Abstract
The Kingdom of Saudi Arabia (KSA) is committed to transition its fossil fuel-driven electricity generation to that from renewable energy technologies, such as solar photovoltaic (PV) and wind. The need to reduce greenhouse gas emissions has led it to announce an ambitious target of 40 GW of PV power capacity by 2030. The deployment of such a capacity needs to be augmented with analyses to overcome the challenges faced in terms of the technical capability of the country. This work contributes to this goal by investigating the utilisation of solar photovoltaic PV systems to supply medium-size entities such as universities with clean power, displacing the current fossil fuel power supply. Currently, such considerations are not fully addressed in KSA. The study used the University of Jeddah campus electrical load profile, taking into account future power needs. The methodology encompassed modelling the installation of multi-MW PV systems for the university by considering weather conditions, actual university consumption, load segregation, and economics under different development scenarios informed by surveys with decision makers at the university. The results showed that air conditioning loads alone were responsible for 79% of the campus electrical load and that a 4.5 MW PV system is able to supply half of the total campus annual electrical energy consumption of the year of 2019. The optimum scenario showed that utilising grid-connected PVs would decrease the total cost of electricity over the next two decades by 28 to 35 percent and would result in halving the current campus carbon emissions. The analysis concludes that the business-as-usual case is no longer the cheapest option for the campus.
1. Introduction
Human reliance on energy can be traced to the early years of life on the planet. People have depended on natural resources to supply their daily essential needs such as energy for cooking of food, buildings, and thermal comfort. The way humans utilise energy has developed dramatically since the invention of the steam engine to highly engineered engines fuelled by diesel and petrol. The journey from the late-1800s to the current century has resulted in the burning of fossil fuels at an alarming rate.
Natural resources such as oil, natural gas, and coal have driven the global economy, starting from the industrial revolution in the West to the speed of development of China and India in the 20th century. Fossil fuels have been the primary resource for electricity generation in the world. In 2019, 39% of the total electricity generation in the world came from coal [1]. In 2019, the Kingdom of Saudi Arabia (KSA) relied on natural gas (59%) and oil (41%) for its electricity generation [2]. The power sector in general is the second highest sector in term of carbon emissions in 2018 after the manufacturing industries and construction in KSA [3].
The Kingdom has an area of 2.15 million km2, with a direct normal irradiance (DNI) between 4.4 kWh/m2 and 7.3 kWh/m2 per day. Exploiting such a resource has the potential to reduce KSA’s carbon emissions and shift its reliance from fossil fuel toward renewable generation [4].
The KSA Vision 2030 aims to install 40 GW of PV capacity by 2030 [5]. This ambitious plan needs to be augmented with research to enhance the knowledge transfer and to overcome the installation challenges such as capacities, skills, and the supply chain.
Consumption in Government buildings such as universities, schools, hospitals, and public services represent 15% of the total electricity sold in KSA in 2018 [2]. Public universities such as the University of Jeddah (UJ) are considered part of the government sector.
It is clear that solar and wind technologies are viable options to displace the current fossil fuel supply and overcome such generation challenges [6]. In a study of a standalone hybrid system for a remote area in Abu Dhabi, it was found that the optimal system modelled based on the lowest net present cost for three different loads of 500 kW, 1 MW, and 5 MW consisted of a combination of PV, wind, batteries, and diesel generators [7]. The work showed that for the 500 kW average load, 15% PV and 30% wind systems with diesel generators is the optimum system to supply the predicted loads. Using such a hybrid system resulted in a potential 37% carbon emissions reduction, but the levelised cost of electricity was still higher than that of the grid tariff in the country at the time. The study was undertaken in 2013 when the current utility-scale PV levelised cost of electricity in Abu Dhabi was USD 1.35 cents/kWh, one of the cheapest in the world [8]. Thus, the study encouraged a change in the policy to make renewable energy more competitive in the future.
A 19 MW solar–wind–diesel hybrid system for the coastal area of Bangladesh was presented in [9] and demonstrated that a 100% renewable energy system was not feasible economically. The optimum design consists of 55% wind, 15% PV, and 30% diesel generation. The proposed combination reduced the carbon emissions by 69% in comparison to the business-as-usual case, which was diesel generation only.
This study aims to evaluate the impact of a significant-scale PV installation on reducing the UJ campus carbon footprint. Here, we present an analysis that evaluates the impact of the PV power generation on the university current consumption based on real data. The work also includes the evaluation of the economic and environmental impact of adopting PV as the power supply source for the UJ.
2. Site Characteristics, Methodology, and Analytics
2.1. University of Jeddah Campus
The University of Jeddah campus is situated in the North of the city of Jeddah, 20 miles from the airport. It consists of 22 temporary single-storey lecture buildings and two, four-storey management buildings, as shown in Figure 1.
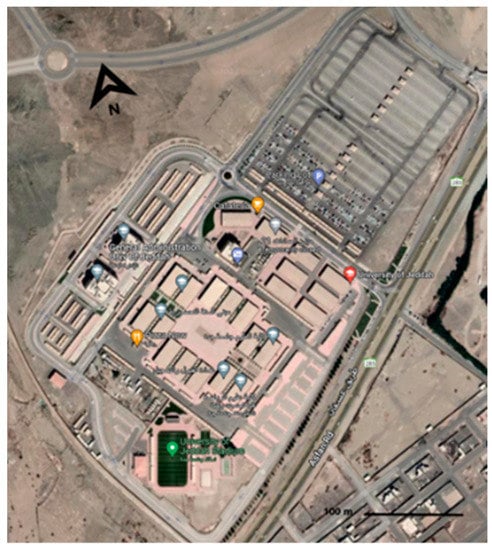
Figure 1.
University of Jeddah Campus Latitude (N): 21.89252 degrees, Longitude (E): 39.2539 degrees (image source Google Maps 2021).
The total active area of the campus in the year of 2019 was 41,151 m2. The total annual electricity consumption of the campus in 2019 was 9,939,297 kWh. Therefore, the average consumption in 2019 was 242 kWh/m2/year.
2.2. Methodology Framework
The methodology and its analysis framework are described in the steps below and summarised in Figure 2.
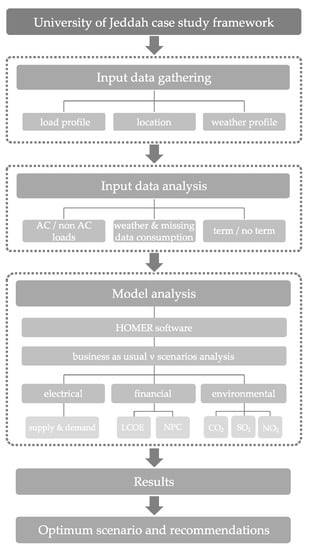
Figure 2.
Methodology framework.
- Input data
- Site location and weather data: Site location allows estimation of the solar resource such as the direct solar irradiance (DNI) and global horizontal irradiance (GHI). The weather data were from the weather station at King Abdulaziz University [10]. Data included ambient temperature, wind speed, and humidity.
- Campus electrical consumption: This was obtained from the smart meter at the JU campus in kW/half-hour.
- Data analyses
- Electrical load profile: Consumption data (1 B) only covered 3 months. The load profile was then built using a linear relationship to estimate the missing data. The full-year load profile (kW/half-hour) was established using the known ambient temperature obtained from the weather data in step (1 A) to forecast the electrical consumption through the linear relationship.
- Campus seasonality: The analysis covered here identified term dates and holiday intervals on campus to clarify campus electrical load behaviour. Building linear relationships between the ambient temperature and consumption for each interval (fall and spring terms, summer holiday, Eid holiday) resulted in a set of linear relationships that can be used to forecast the electrical consumption for each given interval in the campus.
- Load segregation: Using the cooling degree-days method to identify the cooling loads (AC loads) of the campus and the noncooling loads (non-AC loads). This resulted in a relationship between the monthly electrical consumption and the cooling degree-days per month, providing an indication of the air condition share of the consumption in the campus.
- Modelling and Analysis
This encompassed the creation of the seven scenarios used to evaluate the current state of campus supply, and the options for PV interventions. The assessment was carried out using HOMER [11], where the impact of the load profiles for different scenarios were analysed.
- Evaluating electrical supply: This covered the business-as-usual (BAU) scenario and building more scenarios for the PV grid connected with different export tariff options, as well as an additional standalone PV battery combination scenario. All scenarios were set to fully supply the load (no short fall of supply is allowed).
- Economic assessment: The impact of implementing the different scenarios were evaluated based on total net present cost (NPC) and Levelized Cost of Energy (LCOE). The assessment was undertaken in Homer over the 25-year lifetime of the project. The grid tariff, PV Capex, and battery cost were adjusted to reflect current Saudi Arabia prices.
- Environmental assessment: Under all the different scenarios, the total carbon dioxide sulphur dioxide (SO2) and nitrogen oxides (N2O) emissions were evaluated using Homer.
The outcomes (electrical, economic, and environmental assessments) of the analyses under the different scenarios were then compared to find the optimum scenario that can displace the current fossil fuel supply of the campus.
2.3. Analytics
Electrical consumption and its relationship to the ambient temperature was developed for each semester—fall, spring, and summer terms, as well as Eid (festive) holidays.
To evaluate the air conditioning load component of the total campus consumption, a cooling degree-days (CDD) method was used [12,13]. The total annual CDD in the campus based on the 18 °C base temperature was 4236 CDD/year [14]. The relation between cooling degree-days and the consumption of the campus was evaluated over two years between March 2017 and March 2019 and is shown in Figure 3. As can be seen from the figure, the data are scattered without a clear trend. This is due to the lack of control on energy consumption in the campus.
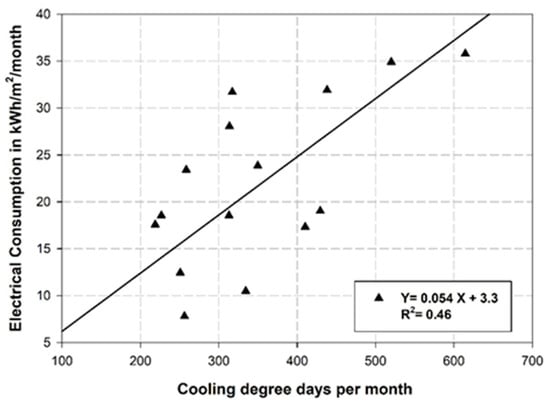
Figure 3.
Monthly electrical consumption in kWh/m2/month versus cooling degree-days per month in the University of Jeddah from March 2017 to June 2018. A linear fit and correlation are shown.
Starting from July 2018, the university applied an energy control policy where all air conditioning (AC) units are monitored and turned off after 6 pm. The relationship between the electrical consumption and cooling degree-days after applying the energy control was more linear, as shown in Figure 4.
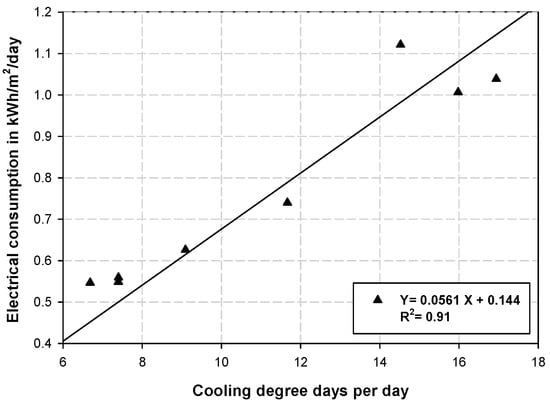
Figure 4.
Electrical consumption in kWh/m2/day versus cooling degree-days per day for the University of Jeddah Campus from July 2018 to March 2019 with energy control policy applied. A linear fit and correlation are shown.
The relation between CDD/day and average kWh/m2/day (Equation (1)) was developed from Figure 4 to determine the approximate AC energy consumption in the campus.
where Y is the consumption in kWh/m2/day and X is the CDD/day.
From Figure 4, at zero CDD (where the AC is off), the consumption of the campus Y was 0.1455 kWh/m2/day. This is equivalent to consumption of the non-AC loads. Hence, for an area of 41,150 m2, the total consumption of the non-AC loads was 0.1445 × 41,150 or 5946 kWh/day.
Table 1 shows the total consumption of the campus measured by the smart meter at different periods in 2018/19. For the interval from 18 February 2019 to 19 March 2019 (29 days), the total consumption was 652,363 kWh (Table 1). However, from the above consideration, the total non-AC loads consumption for the whole campus for 29 days was estimated to be 5946 × 29 or 172,439 kWh. Hence, for the period from 18 February 2019 to 19 March 2019, the non-AC loads represented 26.4% ((172,439/652,363) × 100) of the total consumption of the campus. Hence, the AC campus consumption represented 73.6% of the total electrical consumption in this interval. As shown in Table 1, the summer months AC consumption reached approximately 85% of the total campus consumption, while the average yearly AC consumption for the campus is around 79%.

Table 1.
Consumption and share of non-AC loads for 2018/19.
3. Load Profile Determination
In order to arrive at the electrical load profile for the campus, an analysis was made of the available data, which was not available for the whole year. Hence, an approach was needed to address the incomplete data that will allow the development of the load profile.
3.1. Addressing Missing Data
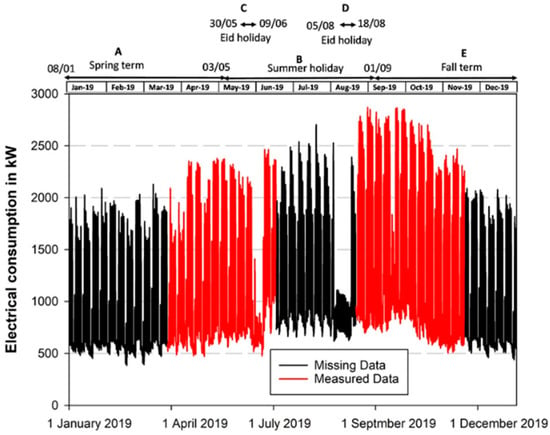
The data for 2019 obtained from the smart meter cover two periods, namely: (i) 22 March 2019 to 19 June 2019 and (ii) 22 August 2019 to 19 November 2019 (Figure 5). Obtaining such datasets necessitate many approvals and a site visit by a specialist to download the data from the smart meter.
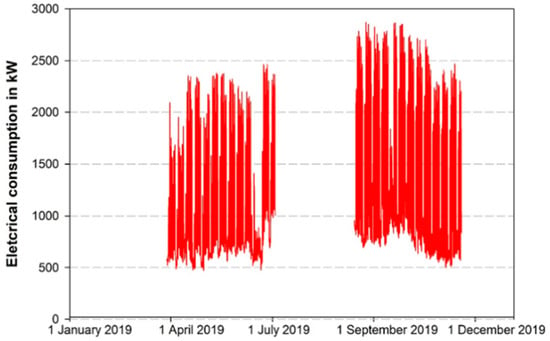
Figure 5.
Measured smart meter electrical consumption and data gaps in 2019. Data were only available for 6 months (see text).
In its current setup, the smart meter records data for up to three months and, if not downloaded, the data are overwritten with new values, hence the missing data (Figure 5). In order to address the data gaps in the periods highlighted above, a missing data (two months)-filling approach to forecast the other four months to establish the full year load profile (kW/half hour) was developed (Table 2). The approach was based on investigating the available consumption data and its relations to the ambient temperature, building utilisation (occupancy) within the campus, and the time of consumption.

Table 2.
UJ different terms and intervals in the year of 2019.
The consumption of the campus is impacted by the ambient temperature, building occupancy, and time of day. The latter two are different from day to day as classes and schedules are different. To illustrate this, the data for Mondays in the Spring and Fall Terms are shown in Figure 6.

Figure 6.
Different linear relationships between ambient temperature and measured electrical consumption in the UJ campus for Mondays in different intervals A and E from Table 2. (A) Mondays in spring term from 25 March 2019 to 29 April 2019 (Interval A) and (B) Mondays in fall academic term from 2 September 2019 to 11 November 2019 (Interval E).
As can be seen from the figure, there was a higher consumption at higher ambient temperatures and there was a linear relationship between these as the AC works harder at higher temperatures. Furthermore, the data indicate a similarity of consumption for the same day every week (i.e., similar for all the Mondays) throughout a semester. However, the consumption was different for other days of the week including the weekend (which is Friday and Saturday) in Saudi Arabia. Figure 7 shows other variations in consumption for the Summer and the Eid holidays. Again, there was a linear relationship between the ambient temperature and consumption. However, for the Eid holidays, a significant reduction can be seen from the data.

Figure 7.
Different linear relationships between ambient temperature and measured electrical consumption in the UJ campus for Mondays in different intervals B and C from Table 2. (A) Mondays in Summer holiday from 6 May 2019 to 26 August 2019 (Interval B); (B) days in Eid Alfitr holiday including two Mondays, 30 May 2019 to 8 June 2019 (Interval C).
In order to address the missing data, the established linear relationship (e.g., Figure 6 and Figure 7) between the ambient temperature and consumption for the available dataset was plotted for every day of the available data periods. The outcome from the analysis provided graphs and relationship equations, similar to Figure 6 and Figure 7, which were used to estimate the missing data of the consumption and ambient temperatures for the whole year.
In order to progress with the analysis, five distinct intervals were identified based on occupancy of the campus for 2019, as shown in Table 2. The intervals consist of spring and fall academic terms, summer holiday, and two Eid holidays (where the campus is least busy). Table 2 also includes the periods of missing data. The linear relationship between the ambient temperature and consumption obtained from the measured data (Figure 5) for each of the days within these specified intervals was used to fill in the missing data for the periods shown in Table 2.
The ambient temperature data for the year 2019 was obtained from a weather station at King Abdulaziz University 23 miles away from UJ.
Figure 6A shows the relationship between the ambient temperature and consumption of the measured data for Mondays for the period from 25 March 2019 to 19 June 2019, which has the following relationship.
where Y: electrical consumption in kWh; X: ambient average ambient temperature.
As the temperature is known, the missing data for the other Mondays in January, February, and March in interval A were estimated using Equation (2). Similarly, for Interval E, the relationship between ambient temperature and consumption of the measured data for Mondays for the period from 2 September 2019 to 11 November 2019 is shown in Figure 6B, which has the following relationship.
where Y: electrical consumption in kWh; X: ambient average ambient temperature.
The same process was repeated for estimating the missing data for interval B (Figure 7A), and a plot of the measured data for Interval C (Eid Alfitr holiday) is represented in Figure 7B and the equations therein. In order to estimate the missing data for interval D (Eid Aladha holiday), the relationship for interval C (Figure 7B) was used, as the two intervals (C and D) represent holiday periods but with different ambient temperatures.
In order to validate the results, a comparison was made for the Mondays data based on the measured data and those estimates determined from the linear relationships, as shown in Figure 8A,B. The figures show similar trends and magnitudes, giving confidence in the approach undertaken. The difference between the estimated load profile and the measured annual campus consumption was 2.6%.
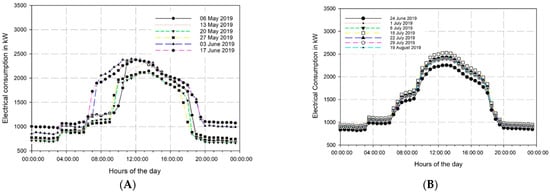
Figure 8.
(A) Measured electrical consumption for Mondays in interval B from May to August 2019, and (B) estimated consumption for Mondays for the missing data in the same interval based on a linear correlation discussed in the text.
3.2. Campus Load Profile
Figure 9 shows the determined campus load profile in kW per half hour for the year of 2019. This represents the fossil fuel-derived energy supply to the campus. Such a load profile was used as an input to the modelling undertaken to displace fossil fuel energy with renewable energy and is discussed in the following section.
4. Modelled Energy Supply Scenarios
The University of Jeddah currently uses fossil fuel-derived electricity with high CO2 emissions. The aim here is to provide a range of PV technical solutions coupled with economic feasibility that can reduce/negate the emissions and provide savings for the university.
The annual electricity consumption of the UJ campus was 9939 MWh in 2019. The import tariff for this is USD 9.775 c/kWh including 15% VAT. To evaluate the displacement of such a supply through the deployment of solar PV power generation systems, different scenarios were developed and modelled. The modelling was undertaken using the commercial software package knows as Homer (Hybrid Optimization of Multiple Electric Renewables), which is appropriate for the analysis [15]. This simulation software was designed to help energy specialists make decisions on optimised system configurations to supply specific loads. The optimisation includes an energy balance when using systems such as PV, diesel generators, and batteries to supply the loads over the year at appropriate cost profiles. The latter includes the consideration of capital, operational, maintenance, and replacement costs over the lifetime of the project. The study considered the grid, grid and PV, and PV standalone options to be equivalent in terms of reliability. Therefore, any secondary backup (such as a diesel generator) is not required, as there are no critical loads such as a hospital. All systems are likely to be highly reliable when they are underpinned by the grid. The stand-alone (S5) off-grid system would be deployed as multiple parallel units, which would create resilience in the system.
Seven appropriately developed scenarios (S1–S7) were modelled and analysed, as summarised below:
- (a)
- S1—address the current situation where the power is supplied from the fossil fuel grid (business as usual (BAU)).
- (b)
- S2—same as S1 but with “future scheduled tariff” of USD 17 c/kWh applied between 11 am and 4pm daily. The “future scheduled tariff” represents the case for a future electricity tariff increase.
- (c)
- S3—same as S1 augmented by power from an installed PV system connected to the grid with zero value of export electricity to the grid.
- (d)
- S4—same as S3 but with export to the grid at export tariff of USD 1.8 c/kWh.
- (e)
- S5—autonomous power supply to the campus based on standalone PV and battery systems with no grid import or export.
- (f)
- S6—same as S3 connected to the grid but with reduced PV capex cost (capex reduced by 20%) with zero export of electricity to the grid. The 20% PV price reduction represents a future expectation of the PV capex reduction.
- (g)
- S7—same as S6, but export to the grid at a tariff of USD 1.8 c/kWh.
In all the scenarios with grid export, the tariff of USD 1.8 c/kWh was set to match the price regulated by the ECRA (Electricity and Cogeneration Regulatory Authority) for the residential sector as the regulation and tariffs for governmental or commercial building are not available to date [2]. The PV capital cost was set at USD 1000/kWp installed, and the cost of replacement of components (inverter) after 10 years was USD 800/kWp.
5. Results and Discussion
As indicated earlier, the purpose of the modelling was not only to evaluate the impact on electrical loads by PV deployment, but also to address economics and environmental impacts. All the analyses are important to provide the required evidence to the university and to make the case for reducing its emissions. The analyses addressed the total electrical consumption, supply and demand based on grid import and PV system supply, and the optimum penetration of PV in the supply requirements. The economics were studied based on the total net present cost and levelised cost of energy. The environmental considerations were based on evaluating the carbon emissions and the reductions achieved by the proposed low-carbon solutions.
5.1. Energy Considerations
Of all scenarios evaluated to meet the criteria for supplying the campus demand of 2019 (9939 MWh), no short fall of supply was allowed. As different PV penetration percentages were added to scenarios, the total production exceeded the total consumption by 1403 to 3326 MWh/year, as shown in Table 3. The PV rated capacity varied from 4.5 to 6 MWp as the penetration percentage changed.

Table 3.
PV capacity and electricity supply under different scenarios.
Scenario 1 (S1) addressed the current supply situation of the university where the power is supplied from the fossil fuel grid. This is considered as the business-as-usual (BAU) scenario. Scenario (S2) is the same as S1 but with an indicative rise in the future grid supply tariff—“future scheduled tariff”—from the current value of USD 9.775 c/kWh to USD 17 c/kWh. However, this increase was only applied for the high demand period between 11 am and 4pm daily. In both S1 and S2, the campus is fully supplied by the grid.
In scenario 3 (S3), the modelling addressed the deployment of a grid-connected PV system (no storage) to supply a proportion of energy to the campus, which was topped up from grid imports. Access energy from the PV system is exported to the grid at zero tariff (i.e., no income to the university). The optimum PV system size achieved for minimum export was 4.5 MWp, providing 7321 MWh/annum or 60% of the required campus energy supply. The excess energy exported to the grid was 1403 MWh/annum. Table 3 provides a detailed breakdown of the energy balance under all scenarios.
Scenario 4 (S4) is the same as S3, but with an opportunity to realise income from the PV access energy through export to the grid at a tariff of USD 1.8 c/kWh. This led to an increase in the PV capacity to 5.3 MWp, providing 8549 MWh/annum or 62% of the required campus energy supply. The excess energy exported increased to 2351 MWh/annum. The PV system size was optimised by the modelling based on the total net present cost economic consideration.
Scenario 5 (S5) addressed the option of supplying the campus with 100% renewable energy. In this case, the optimum PV system capacity to supply the campus was found to be 12.12 MWp with a battery storage of 16.5 MWh. The system can provide 19,557 MWh/annum, and the resulting excess energy exported to the grid was 8408 MWh/annum. In addition, 1210 MWh/annum of energy losses and storage depletion was estimated for such a design. S5 had no grid purchase, as the campus was assumed to be off-grid and the cost of the battery increased the total net present cost to double the cost of the business-as-usual case (S1).
Scenario 6 (S6) is the same as S3 but considers a future reduction in PV capex of 20% and zero export tariff. This led to a slight increase in the PV capacity to 4.8 MWp as compared to S3. The system provided 7779 MWh/annum or 63% of the required campus energy supply. The excess energy exported increased to 1566 MWh MWh/annum as zero export tariff. S6 showed that there is no feasible financial gain in increasing the size of PV where there is no revenue from export to the grid. Again, the PV system size was optimised by the modelling based on the total net present cost economic consideration.
Scenario 7 (S7) is similar to S6 but with an opportunity to realise income from the PV access energy through export to the grid at a tariff of USD 1.8 c/kWh. The optimum PV size was 6.0 MWp, providing 9939 MWh/annum or 66% of the required campus energy supply. The excess energy exported increased to 3326 MWh/annum. Again, the PV system size was optimised by the modelling based on the total net present cost economic consideration. Scenario 7 showed that a reduction in PV capex coupled with the current regulation export tariff to the grid will make this scenario very competitive as an energy supply option for the campus.
In scenarios S3 to S7, the peak power production occurred between 10 am and 3 pm with the highest production occurring in February, March, November, and December, and the capacity factor of PV systems was 18.4%. In the modelling system, output efficiency was decreased by 0.5% for every 1 °C above the nominal operating cell temperature (47 °C).
PV modules suffer performance degradation over time. Typically, this is of the order of 0.5% per annum [16]. Modelling within Homer, we used the multi-year function to enable PV degradation to be incorporated and to take into account in the analysis. As a result, the required PV system capacity increased when PV module degradation was considered. Scenario S3 considered augmenting the grid supply with power from the PV system, with the condition that zero PV power is exported to the grid. In this case, the impact of PV degradation on Scenario S3 resulted in having an increase in the PV system capacity by 7%, from 4.5 MW to 4.9 MW. This also resulted in slightly elevating the total net present cost from USD 22.7 M to USD 23.1 M. Similarly, the PV capacity in Scenario S4 increased by 4% from 5.3 MW to 5.5 MW. Scenario S5 represents a standalone PV and battery system working as an autonomous campus power supply with no grid import or export. Such a system is most vulnerable to PV degradation. As such, the modelled PV capacity in this scenario increased by 13% from 12.12 MW to 13.7 MW. In all scenarios, the battery (for only S5) and inverters capacities were kept the same for the degradation analysis. The impact of the degradation on Scenarios S6 and S7 represents the future cost capital cost reduction in the PV system by 20%. Hence, when taking into account the degradation, Scenario S6 had the PV capacity increased by 1.6% from 4.8 MW to 4.9 MW. Similarly, in S7, the PV capacity also increased by 1.6% from 6.1 MW to 6.2 MW. It must be noted that Scenario S1 and S2 represent power supply from the grid only, i.e., no PV system used.
5.2. Economic Considerations
The primary evaluation of all scenarios was based on the total net present cost and the levelised cost of energy (LCOE). The total net present cost represents all costs including operational and maintenance, in addition to revenues over the 25 years lifetime of the project, with the results shown in Table 4. The net present cost is defined in the modelling as the present value of all costs likely to be encountered in the deployment of the scenarios. These costs include capital cost, operational and maintenance cost, minus all revenues from the system over the lifetime of the project. The modelling multiplies the nominal cost by a discount factor to estimate the cash flow discounted to year zero. The sum of the discounted cash flow in each year for the entire project lifetime is the total net present cost.

Table 4.
PV capacity and levelized cost of energy (LCOE) under different scenarios.
All scenarios were evaluated for different nominal discount rates taking in account both the interest rate and the inflation rate over 25 years. Figure 10 shows the total net present cost for the scenarios as a function of discount rate. For scenario 1, business as usual, the net present cost was estimated to be USD 31.7 million. Under scenario 2, where an indicative rise in the future grid supply tariff—“future scheduled tariff”—was considered, the net present cost was USD 40.5 million or a 27% increase in the BAU case S1. S2 represents a likely future increase in tariff as currently being applied for different consumers in KSA. It acts as a warning to the campus of a likely increase in future cost and gives justification to the consideration of PV systems under S3–S7. For scenarios 3 and 4, the net present cost was reduced by 28% (give actual value here) to 32% (give actual value here), respectively. Scenario 5 (stand-alone system supplying 100% of needed energy) resulted in a net present cost of USD 60 million or double the cost under S1 (BAU). This was expected at the system size and the needed storage added significant cost to the case. In scenarios 6 and 7, where the PV capital cost was decreased by 20%, the net present cost decreased by 31% and 35%, respectively. The export price used represents the current rate for domestic building. However, clearly, this low value further impacted the economic benefit. Nevertheless, the trend in energy pricing in KSA is upward and the rate of export is likely to go up, which will enhance the economic case.
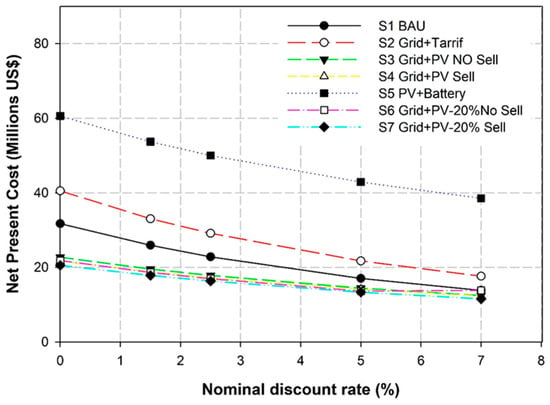
Figure 10.
Net present cost for each scenario at different nominal discount rates.
Figure 11 and Table 4 show the levelised cost of energy for all scenarios as a function of discount rate. As can be seen from the table, S2 resulted in an increase in LCOE due to an increase in “future” tariff. S5, the standalone scenario, had the highest LCOE. The other PV deployment scenarios resulted in much lower LCOEs compared to the business-as-usual case, with S7 being the lowest. These cost reductions should be an impetus to the University of Jeddah to consider the latter scenario.
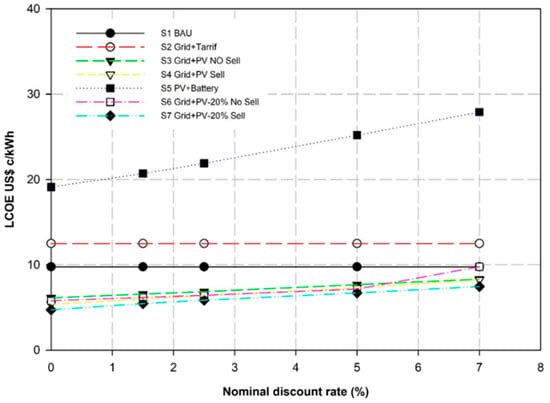
Figure 11.
Levelised cost of energy for all scenarios.
5.3. Environmental Considerations
Emissions in all the scenarios arise from the fossil fuel components of the national grid (Figure 12). Thus, the more the campus has to rely on the grid supply, the higher the carbon emissions. Scenarios S1 and S2, with both having grid supply, had the same emissions. The carbon emissions resulting from scenarios S3–S7 varied depending on the PV system size and its energy supply to the campus. The higher the PV supply penetration, the lower the carbon emissions. As to be expected, for scenario 5, a 100% renewable supply had no emissions.
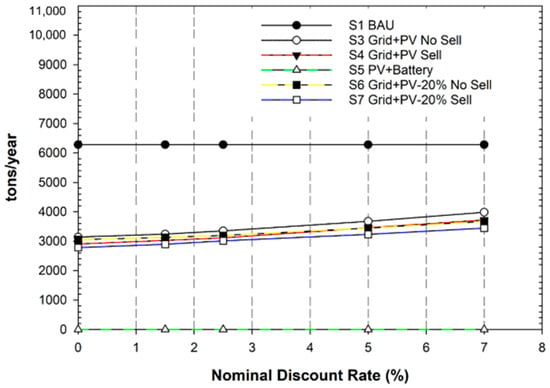
Figure 12.
Carbon dioxide emissions in tons per year for all scenarios.
6. Conclusions
In 2019, the Jeddah University (JU) campus had an annual electricity consumption of 9939 MWh, which equates to 242 kWh/m2/annum. Air conditioning is the main driver for energy consumption in the campus as it is responsible for 74 to 83% of the total loads in 2019. The modelling indicated that, today, the UJ could benefit from adding 5.3 MW of PV to support its power supply (S4). Such a deployment will save approximately 28% to 35% of the total electricity cost of the campus over the next 25 years. However, this will require an initial investment of ~USD 22 million. The option to sell electricity to the grid will enable the campus to generate an income of approximately USD 42k annually, which is likely to ease the electricity cost burden on the budget. Furthermore, PV deployment will help ease the peak consumption in the summer months, where the electricity consumption is almost double that of the winter months and raises the need for a consumption reduction strategy in addition to PV uptake. PV and grid-connected scenarios can save from USD 9 to 11.2 million over the cost of electricity in the next 25 years. In terms of carbon emissions, PV deployment will help save half of the emissions of the imported grid power over the lifetime of the project.
It must be noted that in our analysis, for all scenarios with the exception of S5, the grid is assumed to be available continuously as it is the BAU case and there is no battery included in the other considered scenarios. Hence, this assumption provides the same security of supply and reliability as the current state of power supply (national grid) to the campus. In scenario S5 “autonomous power supply to the campus based on standalone PV and battery systems with no grid import or export”, the system would be deployed as multiple parallel units, which would create resilience in the supply. This approach is deemed adequate for the weather conditions in KSA and also the technical capability to resolve any issue of the supply in this scenario. Furthermore, this study has not explicitly considered the reliability of the system. However, with PV systems having over 773 GWp of capacity installed globally [17], such systems are renowned for their reliability. Hence, in our study, all systems are assumed to be highly reliable with the additional security of being underpinned by a highly reliable national grid.
In this work, we address the paucity of data, develop the load profile based on real data, and develop different options and scenarios for a real-world load profile that will help the researchers to understand the needed steps to the problem under consideration. The findings are not only transferrable to other applications in the KSA context such as malls, hospitals, and other university campuses with large AC led loads, but also regionally. This paper has demonstrated the economic case for a renewable transition in this context. In particular, the AC-led demand profile studied here is common to many other entities in KSA such as shopping malls, hospitals, and schools and, therefore, the findings have a far wider impact.
The study contributes to our knowledge as it shows that, as of 2020, the business-as-usual approach is no longer the cheapest option even in an oil- and gas-rich country such as KSA. This evidence makes the case for a renewable transition in this context, highlighting that, for similar medium-size entities in the country, solar PV provides an appropriate pathway for such transitions. Furthermore, the outcomes presented show a robust analysis of the way to transitioning medium/large institutions, such as universities in Saudi Arabia, to low carbon, taking advantage of the rich indigenous resources such as solar energy whilst displacing polluting fossil fuels and providing the economic case under various scenarios for the needed interventions.
Author Contributions
Formal analysis, S.A.; Funding acquisition, A.S.B.; Investigation, S.A.; Software, S.A.; Supervision, A.S.B. and P.J.; Visualization, N.A.; Writing—original draft, S.A.; Writing—review & editing, A.S.B. and P.J. All authors have read and agreed to the published version of the manuscript.
Funding
This research received no external funding.
Institutional Review Board Statement
Not applicable.
Informed Consent Statement
Not applicable.
Data Availability Statement
Not applicable.
Acknowledgments
This work is part of the activities of the Energy and Climate Change Division and the Sustainable Energy Research Group (www.energy.soton.ac.uk) (accessed on 10 February 2022), in the Faculty of Engineering and Applied Sciences at the University of Southampton, UK. It is also part of the work of the King Salman bin Abdulaziz Chair for Energy Research within King Abdulaziz University, KSA. The research is also part of a PhD programme sponsored by the Faculty of Engineering, at the University of Jeddah, Saudi Arabia.
Conflicts of Interest
The authors declare no conflict of interest.
References
- IEA. Global Energy Review 2019. 2019. Available online: https://www.iea.org/reports/global-energy-review-2019/electricity#abstract (accessed on 1 April 2020).
- ECRA. Electrcity and Cogeneration Regulatory Authority. 2018. Available online: https://www.ecra.gov.sa/en-us/DataAndStatistics/NationalRecord/HistoricalData/Pages/Home.aspx (accessed on 10 February 2019).
- KAPSARC. King Abdullah Petroleum Studies and Research Center. Available online: https://www.kapsarc.org/research/publications/what-is-behind-the-recent-fall-in-saudi-arabias-co2-emissions/ (accessed on 1 February 2020).
- Zell, E.; Gasim, S.; Wilcox, S.; Katamoura, S.; Stoffel, T.; Shibli, H.; Engel-Cox, J.; Al Subie, M. Assessment of solar radiation resources in Saudi Arabia. Sol. Energy 2015, 119, 422–438. [Google Scholar] [CrossRef] [Green Version]
- Saudi Ministry of Energy. Energy & Sustainability. In Proceedings of the 9th International Conference on Energy and Sustainability, Online Conference, 6–8 October 2021. [Google Scholar]
- Rahman, M.; Khan, M.-U.-H.; Ullah, M.A.; Zhang, X.; Kumar, A. A hybrid renewable energy system for a North American off-grid community. Energy 2016, 97, 151–160. [Google Scholar] [CrossRef]
- Rohani, G.; Nour, M. Techno-economical analysis of stand-alone hybrid renewable power system for Ras Musherib in United Arab Emirates. Energy 2014, 64, 828–841. [Google Scholar] [CrossRef]
- Dudley, D. Abu Dhabi Lays Claim To World’s Cheapest Solar Power, After Revealing Bids For 2GW Mega-Plant. Forbes. Available online: https://www.forbes.com/sites/dominicdudley/2020/04/28/ (accessed on 6 October 2021).
- Zubair, A.; Tanvir, A.A.; Hasan, M. Optimal Planning of Standalone Solar-Wind-Diesel Hybrid Energy System for a Coastal Area of Bangladesh. Int. J. Electr. Comput. Eng. 2012, 2, 731–738. [Google Scholar] [CrossRef]
- King Abdulaziz University. King Salman Bin Abdulaziz Chair for Energy Research. Available online: https://kscer.org/#:~:text=King%Salam%Bin%Abdulaziz%2C%Chair,undertaken%research%in%solar%energy (accessed on 5 March 2022).
- NREL. HOMER Software. Available online: https://www.homerenergy.com/products/pro/index.html (accessed on 5 March 2022).
- Matzarakis, A.; Balafoutis, C. Heating degree-days over Greece as an index of energy consumption. Int. J. Clim. 2004, 24, 1817–1828. [Google Scholar] [CrossRef]
- Lam, J.C.; Tsang, C.; Li, D.H. Long term ambient temperature analysis and energy use implications in Hong Kong. Energy Convers. Manag. 2004, 45, 315–327. [Google Scholar] [CrossRef]
- Bizee. Bizee Degree Days. World Degree Days. 2019. Available online: https://www.degreedays.net/# (accessed on 28 February 2019).
- Lambert, T.; Gilman, P.; Lilienthal, P. Micropower system modeling with HOMER. In Integration of Alternative Sources of Energy; Farret, F.A., Simões, M.G., Eds.; John Wiley & Sons, Inc.: Hoboken, NJ, USA, 2006; pp. 379–418. [Google Scholar]
- NREL. Lifetime of PV Panels. 2018. Available online: https://www.nrel.gov/state-local-tribal/blog/posts/stat-faqs-part2-lifetime-of-pv-panels.html (accessed on 2 March 2022).
- Statista. Cumulative Installed Solar Pv Capacity Worldwide from 2000 to 2020. Available online: https://www.statista.com/statistics/280220/global-cumulative-installed-solar-pv-capacity/#:~:text=Global%cumulative%installed%solar%PV%capacity%2000-2020&text=Global%cumulative%solar%photovoltaic%capacity,installed%in%that%same%year (accessed on 20 March 2022).
Publisher’s Note: MDPI stays neutral with regard to jurisdictional claims in published maps and institutional affiliations. |
© 2022 by the authors. Licensee MDPI, Basel, Switzerland. This article is an open access article distributed under the terms and conditions of the Creative Commons Attribution (CC BY) license (https://creativecommons.org/licenses/by/4.0/).
