Article

Theoretical Study on the Micro-Flow Mechanism of Polymer Flooding in a Double Heterogeneous Oil Layer

1
Key Laboratory for Enhanced Oil & Gas Recovery of the Ministry of Education, Northeast Petroleum University, Daqing 163318, China
2
Research Institute of Exploration and Development, PetroChina Daqing Oilfield Company, Daqing 163712, China
3
No. 1, Oil Recovery Plant, PetroChina Daqing Oilfield Company, Daqing 163255, China
*
Author to whom correspondence should be addressed.
Energies 2022, 15(9), 3236; https://doi.org/10.3390/en15093236
Submission received: 22 March 2022 / Revised: 27 April 2022 / Accepted: 27 April 2022 / Published: 28 April 2022
(This article belongs to the Special Issue Enhanced Oil Recovery (EOR) Methods)

Abstract

:
Critical issues in the development of oil fields include the differences in the layer properties as well as serious interlayer conflicts and disturbances that can lead to the formation of a preferential flow pathway. In order to understand the interlayer disturbance mechanism between the heterogeneous oil layers, mathematical models of the polymer, and oil two-phase micro-flow in porous media are established based on the Navier-Stokes equation. The phase-field method is used to track the two-phase interface during the displacement process. Then, the influences of wettability, injection modes, and permeability contrasts on the front length coefficient and the displacement efficiency are studied. The results showed that when the rock surface is water-wet (oil-wet), the polymer displaced the low (high) permeability layer first, and the interlayer breakthrough is obvious in the early stages of displacement. After the front broke through, the water-wet (oil-wet) rocks began to displace the high (low) permeability layer, and the preferential flow pathway is formed, which slowed the subsequent polymer flooding. When the rock surface is oil-wet, the perforation degree of the inlet had a greater effect on the micro-oil displacement efficiency. The micro-oil displacement efficiency of the full perforation and commingling production model is 26.21% and 37.75% higher than that of the separate-layer injection and commingling production, as well as the partial perforation and commingling production-injection models, respectively. The larger the permeability contrast, the more obvious the interlayer breakthrough. This study reveals the influence of different wettability characteristics, injection modes, and permeability contrasts on the front length coefficient and the displacement efficiency in a micro-heterogeneous model and provides an important theoretical basis for the formulation of enhanced oil recovery schemes for heterogeneous oil layers.

1. Introduction

Wettability is a primary characteristic of a reservoir, as it affects oil-water relative permeability, the distribution of residual oil in pores, and water-flooding development [1]. As a crucial parameter to measure the wettability of liquid on a rock surface, the contact angle has not only been used to characterize the surface properties of the materials, but it has also played an important role in catalysis, oil recovery, printing, medicine, and other fields [2,3]. Jia et al. [4] used the micro-model to conduct displacement experiments and found that, under different wettability conditions, waterflooding showed different displacement mechanisms. In strongly water-wet pore media, water injection “crawled” along the pore wall; moreover, in oil-wet pore media, it dashed along the pore center. Zhu et al. [5] performed a spontaneous imbibition experiment using water-wet artificial cores to study the imbibition mechanism of a low permeability reservoir. The experimental results showed that for the water-wet cores, there was an optimal displacement speed and the best oil displacement efficiency could be obtained by combining the imbibition effect of capillary force with the displacement effect of the driving force. Liu et al. [6] performed water-flooding experiments using four cores with different wettabilities, and they found that the wettability had a significant influence on relative permeability. The relative permeability of the oil phase of a water-wet rock was higher than that of an oil-wet rock, and this affected the distribution of oil and water in pores and further affected recovery after water flooding.
However, to stabilize oil production and control water, separate-layer water injection has been necessary [7,8]. Huang et al. [9] established a conceptual model using a numerical reservoir simulation method to study the optimal classification of the subdivisions of water injection in a sandstone oil field. The results revealed that with an increase in the number of subdivided strata sections in water-injection wells, the corresponding cumulative oil production and water-absorption thickness ratio increased during the same period. Gang et al. [10] statistically analyzed the data from water absorption and liquid production profiles before and after the water injection in 165 subdivided water-injection wells in various oil production plants at Daqing Oil Field and confirmed that the separate-layer injection process solved the problem of obvious water absorption differences between interlayers and strengthened the injection intensity for poor layers while controlling the injection volume for good layers. After a subdivided water injection, the proportion of the water absorption thickness for the water-injection well had increased by approximately 10%, which improved the production performance of the poor oil layers. From a microscopic view, Chen [11] used six micro-heterogeneous models, transverse, longitudinal, and planar, to conduct water-flooding experiments to study the mechanism of water flooding in different injection-production methods. The results showed that the lateral and planar heterogeneous models improved the recovery efficiency by 2.89% and 5.42%, respectively, after changing the injection-production direction. Gu [12] studied the imbibition behavior of fluid under different capillary numbers in the imbibition process by using the dual-permeability pore network model and found that when the capillary number was large (small), the wetting-phase priority displaced the high (low) permeability zone; when the capillary number was moderate, due to the effect of interfacial tension, the wetting fluid formed an oblique advancing pattern. The annual output of oil in polymer flooding accounted for a quarter of the oil in Daqing Oilfield, where the production for 14 consecutive years has been more than ten million tons, becoming a key technology for stable production [13]. Therefore, given the complexity of heterogeneous reservoir development, we established a two-phase micro-flow model of polymer and crude oil based on the Navier-Stokes equation. The phase-field method was used to track the interface between the two phases. The double heterogeneous oil layer micro-models were established to study the influence of rock wettability, injection methods, and permeability contrast on the flow characteristics at a micro-scale. This study further revealed the polymer-flooding mechanism of longitudinal heterogeneous reservoirs, which provides an important theoretical basis for the preparation of enhanced oil recovery schemes for heterogeneous reservoirs.

2. Modeling

2.1. Micro-Model

Porous media in actual strata due to pore and throat distribution and connected conditions have complex, which has resulted in significant differences between interlayers [14,15]. To develop a realistic simulation of fluid flow in pores, we established double heterogeneity oil layer micro-models based on oil field development. According to the actual development of oil fields, we established the following three micro-models: full perforation and commingling production, partial perforation and commingling production-injection, and separate-layer injection and commingling production by setting different inlet positions and perforated degrees, as shown in Figure 1. The micro-models consisted of inlets, outlets, and solid walls. The upper layer represented the high-permeability layer, and the lower layer represented the low-permeability layer; each layer accounted for approximately half the width of the model. The gray zones represented porous media, and the white circles represented solid rock particles with radii of 150 μm and 75 μm, respectively, and the throat radii were 50 μm and 20 μm, respectively. The whole model was 5000 × 3550 μm2 in size. For the partial perforation and commingling production-injection micro-model and the separate-layer injection and commingling production micro-model, the length and width of inlet and outlet were 1500 μm and 500 μm, respectively. The porous media were divided into unstructured meshes.

2.2. Mathematical Model

In this study, the N-S equation and the phase-field method were coupled and solved by commercial software, COMSOL Multiphysics. It was combined with the finite element method (FEM) and the phase field method (PFM), and it could accurately simulate two-phase flow characteristics [16]. Therefore, COMSOL Multiphysics has been widely used in micro-research fields concerning displacement processes and residual oil distribution [17,18].
The continuity equation of the oil/water flow in porous media is as follows:
u = 0
where u is the velocity vector of the fluid, m/s. For the incompressible fluid in the micro-pore, its momentum equation is written as follows [19]:
ρ [ u t + ( u ) u ] = ( p I + μ [ u + ( u ) T ] ) + F s t
where ρ is the fluid density, kg/m3; t indicates time, s; p is pressure, Pa; I is the unit vector; μ is the dynamic viscosity, Pa·s; Fst is the surface tension force.
In the oil/water two-phase flow, the two-phase interface was constantly changing. COMSOL Multiphysics includes the following three interface tracking methods: level set, phase-field method, and moving-mesh method [20,21]. The phase-field method uses the diffusion interface to simulate the discontinuous distribution of variables in the actual situation. It does not need to directly track the changes in the two-phase interface because the interface itself is a part of the equation solution [19,22,23]. Therefore, the phase-field method was used to track the interface in the displacement process, and phase-field variable φ was introduced to identify different phases and transition regions, which was consistent with the Cahn–Hilliard convection–diffusion [22]. In the homogeneous phase region, the phase-field variable was constant (usually set as −1 and 1); in the transition region at the interface, the phase-field variable changed continuously (between −1 and 1).
Mixing energy based on the definition of phase-field variables was introduced into the Cahn–Hilliard equation to control the interface evolution, which indicated that the variation under the influence of convection–diffusion could reach a balance with the variation over time as follows [24]:
φ t + u φ = γ 2 G
where φ is the phase-field variable, dimensionless; γ is mobility, m3·s/kg, which determines the diffusion time factor of the equation. Variations in mobility could have influenced the phase-field simulation results [25,26,27]; therefore, it should be large enough to maintain the constant thickness of the interface and small enough so that the convection would not be constrained by the damping transition [28]. G is chemical potential, J/m3.
Since the higher (fourth) order of the convective Cahn–Hilliard equation caused numerical complications, it was split into the following two second-order partial differential Equations [29]:
φ t + u φ = γ λ ε pf 2 ψ
ψ = · ε pf 2 φ + ( φ 2 1 ) φ
where λ is the mixing energy density, N; ε pf is interface thickness, m; ψ is the phase-field help variable.
Equating the traditional surface energy in the sharp interface approach to the mixing energy across a diffuse interface at equilibrium, interfacial tension can be expressed as follows [30]:
σ = 2 2 3 λ ε pf
At the walls, the wall velocity (uw) was set equal to the fluid velocity (u), which meant the boundary condition of the wall was no-slip and implied that the motion of the contact line on the walls was entirely due to Cahn–Hilliard diffusion [28]. The contact angle (θ) is specified in as follows [31]:
n ε pf 2 φ = ε pf 2 cos ( θ ) φ
where n is the unit normal of the boundary.
During the displacement process, physical parameters such as density, dynamic viscosity, and saturation of the following two-phase system linearly depend on phase variables [32]:
ρ = V f , 1 ρ 1 + V f , 2 ρ 2
μ = V f , 1 μ 1 + V f , 2 μ 2
V f , 1 = 1 φ 2
V f , 2 = 1 + φ 2
V f , 1 + V f , 2 = 1
where ρ1 and ρ2 represent the density of displacement fluid and displaced fluid, respectively, kg/m3; μ1 and μ2 represent the dynamic viscosity of displacement fluid and displaced fluid, respectively, Pa·s; Vf,1 and Vf,2 represent the saturation of displacement fluid and displaced fluid, respectively, dimensionless.
In this study, the polymer was regarded as a power-law fluid, and its constitutive equation is as follows:
τ = k γ ˙ n
where τ is the shear stress, Pa; k is the fluid consistency factor, Pa·sn, γ ˙ is the shear rate, s−1; n is the fluid behavior index, dimensionless.

2.3. Boundary Conditions

In this study, the boundary condition of the inlet was set as the velocity inlet, according to the underground flow velocity in the Daqing Oil Field. The fixed velocity of the inlet was set at 1.16 × 10⁻⁵ m/s; the outlet was a pressure outlet, and the reference pressure was set at 0 Pa. A no-slip boundary condition was used for the solid wall; the contact angles were set at 80° (water-wet) and 135° (oil-wet), respectively. The fluid was incompressible and laminar in the micro-models. Based on the above equations and boundary conditions, the two-phase flow of polymer and crude oil in porous media at micro-scale was simulated.

3. Influence of Wettability on Micro-Flow Characteristics

In this study, the influence of wettability on the front length coefficient and oil displacement efficiency was studied based on the full perforation and commingling production; the initial configuration used for the models was saturated oil. The fluid parameters of crude oil and polymer in the process of the numerical simulation are shown in Table 1.
In Figure 2, Figure 2a–c and Figure 2d–f are the oil-wet and water-wet saturation distributions during the polymer flooding with different pore volume (PV), respectively.
When the rock was oil-wet, the capillary force was the displacement resistance during the polymer-flooding process, and the viscous resistance of the high-permeability zone was smaller. As shown in Figure 2, the polymer solution preferentially displaced the high-permeability zone. Its front displacement was uniform due to the high-permeability layer’s being homogeneous. We can observe the opposite phenomenon when the surface of the rock is water-wet, as follows: The capillary force was the driving force, and the polymer solution preferentially displaced the low-permeability zone. It entered the narrow pore first under the effect of the capillary force, which effectively enhanced the oil recovery. Meanwhile, in the upper part of the low-permeability zone, the front displacement velocity was slightly lower than that of the lower part due to the influence of the high-permeability layer. In the previous studies [33,34,35,36,37], the residual oil distribution with different displacement fluids was studied via experiments and numerical simulations. The results showed the pattern of the fluid communication between high- and low-permeable zones. They concluded that the crossflow, which was driven by viscous and capillary forces and gravity segregation, had a strong influence on the heterogeneous media where high- and low-permeability zones existed. In addition, studies have focused on the transitions from a flow dominated by capillary pressure to a flow dominated by gravity and viscous forces by changing the interfacial tension and flow rate. However, in the current study, we ignored the effect of gravity while no obvious crossflow area was observed through the saturation distribution figures between the high- and low-permeability layers. Therefore, we focused on investigating the influence of different wettability, injection modes, and permeability contrasts on the front length coefficient and displacement efficiency.
The non-uniform propulsion of the polymer solution front between the high-permeability layer and the low-permeability layer was an “interlayer breakthrough”, which is similar to fingering. As shown in Figure 2, the displacement patterns were obviously different with different wettability. A clear distinction between stable and dash displacement patterns was observed by the displacement front length l of the polymer–oil interface, as concluded previously [38]. Therefore, the front length coefficient was defined to enable the quantitative analysis of the displacement patterns of the injecting fluid and interlayer breakthrough. The front length coefficient of the heterogeneous oil layer was defined as m, and its definition can be expressed as Equation (14). In this paper, the influence of the contact angles at 70°, 80°, 100°, and 110° on the interlayer breakthrough of the heterogeneous oil layers was analyzed by using the full perforation and commingling production model, as shown in Figure 3a.
m = l h
Here, l is the displacement front length, μm; h is the thickness of the double-heterogeneous oil layers, μm. Therefore, the relationship between the front length coefficient m and the PV was quantitatively evaluated. Figure 3b shows the variation of oil saturation with the PV for different wettability.
Figure 3a, shows that the curve of the front length coefficient was divided into the following three stages: in the early stage of the displacement process, the interlayer breakthrough was obvious. When the rock was water-wet (oil-wet), the polymer solution preferentially displaced the low- (high-) permeability zone, and the curve showed a rising trend. When the polymer front broke through, the curve reached its highest point. As the polymer solution was injected, the water-wet (oil-wet) rock continued to displace the high (low) permeability layer, and the curve showed a declining trend; eventually, no crude oil was available, and the curve plateaued. The closer the contact angle was to 90°, the smaller the front length coefficient m would be. The primary reason was that when the wettability of rock was closer to intermediate wetting, the capillary force would be closer to 0. The interlayer breakthrough was affected by pore size, which resulted in the displacement in front of high- and low-permeability layers being uniform in propulsion.
As observed from the oil saturation curves of the different wettability characteristics (Figure 3b), the oil saturation of the water-wet rocks decreased at a faster rate than that of the oil-wet rocks, primarily due to the capillary force of water-wet rocks being the driving force in the displacement process, which was conducive to polymer flooding. From 0.5 to 1 PV, the inflection points of the oil saturation appeared. This was the point of the polymer front breakthrough, where it corresponded to the maximum value of the curve in Figure 3a. Afterward, the declining rate of the oil saturation decreased as the strata formed the preferential flow pathway, which reduced the sweep rate of the unswept areas, especially under oil-wet conditions.

4. Influence of Injection Method on Micro-Flow Characteristics

As for the property differences and interlayer contradictions found in reservoirs, different exploitation methods could effectively reduce the interlayer interference, improve the thickness and the layers of water absorption, and improve the production of the low-permeability zones, so as to stabilize the oil-well production [39]. Therefore, this paper studied the effects of three different exploitation methods on microscopic oil displacement efficiency under oil-wet conditions. The oil saturation distribution of the other two models is shown in Figure 4 and Figure 5.
By comparing the oil saturation distribution of the three exploitation methods, we observed that the full perforation and commingling production models had the highest oil-displacement efficiency, and the oil layers had better production. This exploitation method had little interference from the interlayer heterogeneity, and the polymer solution could continue to displace the crude oil in the low-permeability zone after displacing the high-permeability zone. In comparison, the partial perforation and commingling production-injection model and the separate-layer injection and commingling production model had lower production in the low-permeability layer. Before the polymer front breakthrough, the polymer solution swept through the low-permeability layer; however, once the front breakthrough occurred, the high-permeability zone formed a preferential flow pathway, and the low-permeability zone was no longer displaced. The comparison between the commingling injection and separated injection showed that the separate-layer injection slowed down the movement speed of the polymer flooding front in the high-permeability layer and significantly improved the production of crude oil in the low-permeability layer while alleviating the interlayer breakthrough.
Figure 6a shows the relationship between oil saturation and PV in three injection modes when the rock surface was oil-wet. The displacement efficiency of the micro-model increased with an increase in the degree of perforation; however, in actual oil field development, it is not all perforated. Microscopic studies have found that separate-layer injection improved the production of low-permeability layers and thus enhanced overall oil recovery. The micro-oil displacement efficiency of the full perforation and commingling production models was 26.21% and 37.75% higher than that of the separate-layer injection and commingling production and partial perforation and commingling production-injection models, respectively.
Figure 6b reveals the relationship between the displacement pressure differences and the PVs of the three injection modes under oil-wet conditions. As shown in the figure, the variation in the pressure differences with PVs was similar in the partial perforation and commingling production-injection model and the separate-layer injection and commingling production model, which had an inlet channel. In the initial stage, the pressure difference was stable, and the polymer solution flowed into the entrance of the main pore. When the polymer solution began to displace the crude oil in the porous media, the pressure difference rose sharply, approximately 40 Pa; then, the crude oil in the high-permeability layer was displaced, and the pressure difference reached a plateau. When the polymer front reached the outlet channel, the pressure difference decreased sharply; finally, the polymer flooding front broke through, and the pressure difference was stable. In the full perforation and commingling production models, the curve in the initial stage had a gradual upward trend; as the displacement continued, the crude oil in the micro-model was continuously produced. When the residual oil saturation decreased and the displacement pressure difference decreased, indicating that no crude oil was continuously displaced, the curve tended to be stable.

5. Influence of Permeability Contrast on Micro-Flow Characteristics

Permeability contrast is one of the primary factors influencing displacement effects, and it should be considered when dividing and combining development layers. Reasonable permeability contrast can reduce interlayer interference and improve the longitudinal sweep coefficient so as to improve the development of the oil field [40,41]. In this paper, a model with a permeability contrast of 11.11 was established based on a model with a permeability contrast of 6.71 to study the influence of permeability contrast on the front length coefficient and oil displacement efficiency when the rock surface was water-wet. Figure 2d–f shows the oil saturation distribution with a permeability contrast of 6.71, and Figure 7 shows the saturation distribution with a permeability contrast of 11.11.
As compared to two permeability contrasts of oil saturation distributions, we found that when the permeability contrast was larger, the interlayer breakthrough was more obvious. We attributed this to the rock surface being water-wet, which led to the capillary force being the driving force and imbibition. Since the driving force would be greater in smaller pores, there would be a considerable difference in development between the high-and low-permeability layers. We also studied the front length coefficient and oil saturation for two different permeability contrasts, as shown in Figure 8.
The curve in Figure 8a shows that the larger the permeability contrast was, the bigger the front length coefficient would be, which was consistent with the oil saturation distribution data. After the front broke through, the polymer solution began to displace the high-permeability layer, and the front length coefficient decreased, which was consistent with Figure 2. In Figure 8b, at the early stage of displacement, the influence of the permeability differences on oil saturation was not obvious, and the oil saturation decreased at a constant rate for the two permeability contrast micro-models. After the polymer was injected at 0.52 PV, the low-permeability layer of the model with a permeability contrast of 11.11 had small pores and a high capillary force, and the displacement front broke through, the high-permeability layer was preferentially displaced, and the slope of the curve increased slightly; at that moment, the oil saturation curve of the 11.11 model was lower than that of the 6.71 model. However, when the polymer flooding continued, the subsequent polymer flooding speed was slowed due to the existence of the preferential flow pathway. When the 0.6 PV polymer was injected, the model with the permeability contrast of 6.71 had breakthroughs. Since the model had a smaller permeability contrast, interlayer interference, and flow resistance, it was more conducive to polymer flooding. Therefore, as the polymer flooding continued, the oil saturation of the curve with the permeability contrast of 6.71 decreased more rapidly than that of the 11.11 model. Finally, the displacement efficiency of the 6.71 model was 6.7% higher than that of the 11.11 model.
We found that the smaller the permeability contrast was, the higher the oil displacement efficiency would be, and this was consistent with the conclusion by Yang [42]. A series of water/oil displacement experiments of different heterogeneous degrees were conducted at constant pressure, and they found that reasonable layer division played a vital role in oil field development [43,44,45]. Not only could it enhance the recovery of heterogeneous reservoirs, but it could also restrain the interlayer breakthroughs and improve the displacement effect of polymer flooding.

6. Conclusions

(i)
Based on the N-S equation, a mathematical model of a two-phase micro-flow was established, and the micro-models of full perforation and commingling production, partial perforation and commingling production-injection, and separate-layer injection, and commingling production with different perforation degrees were established. The front length coefficient was defined to quantitatively describe the non-piston-like displacement phenomenon of the front propulsion;
(ii)
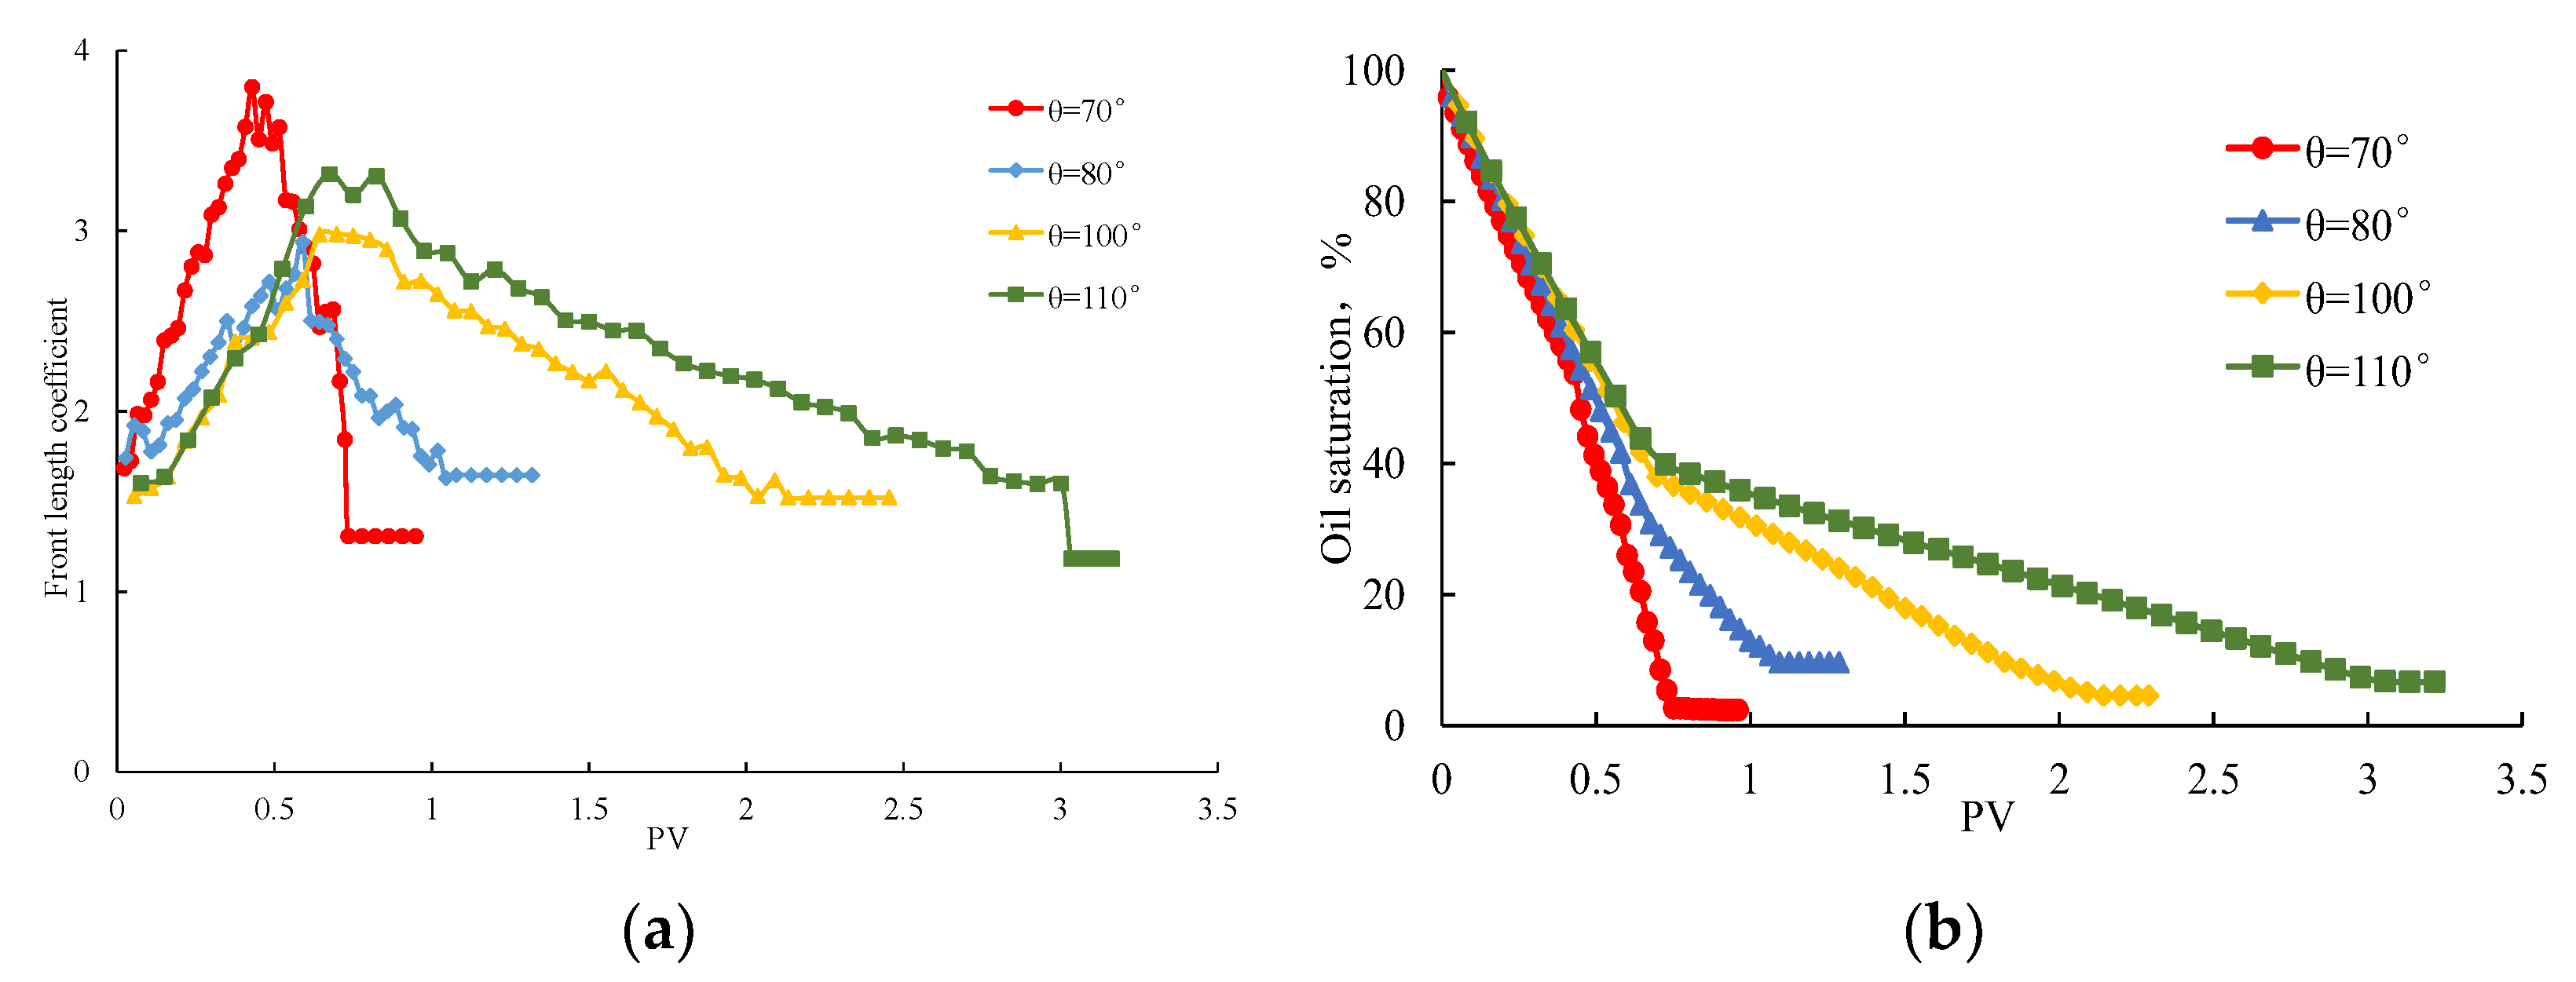
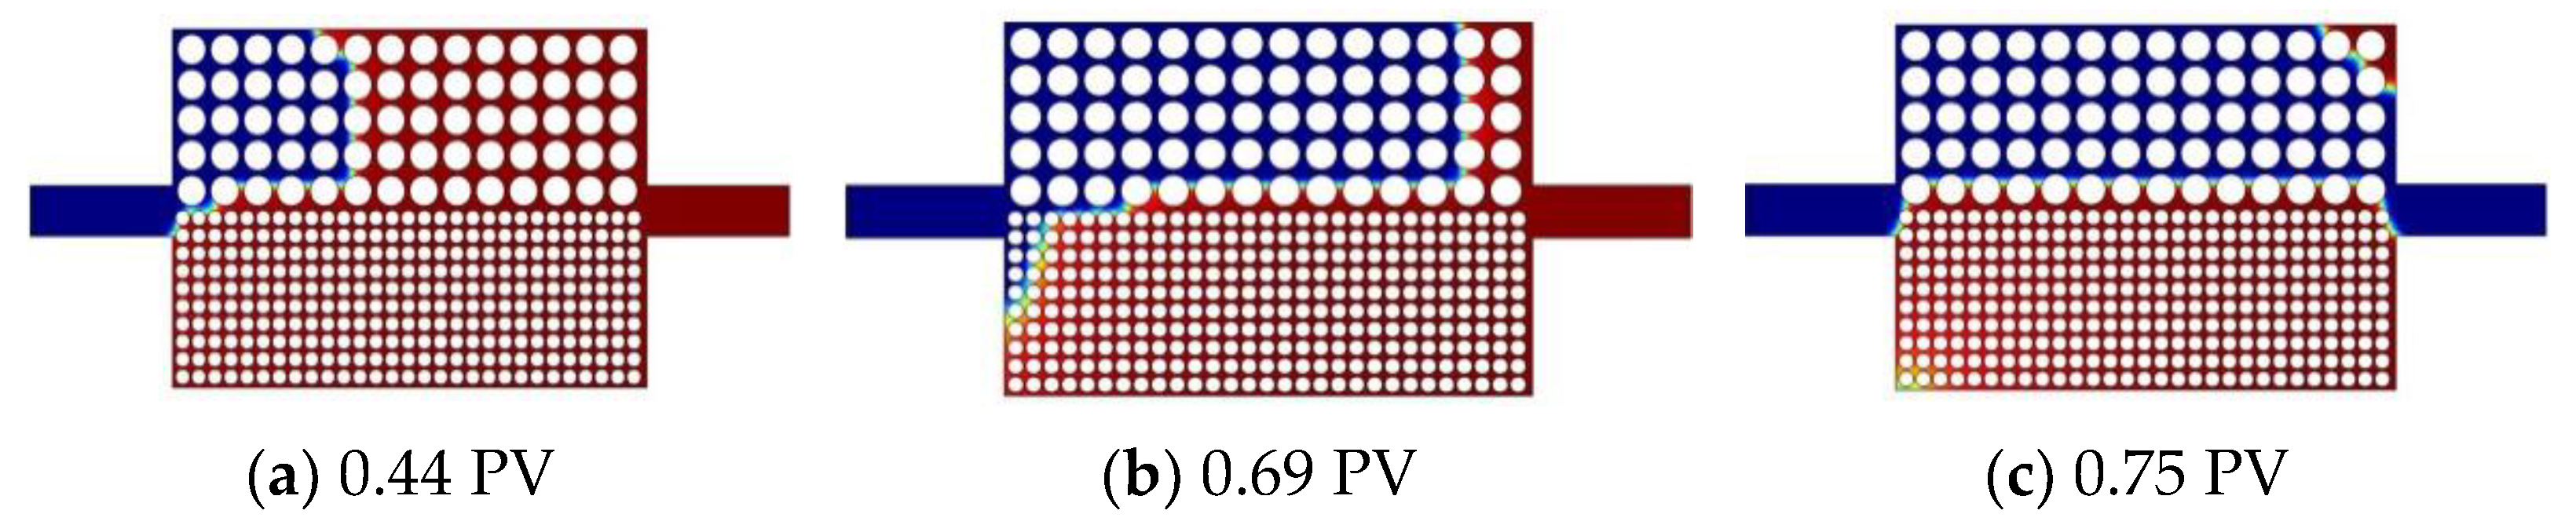
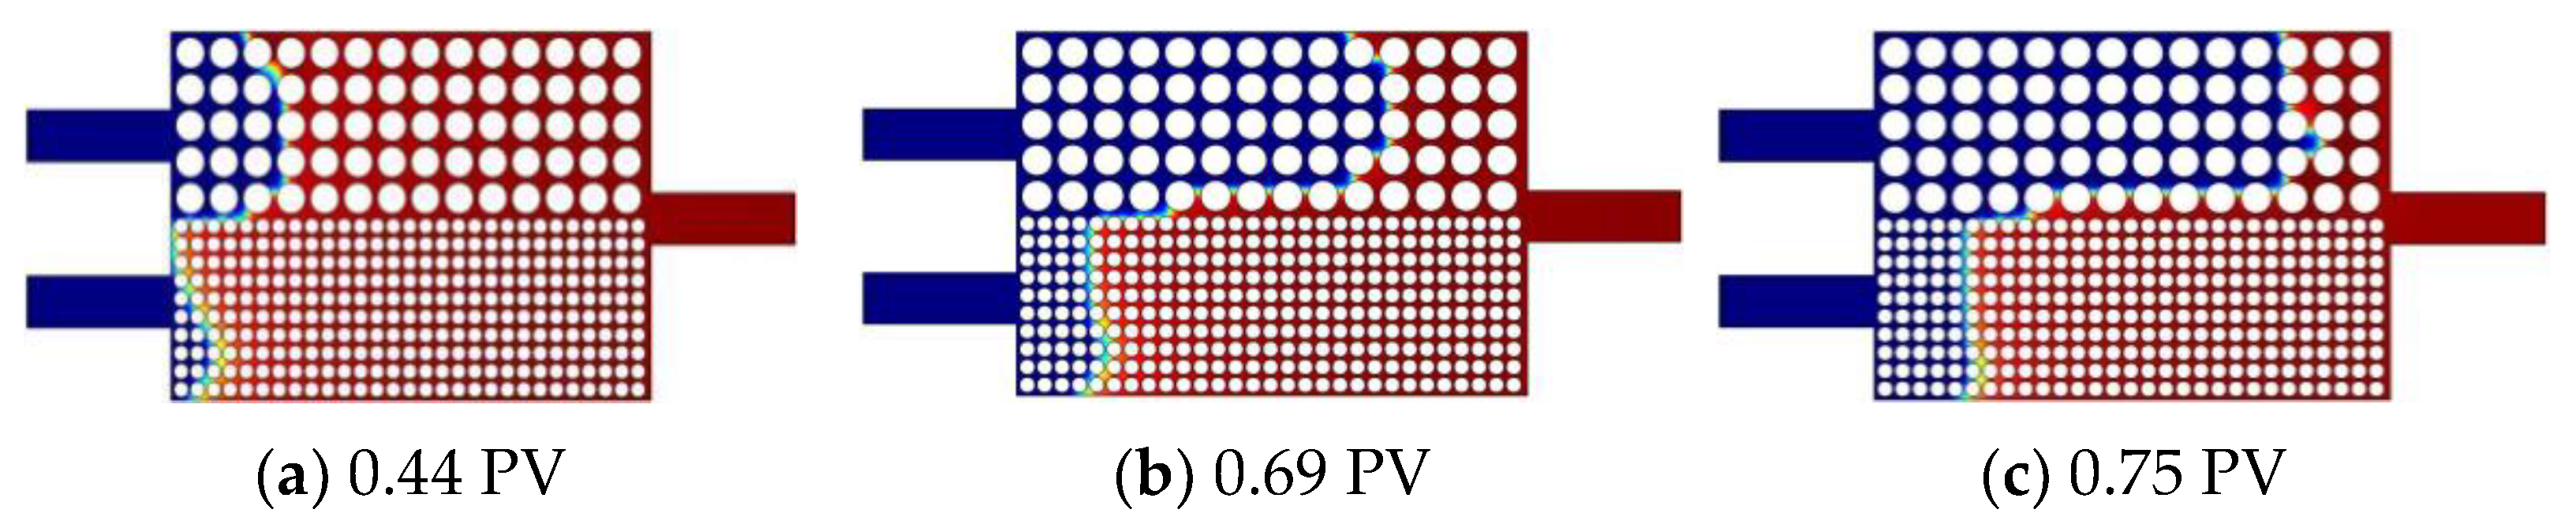
When the rock surface was oil-wet, the polymer solution preferentially displaced the crude oil in the high-permeability layer; in contrast, it preferentially displaced the crude oil in the low-permeability layer under water-wet conditions, and the interlayer breakthroughs were obvious in the early stages of displacement. When the displacement front broke through, the water-wet (oil-wet) began to displace the high (low) permeability layer, and the front length coefficient decreased while the interlayer breakthrough slowed;
(iii)
The decreased rate of oil saturation under the water-wet condition was higher than that under the oil-wet condition. After the breakthrough of the polymer flooding front, a preferential flow pathway was formed, which slowed the subsequent polymer flooding of crude oil, especially under oil-wet conditions;
(iv)
When the rock surface was oil-wet, the perforation degree of the inlet had a significant influence on the micro-oil displacement efficiency, and the micro-oil displacement efficiency of the full perforation and commingling production models was 26.21% and 37.75%, respectively, higher than that of the separate-layer injection and commingling production and partial perforation and commingling production-injection models, respectively;
(v)
The larger the permeability contrast was, the more obvious the interlayer breakthrough would be. The displacement efficiency of the model with a permeability contrast of 6.71 was 6.7% higher than that of the model with a permeability contrast of 11.11.

Author Contributions

H.Z. proposed the idea of this work and designed the research scheme. Y.H. performed the micro-modeling and the simulations and prepared the original draft of this paper. X.Z. performed the simulation, processed the data, and enriched the discussion combined with the actual field. X.P. performed the interpretation of data, designed the structure of the paper, and performed the language editing. The whole work was supervised by H.Z. All authors have read and agreed to the published version of the manuscript.

Funding

This work presented in this paper was financially supported by the China Postdoctoral Science Foundation (Grant No. 2019M661250) and the Post-doctoral Science Foundation of Heilongjiang Province in China (Grant No. LBH-Z19050).

Institutional Review Board Statement

Not applicable.

Informed Consent Statement

Not applicable.

Data Availability Statement

Some or all data, models, or code generated or used during the study are available from the corresponding author by request.

Acknowledgments

The authors gratefully acknowledge the support from the China Postdoctoral Science Foundation and the Postdoctoral Scientific Foundation of Heilongjiang Province in China. The authors also would like to thank Daqing Oilfield Limited Company for providing the data for the work.

Conflicts of Interest

The authors declare no conflict of interest.

References

  1. Wang, S.L.; Wang, X.Y.; Huang, C.; Cai, Q.L.; Xing, J.C.; Jiang, W.X.; Wang, Y.F. Research progress of EOR with alteration of rock wettability in low-permeability reservoir. Fault-Block Oil Gas Field 2012, 19, 472–476. [Google Scholar]
  2. Zhu, D.Y.; Dai, P.Q.; Luo, X.B.; Zhang, Y.C. Novel Characterization of Wetting Properties and the Calculation of Liquid-Solid Interface Tension (I). Sci. Technol. Eng. 2007, 7, 3057–3062. [Google Scholar]
  3. Li, X.B.; Liu, Y. Contact angle model and wettability on the surfaces with microstructures. Mater. Rep. 2009, 23, 101–103. [Google Scholar]
  4. Jia, Z.W.; Yang, Q.Y.; Lan, Y.B.; Zhang, H.X. Experimental study on the process of water-oil displacement with the micro-model. Pet. Geol. Oilfield Dev. Daqing 2002, 21, 46–49. [Google Scholar]
  5. Zhu, W.Y.; Ju, Y.; Zhao, M.; Chen, Q.; Yang, Z.M. Spontaneous imbibition mechanism of flow through porous media and waterflooding in low-permeability fractured sandstone reservoir. Acta Pet. Sin. 2002, 23, 56–59. [Google Scholar]
  6. Liu, Z.Y.; Zeng, Q.H.; Tang, Z.H.; Zhang, G.S. Effect of wettability on recovery and relative permeability. Oil Gas Geol. 2000, 21, 148–150. [Google Scholar]
  7. Zhang, J.C.; Jin, H.L.; Liang, W.Q.; Yu, X.J. Research and practice of multiple water injection technology for fractured buried hill reservoirs. Spec. Oil Gas Reserv. 2012, 19, 86–89. [Google Scholar]
  8. Zhang, H.M.; Wang, S.B.; Wang, Y.M. Application of interval subdivision in water injectors in “stabilizing oil production and controlling water cut”. Pet. Geol. Oilfield Dev. Daqing 1997, 16, 64–66. [Google Scholar]
  9. Huang, F.S.; Zhao, Y.S. Research on optimal hierarchical modeling of subdivisional separate layer injection in high water cut sandstone oil field. Pet. Geol. Oilfield Dev. Daqing 1998, 17, 33–34. [Google Scholar]
  10. Gang, Z.B.; Wei, X.F. Review and outlook of separate layer water injection technology in Daqing Oilfield. Spec. Oil Gas Reserv. 2006, 13, 4–9. [Google Scholar]
  11. Chen, T. Experimental study of water-oil displacement with microscopic models of heterogeneous reservoirs. Pet. Geol. Recovery Effic. 2007, 14, 72–75. [Google Scholar]
  12. Gu, Q.Q.; Liu, H.H.; Wu, L. Preferential imbibition in a dual-permeability pore network. J. Fluid Mech. 2020, 915, A138. [Google Scholar] [CrossRef]
  13. Guo, W.K. Progress and prospect of geology and development technology in Daqing oilfield. Pet. Geol. Oilfield Dev. Daqing 2004, 23, 54–59. [Google Scholar]
  14. Quezada, G.R.; Toro, N.; Saavedra, J.H.; Robles, P.; Salazar, I.; Navarra, A.; Jeldres, R.I. Molecular Dynamics Study of the Conformation, Ion Adsorption, Diffusion and Water Structure of Soluble Polymers in Saline Solutions. Polymers 2021, 13, 3550. [Google Scholar] [CrossRef] [PubMed]
  15. Jeldres, R.I.; Concha, F.; Toledo, P.G. Population balance modelling of particle flocculation with attention to aggregate restructuring and permeability. Polymers 2015, 224, 62–71. [Google Scholar] [CrossRef] [PubMed]
  16. Bogdanov, I.; Kpahou, J.; Kamp, A. Direct Pore-scale Modeling of Two-phase Flow Through Natural Media. In Proceedings of the European COMSOL Conference, Stuttgart, Germany, 26–28 October 2011. [Google Scholar]
  17. Afrapoli, M.S.; Crescente, C.; Li, S.D.; Alipour, S.; Torsaeter, O. Simulation Study of Displacement Mechanisms in Microbial Improved Oil Recovery Experiments. In Proceedings of the SPE EOR Conference at Oil and Gas West Asia, Muscat, Oman, 16–18 April 2012. [Google Scholar]
  18. Rabbani, S.; Abderrahmane, H.; Sassi, M. Investigation of Enhanced Oil Recovery with the Upscaled Three Phase Flow Model in an Oil Reservoir. In Proceedings of the SPE Gas & Oil Technology Showcase and Conference, Dubai, United Arab Emirates, 21–23 October 2019; p. 198575. [Google Scholar]
  19. Yue, P.T.; Feng, J.J.; Liu, C.; Shen, J. A diffuse-interface method for simulating two-phase flows of complex fluids. Fluid Mech. 2004, 515, 293–317. [Google Scholar] [CrossRef] [Green Version]
  20. Zhu, G.P.; Yao, J.; Zhang, L.; Sun, H.; Li, A.F.; Zhang, K. Pore-scale investigation of residual oil distributions and formation mechanisms at the extra-high water-cut stage. Chin. Sci. Bull. 2017, 62, 2553–2563. [Google Scholar]
  21. Tryggvason, G.; Bunner, B.; Esmaeeli, A.; Juric, D.; Rawahi, A.; Tauber, W.; Han, J.; Nas, S.; Jan, Y.J. A front-tracking method for the computations of multiphase flow. J. Comput. Phys. 2001, 169, 708–759. [Google Scholar] [CrossRef] [Green Version]
  22. Yue, P.T.; Zhou, C.F.; Feng, J.J.; Ollivier-Gooch, C.F.; Hu, H.H. Phase-field simulations of interfacial dynamics in viscoelastic fluids using finite elements with adaptive meshing. J. Comput. Phys. 2006, 219, 147–167. [Google Scholar] [CrossRef]
  23. Zhou, S.W.; Zhuang, X.Y.; Rabczuk, T. A phase-field modeling approach of fracture propagation in poroelastic media. Eng. Geol. 2018, 240, 189–203. [Google Scholar] [CrossRef] [Green Version]
  24. Boyer, F.; Lapuerta, C.; Minjeaud, S.; Piar, B.; Quintard, M. Cahn–Hilliard/Navier-Stokes Model for the Simulation of Three-Phase Flows. Transp. Porous Media 2010, 82, 463–483. [Google Scholar] [CrossRef]
  25. Magaletti, F.; Picano, F.; Chinappi, M.; Marino, L.; Casciola, C.M. The sharp-interface limit of the Cahn-Hilliard/Navier-Stokes model for binary fluids. J. Fluid Mech. 2013, 714, 95–126. [Google Scholar] [CrossRef]
  26. Shardt, O.; Derksen, J.J.; Mitra, S.K. Simulations of droplet coalescence in simple shear flow. Langmuir 2013, 29, 6201–6212. [Google Scholar] [CrossRef] [PubMed]
  27. Lee, H.G.; Kim, K.; Kim, J. On the long time simulation of the Rayleigh-Taylor instability. Int. J. Numer. Methods Eng. 2010, 85, 1633–1647. [Google Scholar] [CrossRef]
  28. Zhong, H.; He, Y.; Yang, E.; Bi, Y.; Yang, T. Modeling of microflow during viscoelastic polymer flooding in heterogenous reservoirs of Daqing Oilfield. J. Pet. Sci. Eng. 2022, 210, 110091. [Google Scholar] [CrossRef]
  29. Luo, H.; Wen, J.; Lv, C.; Wang, Z. Modeling of viscosity of unstable crude oil–water mixture by characterization of energy consumption and crude oil physical properties. J. Pet. Sci. Eng. 2022, 212, 110222. [Google Scholar] [CrossRef]
  30. Shen, J. Modeling and numerical approximation of two-phase incompressible flows by a phase-field approach. Multisc. Model Anal. Mater. Simul. 2011, 22, 147–195. [Google Scholar]
  31. Hizir, F.E.; Hardt, D.E. Phase-field modeling of liquids splitting between separating surfaces and its application to high-resolution roll-based printing technologies. Phys. Fluids 2017, 29, 052007. [Google Scholar] [CrossRef] [Green Version]
  32. Li, Y.; Long, J.; Zhao, Y.; Duan, Q.; Dai, Z.; Su, S. Molecular simulation on friction reducing performance of friction modifiers. Acta Pet. Sin. 2018, 34, 136–143. [Google Scholar]
  33. Wylie, P.; Mohanty, K.K. Effect of Wettability on Oil Recovery by Near-miscible Gas Injection. SPE Reserv. Eng. 1998, 21, 264–268. [Google Scholar]
  34. Cinar, Y.; Jessen, K.; Berenblyum, R.; Juanes, R.; Orr, F.M. An Experimental and Numerical Investigation of Crossflow Effects in Two-Phase Displacements. In Proceedings of the SPE Annual Technical Conference and Exhibition, San Antonio, TX, USA, 24–27 September 2006; Volume 11, pp. 216–226. [Google Scholar]
  35. Pande, K.K.; Orr, F.M. Effect of Viscous Crossflow on Miscibility Development in a Two-Layer Flow System: Part I—Ternary Vaporizing Gas Drives. SPE Adv. Technol. Ser. 1994, 2, 7–16. [Google Scholar] [CrossRef]
  36. Pande, K.K.; Orr, F.M. Effect of Viscous Crossflow on Miscibility Development in a Two-Layer Flow System: Part II—Ternary Condensing Gas Drives. SPE Adv. Technol. Ser. 1994, 2, 17–25. [Google Scholar] [CrossRef]
  37. Zhang, B.; Okuno, R. Modeling of capacitance flow behavior in EOS compositional simulation. J. Pet. Sci. Eng. 2015, 131, 96–113. [Google Scholar] [CrossRef]
  38. Herminghaus, S. Wettability controls slow immiscible displacement through local interfacial instabilities. Phys. Rev. Fluids 2016, 1, 074202. [Google Scholar]
  39. Yang, W.; Fu, C.; Du, Y.; Xu, K.; Balhoff, M.T.; Weston, J.; Lu, J. Dynamic contact angle reformulates pore-scale fluid-fluid displacement at ultralow interfacial tension. SPE J. 2021, 26, 1278–1289. [Google Scholar] [CrossRef]
  40. Wang, Z.; Xu, Y.; Gan, Y.; Han, X.; Liu, W.; Xin, H. Micromechanism of partially hydrolyzed polyacrylamide molecule agglomeration morphology and its impact on the stability of crude oil−water interfacial film. J. Pet. Sci. Eng. 2022, 214, 110492. [Google Scholar] [CrossRef]
  41. Wang, Y.; Li, X.; Lu, J. Experimental study and numerical modeling of boron transport in reservoir and its influence on seawater-breakthrough calculation. SPE Reserv. Eval. Eng. 2021, 24, 292–309. [Google Scholar] [CrossRef]
  42. Yang, E.; Fang, Y.; Liu, Y.; Li, Z.; Wu, J. Research and application of microfoam selective water plugging agent in shallow low-temperature reservoirs. J. Pet. Sci. Eng. 2020, 193, 107354. [Google Scholar] [CrossRef]
  43. Liu, Y.; Rui, Z. A storage-driven CO2 EOR for a net-zero emission target. Engineering 2022, in press. [Google Scholar] [CrossRef]
  44. Wang, Z.; Le, X.; Feng, Y.; Zhang, C. The role of matching relationship between polymer injection parameters and reservoirs in enhanced oil recovery. J. Pet. Sci. Eng. 2013, 111, 139–143. [Google Scholar] [CrossRef]
  45. Ren, Y.; Zhang, X.; Luo, P.; Liu, Y.; Chen, X. An experimental study of hot water flood for enhancing oil recovery in ultra-low permeability reservoir. Unconv. Oil Gas 2019, 6, 69–74. [Google Scholar]
Figure 1. (a) Full perforation and commingling production micro-model. (b) Partial perforation and commingling production-injection micro-model. (c) Separated layer injection and commingling production micro-model.
Energies 15 03236 g001
Figure 2. Distribution of oil saturation for different wettability. (The polymer solution is represented in blue and the oil in red).
Energies 15 03236 g002
Figure 3. (a) Front length coefficient m and (b) oil saturation vs. PV for different wettability.
Energies 15 03236 g003
Figure 4. Oil saturation distribution of partial perforation and commingling production-injection. (The polymer solution is represented in blue and the oil in red).
Energies 15 03236 g004
Figure 5. Oil saturation distribution of separated layer injection and commingling production. (The polymer solution is represented in blue and the oil in red).
Energies 15 03236 g005
Figure 6. (a) Oil saturation and (b) pressure difference vs. PV for different injection method. (blue line: full perforation and commingling production micro-model; red line: partial perforation and commingling production-injection micro-model; green line: separated layer injection and commingling production micro-model).
Energies 15 03236 g006
Figure 7. Distribution of oil saturation when permeability contrast is 11.11 (The polymer solution is represented in blue and the oil in red).
Energies 15 03236 g007
Figure 8. (a) Front length coefficient m and (b) oil saturation vs. PV for different permeability contrast.
Energies 15 03236 g008
Table 1. Parameters of fluid used in this study.
FluidRheologyDensity (kg/m3)Dynamic Viscosity (Pa·s)Interfacial Tension (N/m)
Crude oilNewtonian fluid8600.014.8 × 10−3
Polymer solutionPower-law fluid9600.01
Publisher’s Note: MDPI stays neutral with regard to jurisdictional claims in published maps and institutional affiliations.

