Article

Effect of the Azimuth Axis Tilt Error on the Tracking Performance of a Solar Dish Concentrator System

College of Mechanical Engineering, Hunan University of Science and Technology, Xiangtan 411201, China
*
Authors to whom correspondence should be addressed.
Energies 2022, 15(9), 3261; https://doi.org/10.3390/en15093261
Submission received: 8 April 2022 / Revised: 25 April 2022 / Accepted: 25 April 2022 / Published: 29 April 2022

Abstract

:
A solar dish concentrator system has a large windward area and heavy structural mass, and under the action of wind loads and self-weight loads, foundation settlement can easily occur and cause the column (the azimuth axis) to tilt. Upon tilting, the azimuth axis is no longer perpendicular to the horizontal plane, causing a tracking error in the service of the solar dish concentrator system. In this paper, a tracking error model of a solar dish concentrator system is established based on the rigid body motion theory, which considers the azimuth axis tilt error. In this model, a radial angle and tangential angle parameters are used to describe the azimuth axis’s tilt angle and tilt direction. Under the tilt error of the azimuth axis, we analyze, in detail, the initial tracking position of a solar dish concentrator system, the system operation area, and the variation rule of tracking performance in long-term operation. The results show that under the azimuth axis tilt error of the solar dish concentrator system, the deviation of the initial tracking position of the solar dish concentrator system in the horizontal or vertical plane will reduce its tracking performance and the stability of tracking performance compared with the initial tracking position being due east. The tracking performance of a solar dish concentrator system and its stability are better in areas with a relatively low latitude. In different areas with close latitude, the tracking performance of the solar dish concentrator system and its stability are better, particularly with lower longitudes. During a whole year operation period, the tracking performance of an solar dish concentrator system in the first quarter and the fourth quarter is relatively better, and its stability in June and July is relatively better. This work can provide a theoretical basis for the installation, debugging, and error control of solar dish concentrator systems.

1. Introduction

Solar energy has the advantages of large total volume, safety and economy, cleanness, and being pollution-free [1,2]. A solar dish concentrator (SDC) system is one of the ways to realize the utilization of solar energy [3,4], which has been widely used for its high concentration ratio and high light–electricity conversion efficiency (32%) [5,6]. As shown in Figure 1a, a 38 kW solar dish Stirling thermal power (SDSP) generation system was developed by the authors [7]. The aperture radius R1 of the concentrator is 8.85 m, the focal length is 9.49 m, the unfilled angle θ is 30°, and the unfilled radius R2 is 0.9 m. The SDC system is aimed at the sun in real time through the double-axis tracking device (DATD), gathers the solar radiation energy to the inner surface of the cavity receiver, heats the fluid working medium (usually hydrogen or helium) in the cavity receiver to drive the Stirling heat engine to do work, and, finally, drives the generator set to generate electricity [8]. When the SDC system cannot track the sun accurately, it will lead to the shift of the focus spot and the formation of high-temperature hot spots on the inner wall of the cavity receiver. This will lead to thermal deformation and burning damage to the cavity receiver, which will affect the safe operation of the SDC system [7]. The orthogonal relationship between elevation axis, azimuth axis, and concentrator focal axis of the SDC system is the key factor to ensure its tracking accuracy. Among these, the vertical relationship between the elevation axis and the azimuth axis can be ensured by controlling the machining accuracy of the DATD. The vertical relationship between the focal axis and the elevation axis can be ensured by adjusting the posture of the concentrator. However, due to its large windward area and heavy structural mass, the column (azimuth axis) may tilt under the action of wind loads and self-weight during the long-term service of the SDC system. Then, the azimuth axis becomes non-orthogonal with the horizontal ground, which will lead to the tracking error of the SDC system. Therefore, it is necessary to study the influence of the azimuth axis tilt error on the tracking performance of the SDC system.
At present, many scholars have studied the influences of optical errors on the optical and photo-thermal performance of SDC systems, but fewer scholars have focused on the causes and influence laws of the generation of double-axis tracking errors. For example, in terms of optical and photo-thermal performance, Castellanos et al. [10] developed a mathematical model of the dish/Stirling system and investigated the influence of the geometry of the concentrator and the receiver on the maximum and overall thermal efficiency of the system. Yan et al. [9] investigated the influence of the geometric parameters of the dish concentrator on the optical performance of the solar dish/Stirling system. Li et al. [11] proposed a double-window pressurized volume receiver and studied, in detail, the influence of receiver parameters (cavity size, inner window thickness, distance between windows, and emissivity of inner surfaces) on its optical and thermal performance. Yang et al. [12] established a PTC optical–thermal coupling model based on the Monte Carlo ray tracing method and finite volume method and studied the influence of the concentrator installation error on its optical-thermal performance. Yan et al. [13] studied the influence of a tracking error caused by the DATD on the optical performance of the SDC system. In the aspect of tracking errors, Badescu [14] studied different tracking error distributions and their effects on the long-term operation performance of the dish concentrator system. He used four different tracking error distributions, three of which are bounded distributions and one of which is the widely used classical Gaussian distribution, to evaluate the interception factor, thermal efficiency, and engine efficiency. Furthermore, he also derived the theoretical model of a tracking error distribution of a heliostat based on integral geometry and a geometric probability method [15]. Guo et al. [16] established an elevation-azimuth double-axis tracking model in which the azimuth axis tilt, the non-orthogonal of the elevation-azimuth axis, and the non-parallel degree of the mirror surface plane to the elevation axis were considered. Furthermore, the elevation-azimuth double-axis tracking model is improved and a tracking model of six angular parameters (inclination angle, inclination direction of azimuth axis, the bias angle between elevation axis and azimuth axis, the zero angle position errors of the elevation axis and azimuth axis, and the canting angle of the mirror surface plane to the elevation axis) is established, and the effectiveness of the model is verified by experimental data [17]. The research on shafting tilt error mainly focuses on the field of large telescopes and precision instruments (such as laser trackers). Nobuharu et al. [18] investigated the tilt of the ASTE 10 m antenna azimuth axis under the influence of thermal and wind loads. Huang et al. [19] established the mathematical model of pointing errors and assembly errors of mechanical parts of optical imagers, and established the simulation model of pointing errors based on the Monte Carlo methods and obtained the distribution of pointing errors before and after assembly error correction. Mei et al. [20] derived a quantitative relationship between antenna elevation angle, azimuth angle, and antenna pointing error to correct the pointing error caused by reflector deformation. Some of the researchers’ work is not described in detail, and their main contributions are listed in Table 1.
In summary, some scholars have conducted tracking error-related studies in different fields. However, there are few studies related to the variation law of the tracking performance of the SDC system in terms of initial tracking position, operation area, and long-term operation under the influence of azimuth tilt errors. Therefore, this paper focuses on the tracking performance of the SDC system under the influence of an azimuth axis tilt error. The influence of radial angle and tangential angle of the azimuth axis on the tracking performance of the SDC system is studied in detail. Under the influence of an azimuth axis tilt error, the variation law of tracking performance of the SDC system in initial tracking position, operation area, and the whole year operation period are analyzed. The results of this paper can provide theoretical guidance for the future installation and layout of SDC systems.

2. Tracking Error Model of Azimuth Axis Tilt Influence

2.1. Azimuth Axis Tilt Error

An SDC system mainly consists of a column, DATD, parabolic concentrator, and Stirling heat engine. The column is the front-end mechanism in the SDC system which is fixed on the horizontal ground by bolts. The DATD is installed at the top of the column, and the parabolic concentrator is fixed with the truss through the u-shaped body and installed on the DATD. Ideally, the azimuth axis (that is, the center of the column) is perpendicular to the horizontal plane, the elevation axis is perpendicular to the azimuth axis, and the concentrator focal axis is perpendicular to the elevation axis. The angle between the focal axis and the azimuth axis varies with the position of the sun. However, after long-term operation, the foundation is prone to settlement and the column inclines, leading to the non-orthogonal relationship between the azimuth axis and the horizontal plane, which leads to the tracking error of the SDC system.
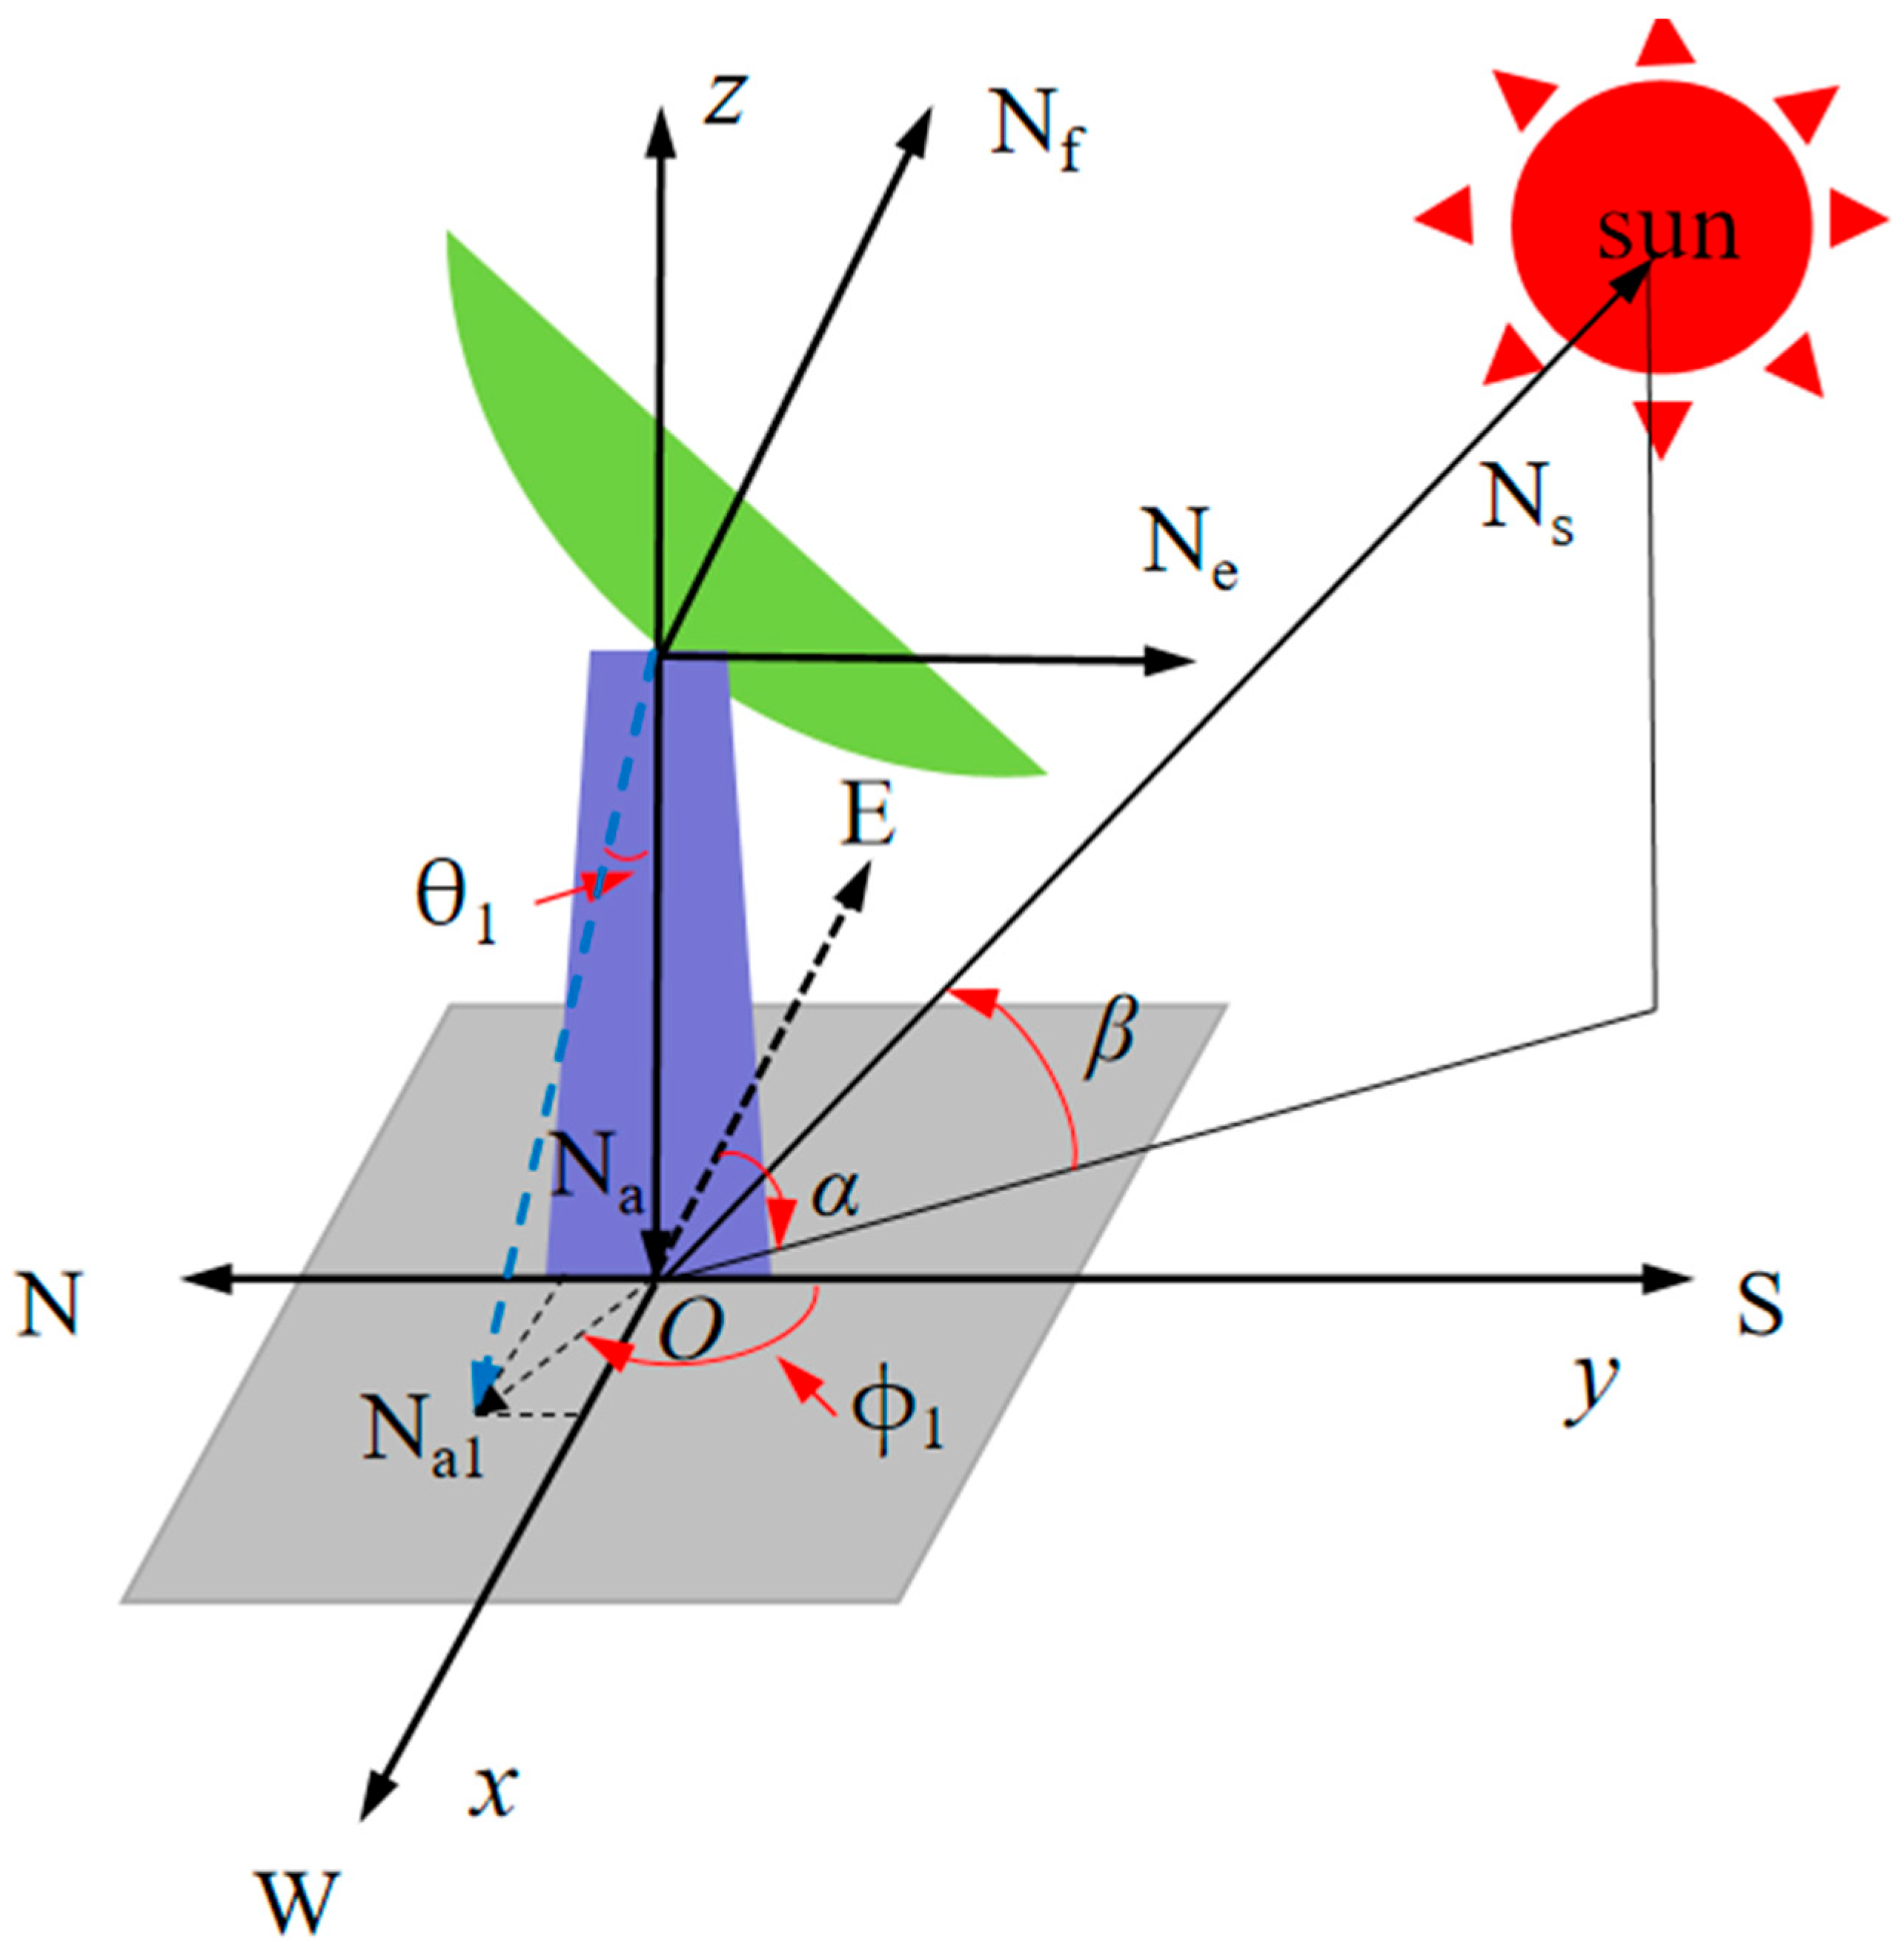
To represent the tilt of the azimuth axis of an SDC system and the position of the sun, the coordinate system O-xyz, as shown in Figure 2, is established. Its center O is located at the intersection of the horizontal ground and the central axis of the column, with the y-axis pointing to due south, x-axis pointing to due east, and z-axis pointing to zenith. In this study, the sun azimuth angle α is positive to the west and negative to the east, the sun elevation angle β is positive to the water intake plane upward, and β = 90° when pointing to the zenith. Ideally, the initial unit vector of azimuth axis is Na= [0,0,−1], the initial unit vector of elevation axis is Ne = [0,1,0], and the initial unit vector of focal axis is Nf = [−1,0,0]. After settlement of the foundation, the azimuth axis vector tilts. In order to describe the deviation error between the azimuth axis and its ideal position, the parameters of the radial angle θ1 and tangential angle ϕ1 are introduced to represent the inclination angle and direction of the azimuth axis, respectively.
Based on the rigid body motion theory [27], the column tilt is equivalent to the azimuth axis vector rotating by a certain radial angle and tangential angle, in turn. The azimuth axis produces the tilt error, which can be considered as the ideal azimuth axis vector Na rotating by an angle θ1 around the x-axis and then rotating by an angle ϕ1 around the z-axis. The azimuth axis vector Na1, after introducing the tilt error, is shown in Equation (1), where Rot(x, θ1) and Rot(z, ϕ1), respectively, represent the rotation matrix around the x- and z-axes, which are shown in Equations (2) and (3), respectively:
N a 1 = N a R o t x , θ 1 R o t z , ϕ 1 = s i n θ 1 s i n ϕ 1 , s i n θ 1 c o s ϕ 1 , c o s θ 1
R o t x , θ 1 = 1 0 0 0 c o s θ 1 s i n θ 1 0 s i n θ 1 c o s θ 1
R o t z , ϕ 1 = c o s ϕ 1 s i n ϕ 1 0 s i n ϕ 1 c o s ϕ 1 0 0 0 1
In the normal operation of an SDC system, the azimuth axis radial angle θ1 can be controlled within a certain range. Then, θ1 is a tiny quantity. Therefore, one can make the following approximation: sinθ1 ≈ θ1, cosθ1 ≈ 1. The azimuth axis vector Na1 can be equivalent to N a 1 , which can be calculated by Equation (4). In this paper, the azimuth axis radial angle θ1 = [0°, 0.25°], then the angle between azimuth axis vector Na1 and its equivalent vector, N a 1 , is [0°, 1.71 × 10⁻⁶°]. It can be seen that the deviation between the azimuth axis vector Na1 and its equivalent vector N a 1 is small, and within the range of the azimuth axis radial angle studied in this paper. Therefore, it is reasonable to adopt the above approximate method.
N a 1 = θ 1 s i n ϕ 1 , θ 1 c o s ϕ 1 , 1

2.2. Tracking Error Model of the SDC System

An SDC system controls the output angle of a DATD by a solar position algorithm (SPA) and tracks the sun in real time from the initial tracking position. However, after the azimuth axis inclines, the SDC system will produce a tracking error. In this paper, an SPA [28] is used to derive the information of the sun’s position (the azimuth angle and elevation angle) at any time and any place. At any time, the sun’s ray vector is expressed by Ns, which can be calculated by Equation (5), where α and β are the sun’s azimuth and elevation angles, respectively. In the process where an SDC system tracks the sun, the focal axis needs to rotate at a certain angle around the azimuth axis, and then rotate at a certain angle around the elevation axis so that the focal axis vector of the concentrator aiming at the sun’s center can be obtained. The main steps are as follows:
N s = c o s α s i n β , s i n α c o s β , s i n β
(1) The elevation axis vector Ne1 rotates the azimuth axis vector Na1 around α angle and the elevation axis vector Ne2 after tracking the sun is obtained, which can be calculated by Equation (6). In this study, it is assumed that the elevation axis and the concentrator focal axis have no initial axis system error, i.e., Ne1 = Ne and Nf1 = Nf.
N e 2 = N e 1 R o t N a 1 , α
R o t n , θ = c o s θ + n x 2 1 c o s θ n x n y 1 c o s θ + n z s i n θ n x n z 1 c o s θ n y s i n θ n x n y 1 c o s θ n z s i n θ c o s θ + n y 2 1 c o s θ n y n z 1 c o s θ + n x s i n θ n x n z 1 c o s θ + n y s i n θ n y n z 1 c o s θ n x s i n θ c o s θ + n z 2 1 c o s θ
where Rot(n, θ) [16] is the function to ensure that the vector P R 1 × 3 is rotated by angle θ around the unit vector n = [nx, ny, nz].
Simplifying the substitution of Equation (4) into Equation (6), we get Equation (8):
N e 2 = θ 1 2 1 c o s α s i n ϕ 1 c o s ϕ 1 + s i n α θ 1 2 1 c o s α c o s 2 ϕ 1 + c o s α θ 1 s i n ϕ 1 + α s i n ϕ 1 T
(2) The concentrator focal axis vector Nf1 rotates α angle around the azimuth axis vector Na1, which can be calculated by Equation (9). It then rotates β angle around the elevation axis to obtain the focal axis vector Nf2 after tracking the sun, and can be calculated by Equation (11).
N f 2 = N f 1 R o t N a 1 , α
Simplifying the substitution of Equation (4) into Equation (9), we get Equation (10):
N f 2 = θ 1 s i n ϕ 1 s i n ϕ 1 + α θ 1 c o s ϕ 1 c o s ϕ 1 + α 1 T
N f 2 = N f 2 R o t N e 2 , β
To facilitate the derivation, let N e 2 = d 1 , d 2 , d 3 and N f 2 = e 1 , e 2 , e 3 , substitute them into Equation (11), and then simplify to obtain Equation (12):
N f 2 = e 1 c 1 c o s β e 2 d 3 e 3 d 2 s i n β + c 1 e 2 c 2 c o s β + e 1 d 3 + e 3 d 1 s i n β + c 2 e 3 c 3 c o s β e 1 d 2 e 2 d 1 s i n β + c 3 T
In Equation (12), c1, c2, and c3, respectively, are:
c 1 = e 1 d 1 2 + e 2 d 1 d 2 + e 3 d 1 d 3 c 2 = e 2 d 2 2 + e 1 d 1 d 2 + e 3 d 2 d 3 c 3 = e 3 d 3 2 + e 1 d 1 d 3 + e 2 d 2 d 3
(3) The angle between the sun ray vector Ns and the focal axis vector Nf2, i.e., the SDC system tracking error, can be calculated by Equation (14):
e a l l = a r c c o s N s , N f 2

3. Evaluation Index

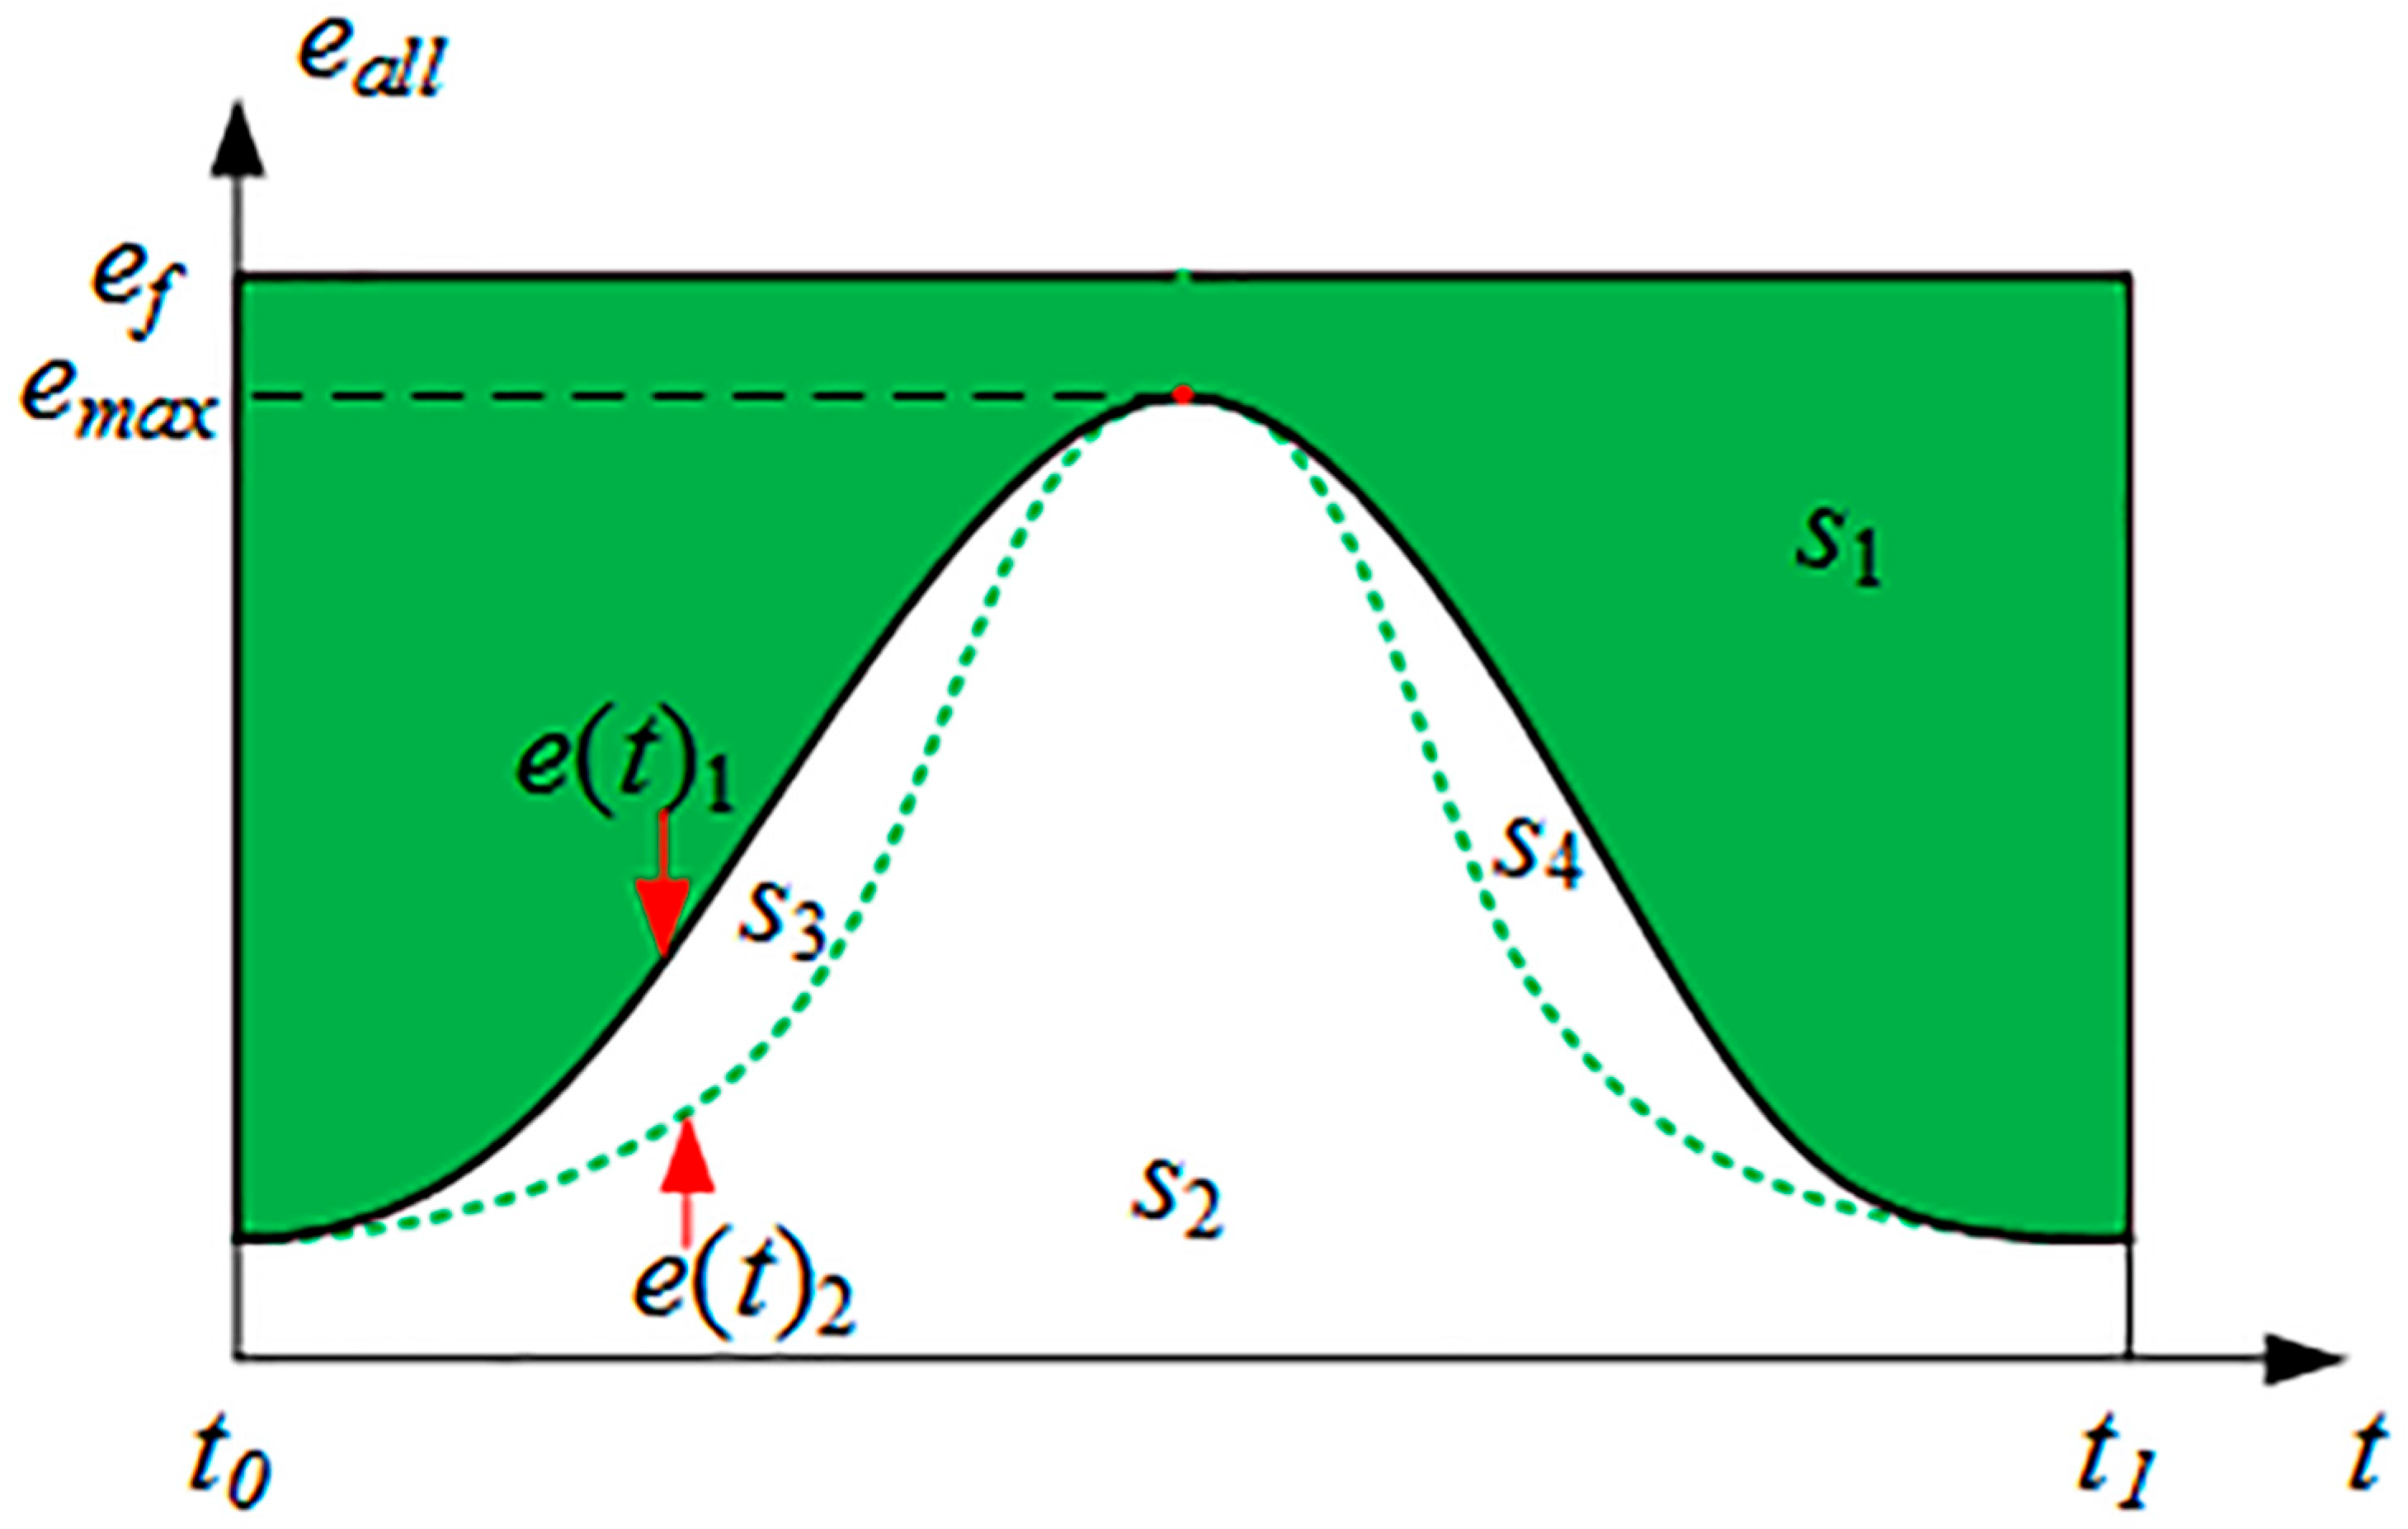
The measurement of tracking performance of an SDC system can be divided into a certain moment, day, month or year from the perspective of time dimension. Generally, we use the tracking error to measure the tracking performance of an SDC system at a certain time. An effective tracking factor (ETF) was previously proposed to measure the tracking performance of an SDC system in a one-day operation cycle [29]. However, the ETF measured the tracking performance of the SDC system under a set of operating conditions (one radial angle and one tangential angle). It cannot measure the tracking performance of the SDC system in a certain area, nor can it measure the tracking performance of the SDC system over a long running period. Therefore, the average effective tracking factor σ ¯ and standard deviation (SD) are introduced to represent the average value of the effective tracking factor and the dispersion degree (stability) of the average effective tracking factor of an SDC system under multiple working conditions, respectively. For example, when the azimuth axis radial angle is constant, σi is used to represent the tracking performance of the SDC system at different tangential angles. When i = 1, σ1 represents the tracking performance of the SDC system when the azimuth axis tangential angle ϕ1 = 0° (due south). the tangential angle is divided into n equal parts (n = 24), the corresponding effective tracking factors are σ1, σ2, ... , σi, ..., and σn, respectively, and then the average effective tracking factor is obtained, which is calculated by Equation (17). The larger the average effective tracking factor, the better the tracking performance of the SDC system. The smaller the SD, the better the stability of the tracking performance of the SDC system Figure 3. σ ¯ d , σ ¯ m , and σ ¯ y represent the average effective tracking factors of one day, one month, and one year, respectively. SDd, SDm, and SDy, respectively, represent the standard deviations of the average effective tracking factor of one day, one month, and one year (i.e., tracking performance stability).
S = S 1 + S 2 + S 3 + S 4 = t 0 t 1 e f d t
σ = S 2 S = t 0 t 1 e f e t 2 d t t 0 t 1 e f d t = 1 t 0 t 1 e t 2 d t t 0 t 1 e f d t
σ ¯ = 1 n i = 1 n σ i
S D = 1 n i = 1 n σ i σ ¯ 2

4. Results and Discussion

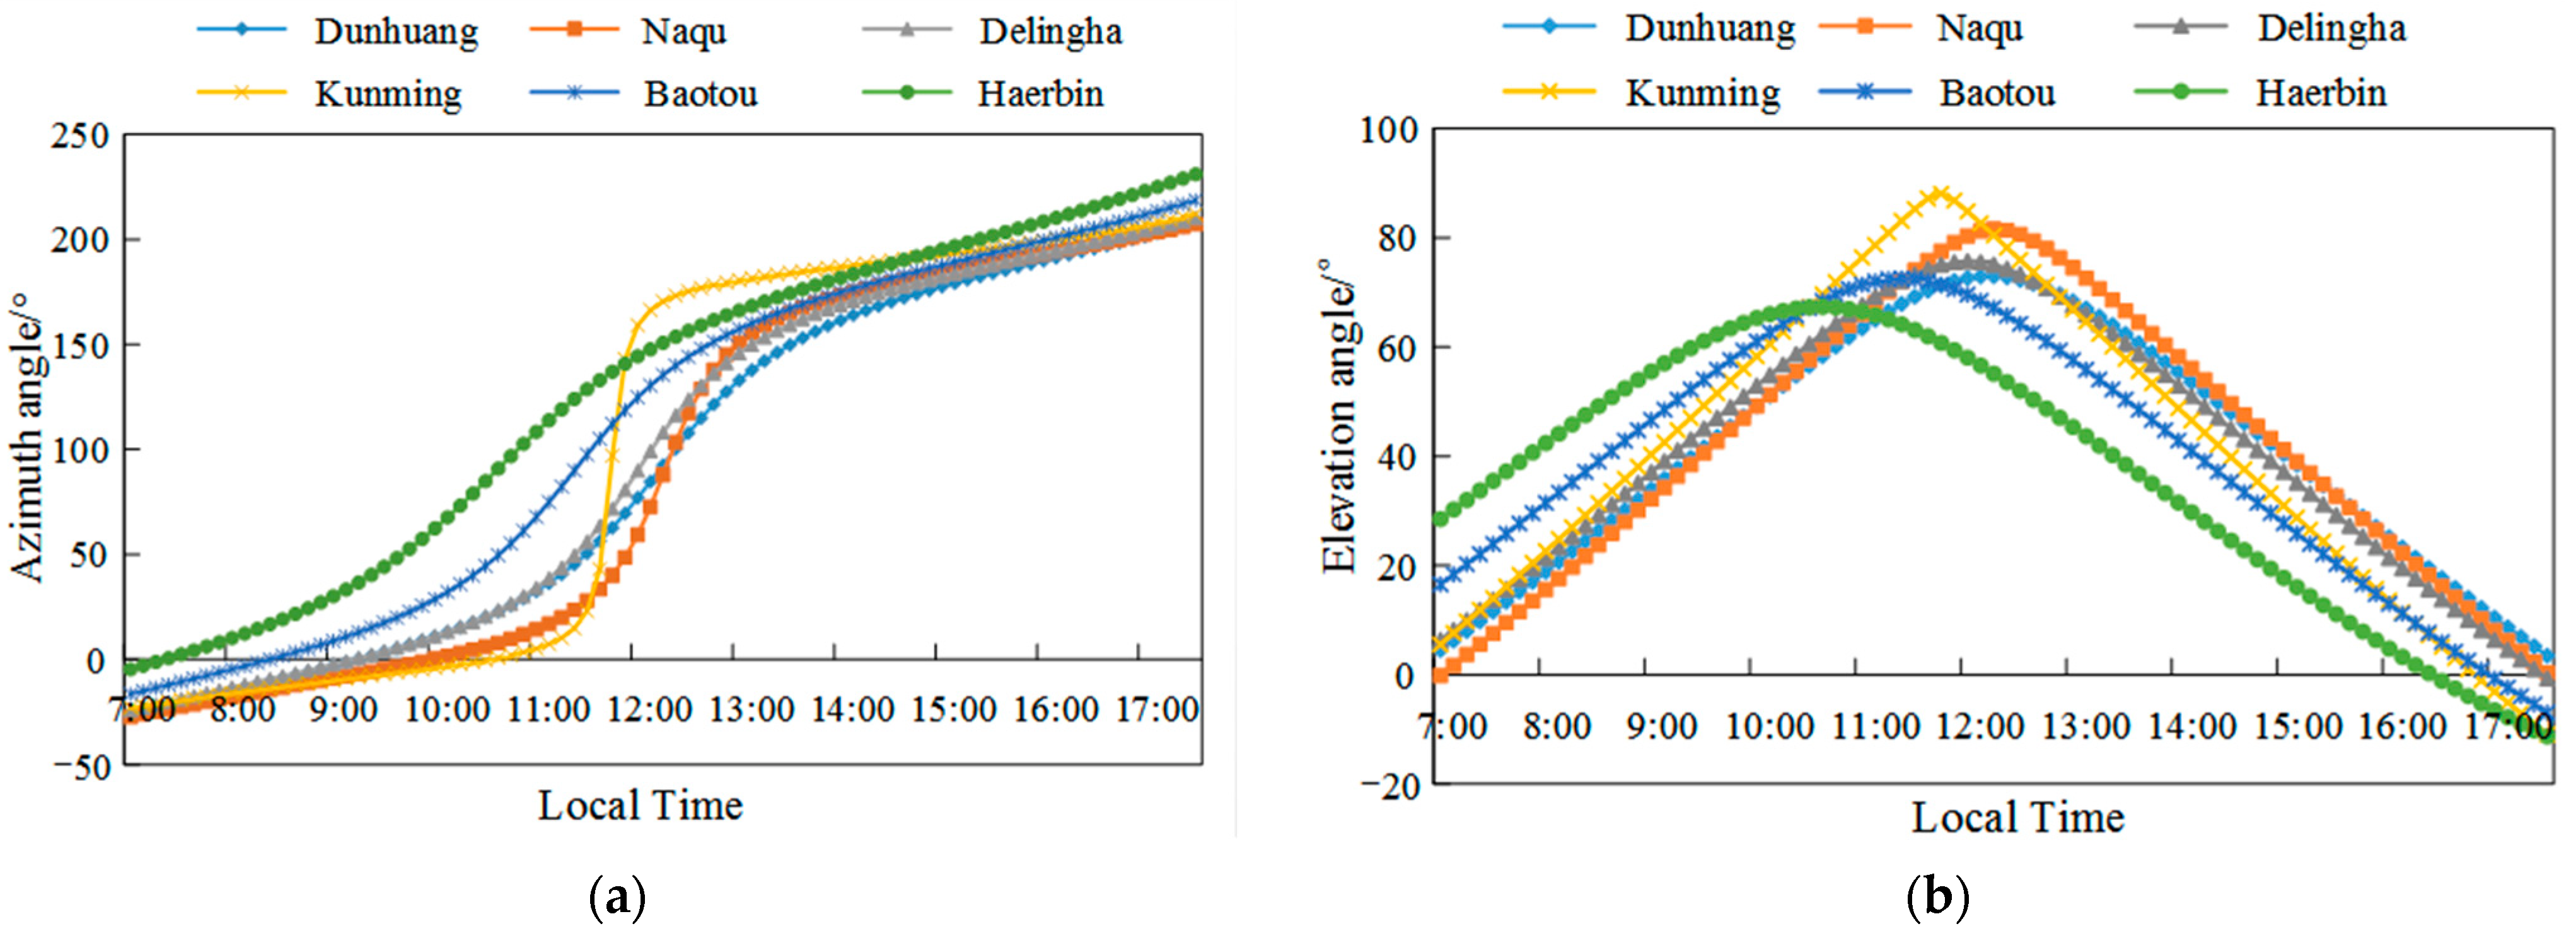
In this section, the influence of the azimuth axis tilt error on the tracking performance of an SDC system is studied in detail. The SPA [28] algorithm is used to calculate the solar position changes in different regions (Dunhuang, Naqu, Delingha, Kunming, Baotou, and Haerbin) during the summer solstice, as shown in Figure 4. Firstly, the influence of the radial and tangential angles of azimuth axis on the tracking performance of the SDC system is studied. Secondly, under the influence of azimuth axis error, the influence of the initial tracking position of SDC system on its tracking performance is studied. Then, the tracking performance variation law of an SDC system operating in different regions is studied. Finally, the tracking performance variation law of an SDC system running in a typical region (Dunhuang) for a long time (one whole year) is studied.

4.1. Influence of Azimuth Radial Angle and Tangential Angle on Tracking Performance of an SDC System

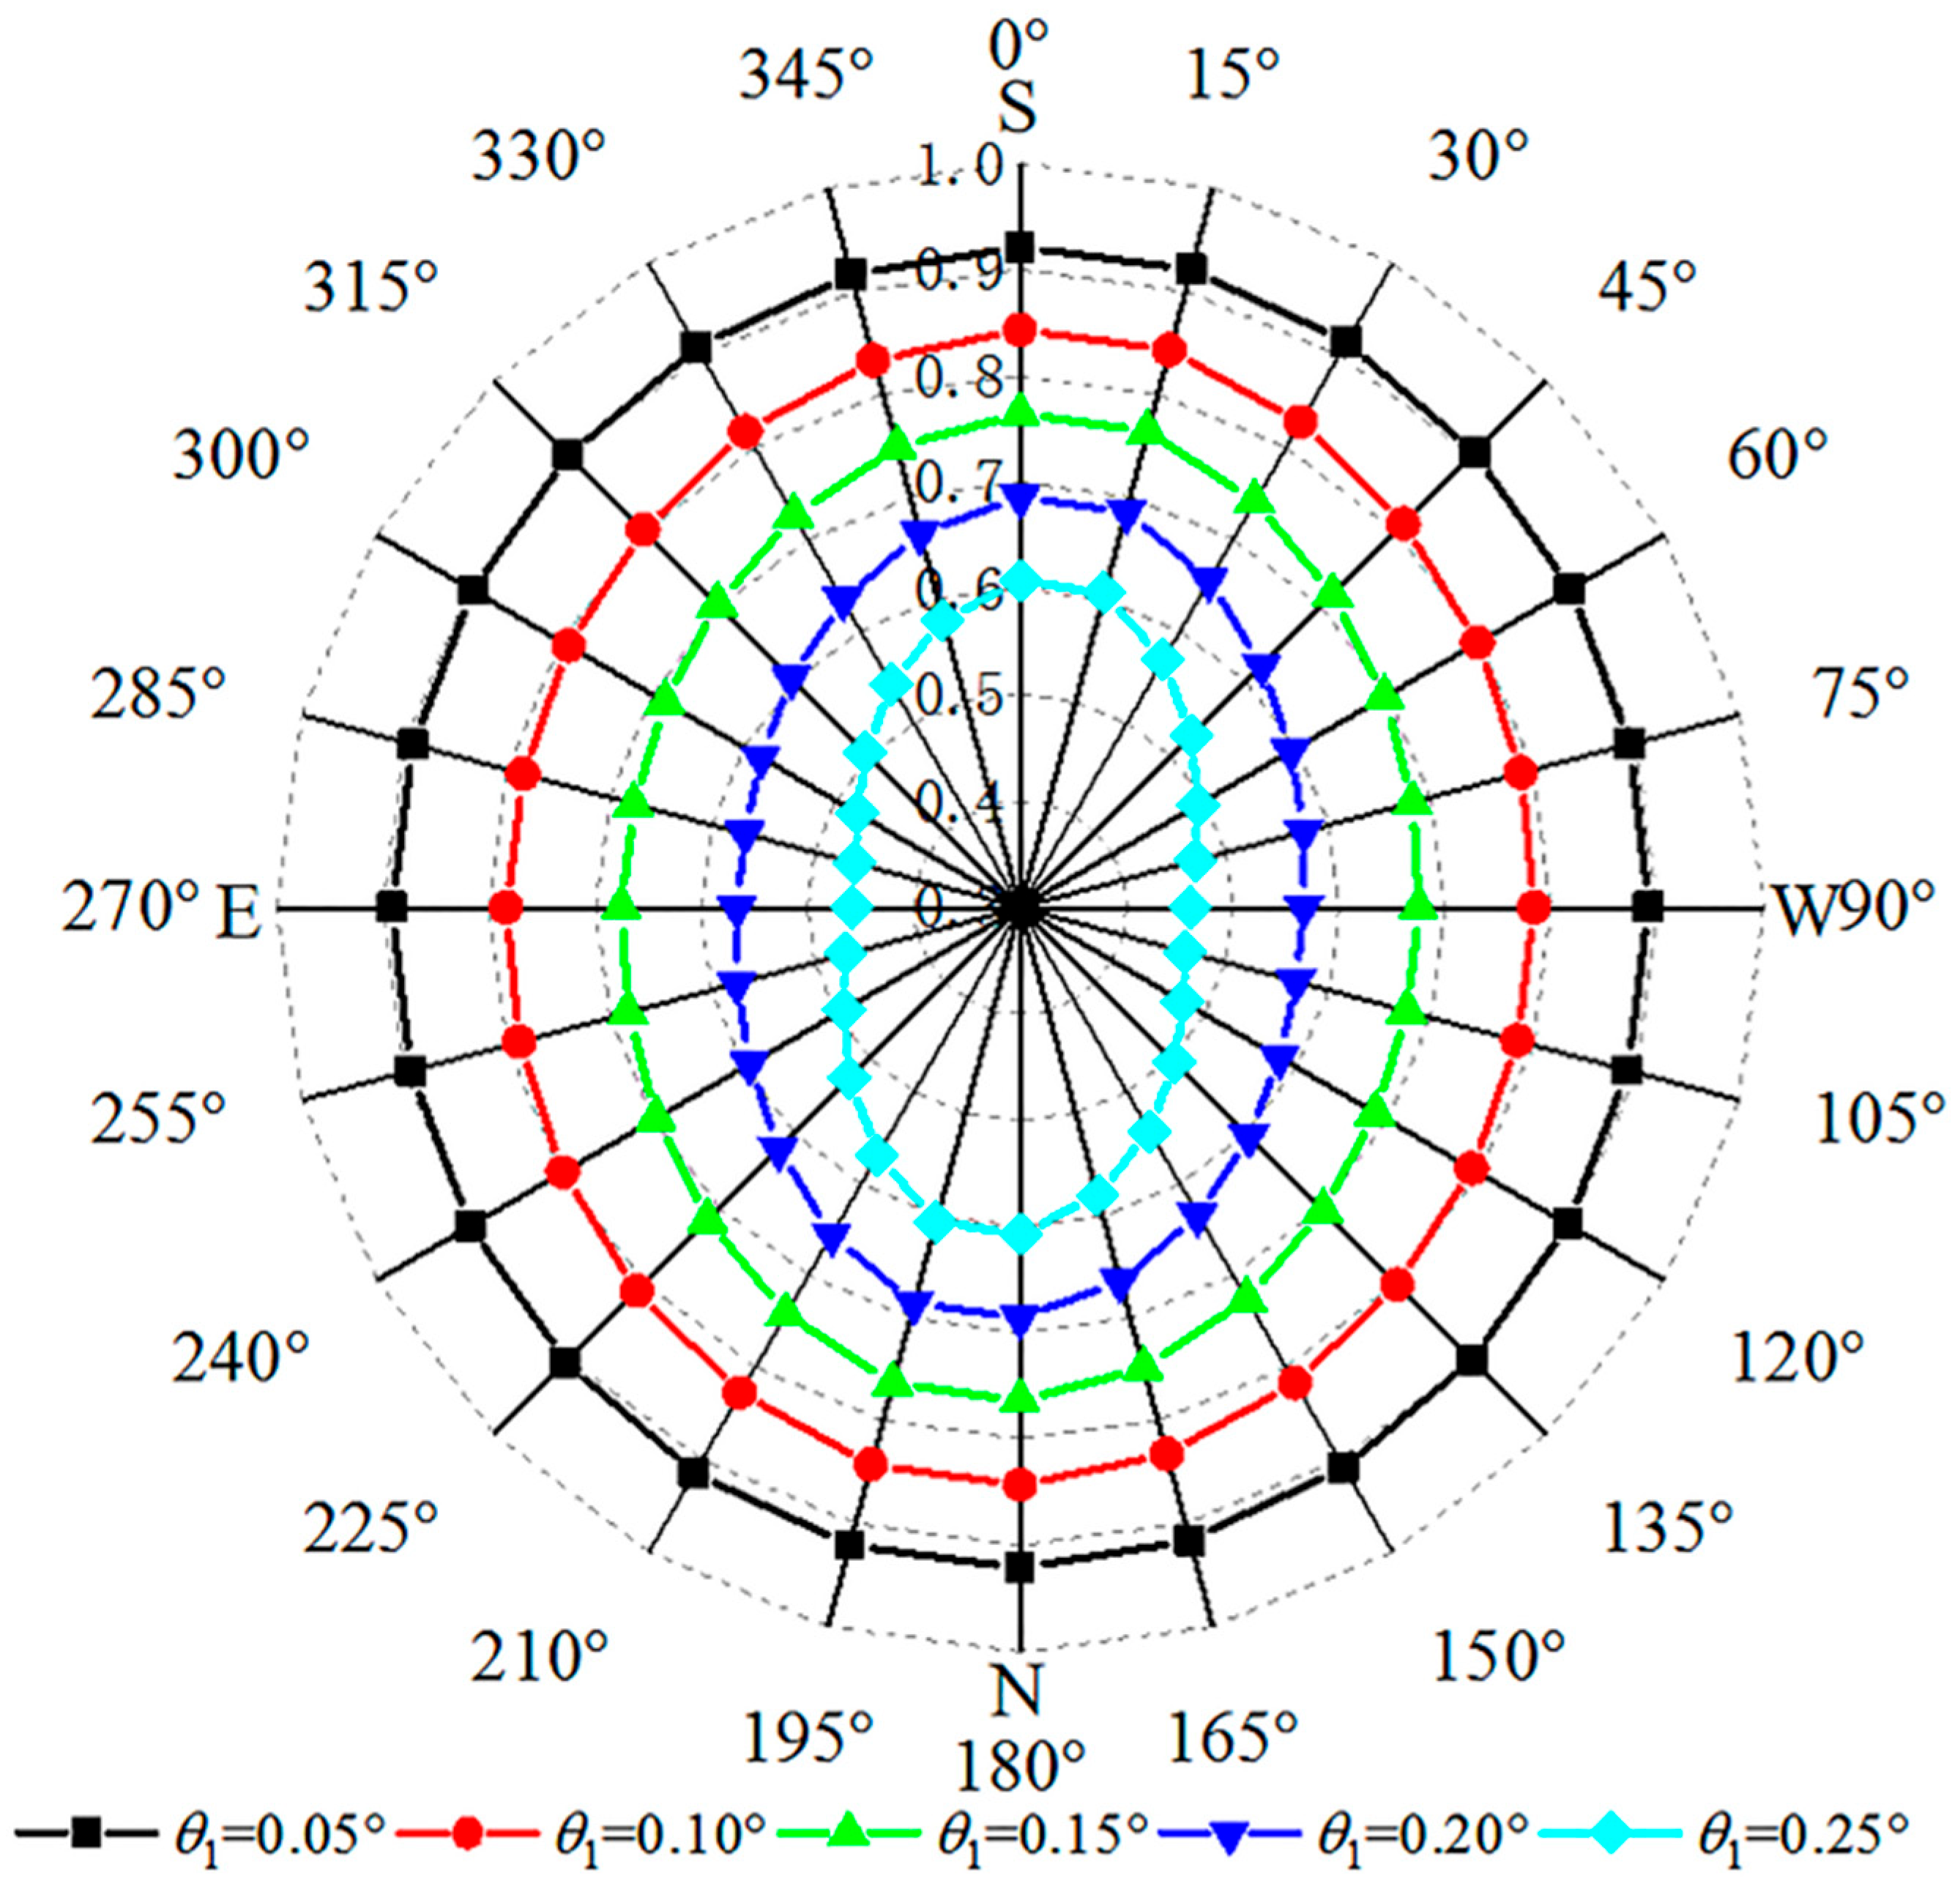
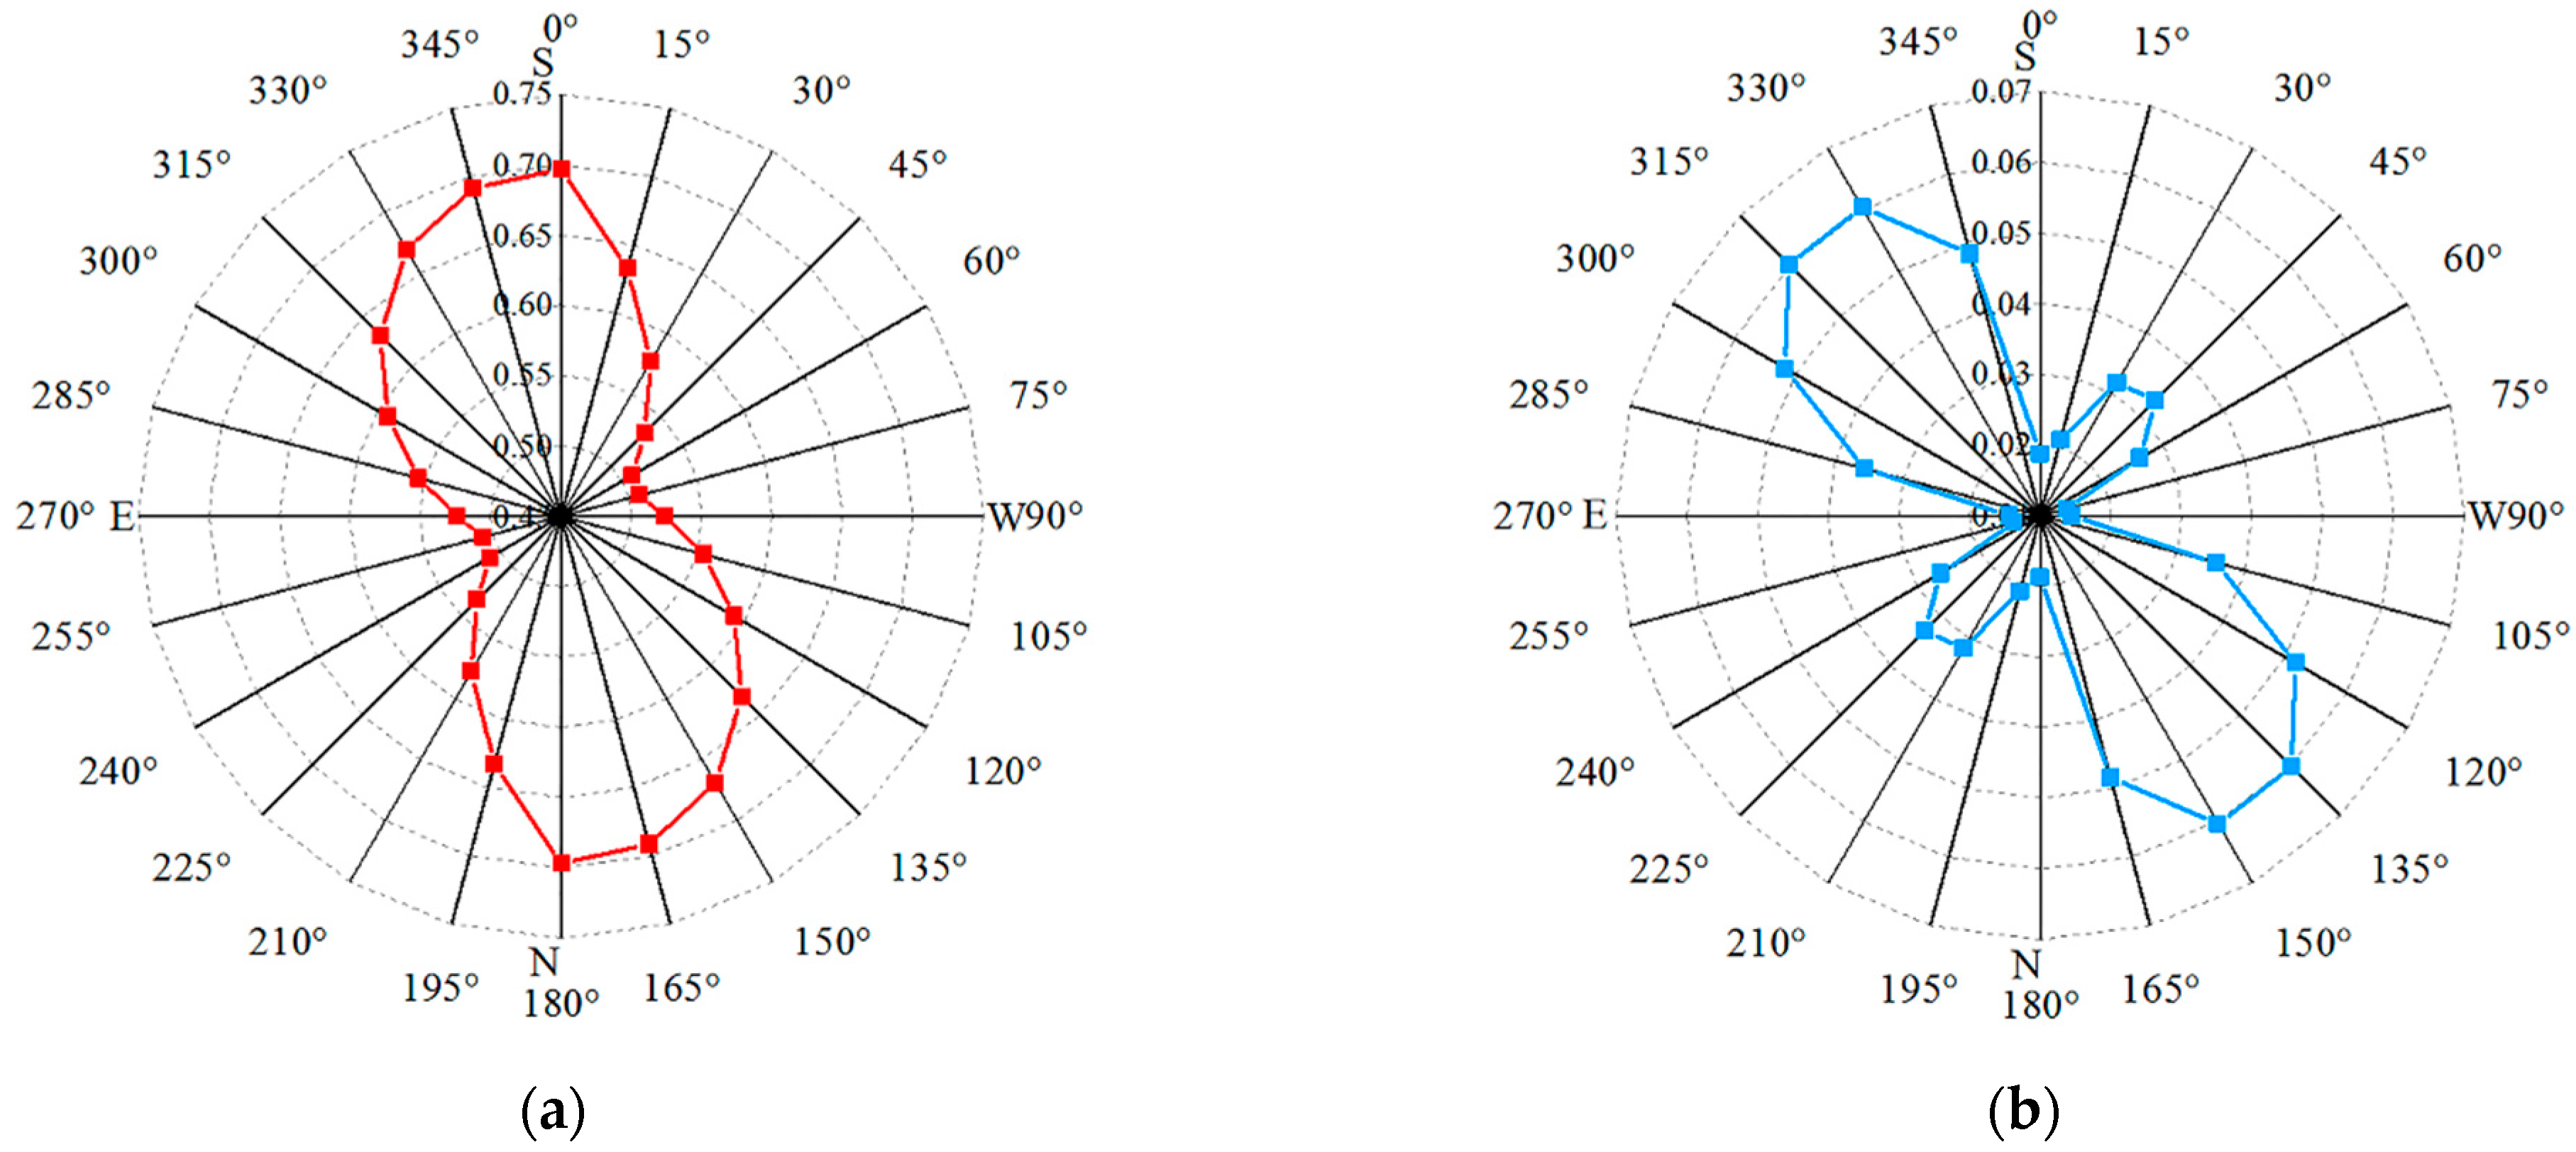
In this section, taking a typical day (the summer solstice) in a typical area (Dunhuang) as an example, the influence of the radial and tangential angles of the azimuth axis on the tracking performance of an SDC system is studied. Figure 5 shows the variation of effective tracking factor of an SDC system with the azimuth axis radial angle θ1 = 0.05°, 0.1°, 0.15°, 0.2°, and 0.25° and the tangential angle ϕ1 = [0°, 360°]. When the tangential angle of azimuth axis is constant, with the increase of the radial angle of azimuth axis, the effective tracking factor decreases, that is, the tracking performance of the SDC system decreases. When the radial angle of azimuth axis is constant, with the tangential angle of azimuth axis changing from ϕ1 = 0° (due south) to ϕ1 = 180° (due north), the effective tracking factor first decreases and then increases. When the azimuth tangential angle of azimuth axis is ϕ1 = 0° and ϕ1 = 90°, the effective tracking factor reaches the maximum and minimum, respectively. That is, when the azimuth axis’s tangential angle is ϕ1 = 0° or 180°, the tilt error of the azimuth axis has the least influence on the tracking performance of the SDC system. At the same time, we find that the change of the azimuth axis radial angle has the same trend for the tracking performance of the SDC system. Two azimuth axis tangential angles symmetrical about the origin have the same tracking performance. For example, when the azimuth axis tangential angles are ϕ1 = 0° and ϕ1 = 180°, the tracking performance is the same. In the subsequent study, in order to reduce the amount of calculation, we used the radial angle θ1 = 0.1° and the tangential angle ϕ1 = [0°,360°] of azimuth axis.

4.2. Influence of Initial Tracking Position of an SDC System under Azimuth Axis Tilt Error

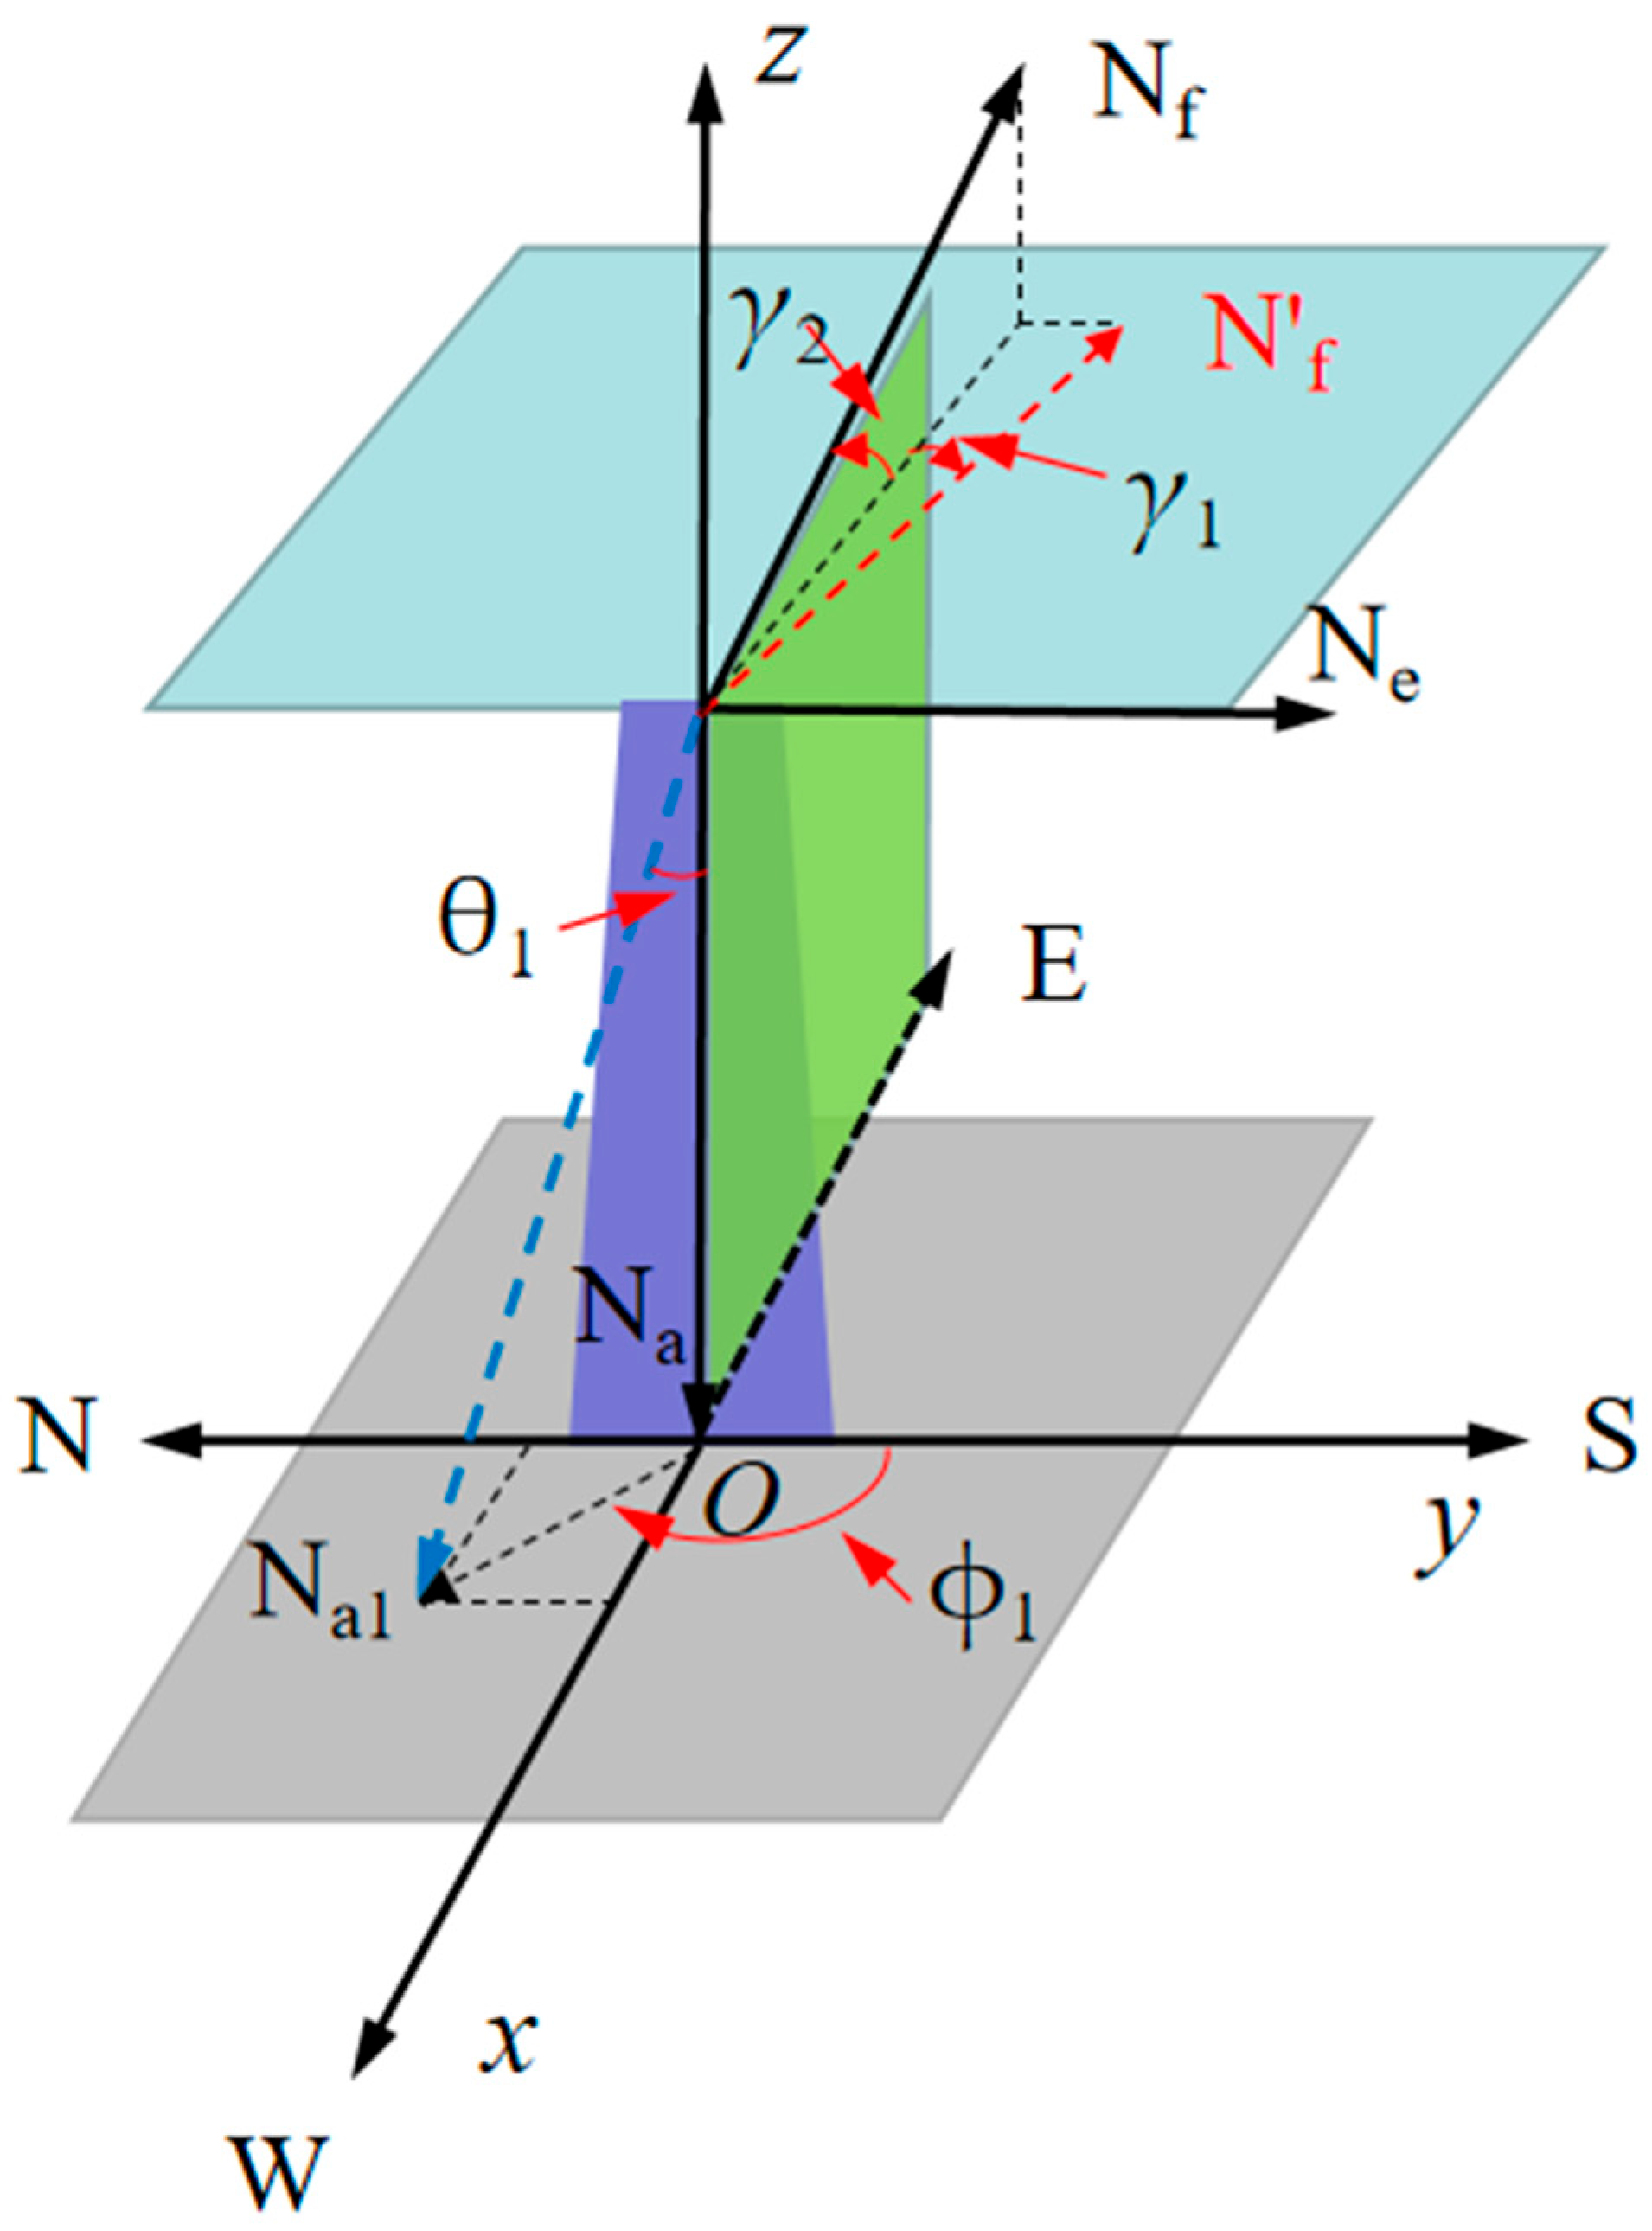
In practical engineering applications, the initial tracking position of an SDC system is generally due east (i.e., the focal axis points to due east). Currently, total stations, ranging sensors, and laser scanners are mainly used to ensure the initial tracking position of an SDC system. These measuring instruments have certain errors, which leads to the initial tracking position of the SDC system not being due east. Therefore, this section takes a typical day (the summer solstice) in a typical area (Dunhuang) as an example to study the influence of the initial tracking position of an SDC system on its tracking performance under the azimuth axis tilt error. Figure 6 shows the schematic diagram of the initial tracking position of an SDC system. In order to describe the initial tracking position of an SDC system, two offset angles, γ1 and γ2, are introduced. Then, any initial tracking position can be considered as the focal axis vector rotated by γ1 around the z-axis and then rotated by γ2 around the y-axis. The focal axis vector N’f of the initial tracking position can be calculated by Equation (19), where Rot(y, γ2) and Rot(z, γ1), respectively, represent the rotation matrix around the y- and z-axes, which are shown by Equations (3) and (20), respectively. When γ1 ≠ 0 and γ2 = 0, the initial tracking position varies in the horizontal plane. When γ1 = 0 and γ2 ≠ 0, the initial tracking position varies in the vertical plane. When γ1 = γ2 = 0, it means that the initial tracking position of the SDC system is due east. The value range of γ1 and γ2 is [−0.5°, 0.5°].
N f = N f R o t z , γ 1 R o t y , γ 2
R o t y , γ 2 = c o s γ 2 0 s i n γ 2 0 1 0 s i n γ 2 0 c o s γ 2
Simplify Equation (19) to get N’f = [−cosγ1cosγ2, −sinγ1, cosγ1sinγ2].
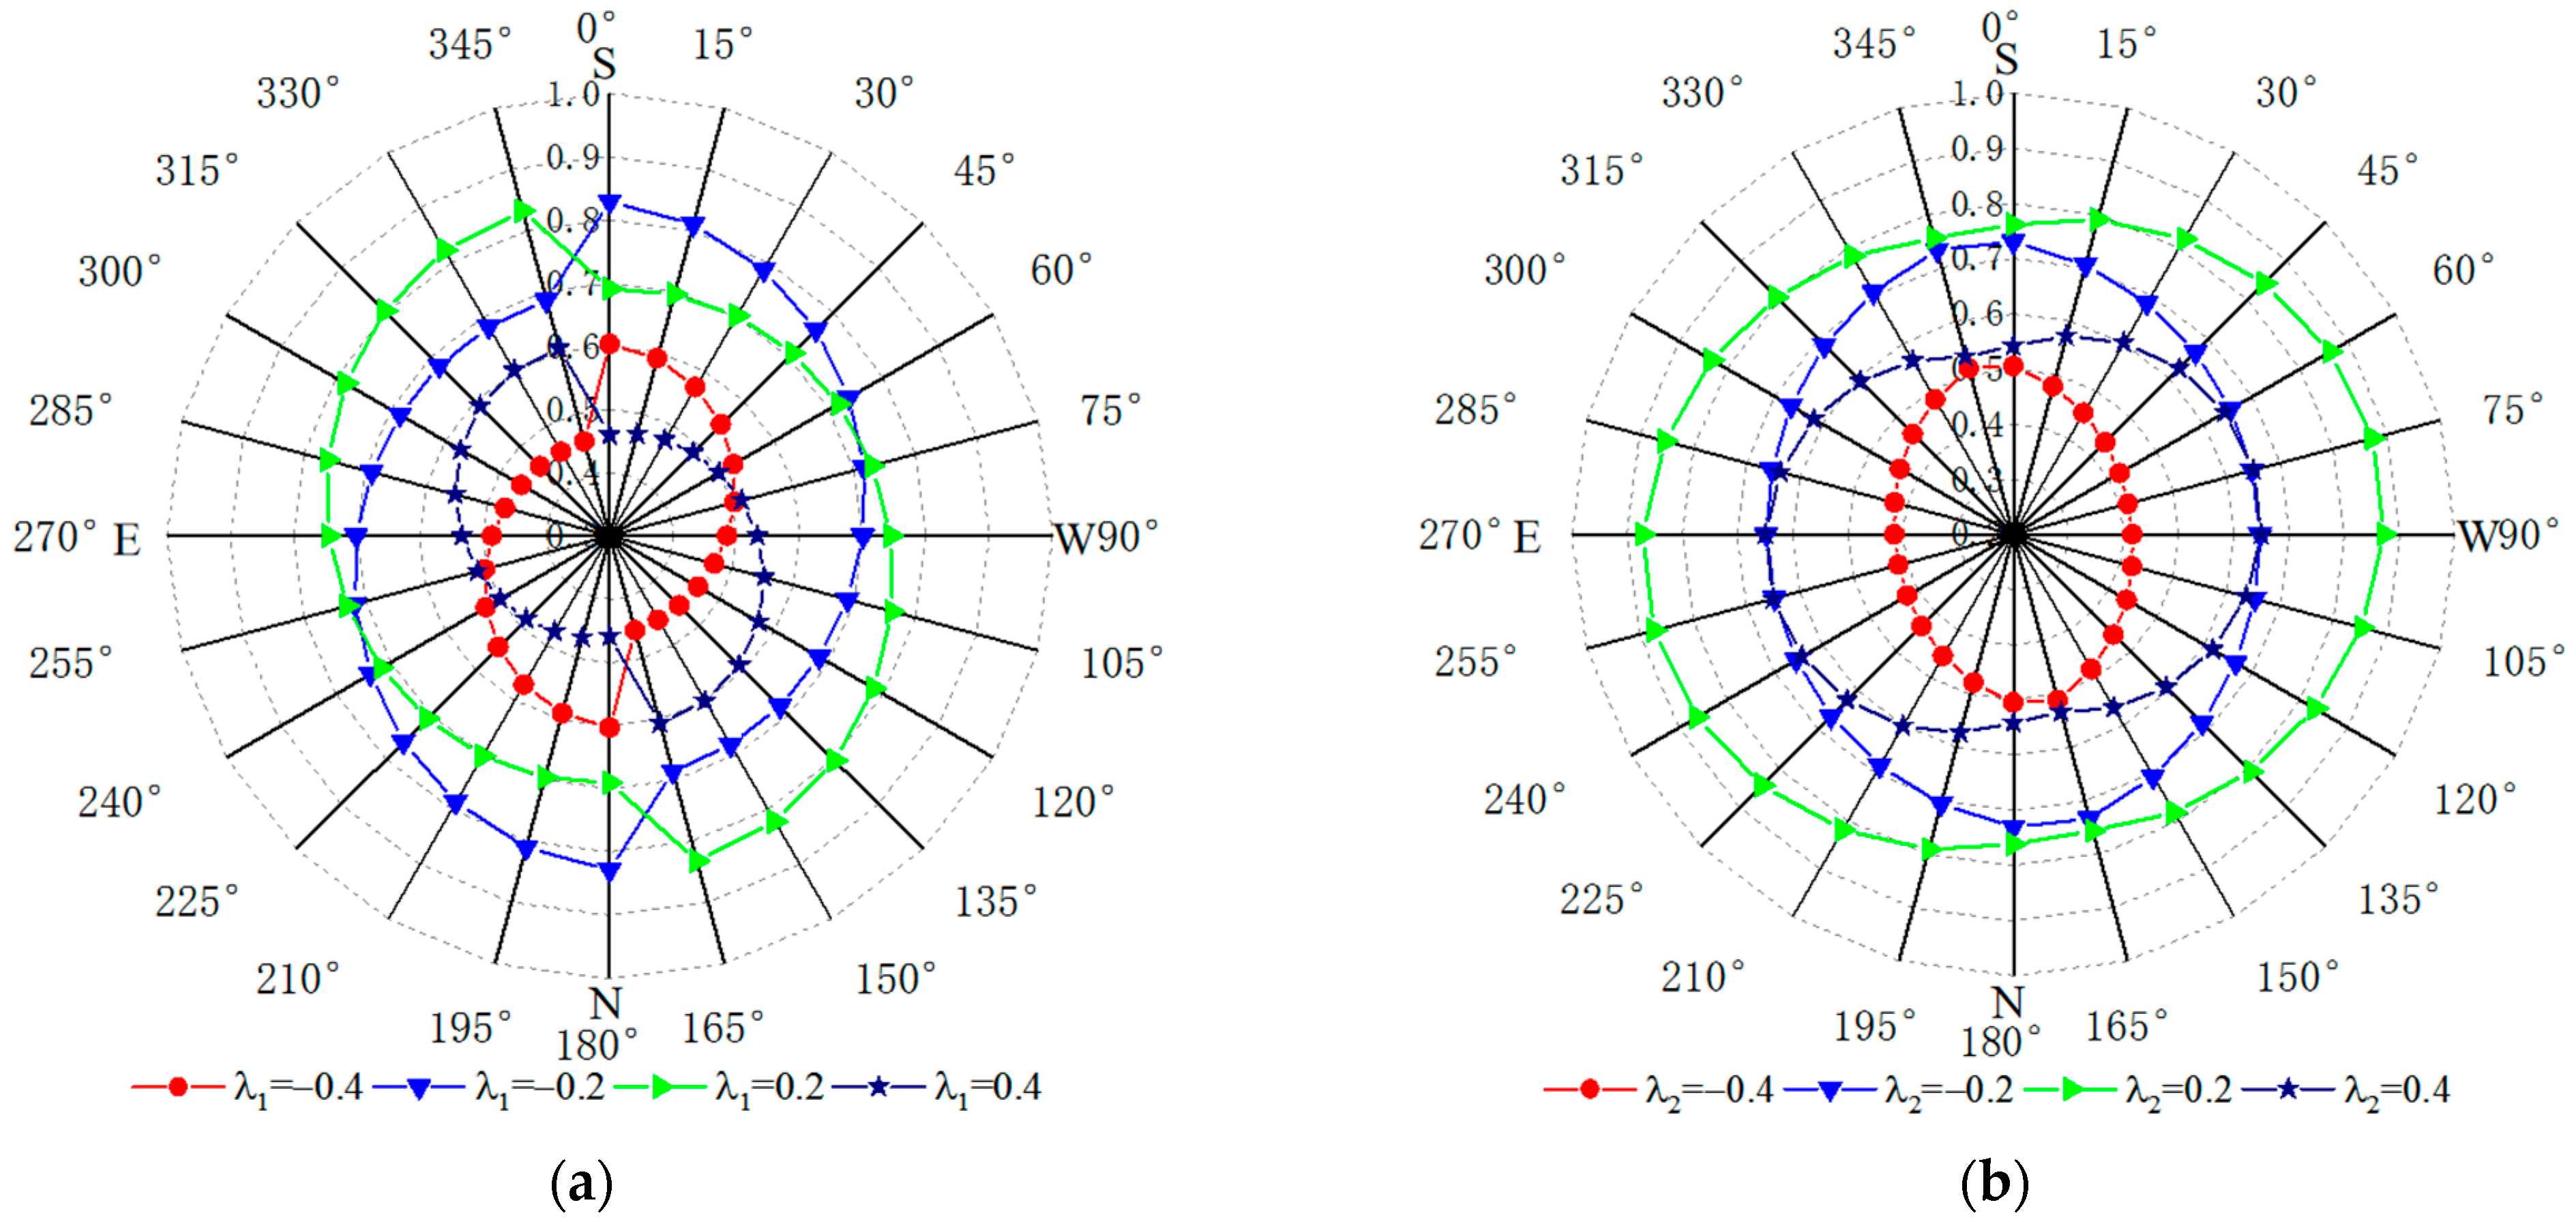
According to the results, different initial tracking position offsets have the same trend on the effective tracking factor of an SDC system, only with a numerical value difference. In order to display the data more clearly, this section only lists the variation rules of the initial tracking position offset of 0.2° and 0.4°. Figure 7 shows the variation of the effective tracking factor of an SDC system with different initial tracking positions under the azimuth axis tilt error. It can be clearly seen that whether the initial tracking position varies in the horizontal plane or the vertical plane, the larger the deviation angle of the initial tracking position (i.e., the larger γ1 or γ2), the worse the tracking performance of the SDC system. Regarding the symmetric initial tracking position offset angle in the due east direction (i.e., γ1 = 0.2° and γ1 = −0.2°), the tracking performance change trends are exactly opposite. From Figure 7a, it can be seen that when γ1 > 0°, the azimuth axis tilt error has the least influence on the tracking performance at the azimuth axis tangential angle ϕ1 = 345° (i.e., 15° south by east) or ϕ1 = 165° (i.e., 15° north by west). In the azimuth axis tangential angle ϕ1 = 0° (due south) or ϕ1 = 180° (due north), the azimuth axis tilt error has the most influence on tracking performance. Similarly, it can be seen in Figure 7b that when γ2 > 0°, the azimuth axis tilt error affects the tracking performance the least at the azimuth axis tangential angle ϕ1 = 75° (i.e., 75° south by west) or ϕ1 = 225° (i.e., 75° north by east). In the azimuth axis tangential angle ϕ1 = 345° (i.e., 15° south by east) or ϕ1 = 165° (i.e., 15° north by west), the azimuth axis tilt error affects the tracking performance the most.
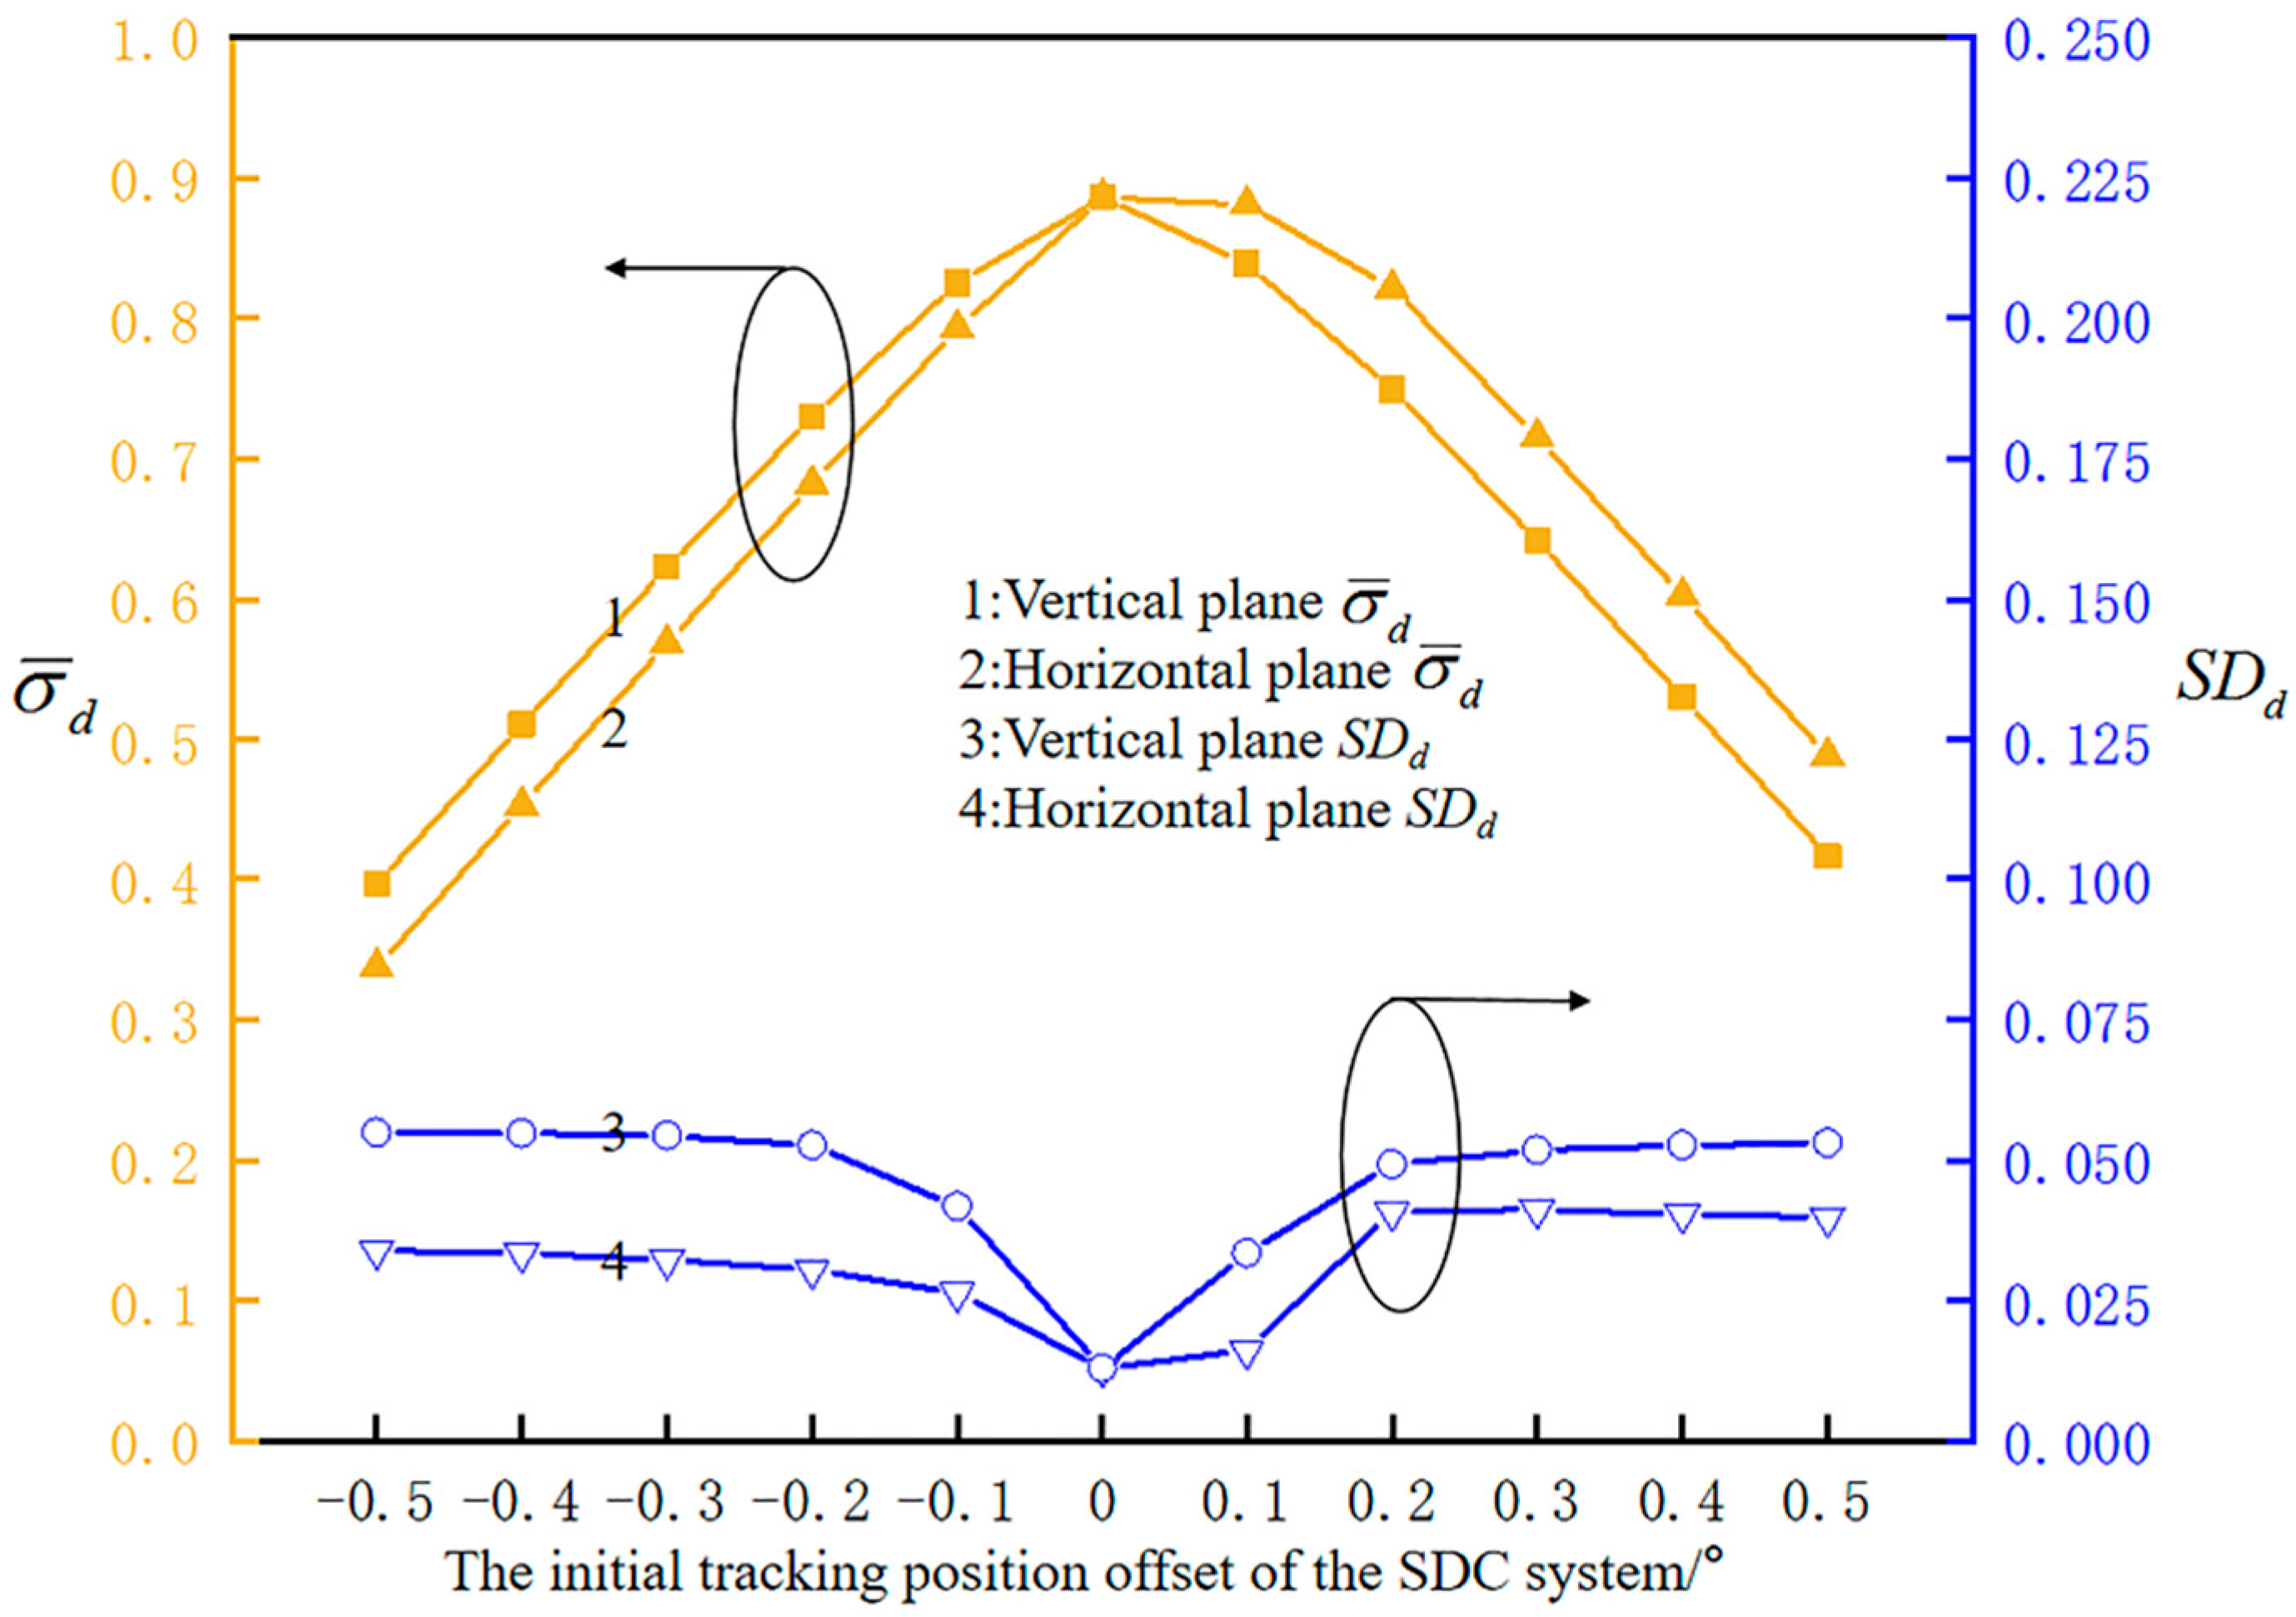
Figure 8 shows the variation of the daily average effective tracking factor σ ¯ d and SDd with the initial tracking position offset for an SDC system. When the initial tracking position offset is less than 0°, the average tracking performance of the initial position of the SDC system in the horizontal plane is better than that in the vertical plane. When the initial tracking position offset is greater than 0, the average tracking performance of the initial position of the SDC system in the vertical plane is better than that in the horizontal plane. At the same initial position offset, the tracking performance stability of the SDC system initial position in the horizontal plane is better than that in vertical plane. However, compared with the initial tracking position due east, the deviation of the initial tracking position of the SDC system in the horizontal or vertical plane will reduce its tracking performance and tracking performance stability.

4.3. Tracking Performance of an SDC System Running in Different Regions under Azimuth Axis Tilt Error

With the maturity of solar photo-thermal power generation technology, its application in various parts of the world is also increasing rapidly. An SDC system needs to track the sun’s position with high precision in order to ensure its power generation efficiency. However, the sun’s position (the azimuth and elevation angles) is different in different regions, and the tracking performance of SDC systems is also different. Therefore, it is necessary to study the influence law of the SDC system running in different regions on its performance. This section mainly analyzes the influence of an SDC system running in different regions (Dunhuang, Naqu, Delingha, Kunming, Baotou, and Haerbin) on its tracking performance on a typical day (the summer solstice). The latitudes and longitudes of different regions are shown in Table 2.
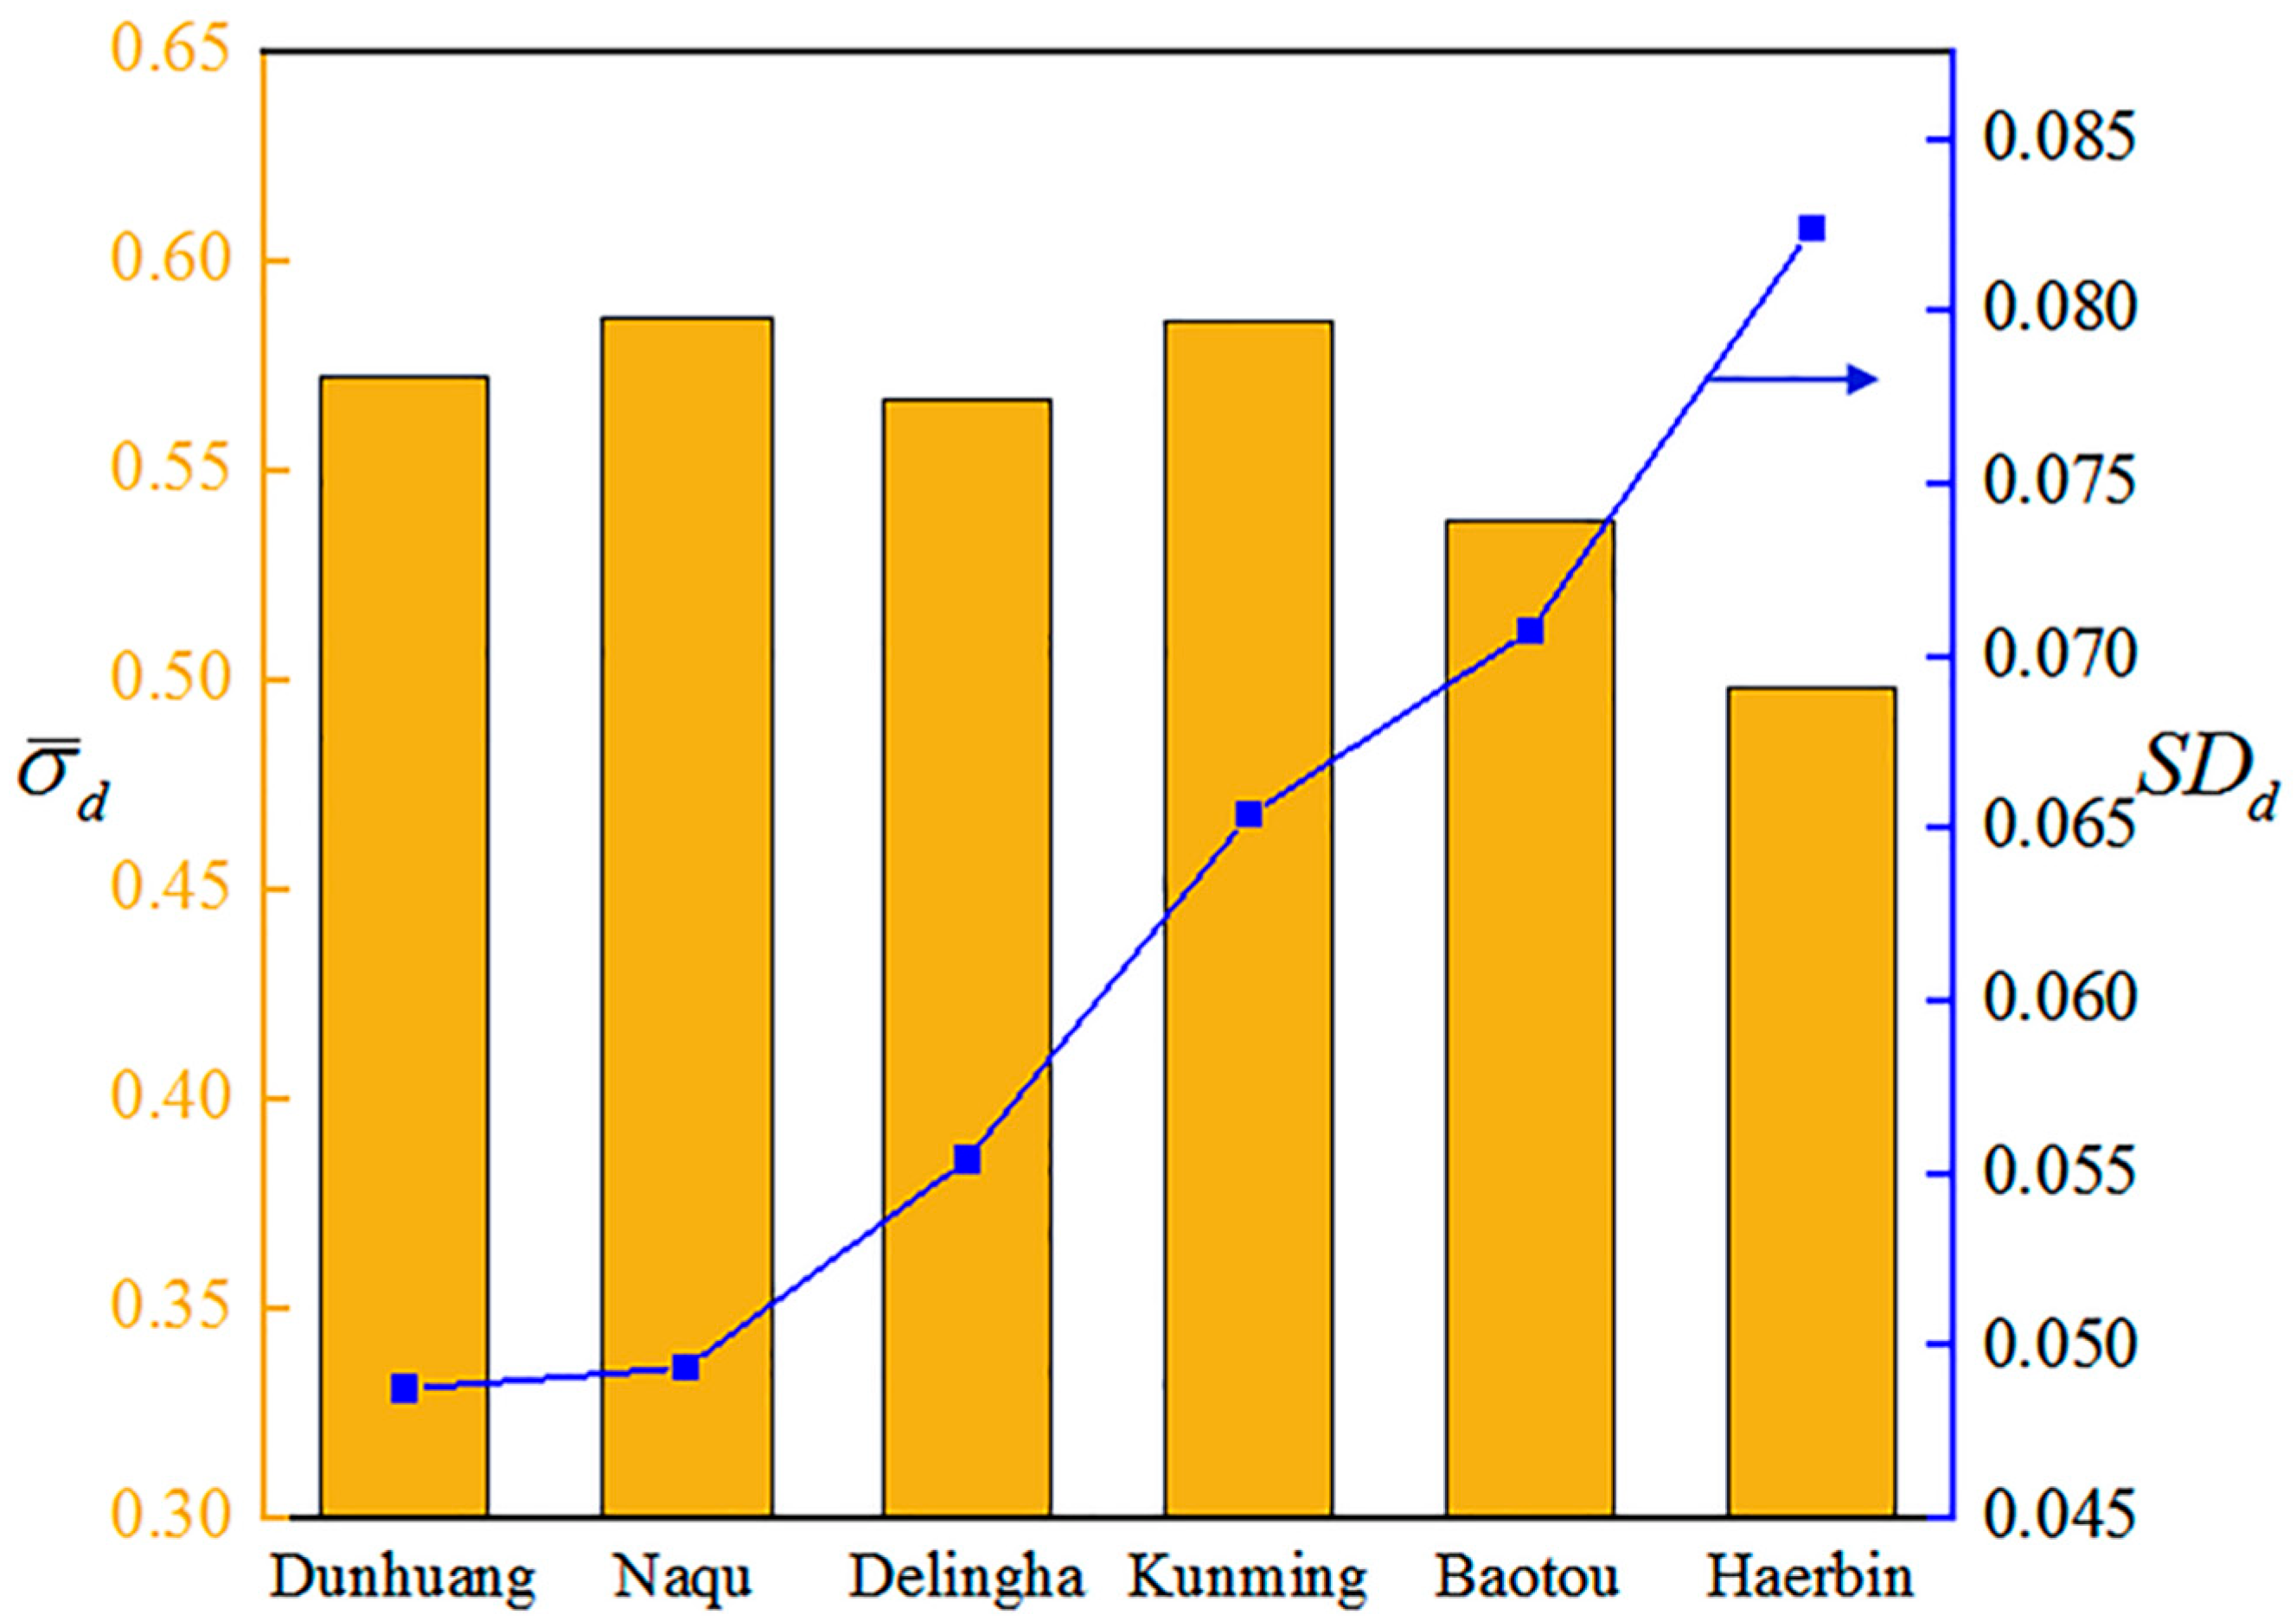
Figure 9 shows the variation of the effective tracking factor of an SDC system in different regions under the azimuth axis tilt error. Obviously, at different azimuth axis tangential angles, the effective tracking factors of the SDC systems in Baotou and Haerbin are relatively small, i.e., the tracking performance is relatively poor. The tracking performance is the worst when the azimuth axis tangential angle ϕ1 = 90° (due west) or ϕ1 = 270° (due east). The tracking performance is best when the azimuth axis tangential angle ϕ1 = 15° (i.e., 15° south by west). Figure 10 shows the daily average effective tracking factors σ ¯ d and SDd variations for different regions, and the specific data are shown in Table 2. It is obvious to see that the daily average effective tracking factors of Baotou and Haerbin are smaller and the SDd is larger, i.e., the tracking performance is relatively poor and the tracking performance stability is relatively low compared with other regions. From Table 2, we can find that the longitude of the Kunming region is not the lowest compared with other regions, but it has the lowest latitude. The tracking performance and tracking performance stability of an SDC system in Kunming’s operations are better than that of Baotou and Haerbin. Compared with Baotou, although the latitude of Dunhuang is closer, the longitude of Dunhuang is lower, and so the tracking performance and tracking performance stability of the SDC system in Dunhuang are better.
In summary, latitude is the main factor that determines the tracking performance and stability of an SDC system in different areas and longitude is the secondary factor. If a certain area can guarantee a low longitude and latitude, then the tracking performance and tracking performance stability of an SDC system in this area will be guaranteed. This has guiding significance for the site selection of large-scale dish power stations.

4.4. Tracking Performance of an SDC System in a Whole Year Operation Cycle under Azimuth Axis Tilt Error

This section focuses on the tracking performance variation law of an SDC system in a typical region (Dunhuang) during a whole year operation cycle under the azimuth axis tilt error. Figure 11 shows the annual average effective tracking factor σ ¯ y and SDy variation of an SDC system with different azimuth axis tilt errors. From Figure 11a, it can be seen that the annual average effective tracking factor of the SDC system achieves the maximum value when the azimuth axis tangential angle ϕ1 = 0° (due south) or ϕ1 = 180° (due north), i.e., the tracking performance is optimal. When the azimuth axis tangential angle ϕ1 = 75° (i.e., 75° south by west), the annual average effective tracking factor achieves the minimum value, i.e., the worst tracking performance. It can be seen from Figure 11b that when the azimuth axis tangential angle ϕ1 = 0° (due south), 90° (due west), 180° (due north), or 270° (due east), the SDy value is relatively small, i.e., the tracking performance stability is relatively better.
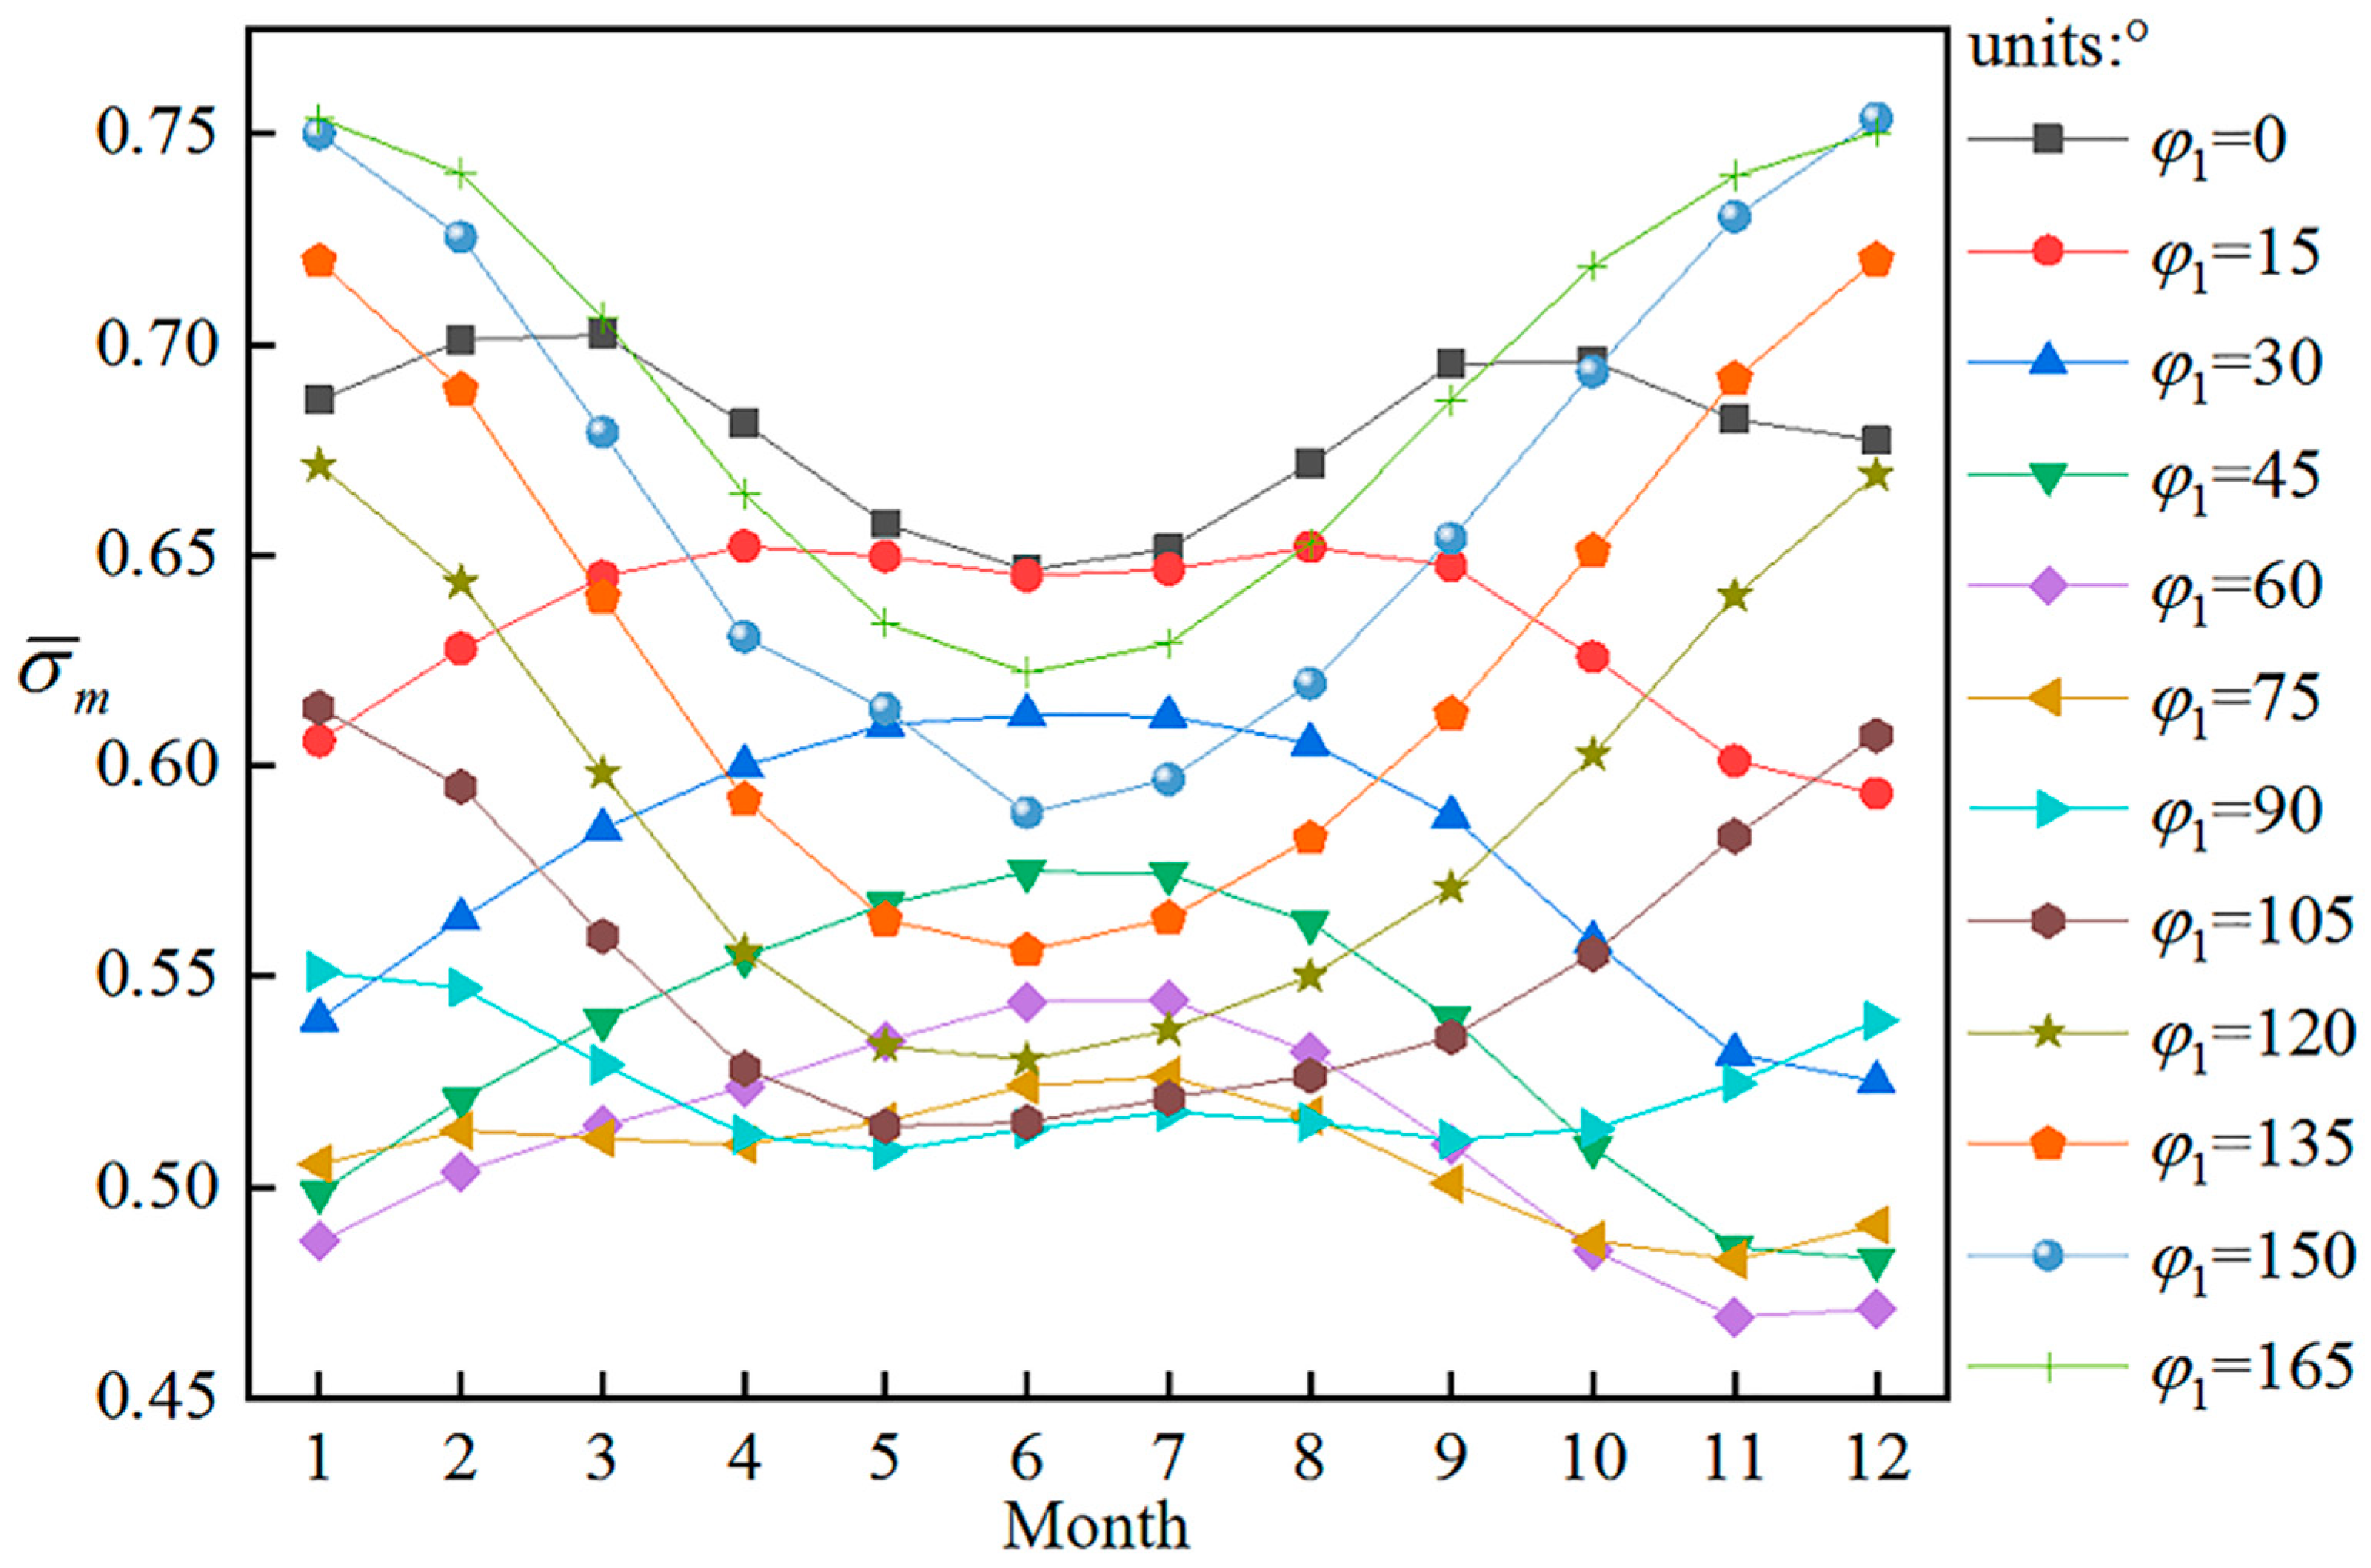
Since the tangential angle of azimuth axis is symmetrical about the origin, its tracking error is the same. Therefore, only some of the data are listed. Figure 12 shows the variation of the monthly average effective tracking factor σ ¯ m of an SDC system for different azimuth axis tilt errors. It can be seen that when the azimuth axis tangential angle ϕ1 = (0°, 90°), the monthly average effective tracking factor first increases and then decreases, i.e., the tracking performance first increases and then decreases. When the azimuth axis tangential angle ϕ1 = (90°, 180°), the monthly average effective tracking factor first decreases and then increases, i.e., the tracking performance first decreases and then increases. When the azimuth axis tangential angle ϕ1 = 0° (due south) or 90°, this is the turning point of the effective tracking factor variation rule of an SDC system. In particular, when the azimuth axis tangential angle ϕ1 = 0°, the monthly average effective tracking factor varies in a “wavy” pattern.
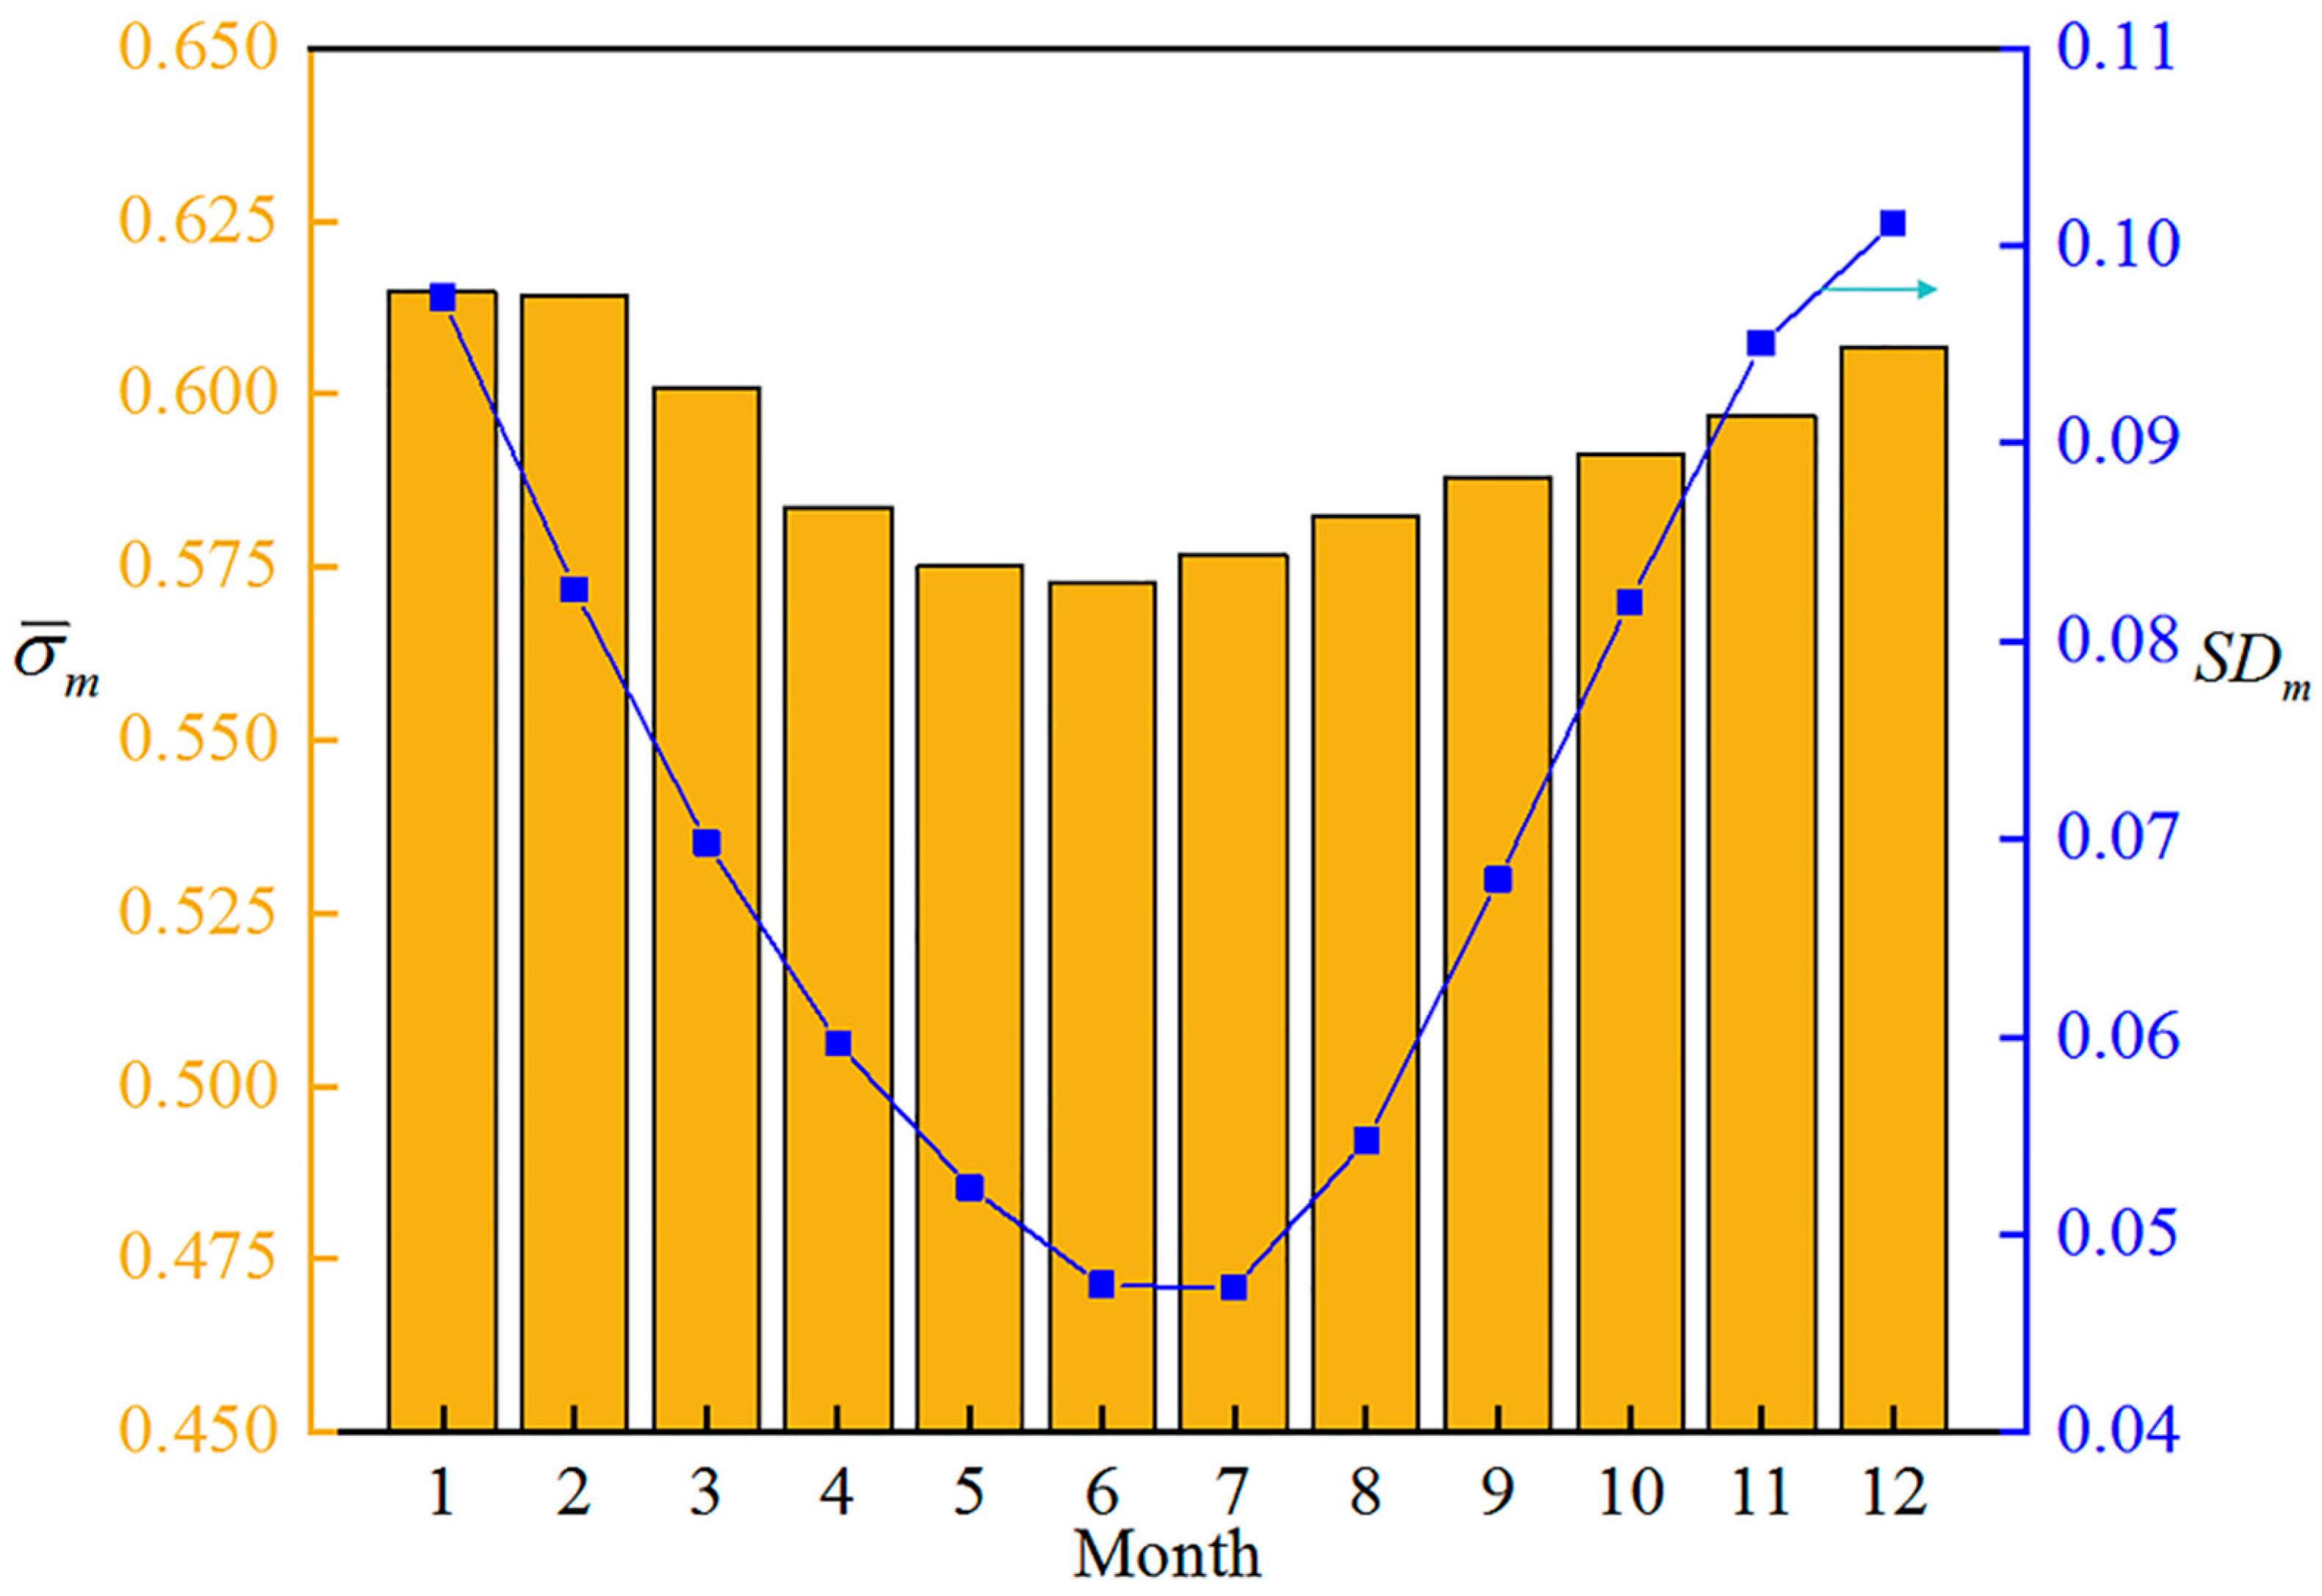
Figure 13 shows the variation of the monthly average effective tracking factor σ ¯ m and SDm of an SDC system. It can be seen that the monthly average effective tracking factor and SDm of the SDC system gradually decrease from January to June, and gradually increase from July to December, i.e., in June and July, the tracking performance of the SDC system is worse, but the tracking performance is more stable. We have counted the extreme values of effective tracking factors and corresponding dates of the SDC system at different azimuth axis tangential angles when the azimuth axis radial angle is 0.1° in the whole year operation cycle, as shown in Table 3. Obviously, when the azimuth axis tangential angle is ϕ1 = 0° (due south), the minimum effective tracking factor of SDC system is larger than the maximum effective tracking factors with its tangential angles of 30°, 45°, 60°, 75°, 90°, and 105°.
Based on the above analysis, the tracking performance and tracking performance stability of an SDC system are better when ϕ1 = 0° (due south) compared with other azimuth axis tangential angles in a whole year operation cycle. If the tilt error of azimuth axis can be determined in a practical engineering application, then we can get a more specific situation of the tracking performance of the SDC system. For example, during a whole year’s operation cycle, on which day is the tracking performance of SDC system the worst? Therefore, we only need to ensure that the day with the worst tracking performance meets the set requirements, and then the SDC system can maintain a good tracking performance in the whole year’s operation cycle. Moreover, we only need to calculate the tracking error of a certain day (the worst performance) to predict whether the SDC system will meet the performance requirements in the whole year. This can reduce the calculation amount of the tracking performance evaluation of the SDC system in the whole year operation cycle. A higher tracking accuracy of a tracking system inevitably leads to a higher cost [30]. We only need to perform error correction on the day of the worst tracking performance to ensure the tracking performance of the SDC system. This has significance in reducing the cost of dish solar thermal power generation.

5. Conclusions

In this paper, based on the theory of rigid body motion, the tracking error model of an SDC system considering the tilt error of azimuth axis is established. The influence of radial angle and tangential angle of azimuth axis on the tracking performance of an SDC system is studied in detail. Under the influence of azimuth axis tilt error, the variation law of tracking performance of an SDC system in initial tracking position, operation area, and the whole year operation period are analyzed. The main conclusions are as follows:
(1) Under the influence of azimuth axis tilt error, the deviation of the initial tracking position of an SDC system in the horizontal or vertical plane will reduce its tracking performance and tracking performance stability compared with the initial tracking position being due east. Therefore, controlling the initial tracking position of an SDC system is one of the factors to ensure its tracking performance.
(2) Latitude is the main factor that determines the tracking performance and tracking performance stability of an SDC system in different regions, and longitude is a secondary factor. Under the influence of azimuth axis tilt error, an SDC system’s tracking performance and its tracking performance stability are better in areas with a relatively lower latitude. The SDC system’s tracking performance and its stability are better in different regions close to latitude and with a lower longitude. This has guiding significance for the site selection of large-scale dish power stations.
(3) During a whole year operation period, when the azimuth axis tangential angle ϕ1 = 0° (due south), the tracking performance and tracking performance stability of an SDC system can be guaranteed at the same time. The tracking performance of an SDC system in the first quarter and the fourth quarter is relatively better, and the tracking performance stability in June and July is relatively better.

Author Contributions

Conceptualization, Y.P.; methodology, Y.L.; software, J.Y.; validation, Y.L.; investigation, Y.L.; writing—original draft preparation, Y.L.; visualization, Y.L.; supervision, Y.P. and J.Y.; project administration, Y.P.; funding acquisition, Y.P. and J.Y. All authors have read and agreed to the published version of the manuscript.

Funding

This research was funded by Jian Yan grant number [No. 52105097] and the APC was funded by Youduo Peng.

Institutional Review Board Statement

Not applicable.

Informed Consent Statement

Not applicable.

Data Availability Statement

Data sharing not applicable.

Acknowledgments

This work is supported by the National Natural Science Foundation of People’s Republic of China (No. 52105097) and Hunan Province Natural Science Foundation of People’s Republic of China (No. 2020JJ5189).

Conflicts of Interest

The authors declare no conflict of interest.

Nomenclature

NaAzimuth axis initial unit vector
NeElevation axis initial unit vector
NfFocal axis initial unit vector
NsSun’s ray direction vector
eallTracking error of an SDC system (mrad)
Greek symbols
θ1Radial angle of azimuth axis (degree)
ϕ1Tangential angle of azimuth axis (degree)
γ1, γ2Offset angles of initial tracking position (degree)
αsun’s azimuth angle (degree)
βsun’s elevation angle (degree)
σEffective tracking factor of SDC system
Abbreviations
DATDDouble-axis tracking device
ETFEffective tracking factor
SDCSolar dish concentrator
SDStandard deviation
SDSPSolar dish Stirling thermal power
SPASolar position algorithm

References

  1. Gauché, P.; Rudman, J.; Mabaso, M.; Landman, W.A.; von Backström, T.W.; Brent, A.C. System value and progress of CSP. Sol. Energy 2017, 152, 106–139. [Google Scholar]
  2. Merchán, R.P.; Santos, M.J.; Medina, A.; Hernández, A.C. High temperature central tower plants for concentrated solar power: 2021 overview. Renew. Sustain. Energy Rev. 2021, 155, 111828. [Google Scholar] [CrossRef]
  3. Singh, U.R.; Kumar, A. Review on solar Stirling engine: Development and performance. Therm. Sci. Eng. Prog. 2018, 8, 244–256. [Google Scholar]
  4. Bataineh, K.M. Optimization analysis of solar-powered average temperature Stirling heat engine. J. Energy South. Afr. 2015, 26, 55–66. [Google Scholar]
  5. Sandia. News Releases: Stirling Energy Systems Set New World Record for Solar-to-Grid Conversion Efficiency. 2008. Available online: https://share.sandia.gov/news/resources/releases/2008/solargrid.html (accessed on 13 February 2008).
  6. Zayed, M.E.; Zhao, J.; Elsheikh, A.H.; Li, W.; Sadek, S.; Aboelmaaref, M.M. A comprehensive review on Dish/Stirling concentrated solar power systems: Design, optical and geometrical analyses, thermal performance assessment, and applications. J. Clean. Prod. 2021, 283, 124664. [Google Scholar] [CrossRef]
  7. Yan, J.; Peng, Y.D.; Cheng, Z.R.; Liu, F.M.; Tang, X.H. Design and implementation of a 38 kW dish-Stirling concentrated solar power system [C]//IOP conference series: Earth and environmental science. IOP Publ. 2017, 93, 012052. [Google Scholar]
  8. Coventry, J.; Andraka, C. Dish systems for CSP. Sol. Energy 2017, 152, 140–170. [Google Scholar] [CrossRef]
  9. Yan, J.; Cheng, Z.; Peng, Y. Effects of geometrical parameters of a dish concentrator on the optical performance of a cavity receiver in a solar dish-Stirling system. Int. J. Energy Res. 2018, 42, 2152–2168. [Google Scholar]
  10. Castellanos, L.S.; Caballero, G.E.; Cobas, V.R.; Lora, E.E.; Reyes, A.M. Mathematical modeling of the geometrical sizing and thermal performance of a Dish/Stirling system for power generation. Renew. Energy 2017, 107, 23–35. [Google Scholar]
  11. Li, X.L.; Xia, X.L.; Li, Z.H.; Chen, X. Effects of double windows on optical and thermal performance of solar receivers under concentrated irradiation. Sol. Energy 2019, 184, 331–344. [Google Scholar]
  12. Yang, B.; Liu, S.; Zhang, R.; Yu, X. Influence of reflector installation errors on optical-thermal performance of parabolic trough collectors based on a MCRT-FVM coupled model. Renew. Energy 2022, 185, 1006–1017. [Google Scholar] [CrossRef]
  13. Yan, J.; Cheng, Z.; Peng, Y. Effect of tracking error of double-axis tracking device on the optical performance of solar dish concentrator. Int. J. Photoenergy 2018, 2018, 9046127. [Google Scholar] [CrossRef] [Green Version]
  14. Badescu, V. Different tracking error distributions and their effects on the long-term performances of parabolic dish solar power systems. Int. J. Sol. Energy 1994, 14, 203–216. [Google Scholar] [CrossRef]
  15. Badescu, V. Theoretical derivation of heliostat tracking errors distribution. Sol. Energy 2008, 82, 1192–1197. [Google Scholar] [CrossRef]
  16. Guo, M.; Wang, Z.; Zhang, J.; Sun, F.; Zhang, X. Accurate altitude–azimuth tracking angle formulas for a heliostat with mirror–pivot offset and other fixed geometrical errors. Sol. Energy 2011, 85, 1091–1100. [Google Scholar] [CrossRef]
  17. Guo, M.; Wang, Z.; Zhang, J.; Sun, F.; Zhang, X. Determination of the angular parameters in the general altitude–azimuth tracking angle formulas for a heliostat with a mirror-pivot offset based on experimental tracking data. Sol. Energy 2012, 86, 941–950. [Google Scholar] [CrossRef]
  18. Ukita, N.; Ezawa, H.; Ikenoue, B.; Saito, M. Thermal and wind effects on the azimuth axis tilt of the ASTE 10-m antenna. Publ. Natl. Astron. Obs. Japan 2007, 10, 25–33. [Google Scholar]
  19. Huang, B.; Li, Z.H.; Tian, X.Z.; Yang, L.; Zhang, P.J.; Chen, B. Modeling and correction of pointing error of space-borne optical imager. Optik 2021, 247, 167998. [Google Scholar] [CrossRef]
  20. Geng-Jun, M.; Bin-Bin, X.; Na, W.A.; Zhao-Jun, W. Correction method of antenna pointing error caused by the main reflector deformation. Chin. Astron. Astrophys. 2021, 45, 236–251. [Google Scholar] [CrossRef]
  21. Wang, H.; Huang, J.; Song, M.; Hu, Y.; Wang, Y.; Lu, Z. Simulation and experimental study on the optical performance of a fixed-focus fresnel lens solar concentrator using polar-axis tracking. Energies 2018, 11, 887. [Google Scholar] [CrossRef] [Green Version]
  22. Pavlovic, S.; Daabo, A.M.; Bellos, E.; Stefanovic, V.; Mahmoud, S.; alDadah, R.K. Experimental and numerical investigation on the optical and thermal performance of solar parabolic dish and corrugated spiral cavity receiver. J. Clean Prod. 2017, 150, 75–92. [Google Scholar] [CrossRef] [Green Version]
  23. Yan, J.; Peng, Y.D.; Wang, H. Assessing the impact of non-ideal optical factors on optimized solar dish collector system with mirror rearrangement. Int. J. Energy Res. 2020, 44, 8799–8822. [Google Scholar] [CrossRef]
  24. Sun, F.; Guo, M.; Wang, Z.; Liang, W.; Xu, Z.; Yang, Y.; Yu, Q. Study on the heliostat tracking correction strategies based on an error-correction model. Sol. Energy 2015, 111, 252–263. [Google Scholar] [CrossRef]
  25. Flores-Hernández, D.A.; Luviano-Juárez, A.; Lozada-Castillo, N.; Gutiérrez-Frías, O.; Domínguez, C.; Antón, I. Optimal strategy for the improvement of the overall performance of dual-axis solar tracking systems. Energies 2021, 14, 7795. [Google Scholar] [CrossRef]
  26. Huang, L.; Ma, W.; Huang, J. Modeling and calibration of pointing errors with alt-az telescope. New Astronom. 2016, 47, 105–110. [Google Scholar] [CrossRef]
  27. Funda, J.; Paul, R.P. A computational analysis of screw transformations in robotics. IEEE Trans. Robot. Autom. 1990, 6, 348–356. [Google Scholar] [CrossRef]
  28. Reda, I.; Andreas, A. Solar position algorithm for solar radiation applications. Sol. Energy 2004, 76, 577–589. [Google Scholar] [CrossRef]
  29. Liu, Y.; Yan, J.; Peng, Y.; Tian, Y. Effect of the shafting nonorthogonal error on the tracking performance of solar dish concentrator system. Int. J. Energy Res. 2021, 45, 18182–18193. [Google Scholar] [CrossRef]
  30. García-Ferrero, J.; Heras, I.; Santos, M.J.; Merchán, R.P.; Medina, A.; González, A.; Calvo Hernández, A. Thermodynamic and Cost Analysis of a Solar Dish Power Plant in Spain Hybridized with a Micro-Gas Turbine. Energies 2020, 13, 5178. [Google Scholar] [CrossRef]
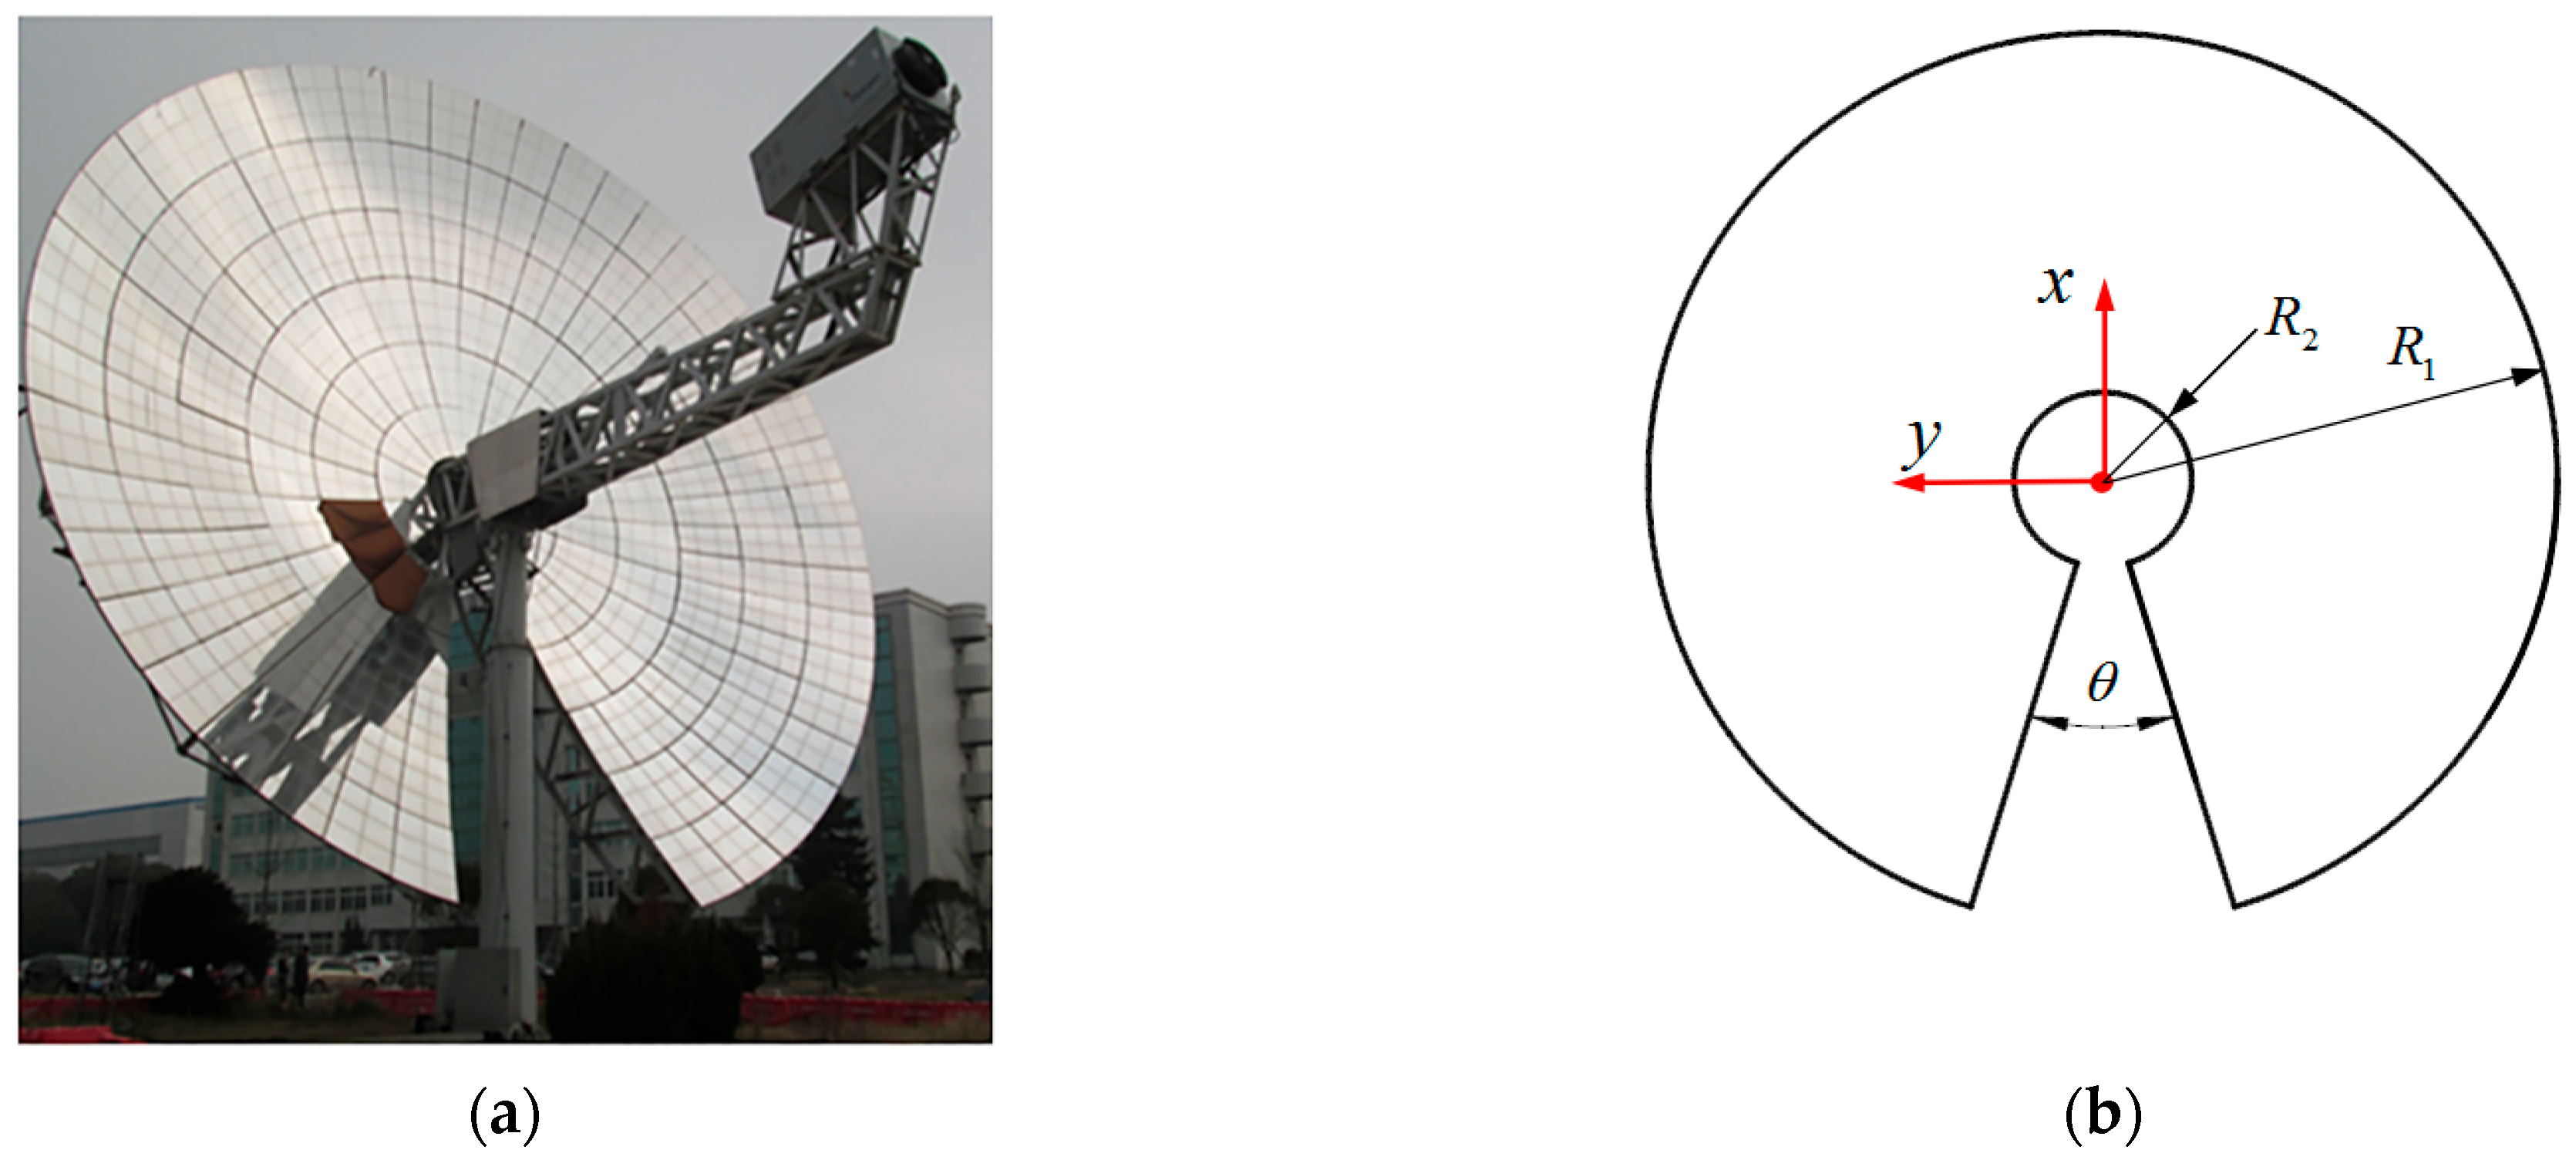
Figure 1. The 38 kW solar dish Stirling thermal power (SDSP) generation system developed by the authors [7]. (a) The physical diagram of the SDC system. (b) The geometric parameters of the concentrator [9].
Energies 15 03261 g001
Figure 2. Schematic diagram of the azimuth axis tilt error.
Energies 15 03261 g002
Figure 3. Geometric diagram of the effective tracking factor of an SDC system [29].
Energies 15 03261 g003
Figure 4. Variation of solar position on the summer solstice in different regions: (a) azimuth angle; and (b) elevation angle.
Energies 15 03261 g004
Figure 5. Variation of the effective tracking factor σ of an SDC system with the radial and tangential angles of azimuth axis.
Energies 15 03261 g005
Figure 6. Schematic diagram of initial tracking position of an SDC system.
Energies 15 03261 g006
Figure 7. Variation of the effective tracking factor σ of an SDC system with different initial tracking positions under the azimuth axis tilt error. (a) The initial tracking position varies in the horizontal plane (γ2 = 0°). (b) The initial tracking position varies in the vertical plane (γ1 = 0°).
Energies 15 03261 g007
Figure 8. Variation of the daily average effective tracking factor σ ¯ d and SDd of an SDC system with initial tracking position offset.
Energies 15 03261 g008
Figure 9. Variation of the effective tracking factor σ of an SDC system in different areas under an azimuth axis tilt error.
Energies 15 03261 g009
Figure 10. Variation of the daily average effective tracking factor σ ¯ d and SDd of an SDC system in different regions.
Energies 15 03261 g010
Figure 11. Variation of the annual average effective tracking factor σ ¯ y and SDy of an SDC system under different azimuth axis tilt errors: (a) annual average effective tracking factor σ ¯ y ; and (b) SDy.
Energies 15 03261 g011
Figure 12. Variation of the monthly average effective tracking factor σ ¯ m of an SDC system under different azimuth axis tilt errors.
Energies 15 03261 g012
Figure 13. Variation of the monthly average effective tracking factor σ ¯ m and SDm of an SDC system.
Energies 15 03261 g013
Table 1. Previous researchers’ related work (in part).
ResearchersResearch ObjectsMain Contribution
Wang et al. [21]Fresnel lens solar concentratorUses polar-axis tracking
Pavlovic et al. [22]Solar parabolic dish and cavity receiverProposes a low-cost solar collector
Yan et al. [23]An optimized solar dish collectorThe non-ideal optical factors considered are relatively comprehensive
Sun et al. [24]HeliostatProposes a tracking error correction model to improve the tracking accuracy
Flores-Hernández et al. [25]Dual-axis tracking systems Proposes a novel methodology for optimizing the overall performance
Huang et al. [26]Large telescopesEstablishes a new model of a telescope pointing error
Table 2. Latitude and longitude and the daily average effective tracking factor σ ¯ d and SDd of SDC systems in different regions.
Regions
DunhuangNaquDelinghaKunmingBaotouHaerbin
Latitude40.13° N31.29° N37.22° N25° N40.32° N45.42° N
Longitude94.67° E92.04° E97.23° E102.39° E109.53° E125.15° E
σ ¯ d 0.572340.58680.567150.586120.537920.49776
SDd0.048740.049350.055390.065370.070720.08238
Table 3. Extreme values of effective tracking factors and corresponding dates for different tangential angles in a whole year operation cycle when the radial angle of azimuth axis is 0.1°.
Azimuth Axis Tangential Angle ϕ1
0153045607590105120135150165
Date
(month/day)
06/2112/1212/1012/0511/2711/0105/0106/0106/0106/1906/1606/19
σmin0.6460.5920.5240.4800.4670.4810.5070.5130.5290.5550.5880.621
Date
(month/day)
02/0508/0107/0107/0107/0107/0102/0101/0101/0101/0101/0101/01
σmax0.7050.6540.6130.5770.5450.5280.5530.6160.6780.7280.7610.757
Publisher’s Note: MDPI stays neutral with regard to jurisdictional claims in published maps and institutional affiliations.