Abstract
E-Vehicles are used for transportation and, with a vehicle-to-grid optimization approach, they may be used for supplying a backup source of energy for renewable energy sources. Renewable energy sources are integrated to maintain the demand of consumers, mitigate the active and reactive power losses, and maintain the voltage profile. Renewable energy sources are not supplied all day and, to meet the peak demand, extra electricity may be supplied through e-Vehicles. E-Vehicles with random integration may cause system unbalancing problems and need a solution. The objective of this paper is to integrate e-Vehicles with the grid as a backup source of energy through the grid-to-vehicle optimization approach by reducing active and reactive power losses and maintaining voltage profile. In this paper, three case studies are discussed: (i) integration of renewable energy sources alone; (ii) integration of e-Vehicles alone; (iii) integration of renewable energy sources and e-Vehicles in hybrid mode. The simulation results show the effectiveness of the integration and the active and reactive power losses are minimum when we used the third case.
1. Introduction
Energy demand at the consumer end is rapidly increasing and needs the attention of distribution network operators to maintain the demand with fewer losses by maintaining the voltage profile. Energy is generated by centralized installed power plants and supplied to consumers through large transmission and distribution networks. Approximately 35% of the electricity is lost as transmission and distribution losses throughout the process. It is also estimated that the electricity demand will rise to 900 GW by 2030 and meeting that demand with conventional energy sources may result in a 59% rise in environmental pollution [1]. A suitable solution is provided by renewable energy sources (RESs) installed near load centers to meet the demand of consumers; the suitable integration may reduce environmental pollution as well as transmission and distribution losses [2]. RESs are green energy generation sources installed at the consumer end. RESs consist of solar photovoltaic, wind turbines, microhydro, etc. [3]. RES integration with different kinds of connected sources, random energy consumption profiles, and high losses increase the complexity of the system. The integration of RES is essential with integrated approaches and the identification of objectives. To increase the reliability of the RES, backup sources of energy must be integrated [4]. As a backup source, battery stations or e-Vehicles may be considered. The prime objective of e-Vehicles is transportation, but the excess amount of energy may be supplied to the grid again if consumers receive better payoffs [5]. In this paper, we identify the approach to integrating RES and e-Vehicles into the grid using the fuzzy logic approach and genetic algorithm [6]. Incentive-based e-Vehicle integration may be the scope of future work. Following are the major contributions of this paper:
- Increase the penetration and dependency on renewable energy sources;
- Integrate RES to distribution grid at consumer end, reduce active and reactive power losses, and maintain voltage profile;
- E-Vehicles are used as backup source of energy and integrate with the grid at suitable locations with suitable size;
- Integrate RES and e-Vehicles in hybrid mode to maintain the voltage profile and to reduce active and reactive power losses using fuzzy logic approach and genetic algorithms.
1.1. Litterature Review
Electric energy generation decentralization is a significant step toward the adoption of RESs that can reduce reliance on fossil fuels [7]. In the past few years, the global growth rate of solar PV was 4% and wind power was 7%. In the last five years, the average energy generation for solar PV increased by 27% and the wind by 13% [8,9]. RESs are complex, small in capacity, unpredictable, and dependent on weather constraints. These characteristics create various challenges in the existing power systems [10,11] related to the reliability of the network, voltage profile balancing, and high active and reactive power losses. The impact of a RES on the system is examined by researchers with a better integration approach and hybrid models of backup energy sources. E-Vehicles and battery banks are the most used backup sources. They are connected to increase reliability and, in emergency and peak hours, they may supply to the grid. Battery banks are considered as backup sources by researchers to improve the reliability of the system; however, e-Vehicles have received the attention of very few researchers. The aim of the e-Vehicles is to integrate with the grid without focusing on electric constraints. The uncertainty model of distributed energy sources’ challenges and integration approaches are discussed in [12]. RES advantages for integration with reliability assessment are discussed in [13]. The internet framework for optimization of distributed energy resources is discussed in [14] for energy management. The problems of voltage sag and unbalanced grids are discussed and analyzed by [15]. These challenges are the problems of RES optimization and, in [6,15,16], the authors discussed different integration approaches for renewable energy sources using adaptive schemes, application and architecture development, and implementation with case studies from Western Australia. Proper allocation of RES is essential due to multiple advantages, i.e., minimizing real and reactive power losses, line loading, carbon emission, initial cost, tariff structuring, cost of energy generation, utility cost, and improving the voltage profile of the distribution network. Various RES integration methodologies, such as novel methods, power loss sensitivity methods, voltage indexing, voltage sensitivity analysis, and so on, are available in the literature and can be optimized using various tools, such as fuzzy logic controllers, genetic algorithms, practical swarm optimizations, neural networks, machine learning, and so on. In [17], the authors discuss the road map for the integration of RES into the grid; in [18], the authors discuss the limitations of RES integration into the grid. The authors of articles [19,20,21] discussed the integration of e-Vehicles into the grid using various optimization approaches. Vehicle-to-grid optimization is a useful identification for improving RES and integrated grid reliability.
1.2. Problem Formulation
Most of the research work in the literature takes place on the integration of distributed energy resources with complex problem-solving approaches. Now, the transportation industry is shifting towards e-Vehicles, which may play an important role in energy reliability as a backup source of energy. Identifying the optimal location and size of the e-Vehicle to integrate as an energy generation source to supply during peak hours is not considered in the literature. Energy supply during peak hours is higher and utility needs to supply the whole day. To manage the peak-hours energy consumption, an extra amount of energy available near load centers is needed and may be supplied by e-Vehicles available at the consumer end.
1.3. Objectives
- ▪
- Integration of RES and EVCS into an IEEE 33-node radial distribution system using Fuzzy Logic and Genetic Algorithm (FL-GA) to keep electrical constraints within permissible limits;
- ▪
- Manage the demand of consumers using RES near load centers to reduce the active and reactive power losses in the distribution network;
- ▪
- Integrate an e-Vehicle charging station using vehicle-to-grid integration to maintain the peak energy consumption.
1.4. Methodology
The major task is to integrate RES and e-Vehicles charging stations (EVCS) into the grid. IEEE 33-node radial distribution system was used for integration. The capacity identification of RES and EVCS are continuous problems. A fuzzy logic approach with a predefined set of rules was used. The fuzzy logic approach used active power losses, reactive power losses, and node voltages as input functions and these input functions were subdivided into three triangular membership functions to identify the capacity of RES and EVCS to integrate. The location identification of RES and EVCS is a classification problem with 33 suitable outcomes. The genetic algorithm was used for the identification of the location within the predefined constraints limit. In this paper, e-Vehicles are used as energy generation sources and integrated into distributed network operators. This approach may increase the stability of the system. Now, the e-Vehicles are integrated into the grid at consumer-flexible stations, mostly at consumer’s homes, and may increase the chances of excess energy in the grid at a certain time.
2. Problem Formulation
A large power system network needs proper monitoring for voltage profiles, active and reactive power losses, and current flow to manage the demand efficiently. Load flow analysis is generally utilized in the operation and planning of power systems. The essential network, load, and generation data are used to build the power flow model of a system. The load flow models include voltages at different nodes, network line flows, and system losses [22,23]. Solving nodal power balance equations yield these values. Despite the nonlinear nature of these equations, iterative approaches such as Newton–Raphson, Gauss–Seidel, and Fast Decoupling methods are commonly utilized to solve them. When compared to the transmission system, the load flow analysis for a radial distribution network with a high R/X ratio is distinct. For power flow usage, traditional load flow approaches are insufficient. The analysis is carried out using the usual backward–forward sweep approach [24].
- i.
- Backward Sweep
Backward sweep is also known as reverse breadth-first search because it starts from the farthest node and ends at the source node. The updated effective power flows in each branch are acquired in the backward propagation calculation by considering the node voltage of the previous loop. It implies that the voltage values acquired in the forward path are held consistent during the backward propagation and updated power flows of each node are sent in reverse along the feeder utilizing the backward path. This specifies that the backward propagation starts from the extremely end node and continues towards the source node.
Active power ( and reactive power ( at node and and , respectively, are the resistance and reactance connected between branch from node to node. is denoted as the voltage at node and can be calculated backward from the end node, given by (1) and (2).
where in (1) and (2),
where in (3) and (4), and respectively are the active and reactive loads connected at node. and are active and reactive power flowing through node.
Total active and reactive power losses of the network are calculated by (5) and (6), respectively.
- ii.
- Forward Sweep
The forward sweep method is also known as breadth-first search, it starts from the source node. It is primarily a voltage drop calculation, feasible for current or power flow updates. The aim is to determine the voltages at each node that starts from the source node (feeder node). The feeder substation voltage is set at its real values. Throughout the forward propagation, the effective power in each node is held steady to the values obtained in a backward way. Considering voltage at node with phase angle and at node with phase angle , the current flowing through the branch is calculated by (7).
From the apparent power equation, the current may also be calculated by (8).
s.t.
After equating Equations (7) and (8),
Separating the real and imaginary parts in (11),
From (12) and (13), the total voltage at node is calculated by (14).
- iii.
- Active and Reactive Power losses
Active and reactive power losses are calculated by comparing power calculated by the backward sweep method with voltage calculated in two successive iterations through the forward sweep method [25,26,27]. Specify a tolerance limit and, if the voltage difference is within the specified limit, the solution is provided; otherwise, active and reactive power losses are calculated in each branch by (15) and (16). Power losses of branch ‘ij’ can be analyzed as
The total active and reactive power losses of the radial distribution network are calculated by (17) and (18), respectively.
3. Objective Function
The primary goal of the integration of RES is to determine the proper position and capacity. In a radial network with a large number of nodes, the voltage profile is decreasing. Voltage indexing is a term used to describe voltage stability [28]. The distance from the source node to the point where the system becomes partially stable is defined by the voltage indexing. When the voltage is in an unstable range, the system experiences voltage collapse [29,30]. Mathematical calculations aid utilities by reducing the likelihood of voltage collapse or introducing an autoconnecting technique to turn off or on the RES to avoid it from collapsing. Voltage indexing is calculated by steady-state power flow analysis at each node of the distributed network by (19).
where is the voltage at node before installation of RES, is the voltage at node after integration of RES.
Minimize the active and reactive power losses of the radial distribution system by integration of RES. Active and reactive power objective functions are to minimize the losses, as shown in (20) and (21).
where in (20) and (21),is the objective function for active power; is the objective function for reactive power; and are, respectively, the weighting factor for total active and reactive power losses per unit; and is the weighting factor for voltage index, representing the importance of objectives. It is usually assumed in (22):
The weights are calculated by suitable approaches, RES capacity identification is a regression problem with a continuous data type and location is a classification problem with a categorical data type. To solve the problem, two different algorithms are needed. In this paper, the fuzzy logic approach is used to resolve the regression problem and the genetic algorithm to solve the classification problem.
4. Capacity Optimization Using Fuzzy Logic
Fuzzy logic is the fundamental idea driving the human dynamic interaction. It may be explained by the choice of tree technique and the rule-based programming ways. It checks each risk and chance of the results by assessing every one of its advantages and disadvantages. It is the base for creating artificial intelligence with rule-based interferences. The term fuzzy alludes to the things that do not seem to be satisfactory or are vague. In this paper, the fuzzy logic approach is used to identify the capacity to integrate RES and EVCS. EVCS is also a type of RES and is mathematically defined as the same function. The only change in the EVCS is consuming energy, except for peak hours. During peak hours, using a vehicle for grid integration, they supply energy as a backup energy source. For the fuzzy logic approach, three inputs and the output are the capacity of RES and EVCS. All input and output functions are triangular functions and are subdivided into three high, medium, and low membership functions.
5. Location Optimization Genetic Algorithm
The location of RES for minimum power losses in the Radial Distribution System is the classification problem. The suitable location to integrate is a binary class variable and the Genetic algorithm is simple and efficient for binary classification. It follows Darwin’s theory “Survival of the fittest”, which results in the choice of the best and expulsion of the rest [31]. The genetic and choice primarily based on genetic algorithm method is unvaried, which can continue to notice the fittest candidate solution of constant size. Using the genetic algorithm, a location is obtained where the active and reactive power losses are minimum and voltage profile is at a stable limit called voltage indexing and calculated by (23) and (24).
s.t.
When total capacity achieved by the fuzzy logic approach is less than total installed capacity in (25),
e-Vehicle charging stations are also used to integrate the vehicles to the grid and connect as backup devices; an e-Vehicle’s battery capacity is between 75–100 kWh and, at a particular time on a single station, five to six such charging stations are available. The location identification for EVCS considers it and only the nodes with less than 700 kVA generation are available. The mathematical formulation of the location of EVCS is calculated by (26).
6. Simulation Result
6.1. Simulation scenario
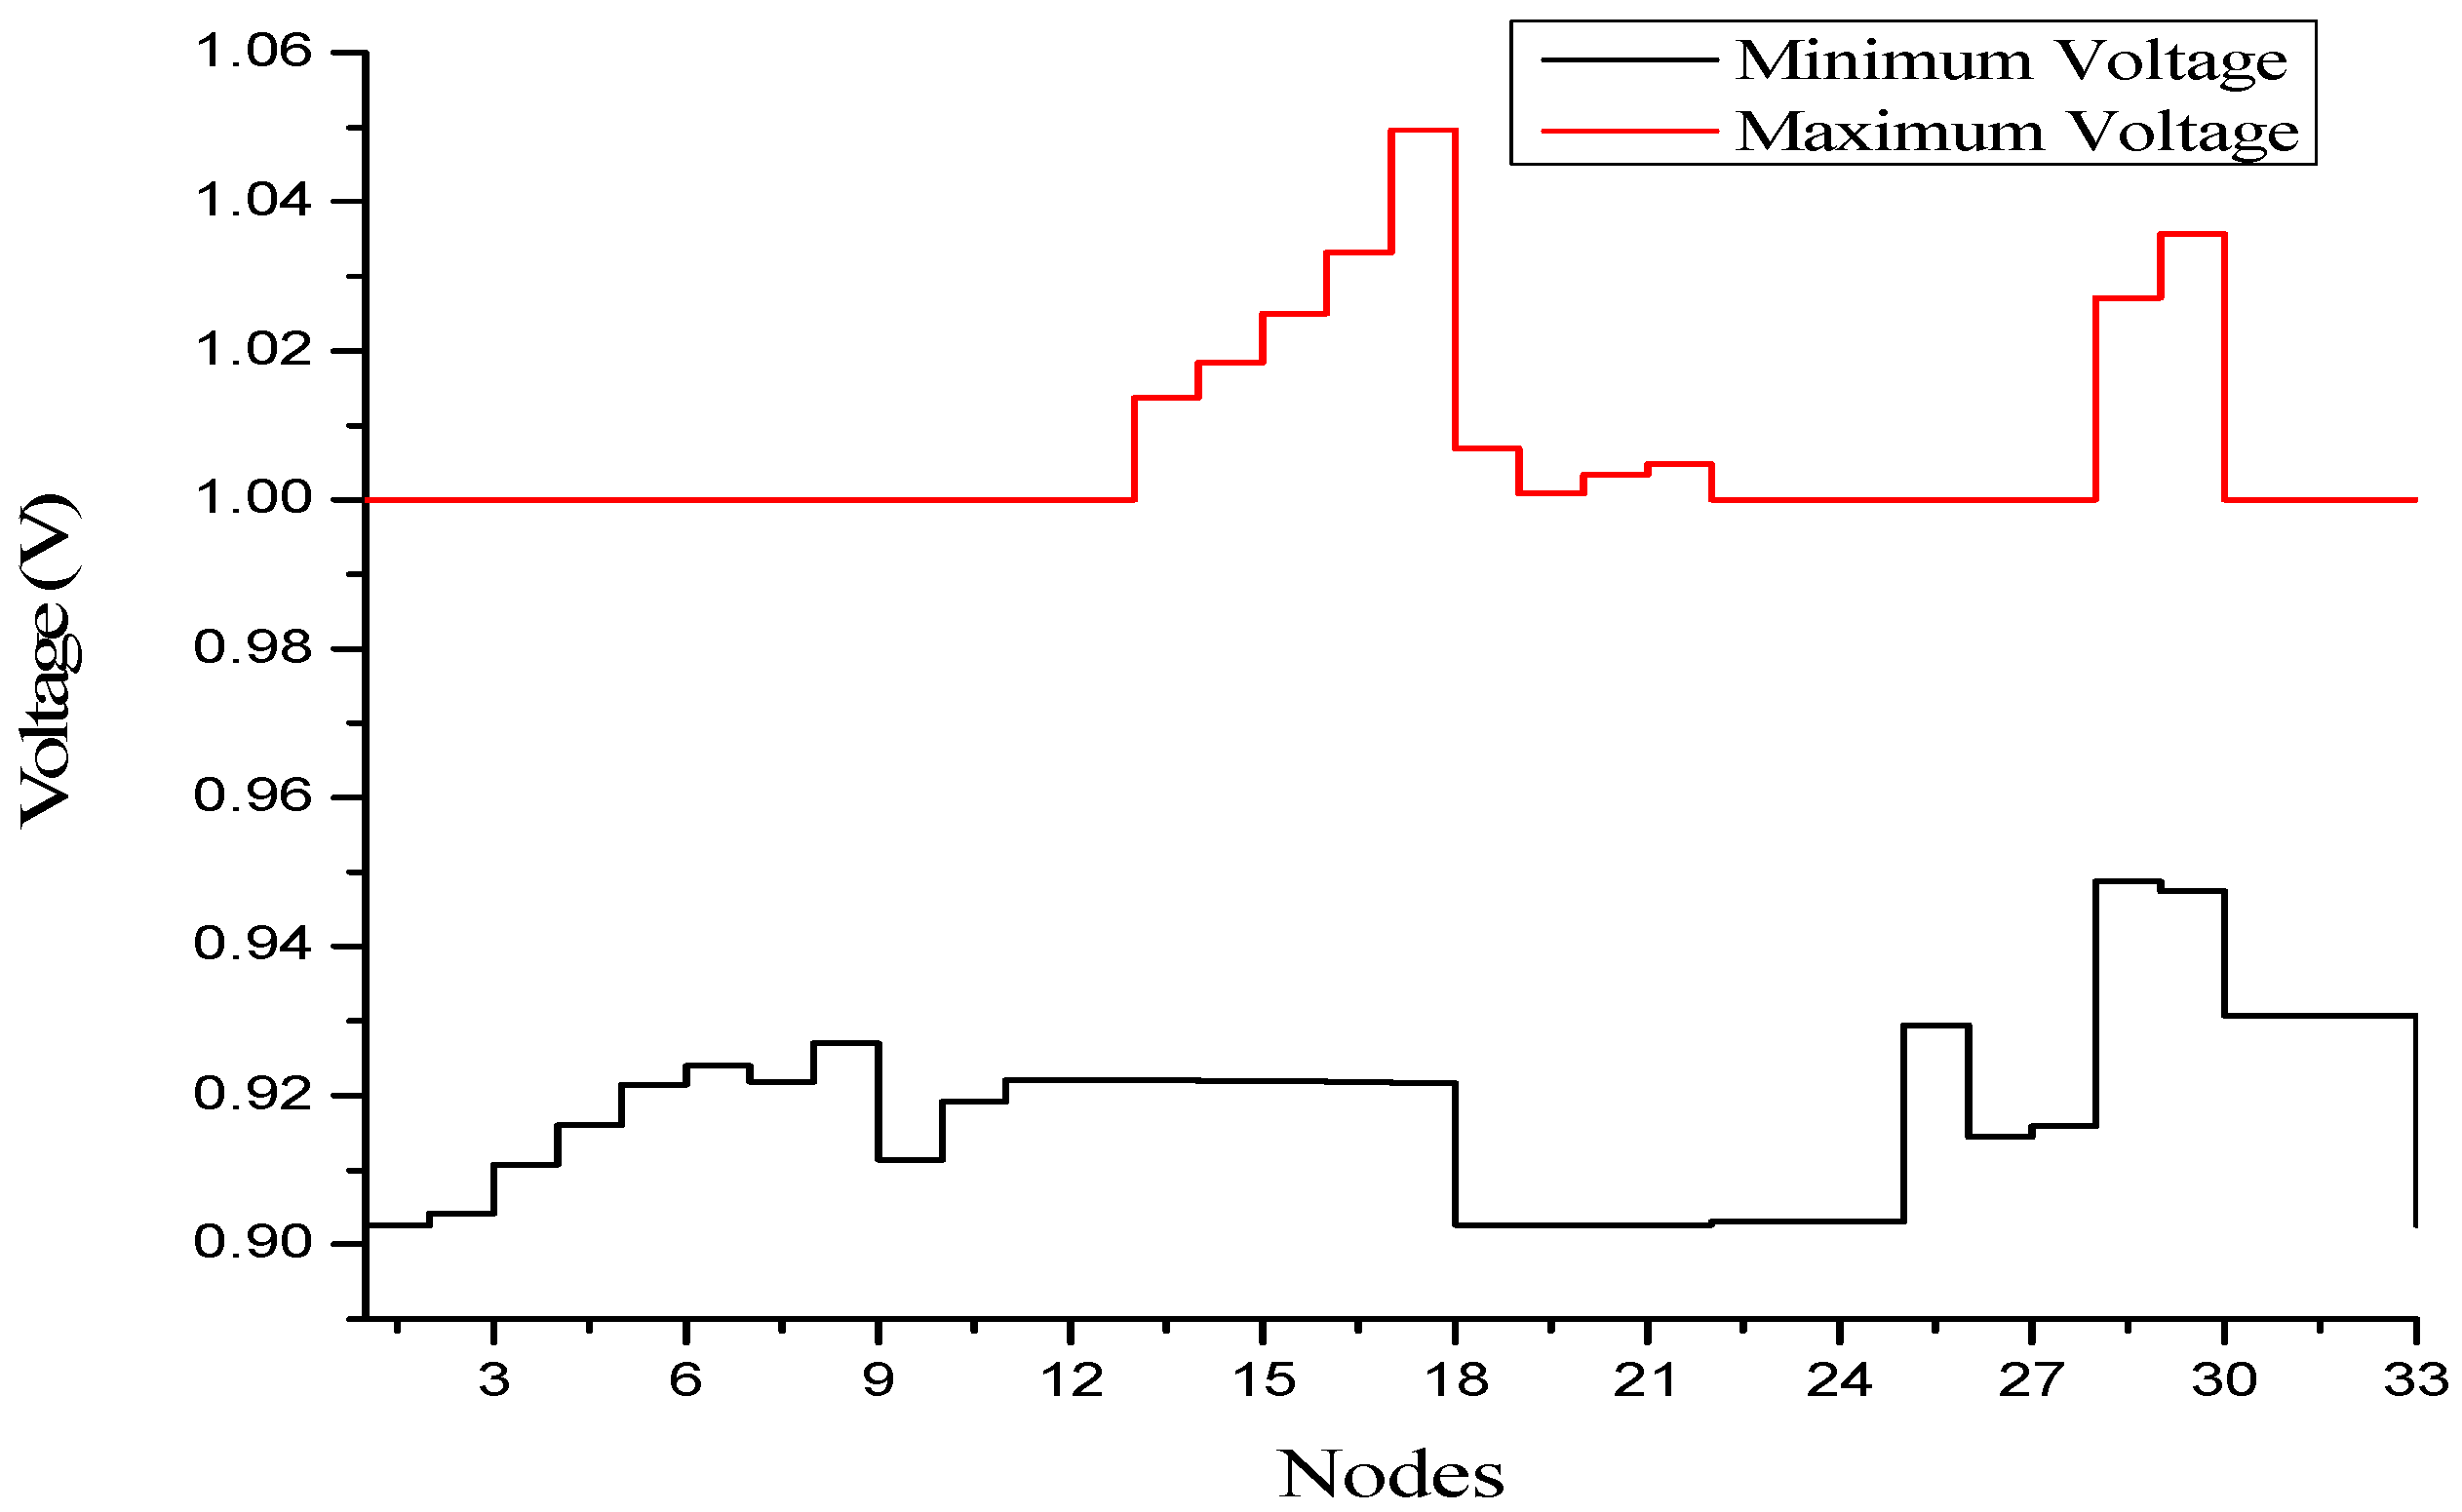
An IEEE 33 node radial distribution network was selected as the test system with an assumption of 0.9 power factor lagging for an instant duration. The objective of the research is to find the optimal size and location to integrate RES and EVCS. The fuzzy logic approach was used for size identification at each node and a genetic algorithm was used for optimal location identification. Three cases were taken into consideration for results. First was the integration of RES. In the second case, EVCS was integrated into the IEEE 33 node radial distribution network. In the third case, both RES and EVCS were integrated with the network, and we compared the results of all three networks. For this, capacity optimized integration is shown in Figure 1 and suggests that the highest capacity is connected at nodes 28 and 29. After integration of the RES and EVCS capacity to the IEEE 33 node radial distribution network, minimum and maximum voltage at each node is shown in Figure 2 and active and reactive power losses are shown in Figure 3. RES and EVCS integration location was optimized by a genetic algorithm with the help of active and reactive power losses and voltage profiles.
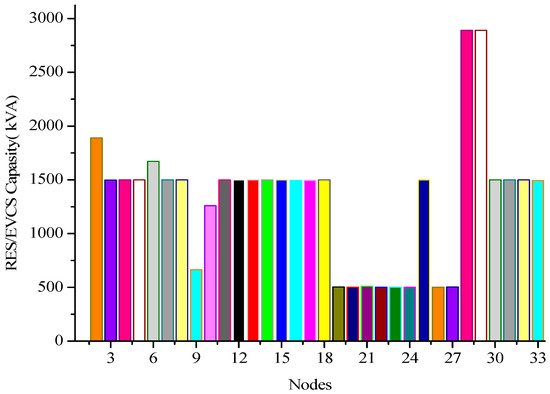
Figure 1.
RES and EVCS capacity using a fuzzy logic approach.
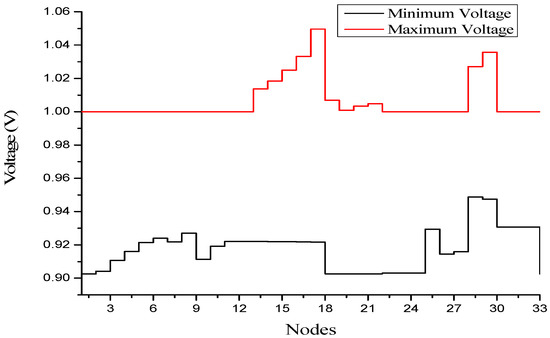
Figure 2.
Minimum and Maximum voltage at each node after integrating RES and EVCS.
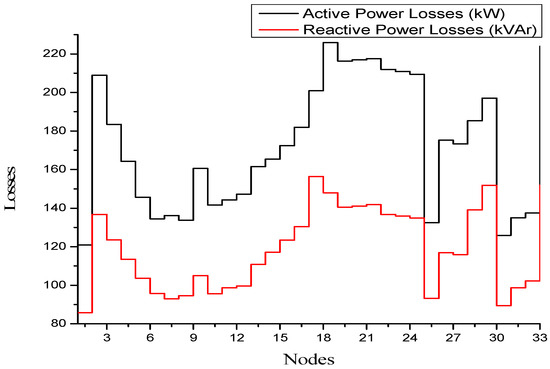
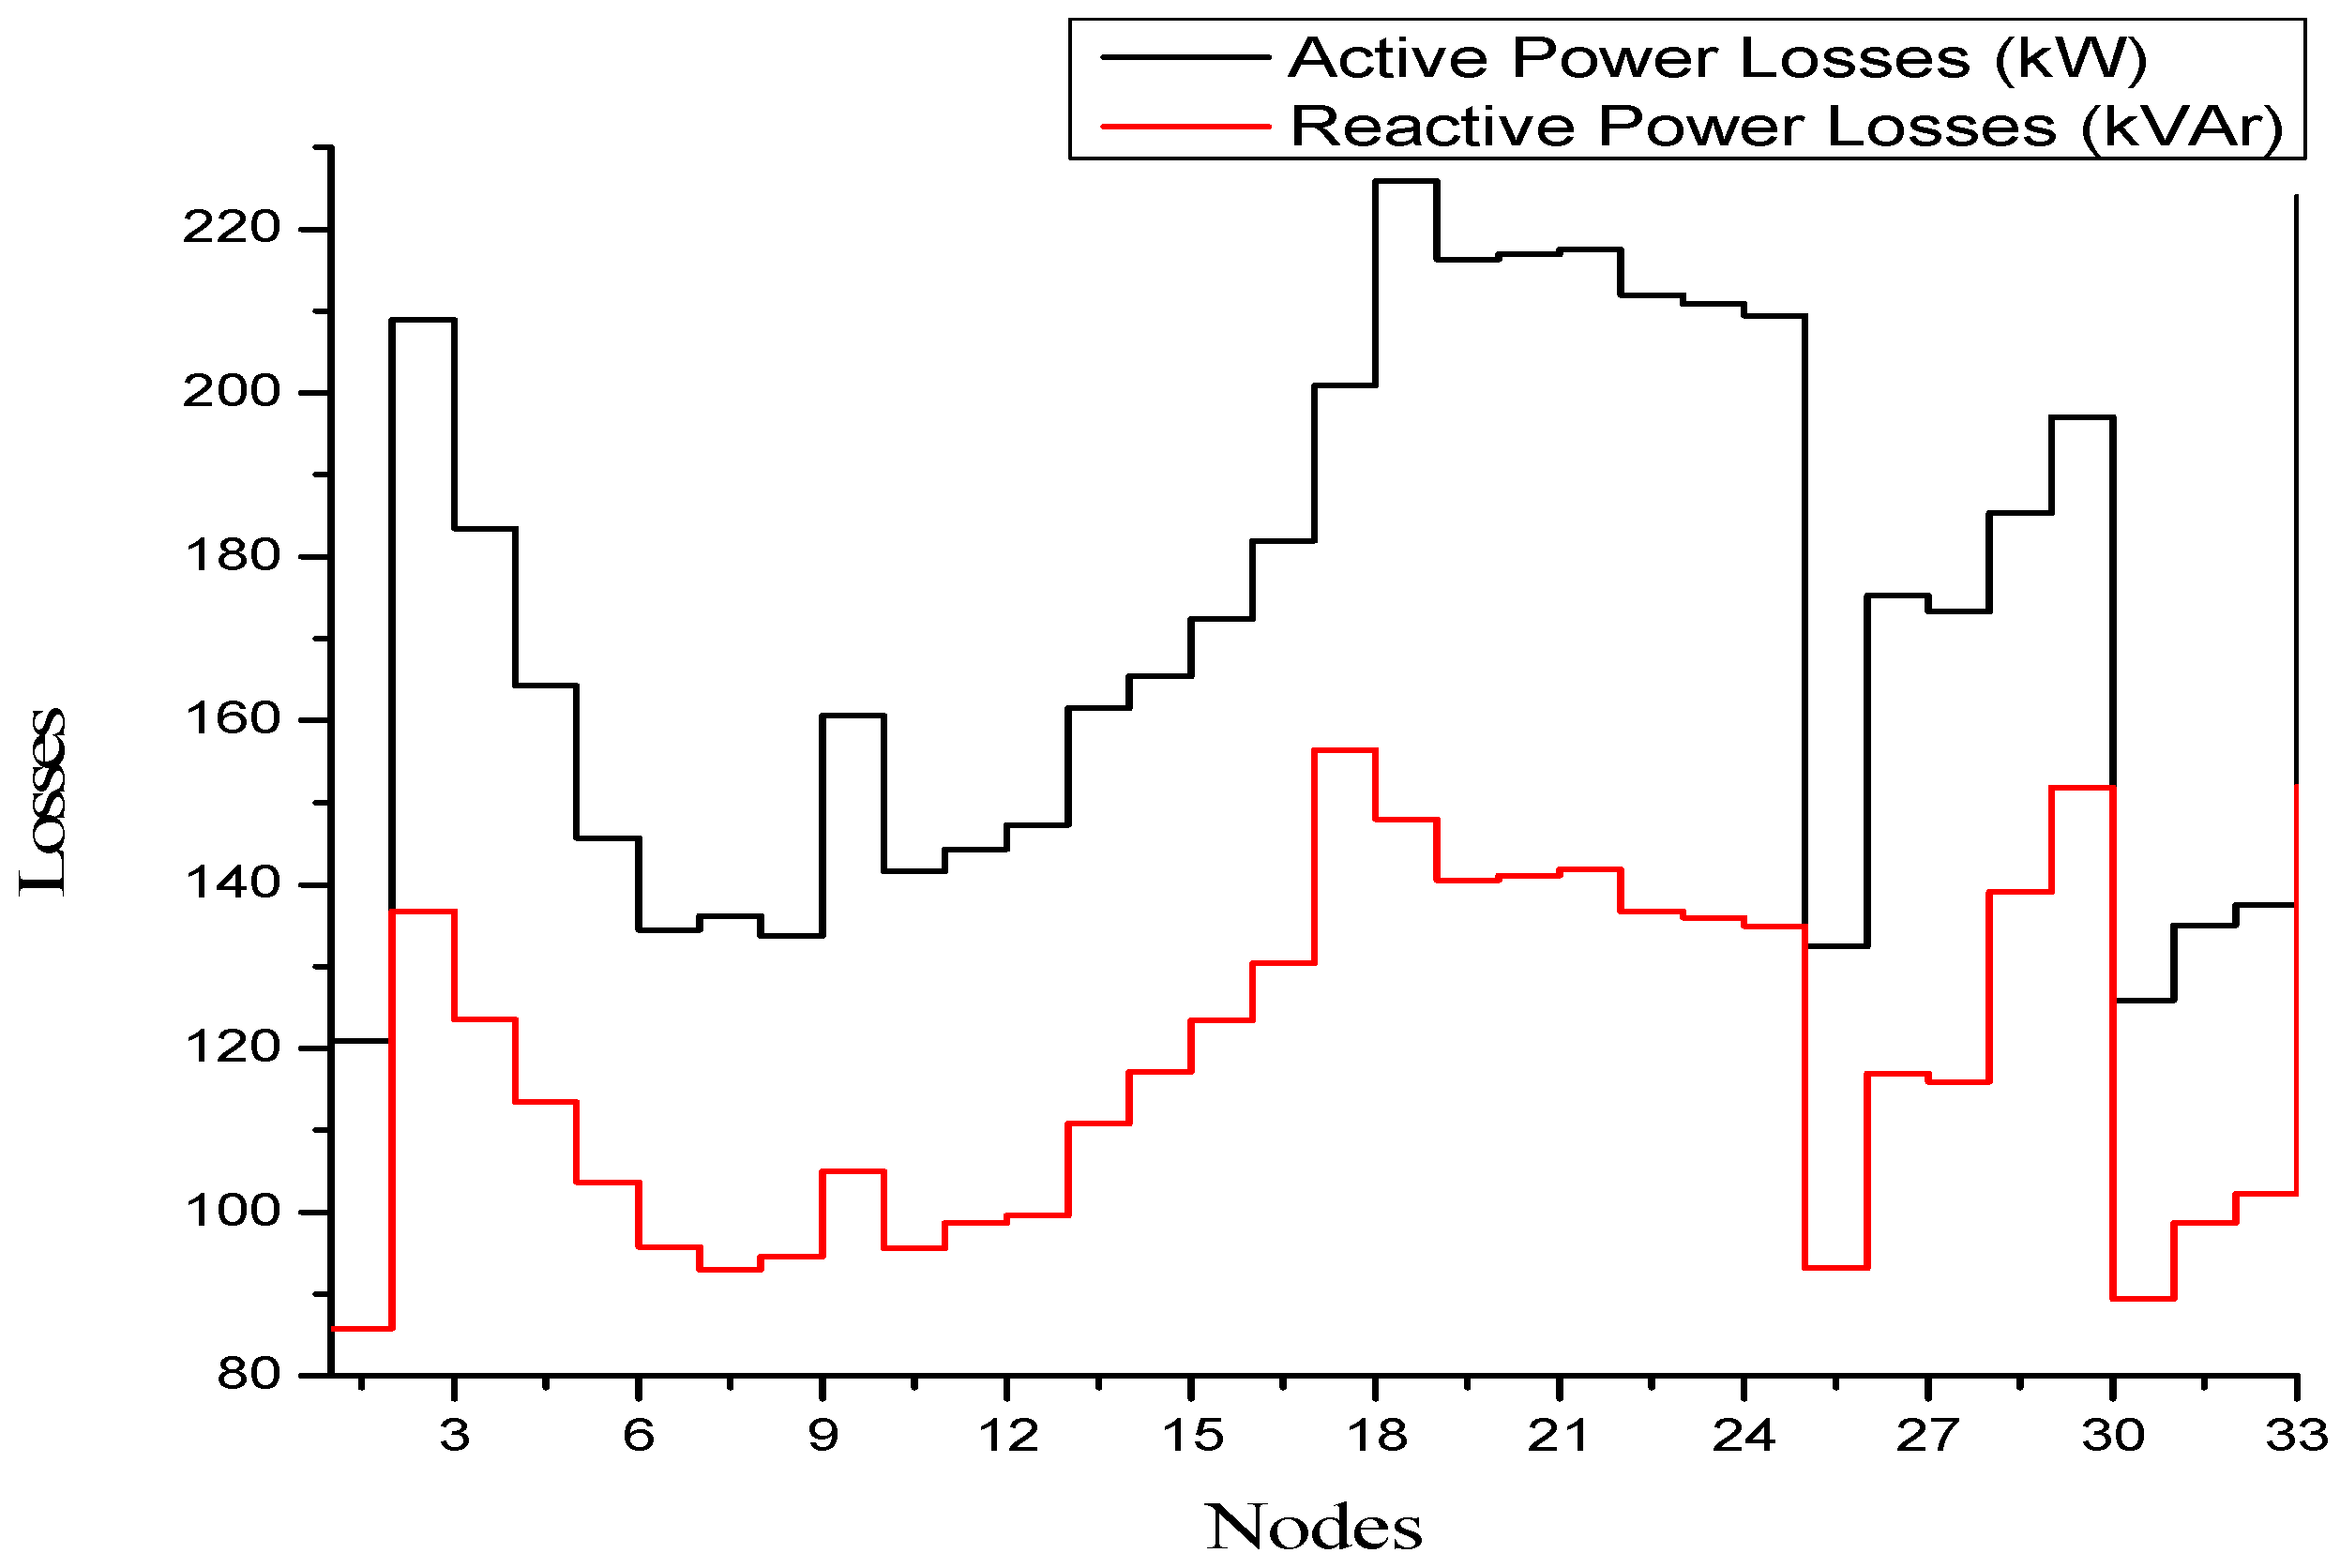
Figure 3.
Active and reactive power losses at each node after integration of RES and EVCS.
6.2. RES Integration
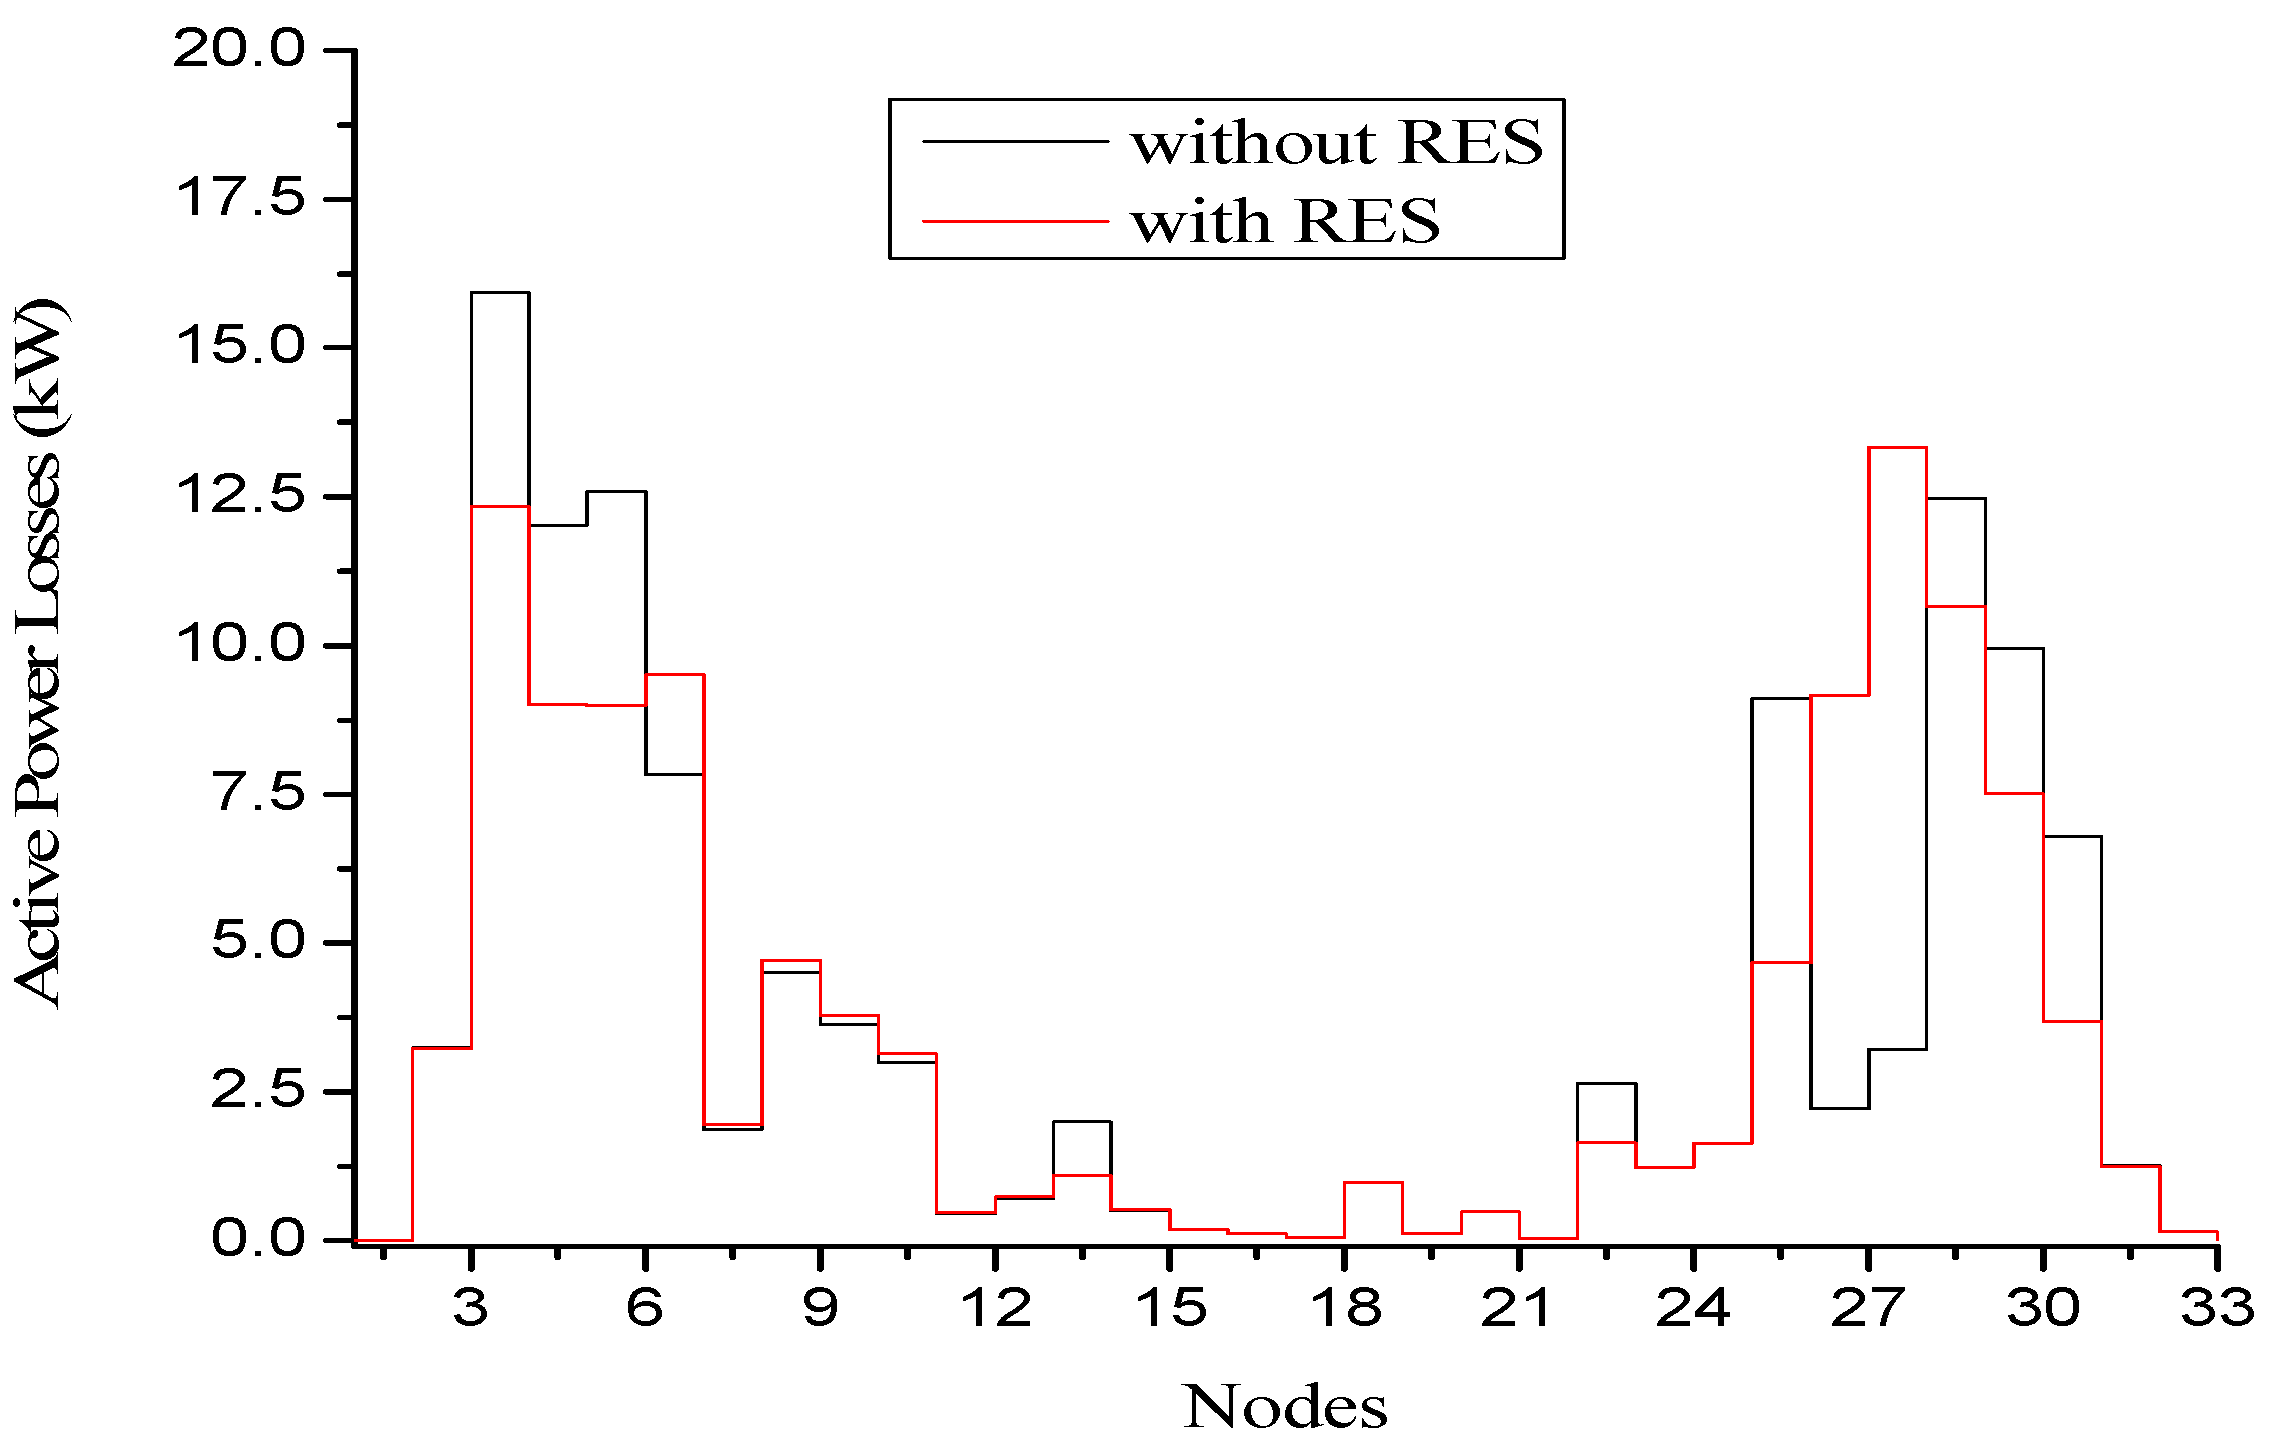
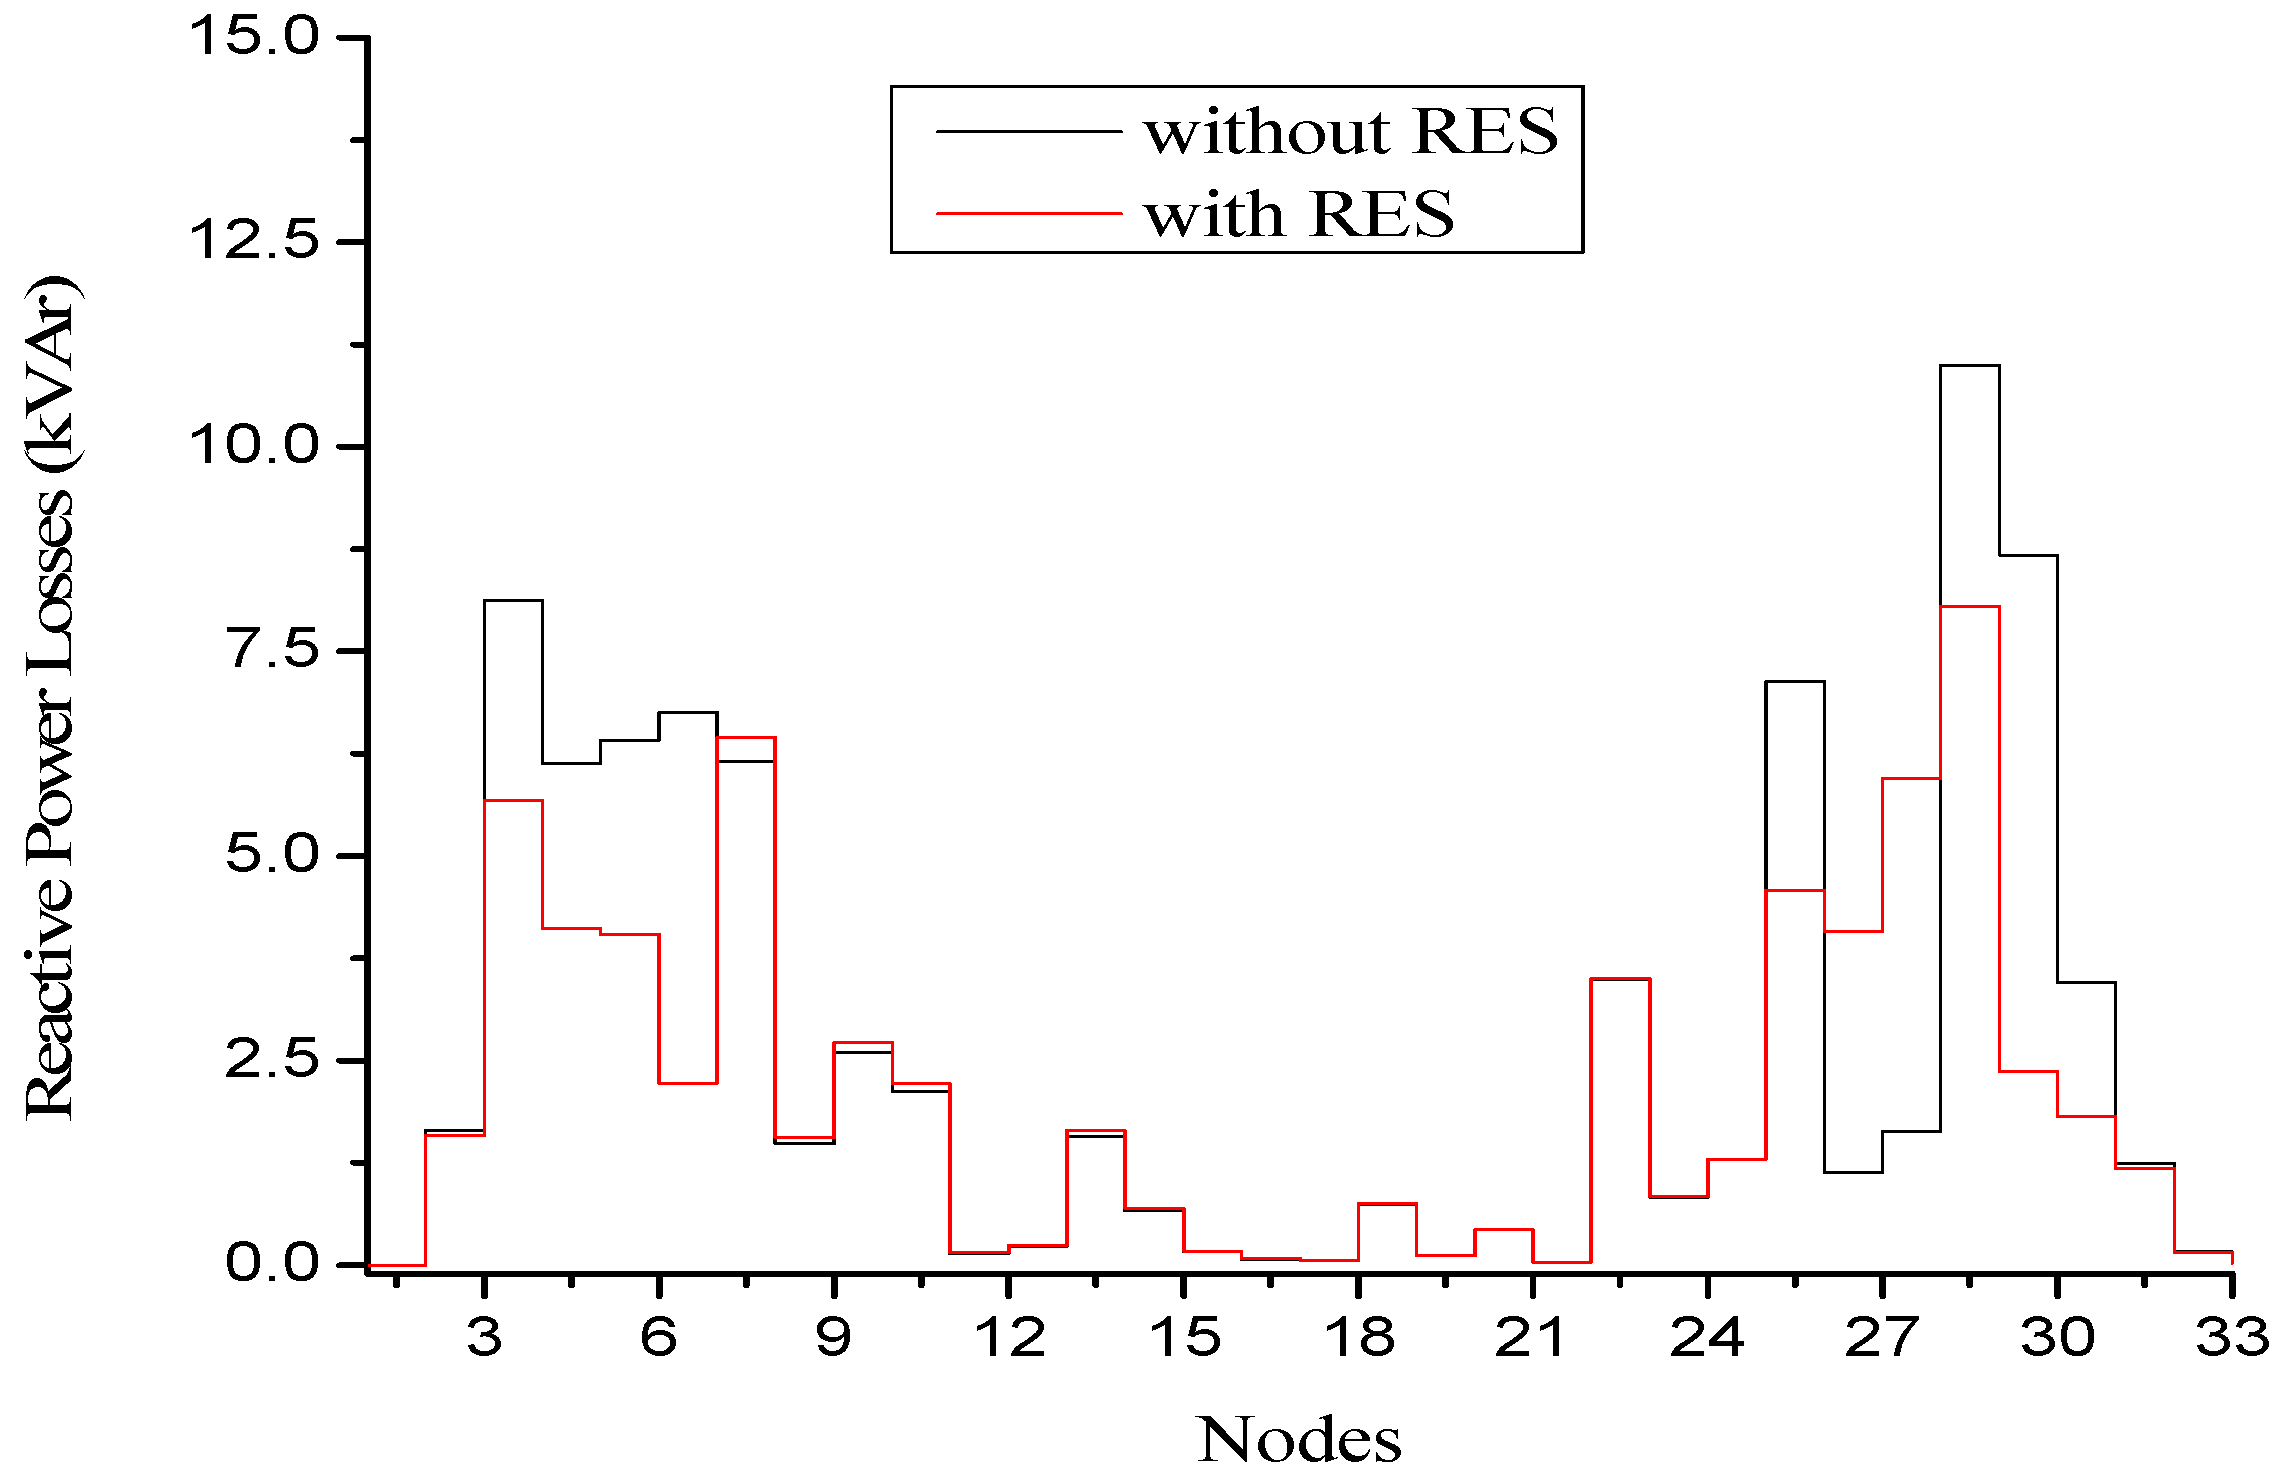
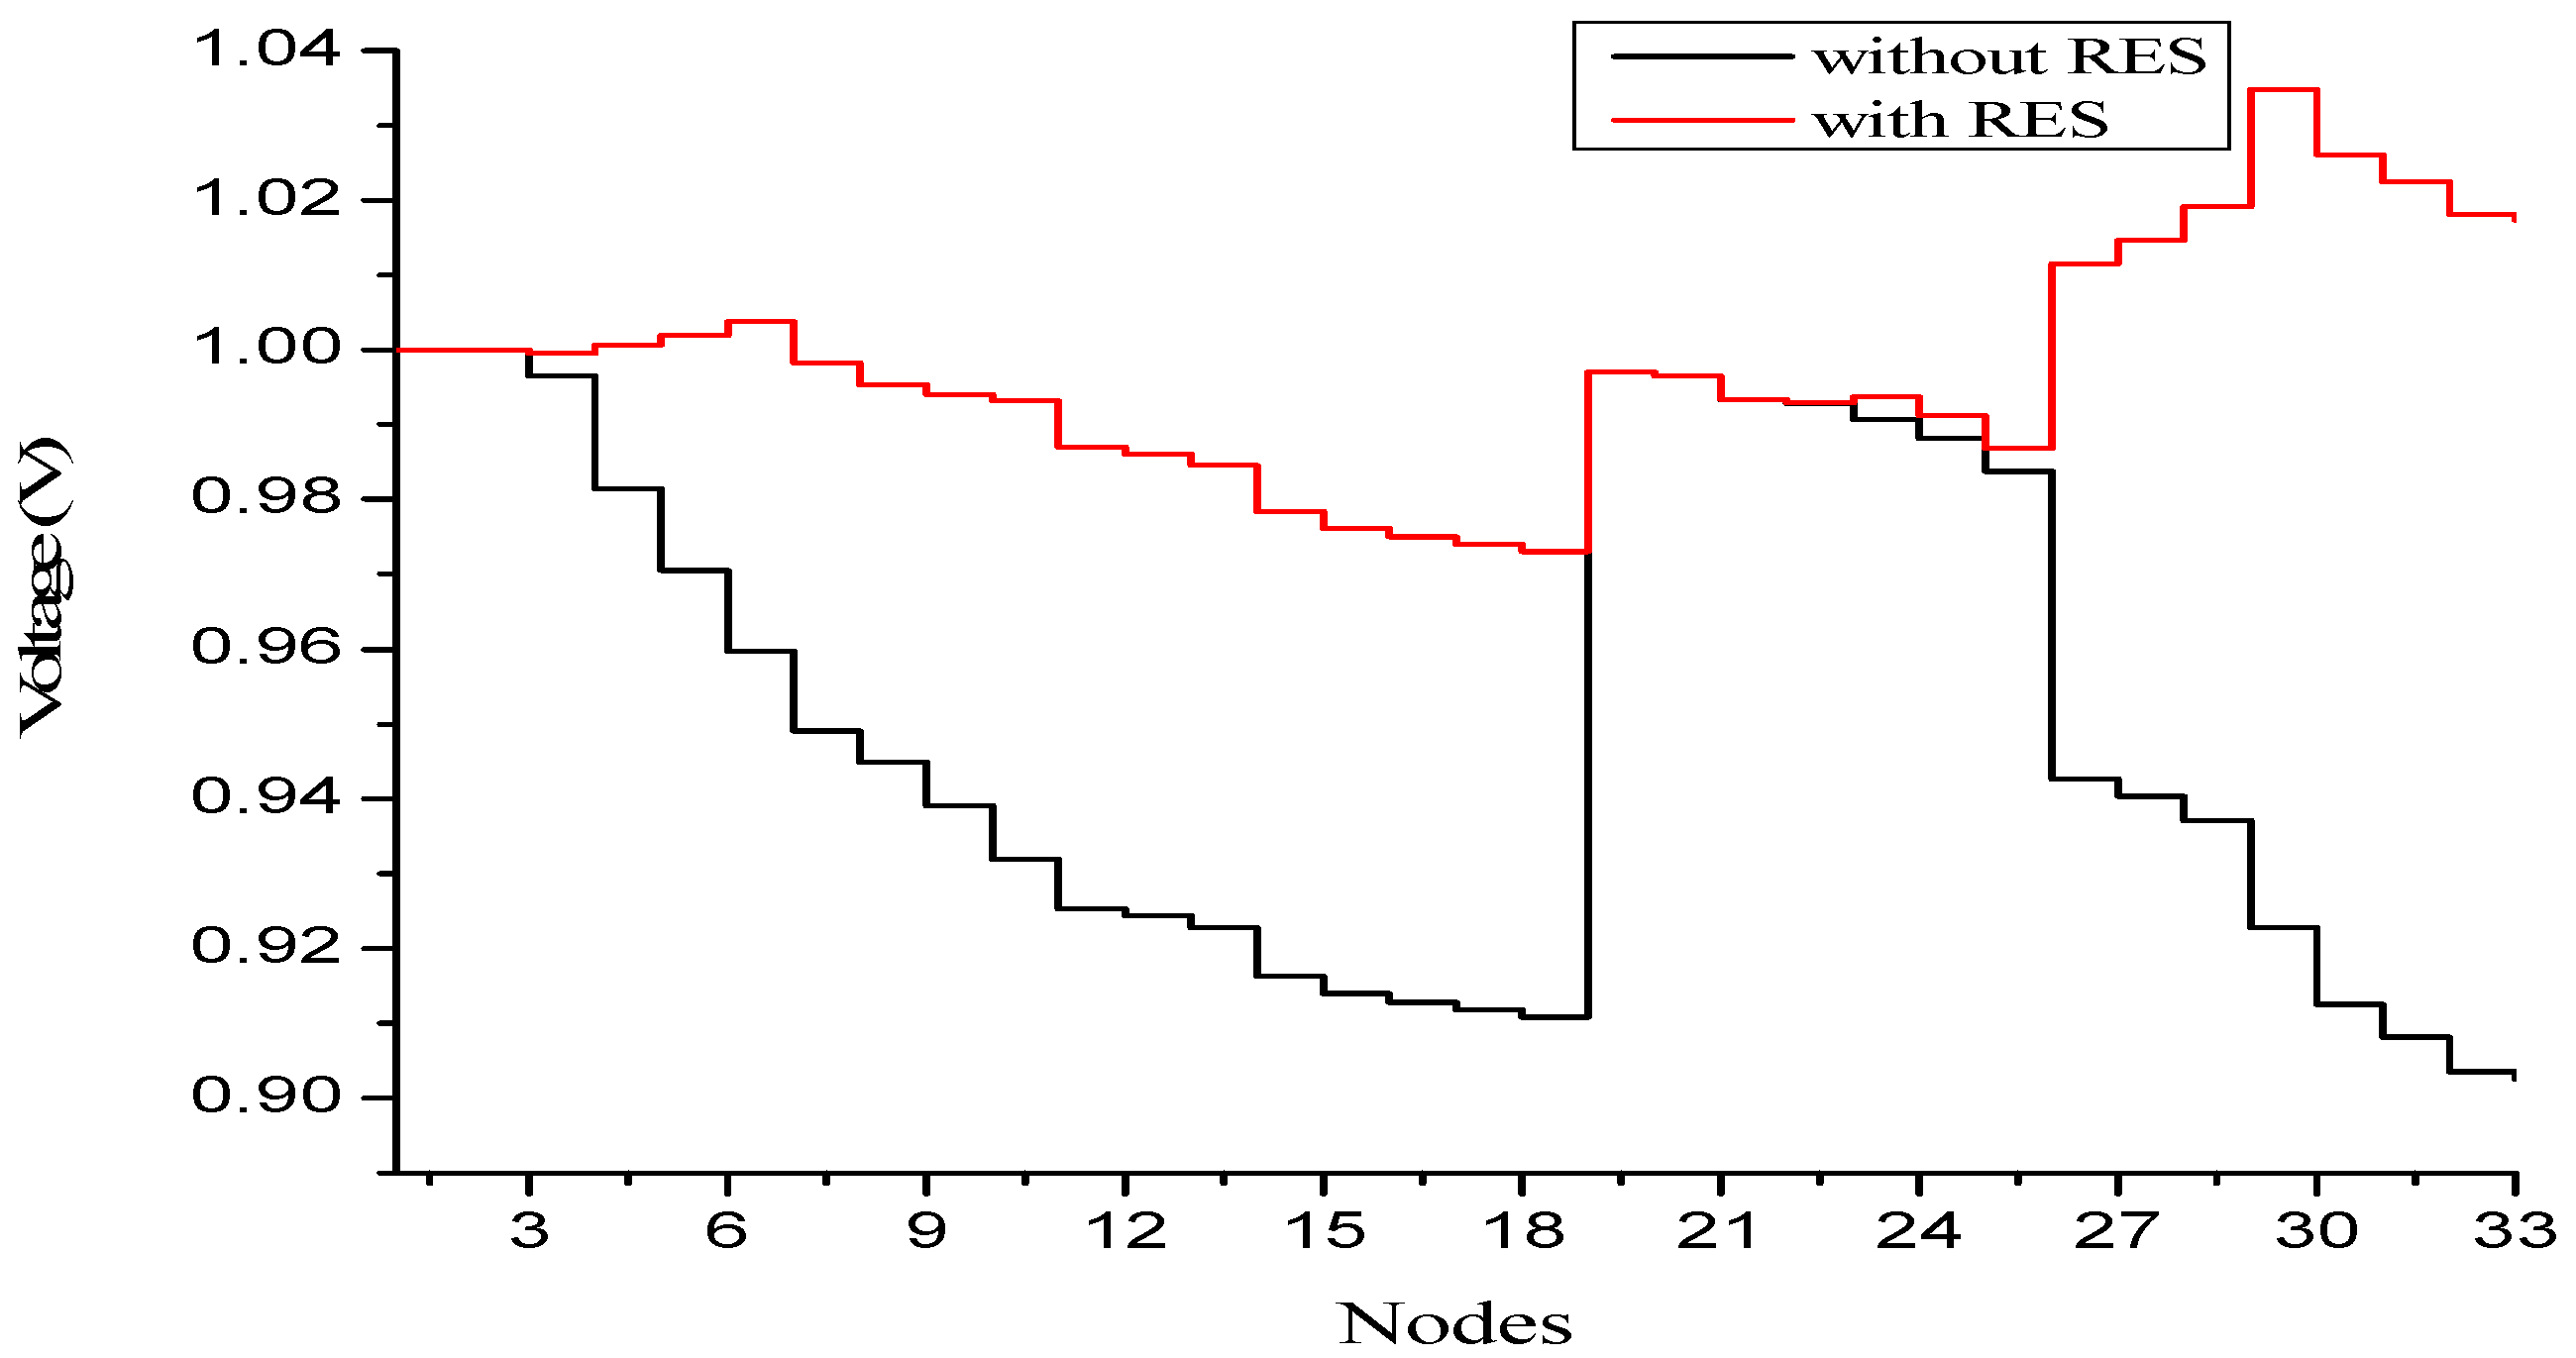
RESs are integrated using a genetic algorithm where active and reactive power losses are minimum and voltage profile is in constraints defined by (24) and (25). RESs are integrated at node 28 using a genetic algorithm with a capacity of 2891.56 kVA and, after integration of RES, active power losses are reduced to 185.35 kW from 216.84 kW, as shown in Figure 4. Reactive power losses are reduced to 139.1 kVAr from 141.34 kVAr, as shown in Figure 5. The minimum voltage profile is improved to 0.948 Per Unit (pu) and the maximum voltage profile is 1.027 pu within the constraints. According to the rules defined in the genetic algorithm, RES is integrated where active and reactive power losses are minimum. After integrating the optimized capacity of RES from fuzzy logic to the test system, minimum losses are obtained at node 30 but the voltage index at node 30 is noted in the defined range. After node 30, minimum losses are at node 28, and voltage index in the defined range is selected for integration of RES. The voltage profile after integration of RES at node 28 is shown in Figure 6.
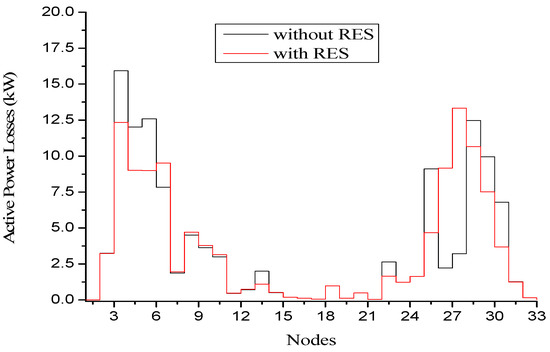
Figure 4.
Active power losses with and without the integration of RES.
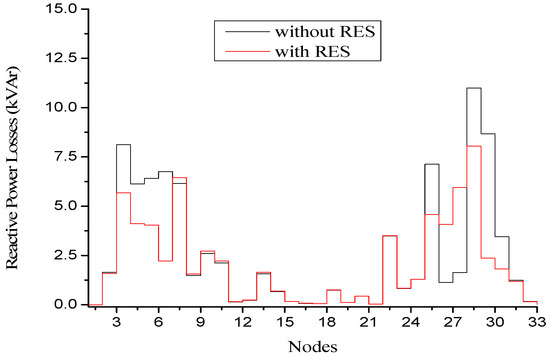
Figure 5.
Reactive power losses with and without the integration of RES.
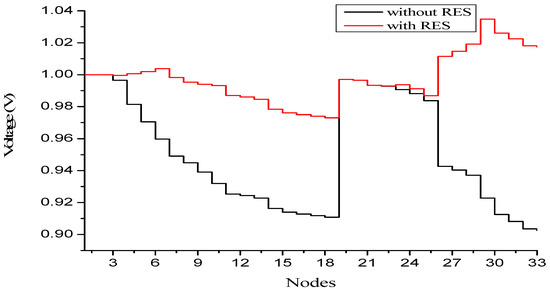
Figure 6.
Voltage profile with and without RES.
Table 1 gives the comparison of parameters with and without the integration of RES and clearly shows how the losses were reduced and the voltage profile was improved.

Table 1.
Comparison of parameters with and without RES.
6.3. EVCS Integration
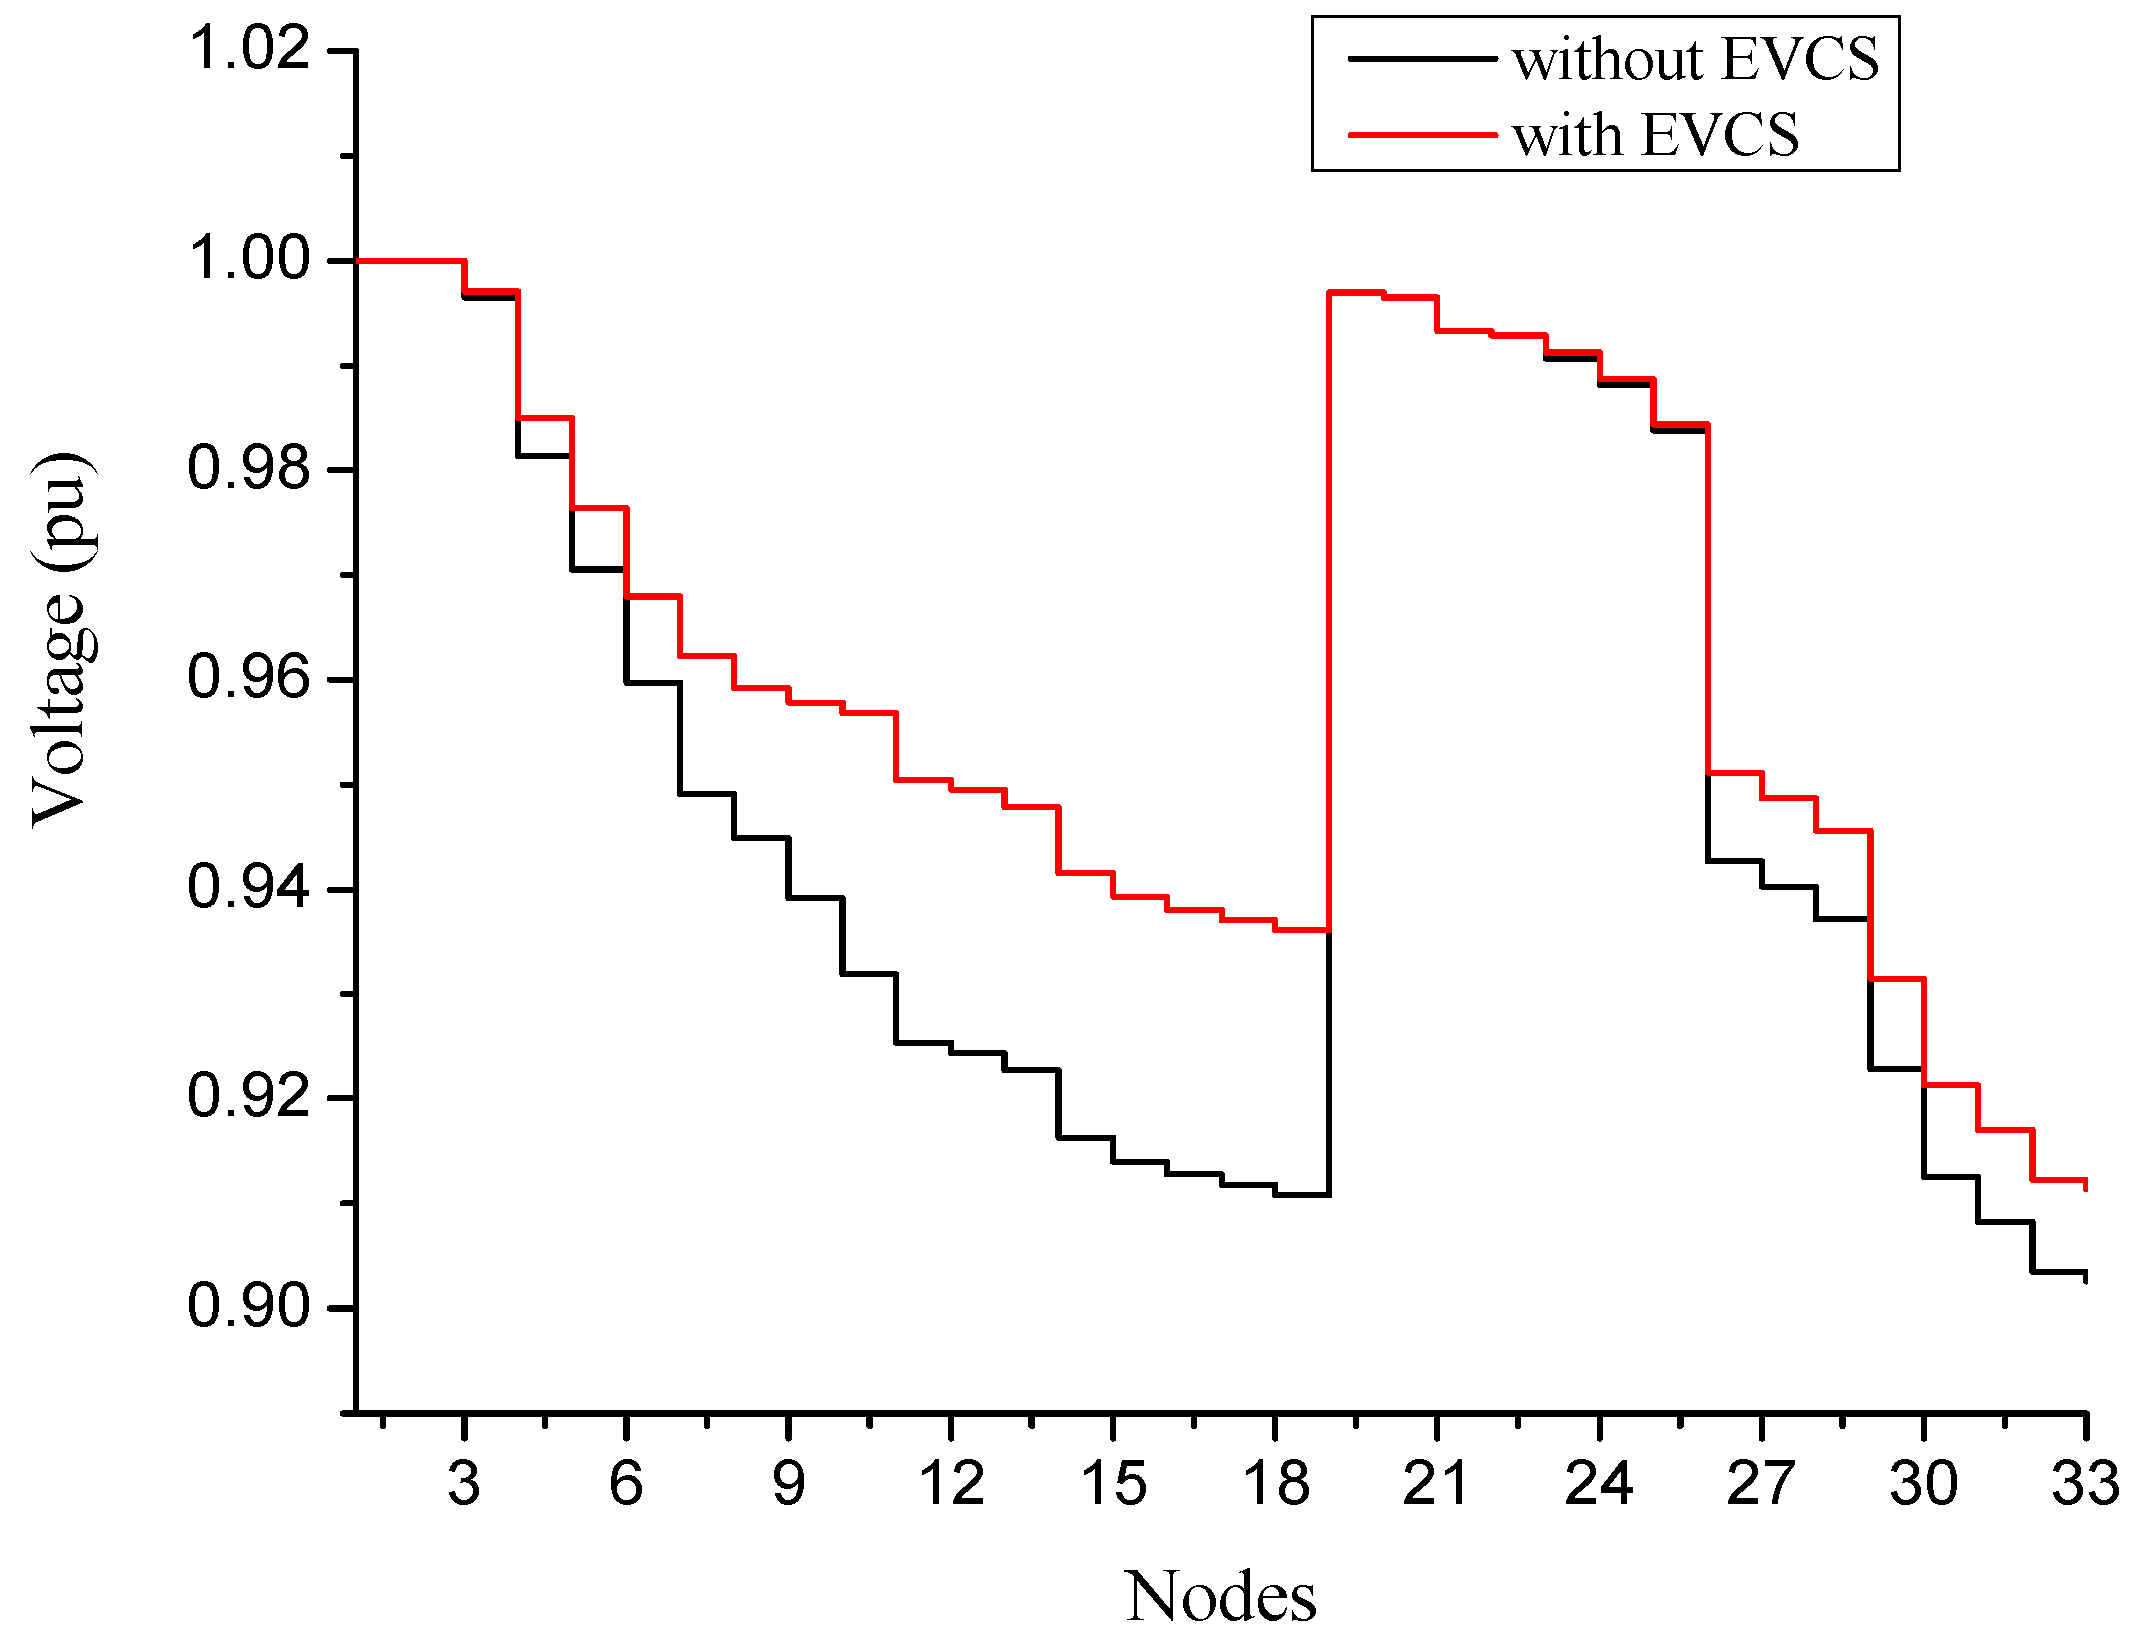
E-vehicle charging station maximum capacity is defined by (26); after using a genetic algorithm, EVCS was integrated at node 9 with a capacity of 663.9 kVA and the minimum voltage improved to 0.911, as shown in Figure 7. Active and reactive power losses are, respectively, 160.62 kW and 104.98 kVAr.
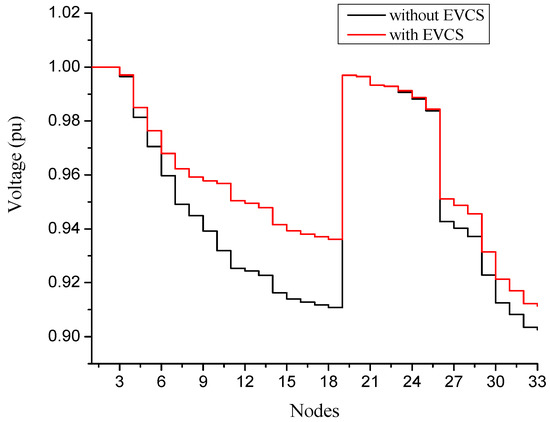
Figure 7.
Voltage profile with and without EVCS.
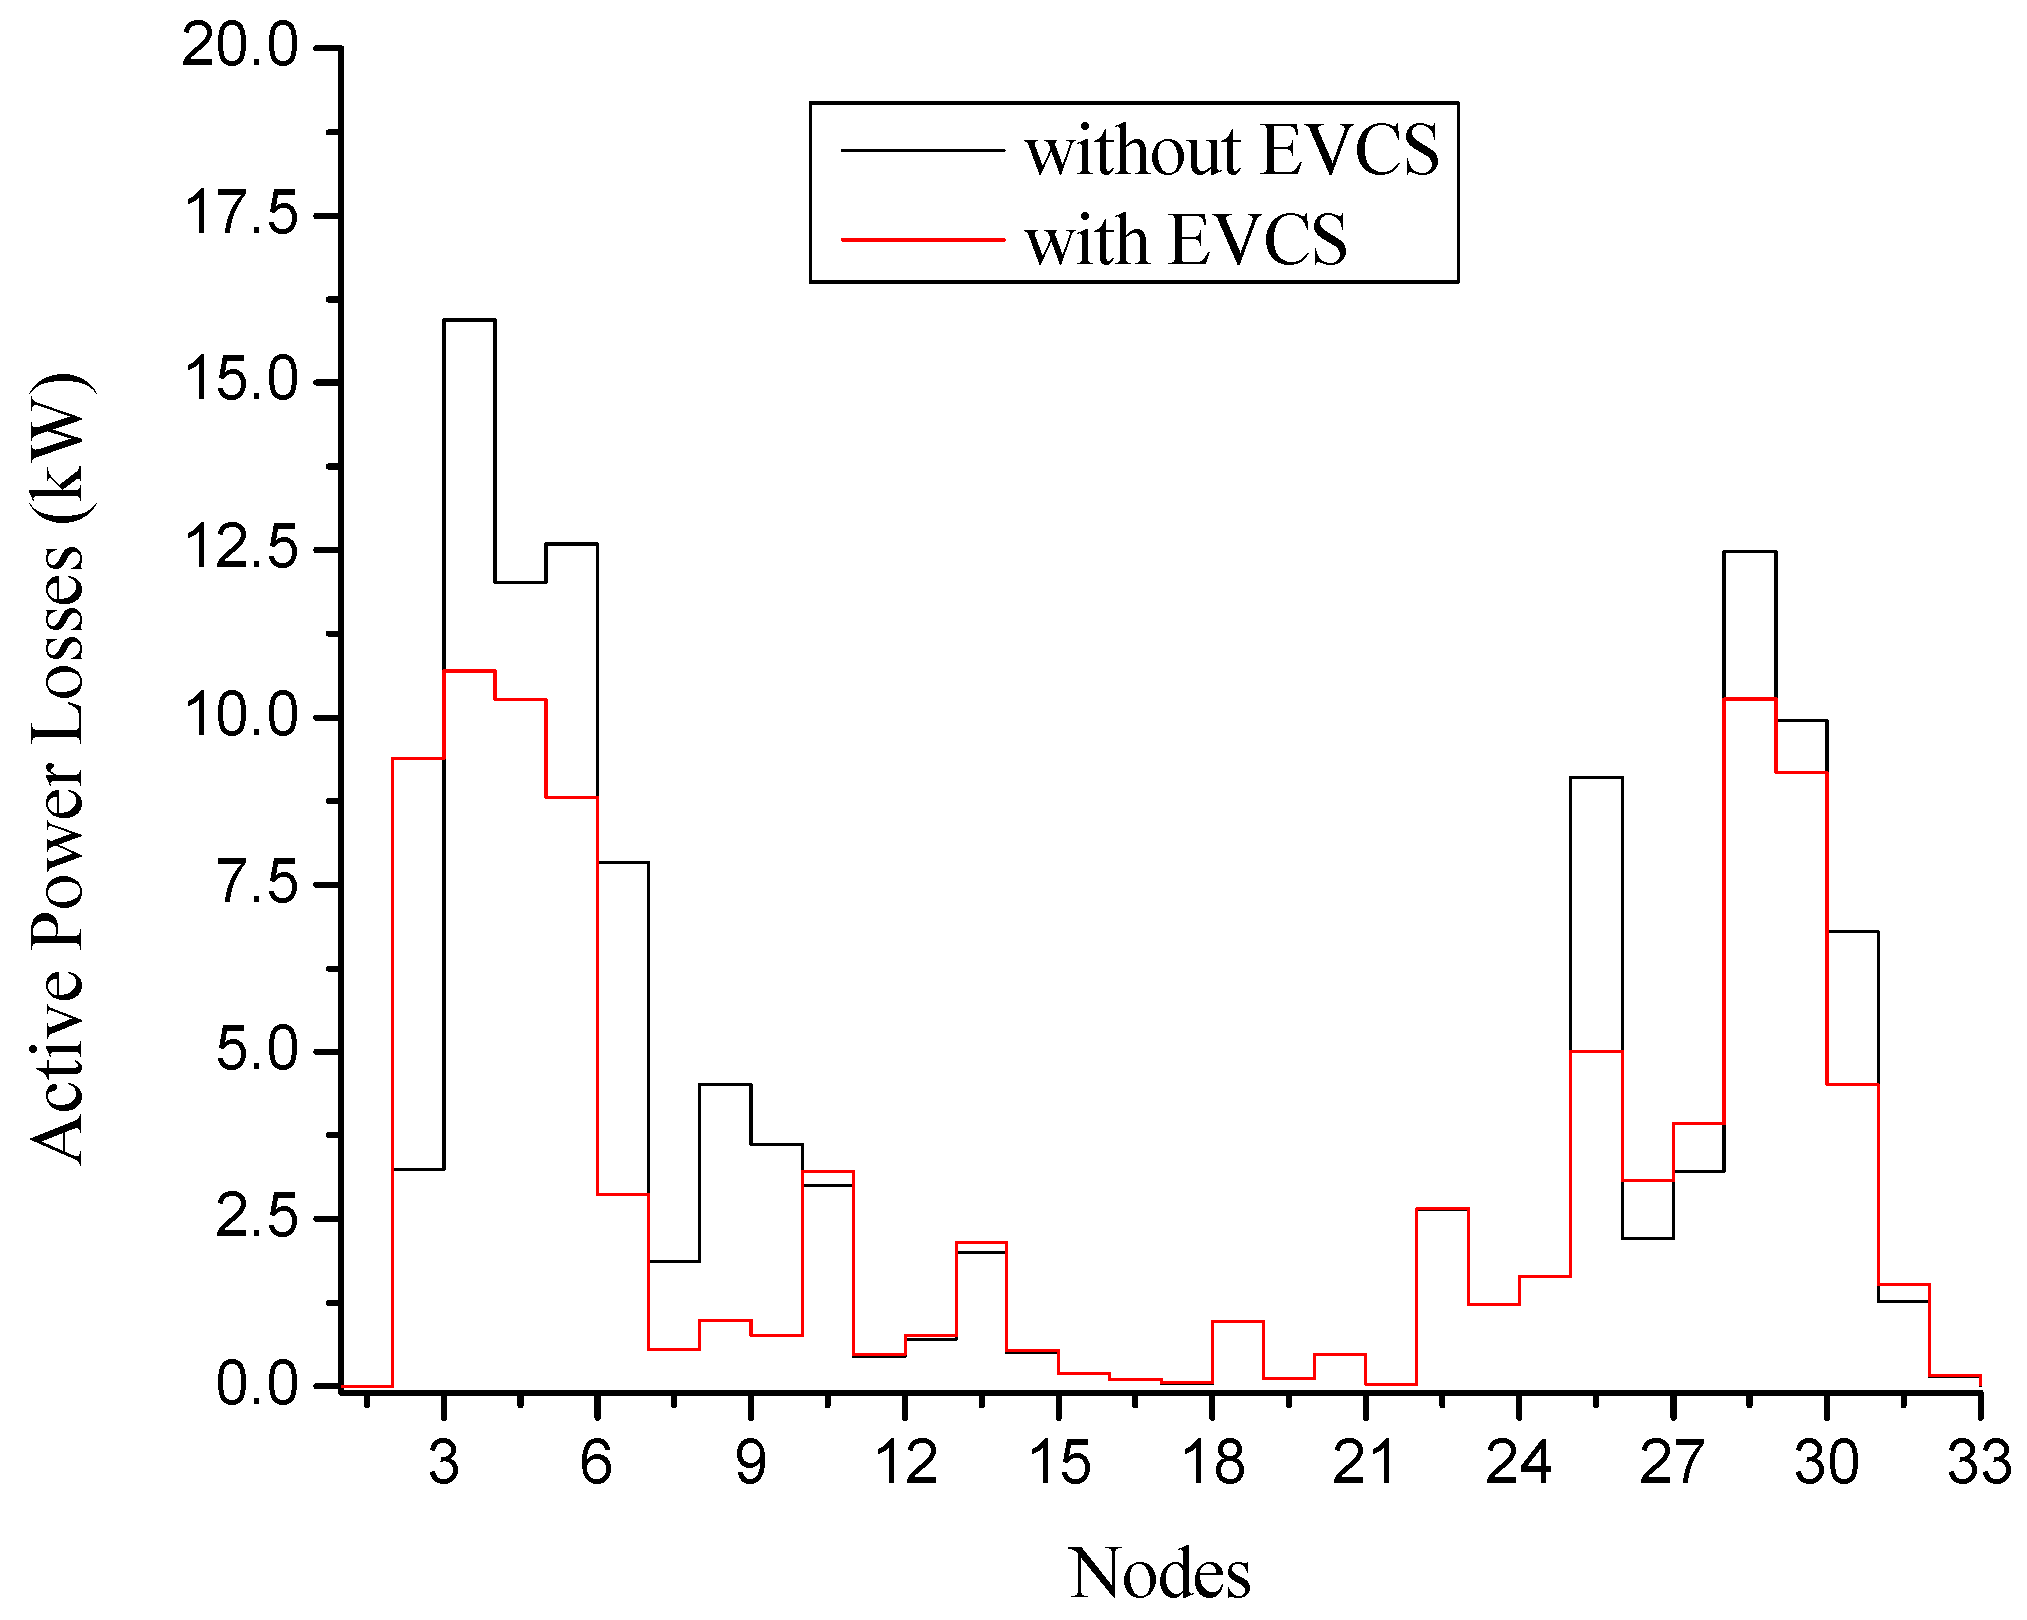
EVCS was integrated at node 9 using a genetic algorithm with the capacity of 663.9 kVA and the active power losses of 160.62 kW, as shown in Figure 8.
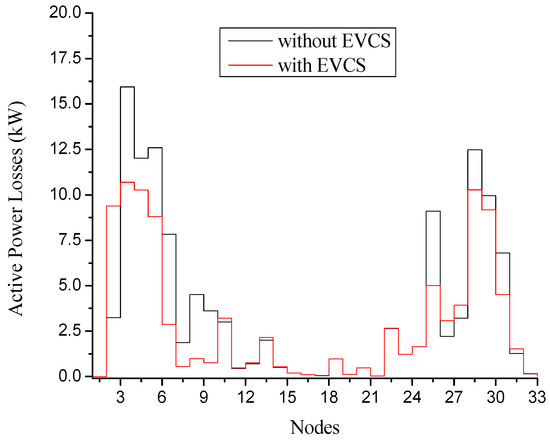
Figure 8.
Active power losses with and without the integration of EVCS.
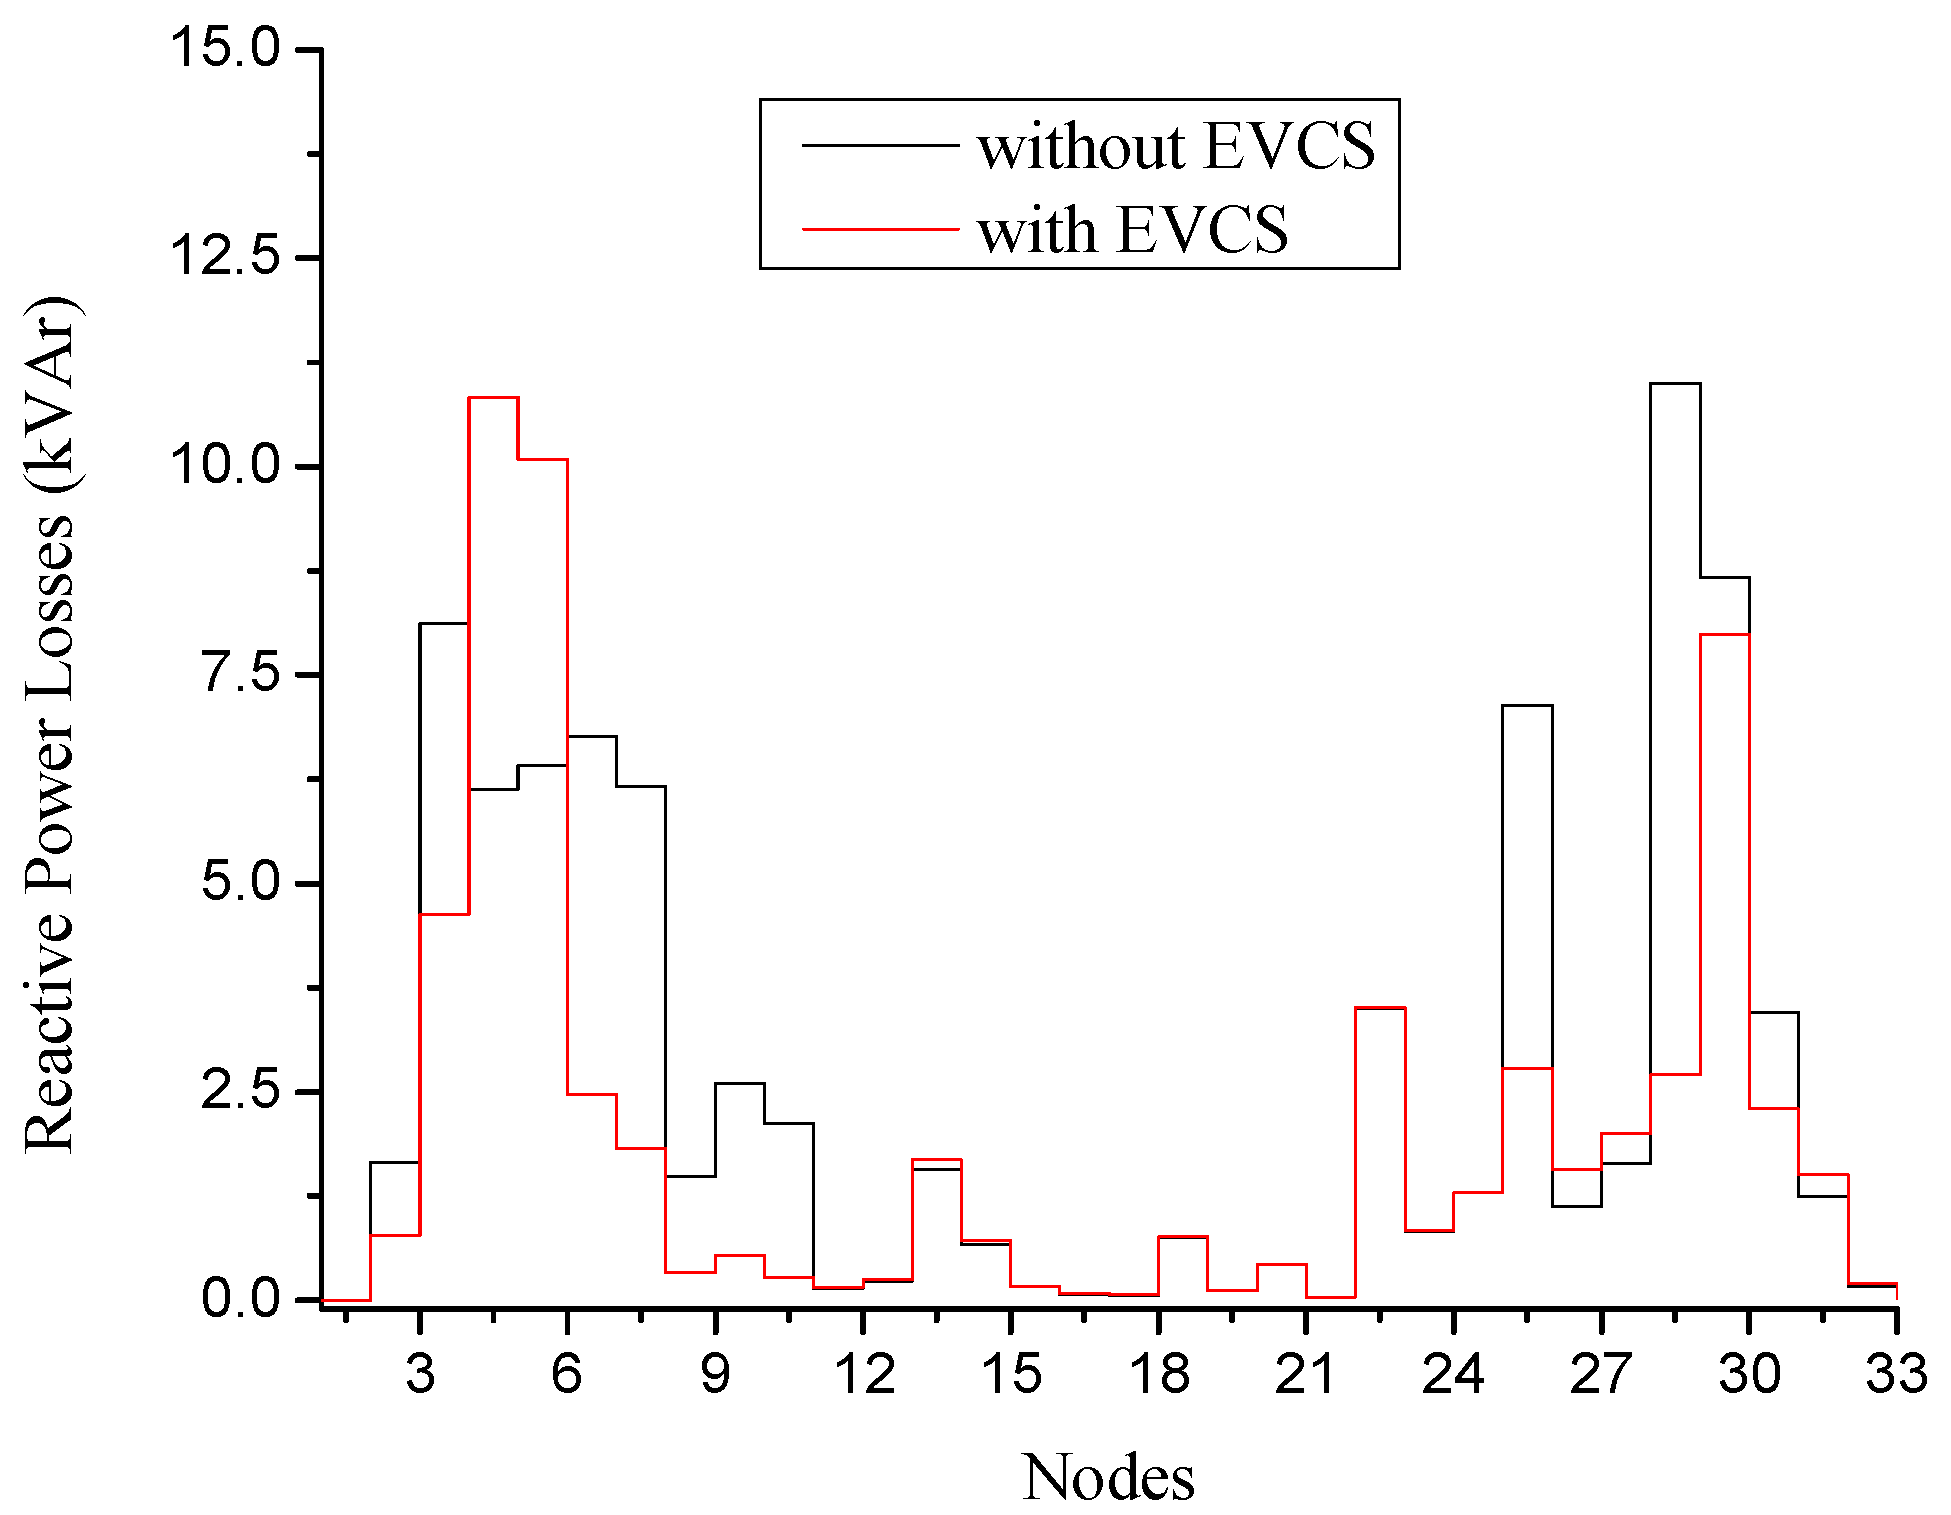
EVCS was integrated at node 9 using a genetic algorithm with a capacity of 663.9 kVA and reactive power losses of 104.98 kVAr. Figure 9 shows the graphical comparison between reactive power losses with and without the integration of EVCS.
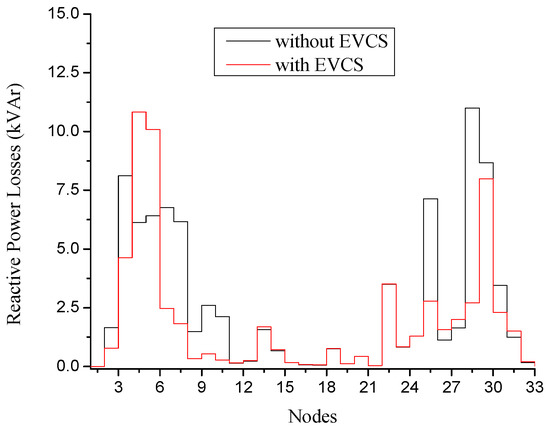
Figure 9.
Reactive power losses with and without the integration of EVCS.
Table 2 provides the comparison of parameters with and without the integration of EVCS and clearly shows how the losses were reduced and the voltage profile was improved.
Table 2.
Comparison of parameters with and without EVCS.
6.4. RES and EVCS Integrate
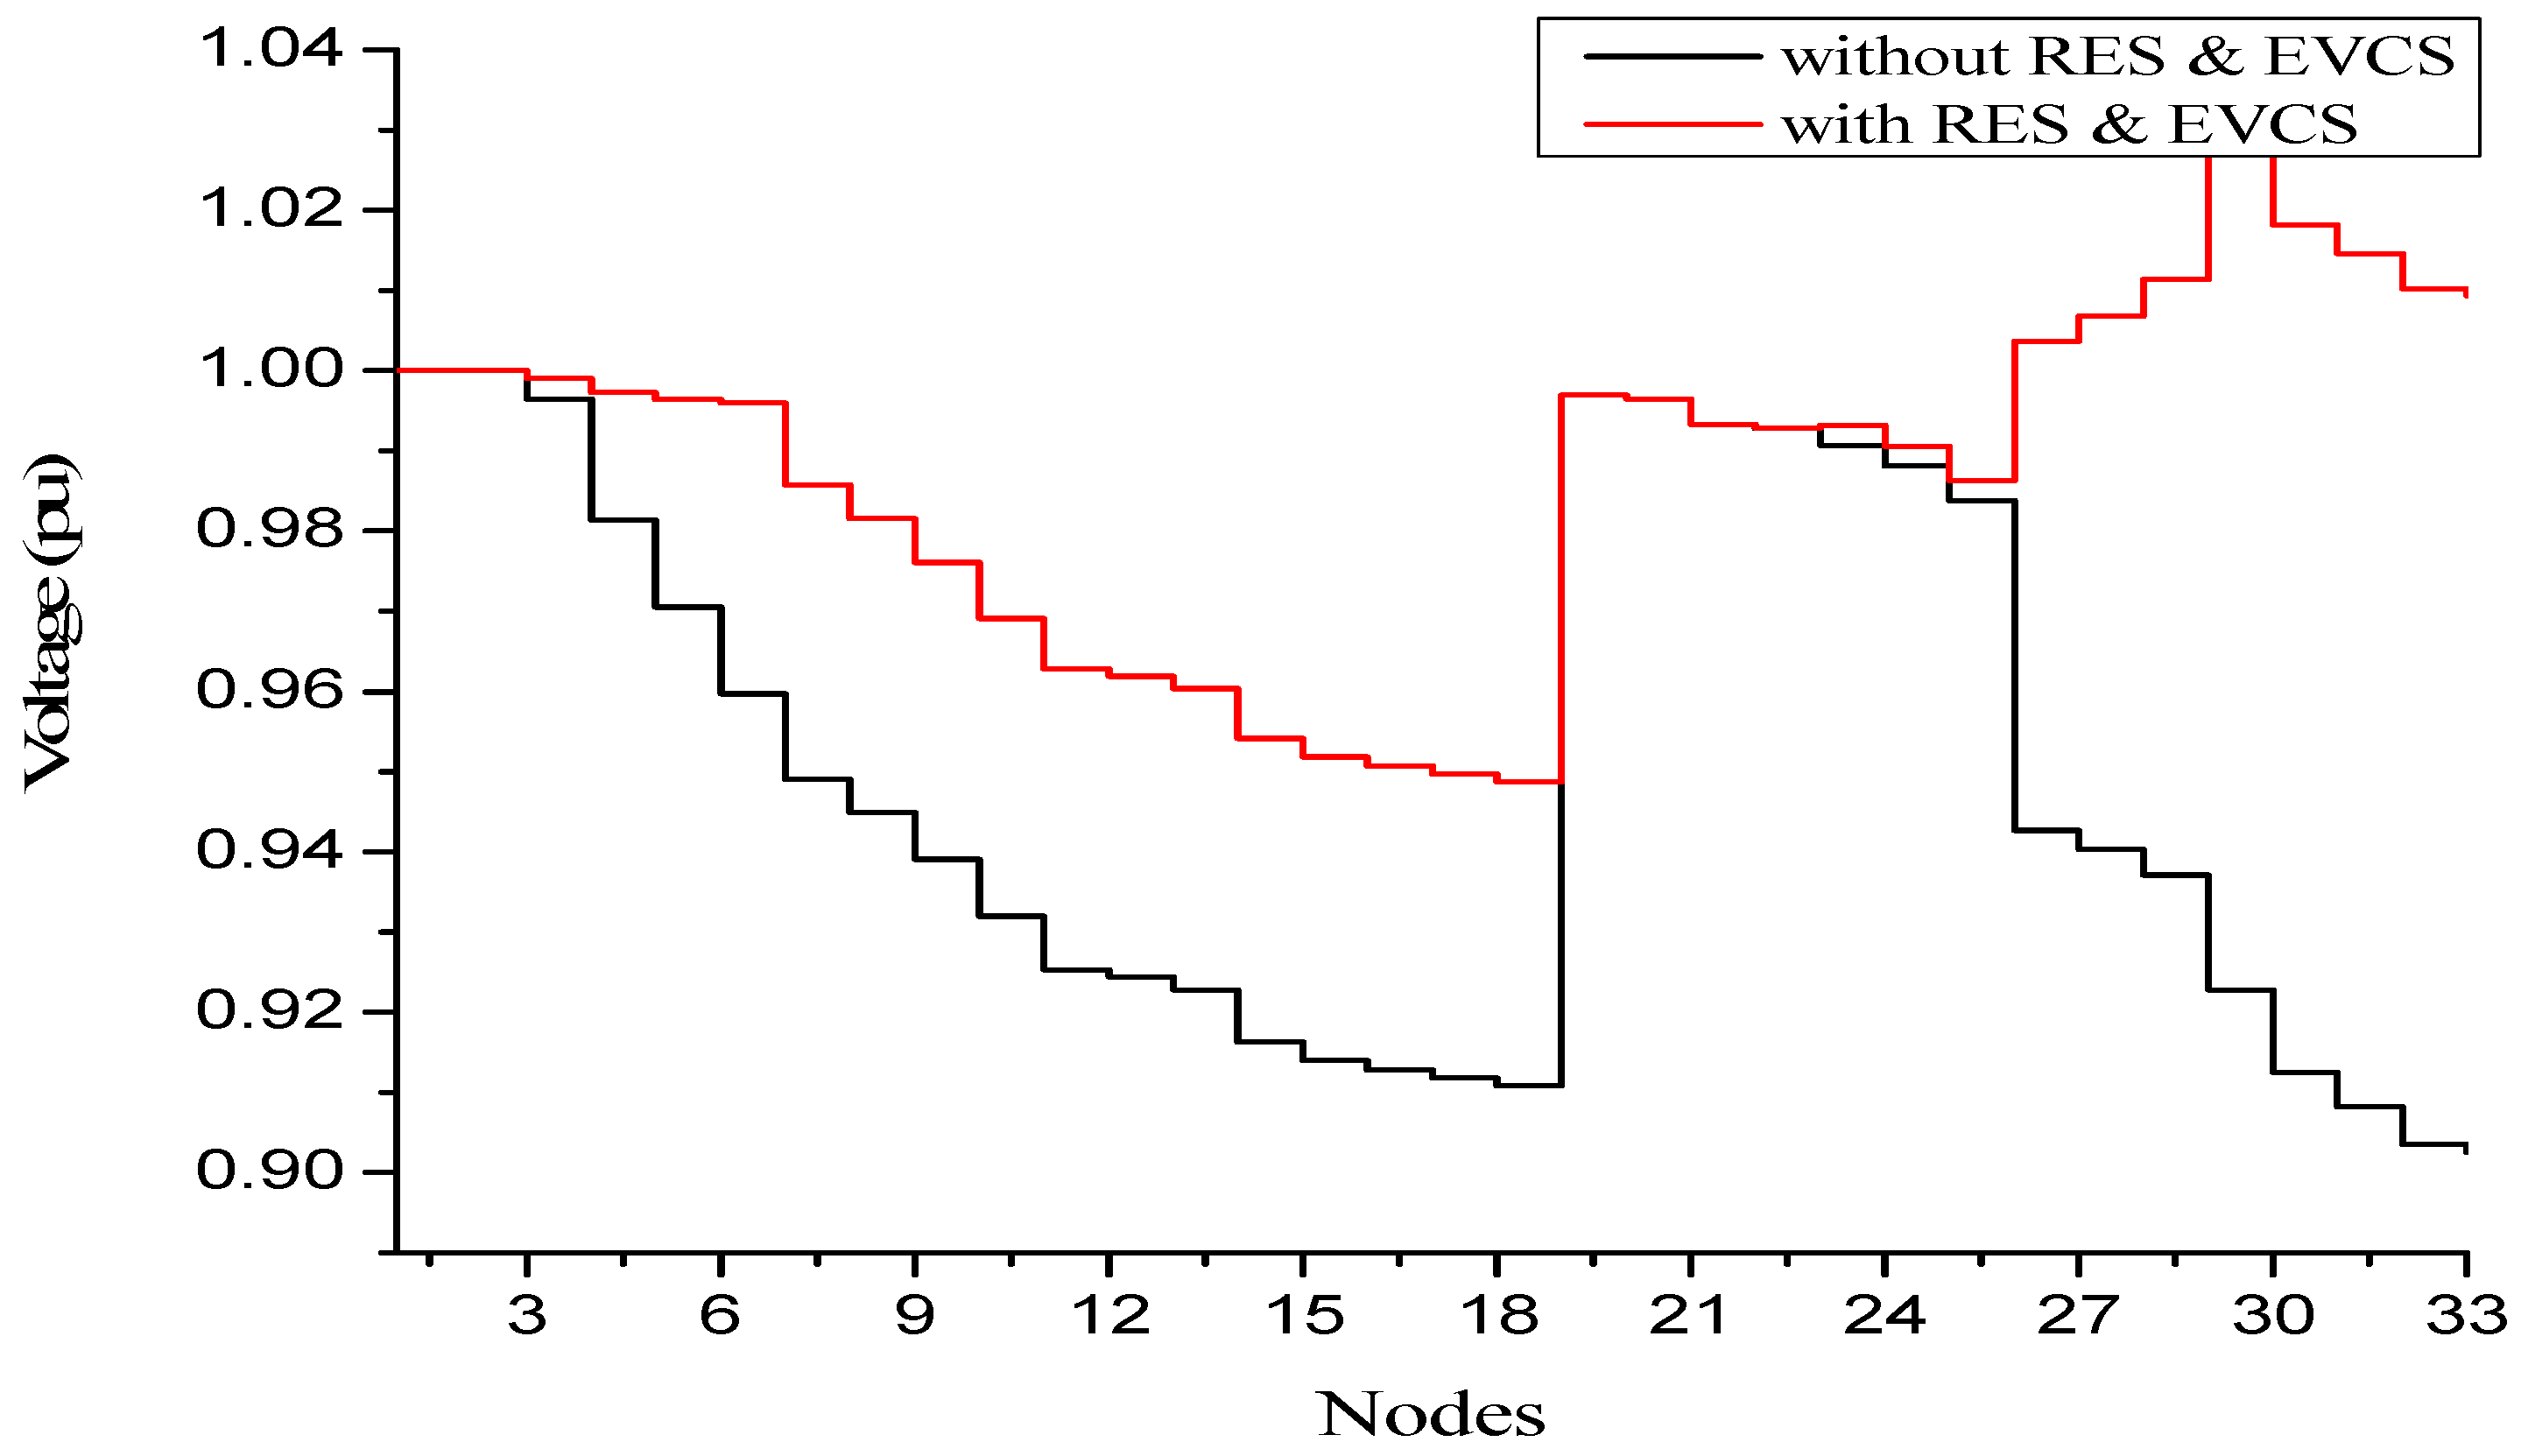
The total capacity of the grid is 3710 kVA. The total capacity of RES at node 28 is 2891.56 kVA and the total capacity of EVCS at node 9 is 663.9 kVA; the summation of both is 355.46 kVA less than the total installed capacity. In this case, we integrate both the minimum voltage 0.973 and the maximum voltage 1.03, as shown in Figure 10. Total active power losses are 179.02 and total reactive power losses are 128.88 kVAr.
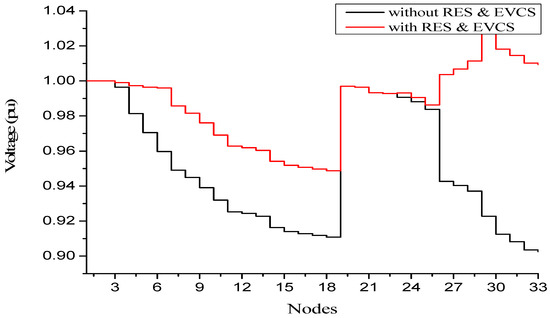
Figure 10.
Voltage with and without RES and EVCS.
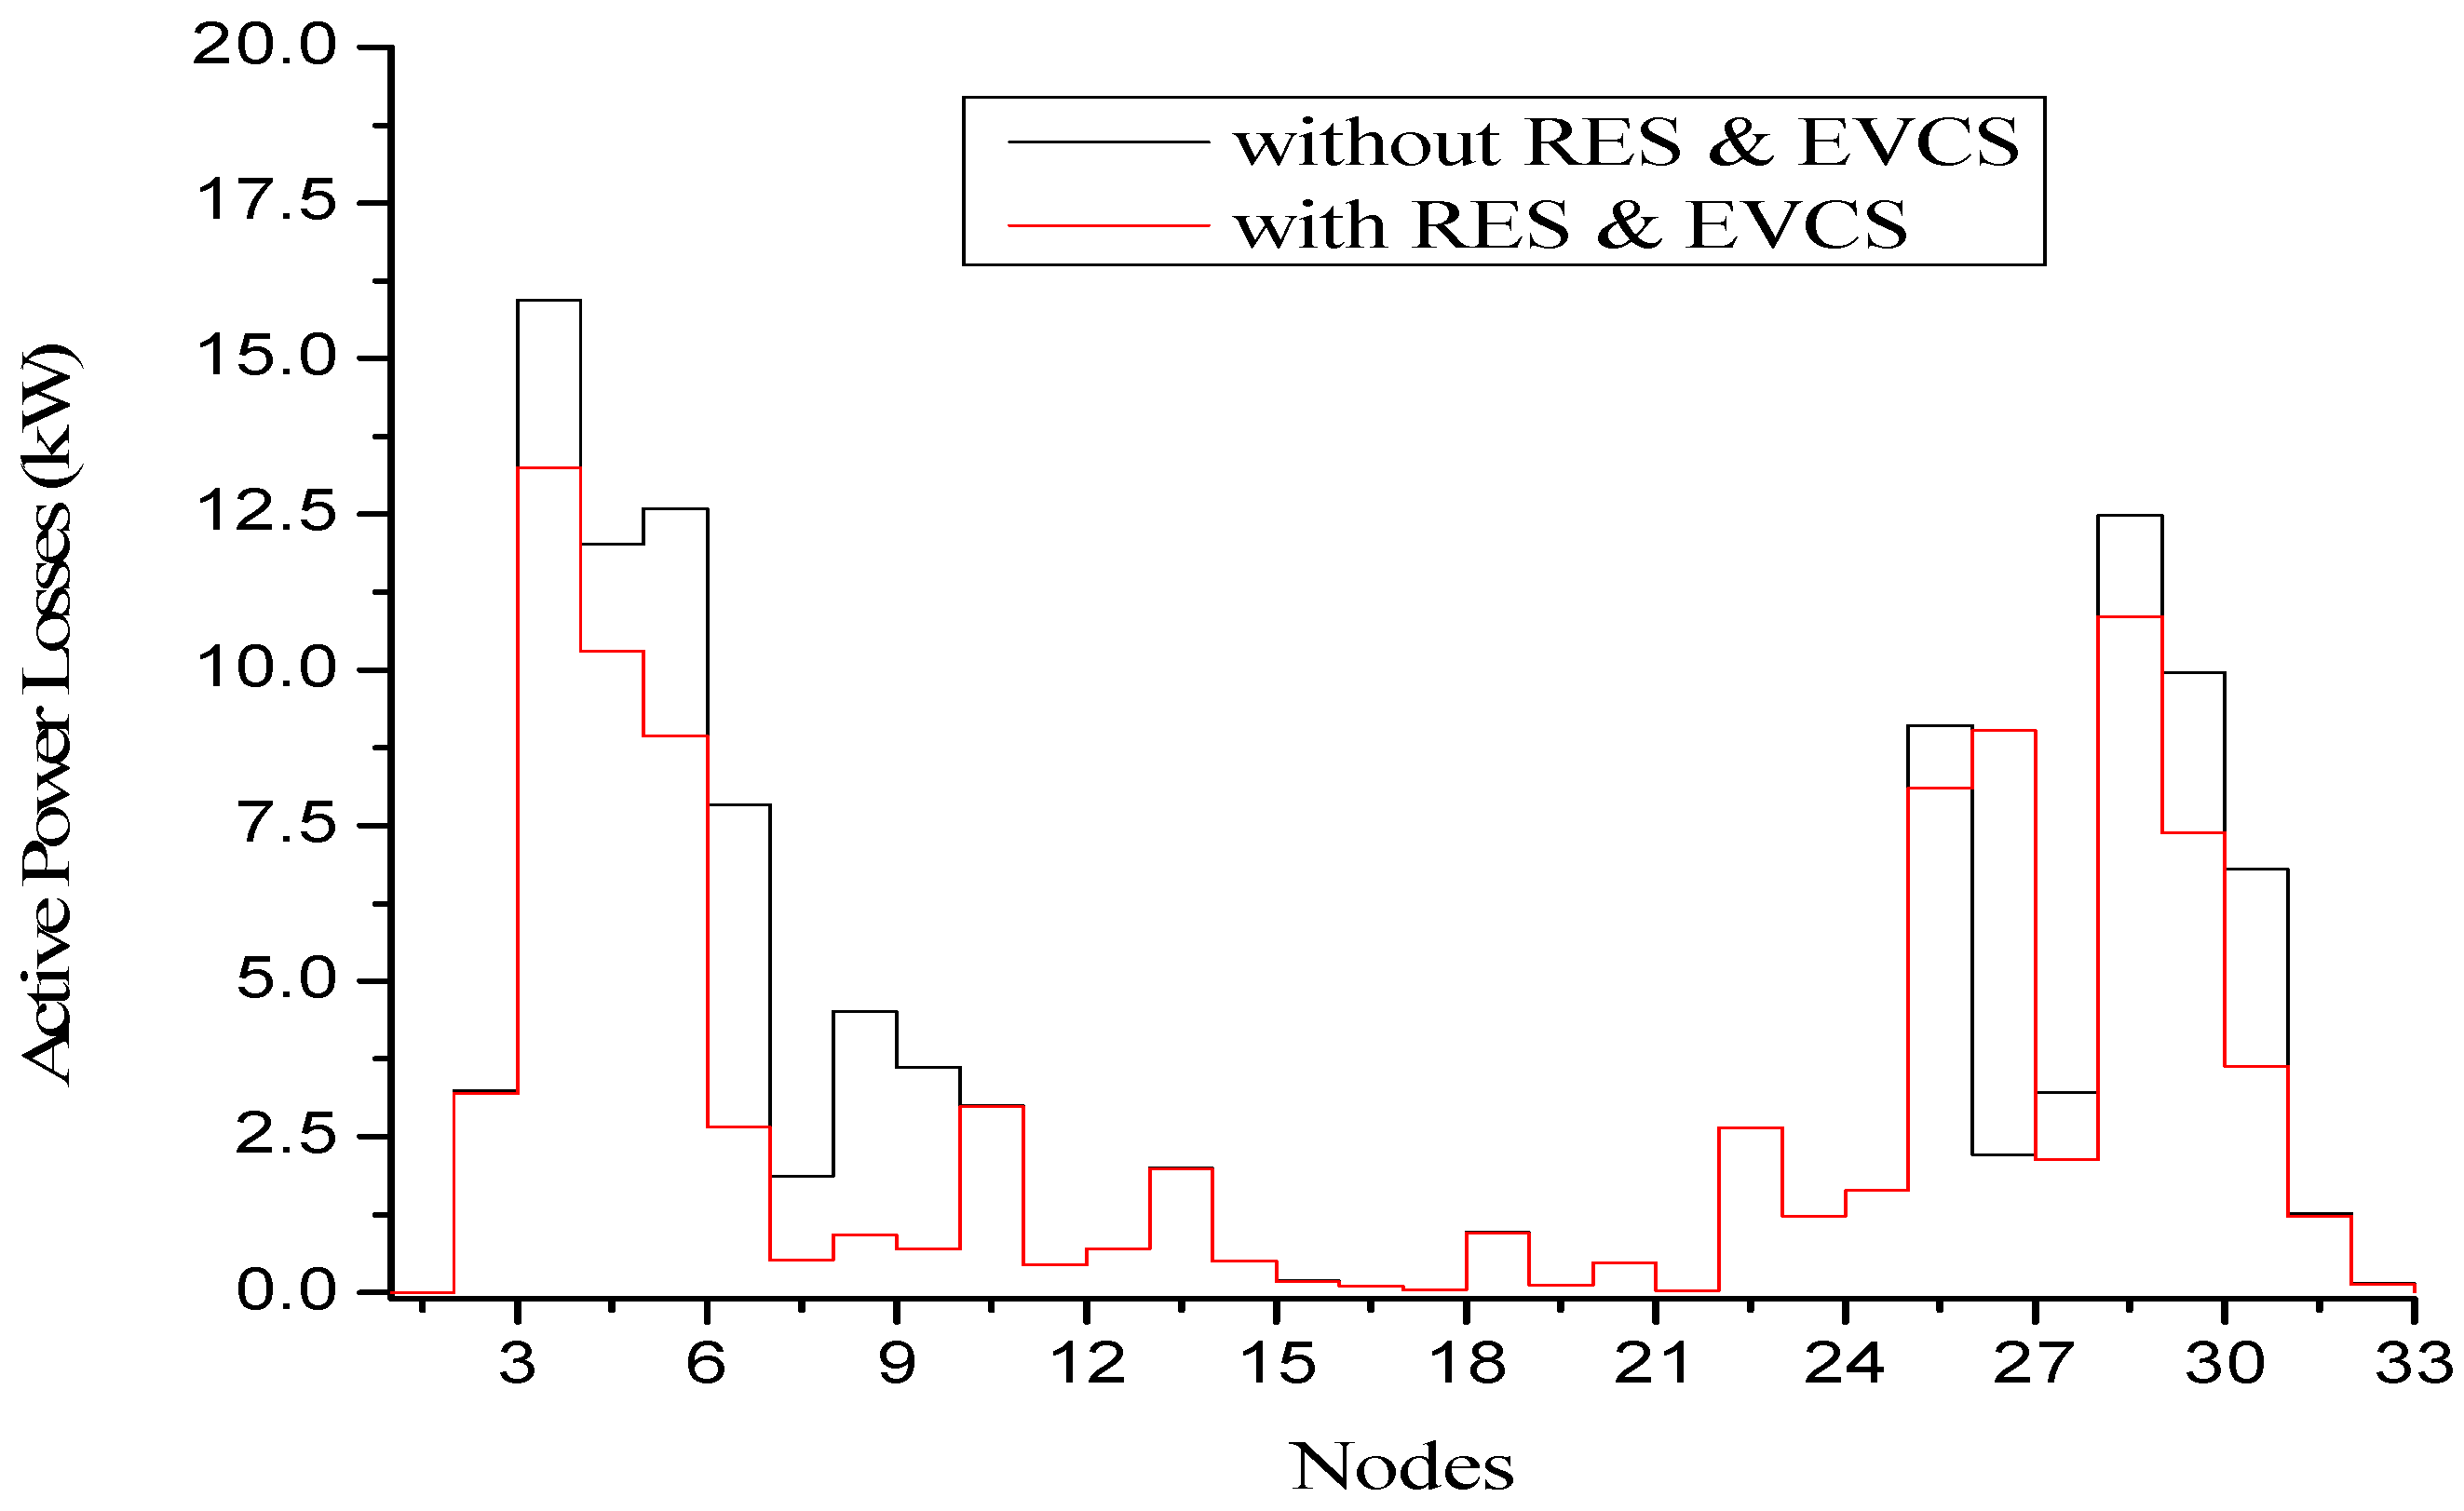
The total capacity of the grid is 3710 kVA. The total capacity of RES at 28 node is 2891.56 kVA and the total capacity of EVCS at node 9 is 663.9 kVA; the summation of both is 355.46 kVA less than the total installed capacity. Total active power losses are 108.88 kW in this case. Figure 11 shows the active power losses integration with and without RES and EVCS; it can be seen that after integration with EVCS capacity, it is less than the installed capacity.
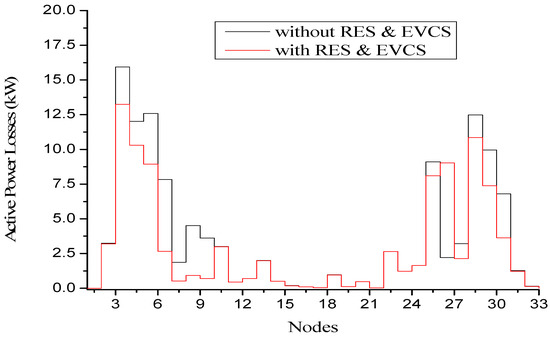
Figure 11.
Active power losses with and without the integration of RES and EVCS.
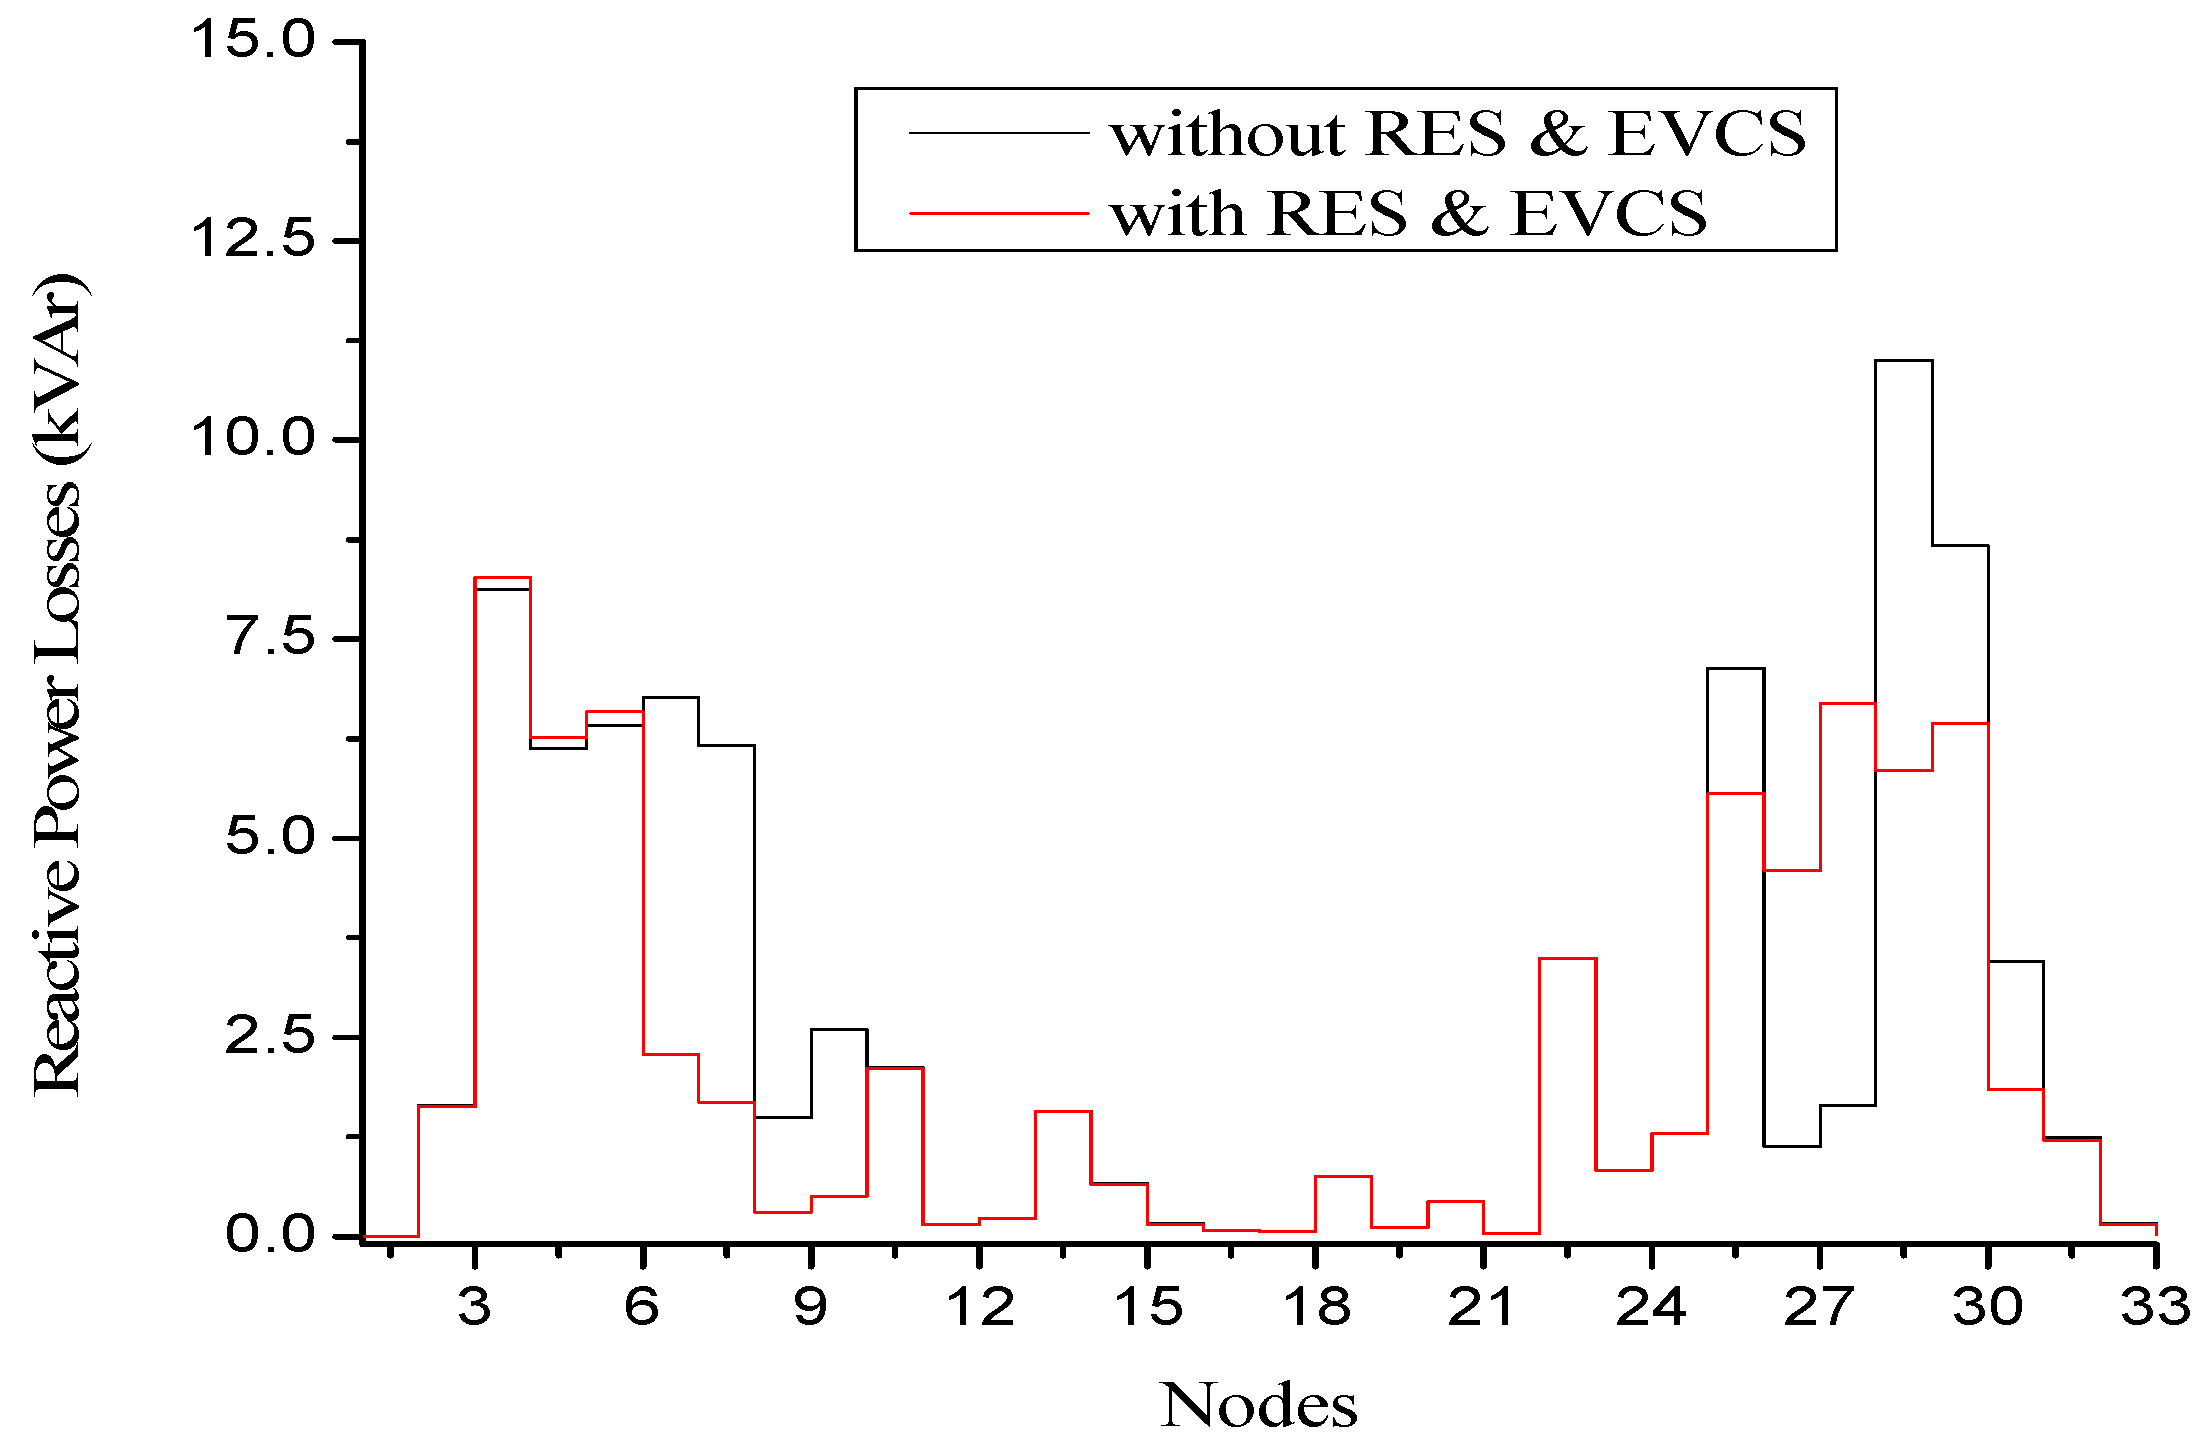
Total reactive power losses are 103.88 kVAr in this case. Figure 12 shows the reactive power losses integration with and without RES and EVCS; it can be seen that after integration with EVCS capacity, it is less than the installed capacity.

Figure 12.
Reactive power losses with and without the integration of RES and EVCS.
Table 3 presents the comparison of parameters with and without the integration of RES and EVCS and clearly shows how the losses were reduced, the voltage profile was improved, and the capacity after integration was less than the total capacity.
Table 3.
Comparison of parameters with and without RES and EVCS.
6.5. Comparative Analysis
- ▪
- A fuzzy logic approach is used for size identification at each node and a genetic algorithm is used for optimal location identification. The first step is to integrate RES to the IEEE 33 node radial distribution network. In the second case, EVCS is integrated into an IEEE 33 node radial distribution network. In the third case, both RES and EVCS are integrated in hybrid mode with IEEE 33 node radial distribution network and the results of all three networks compared.
- ▪
- The voltage profile improved from 0.90 pu without RES and EVCS to 0.94 pu with RES at node 28, 4.44%; 0.911 pu with EVCS at node 9 improved by 1.11% and 0.97 pu with RES and EVCS in hybrid mode improved by 7.77% at nodes 9 and 28.
- ▪
- Active power losses reduced from 217.48 kW without RES and EVCS to 195.35 kW with RES reduced by 10.17%, 160.62 kW with EVCS reduced by 26.14%, and 108.88 kW with RES and EVCS reduced by 49.93%.
- ▪
- Reactive power losses are reduced from 141.34 kVAr without RES and EVCS to 116.095 kVAr with RES reduced by 17.85%, 104.98 kVAr with EVCS reduced by 25.72%, and 103.88 kVAr with RES and EVCS reduced by 23.67% at nodes 9 and 28.
The abovementioned three cases are presented in Table 4. The table shows the comparison of the parameters before and after the integrations of RES and EVCS, both individually and in combination.
Table 4.
Comparison of parameters with RES and EVCS and without RES and EVCS.
7. Discussion
High active and reactive power losses at the distribution end are the problem to mitigate. Integration of RES near load centers with suitable size and location reduces the active and reactive losses, but not much as the generation is dependent upon the weather constraints. The inclusion of e-Vehicles as an energy storage mechanism and supply mechanism during peak hours reduces the active and reactive power losses and maintains the voltage profile of the test system with the identification of a suitable size and location to integrate. In article [32], DERs are integrated into the grid using four different approaches: modified novel (MN) method, power loss sensitivity (PLS) method, voltage sensitivity analysis (VSA), and fuzzy logic approach and game theory (FLA-GT) method, which are shown in Table 5. The results of the literature paper suggest that the maximum reduction in active and reactive power losses and stable voltage profiles are achieved by the fuzzy logic and game theory method. Using that method, active and reactive power losses are reduced by 47.44% and 22.34%, respectively, and the voltage profile is improved by 7.27%. In the proposed method of this paper using fuzzy logic and genetic algorithm, active and reactive power losses for hybrid integration of DER and EVCS reduced by 49.93% and 23.67%, respectively, and the voltage profile improving by 7.77% shows the effectiveness of the results. The results suggest that the reduction in active and reactive power losses and voltage profile is improved within the defined constraints.
Table 5.
Results of article [32] used for comparisons.
8. Conclusions
In this paper, the optimal location and capacity of RES and EVCS to integrate with the IEEE 33 node radial distribution network is investigated with three case studies. In the first case, only RESs were integrated into the grid. In the second case, only EVCSs were integrated into the grid. In the third case, both RES and EVCS were integrated into a hybrid model. The optimal location was identified using a genetic algorithm and optimal capacity was identified using the fuzzy logic approach. Simulation results performed on the test system suggested that the voltage magnitude in all three cases improved and the active and reactive power losses reduced. In hybrid integration, voltage magnitude is maximum and active and reactive power losses are minimum. In future work, the stability and reliability assessment of RES and EVCS integration may be performed on a practical system.
Author Contributions
Conceptualization, H.A. (Himanshi Agrawal) and A.T.; methodology, A.G., A.S. and H.A. (Hashem Alyami); validation, W.A. and A.S.; formal analysis, H.A. (Hashem Alyami) and A.O.-M.; investigation, W.A. and A.O.-M.; resources, W.A. and A.G.; data curation, A.S. and H.A. (Hashem Alyami); writing—original draft preparation, H.A. (Himanshi Agrawal), A.T. and A.G. All authors have read and agreed to the published version of the manuscript.
Funding
This research was funded by Researchers Supporting Project number (TURSP-2020/306), Taif University, Taif, Saudi Arabia.
Data Availability Statement
Not applicable.
Acknowledgments
This research was supported by Taif University Researchers Supporting Project number (TURSP-2020/306), Taif University, Taif, Saudi Arabia.
Conflicts of Interest
The authors declare no conflict of interest.
References
- Talwariya, A.; Singh, P.; Kolhe, M.L. Stackelberg Game Theory Based Energy Management Systems in the Presence of Renewable Energy Sources. IETE J. Res. 2021, 67, 611–619. [Google Scholar] [CrossRef]
- Xu, Y.; Zheng, Y.; Yang, Y. On the movement simulations of E-Vehicles: A behavioral model-based approach. Appl. Energy 2021, 283, 116356. [Google Scholar] [CrossRef]
- Wang, T.; Luo, H.; Zeng, X.; Yu, Z.; Liu, A.; Sangaiah, A.K. Mobility based trust evaluation for heterogeneous E-Vehicles network in smart cities. IEEE Trans. Intell. Transp. Syst. 2020, 22, 1797–1806. [Google Scholar] [CrossRef]
- Zhang, Y.; Wang, J.; Li, Z. Uncertainty modeling of distributed energy resources: Techniques and challenges. Curr. Sustain. Renew. Energy Rep. 2019, 6, 42–51. [Google Scholar] [CrossRef]
- Burger, S.P.; Luke, M. Business models for distributed energy resources: A review and empirical analysis. Energy Policy 2017, 109, 230–248. [Google Scholar] [CrossRef]
- Mahmud, K.; Khan, B.; Ravishankar, J.; Ahmadi, A.; Siano, P. An internet of energy framework with distributed energy resources, prosumers and small-scale virtual power plants: An overview. Renew. Sustain. Energy Rev. 2020, 127, 109840. [Google Scholar] [CrossRef]
- Paglia, E.; Parker, C. The intergovernmental panel on climate change: Guardian of climate science. In Guardians of Public Value; Palgrave Macmillan: Cham, Switzerland, 2021; pp. 295–321. [Google Scholar]
- He, W.; Tao, L.; Han, L.; Sun, Y.; Campana, P.E.; Yan, J. Optimal analysis of a hybrid renewable power system for a remote island. Renew. Energy 2021, 179, 96–104. [Google Scholar] [CrossRef]
- Boretti, A.; Castelletto, S. Cost and performance of CSP and PV plants of capacity above 100 MW operating in the United States of America. Renew. Energy Focus 2021, 39, 90–98. [Google Scholar] [CrossRef]
- Alves, O.; Calado, L.; Panizio, R.M.; Gonçalves, M.; Monteiro, E.; Brito, P. Techno-economic study for a gasification plant processing residues of sewage sludge and solid recovered fuels. Waste Manag. 2021, 131, 148–162. [Google Scholar] [CrossRef]
- Alsharif, A.; Tan, C.W.; Ayop, R.; Dobi, A.; Lau, K.Y. A comprehensive review of energy management strategy in Vehicle-to-Grid technology integrated with renewable energy sources. Sustain. Energy Technol. Assess. 2021, 47, 101439. [Google Scholar] [CrossRef]
- Ouramdane, O.; Elbouchikhi, E.; Amirat, Y.; Gooya, E.S. Optimal Sizing and Energy Management of Microgrids with Vehicle-to-Grid Technology: A Critical Review and Future Trends. Energies 2021, 14, 4166. [Google Scholar] [CrossRef]
- Huang, B.; Meijssen, A.G.; Annema, J.A.; Lukszo, Z. Are electric vehicle drivers willing to participate in vehicle-to-grid contracts? A context-dependent stated choice experiment. Energy Policy 2021, 156, 112410. [Google Scholar] [CrossRef]
- Bibak, B.; Tekiner-Moğulkoç, H. A comprehensive analysis of Vehicle to Grid (V2G) systems and scholarly literature on the application of such systems. Renew. Energy Focus 2021, 36, 1–20. [Google Scholar] [CrossRef]
- Rolán, A.; Bogarra, S.; Bakkar, M. Integration of Distributed Energy Resources to Unbalanced Grids under Voltage Sags with Grid Code Compliance. IEEE Trans. Smart Grid 2021, 13, 355–366. [Google Scholar] [CrossRef]
- Gill, A.; Singh, P. Optimal penetration of distributed generation system in radial distribution network using adaptive scheme. J. Phys. Conf. Ser. 2021, 1914, 012027. [Google Scholar] [CrossRef]
- Hadingham, W.; Rayney, K.; Blaver, A.; Smart, B.; Thomas, J. Distributed Energy Resources Roadmap: How the State of Western Australia Is Leading in Integration. In IEEE Power and Energy Magazine; 20 August 2021; Volume 19, pp. 76–88. [Google Scholar]
- Talwariya, A.; Singh, P.; Kolhe, M. A stepwise power tariff model with game theory based on Monte-Carlo simulation and its applications for household, agricultural, commercial and industrial consumers. Int. J. Electr. Power Energy Syst. 2019, 111, 14–24. [Google Scholar] [CrossRef]
- Rao, S.S. Engineering Optimization: Theory and Practice, 3rd ed.; Wiley-Inter Science: New York, NY, USA, 1996. [Google Scholar]
- Lalitha, M.P. Application of Fuzzy and ABC Algorithm for DER Placement for Minimum Loss in Radial Distribution System. Iran. J. Electr. Electron. Eng. 2010, 6, 248–257. [Google Scholar]
- Kumawat, A.; Choudhary, R.; Singh, P. Optimal Placement of DER and Capacitor for Minimizing the Power Losses using Genetic Algorithm. Int. Res. J. Eng. Technol. 2015, 2, 2306–2309. [Google Scholar]
- Della Marca, R.; d’Onofrio, A. Volatile opinions and optimal control of vaccine awareness campaigns: Chaotic behaviour of the forward-backward sweep algorithm vs. heuristic direct optimization. Commun. Nonlinear Sci. Numer. Simul. 2021, 98, 105768. [Google Scholar] [CrossRef]
- Hota, A.P.; Mishra, S. A forward-backward sweep based numerical approach for active power loss allocation of radial distribution network with distributed generations. Int. J. Numer. Model. Electron. Netw. Devices Fields 2021, 34, e2788. [Google Scholar]
- Abu-Mouti, F.S.; El-Hawary, M.E. Optimal Distributed Generation Allocation and Sizing in Distribution Systems via Artificial Bee Colony Algorithm. IEEE Trans. Power Deliv. 2011, 26, 2090–2101. [Google Scholar] [CrossRef]
- Gill, A.; Choudhary, A.; Bali, H. Renewable Distributed Generations Optimal Penetration in the Distribution Network for Clean and Green Energy. Asian J. Water Environ. Pollut. 2021, 18, 37–43. [Google Scholar] [CrossRef]
- Naik, S.N.G.; Khatod, D.K.; Sharma, M.P. Analytical approach for optimal siting and sizing of distributed generation in radial distribution networks. IET Gener. Transm. Distrib. 2015, 9, 209–220. [Google Scholar] [CrossRef]
- Rialland, R.; Carrère, V.; Marion, R.; Soussen, C. Identification of minerals from hyperspectral imaging based on a fuzzy logic approach. In Proceedings of the Algorithms, Technologies, and Applications for Multispectral and Hyperspectral Imaging XXVII, online, 12–16 April 2021; International Society for Optics and Photonics: Bellingham, WA, USA, 2021; Volume 11727. [Google Scholar]
- Thakare, V.R. Computational trust evaluation algorithm for cloud models using fuzzy logic approach. Int. J. Ad Hoc Ubiquitous Comput. 2021, 38, 127–140. [Google Scholar] [CrossRef]
- Talwariya, A.; Singh, P. Optimization of distribution networks with integration of distributed generators using cooperative Game Theory. Int. J. Power Energy Syst. 2019, 39, 1–7. [Google Scholar] [CrossRef]
- Wan, S.; Liang, X.; Jiang, H.; Sun, J.; Djilali, N.; Zhao, T. A coupled machine learning and genetic algorithm approach to the design of porous electrodes for redox flow batteries. Appl. Energy 2021, 298, 117177. [Google Scholar] [CrossRef]
- Park, J.S.; Ng, H.Y.; Chua, T.J.; Ng, Y.T.; Kim, J.W. Unified genetic algorithm approach for solving flexible job-shop scheduling problem. Appl. Sci. 2011, 11, 6454. [Google Scholar] [CrossRef]
- Talwariya, A.; Singh, P.; Kolhe, M.L.; Jobanputra, J.H. Fuzzy logic controller and game theory based distributed energy resources allocation. AIMS Energy 2020, 8, 474–492. [Google Scholar] [CrossRef]

Publisher’s Note: MDPI stays neutral with regard to jurisdictional claims in published maps and institutional affiliations. |
© 2022 by the authors. Licensee MDPI, Basel, Switzerland. This article is an open access article distributed under the terms and conditions of the Creative Commons Attribution (CC BY) license (https://creativecommons.org/licenses/by/4.0/).