Article

Anti-Wind Experiments and Damage Prediction of Transmission Tower under Typhoon Conditions in Coastal Areas

Tsinghua Shenzhen International Graduate School, Tsinghua University, Shenzhen 518055, China
*
Author to whom correspondence should be addressed.
Energies 2022, 15(9), 3372; https://doi.org/10.3390/en15093372
Submission received: 16 March 2022 / Revised: 13 April 2022 / Accepted: 29 April 2022 / Published: 5 May 2022

Abstract

:
Typhoons are a serious threat to transmission towers and lines in coastal areas. The anti-wind performance of a transmission tower needs to be reinforced and optimized to avoid tower collapse. Here, an improved real-time wind-field mathematical model and a tower-line coupled simulation model were established to reproduce the wind field distribution, mechanical vibration, and interaction between the wind field and tower. The damage prediction of the transmission tower was analyzed. Furthermore, an actual scaled tower-line model was built, which was used to measure the acceleration and displacement responses in the anti-wind experiments. The research results show that the improved model is feasible and correct based on the verification of Typhoon Mujigae. The tower’s vibration response is mainly characterized by low frequencies, whereas the lines indicate a high frequency response. The transmission line has a remarkable impact on tower vibrations in high turbulence. A flow direction angle of 50° and a long span are dangerous conditions for transmission systems in coastal regions. The acceleration and displacement responses of the main bars show opposite trends to that of the auxiliary cross-bars. The contribution of this article is the possibility of tower collapse prediction and prevention.

1. Introduction

Typhoon is a very dangerous weather that may cause a tower collapse for the transmission system in coastal area [1,2,3]. In 2015, the super typhoon “Mujigae” damaged 80 towers, impacting thousands of transmission lines, as shown in Figure 1. Due to the high-rise structure of transmission towers, which are sensitive to strong wind, it requires highly-reliable, anti-wind ability for the transmission tower to keep itself stable and ensure normal power system operations, especially in the coastal area. Therefore, it is important to further research the mechanical properties of the transmission towers and lines, aiming to strengthen towers’ anti-wind performance, as well as providing an early warning for tower collapse.
The main causes for tower collapse include the high-rise structure of the tower, the pull-drag force of lines, and the strong turbulence of a typhoon [4,5,6]. By now, some studies just focus on the typhoon wind field distribution and tower’s vibration.
Some wind-field simulation models, such as Batts, Shapiro, CE, and Yanmeng wind-field model have been developed in the last 40 years. Batts model was a first generation typhoon wind-field simulation model proposed by Martin E. Batts in 1980, while this simple model ignored the effect of ground surface friction [7]. The Shapiro model calculated the wind-field based on the momentum balance equation of airflow and considered the typhoon’s asymmetric boundary [8]. The CE model, adopted by the US navy, used the N-S fluid dynamic equation and took ground surface into consideration [9]. The Yanmeng model took advantage of Holland’s pressure model to simulate pressure gradient and calculate wind field distribution; meanwhile, the Yanmeng model also took into account the friction effect of ground surface [10,11]. In China, some scholars summarized the historical typhoon data in the southeast coastal area, and compared it with the former wind-field simulation models [12,13]. It showed that the Yanmeng wind field using Holland pressure had the smallest error in simulating extreme wind speed of a typhoon. Regarding the tower’s vibration, Battista established a simulation model of three towers and two lines, and studied the stability and vibration characteristics of the model under normal wind [14]. Wu Xinqiao tested the wind vibration response of a single tower by installing an acceleration sensor at the tower body [15]. Other research mostly used the discrete stiffness method to simulate the stiffness of each part of the tower on the premise of the Cauchy number criterion [16,17,18].
However, few studies focus on the anti-wind experiments of the tower-line coupled model in various conditions of wind speeds, wind directions and turbulence; meanwhile, the mechanical properties in real-time and frequency aspect are needed to predict tower damage condition.
Here, the improved real-time wind field calculation method and tower-line coupled simulation, as well as the anti-wind experiments are investigated. The special contributions of this paper are that: the surface roughness is two-dimensional refined according to the complex coastal landform, and the cyclone attenuation coefficient is optimized to reproduce typhoon field distribution well; furthermore, an actual scale model of transmission towers and lines are developed to conduct anti-wind experiments. The rest is organized as follows. Section 2 proposes the typhoon mathematical model and ANSYS simulation model. Section 3 analyzes the simulation results and tower damage prediction. The actual anti-wind experiments are conducted in Section 4. Finally, we conclude this article in Section 5.

2. Simulation Model

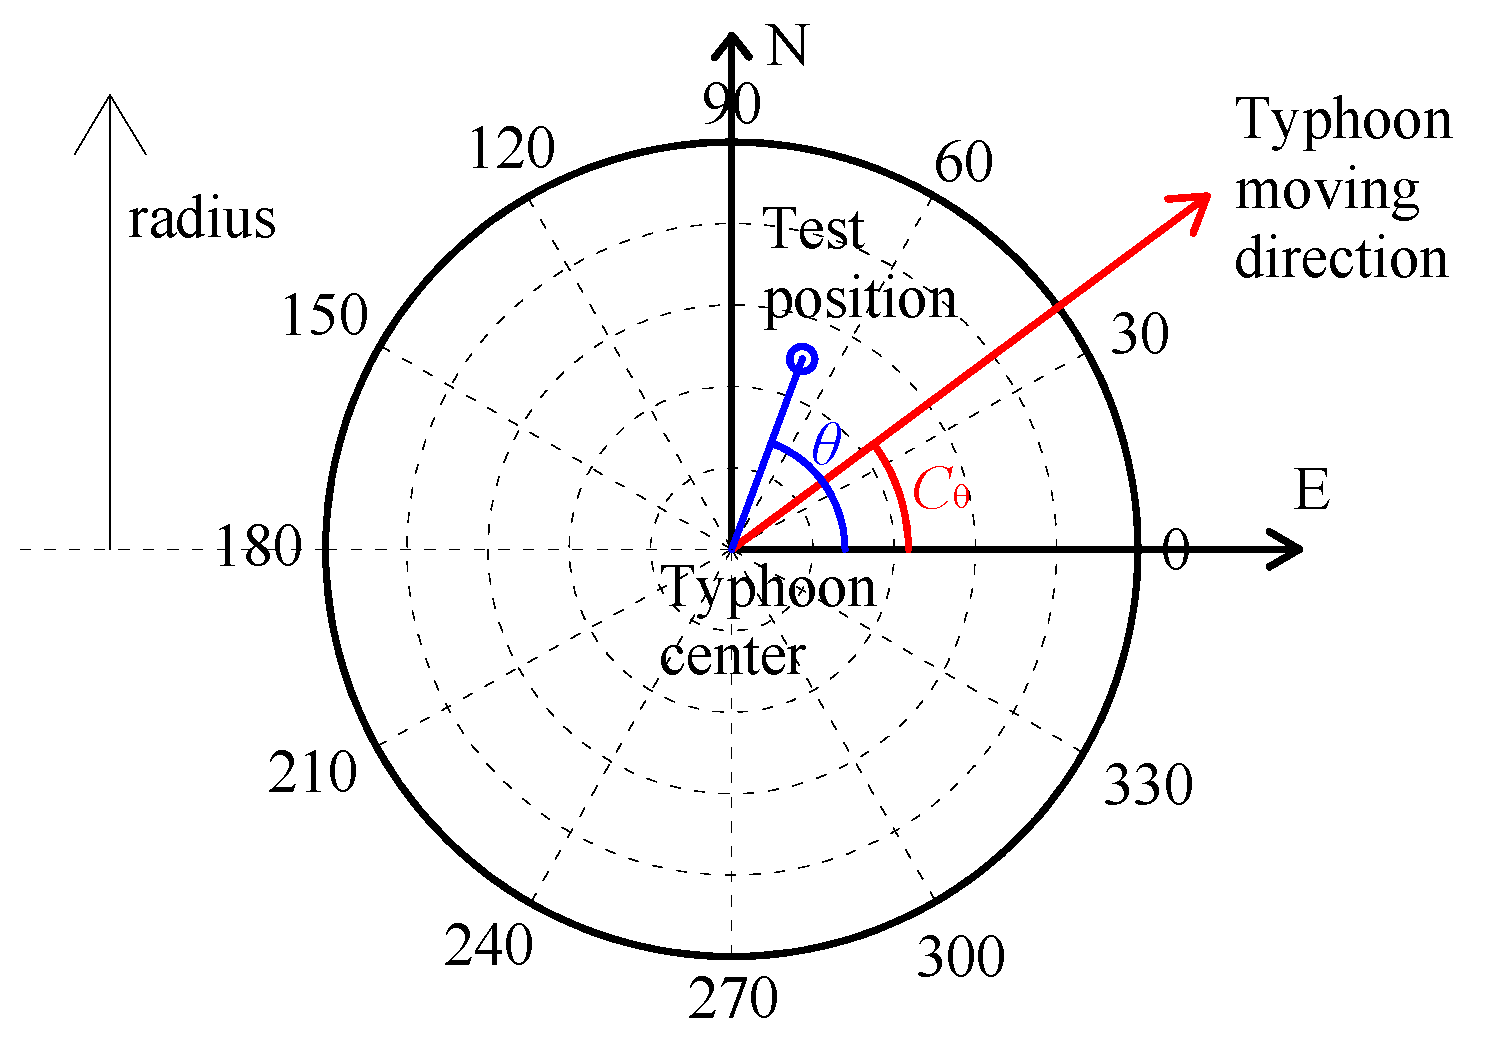
2.1. Real-Time Wind Field Mathematical Model

The real-time distribution of typhoon wind fields, whose characteristic is super high turbulence, is considerably different from normal strong wind. The Yanmeng wind field model is a better model for calculating the wind field distribution in complicated coastal areas. Based on Holland’s atmospheric pressure model, and the surface friction of the ground, as well as considering the typical typhoon data from Guangdong Province in China to modify the formula of the radius of the maximum wind speed, the improved Yanmeng model can be expressed as [11,19]:
{ v t + v · v = P ρ f k × v + F P = P c + Δ P exp [ ( R m / r ) B ] R m = 0.0016 × r 2.14 ( V r V m ) 1.92
where v is the real-time wind speed. v is composed of the horizontal speed vf and the vertical gradient speed vg. ρ is the atmospheric density. P is the pressure of the region when the typhoon is coming. f is the Coriolis force. k is the fitting parameter. F is the surface friction and can be ignored when calculating the atmospheric pressure gradient. Pc is the pressure of the typhoon center. r is the radius. B is Holland’s coefficient. Vm and Vr are the maximum wind speed and the wind speed of radius r, respectively. Rm is the radius of the area covered by the maximum wind speed.
In the view of pulsed power excitation, the Von Karman power spectrum is adopted. The Von Karman expression regards the turbulence gradient as a constant. In fact, the turbulence tends to increase as the height rises. Therefore, the variation in the Von Karman spectrum intensity in the vertical direction needs to be added. The modified Von Karman power spectrum that can satisfactorily solve the pulsating wind speed is expressed as [20,21]:
{ S v ( f ) = 4.4 σ 2 L u v h ( i ) ( 1 + 70.8 f L u v h ( i ) ) 0.83 v i ( t ) = j = 1 i k = 1 N I z ( h ) I von | H ij ( ω jk ) | 2 Δ ω cos [ ω jk t φ ij ( ω ik ) + φ jk ]
where vh(i) is the average wind speed. σ is the variance of the pulsating wind speed. Lu is the turbulence integral length. f is the harmonic frequency. Iz(h) and Ivon are the turbulence intensities based on the actual measured data in reference [20] and the Von Karman power spectrum at the calculating point i under the same average wind speed, respectively.
The definition of the typhoon’s flow direction and polar coordinate are shown in Figure 2. In the calculation, the center of the typhoon is taken as the origin of the polar coordinate system. The flow direction angle is defined as the angle between the typhoon’s moving direction and the east direction.
To simulate the real-time distribution of the wind field, a calculation program is compiled in MATLAB software. The process is shown in Figure 3.

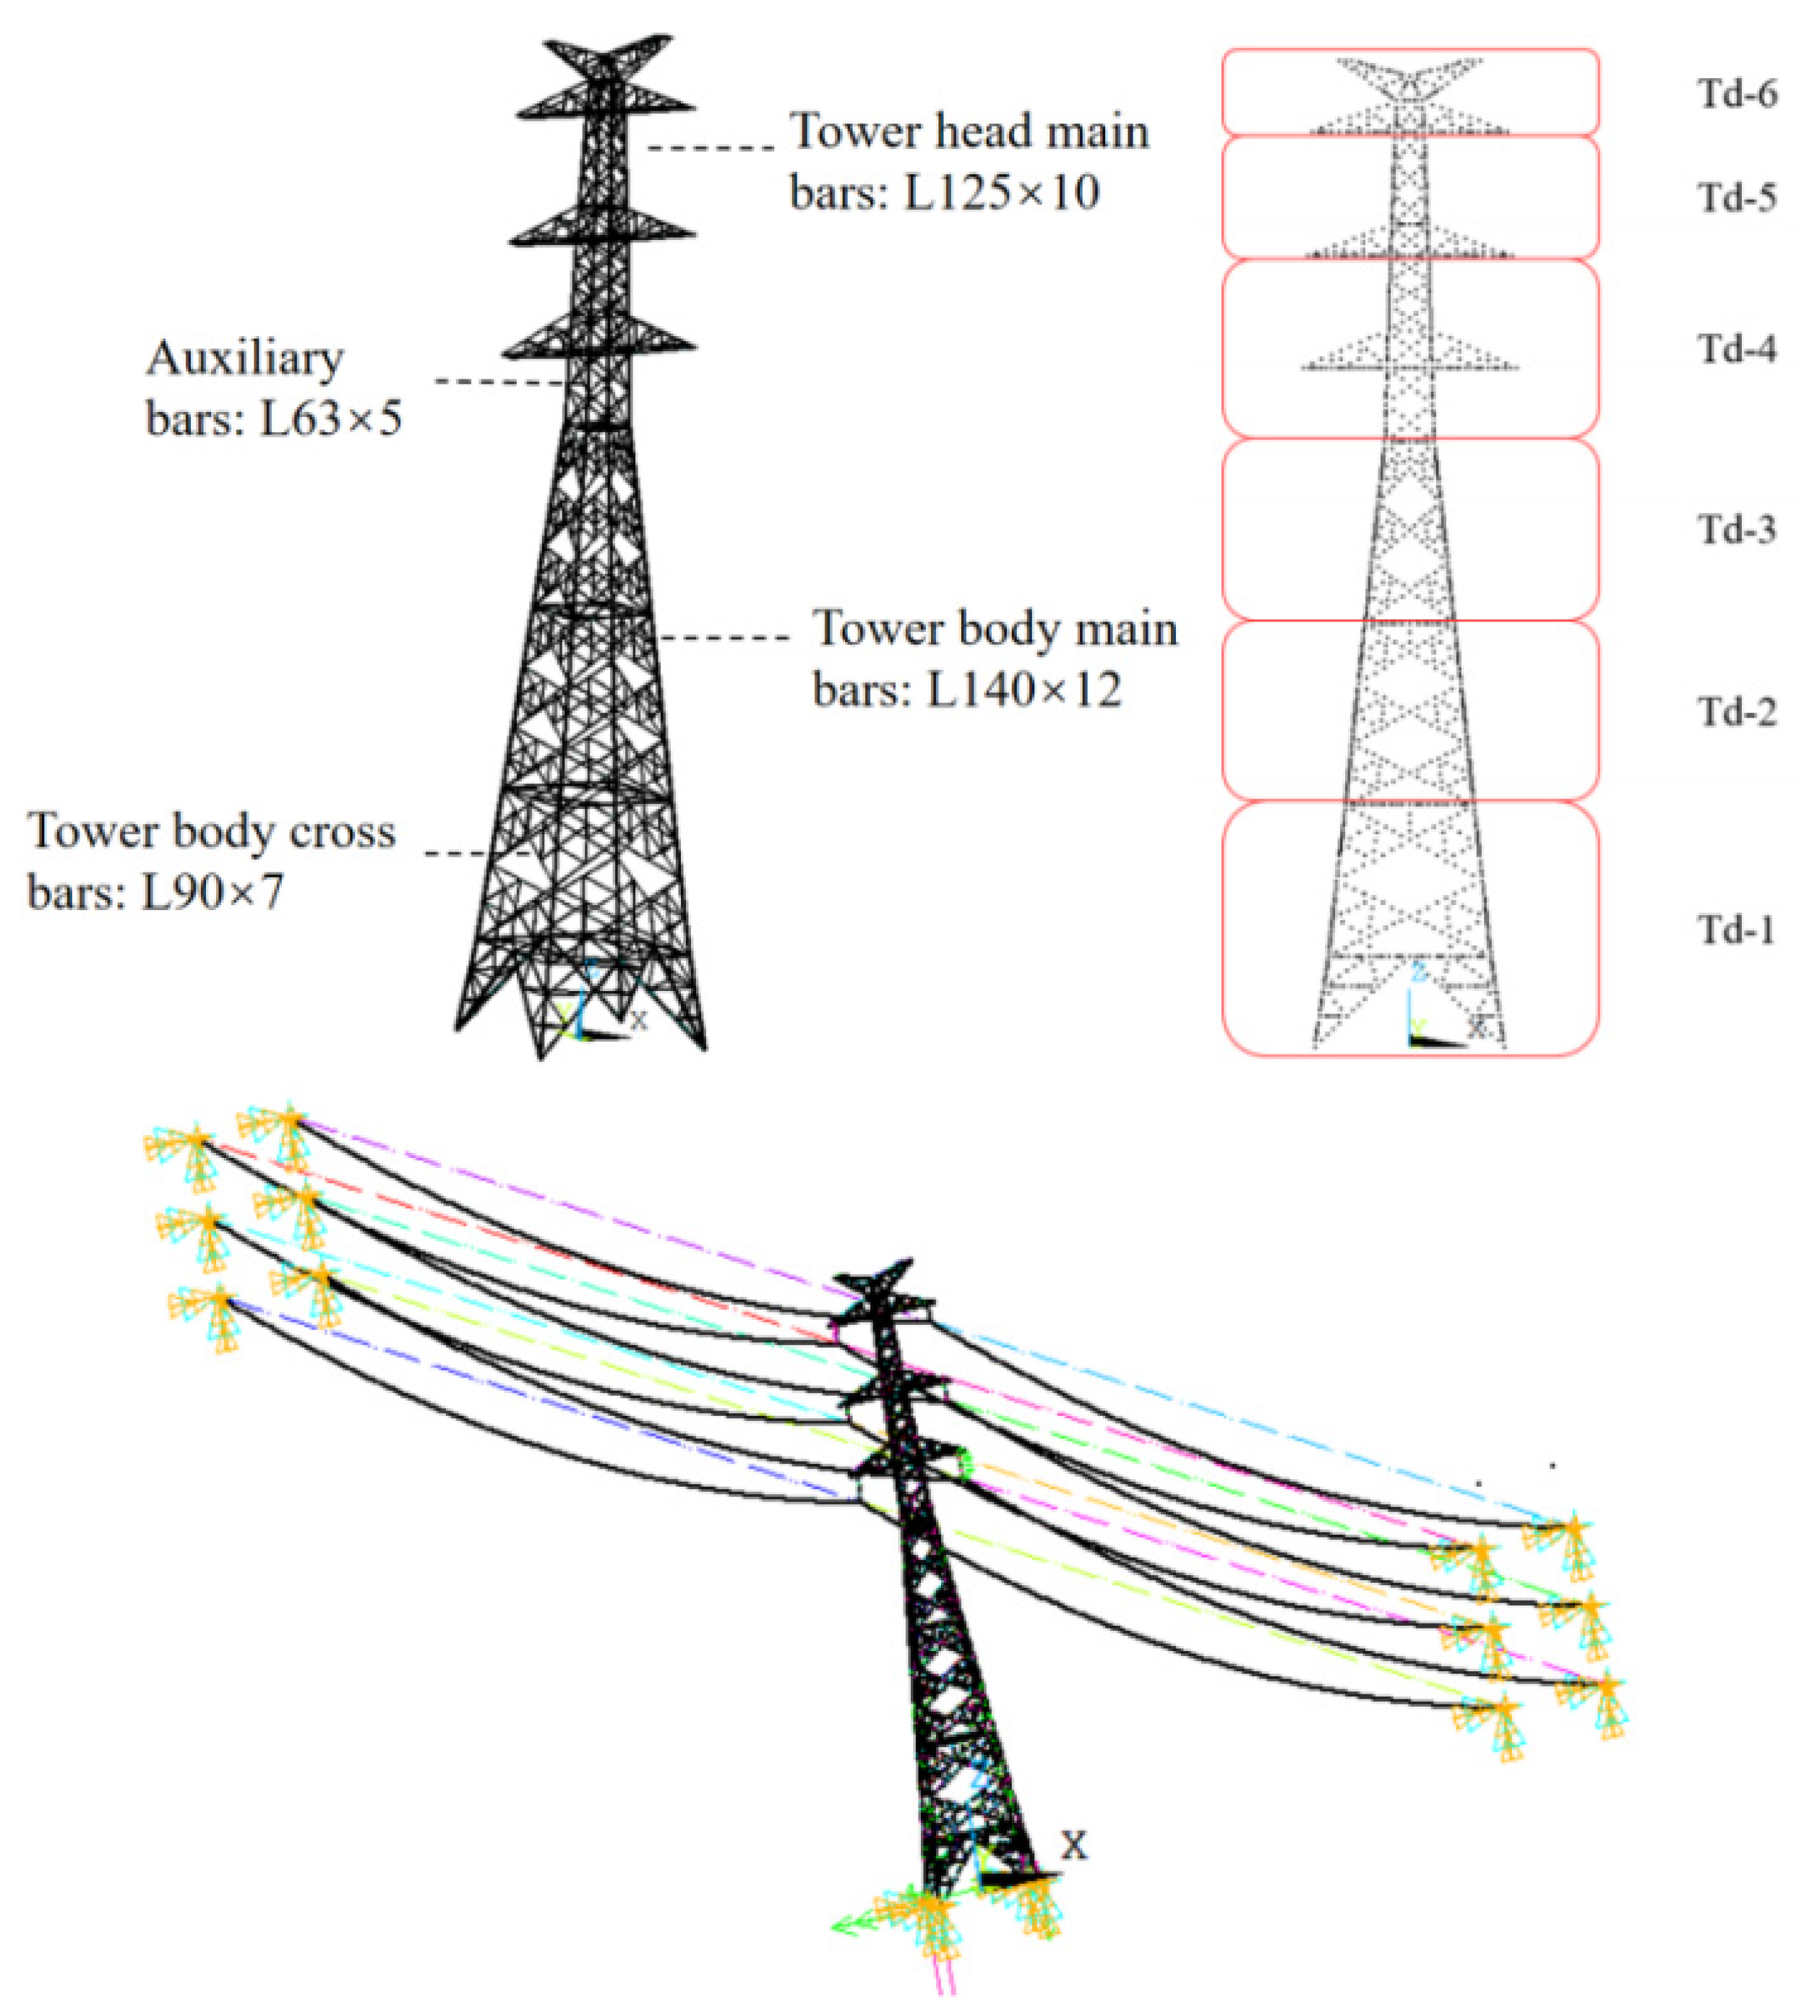
2.2. Tower-Line Coupled Calculation Model

The SZ631-33 tower, which had the highest probability of collapse of the 220 kV transmission systems during the Typhoon Mujigae, is taken as a target to study. Moreover, in consideration of the pull-drag forces of lines on both sides, the tower-line coupled simulation model is established, as shown in Figure 4. The parameters of the simulation model are listed in Table 1. Because the typhoon wind speed and turbulence intensity vary in height, the tower model is divided into six parts, and various wind excitations are uploaded on these six different positions. Combined with the wind speed obtained from the real-time wind field model in Part A, the typhoon wind excitation that should be applied on various bar elements can be computed by the following equations:
{ P 0 = 1 2 ρ v 2 E L = 0 . 00125 × α μ sc ( d + 2 δ ) l H K h 2 P 0 ρ × sin 2 θ E T = 0 . 00125 × k L k Z k T A c P 0 ρ
where v is the real-time wind speed; ρ is the air density; and P0 is wind pressure. According to P0, the wind excitation on the tower and line, which are represented as EL and ET, respectively, can be obtained. α is the nonuniform coefficient of the line pressure. μsc is the line shape coefficient; in the absence of ice, μsc = 1.2. d is the radius of the line conductor. δ is the ice thickness. lH is the horizontal span. Kh is the coefficient of wind speed variation. θ is the angle between the transmission line and the wind moving direction. kL is the shape coefficient of the line wind excitation. kZ is the coefficient of the wind pressure variation. kT is the coefficient of the wind excitation adjustment; for this SZ5631-33 tower, kT = 1.5. Ac is the windward area of each bar.
A detailed simulation process is below. The transmission tower is a high-flexible and lightweight building, which is sensitive to wind load and prone to bending and more easily to deformation after the wire load. In order to simulate the deformation of this part, the tension, compression, bending and torsional stiffness should be better simulated when the steel unit is subjected to gravity load and wind load. Therefore, in terms of unit selection, Beam188 unit in ANSYS is selected as the basic unit considering that the stress of steel is similar to the beam unit. In another aspect, the wire belongs to a flexible cable structure and does not tolerate a bending movement, so the Link180 unit is selected for modeling. In the actual suspension of the wire, in order to avoid excessive pressure from the gravity load of the wire itself to the cross load of the tower, it is necessary to add pre-stress at both ends to balance the gravity load of the wire. The specification of the wire of the modeling object is LGJ-300/25 and the specification of the ground wire is GJ-50. In order to balance the gravity load of the wire, it is necessary to use the deformation command UPGEOM in ANSYS to make the simulated wire generating a pre-stress to offset the gravity load for shape forming. A small deformation is applied to update the shape of the finite element line model, and the hang-down size is used as the termination condition for iterative operation to achieve the effect of stretching the initial form. After 72 iterations, the hang-down of the wire is 4.43 m. After shape forming is completed, the tower-line coupling operation is carried out, and the tower-line coupling system can be formed by adding the transmission tower model together. Due to the complex structure of transmission towers, the amount of calculation increases significantly with the addition of multiple transmission towers. In order to simplify the calculation and facilitate convergence, the basic structure of transmission lines: single tower and two line structure is adopted as the tower-line coupling model. During the analysis, the analysis type is set as transient mechanical analysis, and the converted wind load data is read from the OUTPUT folder of MATLAB, which is the results of the typhoon wind field simulation in the first part. Due to the large wind load value, the time step is selected as 0.0125 s for rapid convergence, and gravity load is applied globally for calculation.

3. Simulation Results and Analysis

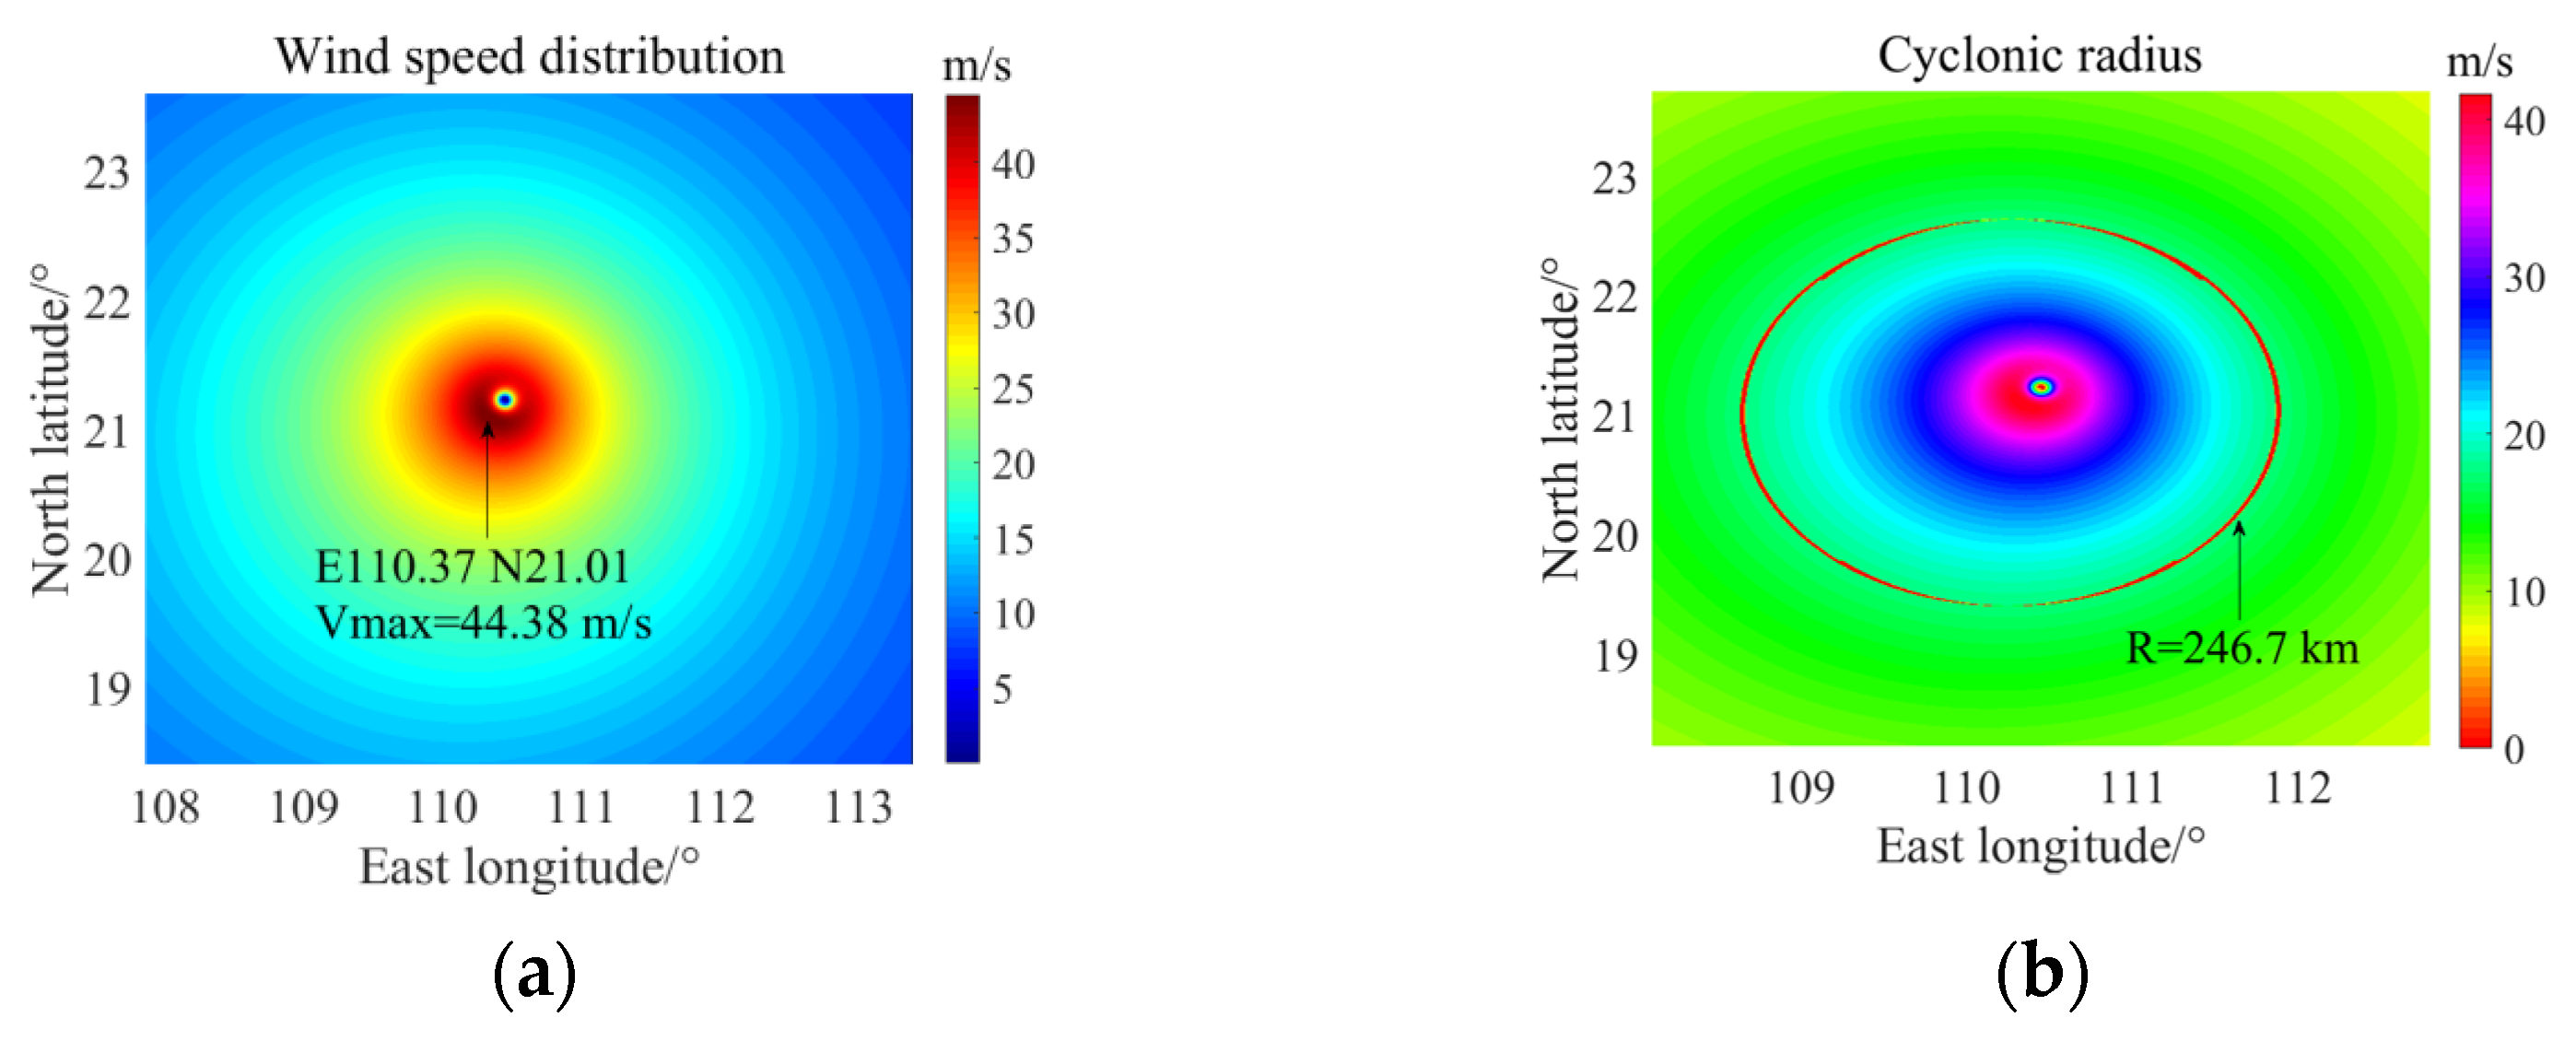
3.1. Real-Time Wind Field Distribution

To verify the feasibility of the typhoon simulation model, Typhoon Mujigae is taken as an example for comparison. The measured data of the Typhoon Mujigae are listed in Table 2, and the simulation results of the wind field are shown in Figure 5.
Figure 5 shows the distribution characteristics of typhoon wind at a height of 15 m. We can see that the maximum wind speed (46.8 m/s) is not at the typhoon center; the simulation maximum wind speed is 44.38 m/s. The position is nearly the same as the actual measured position. The wind speed is relatively small at the typhoon center. With increasing distance from the center, the wind speed rises rapidly to the maximum value. At this position, the wind circle’s radius is called the maximum wind speed radius. If the distance from the typhoon center rises further, then the wind speed gradually decreases. In addition, the growth and decay rates of the wind speed are not completely symmetrical due to the drive of geostrophic deflection forces and also the superposition of the typhoon wind moving forward. The component that is the same as the moving direction is enhanced, while the opposite direction is weakened. Thus, an eccentric wind speed distribution is formed. These distribution characteristics are consistent with the practical development process of typhoons. This confirms that the real-time wind field simulation is useful and correct.
Figure 6 shows the real-time average wind speed before and after typhoon landings within 8 h. Figure 7 shows the typhoon’s instantaneous wind speed, which is superimposed by the real-time average wind speed and pulsating wind speed (turbulence).

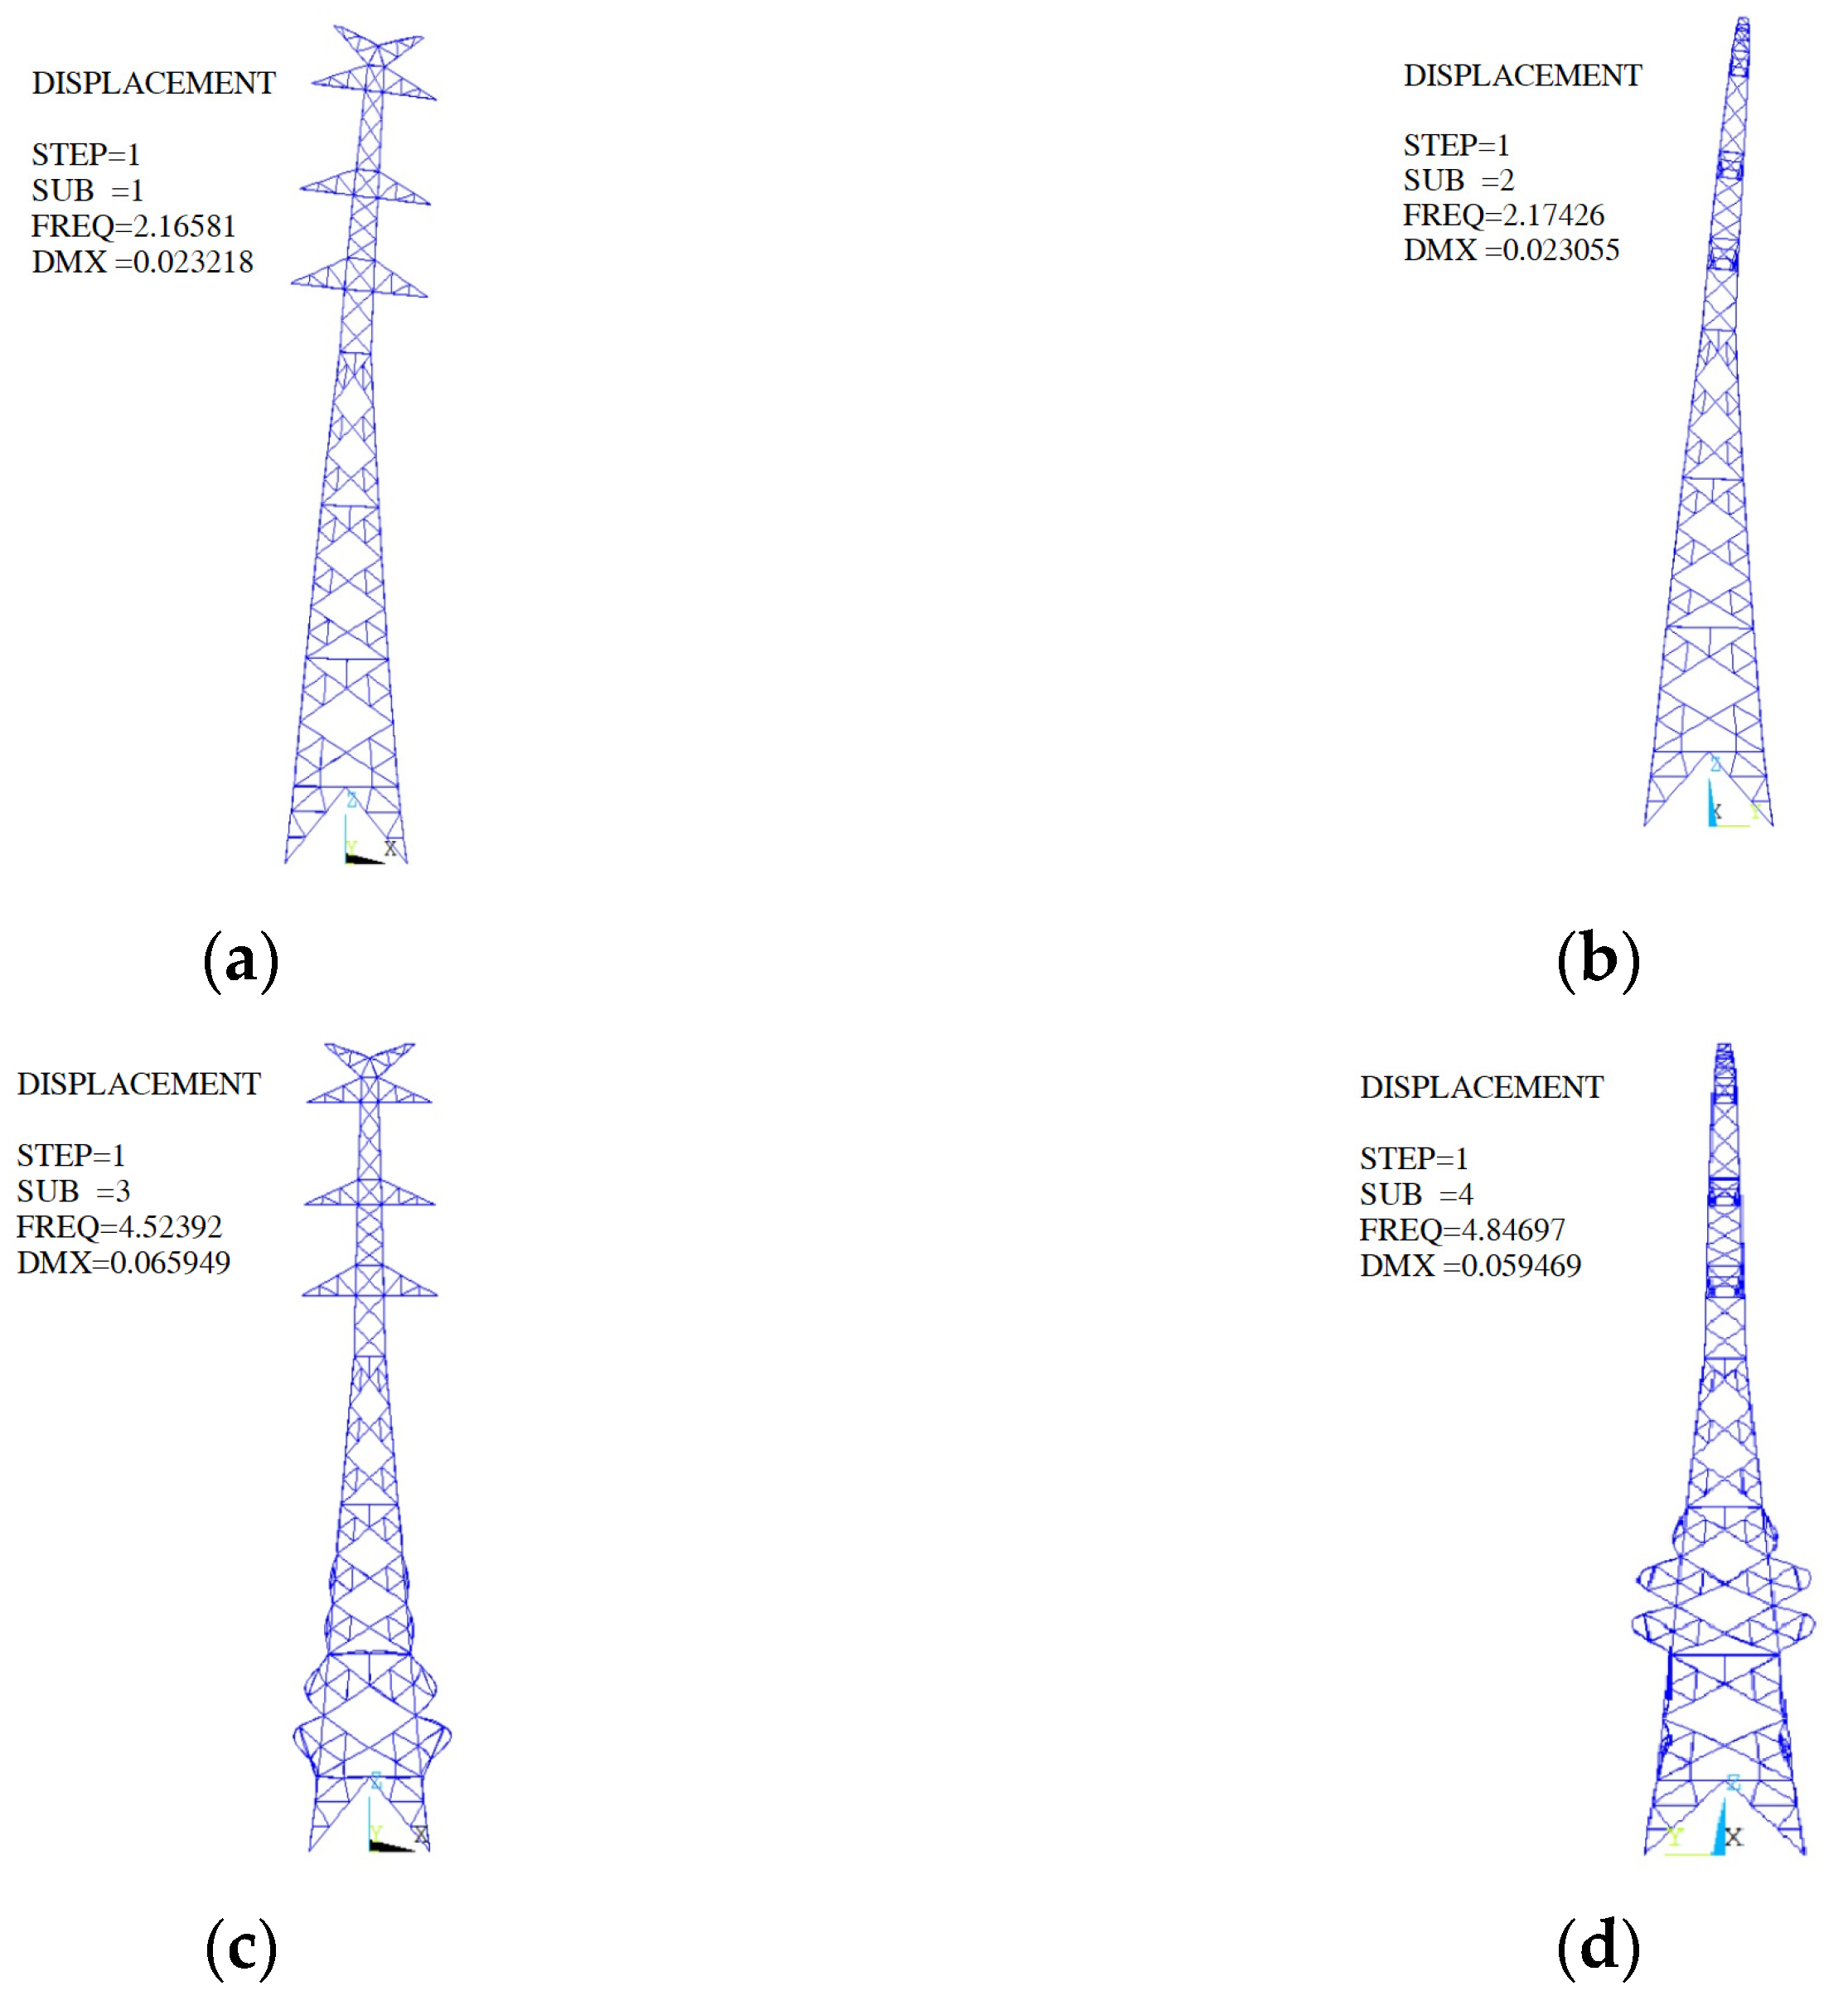
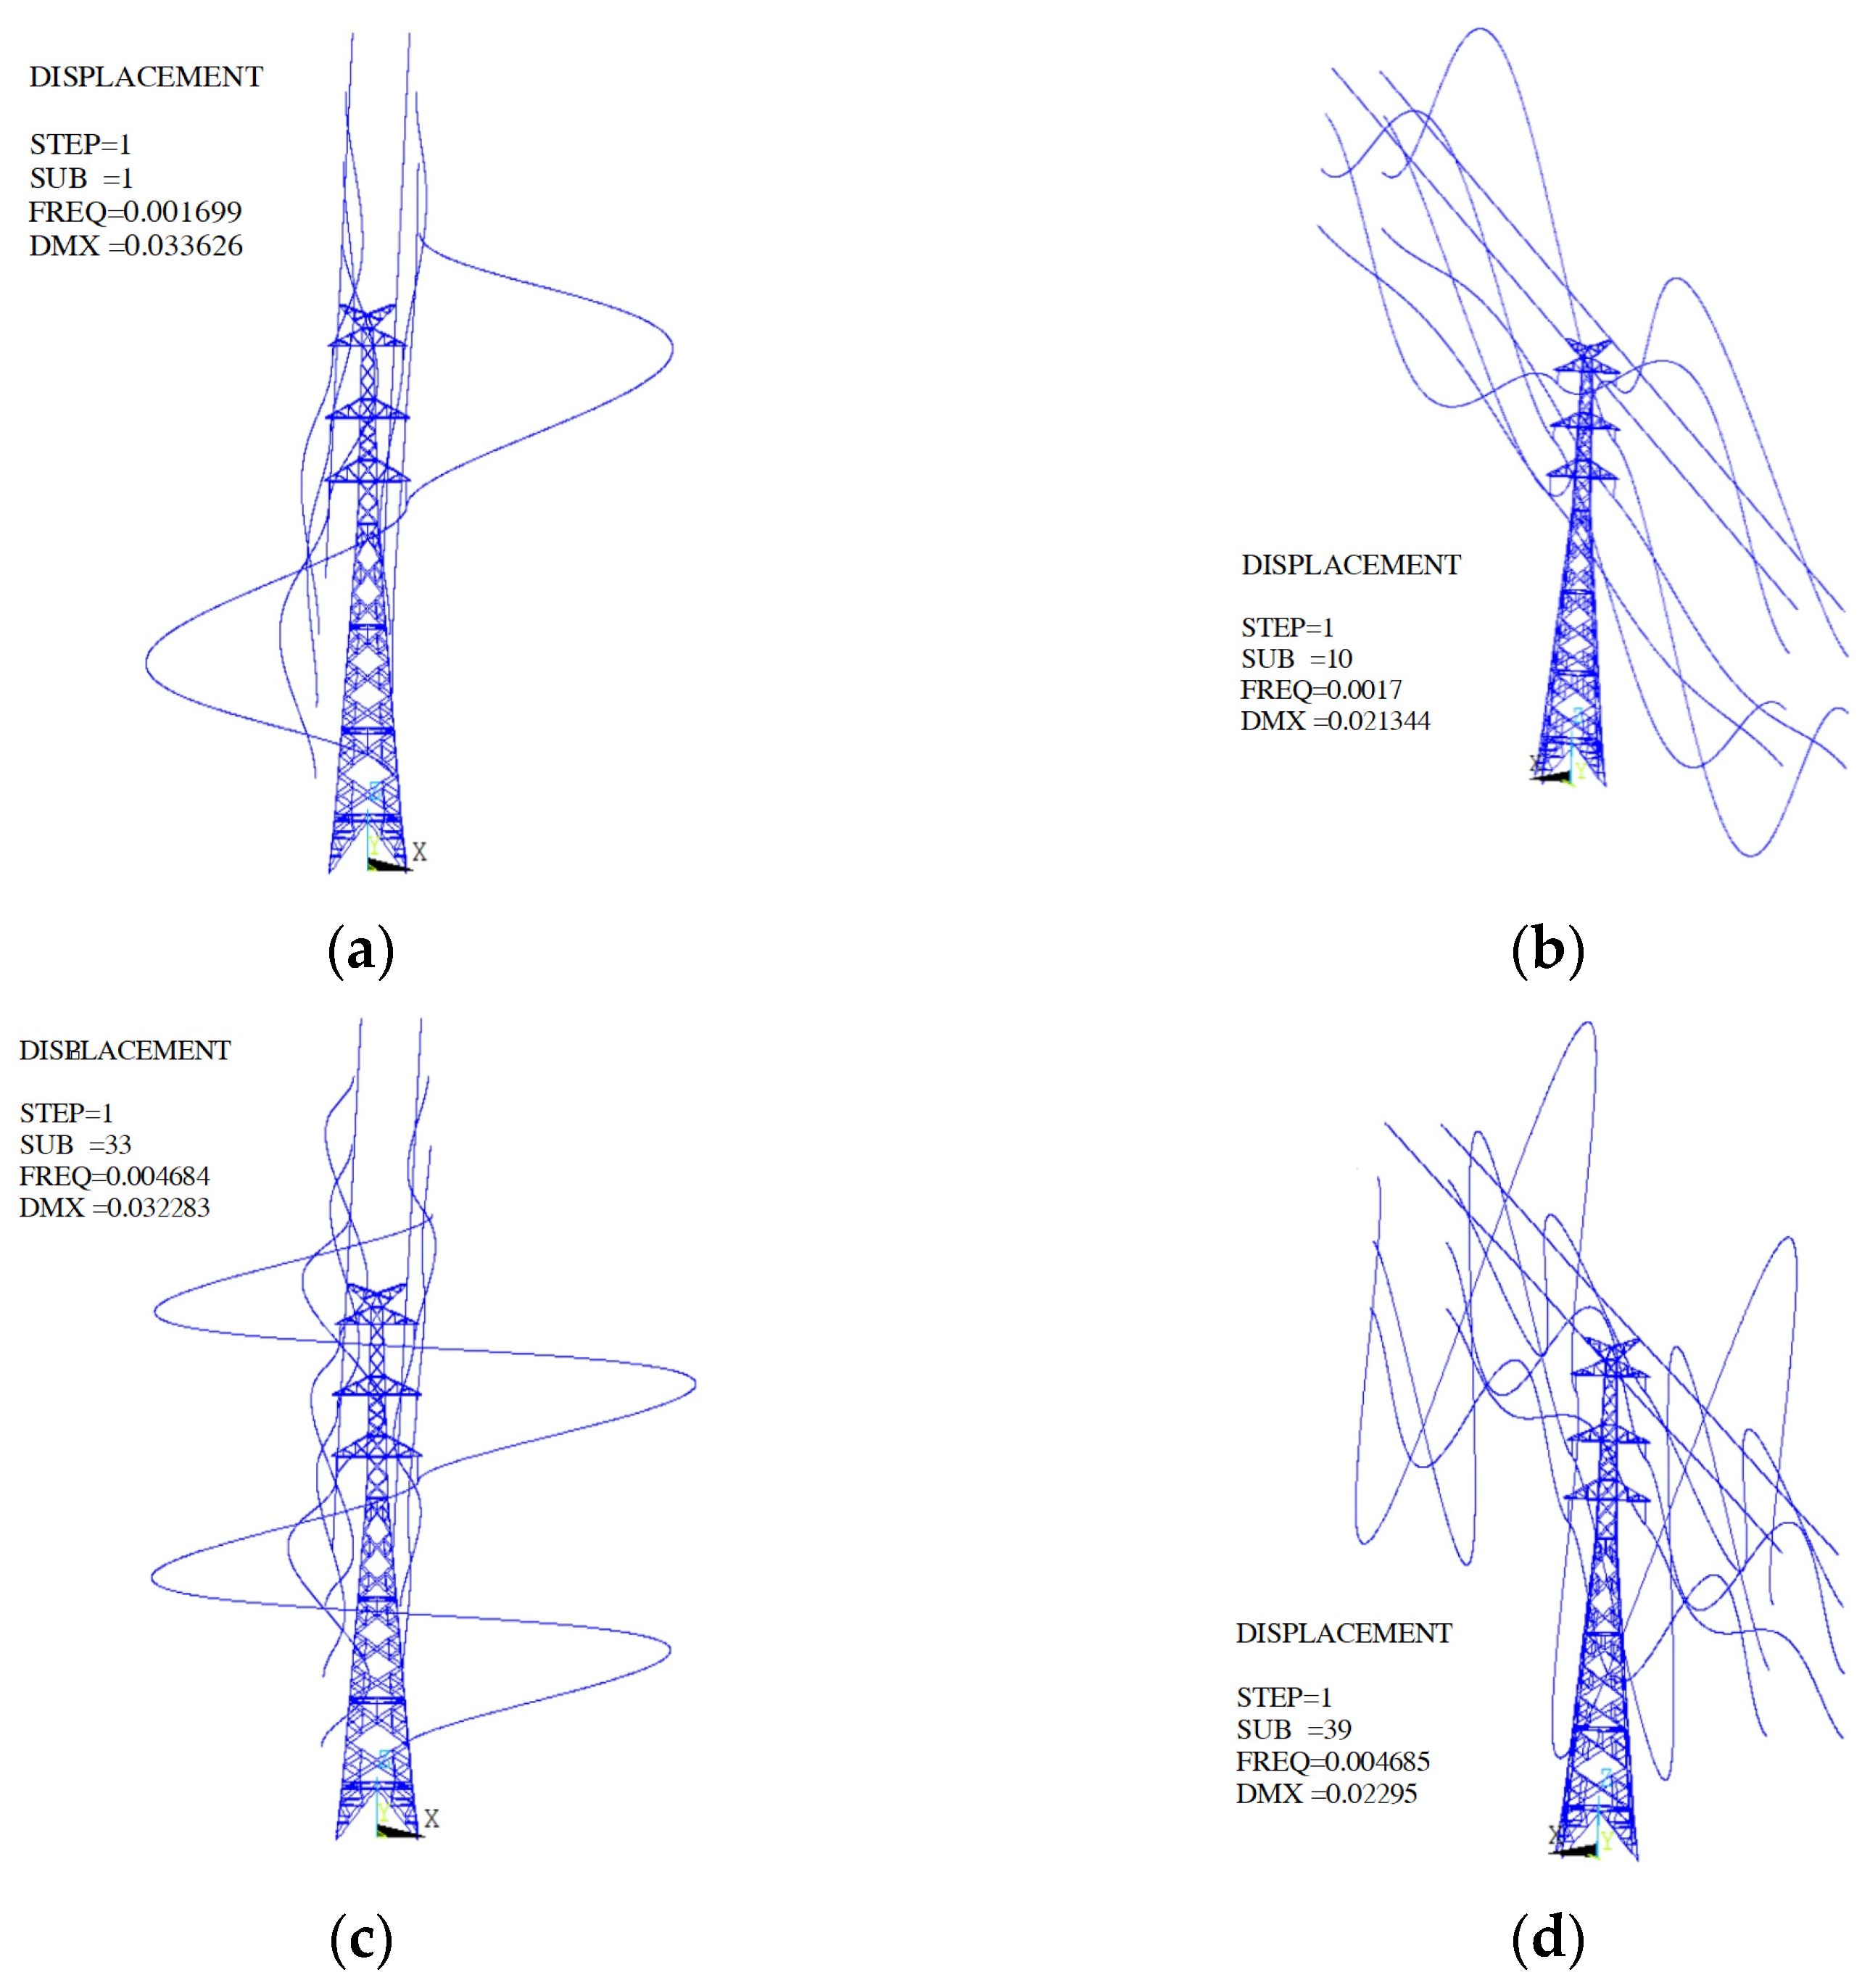
3.2. Mechanical Vibration

For a single tower, due to its structural characteristics, stiffness and weight, low-mode vibrations are the main factors that may cause a destructive shake and break. Figure 8 shows the vibrations of a single tower.
The first-mode vibration makes the whole single-tower shake perpendicular to the transmission line direction. The second-mode vibration causes the whole single tower to vibrate along the transmission line direction. The third-mode and fourth-mode vibrations mainly contribute to the obvious vibration of the auxiliary cross-bars in the second and third floors, respectively, but have no effect on the other parts, as shown in Figure 8. This vibration of the auxiliary bars indicates that the SZ631-33 tower has less safety margin on the auxiliary bars and can be easily shaken. In the case of the action of high-frequency pulsating wind, the vibration of this part will be much more serious, and the support strength of the tower may be weakened.
For the tower-line coupled model, the effect of high-mode vibrations becomes important. Four kinds of vibrations are shown in Figure 9. The amplitude of transmission line vibration is enhanced as the mode increases, which is similar to the periodic vibration of the sine function in terms of shape. Therefore, the vibration intensity can be described by the number of sine function cycles. The vibration frequency on the transmission line increases in step form, and when the sine function on the line increases by one cycle, the frequency clearly increases. In the case of the same vibration frequency, the number of cycles is the same, but the vibration direction is different.
Based on the above vibrations, it can be found that the vibration of the transmission line takes a leader role and is more remarkable in the case of high turbulence. This is because the transmission line demonstrates less stiffness and its vibration frequency is much higher than that of the insulator and steel tower, so the line’s vibration is dominant in some high modes. If the mode further increases, then the interaction vibration of the tower and line will appear. Therefore, it is necessary to consider the line’s impact to exactly analyze the vibration of the tower-line coupled model under typhoon wind.

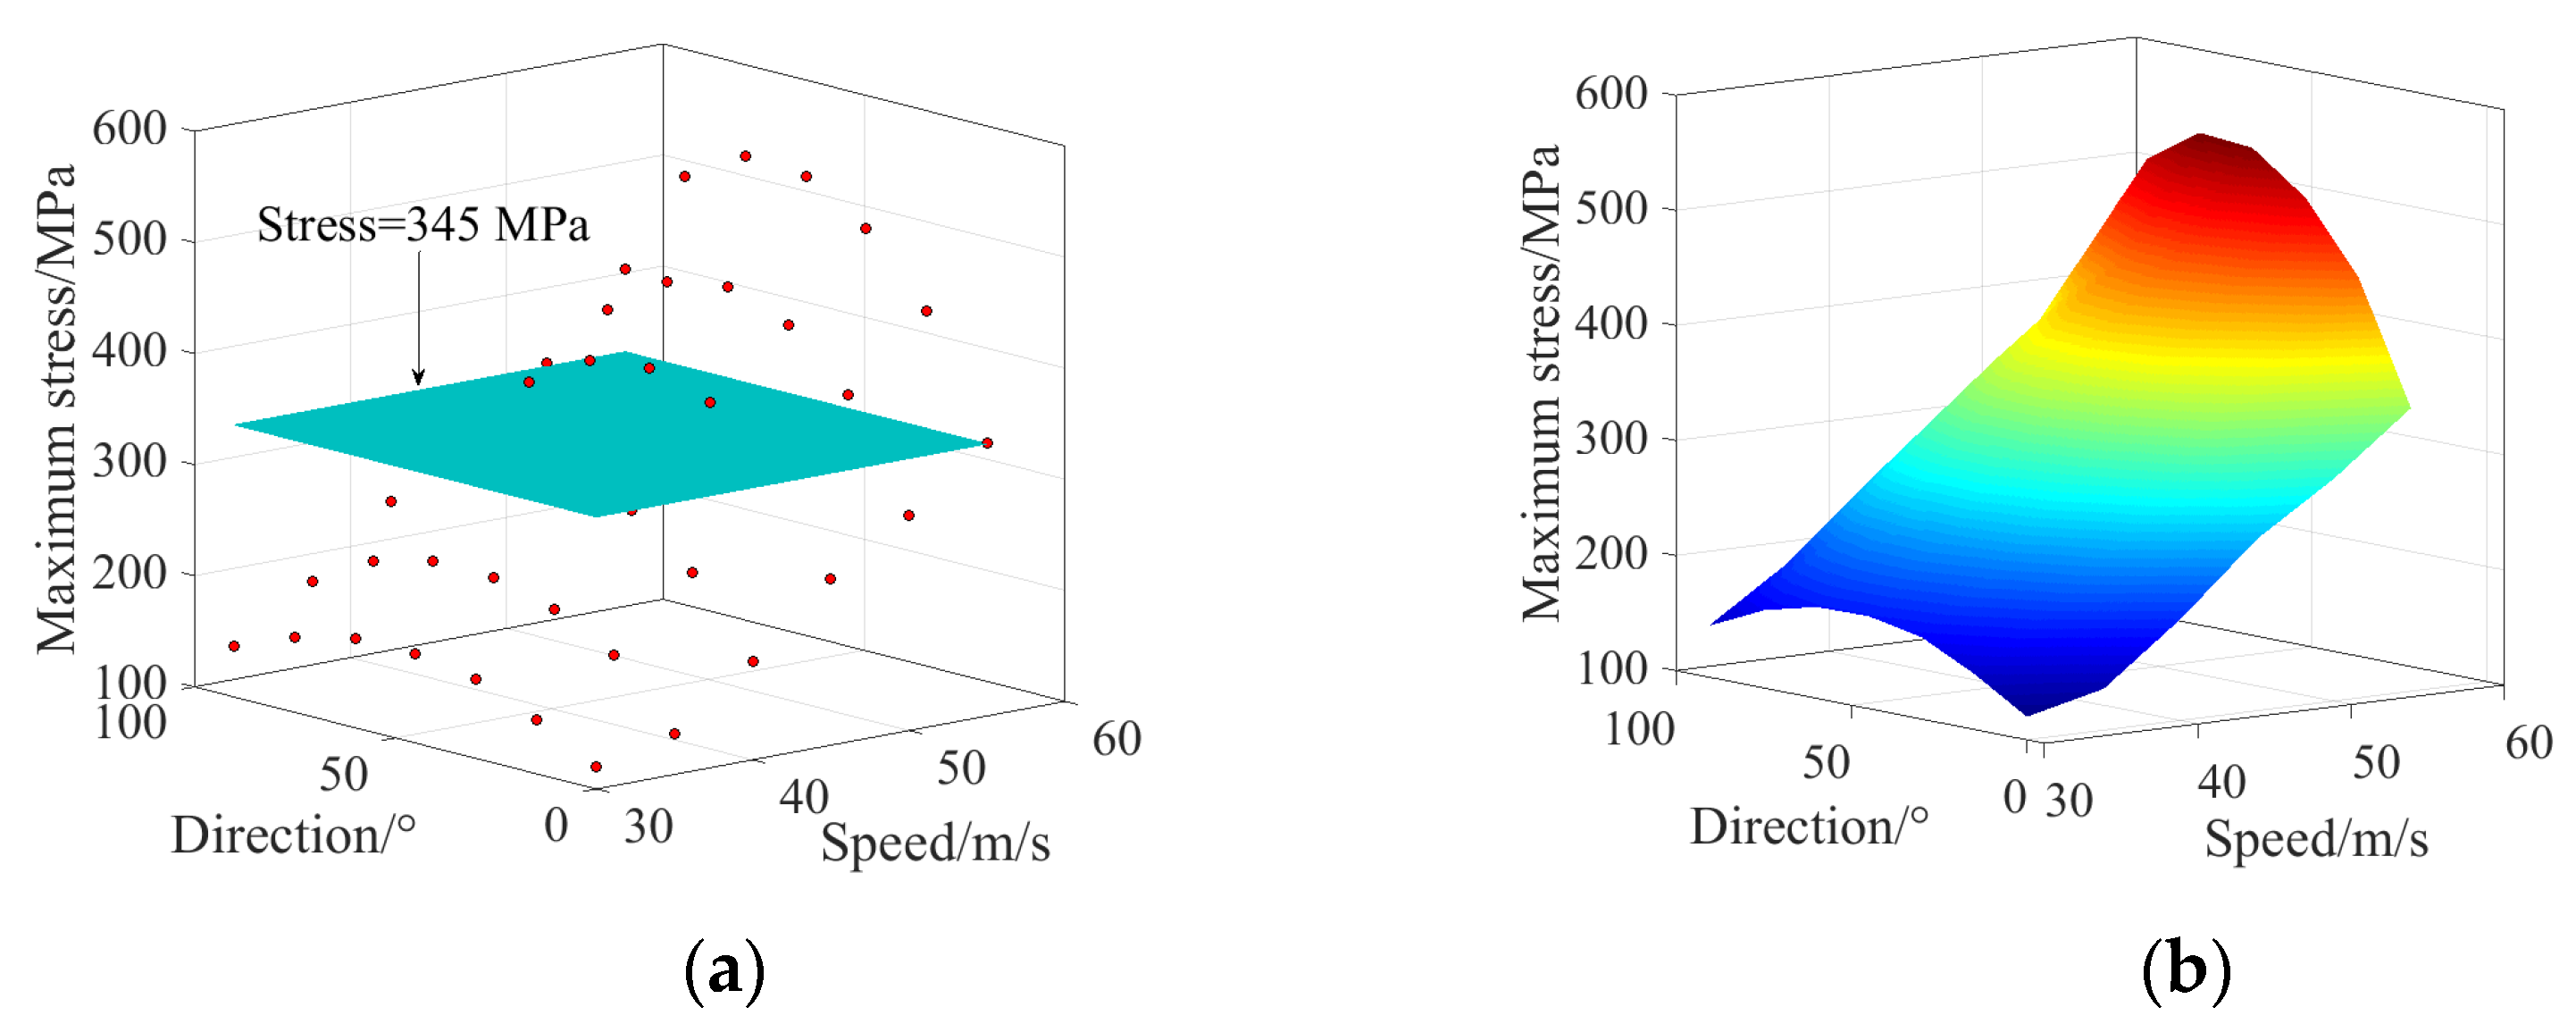
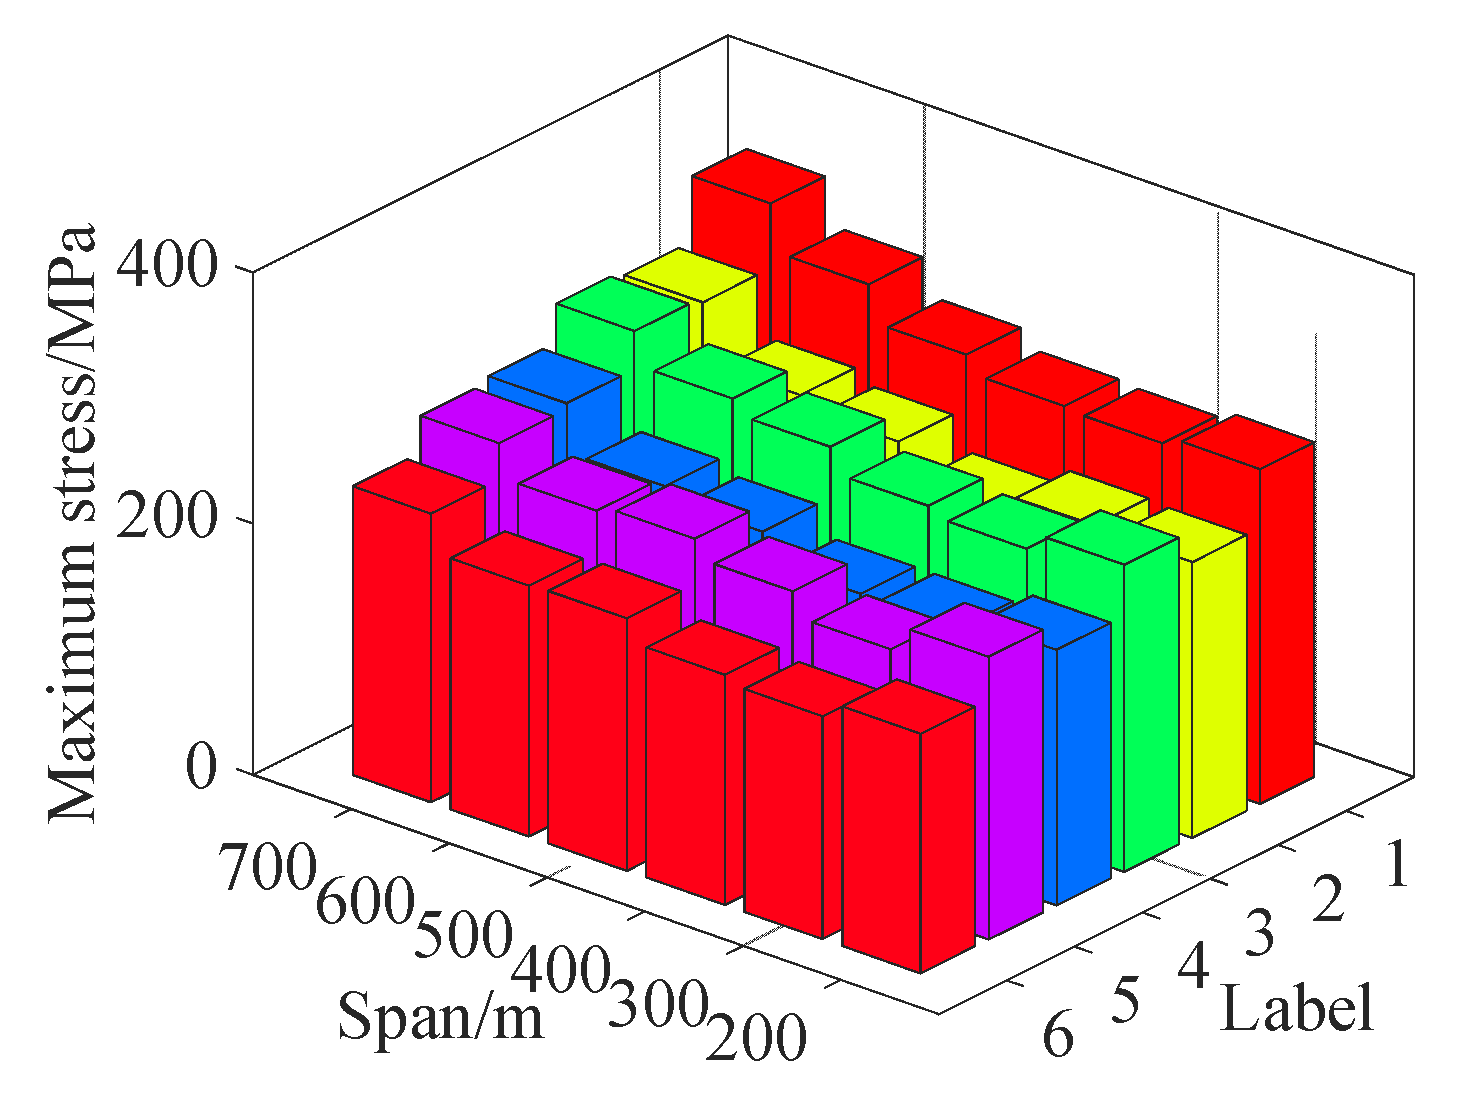
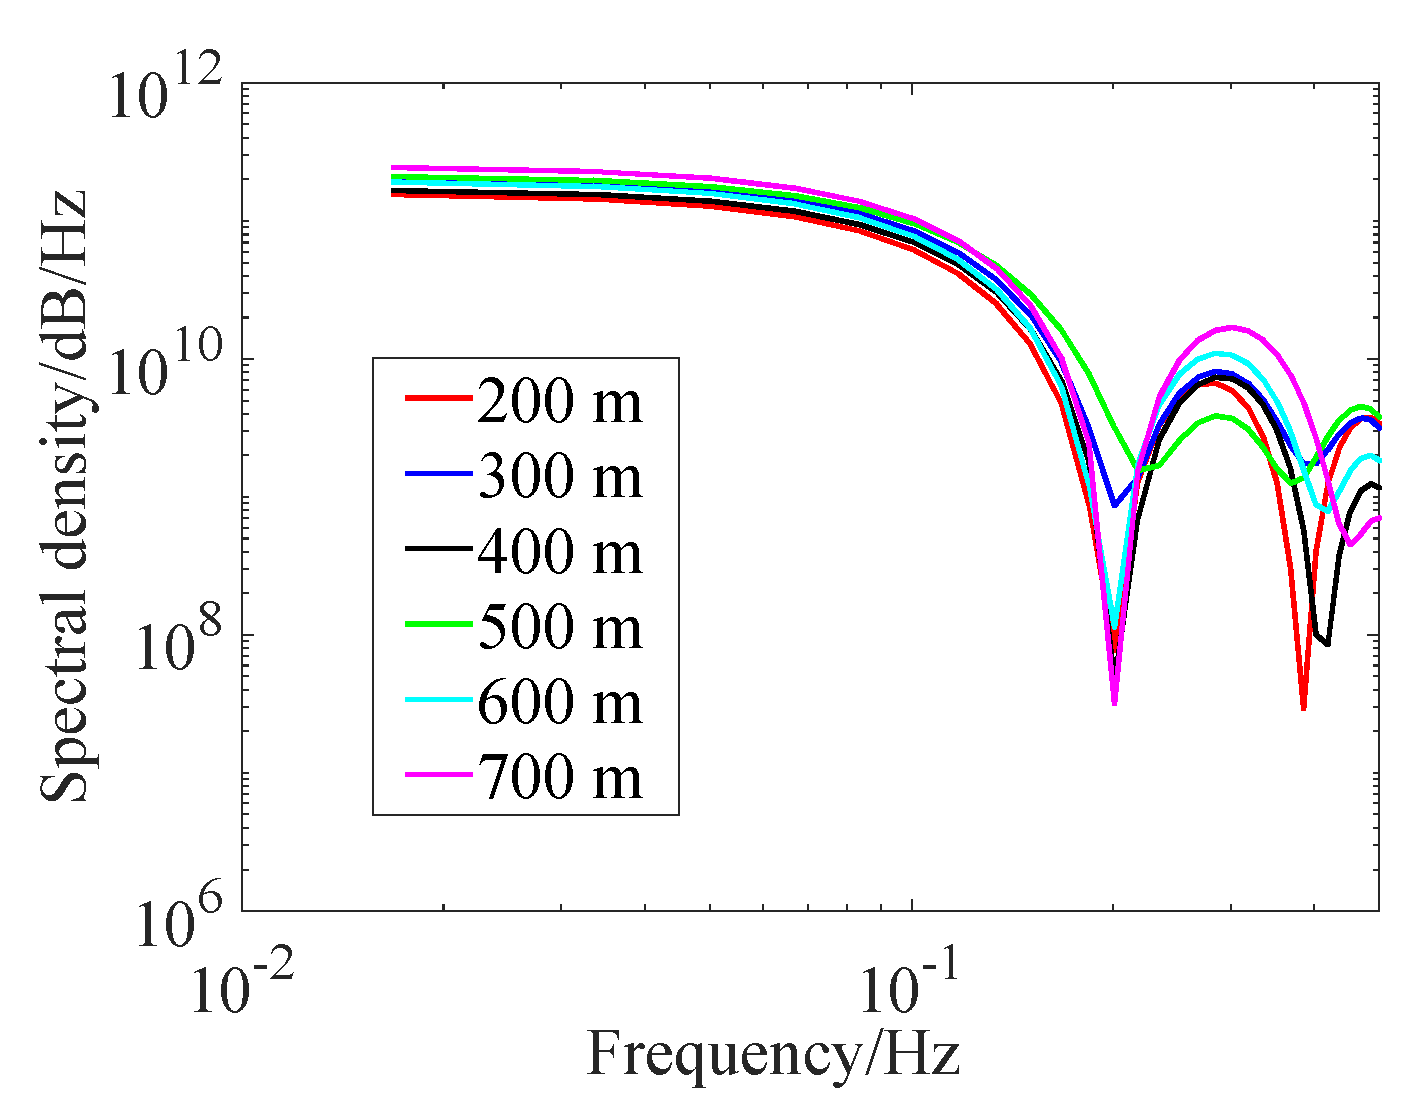
3.3. Damage Prediction

To predict the potential damage of transmission towers and lines, different wind speeds, directions, turbulence intensities, and various structures of the tower-line coupled model are considered to study the dynamic response. According to the dynamic response of the simulation model, the damage condition of the transmission system is analyzed, aiming to avoid tower collapse accidents through reinforcement and optimization.
Eight typical horizontal wind speeds ranging from 30 m/s to 55 m/s are selected, and the interval between each wind speed is set as 5 m/s. The corresponding turbulence and the wind speed gradient in the vertical direction are combined into the wind field based on the selected horizontal wind speed. In addition, wind direction, which means the angle between transmission lines and flowing direction, is selected from 0 degrees (along with transmission lines) to 90 degrees (perpendicular to transmission lines) at an interval of 15 degrees.
The instantaneous maximum stress on the main bars of the tower is shown in Figure 10. The material and yield stress of the main bars are Q345 and 345 MPa, respectively. In Figure 10, some calculating points have already exceeded the yield stress. The maximum stress is concentrated on the main steel on the leeward side, which may lead to instability of the main bars, such as deformation, bending, or even tower collapse. The maximum stress becomes stronger as the wind speed increases. At the same wind speed, when the wind direction changes from 0 degrees to 90 degrees, the maximum stress on the tower bar increases first and then decreases, and it has a peak value when the wind direction angle is approximately 50 degrees. According to the yield stress of Q345 steel and the maximum stress distributions of each part of the tower, the damage prediction of the transmission tower under typhoon conditions can be concluded into the following details. (1) The maximum stress of the main bar may be larger than the material’s yield stress when the wind direction angle is close to 50 degrees under the condition that the average wind speed is no faster than or nearly 41.7 m/s. (2) When the average wind speed is greater than 43.2 m/s, the possible wind direction angle for the main bar overload is 90 degrees. (3) When the average wind speed exceeds 54.8 m/s, regardless of the wind direction angle, stress overload always occurs. Based on the above conclusions and considering the various terrains and surface roughness conditions around the transmission systems, the near-ground wind speed will increase when the incoming typhoon flows from a high roughness ground to a low roughness ground. Therefore, when designing and selecting the location and orientation of the transmission lines, the area with low surface roughness should not be located at the 50-degree direction of the transmission systems.
Furthermore, taking into account the fluctuations in instantaneous wind speed, the duration of the overloaded stress on the main bars may be very short or not long enough, and the wind speed may have already recovered into a bearable value before the main bars yielded and bent. Therefore, it is not certain that a collapse will happen when the typhoon’s stresses on the main bars are beyond 345 MPa. The tower is very likely to be broken if the instantaneous wind stress exceeds the yield stress by 20 percent.
Figure 11 shows the extreme response stresses of the main bars at different spans ranging from 200 m to 700 m. Figure 12 shows the power spectral density analysis of the main bars. Simulation results show that the response stress increases with the expansion of spans, and the rate of increase increases. The response power spectral densities are nearly the same at low frequency or at the model’s main vibration frequency, while the power spectral density gradually differs when the frequency is more than 0.1 Hz for different spans, as shown in Figure 12. A frequency higher than 0.1 Hz mainly belongs to the response characteristics of transmission lines. If the span is extended, the background response contributed from transmission lines becomes larger, and the coupling effect of the tower-line model is enhanced. As a result, the response stress on the tower can be more intensified. Meanwhile, the vibration response caused by transmission lines will be strengthened non-linearly with the extension of the span. Therefore, a long span should not be implemented in coastal typhoon regions to avoid a severe stress response of the tower.

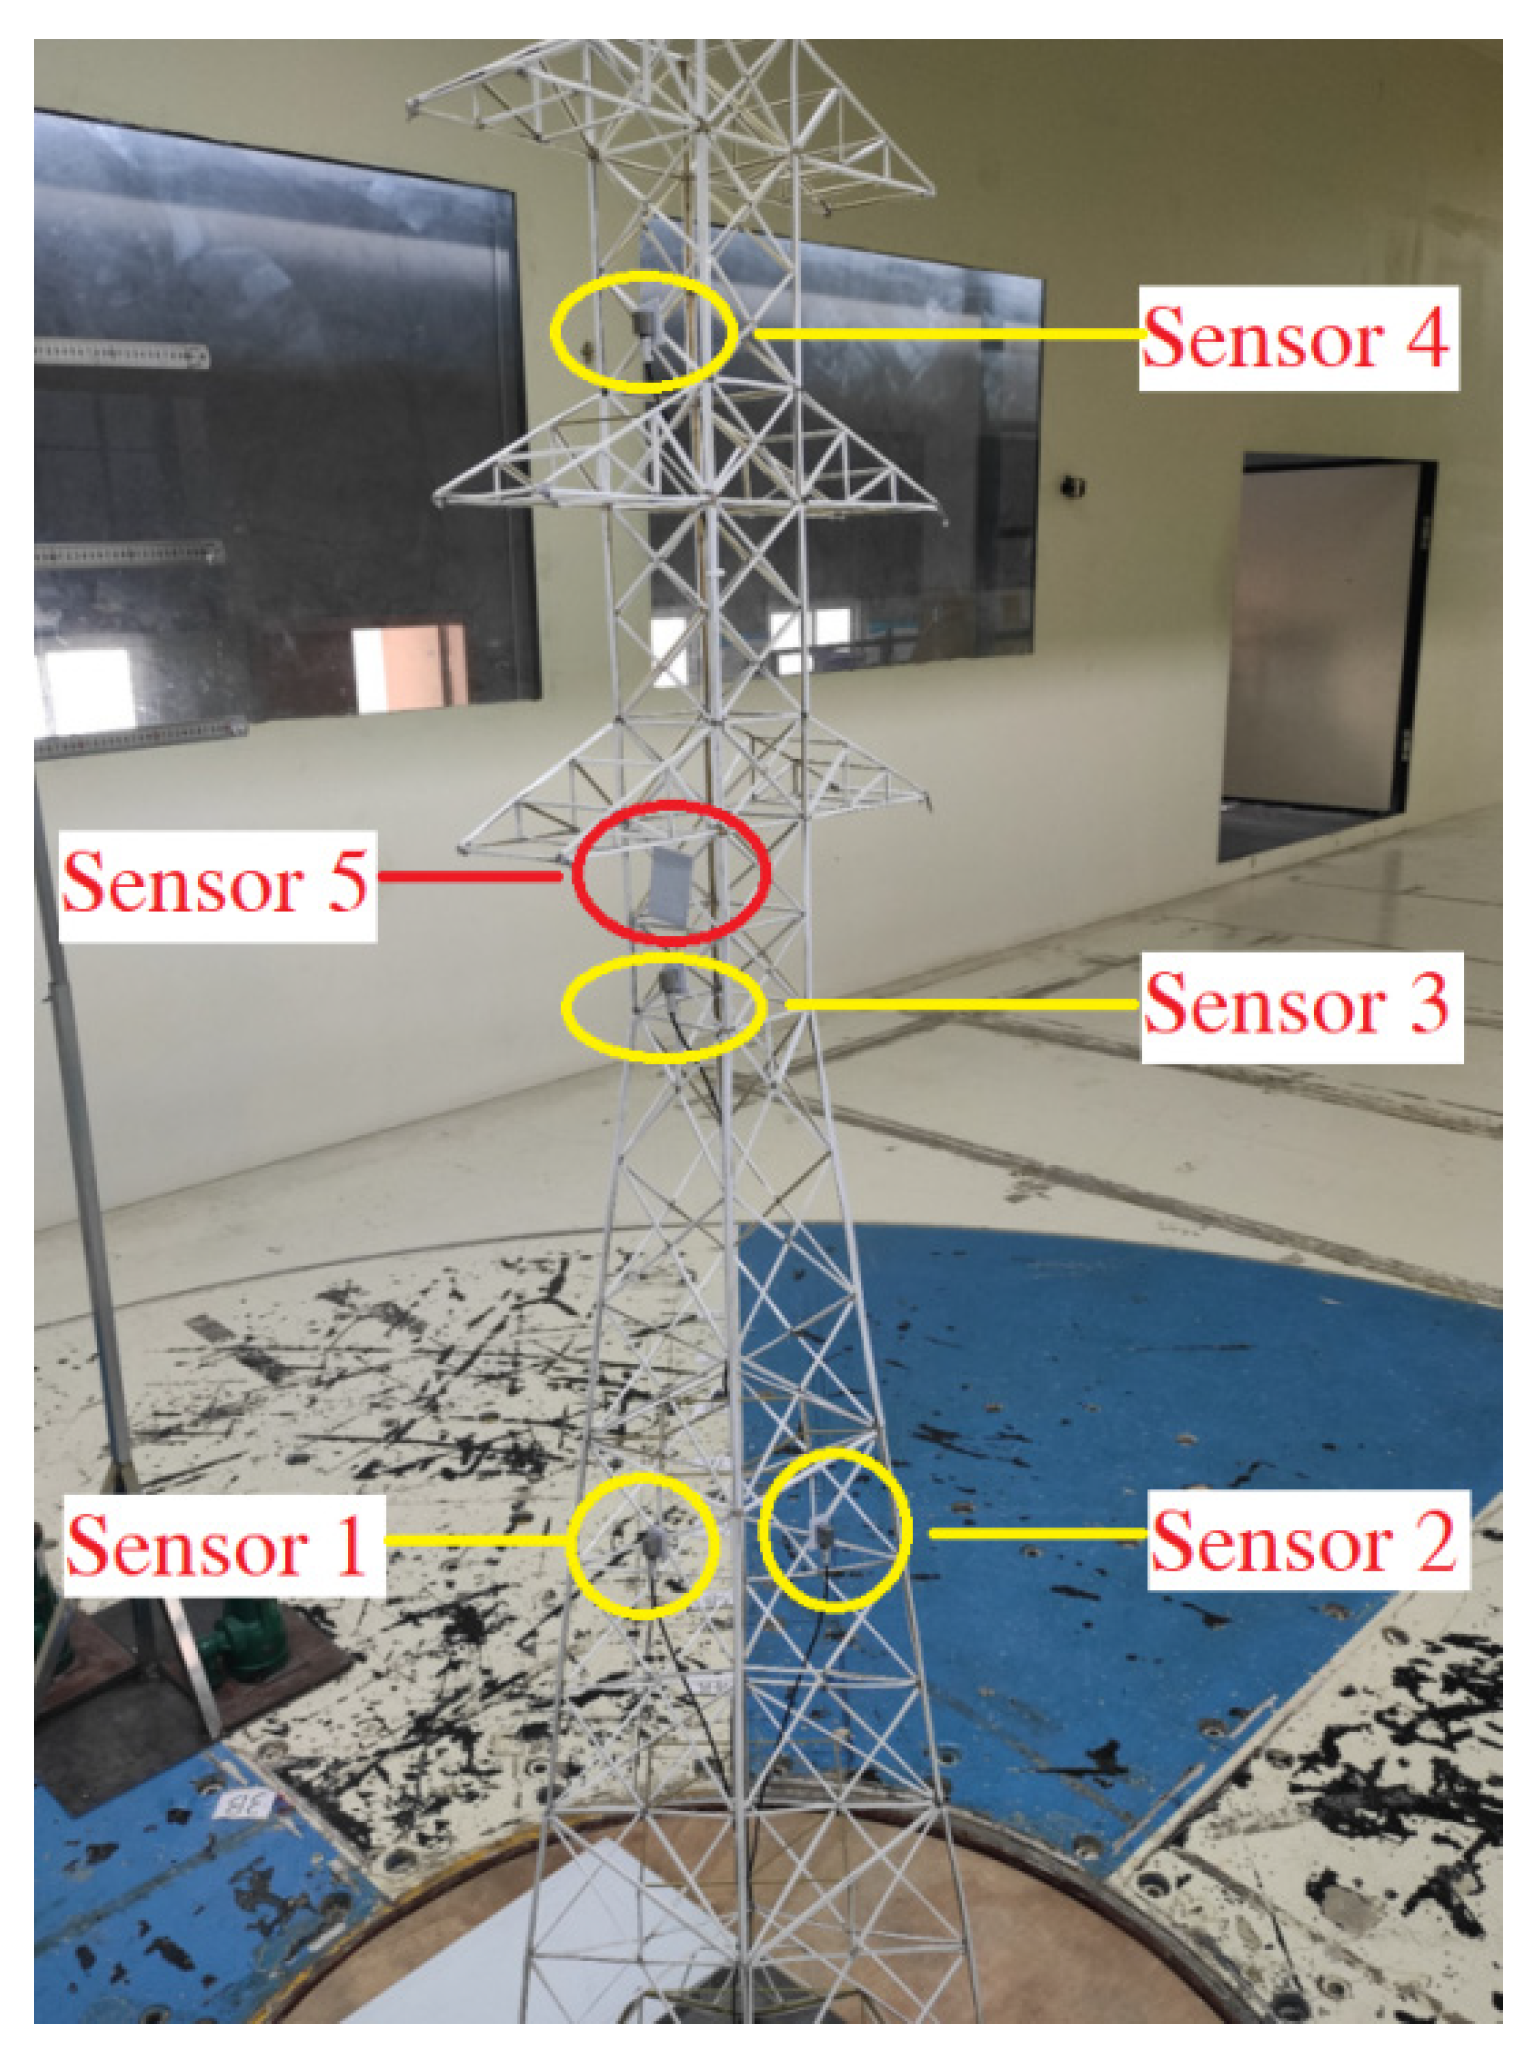
4. Anti-Wind Experiments

In the study of the dynamic mechanical response of transmission towers and lines under typhoon conditions, the anti-wind experiment is more efficient in reflecting the actual interaction between the wind field and the tower-line coupled model.

4.1. Scale Model and Similarity Criterion

A reasonable scale model is designed and made based on the Buckingham-π theorem, Froude number similarity criterion, and Cauchy number similarity criterion.
The wind tunnel’s height is 3.6 m, and the SZ631-33 tower’s height is 48.9 m. Due to the limited space of the wind tunnel laboratory, a basic length scale of 25:1 is selected to ensure that the distances between the scale model and the surrounding walls are far enough to avoid impacting the wind field distribution. According to the Buckingham-π theorem, the functional relationship of physical parameters between the scale model and actual transmission system must remain unchanged, such that the windward area of the scale model should be 252:1. Furthermore, to ensure that the mechanical response of the scale model is similar to that of the actual tower, it is necessary to similarly transform the inertia forces, viscous forces, gravities, and elastic forces.
The Froude number similarity criterion describes the relationship between the wind-induced response and gravity load based on a similar ratio of the inertia force and gravity, and the equation is:
F = k ρ V P 2 ρ P L P g = k ρ V M 2 ρ M L M g
where F is the Froude number. ρ is the air density. L is the bar length. g is the gravity acceleration. V is the wind speed. k is the coefficient. The corner marks P and M represent the practical tower and scale model, respectively.
Therefore, the ratio of wind speed can be obtained:
λ V = V P V M = l P ρ P l M ρ M = λ L λ ρ
where λV, λL, and λρ are the ratios of the wind speed, bar length, and air density, respectively. If λρ = 1, then λV = 5.
The Cauchy number similarity criterion reflects the response of the scale model to the wind field based on the ratio of elastic force to the fluid inertia force. The equation is below:
C = E L 2 ρ V 2 L 2 = E ρ V 2
where E is the elasticity modulus. λE is the ratio of elasticity modulus, so λE = λV2.
For the design of the scale model of transmission lines, an additional similarity criterion proposed by Davenport is also taken into account, and combined with the former rules, the equations are listed below:
{ G F = 2 l m g V 2 k D S λ ρ 1 = λ m λ T = λ V 2 λ D λ S λ D 2 λ L = λ V 2 λ S λ D λ L = λ V 2 λ D λ D = λ A = λ V 2 λ L 2 λ E
where G and F are the loads of gravity and wind, respectively. M is the mass of transmission lines per unit. S is the span. D is the line diameter. λ is the ratio of the physical parameter that corresponds to the special corner mark.
In summary, an H65 copper tube, with an elasticity modulus of 105 GPa, is adopted to establish the frame of the tower model. A plumbum wire, whose diameter is 1.5 mm and length is 1527 m, is selected and hung on the cross-arm bracket 1.5 m away from the tower model. In addition, an acrylonitrile butadiene styrene (ABS) plastic plate, which is strictly scaled based on the windward area and thickness of the main bars, is added and fixed on the copper tube to simulate the shape of the triangle steel bars of an actual tower. The scale model is shown in Figure 13.

4.2. Anti-Wind Experimental Method and Device

The wind tunnel laboratory is 66.8 m in length, 6 m in width, and 3.6 m in height, compared with the scale model’s total width of 3.8 m and a height of 1.96 m. As destructive experiments are strictly prohibited in the wind tunnel laboratory, the maximum testing wind speed in the experiment is limited to 60% of the maximum allowable wind speed. The dynamic responses of the scale model are measured under 25 kinds of combinations with different wind speeds, wind directions, and various turbulence intensities. These values are listed in Table 3. In the wind tunnel, the wind speed and direction can be adjusted by the DC motor and model chassis at the bottom. In terms of turbulence, a meshing grille is installed at the outlet to produce an instantaneous wind with a certain turbulence, as shown in Figure 14. The experimental process is carried out in an environment of 25 ℃ and approximately 62% relative humidity.
Figure 15 shows the position of each sensor. Four acceleration sensors are installed at the measuring points labelled from 1 to 4. Sensors 1, 3, and 4 are used to measure the acceleration perpendicular to the transmission lines, while sensor 2 aims to test the acceleration along the direction of the lines. Sensor 5 is a laser displacement sensor that can measure the tower’s displacement in the wind direction based on a sampling frequency of 1 kHz. During the test, the vibration response is recorded for 10 min in each experimental condition.

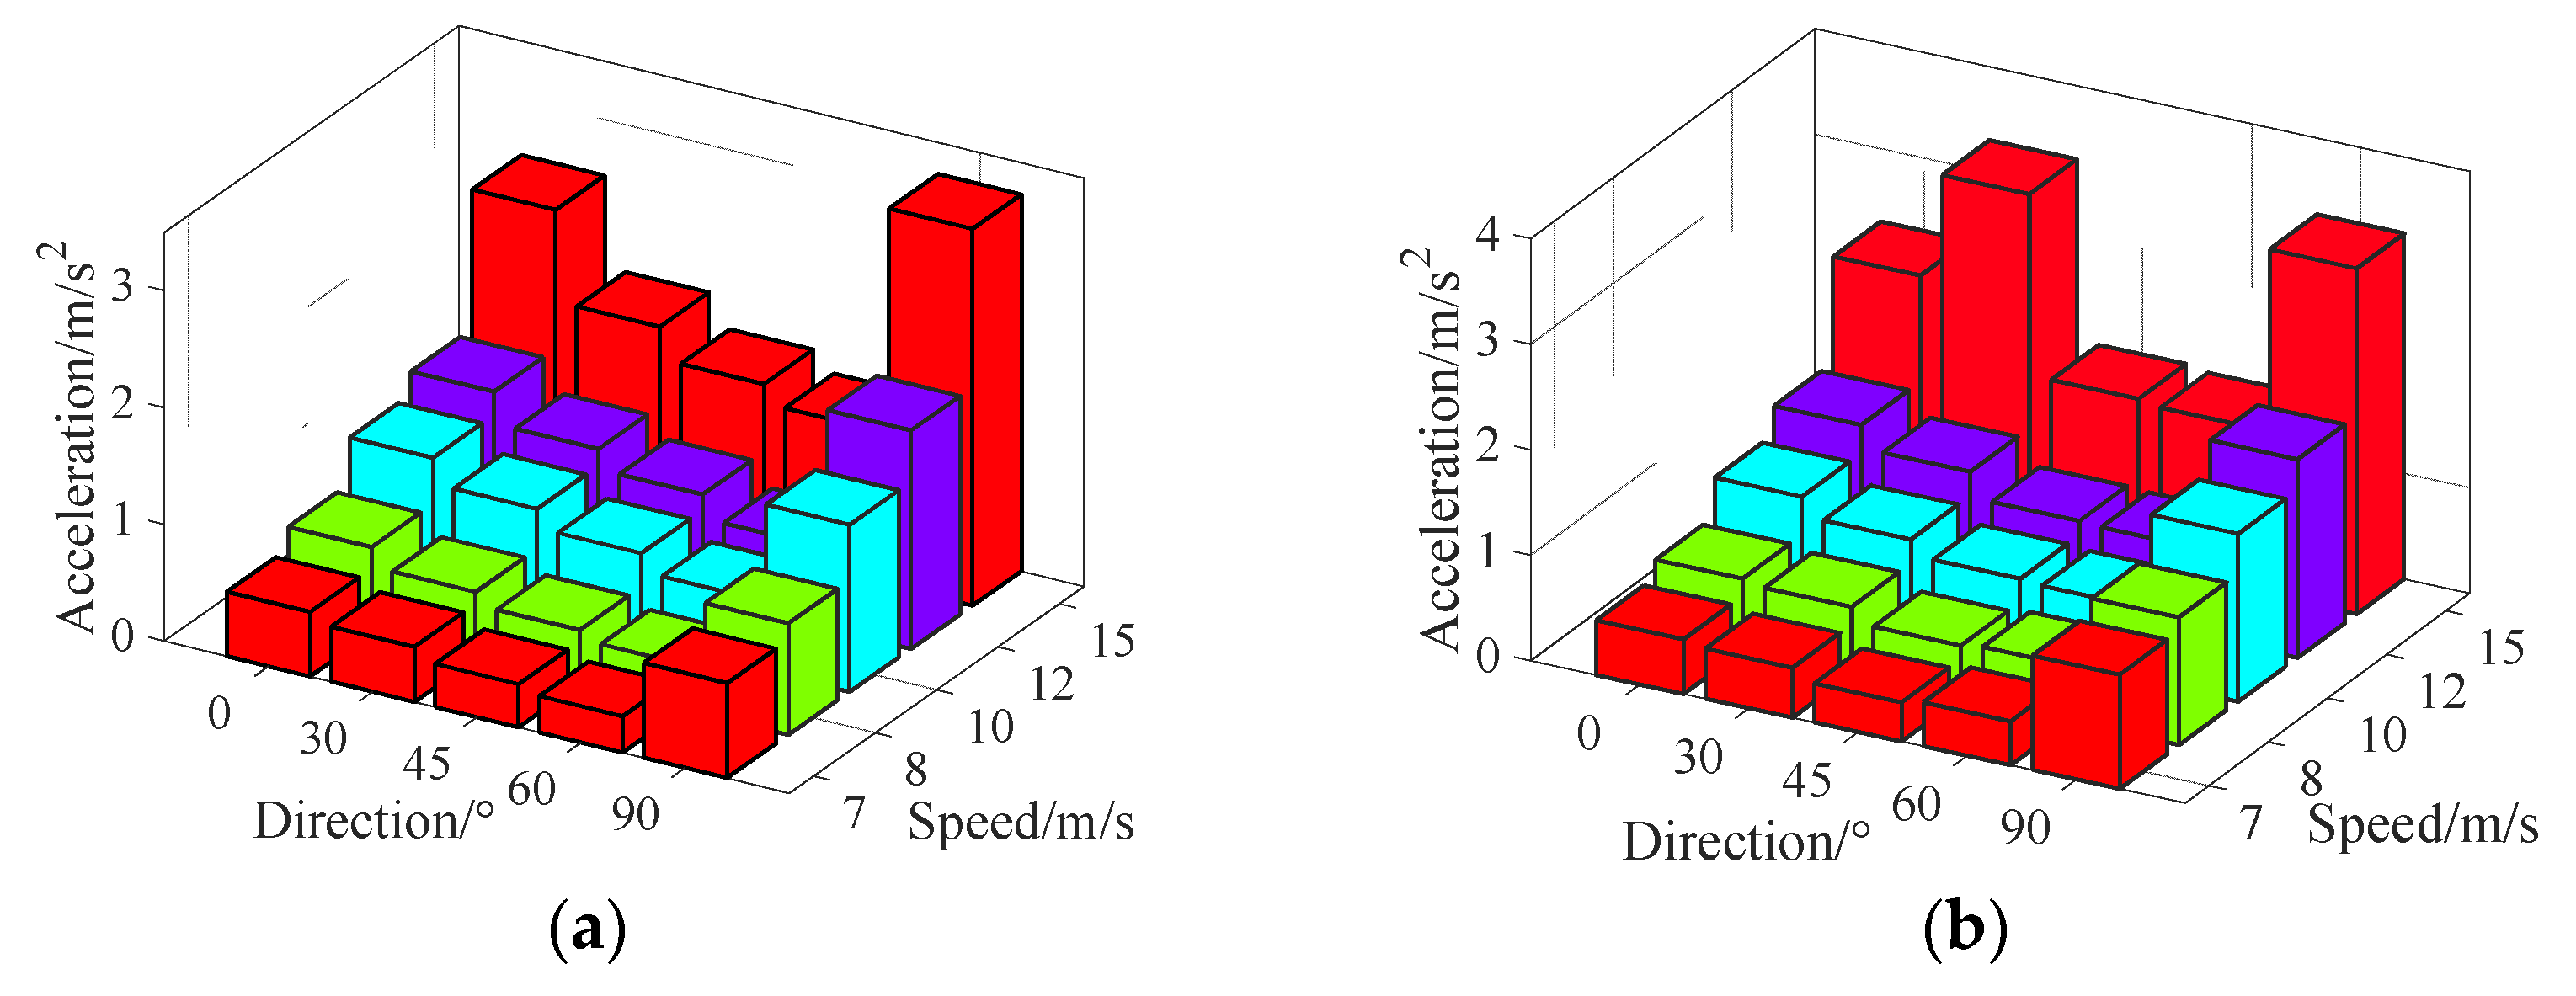
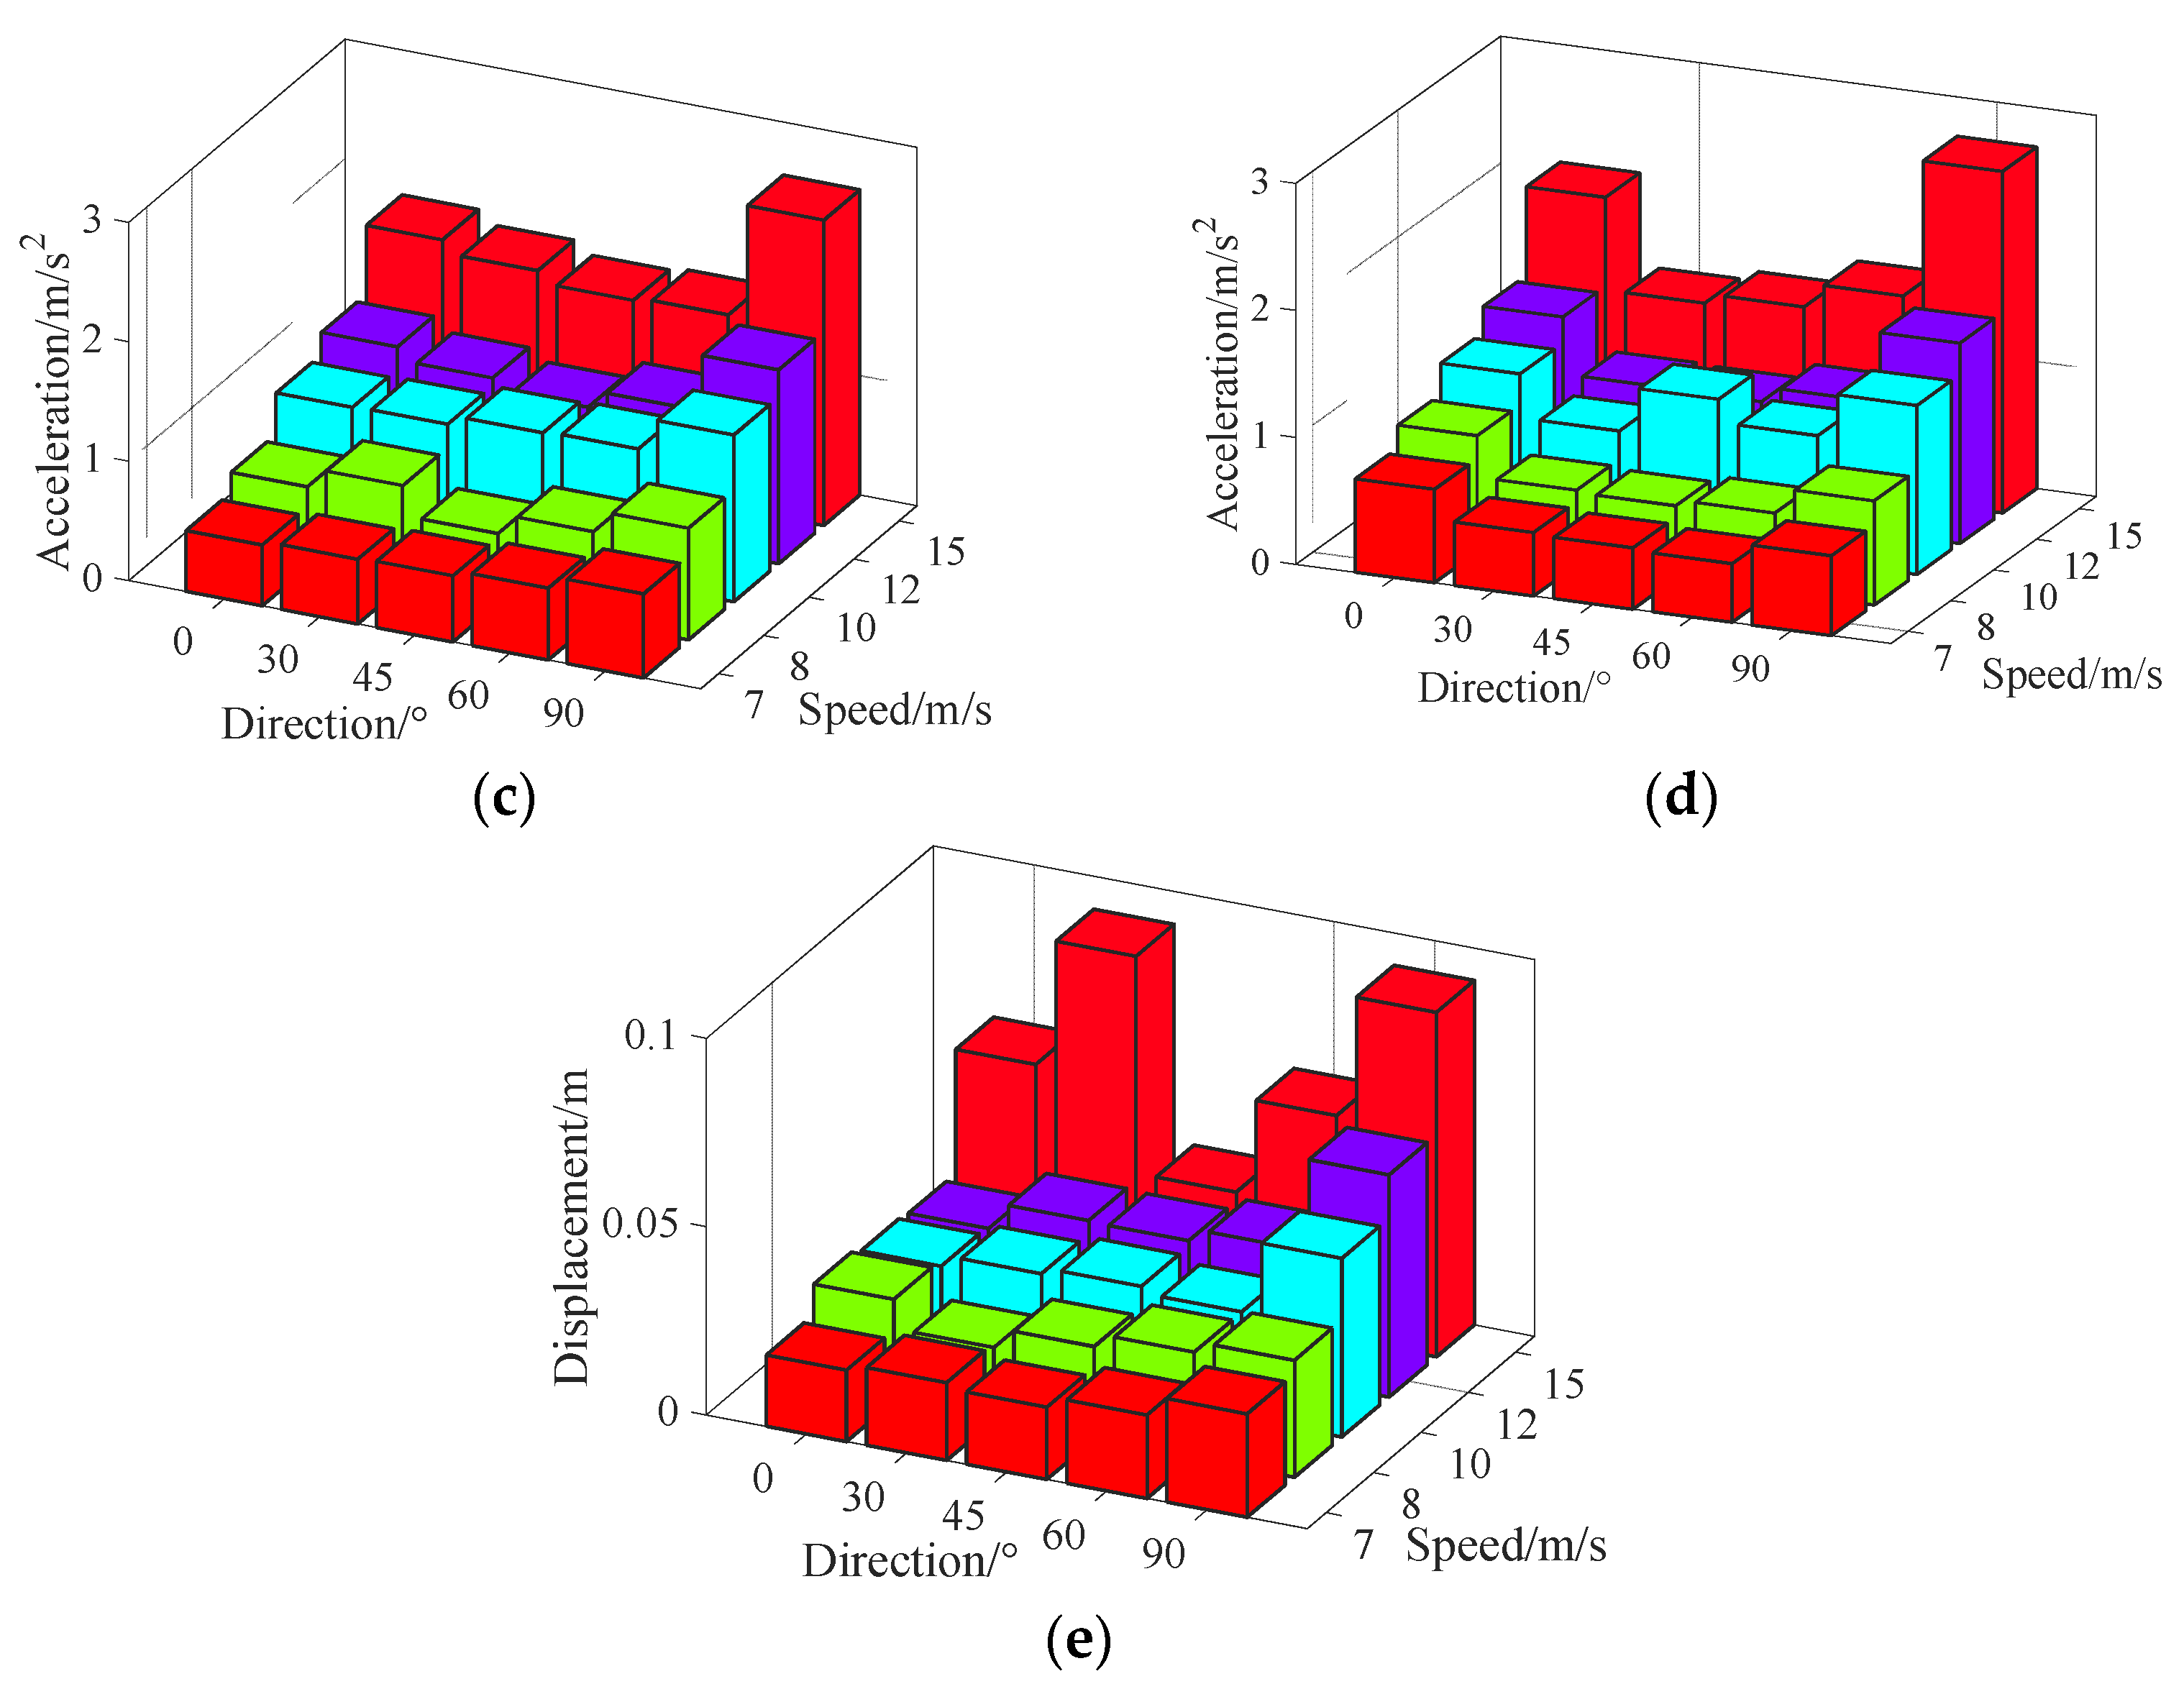
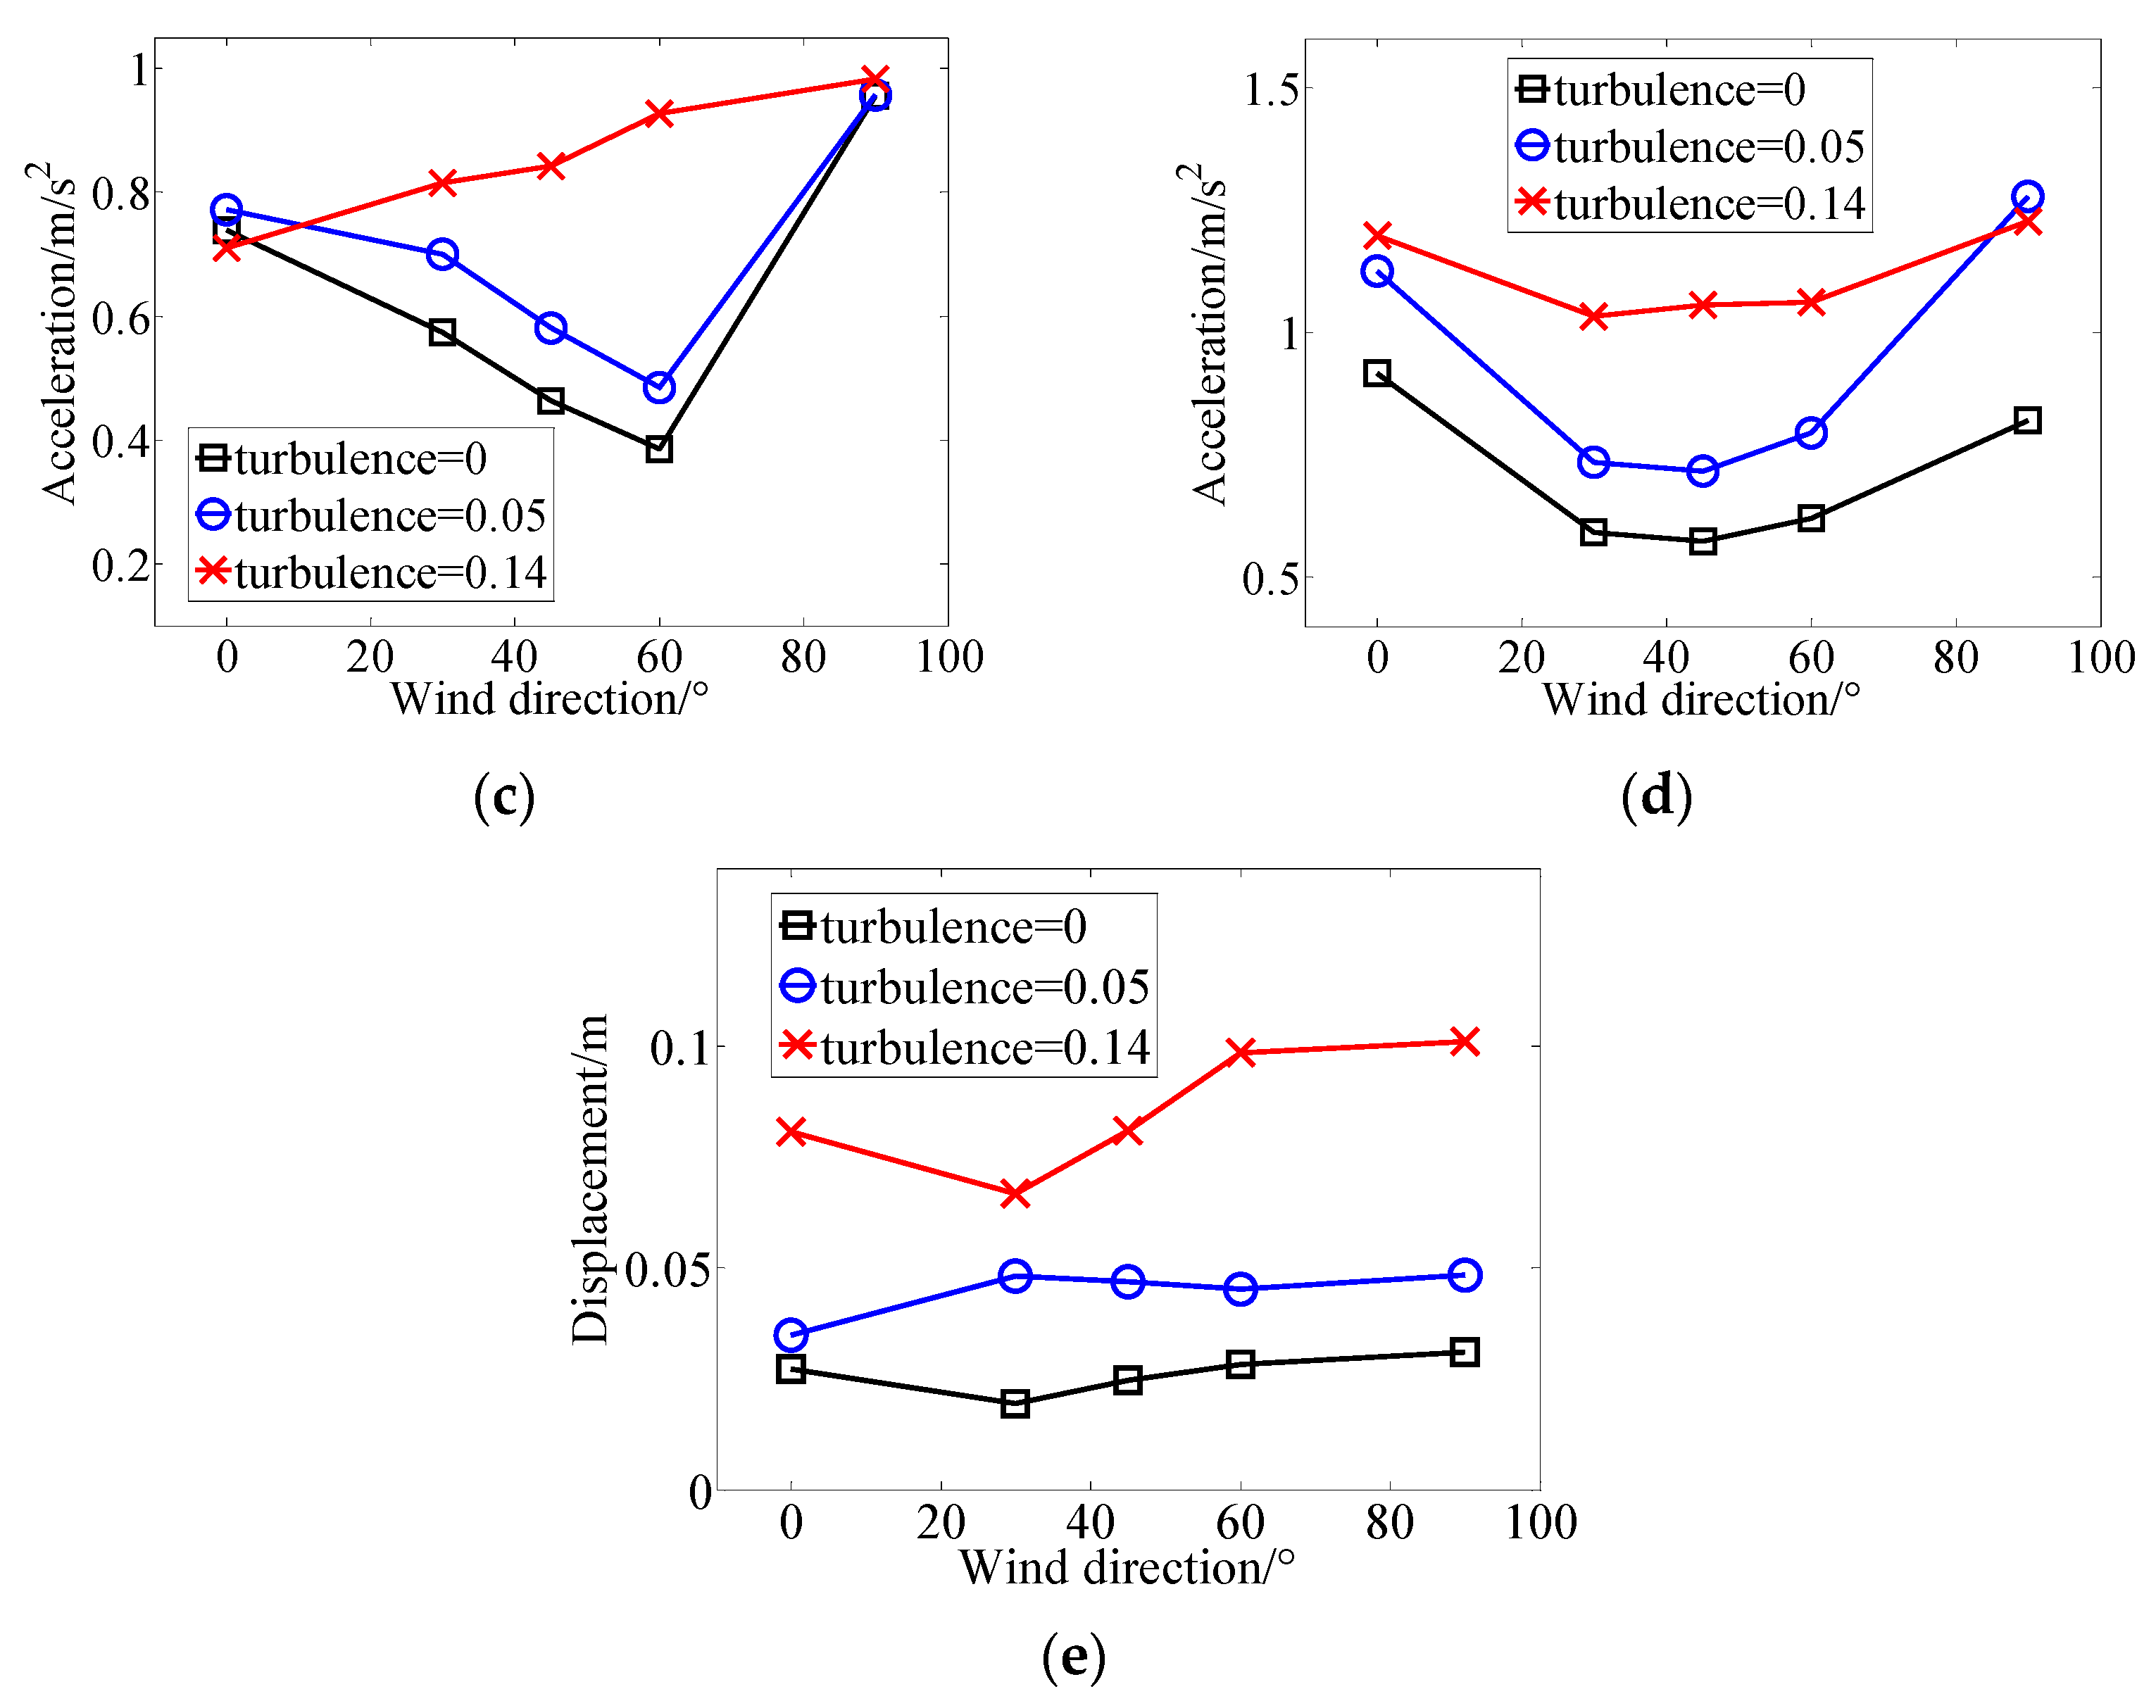
4.3. Experimental Results and Analysis

Figure 16 and Figure 17 show the five sensors’ recording results in the steady wind and transient wind tests, respectively.
Figure 16 shows that the acceleration and displacement are magnified when the wind becomes stronger, and the gradient increases significantly later. For the impact of the wind direction, both the acceleration and displacement decrease first and then increase when the wind direction angle changes from 0 to 90 degrees. This trend is opposite to the simulation results of the main bars. The reason is that the five sensors are installed on the auxiliary cross-bars that are within the framework rather than on the main bars at the edge, and the position of auxiliary cross-bars is more suitable for sensors to be fixed firmly. Therefore, the recording results of sensors can directly reflect the response of the auxiliary bars. The extreme stress of the main bars in the simulation is the physical quantity describing the bearing performance. The opposite trends of the main bars and auxiliary cross-bars can be explained by the vibrations of the transmission tower. When the wind direction angle increases, the 1st-mode and 2nd-mode vibrations are the main shake phenomena for the tower, while the deformation and bending of local auxiliary bars are restrained in the high-mode vibrations.
From Figure 17, the responses of acceleration and displacement generally become larger overall with increasing turbulence, which is consistent with the simulation results. Under the condition of the same turbulence intensity, the trend of displacement does not indicate a special regular change, while the acceleration has an obviously minimum value at the wind direction angle of 45 to 60 degrees. Furthermore, based on the records of sensors 1, 3, and 4, which are perpendicular to the transmission lines, if the turbulence is intensified and the wind direction angle becomes larger, the acceleration increment decreases. However, the measurements of sensor 2, along the transmission line direction, exhibit a clear and consistent regularity, and the acceleration increment does not decrease. The reason is that the low-frequency responses of transmission lines are significantly enhanced as turbulence increases. For sensors 1, 3, and 4, the increase in turbulence leads to a larger response proportion of the transmission lines but a smaller response proportion of the transmission tower. The similar change regularity, which is caused by the distribution coefficient of wind excitation in different directions of the transmission tower, may be weakened by the reduction in the transmission tower response.

5. Conclusions

This article mainly focuses on the models, damage prediction, and anti-wind experiments of transmission towers and lines. The results are summarized as follows.
(1) The real-time typhoon wind field mathematical model, which can reproduce the typhoon instantaneous wind distribution well, is useful and correct based on the verification of Typhoon Mujigae.
(2) For mechanical vibration, the tower’s response is mainly low frequency vibrations, whereas the lines are characterized by a high frequency response. The vibration of the transmission line has a more remarkable impact on the tower-line coupled model in the case of high turbulence. A long span should not be implemented in coastal typhoon regions to avoid the tower’s response stress going into a severe condition.
(3) For damage prediction, the maximum stress of the main bar may be larger than the material’s yield stress when the wind direction angle is close to 50 degrees under the condition that the average wind speed is not greater than (or nearly) 41.7 m/s. Considering the fluctuations, it is not certain that a collapse will occur when the typhoon’s stresses on the main bars are greater than 345 MPa. The tower is very likely to be broken if the instantaneous wind stress exceeds the yield stress by 20%.
(4) The anti-wind experiments show that the trends of accelerations and displacements on the main bars are opposite to those of auxiliary cross-bars under various conditions of wind speeds, wind directions, and turbulence. The damage prediction in the simulation is supported by testing an actual scaled model in the wind tunnel.

Author Contributions

Writing—Original Draft Preparation, R.G.; Writing—Review and Editing, C.X.; Visualization, R.G.; Supervision, Z.J.; Funding Acquisition, Z.J. All authors have read and agreed to the published version of the manuscript.

Funding

This research was funded by the Shenzhen Fundamental Research and Discipline Layout Project with No. JCYJ20180508152044145 and the National Natural Science Foundation of China with No. 52177021. The authors are grateful to their support.

Institutional Review Board Statement

Not applicable.

Informed Consent Statement

Not applicable.

Conflicts of Interest

The authors declare that the received funds do not lead to any conflicts of interest regarding the publication of this manuscript.

References

  1. Zhang, Z.; An, L.; Pang, S. The study of wind resistance performance in coastal region tower based on transmission line system model. Electr. Power Sci. Eng. 2016, 32, 642–650. [Google Scholar]
  2. Hou, H.; Yu, J.; Huang, Y. Risk assessment of transmission line trip caused by wind age yaw under typhoon. High Volt. Eng. 2019, 45, 3907–3915. [Google Scholar]
  3. Soisuvarn, S.; Oudomying, S. Characterization of the Tropical Cyclones Wind Radii in the North Western Pacific Basin Using the ASCAT Winds Data Products. In Proceedings of the 2018 Progress in Electromagnetics Research Symposium (PIERS-Toyama), Toyama, Japan, 1–4 August 2018; pp. 1428–1433. [Google Scholar]
  4. Fenerci, A.; Øiseth, O.; Rønnquist, A. Long-term monitoring of wind field characteristics and dynamic response of a long-span suspension bridge in complex terrain. Eng. Struct. 2017, 147, 269–284. [Google Scholar] [CrossRef]
  5. Chen, X.; Zhong, L.; Li, M. Review on the research status of power system risk identification under typhoon disaster. Proceed Comput. Sci. 2019, 155, 780–784. [Google Scholar] [CrossRef]
  6. Zheng, Y.; Chun, X.; Wei, P. Analytical Study on Wind-Induced Vibration and its Control of Transmission Towers in Mountainous Area. Appl. Mech. Mater. 2012, 78, 1473–1478. [Google Scholar]
  7. Batts, M.E.; Cordes, M.R.; Russell, L.R. Hurricane wind speeds in the United States. J. Struct. Div. 1980, 106, 25–30. [Google Scholar] [CrossRef]
  8. Shapiro, J.L. The Asymmetric Boundary layer Flow Under a Translating Hurricane. J. Atmos. Sci. 1984, 40, 85–92. [Google Scholar] [CrossRef] [Green Version]
  9. Cardone, V.J.; Greenwood, C.V.; Greenwood, J.A. Unified Program for the Specification of Hurricane Boundary Layer Winds Over Surfaces of Specified Roughness. Ocean Weather 1992, 64, 285–290. [Google Scholar]
  10. Holland, G.J. An analytic model of the wind and pressure profiles in Hurricanes. Mon. Weather 1980, 108, 1212–1218. [Google Scholar] [CrossRef]
  11. Meng, Y.; Matsui, M.; Hibi, K. An analytical model for simulation of the wind field in a typhoon boundary layer. J. Wind Eng. Ind. Aerodyn. 1995, 56, 291–310. [Google Scholar] [CrossRef]
  12. Xie, R.; Wu, T.; Wang, Y. Adaptability research on typhoon wind-field model. J. Hefei Univ. Nat. Sci. 2014, 24, 84–88. [Google Scholar]
  13. Zhang, L.; Niu, H.; Qi, Q. Comparisons of several typhoon field models. Shanxi Archit. 2015, 41, 27–28. [Google Scholar]
  14. Battista, R.C.; Rodrigues, R.S.; Pfeil, M.S. Dynamic behavior and stability of transmission line towers under wind forces. J. Wind. Eng. Ind. Aerodyn. 2003, 91, 145–150. [Google Scholar] [CrossRef]
  15. Wu, X.; Peng, K.; Geng, L. Real-time online monitoring and evaluation of wind-induced vibration response of transmission tower in typhoon environment. Chin. J. Appl. Mech. 2018, 35, 328–332. [Google Scholar]
  16. Zhu, H.; Yang, Z. Numerical study on scale of high speed train model for wind tunnel testing. In Proceedings of the 2011 International Conference on Electrical and Control Engineering, Yichang, China, 16–18 September 2011; pp. 725–728. [Google Scholar]
  17. Guo, Y.; Sun, B.; Ye, Y. Wind tunnel test on aeroelastic model of long span transmission line system. J. Zhejiang Univ. 2007, 41, 1482–1486. [Google Scholar]
  18. Tian, L.; Wang, W.; Zeng, Y. Design study of an aero-elastic model of long span transmission tower-line system wind tunnel. Ind. Archit. 2017, 47, 74–78. [Google Scholar]
  19. Li, X.; Pan, Z.; She, J. A method for adjusting typhoon parameters. Adv. Mar. Sci. 1995, 2, 11–15. [Google Scholar]
  20. Wei, J. Analysis of Typhoon Characteristics and Wind-Induced Vibration Measurement of Super Tall Building; Harbin Institute of Technology: Harbin, China, 2019. [Google Scholar]
  21. Li, L. Study on Typhoon Fluctuating Wind Speed Spectrum Based on Near-Earth Observation; Harbin Institute of Technology: Harbin, China, 2008. [Google Scholar]
Figure 1. Tower collapse in typhoon weather.
Energies 15 03372 g001
Figure 2. Definition of the flow direction and polar coordinate.
Energies 15 03372 g002
Figure 3. The process of the calculation program.
Energies 15 03372 g003
Figure 4. The tower-line coupled simulation model.
Energies 15 03372 g004
Figure 5. The simulation wind field: (a) Wind speed distribution; (b) Cyclonic radius.
Energies 15 03372 g005
Figure 6. The real-time average wind speed.
Energies 15 03372 g006
Figure 7. The instantaneous superimposed wind speed.
Energies 15 03372 g007
Figure 8. The vibrations of a single tower: (a) 1st mode; (b) 2nd mode; (c) 3rd mode; (d) 4th mode.
Energies 15 03372 g008
Figure 9. The vibrations of the tower-line coupled model: (a) 1st mode; (b) 10th mode; (c) 33rd mode; (d) 39th mode.
Energies 15 03372 g009
Figure 10. The instantaneous maximum stress: (a) Scatter plot; (b) Continuous plot.
Energies 15 03372 g010
Figure 11. Extreme response stresses.
Energies 15 03372 g011
Figure 12. The power spectral density analysis.
Energies 15 03372 g012
Figure 13. The tower-line coupled scale model. (a) Single tower; (b) Tower and lines.
Energies 15 03372 g013
Figure 14. The meshing grilles.
Energies 15 03372 g014
Figure 15. The installation of the five sensors.
Energies 15 03372 g015
Figure 16. The results in the steady wind test: (a) Sensor 1; (b) Sensor 2; (c) Sensor 3; (d) Sensor 4; (e) Sensor 5.
Energies 15 03372 g016aEnergies 15 03372 g016b
Figure 17. The results in the transient wind test: (a) Sensor 1; (b) Sensor 2; (c) Sensor 3; (d) Sensor 4; (e) Sensor 5.
Energies 15 03372 g017aEnergies 15 03372 g017b
Table 1. The parameters of the simulation model.
ItemsValue/TypeItemsValue/Type
Voltage level220 kVTower full height48.9 m
TowerSZ631-33Cross-arm height33 m
Tower main barQ345Root width8.9 m
Tower auxiliary barQ235Tower simulation elementBeam188
Line conductorLGJ-300/25Line simulation elementLink180
Grounding lineGJ-50Span between towers300 m
Tower patternStraightCalculation typeTransient analysis
Line patternSuspended loop line
Table 2. The measured data of Typhoon Mujigae.
ItemsValueItemsValueItemsValue
Time6:00, 4 October 2015Maximum wind speed46.8 m/sLongitudeE110.45
Pressure94.2 kPaCyclonic radius224.1 kmLatitudeN21.22
Table 3. Experimental parameters.
Steady WindTransient Wind
SpeedDirection AngleSpeed m/sDirection AngleTurbulence
7 m/s8 m/s0.05
8 m/s30°30°0.14
10 m/s45°45°/
12 m/s60°60°/
15 m/s90°90°/
Publisher’s Note: MDPI stays neutral with regard to jurisdictional claims in published maps and institutional affiliations.

