Abstract
The current need for power-system control-room operational tools to increase real-time situational awareness has led to various proposals on data analytics algorithms to obtain operational information from SCADA and PMU power system networks. Most of the proposals are implemented in simulation, with reduced practical significance for system operators. This work proposes a web-based simple algorithm to identify the dynamic parameters of a reduced-order model of power system frequency dynamics that is implemented with industrial hardware on a PMU network in the Chilean power system. To demonstrate the applicability of the proposed tool, the algorithm is implemented in a web page with real-time monitoring of the frequency of the Chilean power system, so that utilities and academic institutions with access to PMU measurements can apply the proposed concepts regardless of the topology of the monitored system.
1. Introduction
With increasing penetration of renewable generation and the progressive de-commitment of synchronous machines, frequency stability is becoming an important concern of systems operators [1]. One aspect that becomes challenging is real-time operation, for which situational awareness is a necessity. Traditionally, power system operators conduct studies and simulations on complex and detailed models based on mathematical modeling of the underlying physics of power system dynamic phenomena. These approaches are normally known as physically driven or first principle-driven modeling [2], and they manifest in a computational complexity that limits their application to situational awareness in real-time operation [3].
With the development of supervisory control and data acquisition (SCADA) and phasor measurement unit (PMU) networks, the precision of a resolution of the measured data has increased from 1/3600 Hz up to 100 Hz, significantly increasing the volume of generated data [4]. This growth on the measured information has led to the development of simplified models with less physical meaning but more accurate representation of actual data, normally known as data-driven models [5,6,7]. Power system data-driven models have captured particular attention in terms of modeling diverse elements of the grid, such as generators, power electronics devices, and loads to improve the accuracy of physically driven models [8,9,10,11,12].
Similarly, pure data-driven or mixed-type models are becoming more useful, as they can be easily integrated into power system control rooms. They can be identified by using real-time data, and provide very fast assessments of diverse operating situations to assist in decision making. On a recent report from an IEEE task force, the authors present the results of a survey to 10 different transmission system operators from different parts of the world. The need to develop tools based on data-driven models is emphasized, concluding that these tools must be simple enough that they can actually be used in control rooms [13]. Some examples of the application of data-driven models for power systems include the estimation of inertia and estimation of the rate of change of frequency (ROCOF) and nadir [14,15,16].
There is extensive literature on mathematical formulations to process data to improve situational awareness; however, most of the proposals are tested in simulations with limited practical significance. In general, analytical tools have to be integrated to existing technologies in power system control rooms, and solutions must be simple to facilitate integration to a growing number of different platforms [17,18,19]. In this scenario, data analytics and data-driven applications must be configured by using commercial software and hardware implementations.
Educational and industrial initiatives showing practical applications are in the development process. The initial FNET/GridEye from the University of Tennessee has developed various applications [20,21,22], such as real-time power system status visualization, disturbance recognition and location, interconnection-wide oscillation detection and analysis, modal analysis using ambient measurement data, islanding and off-grid detection, measurement-aided model validation, electro-mechanical speed map development, and historical data statistical analysis. One aspect that is not explored in this initiative is the online identification of dynamic parameters associated with data-driven models, which is an important feature as mentioned above. Another initiative is the Meedfasee project, which is a low-voltage synchropahosor network development in Brazil. The applications that have been developed are disturbance detection, system-wide model validation, small-signal stability, and fault location [23,24]. Data-driven models are also not considered in this development.
Industrial applications for inertia estimation can also be found. For instance, the Electric Reliability Council of Texas (ERCOT) [25] has an inertia estimation and forecasting tool that sums the inertia of all online generators reported from the SCADA system to estimate total system inertia. In the National Grid ESO [26], a tool to estimate inertia has been developed as well by the Ultracapacitor technology from the company Reactive Technologies [27]. GE’s digital effective inertia measurement tool, which is non intrusive, can measure frequencies and power flows every 50 s to estimate and forecast the inertia on the system [28]. In this sense, in the context of industrial applications, data-driven models have not been widely explored.
As can seen above, most real-time applications currently in place are focused on estimating inertia, neglecting the estimation of other parameters. Although various data-driven proposals can be found in the literature on applications for control room situation awareness in the context of power systems [29], the implementation of more sophisticated algorithm tools to characterize in depth the dynamic response of the frequency are limited to theoretical/simulation demonstration, with limited practical applications valuable to system operators.
This work proposes a web-based tool to identify the parameters of a reduced order model of the frequency variations in real time. The proposed methodology first processes the frequency in real time measured from a PMU network in order to capture abnormal frequency behavior associated with the sudden changes in power balance. Then, a parameter identification of a reduced order model that mimics the frequency response measured is performed. The tool is implemented in a web application by using real measurements of the Chilean power system to show practical significance. The following sections present the hardware and software implementations of the proposed tool.
2. Frequency Dynamic Model
The reduced-order frequency model used in this work is shown in Figure 1.
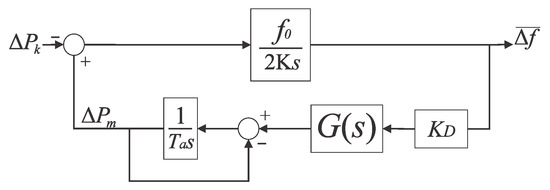
Figure 1.
Reduced-order frequency model [30].
In Figure 1, (MW) represents the magnitude of power imbalance, (Hz) is the scheduled system frequency, K (MWs) is the kinetic energy stored in the rotational masses within the system (also known as inertia), (MW/Hz) is the overall proportional gain of all governors, and is the transfer function associated with the overall governor response (for this study, ). is the incremental variation of system frequency over computed as the center of inertia (COI). The COI is the weighted arithmetic mean of the frequency at all buses averaged by the corresponding inertia of such a bus [31]. Note that the model does not represent other stability aspects such as voltage stability or small signal stability that are assumed to be controlled. The model is only meant to represent frequency stability. The following section will consider how to tune the parameters of the model to obtain a correspondence between the model an actual data.
3. Synchrophasor Network and PMU Hardware
Measurements of frequency are obtained from the Chilean power system, which is a 50-Hz, isolated power system in South America. There is a synchronous tie-line connecting Chile and Argentina, which is currently out of service.
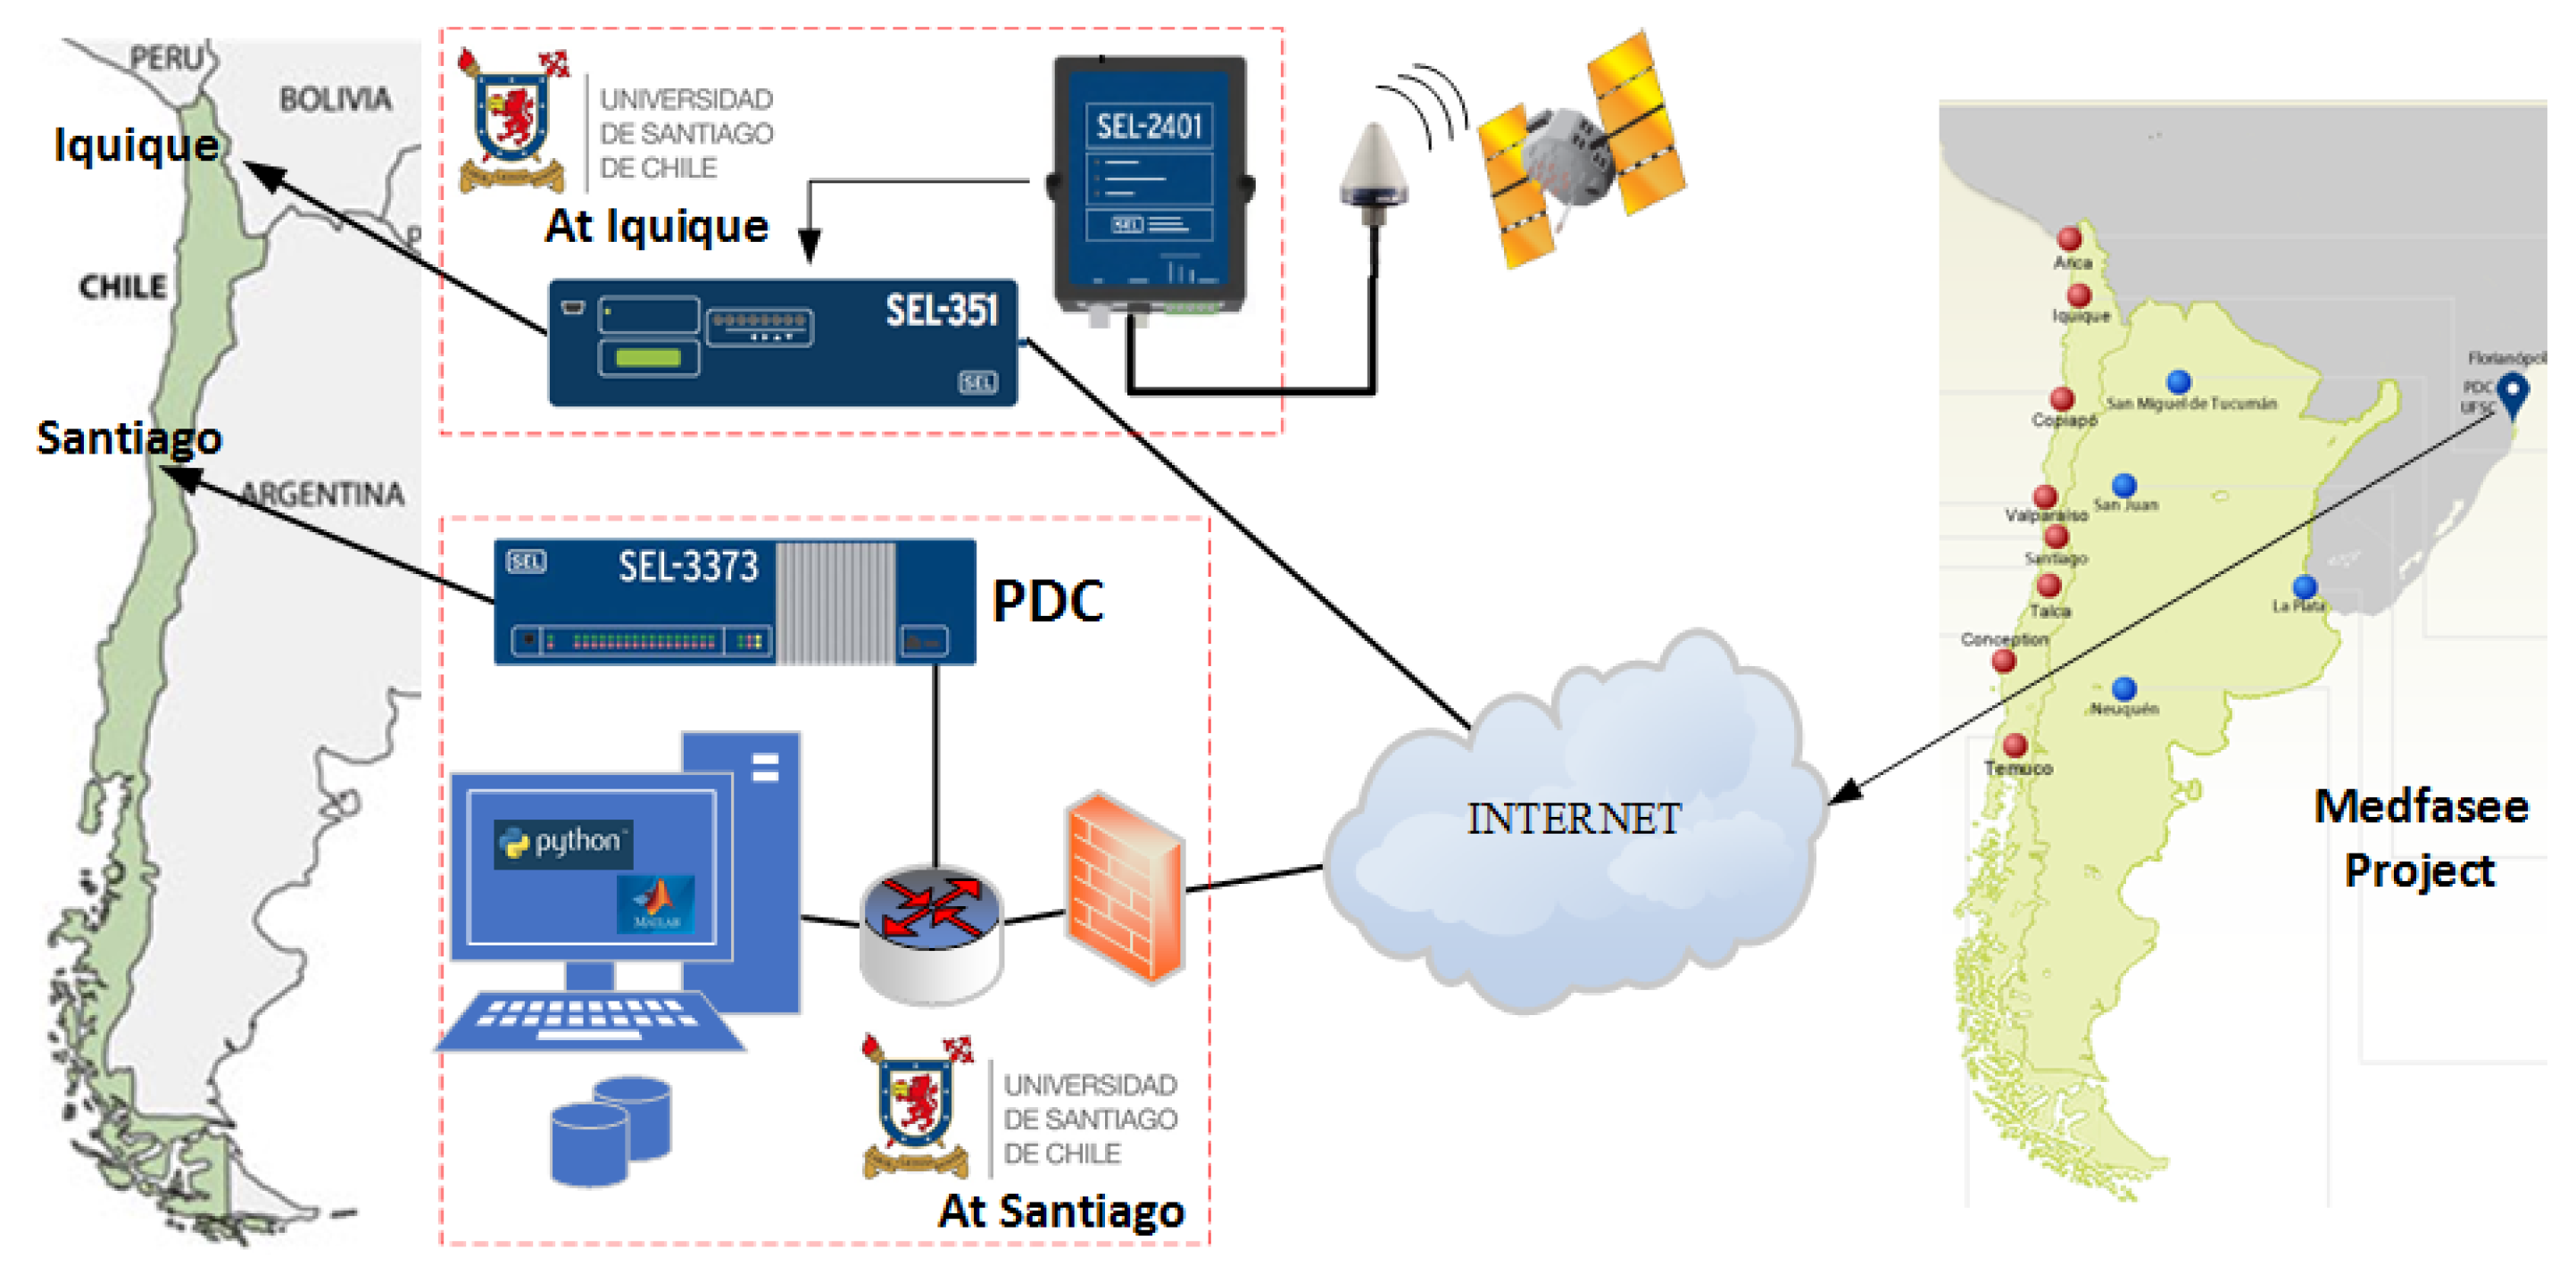
The University of Santiago belongs to a low-voltage synchrophasor network, called Medfasee (see right side of Figure 2). This synchrophasor network shares electrical variables from several places from Chile and South America [32]. The University of Santiago contributes to the Medfasee project with a PMU located in Chile’s northern town of Iquique (see left side of Figure 2).
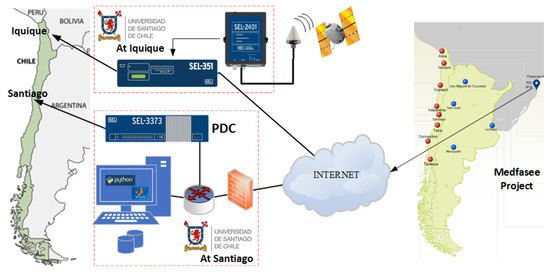
Figure 2.
Syncrophasor network. There are 8 PMU points located in Chile.
The PMU implemented is a SEL-351A; it is an over-current relay that can work as PMU, through the std. IEEE C37.118 to share measurements. This device works with a sample rate of 50 sample per second.
The frequency data of PMU located at Iquique and in the Medfasee project are transmitted over the internet to Santiago, where a phasor data concentrator (PDC), SEL-3373, receives the measurement for further processing.
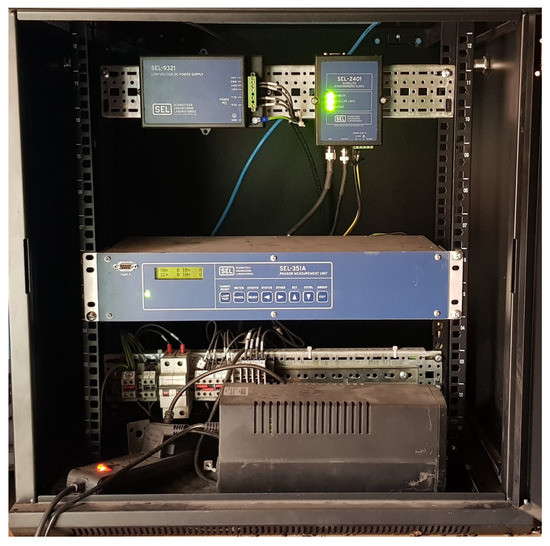
Figure 3.
PMU SEL-351A.
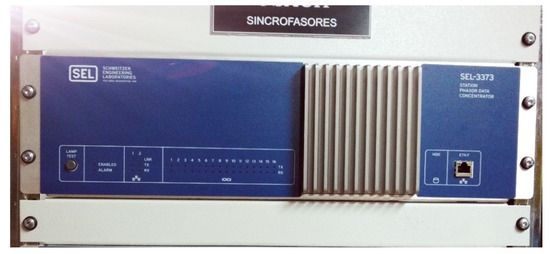
Figure 4.
PDC SEL 3373.
The PMU data from the network is grouped together in the PDC, which is a SEL 3373, and it is located in Santiago, Chile. The Figure 4 shows PDC.
In this way, the real-time data from the actual Chilean power system is collected.
4. Data Analytics Algorithms
The main purpose of the algorithm is to identify the parameters of the model depicted in Figure 1 to identify actual data that is captured with the hardware described above. More explanatory details on the algorithm are found in [33,34]. The general structure of the identification algorithm is shown in Figure 5, and it was built by using Python and Matlab. The algorithm receives measured frequency uninterruptedly and detects frequency events that are suitable for identification of the dynamic parameters of the model in Figure 1 by using COI, which is approximated by using the data of 8 PMUs in the Medfasee project located in Chile.

Figure 5.
Backend Algorithm.
The COI is approximated as shown in (1),
where is the frequency of PMU available online in Medfasee Project. As one can see, the COI approximation overlooks the inertia of the areas. However, this approximation was found to be accurate enough after observing the resulting identifications.
4.1. Algorithm for Contingency Identification
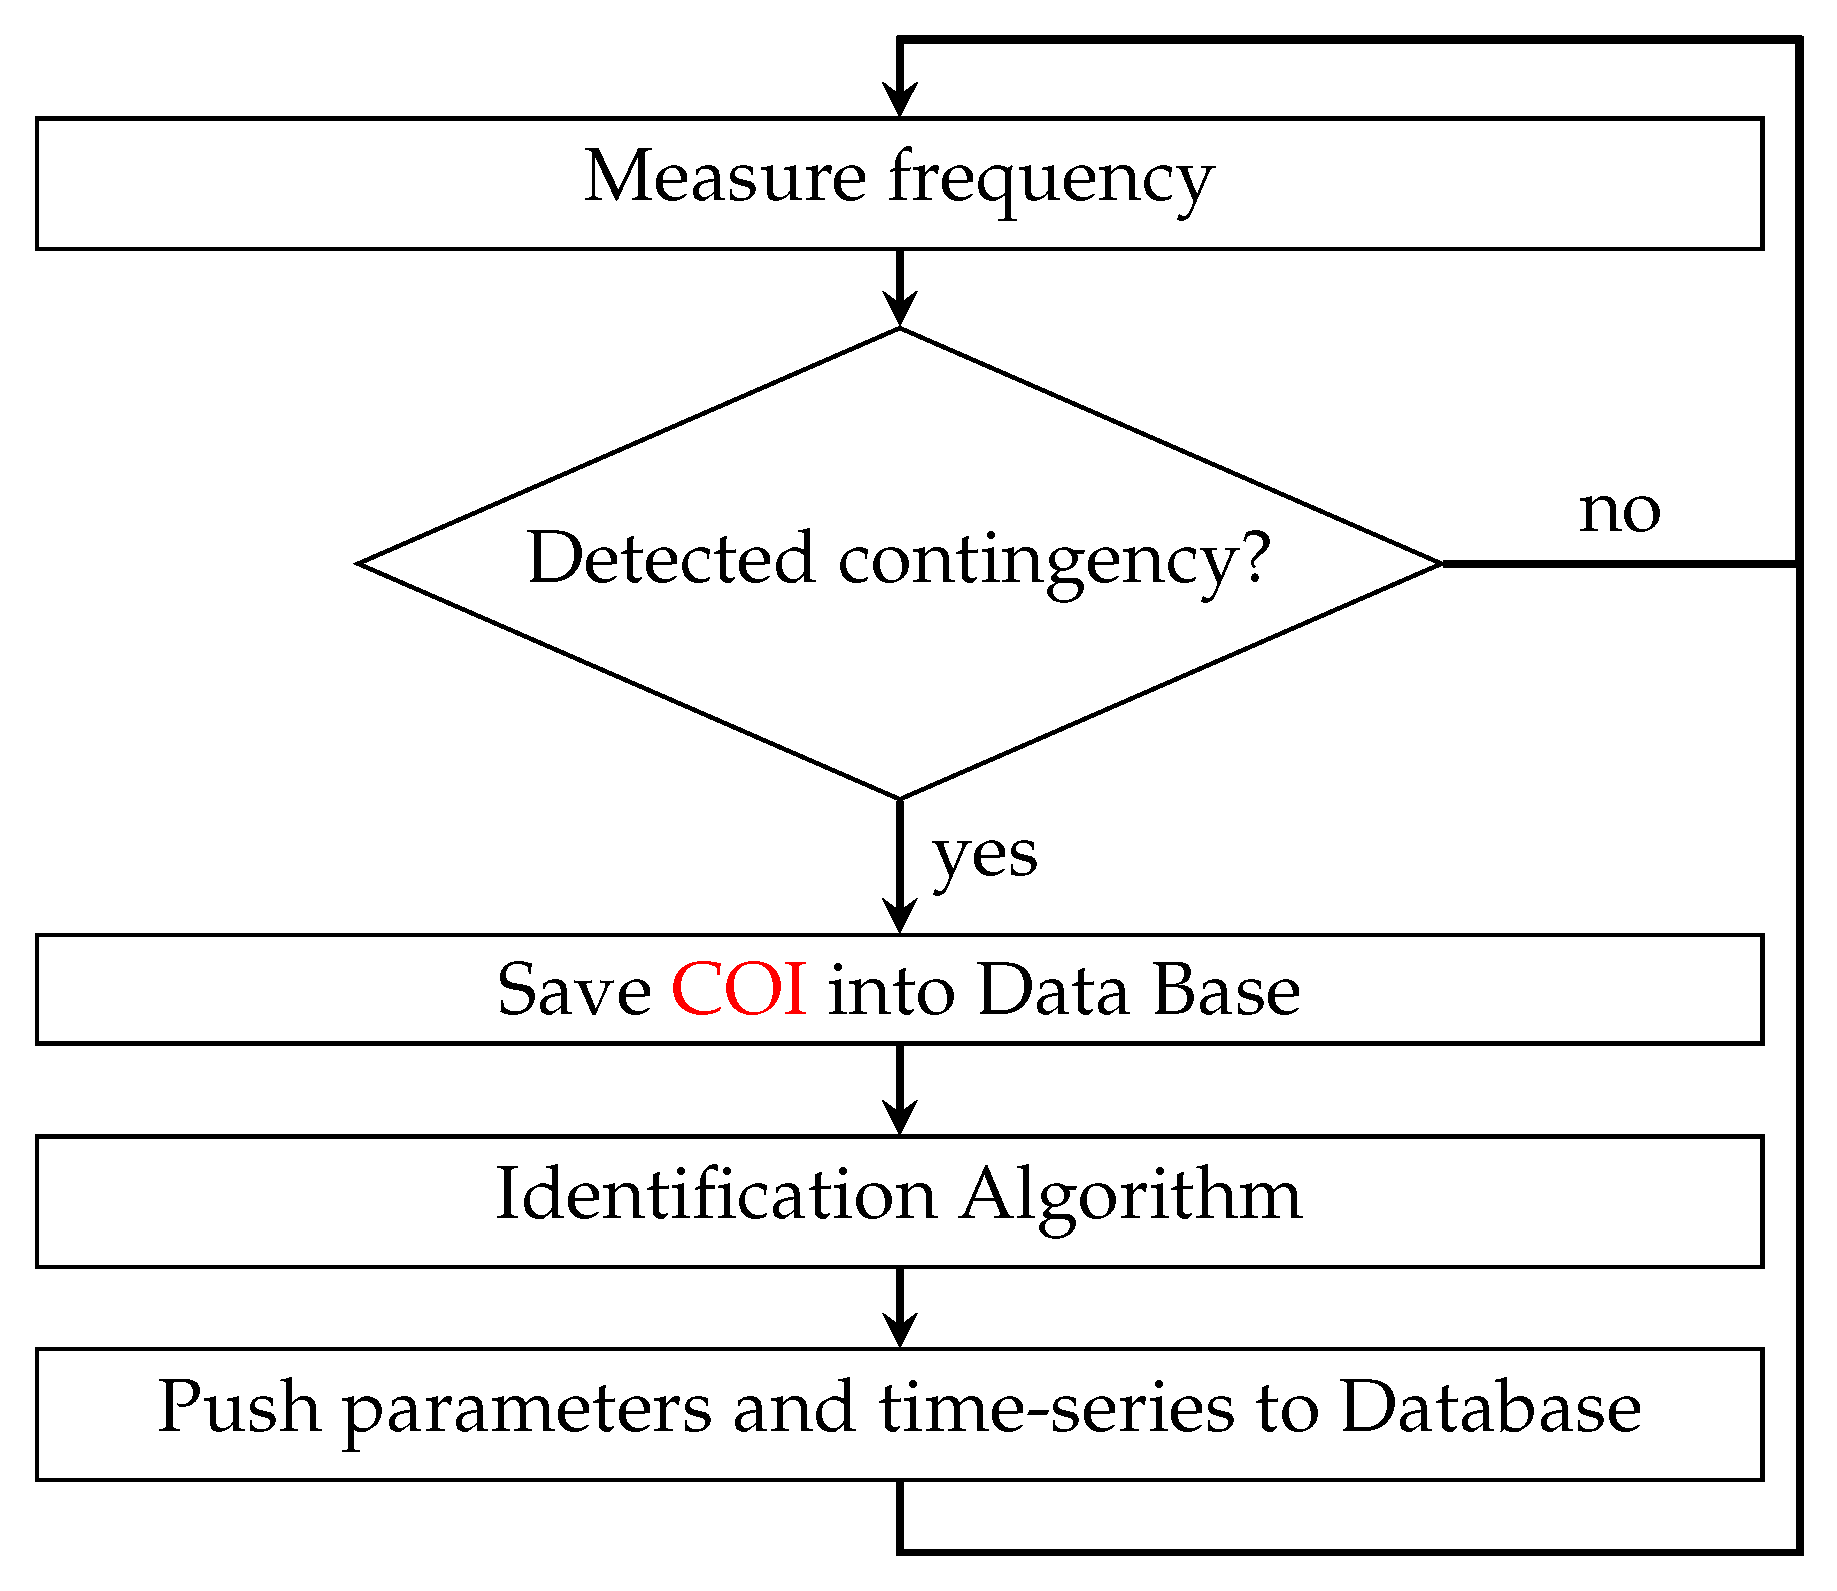
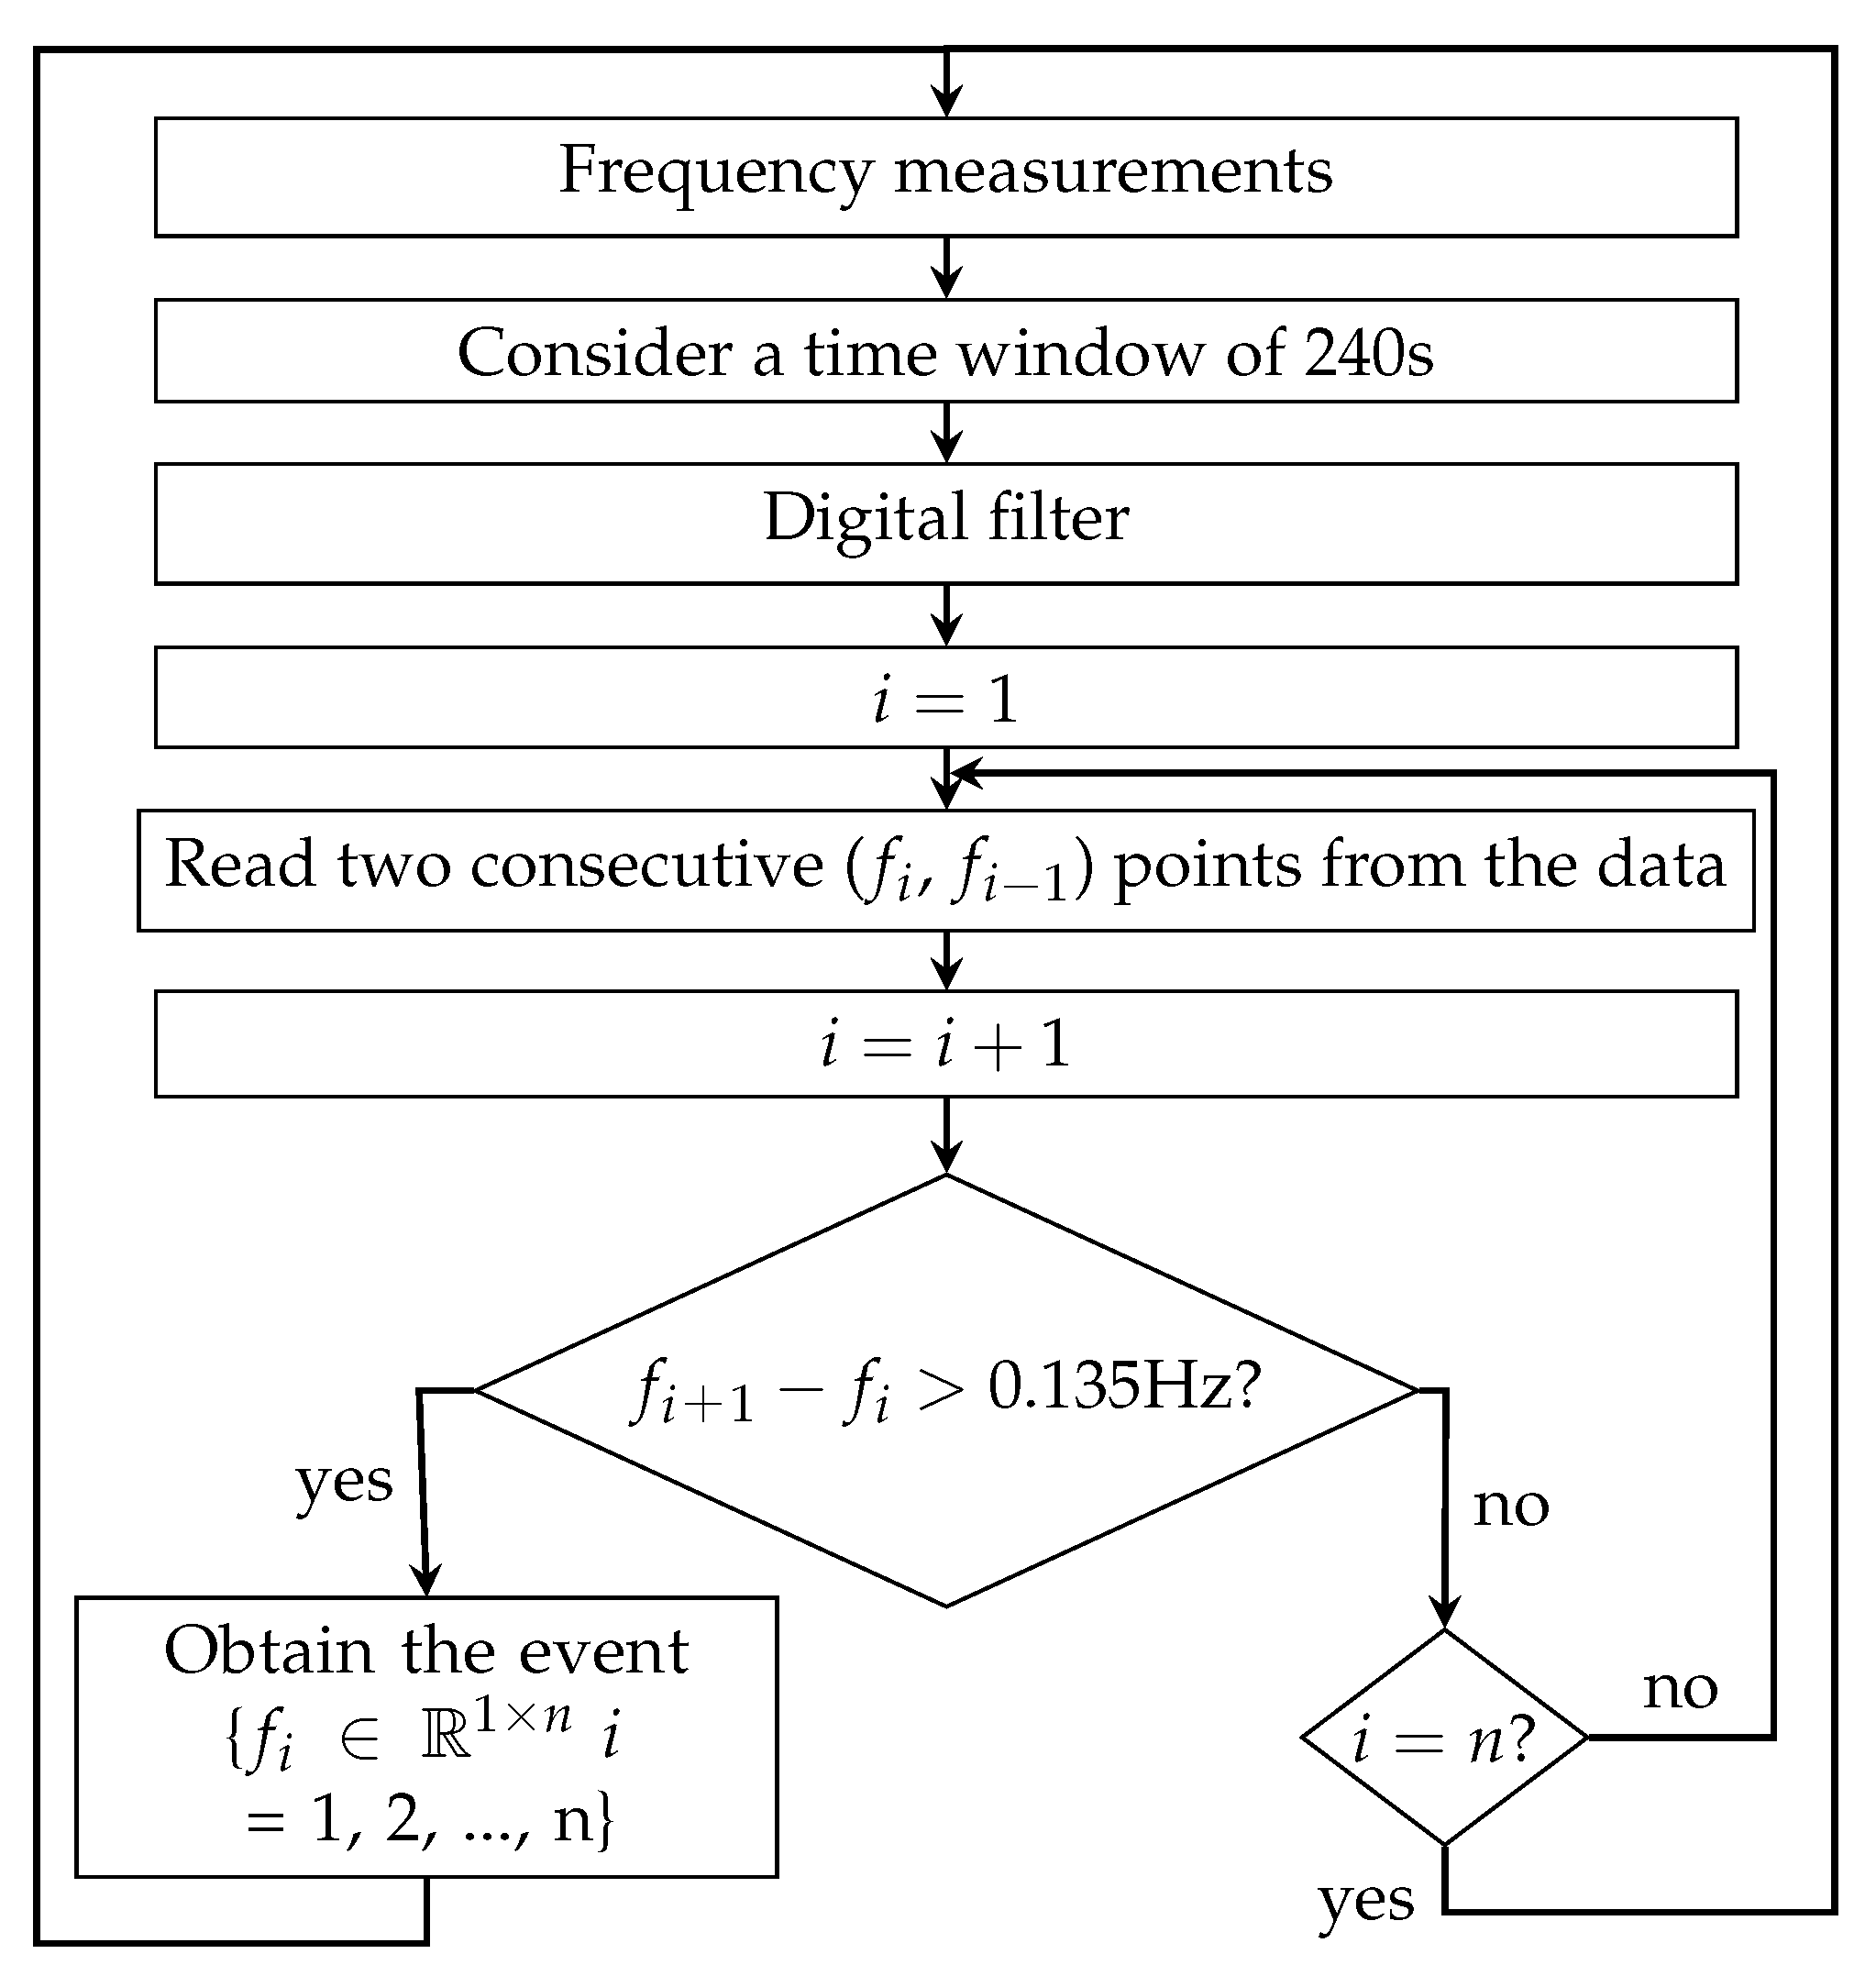
In order for the event-driven identification to be executed, data of sudden changes of power balance must be provided. Figure 6 shows the algorithm developed to identify contingencies from the PMU network data stream.
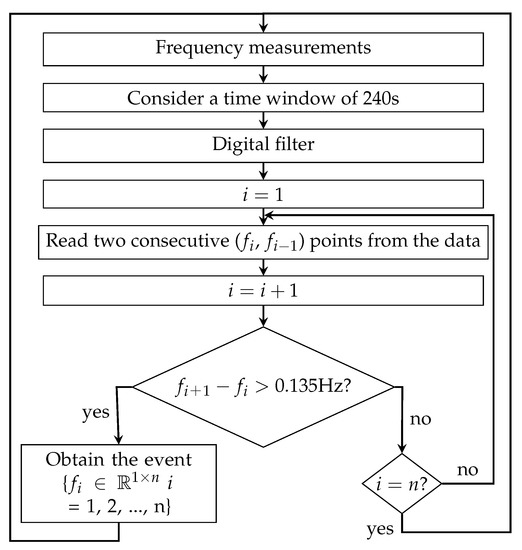
Figure 6.
Contingencies Identification Algorithm.
The algorithm begins measuring data from the PMU network and then considers a time-window of 240 s to have enough data from the event. After a digital filtering process to remove noise is applied, the algorithm determines if there is a pair of points (, ) that exhibit a difference larger or equal to 0.135 Hz. If that happens, the algorithm declares the occurrence of an event. The rationale behind this definition is simple; when a contingency occurs, the frequency drop/raises faster. By successive observation of measured data in the Chilean power system, the 0.135 Hz threshold was determined; see the analysis in [33] on this threshold. Clearly, this threshold definition is completely idiosyncratic to the Chilean power system, and a similar observation process must be performed if the algorithm is to be implemented in a different power system.
4.2. Inertia Identification
After a contingency has been detected, the system’s inertia K can be calculated by using the swing Equation (2), at the first instance following the power imbalance, using Equation (3),
where
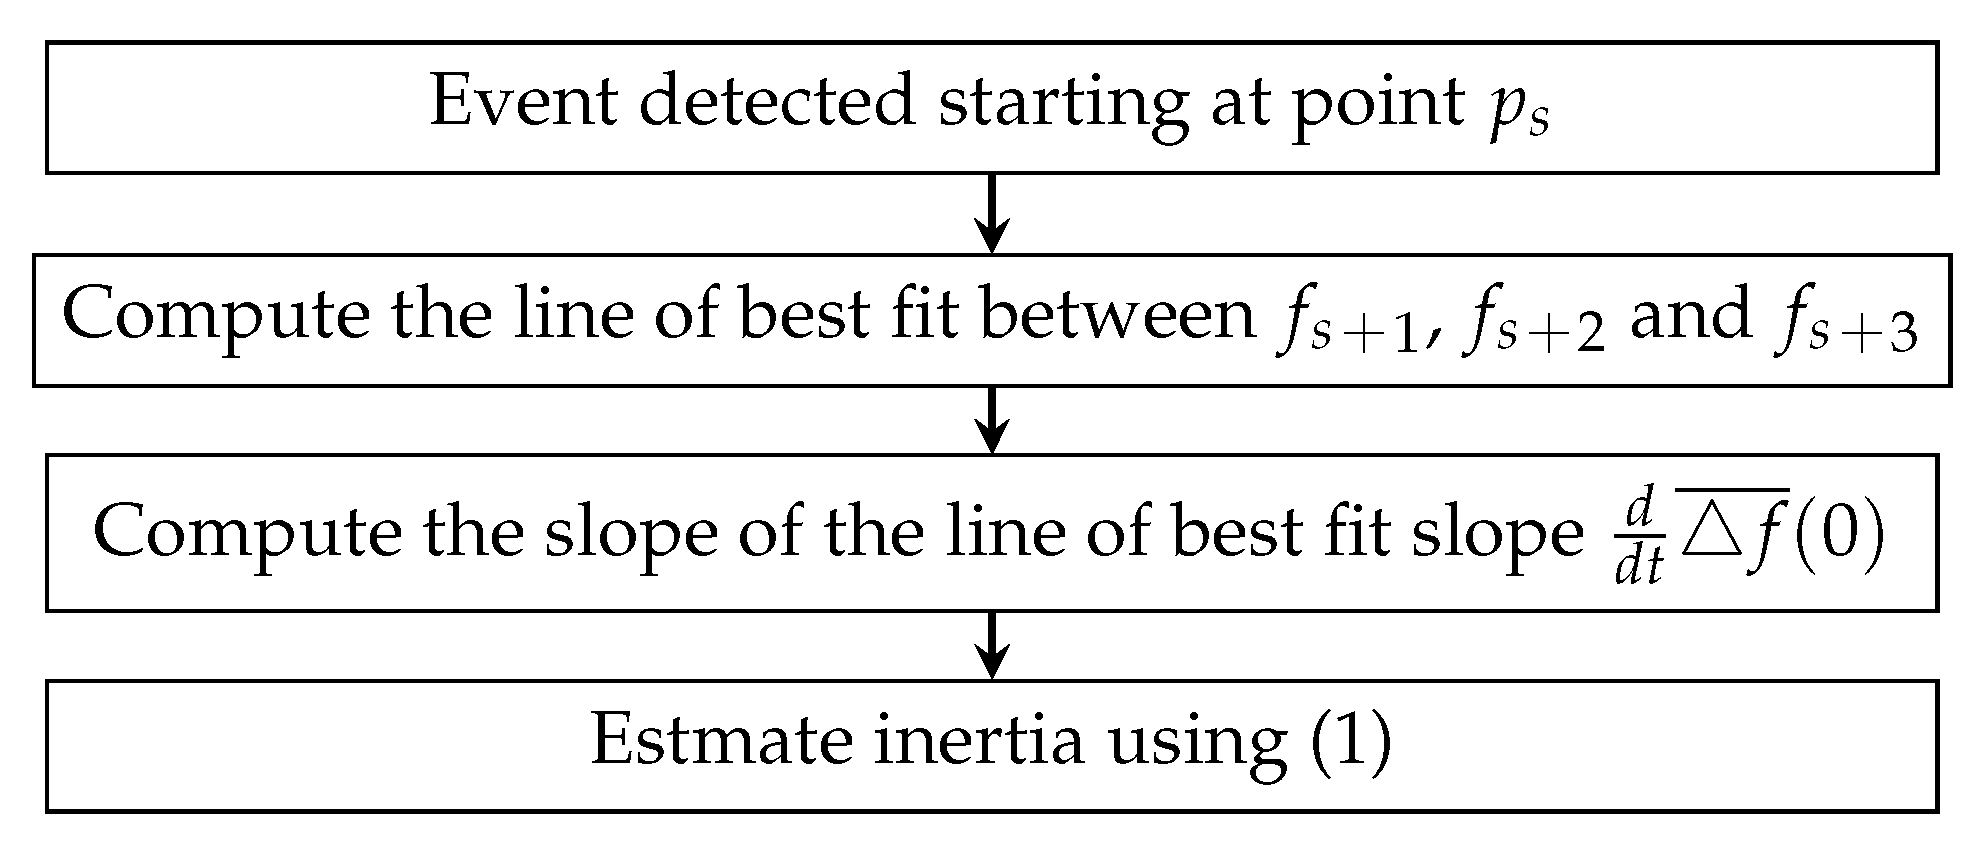
where and are consecutive time instants during the inertial behavior of system frequency after a sudden power imbalance. This definition of inertia from data is significantly sensible to the selection of and as it was observed by successive inertia estimations. Based on a database of frequency events in the Chilean power system, the first point of the frequency time series was not always in line with the rest of the slope, and the best straight line fitting the actual response was obtained by considering the second , third , and fourth points. Figure 7 shows a sketch of the inertia algorithm estimation.
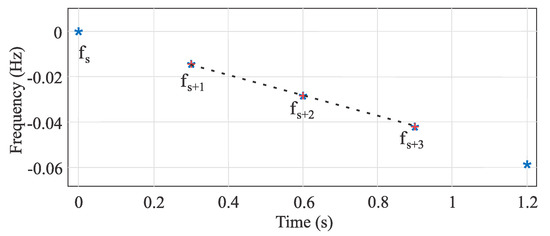
Figure 7.
Inertia Algorithm.
Figure 8 shows a flowchart of inertia algorithm estimation.
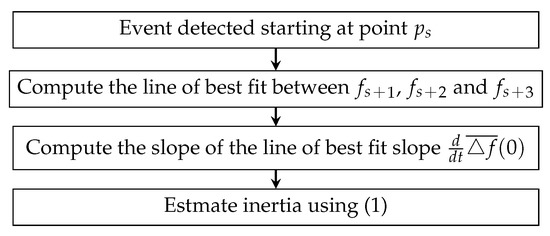
Figure 8.
Inertia Estimation Algorithm [34].
4.3. Droop Estimation
The frequency droop is a parametrization of the steady-state response of the overall governor actions within a power system. It measures the steady-state frequency drop that a power imbalance of magnitude produces as shown in Equation (5),
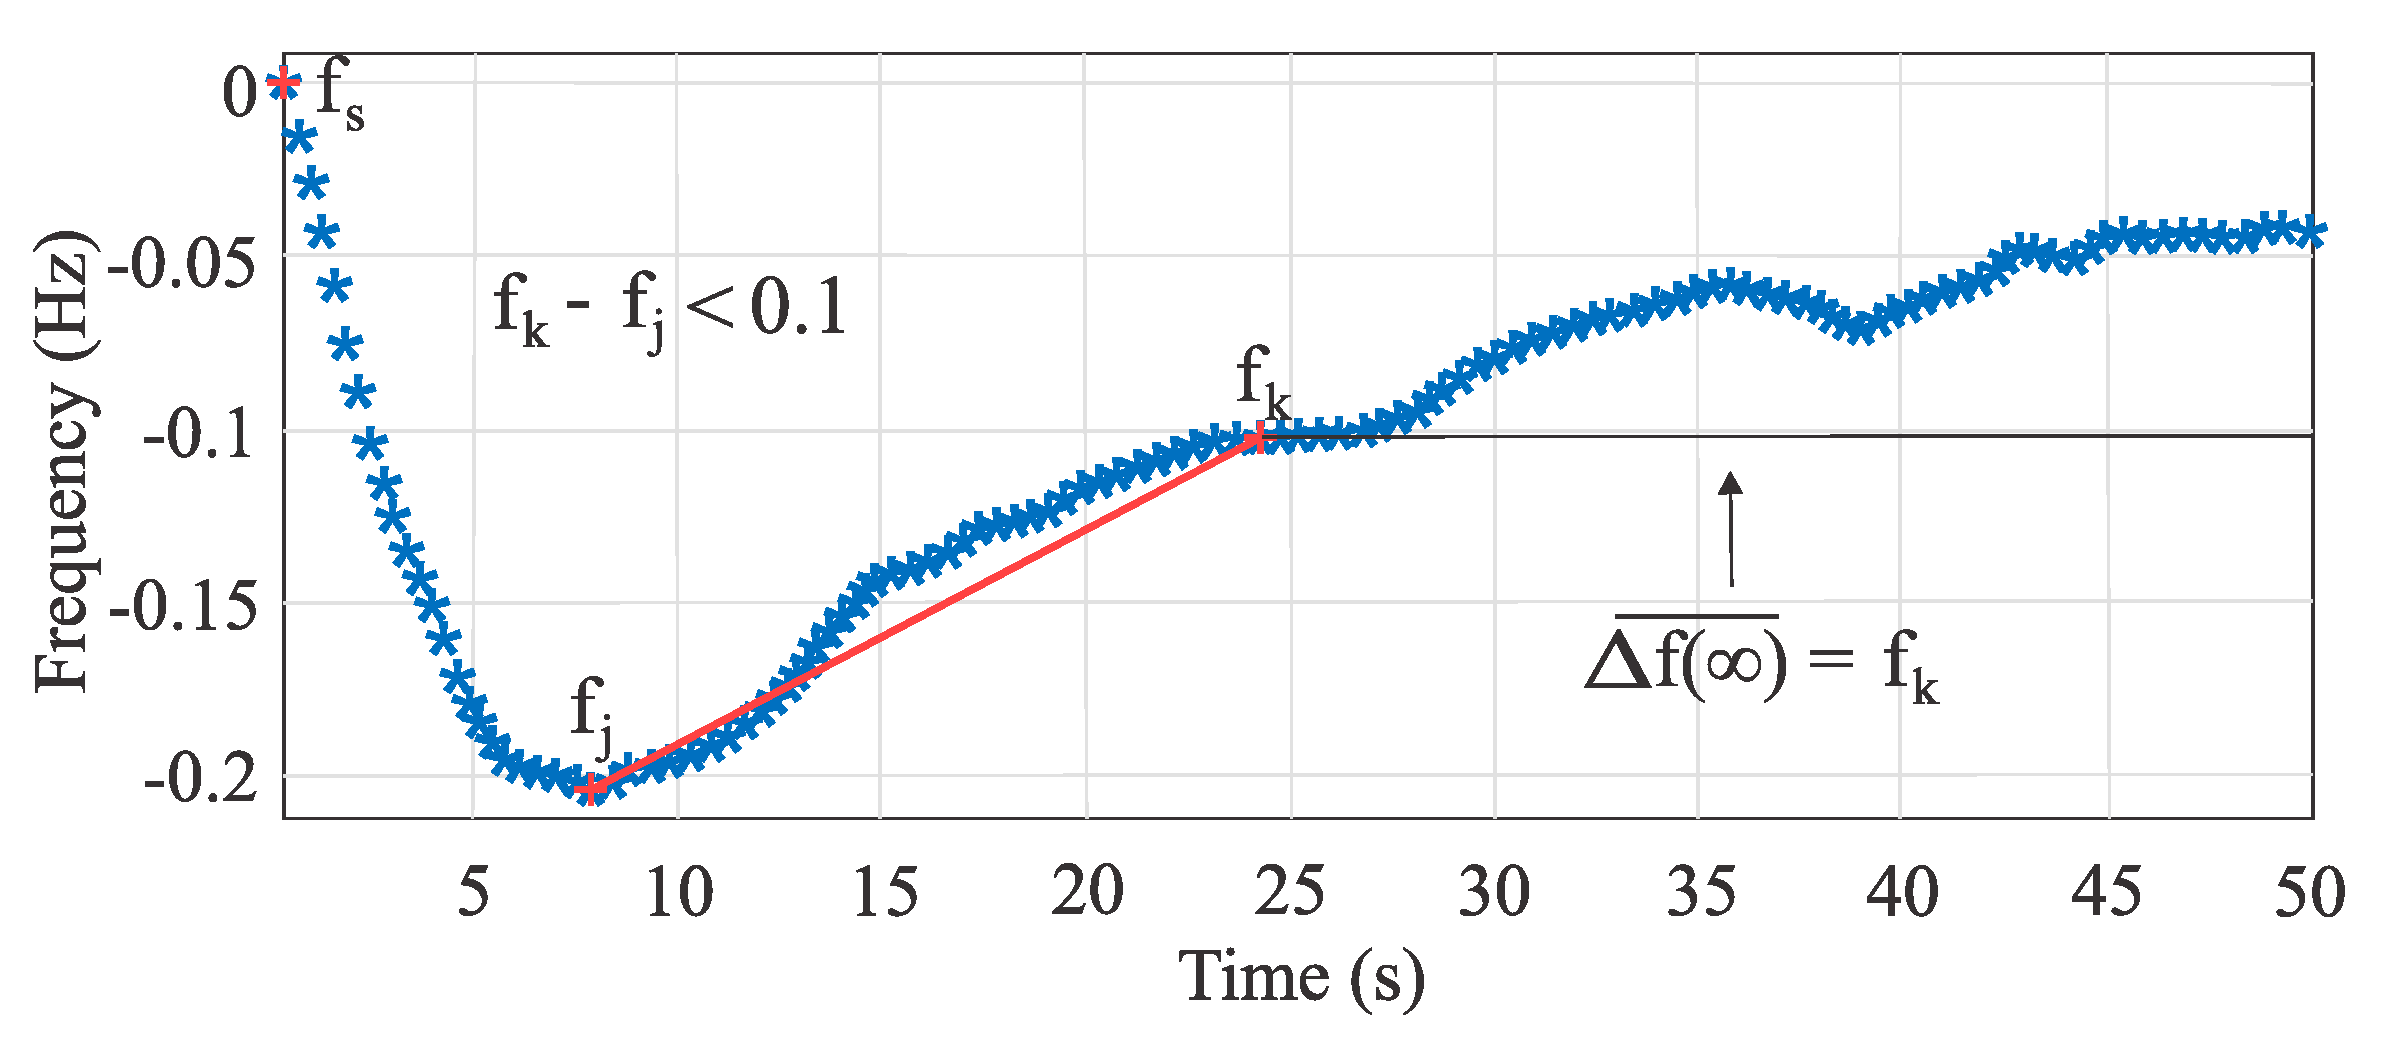
Depending on the dynamic conditions, the damping of the frequency response is subject to change. Qualitatively speaking, frequency responses can be classified as having one or multiples swings, as shown in Figure 9 and Figure 10 respectively. In these figures, it can be observed that the points of the frequency response in which the derivative of the frequency response is zero.

Figure 9.
Frequency response with one swing [34].
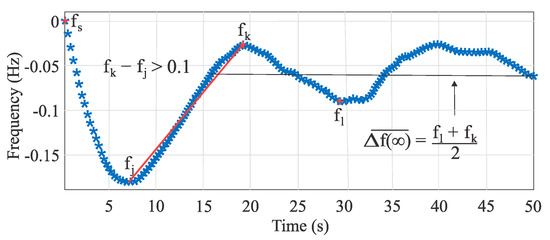
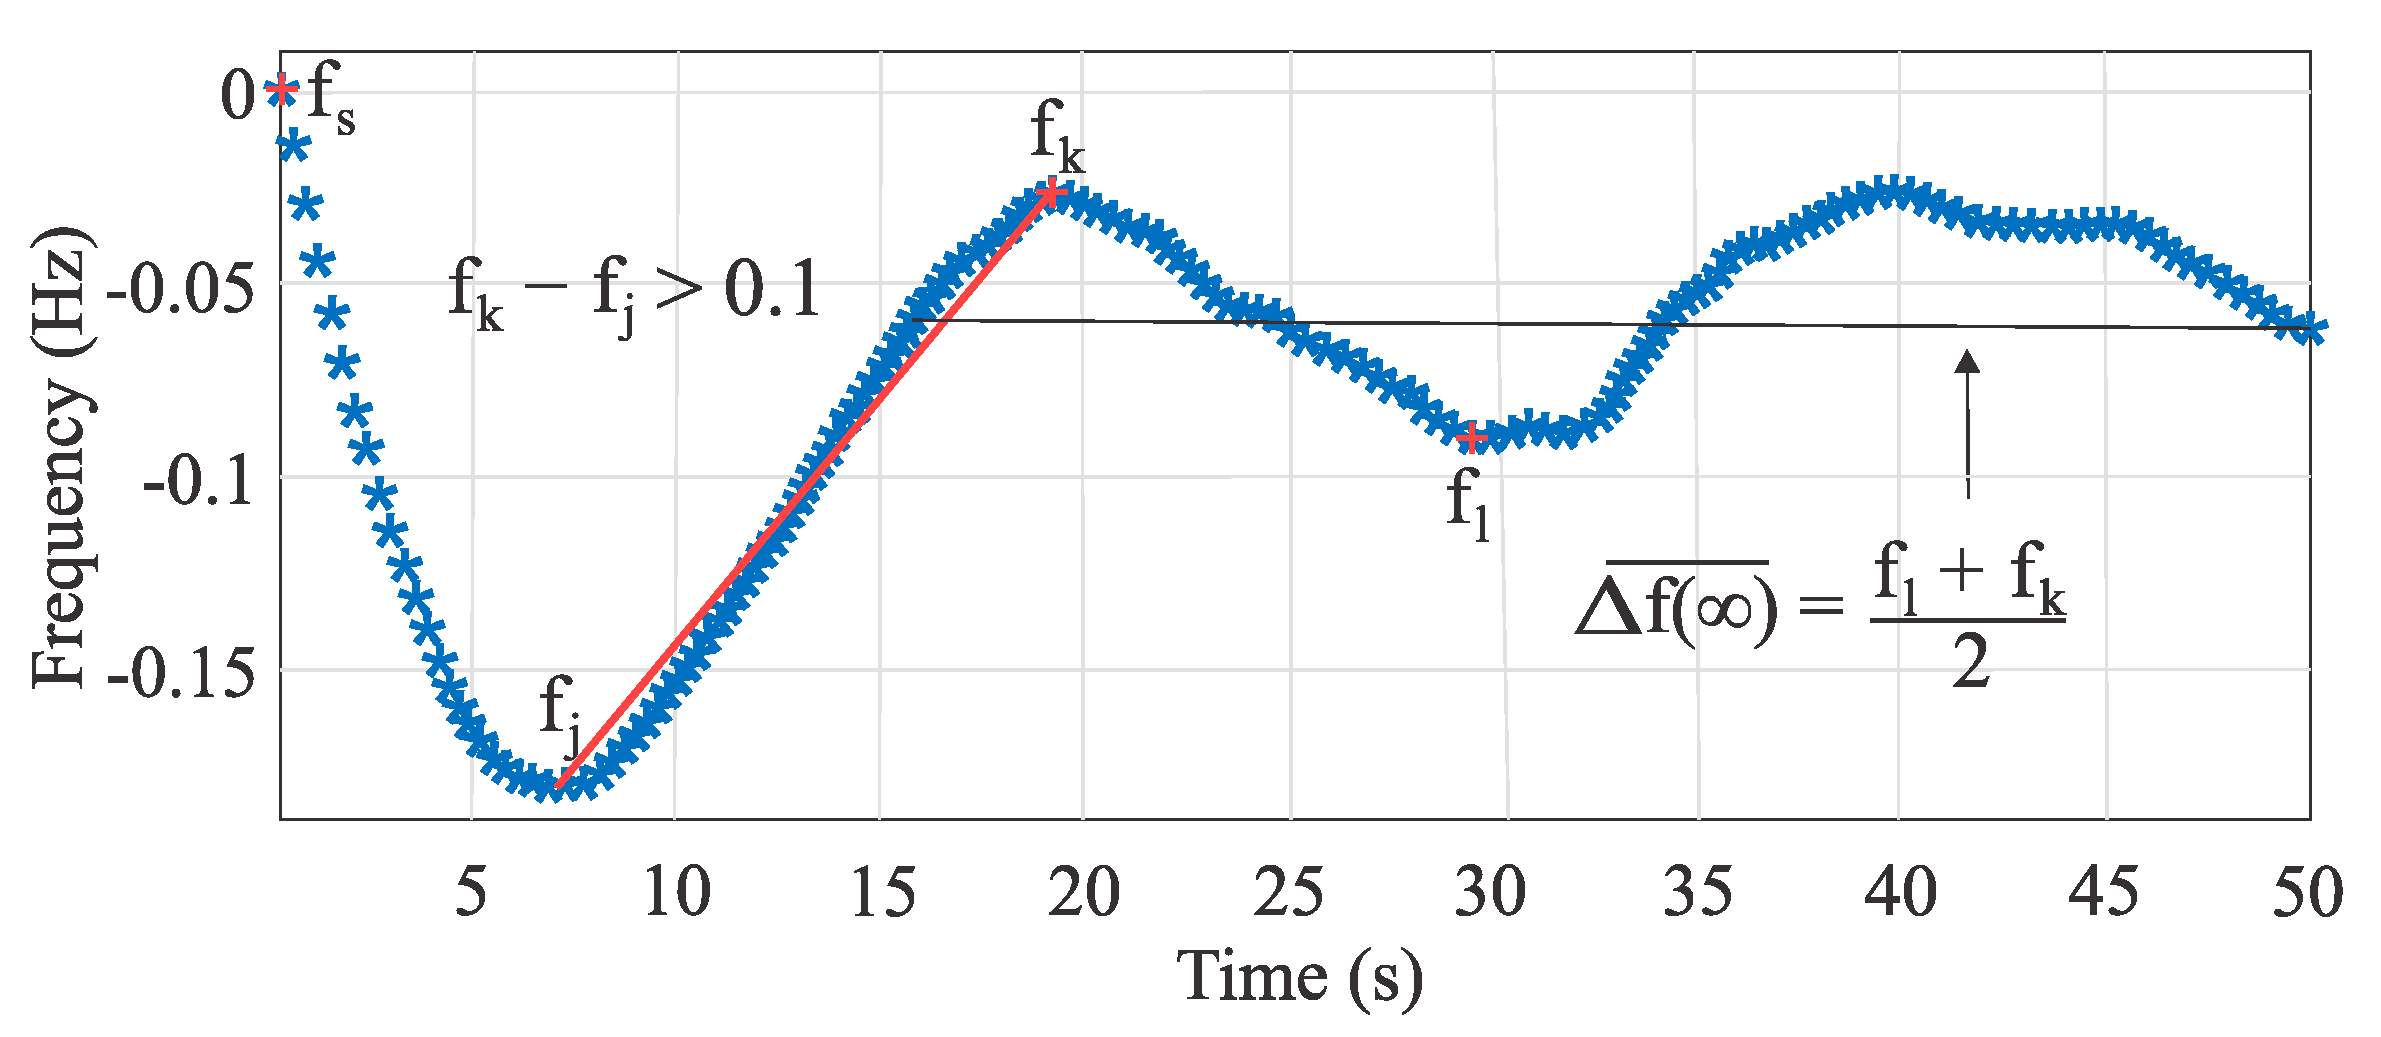
Figure 10.
Frequency response with multiple swings [34].
Moreover, it can be seen that the steady-state response can be associated with directly, whereas the steady-state response can be approximated as if the response has multiple swings. This is a simple way to estimate the steady-state response based on the principle of identifying the number of swings that the frequency response has, namely one or more.
From experimental observations, it was observed that the difference between and is a clear indicator of the shape of the response. Consequently, the following condition was derived to successfully discriminate the form of the frequency response:
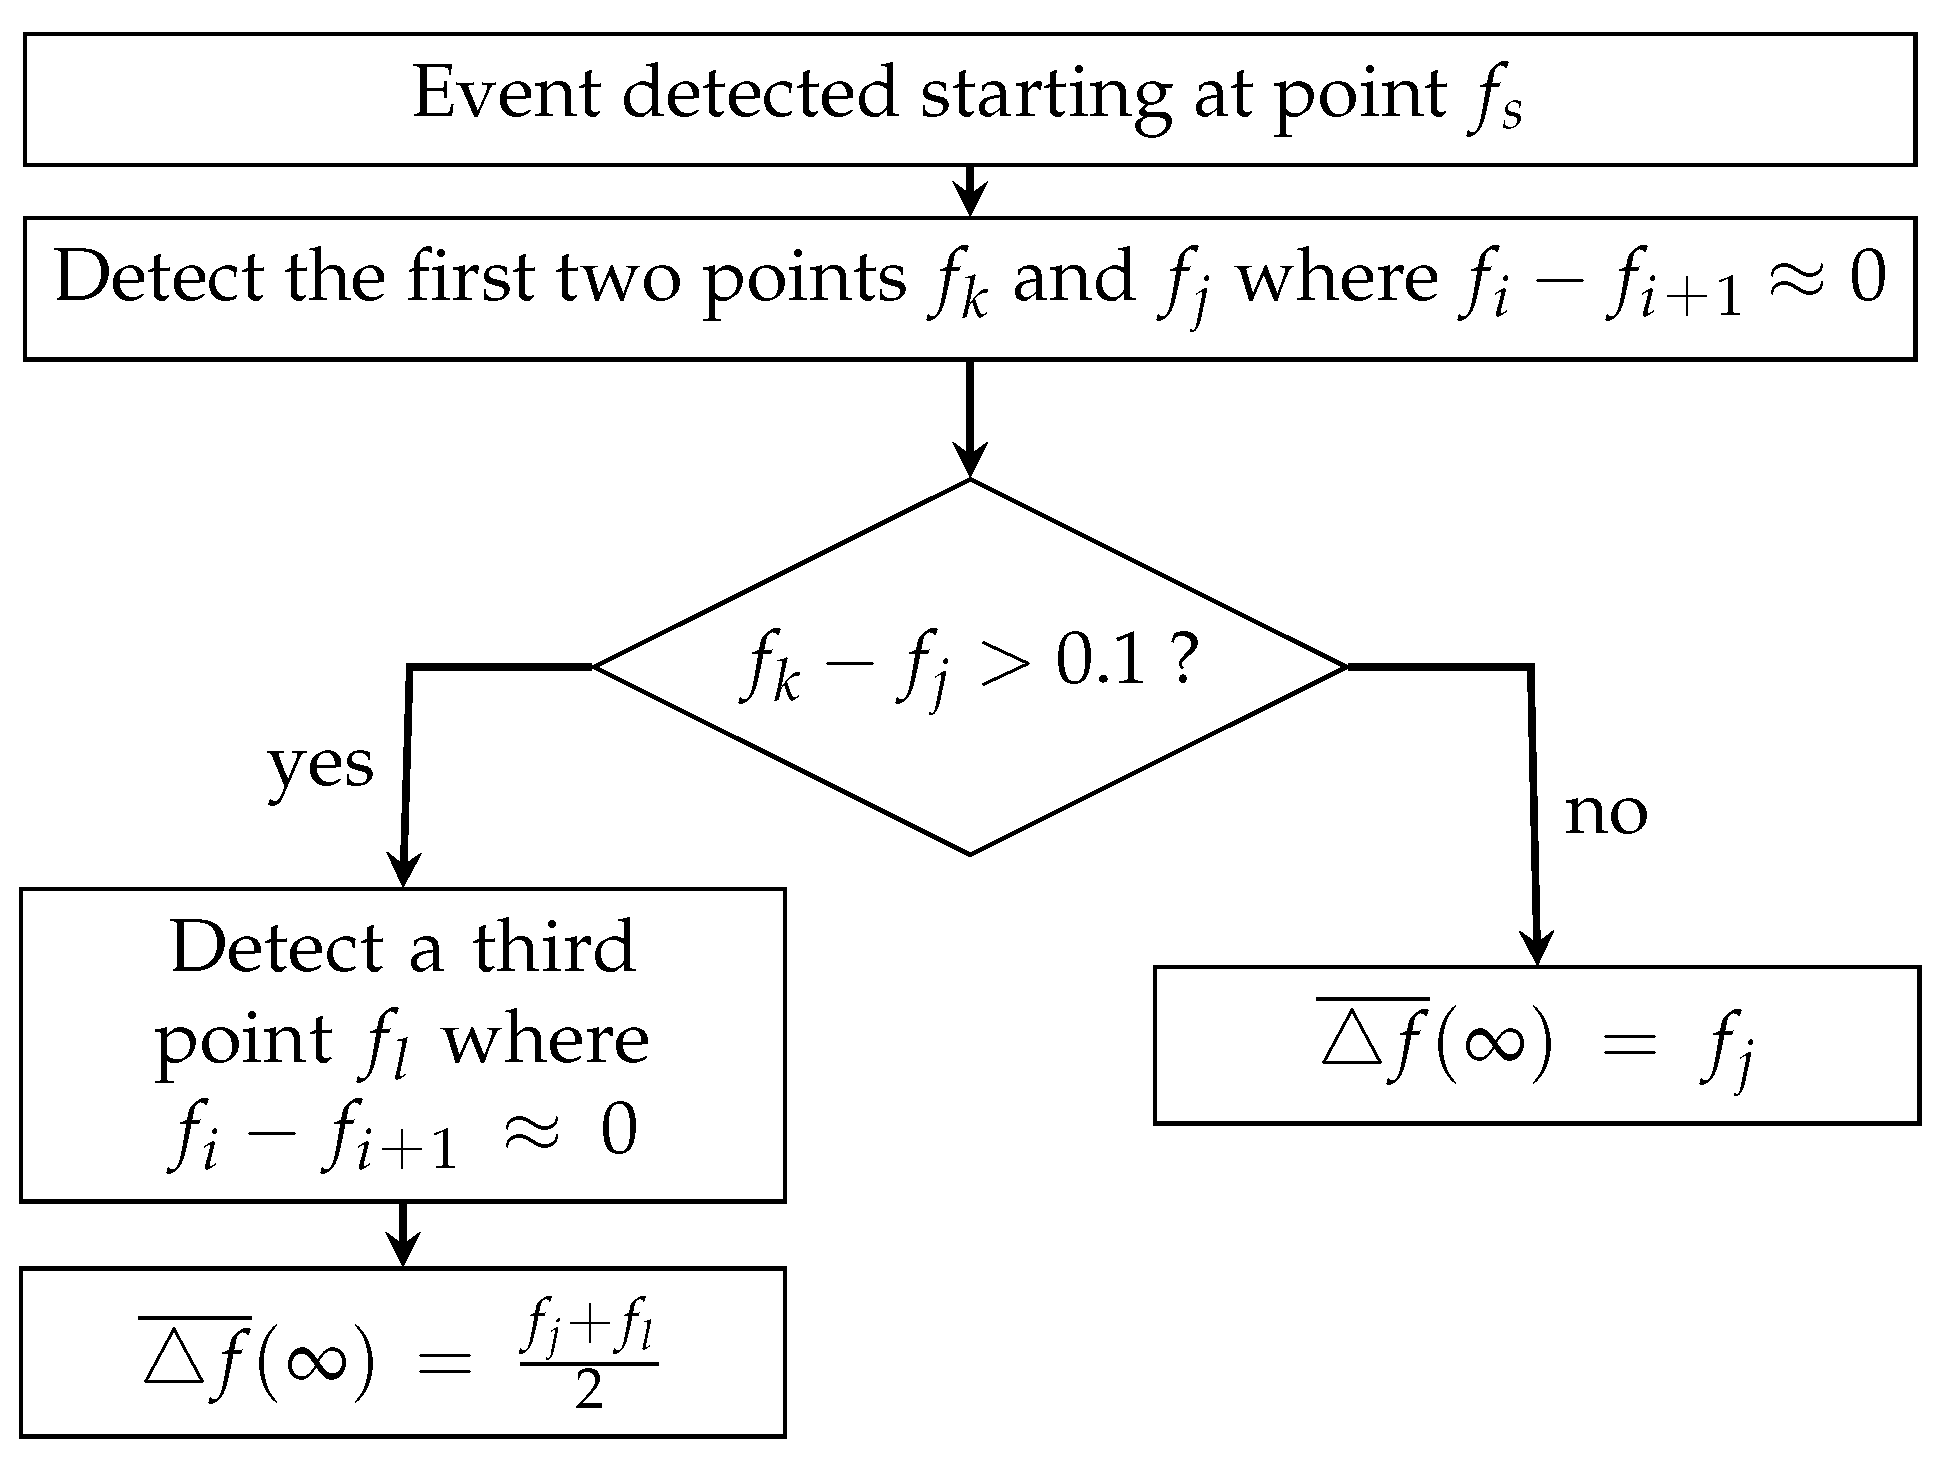
In this form, the algorithm depicted in Figure 11 was developed to estimate the droop .
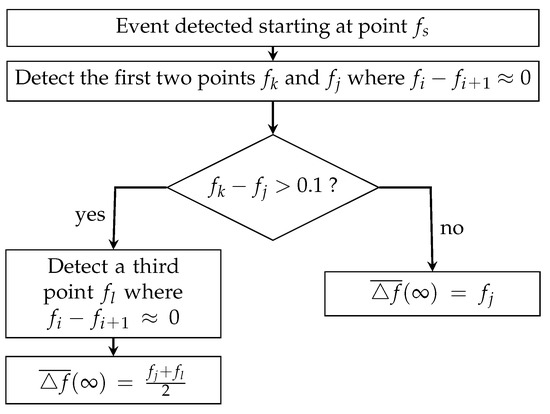
Figure 11.
estimation algorithm.
In this way, the algorithm in Figure 11 is developed to estimate the droop .
Similar to the frequency threshold, the indicator used is idiosyncratic to the Chilean power system and a similar observation process must be performed if the algorithm is to be implemented in a different power system.
4.4. Power Unbalance Estimation
The power imbalance is a datum that is not directly obtained by the proposed tool. In order to obtain the value of the power imbalance, the Chilean National Electric Coordinator issues daily an operational report on the operator’s website. These reports specify the occurrence of all events, faults, and maneuvers during real-time operation. In this way, every time a frequency contingency is detected by the tool, the information of the imbalance must be obtained manually from the operator’s website. The research group is currently working on obtaining this information automatically for the operator’s SCADA.
4.5. Estimation of , , and
A predictor error method (PEM) algorithm, which is an algorithm based on the optimization process, was proposed to identify the parameters , , and . The single-machine model in state-space representation is displayed in Equations (7) and (8), respectively. The one-machine model described in state variables is shown in (8).
In general, a discrete single-input, single-output (SISO), linear time-invariant (LTI) system, with form , can be written as shown in Equation (9) for a sample time T,
where x is the state vector, y is the system output, and u is the system input. The matrices F , G , and H are defined above; n is the order of the system,
The output of a discrete system , for an instant of time can be determined by knowing the initial condition , the input of the system , and the matrices F, G y H, as shows in Equation (11),
Let us consider that a vector of real data from the input and the output of the system is available, labeled as for the output, and for the input; m is the number of samples. Let be the output of the discrete system for m consecutive samples. The error e can be determined by using Equation (12),
The objective is to achieve a minimum error, and thus the problem is formulated to solve an optimization problem as depicted in Equation (13),
where f is a the sum of the square or errors, and is a function that represents the structure of the state matrix of system displayed in Equation (8).
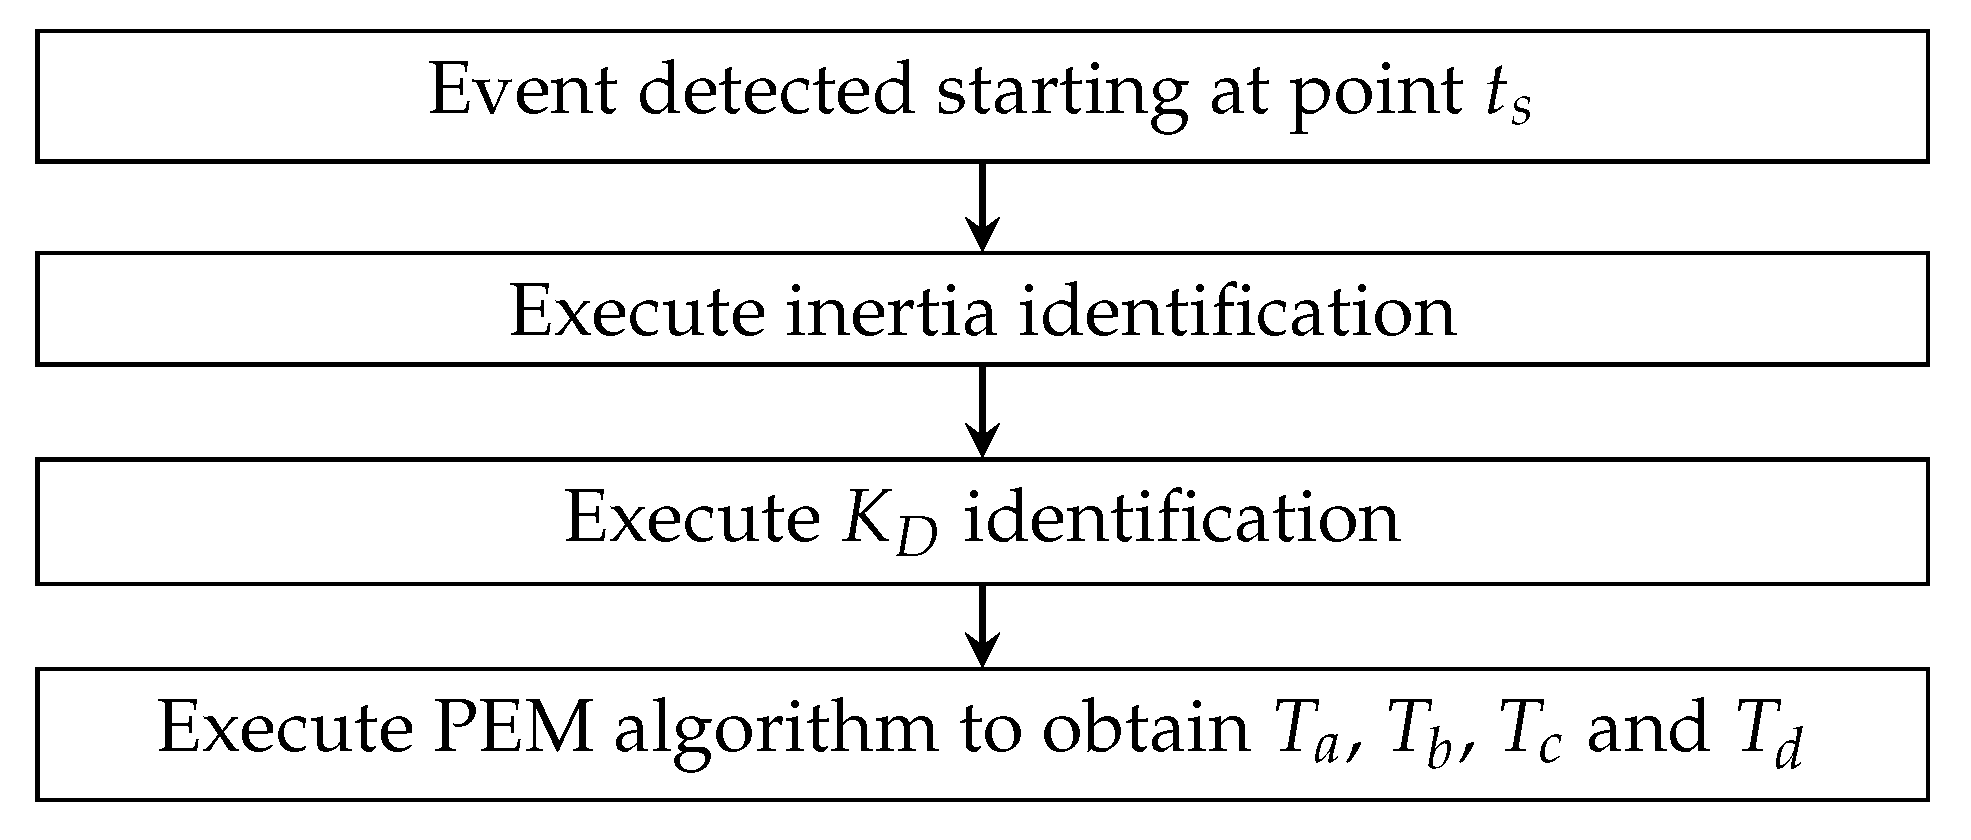
Figure 12 shows the algorithm to identify parameters.
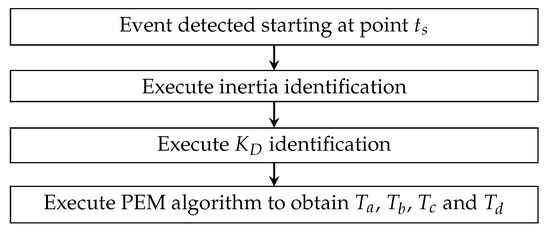
Figure 12.
Process to estimate the additional time constants.
5. Web-Based Application
To demonstrate the effectiveness of the proposed approach and highlight its practical application, the algorithm was implemented in a web page that displays the PMU measurements from the network in real time. The results validate the hypothesis that the simplicity of the resulting algorithm make it an ideal candidate for actual implementation in the transmission system operator control room by means of an ethernet connection.
5.1. Back-End Development
The back-end of the application is built in the Python language and NodeJS frameworks. Python is used to develop the algorithms to identify contingencies, inertia, droop, time constants, and decode std. C37.118 from the PMU measurements. On the other hand, the NodeJS is used as manager for the information between the front end, algorithms, and databases. Figure 13 shows the software running back end.

Figure 13.
Backend softwares.
The web-service is performed by Node JS framework allowing for the handling of the query from client’s host. By using Python, all variables are set, and objects and UDP socket communication are initialized. Then, PMU frames are validated and, if so, they are decoded. Next, two threads are run; one is to set the data configuration and the other to process PMU data, in accordance with the IEEE std. C37.118.
When PMU data is decoded and saved, the identification algorithm is executed in a slide time window of 2 min. If a contingency is recorded, the frequency data from different buses is turned into a one-time series representing the COI. All data, such as the current frequency stream, identified contingencies and parameters are saved into the MongoDB/NoSql database. All these data are available for the front-end to display on the website. The back-end application is depicted in Figure 14.
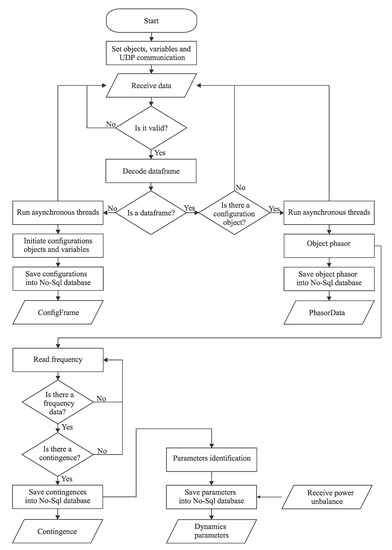
Figure 14.
Back-end algorithms.
5.2. Front-End Development
The front-end software was built on JavaScript by using the framework Angular, and it can be accessed in https://tesis.dispersiondigital.cl/#/session/login (accessed on 1 June 2021). Figure 15 shows a screenshot from the web front end.

Figure 15.
Web initial page.
The main windows are shown in Figure 16, where the frequency of the Chilean system is displayed.
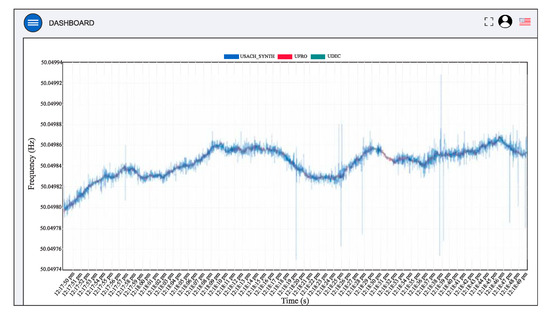
Figure 16.
Main windows.
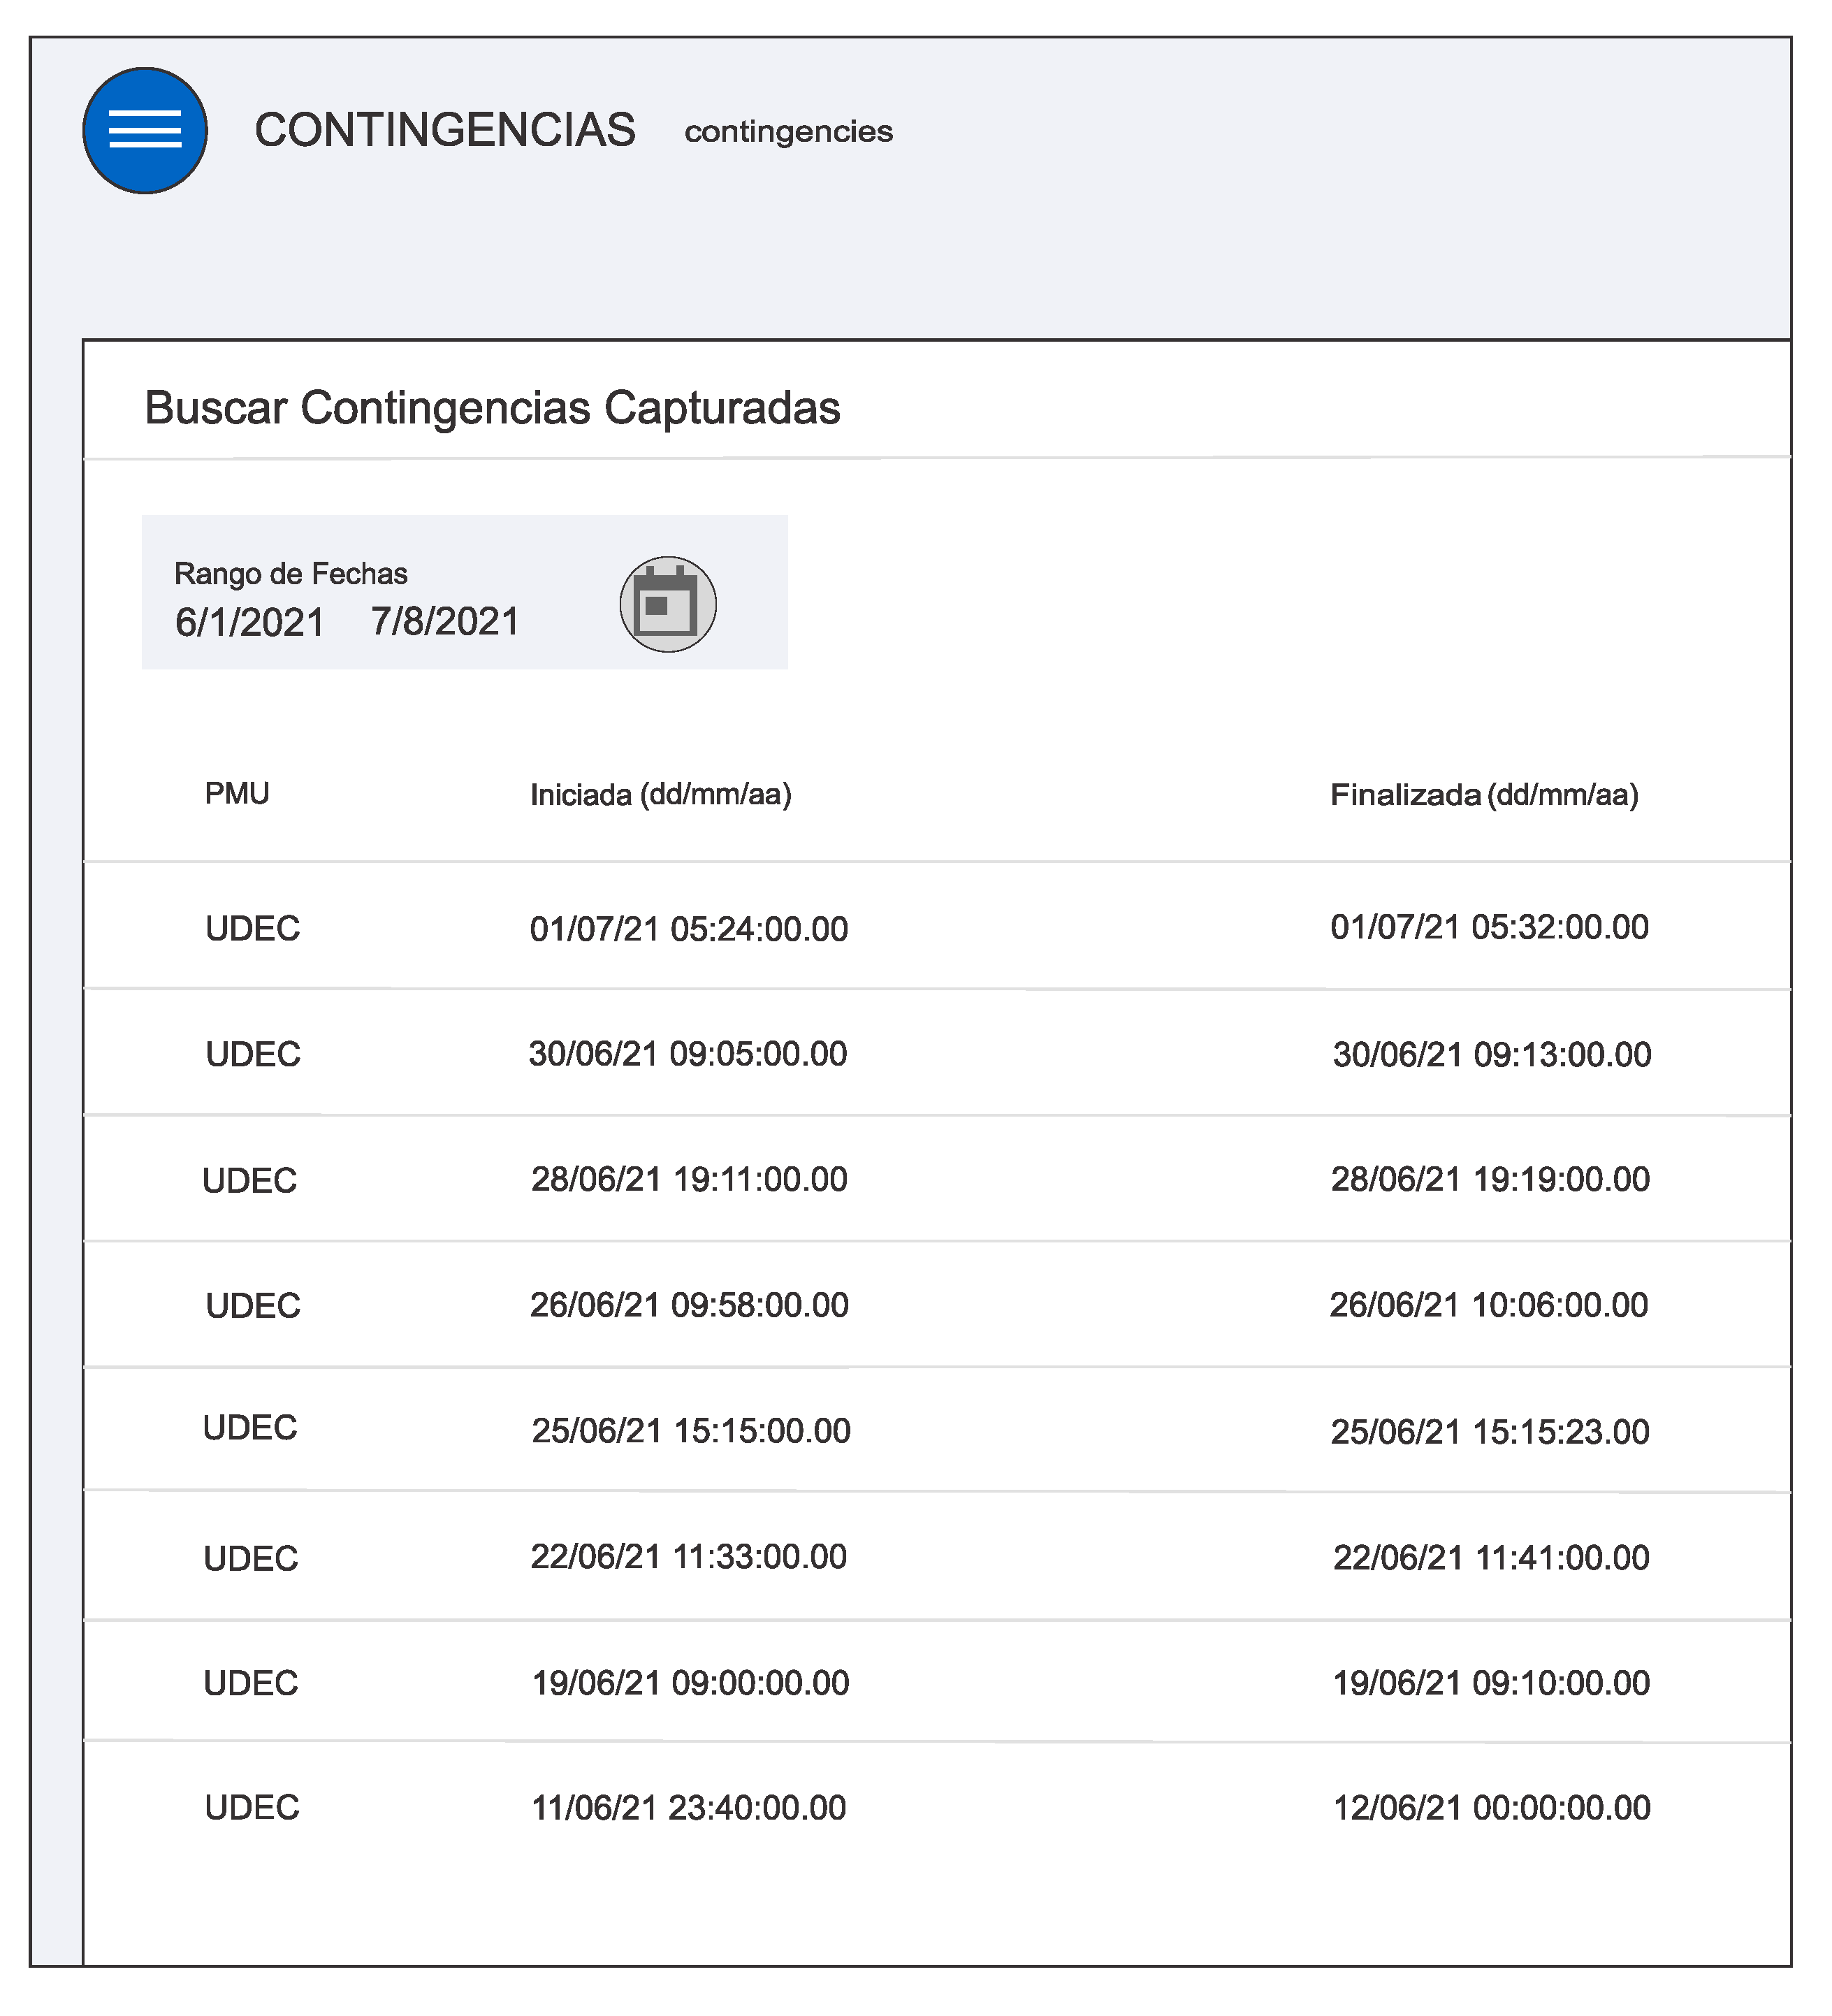
The web has several tabs to display information about the user, frequency, and contingencies. The Dashboard tab, displays real-time frequency from the PMU measurements of the Medfasee network. In this window, the user can select the frequency measurement of a particular PMU or all PMUs available. The recorded contingencies are available in a tab called Contingencies. Figure 17 displays the list of contingencies recorded on August 2021 in order to demonstrate how the data is stored.

Figure 17.
Contingences windows.
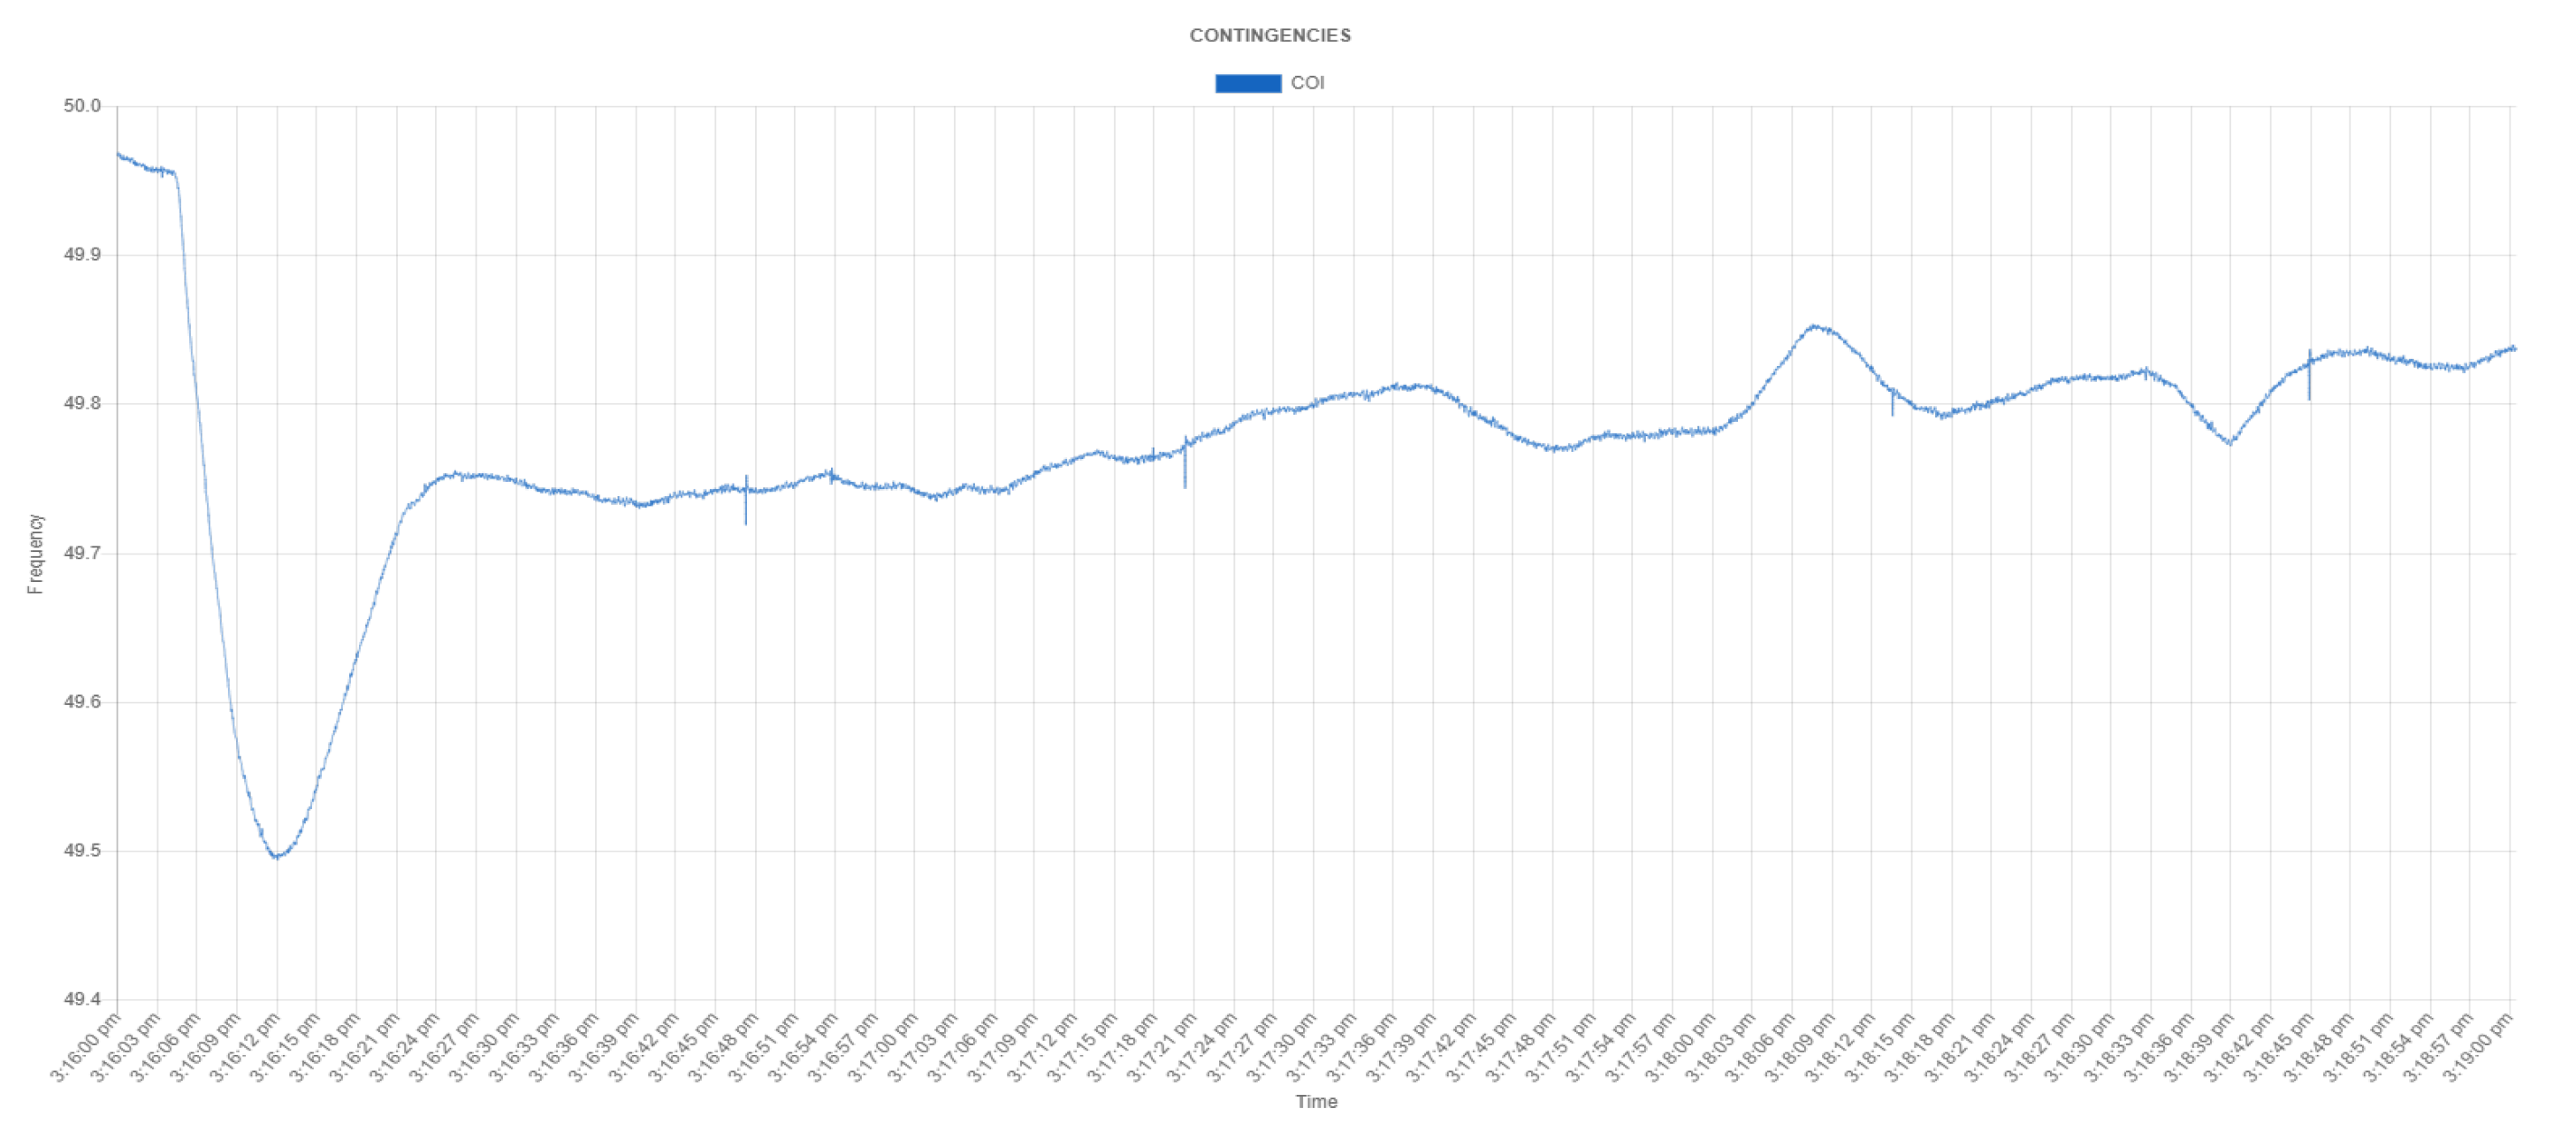
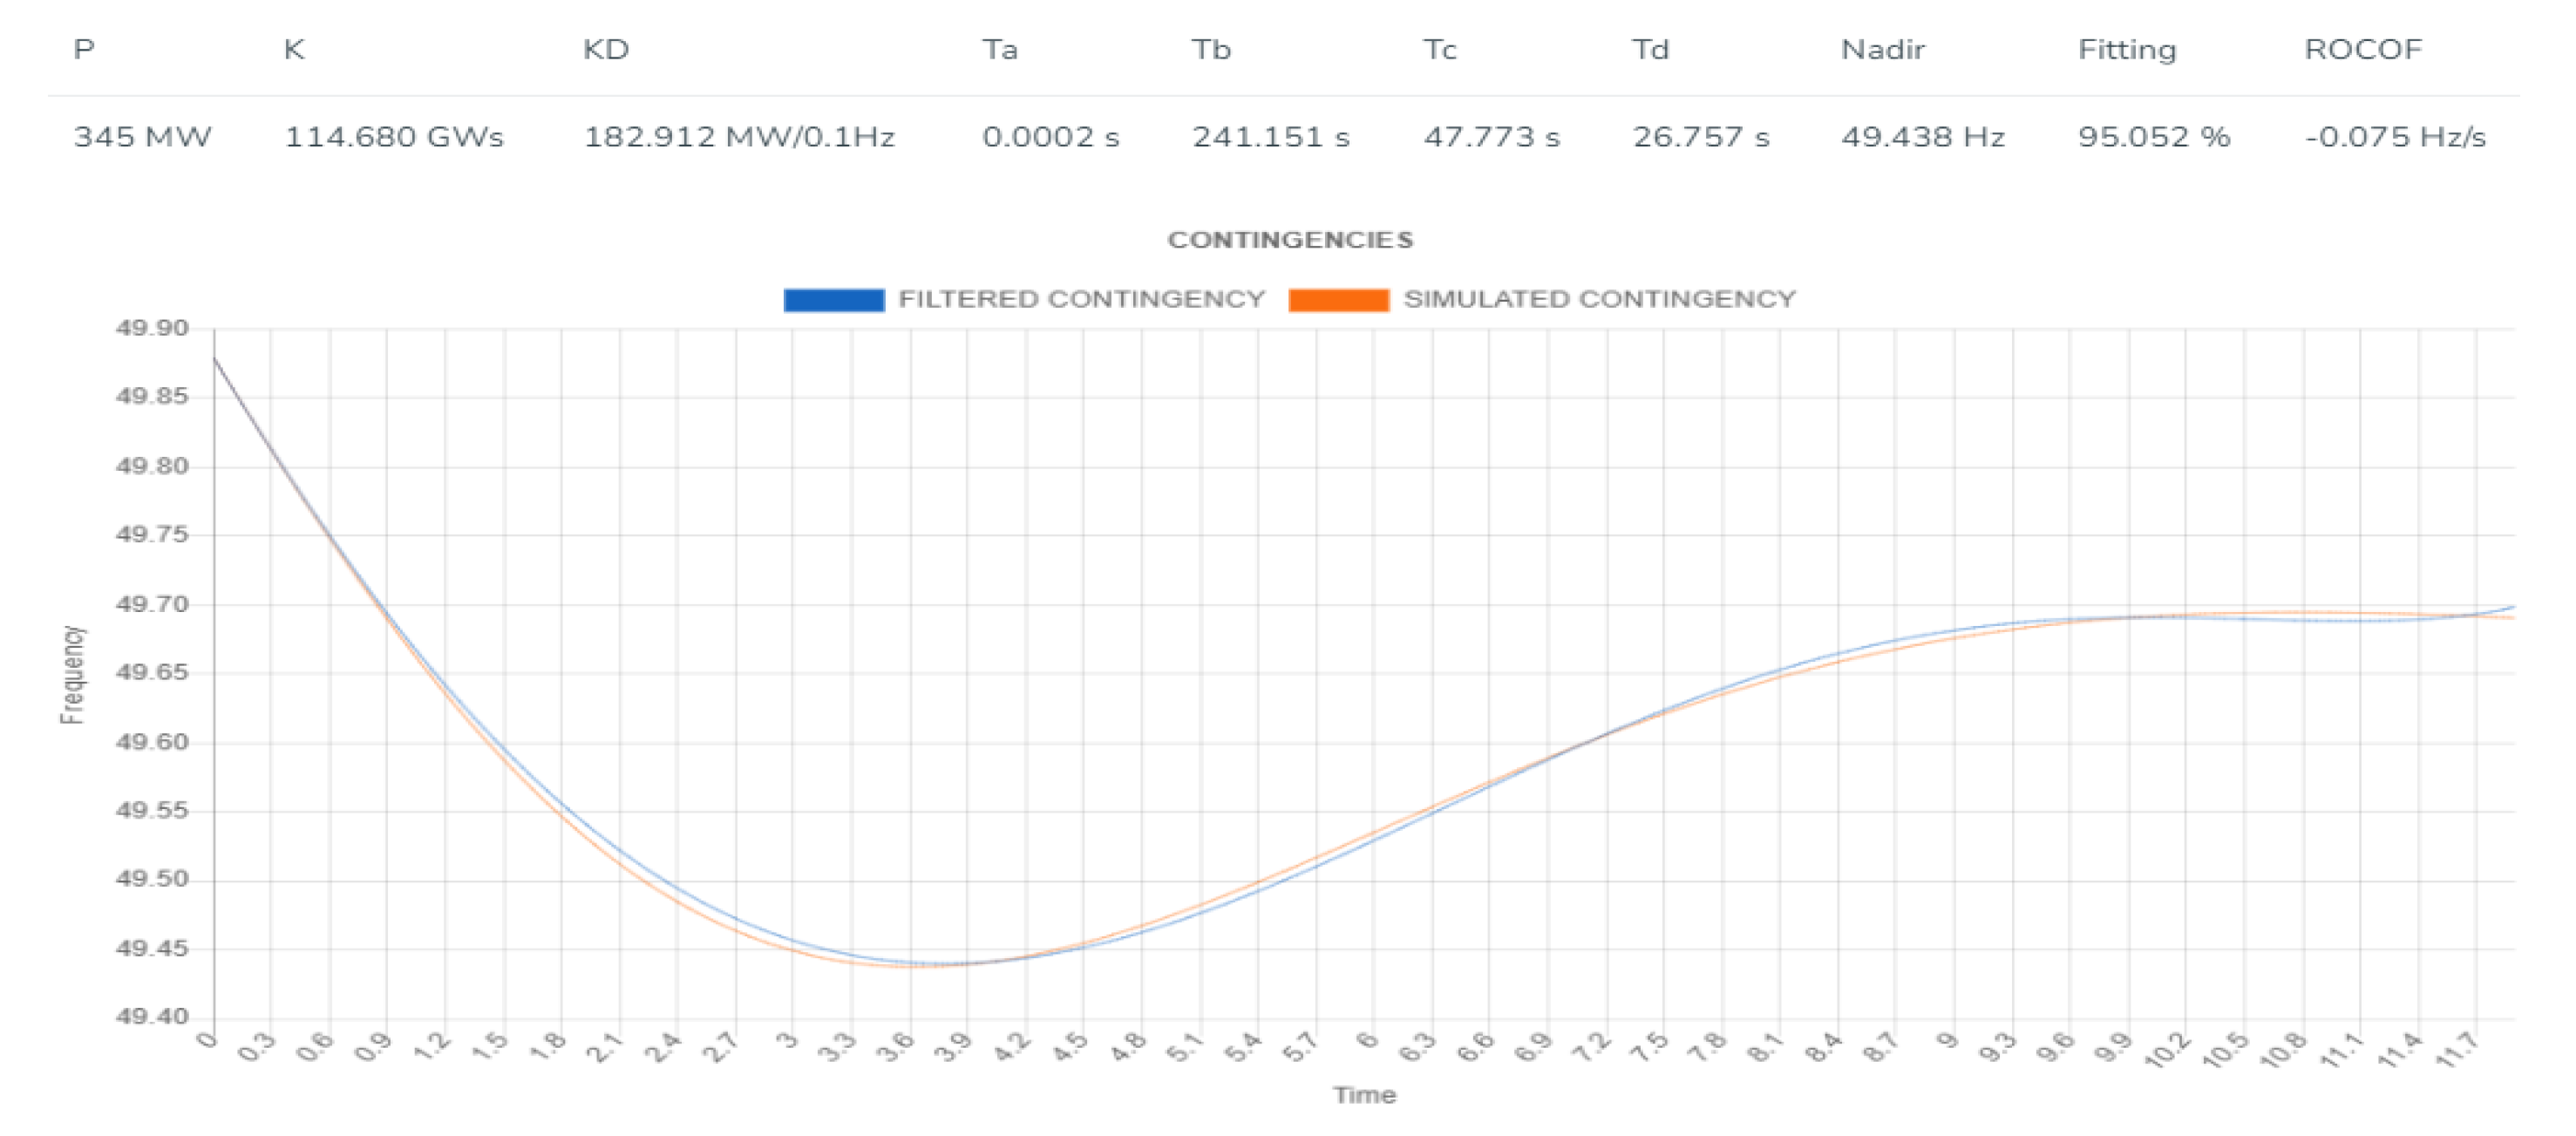
After selecting a contingency from the list, the tool displays the graphic representation of the event and the parameters of the model that have been identified for that contingency. Similarly, the results of the identification are also displayed and compared against the actual event. In this way, it is possible to visualize the difference between the real measurement and the approximation. Figure 18 shows a generator trip of magnitude 345 MW recorded on 25 June 2021, and Figure 19 shows the identified parameters.
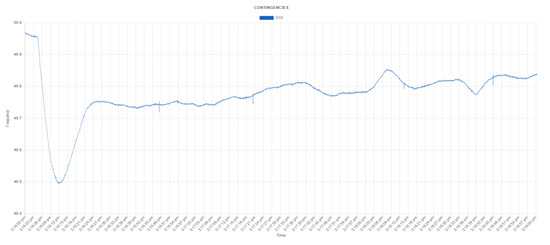
Figure 18.
Contigence of 345 MW-25 June 2021.
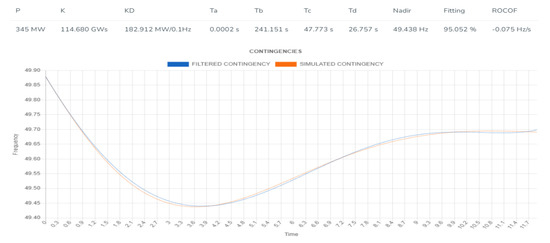
Figure 19.
Parameters identified for contingence of 345 MW-25 June 2021.
Contingency Size
An aspect of the development that needs to be improved upon is the input of the size of the contingency that is necessary to perform the identification process. Currently, after the software has detected a contingency, the human webmaster manually check the daily report of the National Electric Coordinator of Chile (CEN) https://www.coordinador.cl/operacion/documentos/novedades-cdc/ (accessed on 1 June 2021) and manually updates the value of the power imbalance. The size of the contingency is estimated by CEN operators that examine the daily information of the SCADA system and look for large disconnections of load and generation. After that, the event is analyzed, and the size of the loss is that of the last reading of power before the event. Unfortunately, the operator’s website does not count with an application programming interface (API) to obtain the datum in an automated manner.
6. Conclusions and Future Work
This work has presented a practical implementation of a reduced-order model parameter identification in the case of Chile. The tool was implemented in a web page to show the applicability of the development, which can be integrated to other data analytic tools in power system control rooms through ethernet.
The identification of dynamic parameters of a reduced-order model for various dynamic conditions has numerous applications. A reduced-order model significantly reduces the simulation processing time with respect to detailed simulations, which gives the milestone for online dynamic security assessments [35] faster than real-time simulations [33]. The development of practical demonstrations is an important step toward increasing the technological maturity level of data analytics tools to improve the operational awareness of power system control rooms.
Various aspects have been identified as future work. The software tool has thresholds and levels of detection that have a strong connection with practical experience and observation. Future work is proposed to improve the generality of the tuning processes as to be able to propose the tool for any power system. Also, auto-tuning and machine-learning algorithms can be useful in that scenario. Another point of improvement is the imbalance size input process. Currently, it is a manual process that depends on the reports of the system operator. The research group is currently developing a connection of the software with the SCADA of the Chilean power system to automate the capture of the imbalance size.
Finally, the variability of the identified parameters will be considered in a future work. As one can see above, different dynamic conditions lead to different parameters for identifying actual data. This variability is expected as the dynamic equivalent of the system depends on the number of generating units and loads that are connected to the system, both of which change on an hourly basis during power systems’ normal operation. One way to face this difficulty is to obtain a large enough dataset from actual generation contingencies, so that one can extrapolate any future condition of the parameters from the historical data by using data analytics; however, this solution has the drawback of needing a large amount of observation time as contingencies are not usually frequent (in the Chilean power system, three of these events happen every week on average). A second solution would be to include other dynamical events to be input to the identification process; for example, load contingencies. However, load contingencies tend to be of low magnitude, so they have an unnoticeable effect on the frequency of the system. Future work can be conducted to obtain data of load contingencies from the SCADA system. Until then, this data can be used as an input of a modified identification algorithm to increase the database’s identified parameters to have a large enough historical data set and estimate the parameters for any condition.
Author Contributions
Conceptualization, H.C. and F.S.; Formal analysis, J.Q.; Funding acquisition, H.C.; Investigation, J.Q.; Methodology, J.Q.; Software, L.G.; Supervision, H.C.; Writing—original draft, H.C.; Writing—review & editing, H.C. and F.S. All authors have read and agreed to the published version of the manuscript.
Funding
This research was funded by ANID Chile Through project FONDECYT 1191302 FONDEF IT20I0126.
Institutional Review Board Statement
Not applicable.
Informed Consent Statement
Not applicable.
Data Availability Statement
This would be available upon request.
Conflicts of Interest
The authors declare no conflict of interest.
References
- Rezkalla, M.; Pertl, M.; Marinelli, M. Electric power system inertia: Requirements, challenges and solutions. Electr. Eng. 2018, 100, 2677–2693. [Google Scholar] [CrossRef] [Green Version]
- Abed, E.H.; Namachchivaya, N.S.; Overbye, T.J.; Pai, M.A.; Sauer, P.W.; Sussman, A. Data-Driven Power System Operations. In Proceedings of the Computational Science—ICCS 2006, Reading, UK, 28–31 May 2006; Hutchison, D., Kanade, T., Kittler, J., Kleinberg, J.M., Mattern, F., Mitchell, J.C., Naor, M., Nierstrasz, O., Pandu Rangan, C., Steffen, B., et al., Eds.; Lecture Notes in Computer Science. Springer: Berlin/Heidelberg, Germany, 2006; Volume 3993, pp. 448–455. [Google Scholar] [CrossRef]
- Wang, Q.; Li, F.; Tang, Y.; Xu, Y. Integrating Model-Driven and Data-Driven Methods for Power System Frequency Stability Assessment and Control. IEEE Trans. Power Syst. 2019, 34, 4557–4568. [Google Scholar] [CrossRef]
- Khan, M.; Li, M.; Ashton, P.; Taylor, G.; Liu, J. Big data analytics on PMU measurements. In Proceedings of the 2014 11th International Conference on Fuzzy Systems and Knowledge Discovery (FSKD), Xiamen, China, 19–21 August 2014; pp. 715–719. [Google Scholar] [CrossRef] [Green Version]
- Yang, D.; Wang, B.; Cai, G.; Chen, Z.; Ma, J.; Sun, Z.; Wang, L. Data-Driven Estimation of Inertia for Multiarea Interconnected Power Systems Using Dynamic Mode Decomposition. IEEE Trans. Ind. Inform. 2021, 17, 2686–2695. [Google Scholar] [CrossRef]
- Zhou, Y.; Arghandeh, R.; Spanos, C.J. Partial Knowledge Data-Driven Event Detection for Power Distribution Networks. IEEE Trans. Smart Grid 2018, 9, 5152–5162. [Google Scholar] [CrossRef]
- Tianxia, J.; Zhuoyuan, G.; Huadong, S.; Pengfei, G.; Jun, Y.; Shiyun, X.; Bing, Z. Data-driven Research Method For Power System Stability Detection. In Proceedings of the 2018 International Conference on Power System Technology (POWERCON), Guangzhou, China, 6–8 November 2018; pp. 3061–3069. [Google Scholar] [CrossRef]
- Zhang, J.; Xue, A.; Bi, T.; Wang, Z.; Tang, W. On-Line Synchronous Generator’s Parameters Identification with Dynamic PMU Data. In Proceedings of the 2012 Asia-Pacific Power and Energy Engineering Conference, Shanghai, China, 27–29 March 2012; pp. 1–4. [Google Scholar] [CrossRef]
- Gorbunov, A.; Dymarsky, A.; Bialek, J. Estimation of Parameters of a Dynamic Generator Model from Modal PMU Measurements. In Proceedings of the 2020 IEEE Power & Energy Society General Meeting (PESGM), Montreal, QC, Canada, 3–6 August 2020. [Google Scholar] [CrossRef]
- Hua, K.Q.; Vahidnia, A.; Mishra, Y.; Ledwich, G. PMU measurement based dynamic load modeling using SVC devices in online enviroment. In Proceedings of the 2015 IEEE PES Asia-Pacific Power and Energy Engineering Conference (APPEEC), Brisbane, Australia, 15–17 November 2015; pp. 1–5. [Google Scholar] [CrossRef] [Green Version]
- Regulski, P.; Wall, P.; Rusidovic, Z.; Terzija, V. Estimation of load model parameters from PMU measurements. In Proceedings of the IEEE PES Innovative Smart Grid Technologies, Europe, Istanbul, Turkey, 12–15 October 2014; pp. 1–6. [Google Scholar] [CrossRef]
- Shetye, K.S.; Jang, W.; Overbye, T.J. System Dynamic Model Validation using Real-Time Models and PMU Data. In Proceedings of the 2018 Clemson University Power Systems Conference (PSC), Charleston, SC, USA, 4–7 September 2018; pp. 1–7. [Google Scholar] [CrossRef]
- Segundo Sevilla, F.R.; Liu, Y.; Barocio, E.; Korba, P.; Andrade, M.; Bellizio, F.; Bos, J.; Chaudhuri, B.; Chavez, H.; Cremer, J.; et al. State-of-the-art of data collection, analytics, and future needs of transmission utilities worldwide to account for the continuous growth of sensing data. Int. J. Electr. Power Energy Syst. 2021, 137, 107772. [Google Scholar] [CrossRef]
- Zografos, D.; Ghandhari, M. Estimation of power system inertia. In Proceedings of the 2016 IEEE Power and Energy Society General Meeting (PESGM), Boston, MA, USA, 17–21 July 2016; pp. 1–5. [Google Scholar]
- Makolo, P.; Zamora, R.; Lie, T.T. Heuristic Inertia Estimation Technique for Power Networks with High Penetration of RES. In Proceedings of the 2020 2nd International Conference on Smart Power & Internet Energy Systems (SPIES), Bangkok, Thailand, 15–18 September 2020; pp. 356–361. [Google Scholar] [CrossRef]
- Makolo, P.; Oladeji, I.; Zamora, R.; Lie, T.T. Data-driven inertia estimation based on frequency gradient for power systems with high penetration of renewable energy sources. Electr. Power Syst. Res. 2021, 195, 107171. [Google Scholar] [CrossRef]
- Conseil International des Grands Réseaux Électriques; Comité d’Études C4. Review of on-Line Dynamic Security Assessment Tools and Techniques; OCLC: 470553818; CIGRÉ: Paris, France, 2007. [Google Scholar]
- Zhang, R.; Xu, Y.; Dong, Z.Y.; Meng, K.; Xu, Z. Intelligent systems for power system dynamic security assessment: Review and classification. In Proceedings of the 2011 4th International Conference on Electric Utility Deregulation and Restructuring and Power Technologies (DRPT), Weihai, China, 6–9 July 2011; pp. 134–139. [Google Scholar] [CrossRef]
- Sun, S.; Yan, J.; Yu, Z.; Lv, Y.; Lu, G.; Shi, D.; Xie, C. Research of power system online dynamic security assessment application expansion. In Proceedings of the 10th International Conference on Advances in Power System Control, Operation & Management (APSCOM 2015), Hong Kong, China, 8–12 November 2015; pp. 1–6. [Google Scholar] [CrossRef]
- Liu, Y.; Cui, Y.; Yu, W.; Zhang, Y.; Wu, L.; You, S.; Liu, Y. Recent application examples of FNET/GridEye. In Proceedings of the 2018 IEEE 12th International Conference on Compatibility, Power Electronics and Power Engineering (CPE-POWERENG 2018), Doha, Qatar, 10–12 April 2018; pp. 1–6. [Google Scholar] [CrossRef]
- You, S.; Zhao, J.; Yao, W.; Liu, Y.; Cui, Y.; Wu, L.; Guo, J.; Liu, Y. FNET/GridEye for Future High Renewable Power Grids—Applications Overview. In Proceedings of the 2018 IEEE PES Transmission & Distribution Conference and Exhibition-Latin America (T&D-LA), Lima, Peru, 18–21 September 2018; pp. 1–5. [Google Scholar] [CrossRef]
- FNET/GridEye Web Display. Available online: http://fnetpublic.utk.edu/index.html (accessed on 1 July 2021).
- Decker, I.; Dotta, D.; Agostini, M.; Zimath, S.; de Silva, A. Performance of a synchronized phasor measurements system in the Brazilian power system. In Proceedings of the 2006 IEEE Power Engineering Society General Meeting, Montreal, QC, Canada, 18–22 June 2006; p. 8. [Google Scholar] [CrossRef]
- Decker, I.C.; e Silva, A.S.; da Silva, R.J.G.; Agostini, M.N.; Martins, N.; Prioste, F.B. System wide model validation of the Brazilian Interconnected Power System. In Proceedings of the IEEE PES General Meeting, Minneapolis, MN, USA, 25–29 July 2010; pp. 1–8. [Google Scholar] [CrossRef]
- Implementation of Inertia Monitoring in ERCOT—What’s It All about. Available online: https://www.esig.energy/implementation-of-inertia-monitoring-in-ercot-whats-it-all-about/ (accessed on 1 July 2021).
- ‘Sonar of the Power Grid’: New Inertia Measurement Tools Planned for Great Britain’s Electricity System. Available online: https://www.nationalgrideso.com/news/sonar-power-grid-new-inertia-measurement-tools-planned-great-britains-electricity-system (accessed on 1 July 2021).
- Measurements Inertia. Available online: https://www.reactive-technologies.com/grids/gridmetrix/ (accessed on 1 July 2021).
- Digital Energy Effective Inertia. Available online: https://www.ge.com/digital/sites/default/files/download_assets/effective-inertia-datasheet-ge-grid-analytics.pdf (accessed on 1 July 2021).
- Kezunovic, M.; Pinson, P.; Obradovic, Z.; Grijalva, S.; Hong, T.; Bessa, R. Big data analytics for future electricity grids. Electr. Power Syst. Res. 2020, 189, 106788. [Google Scholar] [CrossRef]
- Chavez, H.; Hezamsadeh, M.R.; Carlsson, F. A Simplified Model for Predicting Primary Control Inadequacy for Nonresponsive Wind Power. IEEE Trans. Sustain. Energy 2016, 7, 271–278. [Google Scholar] [CrossRef]
- Ørum, E.; Kuivaniemi, M.; Laasonen, M.; Bruseth, A.I.; Jansson, E.A.; Danell, A.; Elkington, K.; Modig, N. Future System Inertia; ENTSO-E: Brussels, Belgium, 2015. [Google Scholar]
- Proyecto MedFasee: Monitoreo del Sistema Eléctrico en Tiempo Real. Available online: http://www.medfasee.ufsc.br/conosur/ (accessed on 1 July 2021).
- Quiroz, J.; Chavez, H. Towards On-line PMU-based Model Calibration for Look-ahead Frequency Analysis. In Proceedings of the 2019 IEEE Milan PowerTech, Milan, Italy, 23–27 June 2019; pp. 1–5. [Google Scholar] [CrossRef]
- Quiroz, J.; Pérez, R.; Chávez, H.; Matevosyan, J.; Segundo Sevilla, F.R. A Hardware Implementation of an Online Frequency Dynamic Parameter Estimation. In Proceedings of the 2021 IEEE Madrid PowerTech, Madrid, Spain, 28 June–2 July 2021; pp. 1–6. [Google Scholar] [CrossRef]
- Mukherjee, R.; De, A. Real-time dynamic security analysis of power systems using strategic PMU measurements and decision tree classification. Electr. Eng. 2020, 103, 813–824. [Google Scholar] [CrossRef]


Publisher’s Note: MDPI stays neutral with regard to jurisdictional claims in published maps and institutional affiliations. |
© 2022 by the authors. Licensee MDPI, Basel, Switzerland. This article is an open access article distributed under the terms and conditions of the Creative Commons Attribution (CC BY) license (https://creativecommons.org/licenses/by/4.0/).