1. Introduction
1.1. Overview
In the last decades, most industrial sectors saw a key evolution associated with product and process innovation, with digital technologies being adopted to improve their productivity and quality. However, in the Architectural, Engineering, Construction, and Operation sector (AECO), quality, productivity, and sustainability have not often kept pace, resulting in a stagnation of the sector’s productivity [
1]. In this case, the adoption of technologies can help enhance this sector, improving its efficiency and productivity. Several internal and external challenges are responsible for this situation, including the fragmentation of the construction projects, the lack of skilled labor, and failures in the transfer of information, either in the course of a project or from one project to another [
2].
Currently, the increase of productivity, efficiency, sustainability, safety, quality levels, and the improvement of project management can be achieved only by means of digitalization, new construction techniques, and innovation. The focus on digitalization is also one of the proposed steps for construction companies to overcome the crisis caused by the COVID-19 pandemic, requiring a workforce with appropriate skills [
3,
4]. The construction sector, despite its importance for the European economy, has a significant negative impact on the environment, as it is responsible for 36% of carbon dioxide emissions, 40% of the energy consumption, and 55% of the electricity consumption in the European Union (EU). Accordingly, reducing energy consumption in the building sector, leading to building decarbonization and to the 2050 climate neutrality goal, is a critical and very ambitious target [
5]. However, there is a current concern related to the mitigation of the climate change effects, as well as the fight against the classification of the construction sector as an unsustainable industry, owing to the severe impact of buildings on the environment, economy and society [
6], which should begin in the conception phase of any project [
7]. Additionally, construction management can play a crucial role in contributing to the decrease of resource consumption by means of efficient, reliable, and sustainable management processes. Thus, the development of sustainable projects, along with the recognition of the importance of Building Information Modelling (BIM) methodology, has become a priority to improve efficiency [
8].
The enhancement of performance, competitiveness, productivity, and safety in the construction sector has been driven by the automation of traditional manual processes, made possible by the emergence of digital technologies (e.g., BIM, IoT—Internet of Things, mobile devices and sensors, drones) [
9]. BIM permits ground-breaking ways to generate, visualize, exchange, predict, and monitor information along the life cycle of any building facility [
10]. Worldwide, BIM is recognized as being one of the developments that has been contributing most significantly to the digitalization of the construction industry. It is an information technology that involves the application and maintenance of a comprehensive digital representation of all construction information for the different phases of the complex project life cycle, in the form of a data repository. This framework represents a new paradigm for designing, building, operating, and maintaining a facility, and it has become a leading practice across the AECO sector [
11].
The fact that construction projects have become increasingly complex requires Industry/Construction 4.0 as a solution for a new business model [
12,
13]. The integration of BIM in cloud computing allows project stakeholders to collaborate in real-time from different locations, thereby improving the decision-making process and ensuring project deliverability [
2]. BIM (in the design, planning, and management domain), as the center of construction digitalization, together with Industry 4.0 (production domain), can bridge the remaining digital gap and sustain the impact on future construction processes [
14]. It allows for maximizing productivity [
15], improving information flow during the project life cycle, optimizing energy efficiency [
16], and improving safety [
17,
18], as well as resource planning, management, and monitoring [
19].
1.2. BIM Concept
According to [
20], BIM is defined as the “construction of a model that contains the information about a building from all phases of the building life cycle” and defined by [
21] as “a digital representation of physical and functional characteristics of a facility. As such, it serves as a shared knowledge resource for information about a facility forming a reliable basis for decisions during its life cycle from inception onward”.
BIM is an object-based parametric methodology in which an element, class, or family contains a fixed or parametric geometry, a set of relations, and rules to control the parameters by which element instances can be generated. Therefore, parametric modelling relates geometry or other parameters of one object to those of other objects [
22].
Therefore, BIM consists of managing and using digital information from projects [
23]. Systems have also been developed to link other data sets with BIM, including spatial data generation using Geographic Information Systems (GIS), sensor data collection using IoT [
19], and Facility Management (FM) software [
24] to create Intelligent Facility Management (FIM) systems [
25] and environmental performance data of infrastructures [
26]. The growing need for many types of BIM-related data and applications, especially the urgent need to manage and operate those data in close combination with real-time, is resulting in an emerging field in the AECO referred to as Infrastructure Digital Twins (DT) [
27].
1.3. BIM Applications
A BIM model is a computer model database of building design information which can be integrated with information about the construction, management, operations, and maintenance of the building. Thus, adding the different facility life cycle information to the 3D virtual model allows for the attainment of an nD model [
28]. The 4D and 5D models can be respectively obtained by adding time (scheduling information to model construction sequences) and cost information to the 3D model. The 6D, 7D, and 8D models are obtained by adding the facility management, the sustainability, and the health and safety information to the 3D model. Those nD models allow for the visualization and simulation of the whole life cycle of a facility, supporting more accurate decision-making [
29]. The application of the nD models leads to different implementations of BIM in different areas and, consequently, provides their dynamic and virtual analysis, for example in the scope of facility management [
24], maintenance [
30], energy analysis [
31,
32], sustainability and Life Cycle Assessment (LCA) [
33,
34,
35], scheduling and budgeting [
36,
37], quality [
38], and occupational risk prevention [
18,
39,
40,
41,
42,
43].
The research carried out by [
44] points out BIM research papers in the scope of design and the construction phase, which highlights the need for 4D models for the virtual construction simulation, namely to analyze and visualize the variables which are constantly changing during the construction phase. It also states the importance of BIM applications based on 4D models for construction management, specifically the schedule, cost, quality, and safety control (all belonging to the construction management area). Despite the high number of applications of 4D models in the construction phase, and the wide range of different indicators and their dynamic behavior that has to be permanently analyzed during the construction phase, there is the need to automatically provide reliable, real-time, and interrelated data analysis to support the construction management in the pursuit of more efficient and sustainable management.
1.4. Data Management with BIM
As BIM provides an accurate parametric model of the project into which various parameters, such as the type of materials and their characteristics and construction systems, are entered in each building element, it gives the basis for better construction planning, including just-in-time procurement of people, materials, and equipment, which leads to cost savings, and a better collaboration in terms of the on-site work. Besides that, it promotes the reduction of errors, omissions, and resource consumption. Moreover, the use of collaborative forms of contracting (IPD—Integrated Project Delivery) reflects the benefit of collaborative work with integrated teams by using BIM methodology in the project and construction process management [
22].
In construction management, given the amount, diversity, and complexity of the data involved, management (in any of its phases) is faced with the need for permanent data analysis and, despite the different computer tools currently at its disposal, the fast and reliable analysis of the data becomes difficult. Business Intelligence System (BIS) is a multidisciplinary analysis and decision-making system that analyses different types of data from different sources, allowing for [
45]:
- -
the efficient analytical capacity. By means of a Business Intelligence Platform, implicit information from the data can be rapidly analyzed so that decision-makers can better understand the operation and solve problems, playing a vital role in the entire operation of an organization;
- -
the improved efficiency and level of decision-making, as historical information can be quickly analyzed and integrated to understand the state of the operation and support decision-making;
- -
the increase of the performance of an organization.
This work aims to contribute to the development of a methodology in which 3D, 4D, and 5D BIM processes are integrated with Business Intelligence (BI). By addressing Information Modelling from a construction perspective, data science methods have been integrated with BIM. Another goal of this work is to contribute to the construction sector digitalization i.e., applying BI analysis to BIM processes. The novelty of this research is to bridge the existing gap between construction management procedures which remain almost manual-based, developing a digital integrated system: BIM-BI. The main conclusion is that this methodology gives an integrated (BIM with BI), reliable, and real-time analysis of data, which is essential for sustainable construction management and decision-making.
2. Materials and Methods
Despite the currently available technology, most of the Construction Projects are still manually planned [
37]. For the planning phase, technologies such as BIM 4D are already used. BIM 4D consists of adding the planning data to the 3D model and establishing collaboration between the construction sequences and their visualization. The simulation obtained with the 4D model allows for detailed visualization of the daily evolution of the construction, revealing potential problems and opportunities for the improvement of the workplace, resources, equipment, workplace conflicts, and safety problems, among others. These potentialities allow, by means of BIM methodology, for a more detailed vision, follow-up, and management of the project [
22]. In the scope of 5D, some plugins allow the estimation of the costs such as Computing in Cloud (for Revit). The TeamSystem Construction Project Management is a complete construction software management, also cloud computing-based, which includes 4D for scheduling and planning and 5D for project and cost control. In spite of the potentialities of that software, the methodology developed in this work allows using the customized lists of quantities developed by the design and budgeting team, allowing the organization and data modelling according to the specific needs and goals of the project and the BI analysis and visualization.
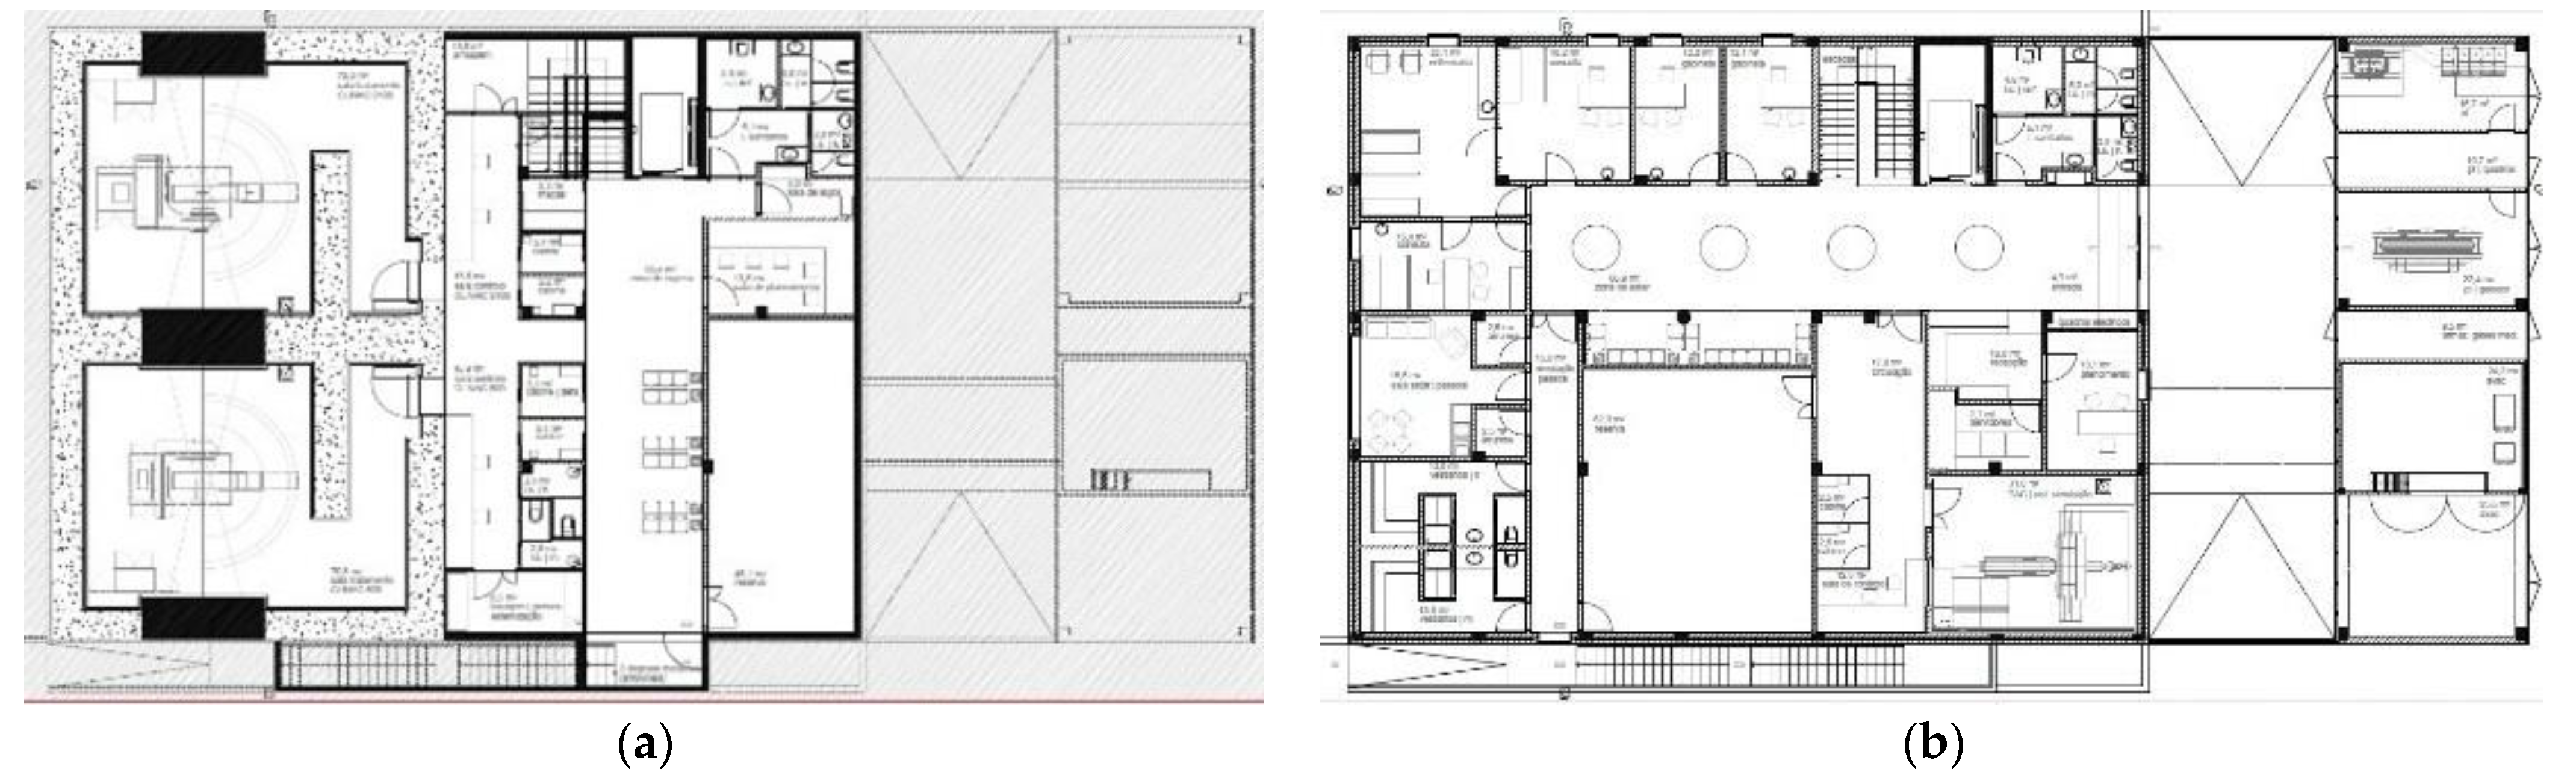
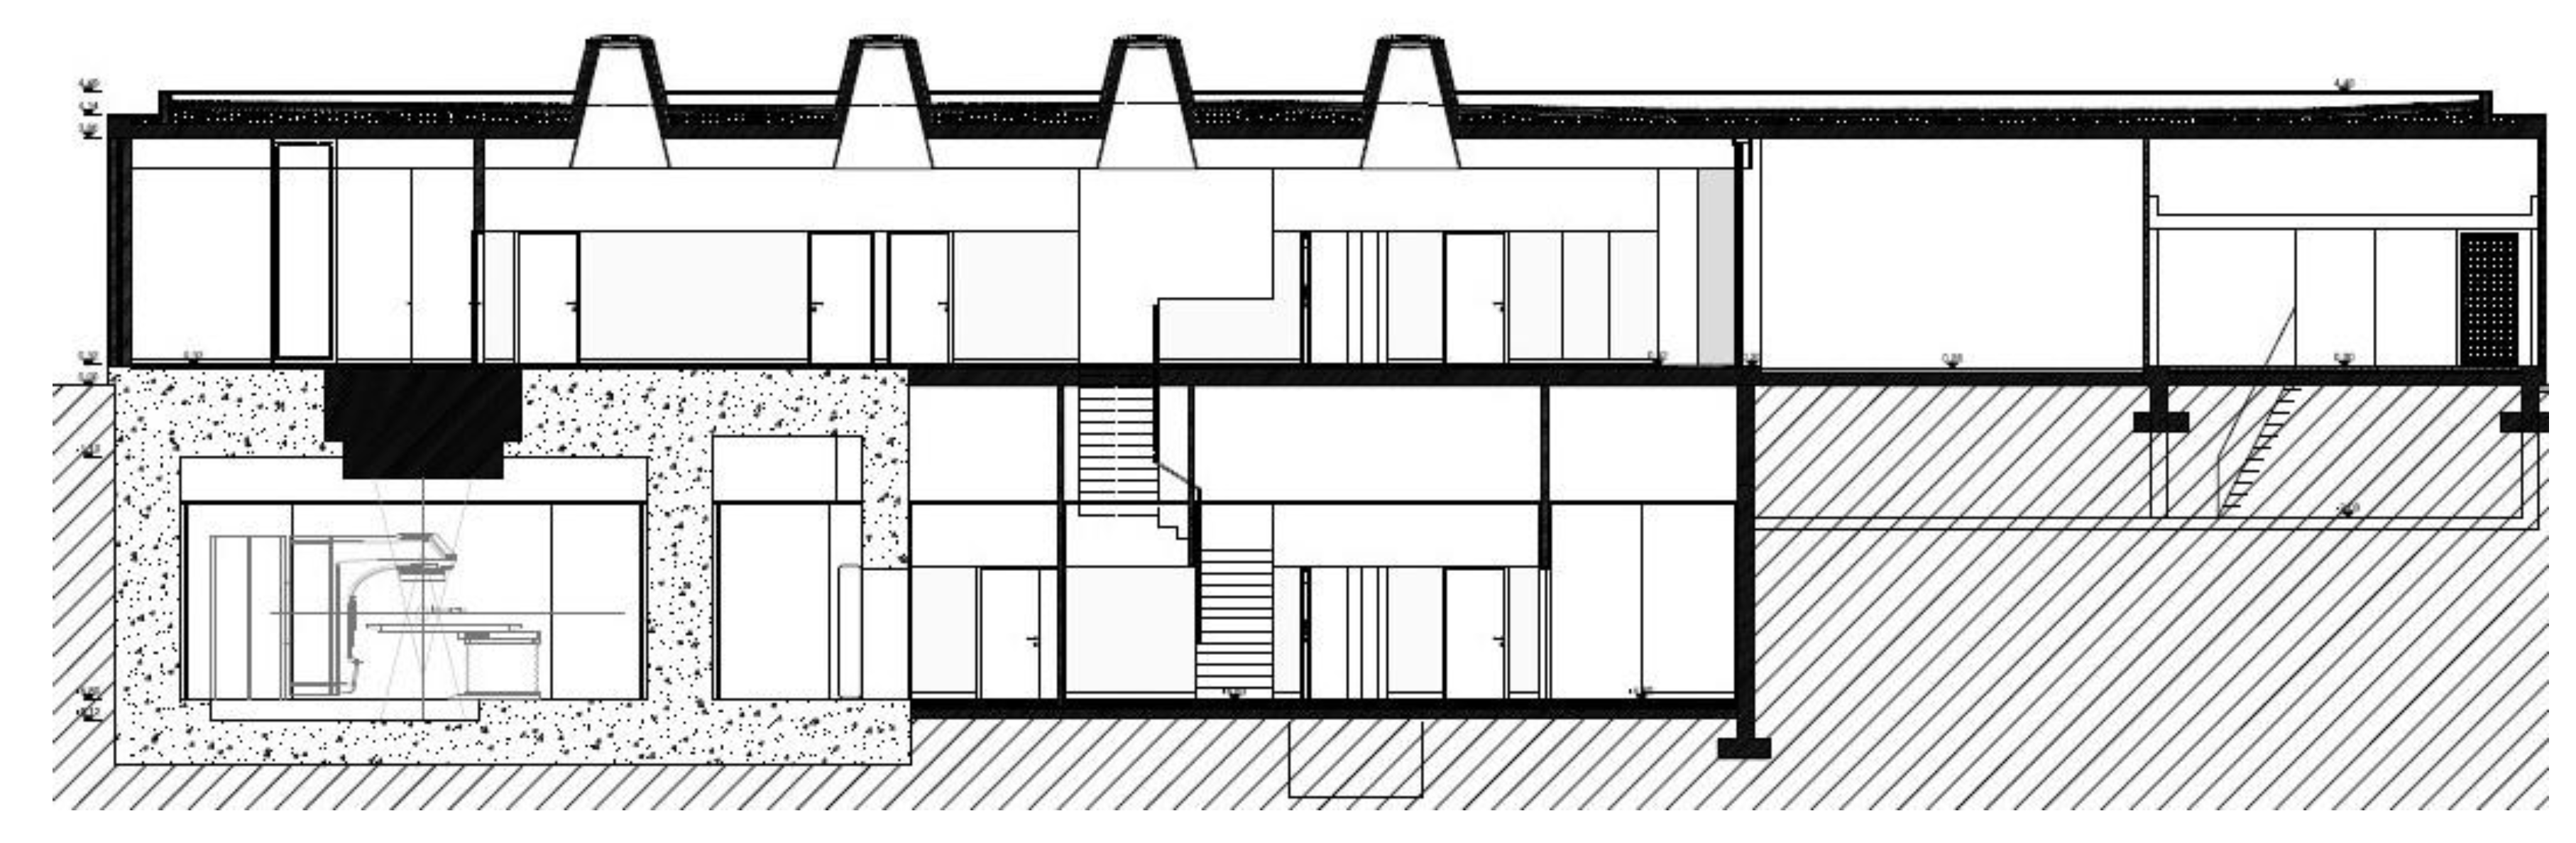
To develop and validate the methodology of Data with BIM and BI management in the planning and construction management, a building was chosen as a study case. It is made up of 2 floors, floor −1 and floor 0, with a reticulated structure in reinforced concrete, double walls in brick masonry, and reinforced concrete walls in two rooms on floor −1 (
Figure 1 and
Figure 2).
2.1. 3D BIM Model
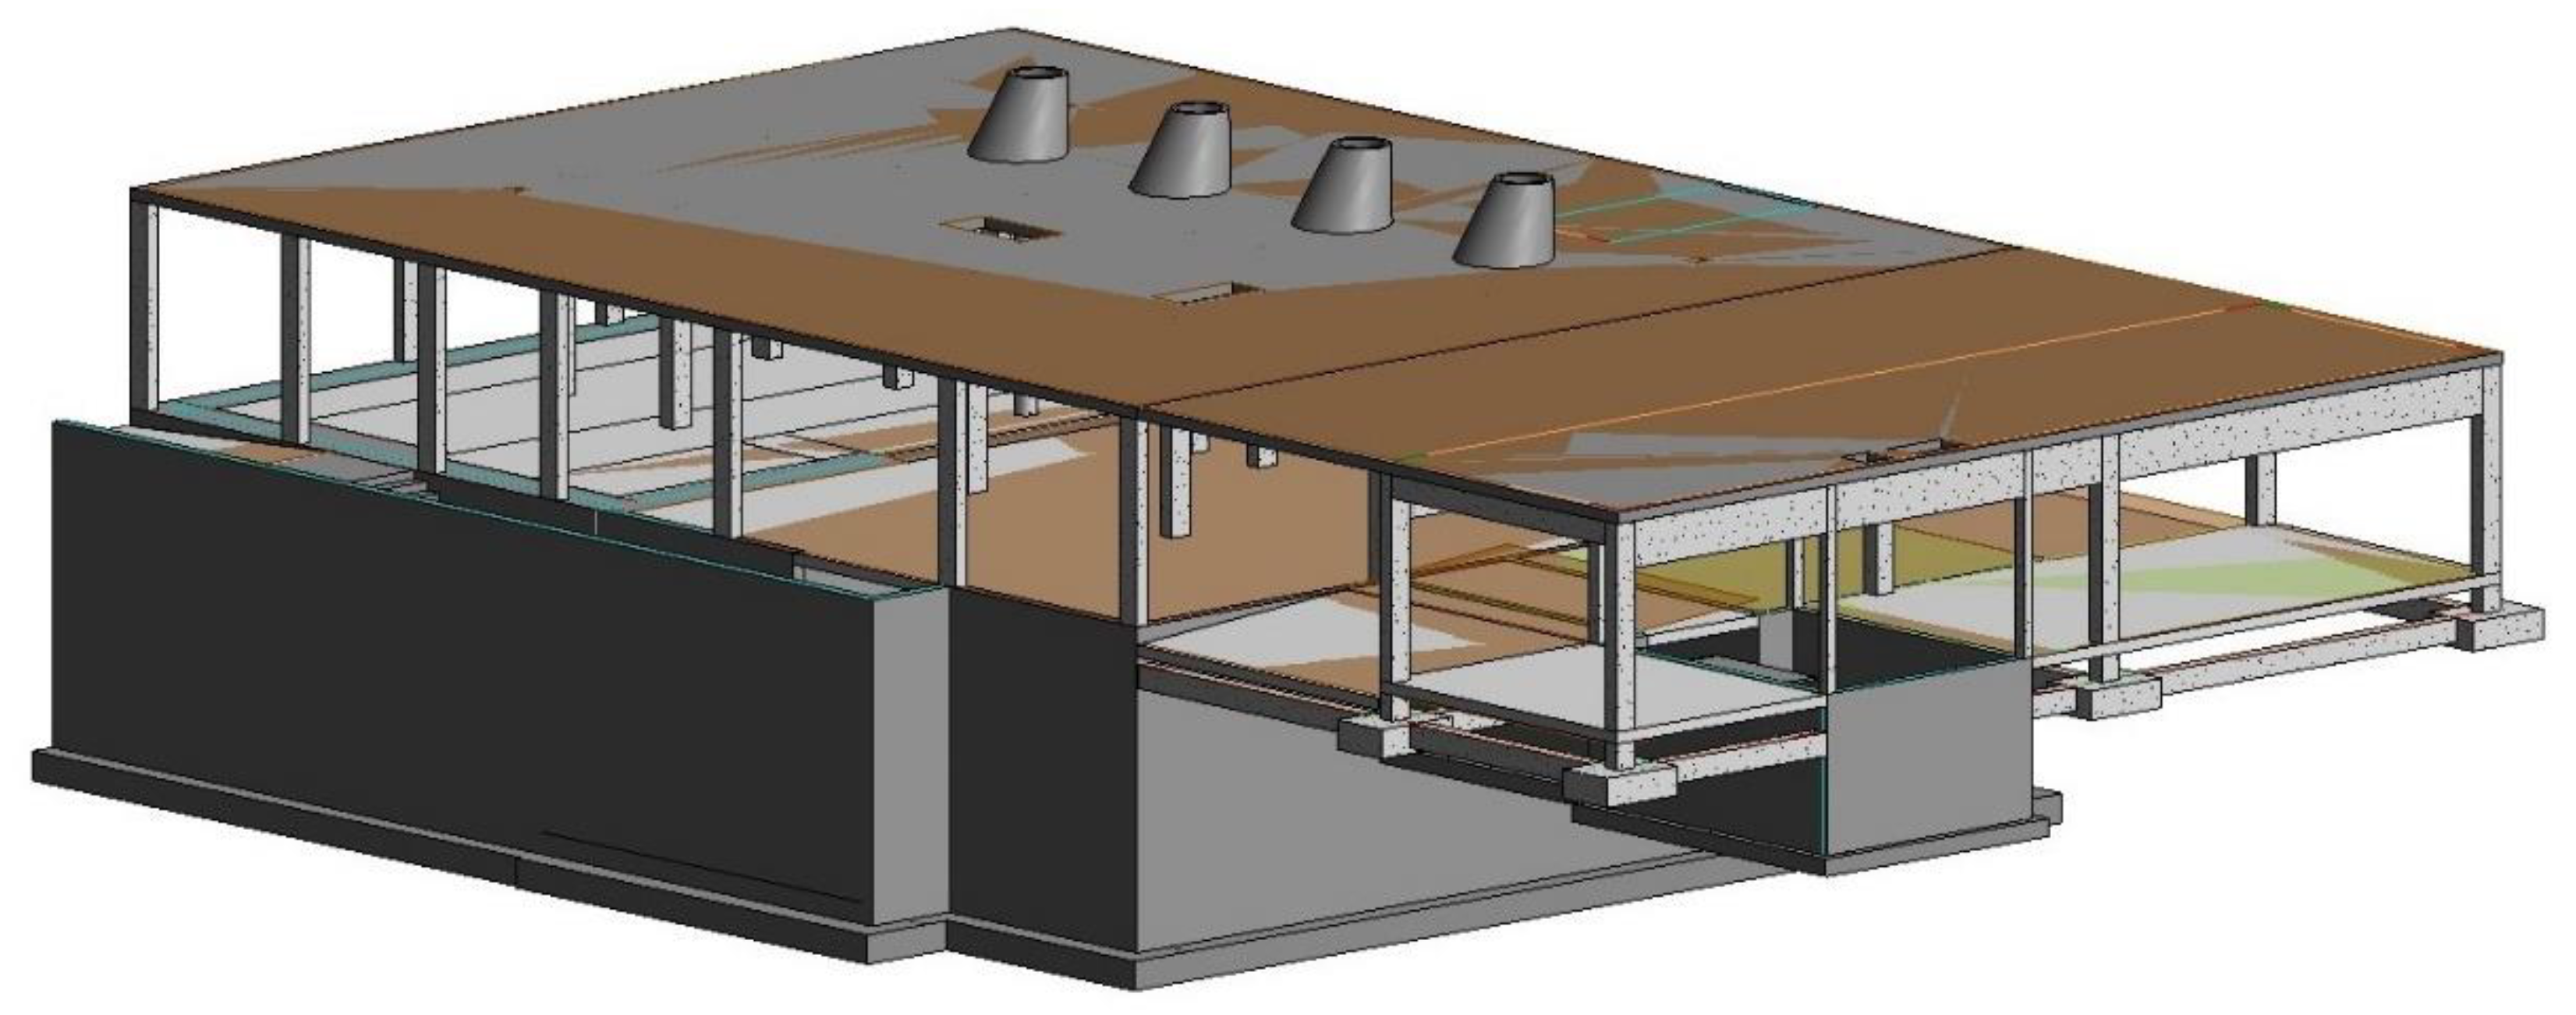
The building structural model was developed with Revit Autodesk software (
Figure 3), a parametric software that allows for the storage and management of information throughout the project life cycle.
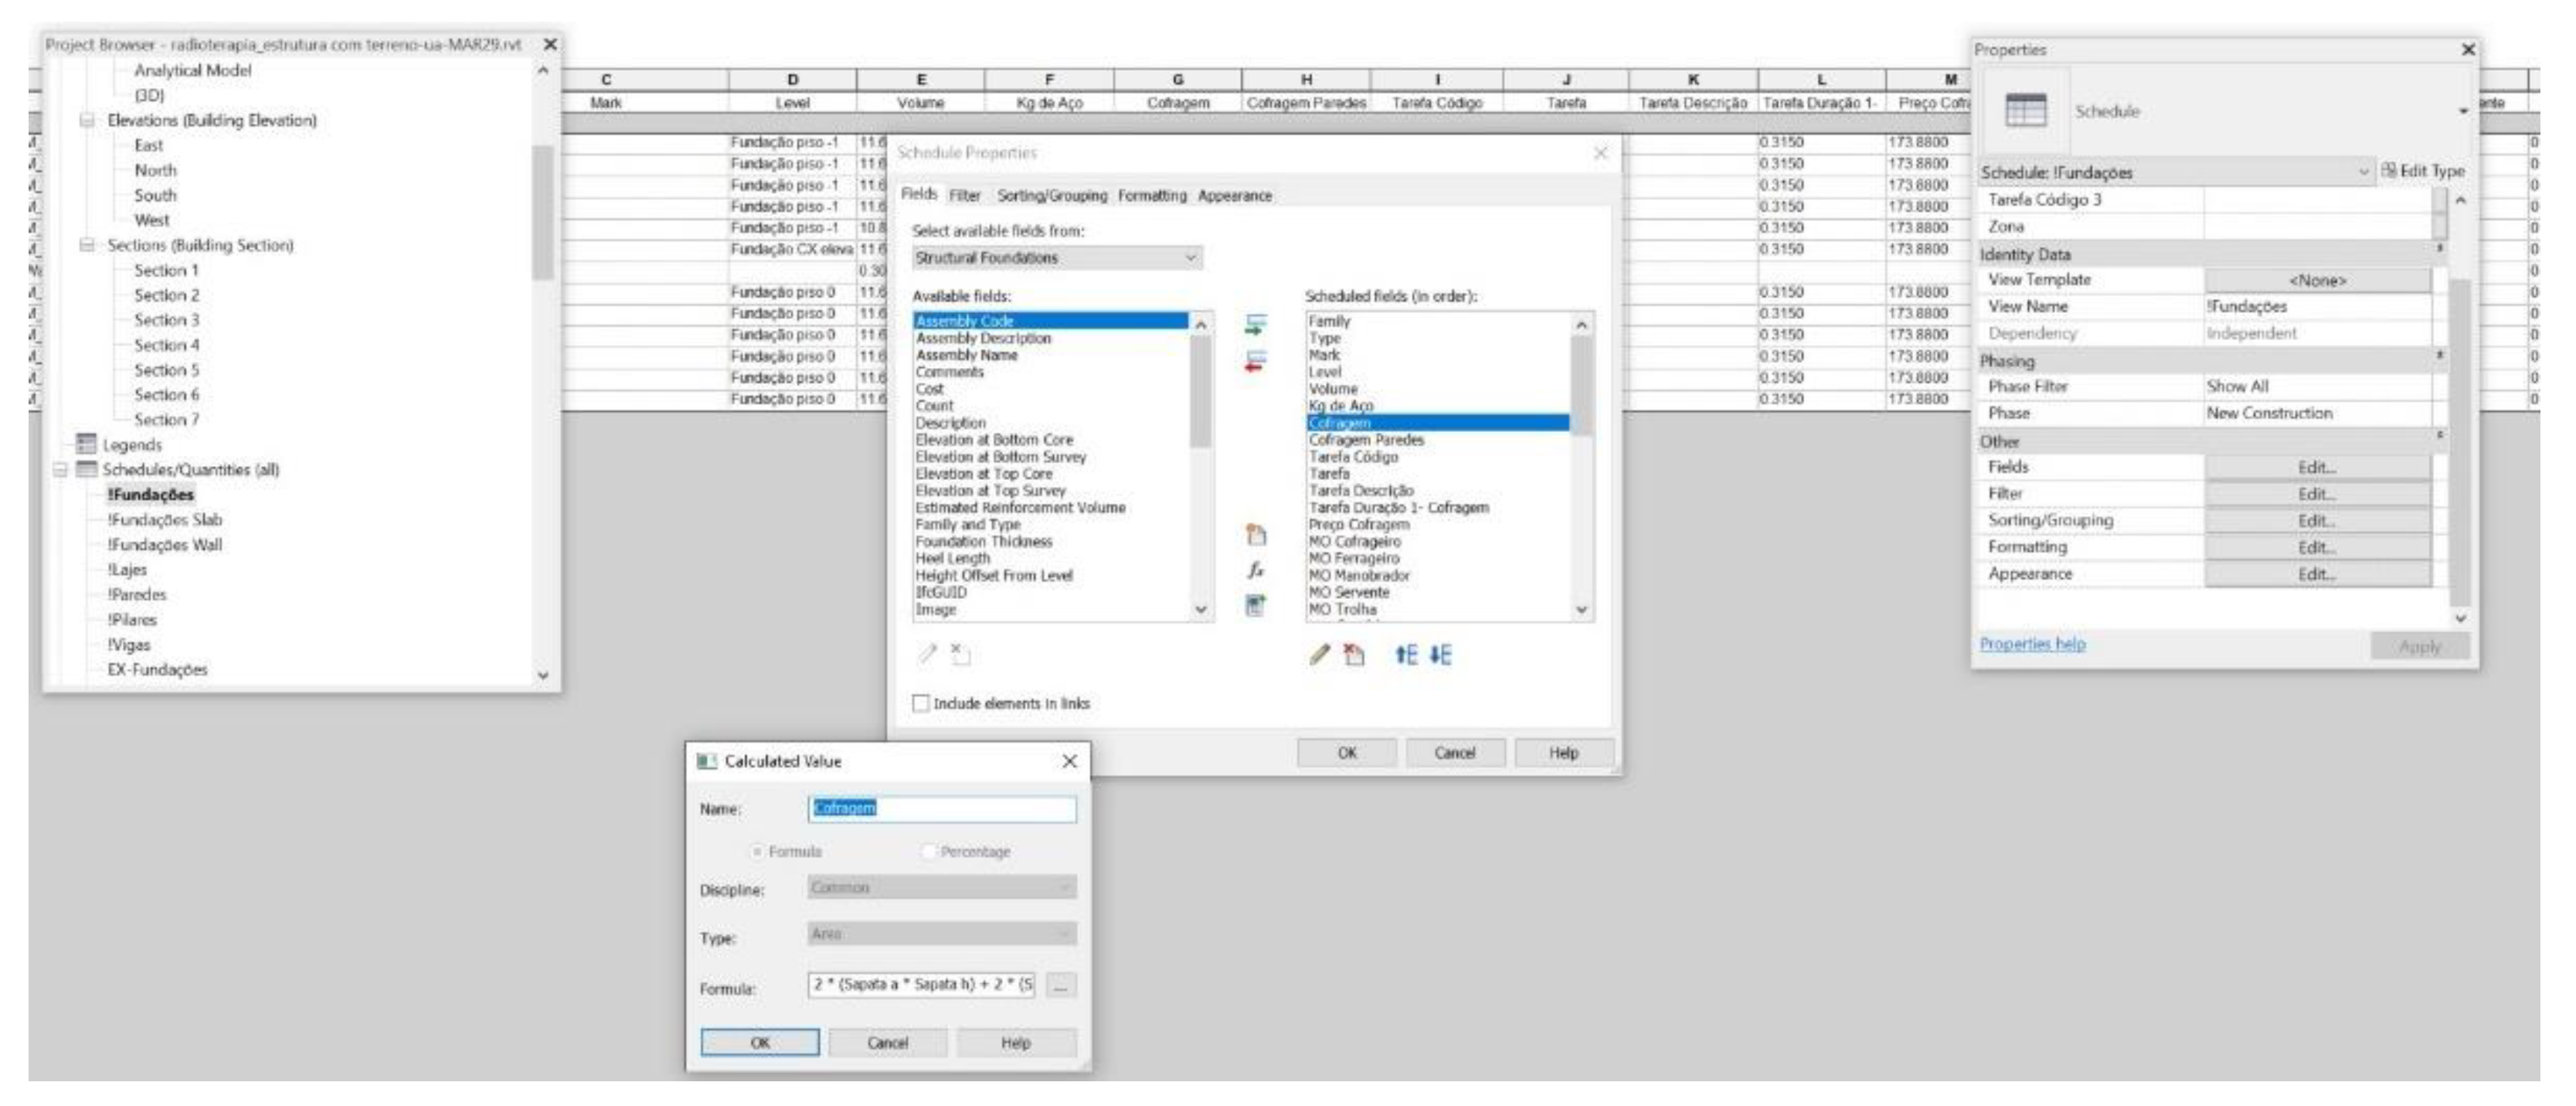
In the scope of the construction management, the goal was to create a model that allowed for the automatic extraction of quantities and in which the essential information for management could be inserted (tasks description, tasks duration, costs) in the scope of planning and cost control, allowing for the Virtual Design Construction (
Figure 4).
The developed 3D model works as an information storage container which will have to be read and managed to effectively serve as decision support at any stage of the project. For each element, which geometric and non-geometric parameters had to be integrated was defined, allowing for resource characterization and information management, according to the previously defined objectives. In this work, as already mentioned, the scope is the construction phase and the construction management.
2.2. Data Modelling
Software Revit, as previously stated, is a parametric modelling software which makes it possible to integrate the geometric and non-geometric parameters in the model object. In the 3D model, parameters (shared parameters) were created, allowing for the integration of the necessary information for the construction management related to each element of the model. The parameters, which allow for the automatic extraction of quantities and the formula for calculating the duration of each activity, were introduced in each object to extract the corresponding duration per element and, subsequently, per activity. In addition to these parameters, cost parameters were also introduced to perform the appropriate control. Thus, for each constructive element, the parameters to calculate the following data were created:
- -
the measurement of the constructive elements;
- -
the labor type;
- -
the unit consumption of each type of labor;
- -
the task code;
- -
the description of the activities;
- -
the duration of the activities;
- -
the costs control (throughout the unit costs, the quantities, and the percentage of concluded activities).
The different parameters were created as:
instance shared parameters such as the task codes;
type shared parameters such as the labor unit consumption and the description of tasks, among others.
Several formulae were introduced to calculate, for instance, by constructive element, the cost (for example of concrete pouring in a column = volume of concrete × cost of a cubic meter of concrete), the duration of tasks, etc.
Table 1 depicts, as an example, the formulae that were introduced in the model for the calculations related to frameworks.
The dimensions as the volume, area, perimeter, and constructive elements dimensions are automatically obtained from the model. However, other parameters such as formwork areas, the thickness of slabs, and so on, had to be calculated by means of the introduction of formulae in the properties of the objects (
Figure 4).
2.3. Data Extraction and Exchange
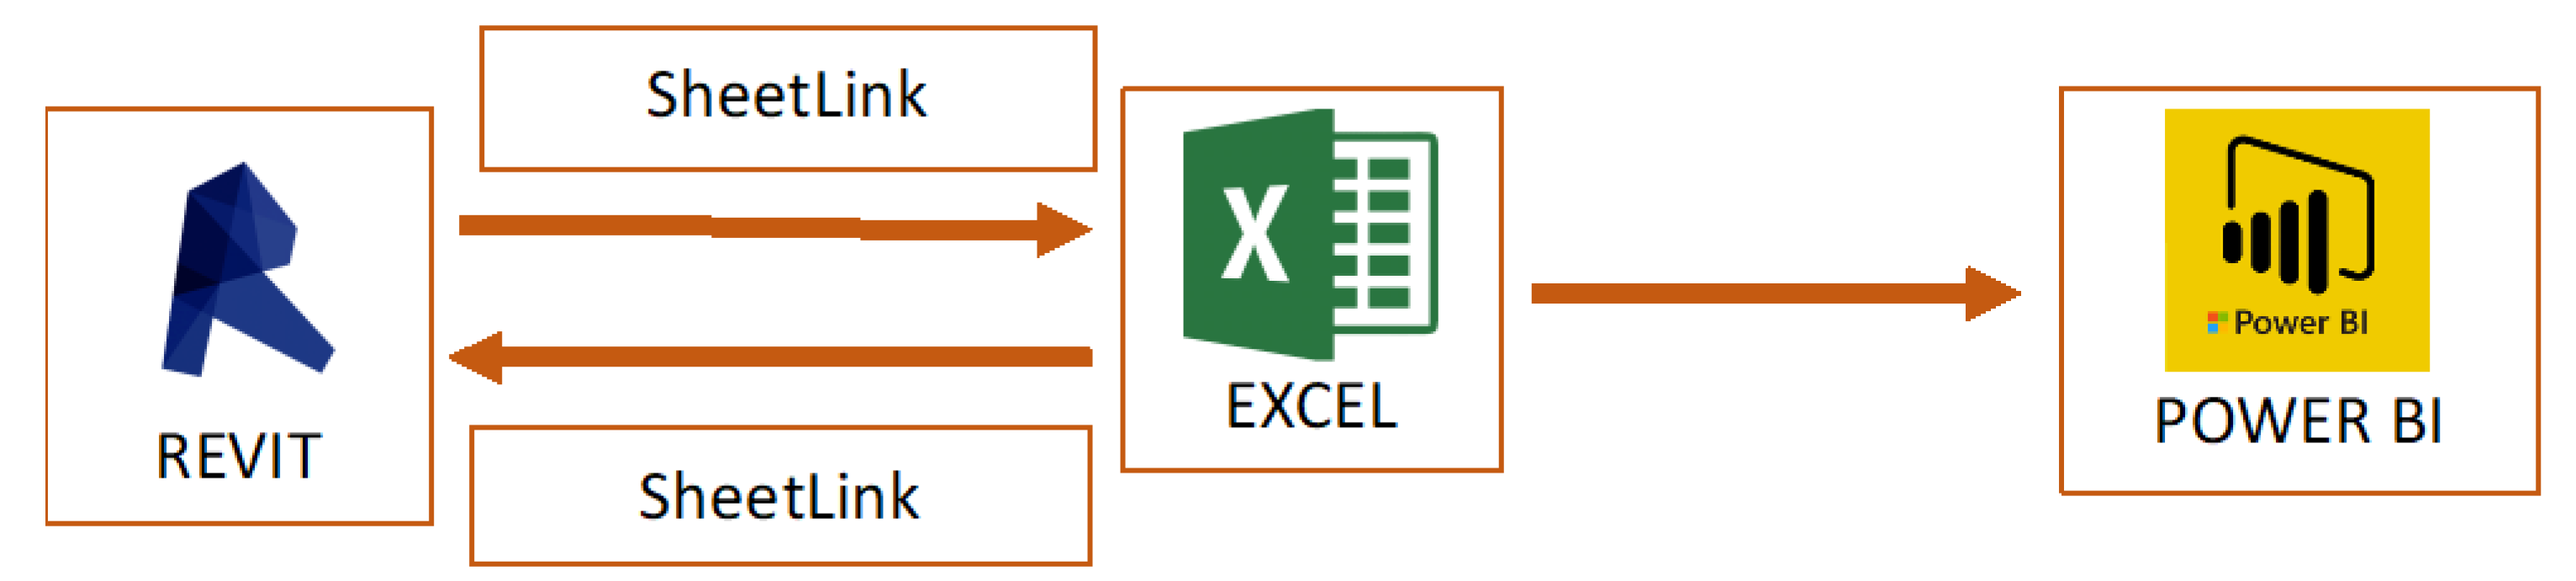
Revit allows for the extraction of information in tables to be opened in Excel software by means of add-ins such as Ideate BIMLink, Exceler8, and SheetLink. These allow the bidirectional exchange of data between the Revit model and excel files. In this work, SheetLink was used (developed by the Dirrots Company). This add-in was used to obtain the bidirectional export and import of information between Revit-Excel. According to the information to be obtained, the corresponding parameters were entered in each element of the model and a customized template of an import/export table/spreadsheet from and to Excel was prepared. This template will be used whenever there is an extraction of information from the Revit model in this and other projects. It is important to highlight that that workflow is always the same, which is essential so that the information is always treated in the same way, without duplication or loss of information. It is through that table that the model is fed with information, and it is also through it that the information will be sent to the BI tool. This work used the Power BI tool for processing and visualizing the data. Power BI is a BI software used in project management, portfolio management, and information, as well as data management in general. It was chosen because of its capabilities and functionalities in addition to its user-friendliness and free access. It also allows for the set of data that is introduced into the model to be easily and automatically updated over time by means of summary tables/templates which can be viewed and filtered by type, date, category, within dashboards, facilitating the understanding and management of information within the work team and providing data for decision-making support.
A scheme of the information exchange from and to the Revit model was created. The information will be introduced in and extracted from Revit, using Excel to supply Power BI (
Figure 5). Despite the generalized use of BI tools in management processes, in the scope of construction management, it is not being used. Therefore, this work is innovative in integrating BIM with BI for construction management.
2.4. Management Methodology
With this methodology, it is possible to automatically extract the quantities of each construction element (object/family), defined by its ID (
Figure 6), and a corresponding planning activity is associated with each one. The definition of those activities, as well as their sequence, were previously defined in the MS Project software, a software widely used in planning. In the Revit model, different formulae were introduced, including mathematical expressions to calculate the duration of each activity in which the quantity of work is automatically extracted from the model.
2.5. Data Analysis and Visualization
As previously mentioned, the data analysis and its visualization are made with Power BI, which is supplied by the data extracted from the model through Excel files. Any changes that occurred along the project phases are automatically introduced in all these elements, working as a single platform (the Revit model), avoiding errors, failures, and disorganization of information (
Figure 6). Dashboards whose structure can be used for different projects allowing the information contained in the Revit model to be easily read, visualized, and analyzed were developed in Power BI, as shown in the section that follows.
3. Results
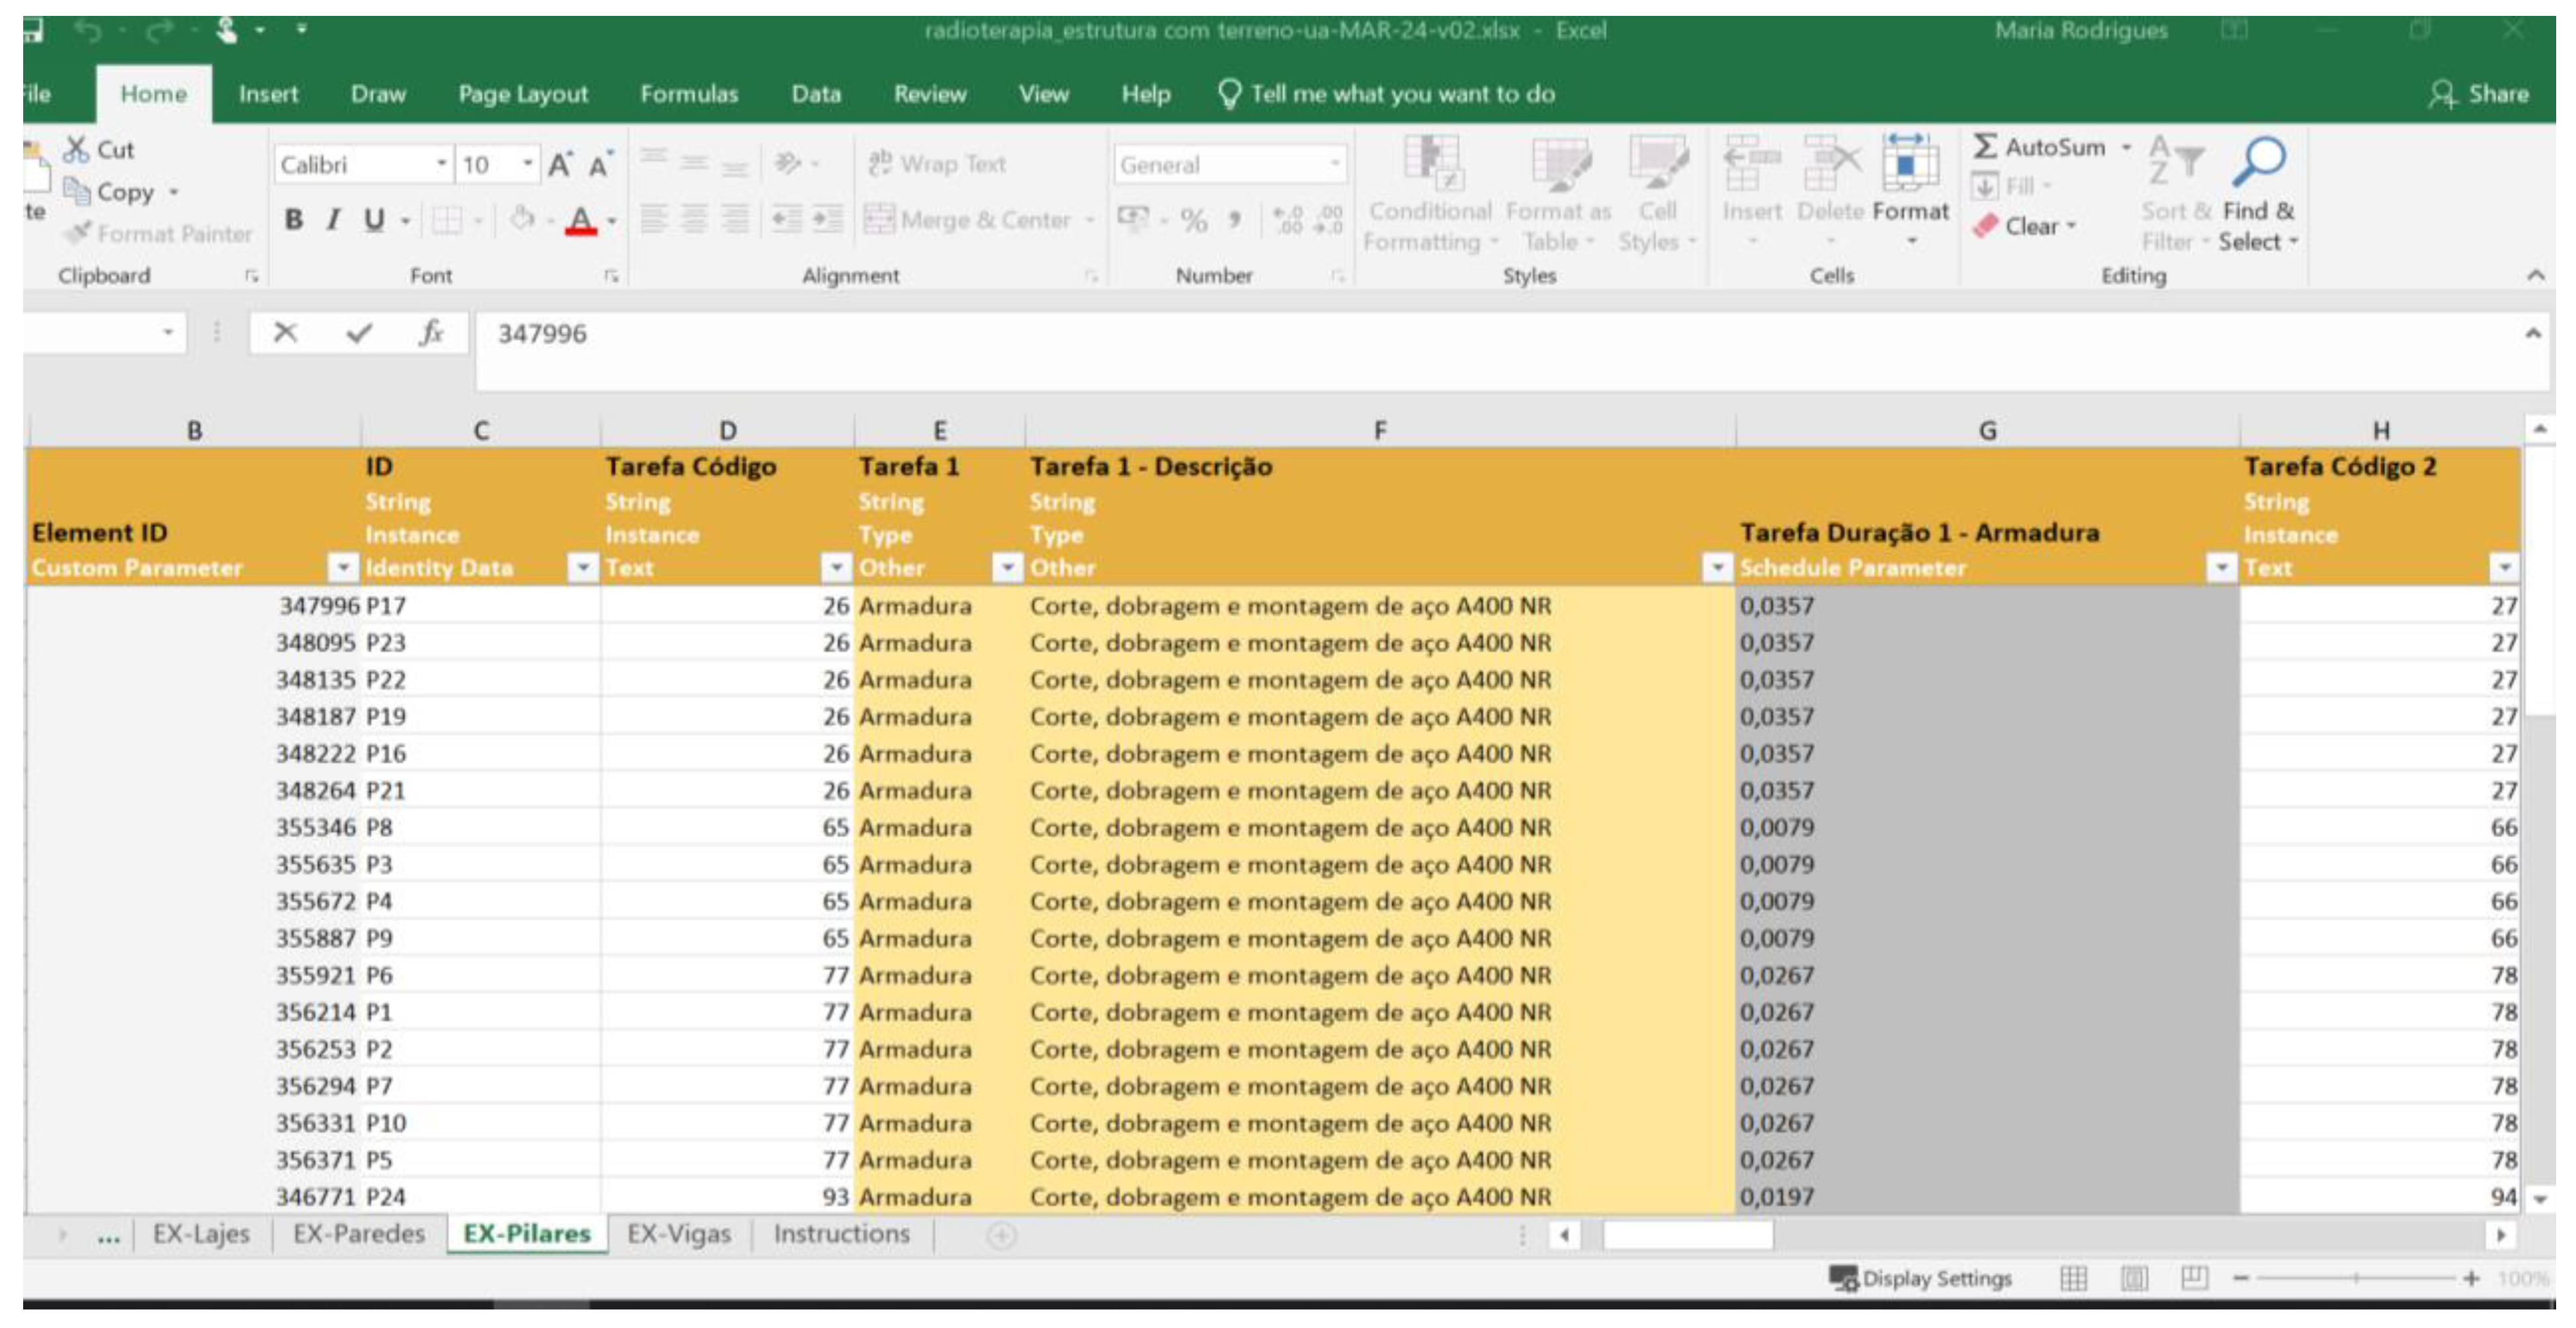
The construction management faces difficulties to do and to obtain real-time accurate analysis due to the quantity, diversity, complexity, and fragmentation of construction projects data, the wide range of different indicators, and their dynamic behavior that has to be permanently analyzed during the construction phase, despite the currently available software tools. In spite of the current software potentialities, the procedures of construction management, namely quantities and cost control performed at each moment and each construction location, still represent hard and time-consuming tasks, involving different tools with a high probability of error and low accuracy. Therefore, in this work, an innovative and integrated methodology was designed—data management with BIM and BI—to avoid data losses, permitting an up-to-date accurate cross-related data analysis and visualization. For this purpose, templates of data organization and extraction were created, allowing for their use in different projects. Data extraction is done from the model through Excel files (
Figure 7) which, after being organized and modelled, will feed Power BI.
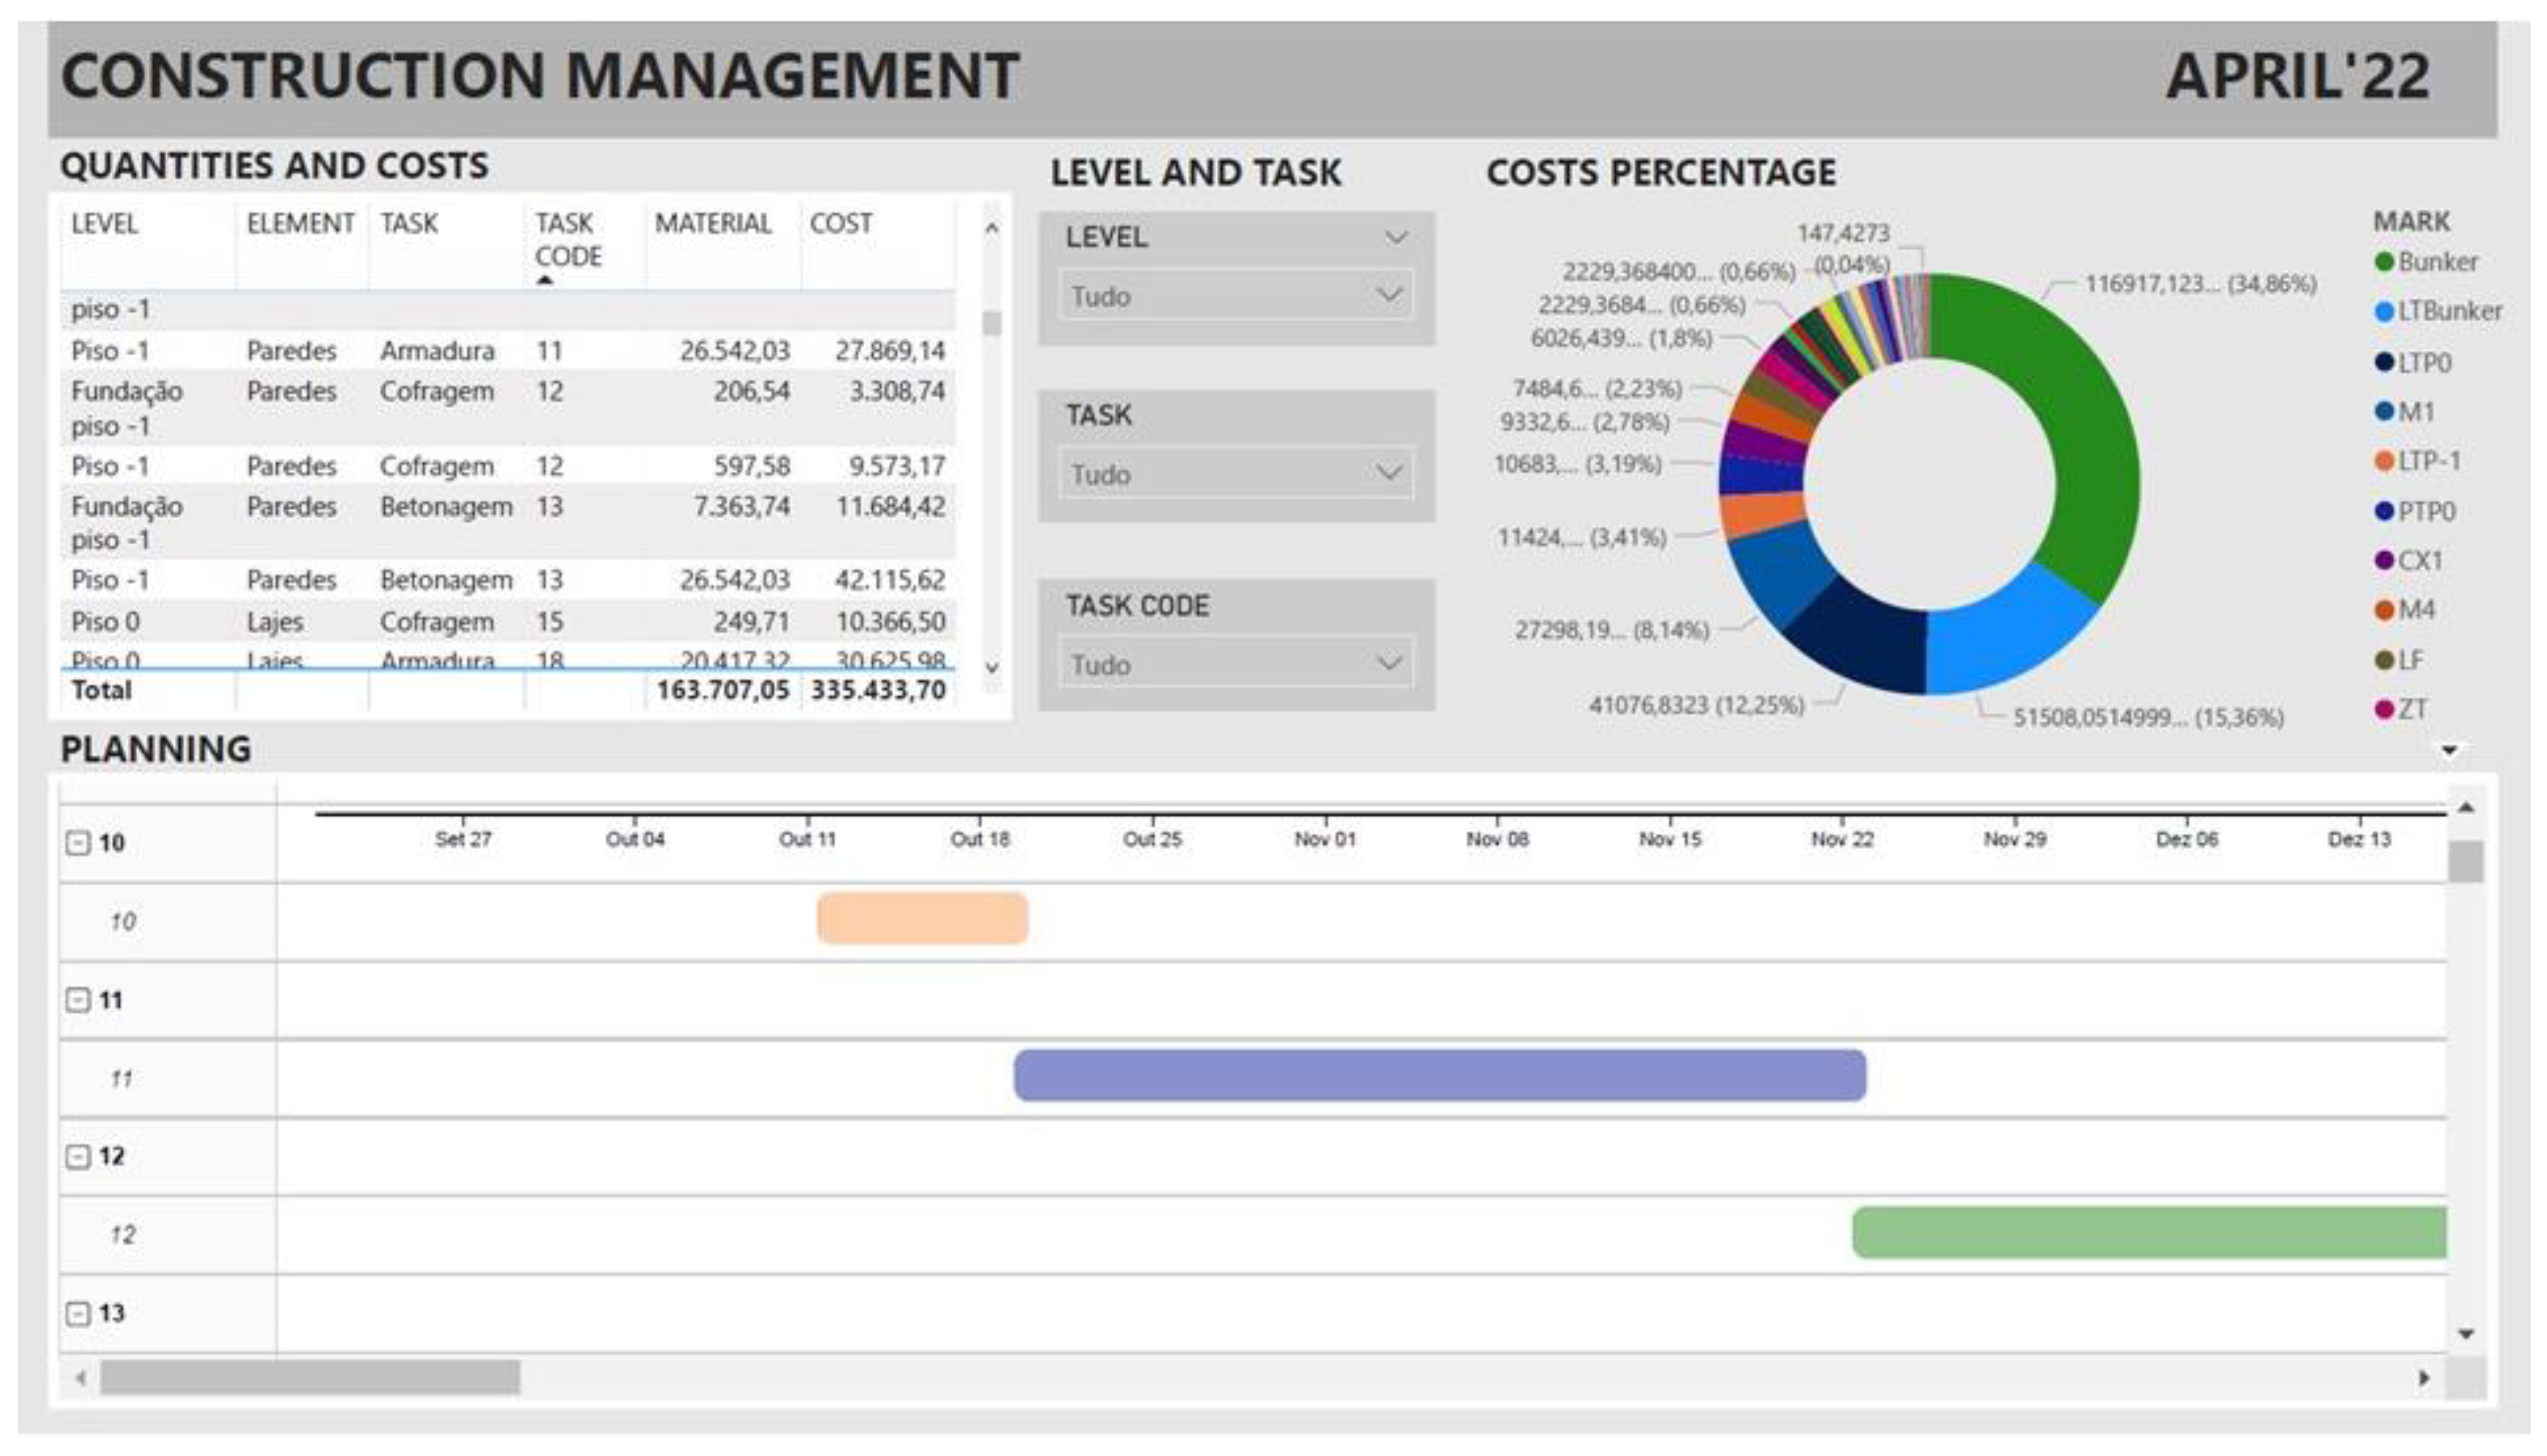
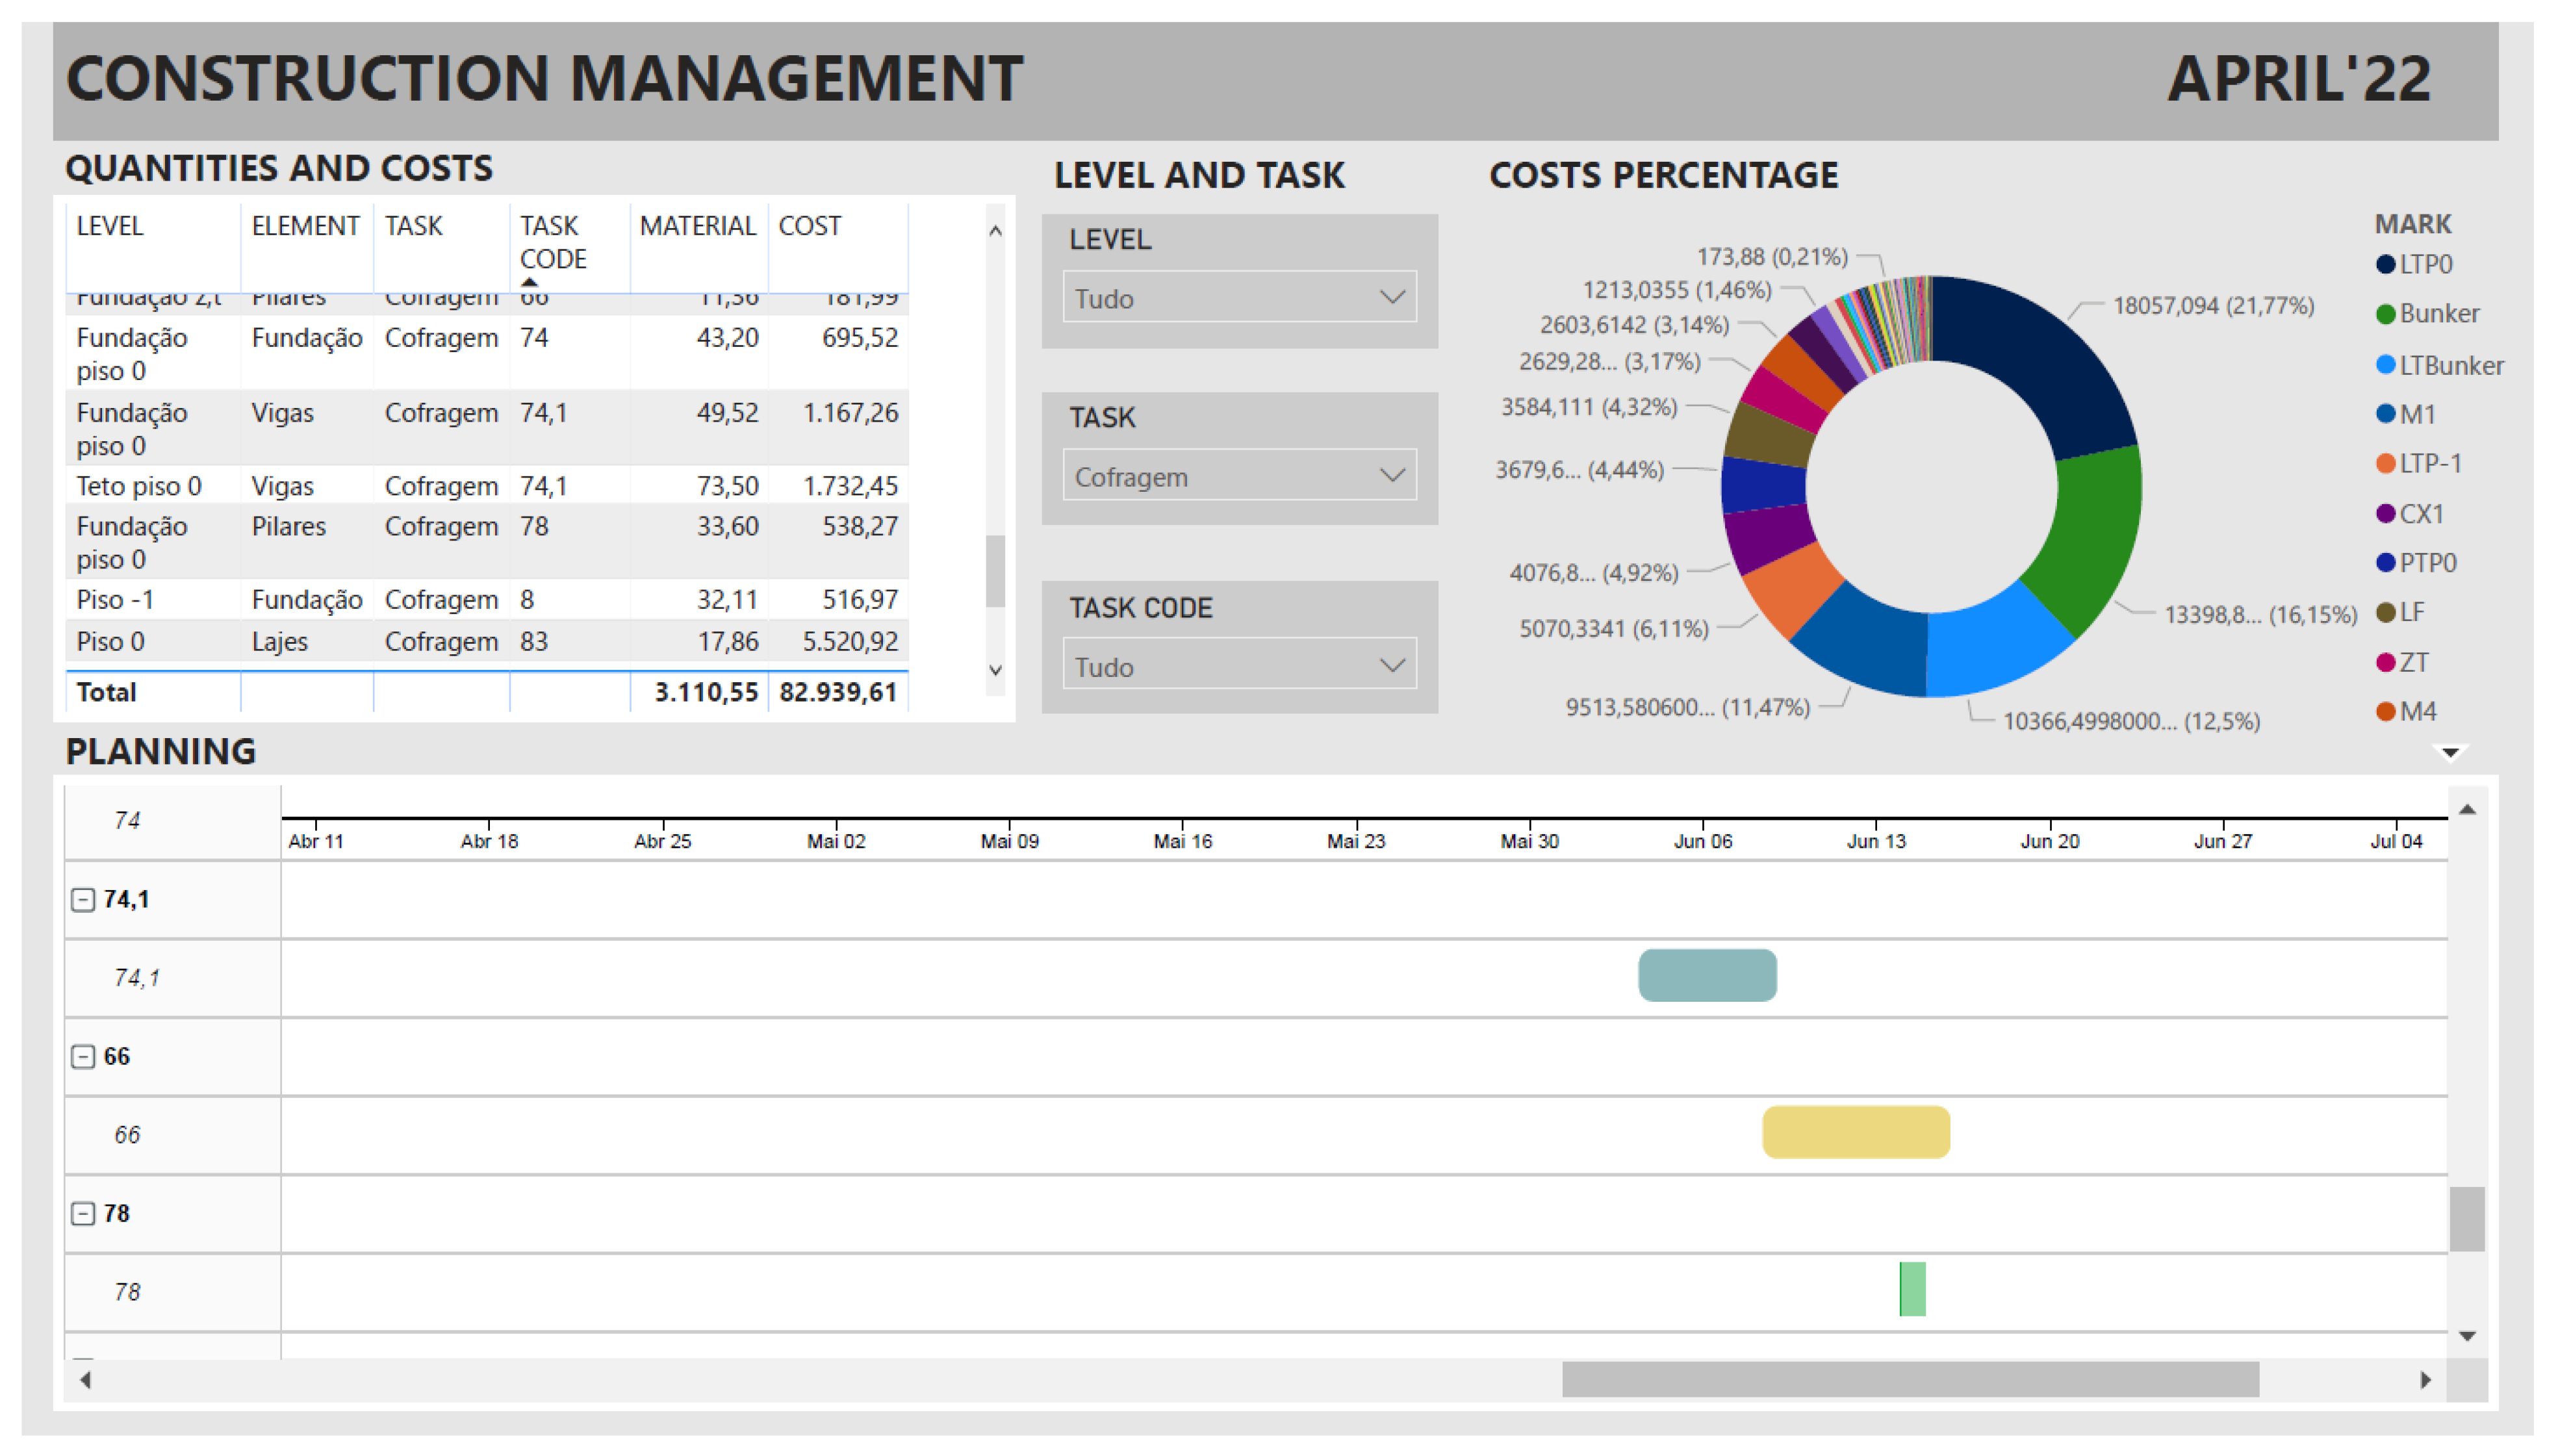
Any data updated in the model is automatically organized and modelled to be used in the BI tool, providing the construction management team with quick, real-time, and easy access to data and their analysis, always integrated with the 3D parametric model. As it is difficult to communicate the information contained in the Revit model to the different elements of that team, the BI tool permits solving this problem by means of the data correlation and visualization, allowing for their clear analysis. This analysis is made through dashboards which were designed to give the results the construction management team need. These dashboards make the data analysis by filters (in accordance to those needs) possible. In the developed study case, the filters give correlated information by level of construction, by task, the task code, and the associated planning, depicting the material quantities, the duration of activities, and the total cost of the task(s) (by activity type: formwork, steelwork, concrete pouring), by each constructive element (foundations, beams, columns, slabs), and the task(s) percentage of costs by constructive element, always with the same updated and available Revit model information. This analysis and visualization are done in an interactive way, which is made possible by the combination of the different parameters.
Figure 8 depicts the data for the reinforced concrete structure under study, correlating by the level of construction, for each task, the quantity of work and the corresponding cost, the total cost, and the percentage of the cost of each constructive element. The planning is also depicted, being interrelated with the tasks that are being visualized. All the Gantt bars have the information of each task planning (task description and duration, beginning and end date as well as the predecessor task), visible by passing the cursor on the bar.
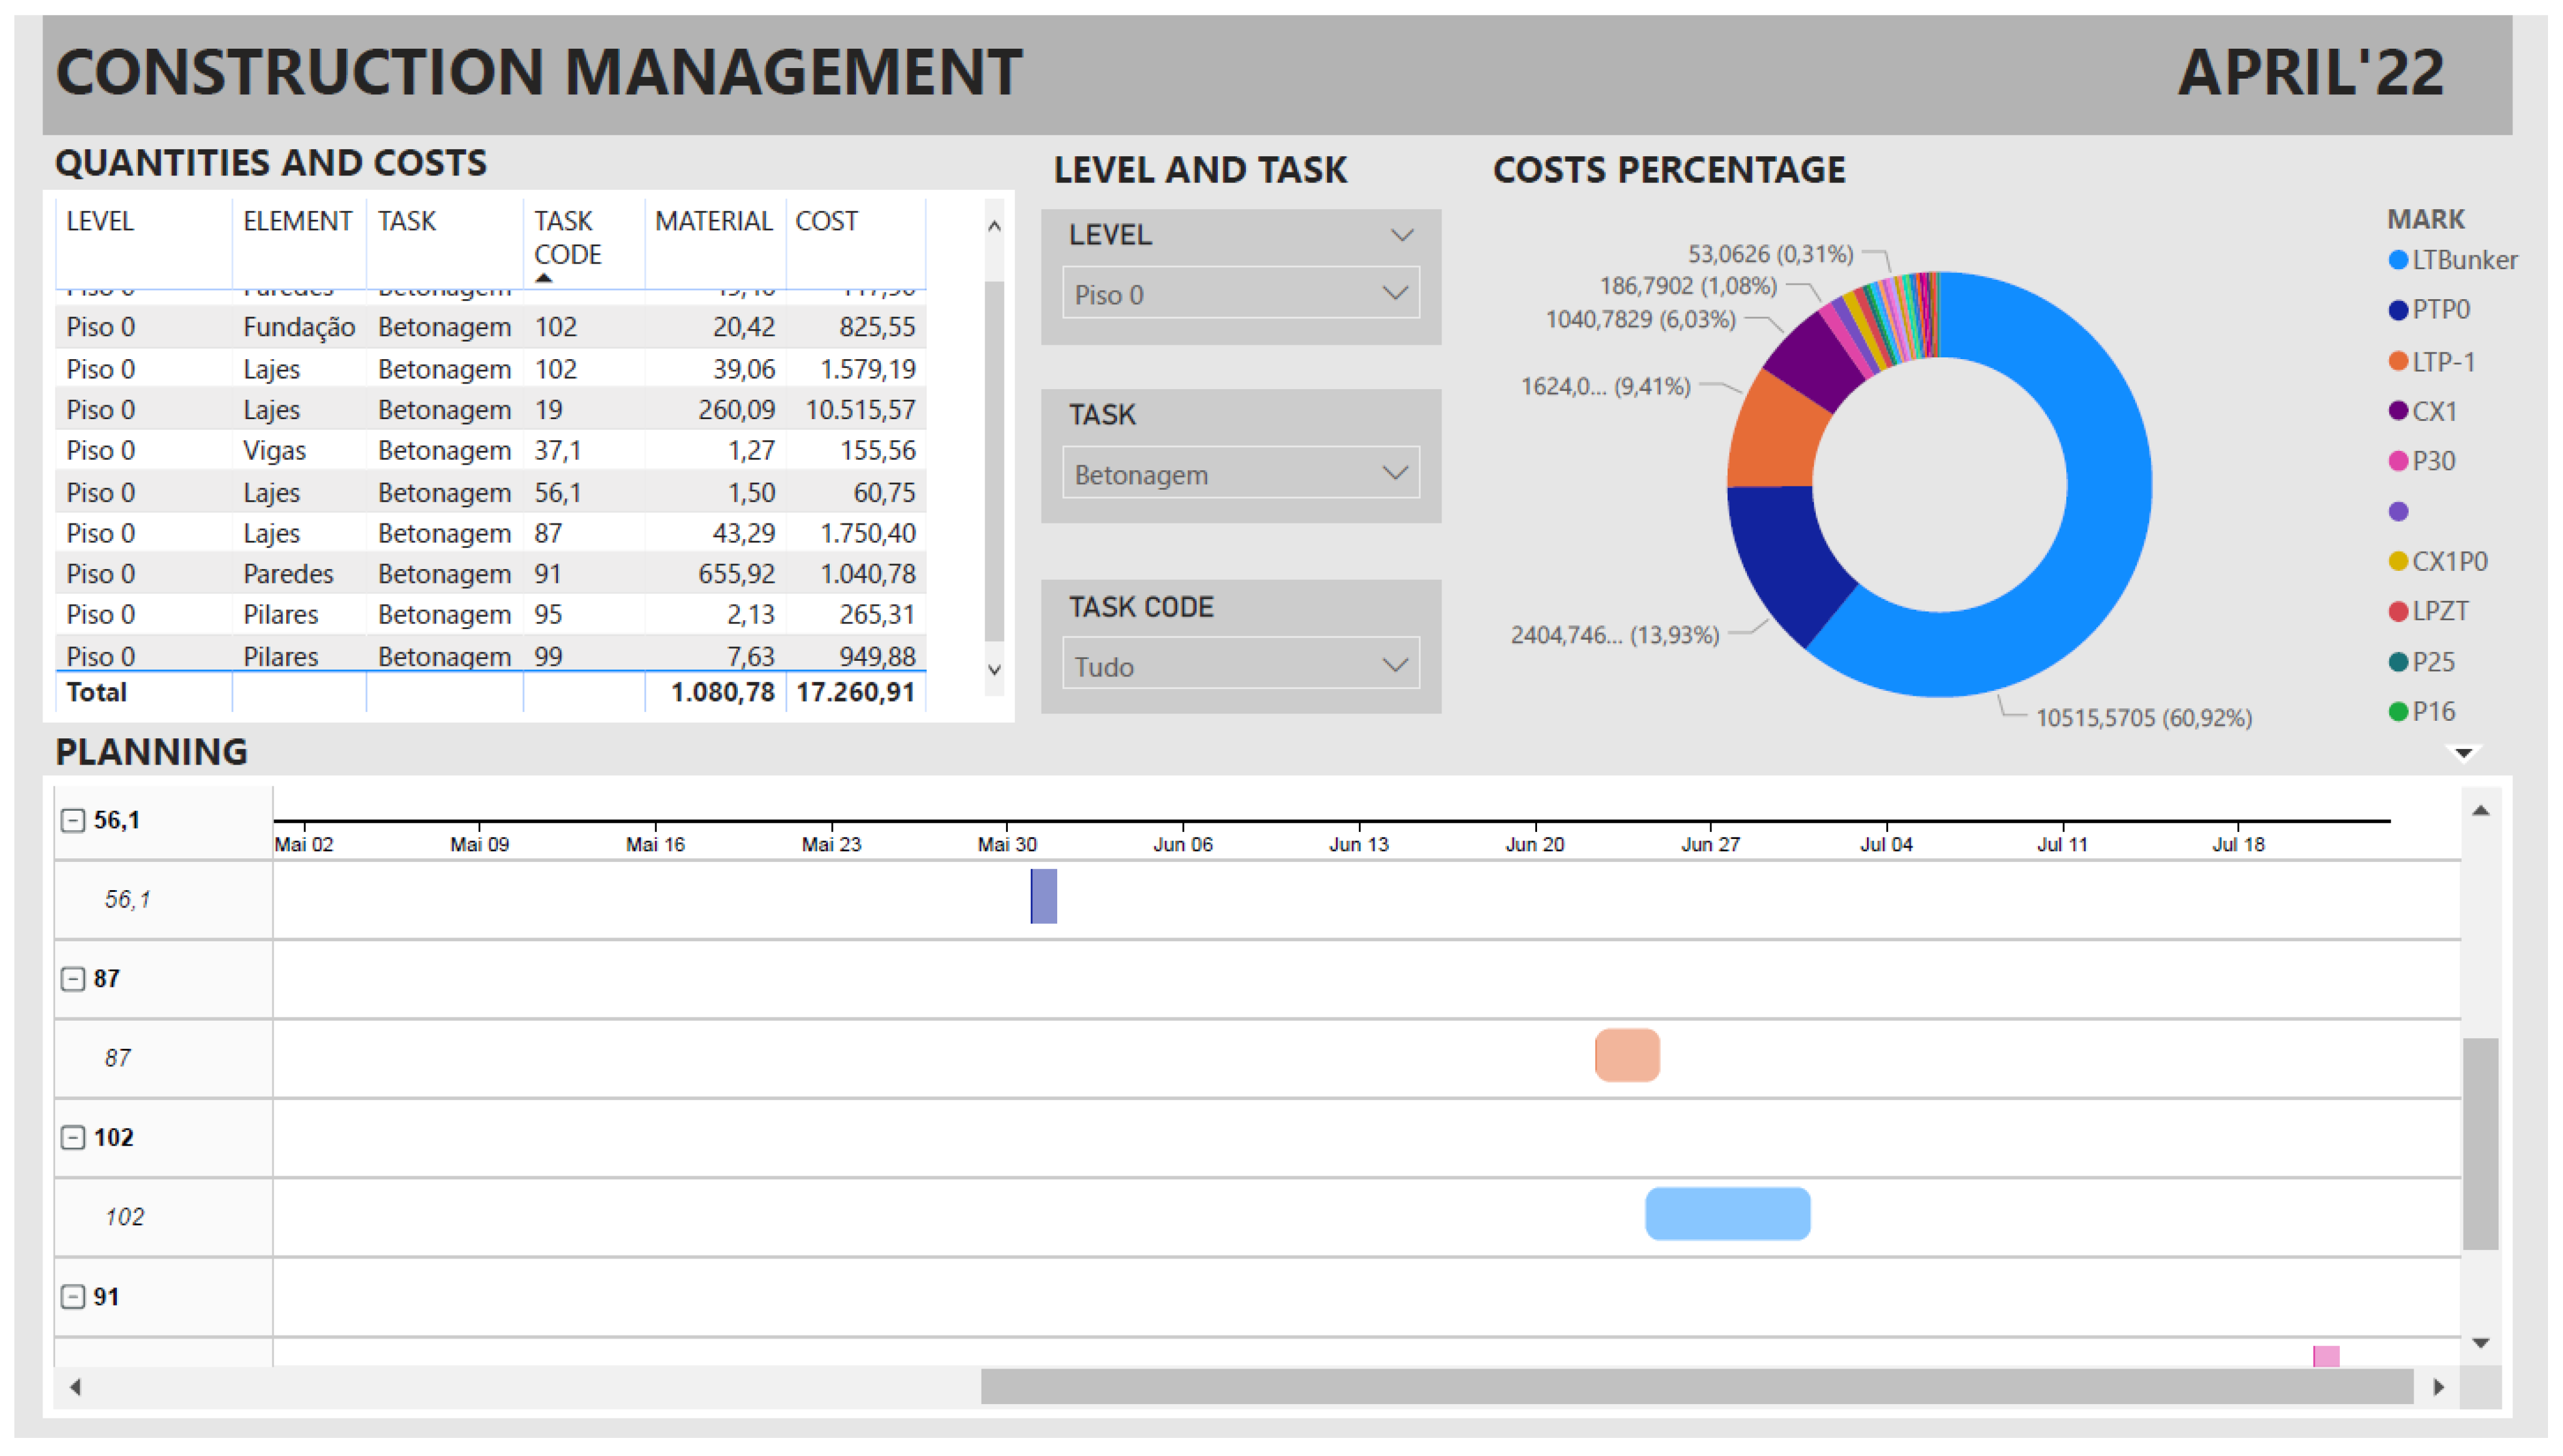
Figure 9 depicts, for level 0, the quantities and costs of the concrete pouring activity for each specific task. Again, the planning is interrelated with each task and the total cost and the percentage of the cost of each task concerning the total concrete pouring cost of level 0 can be analyzed.
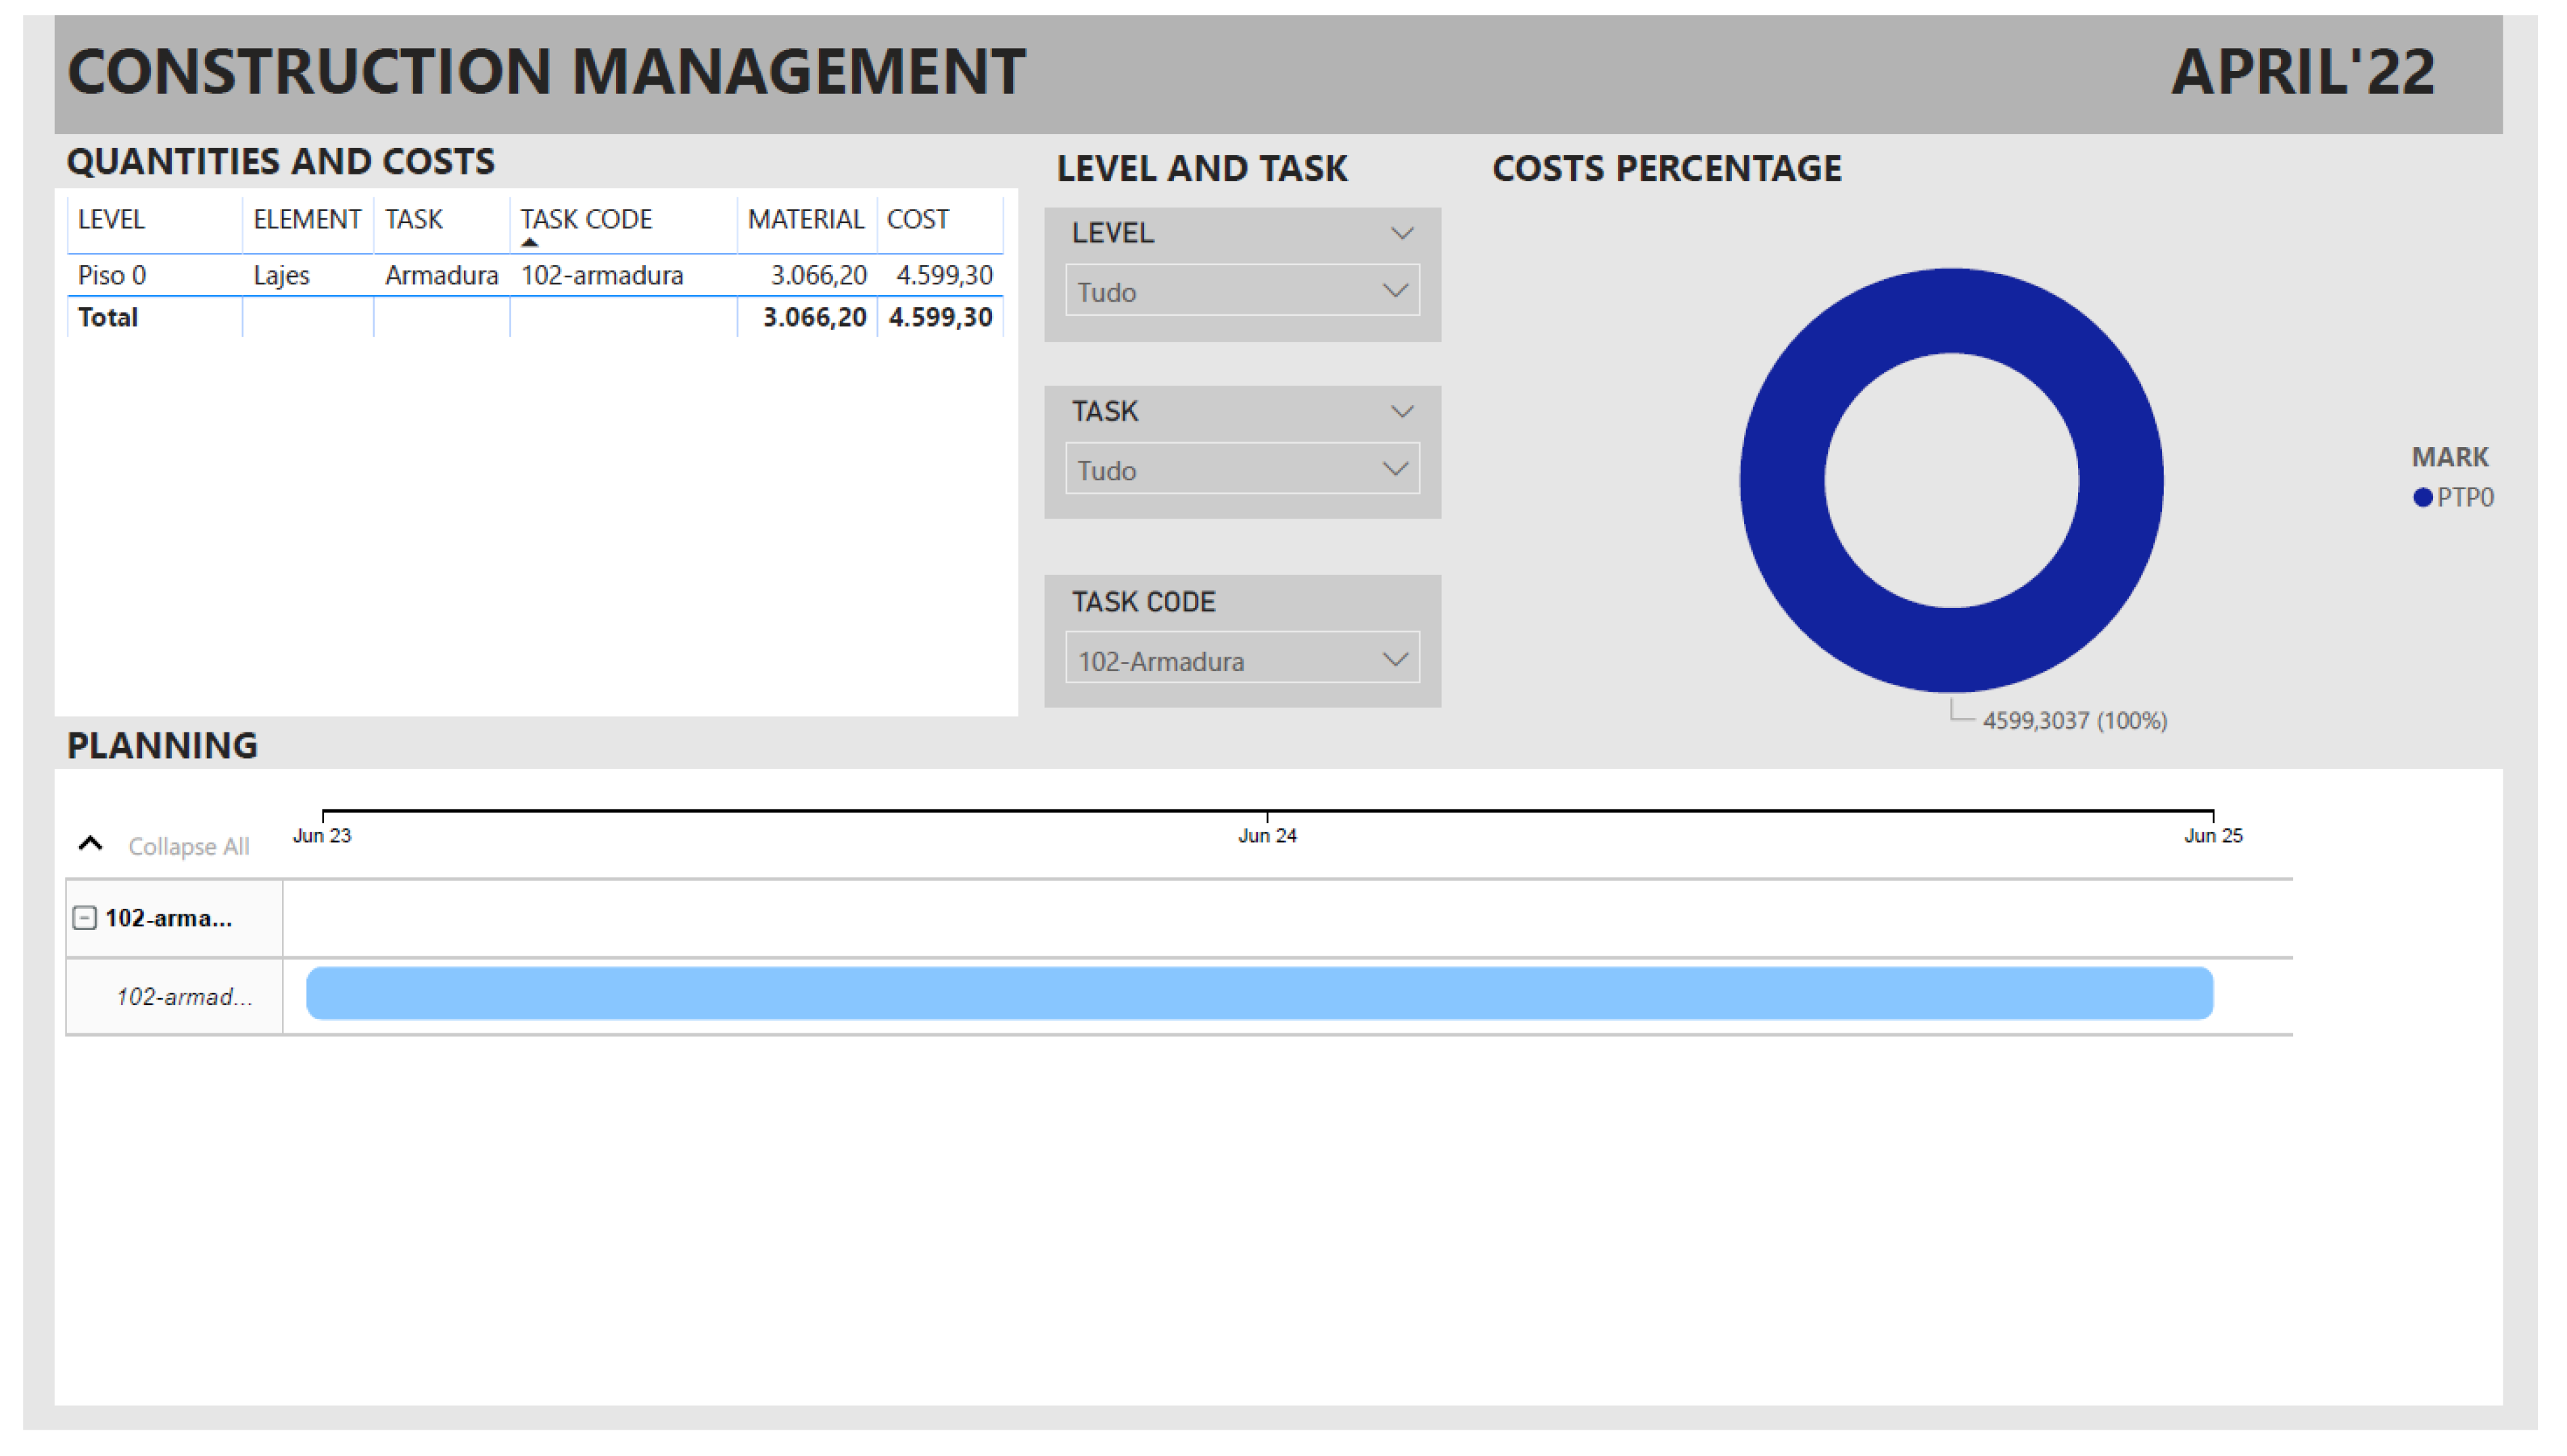
Figure 10 shows all the formwork tasks and the correlation of the previously described data. In
Figure 11, data are depicted only for the task with code 102. It shows that this code corresponds to the total steelwork of slabs of level 0, involving 3066.20 kg of steel bars, with a total cost of 4599.30 €.
Therefore, this methodology allows the construction management team to visualize and obtain updated cross information about quantities of materials, planning, and cost control. This information can be complemented with other data, which allows for real-time control and management of different management topics and the production of automatic reports. The developed methodology leads to the permanent integration and interrelation of the data management and the information contained in the construction virtual model. At any moment, any change in the virtual model is automatically updated in the defined spreadsheets and, consequently, through data visualization in the Power BI, avoids any kind of losses. Therefore, this methodology contributes to the efficient management, the reduction time, and the probability of error or omissions, avoiding manual data entry and extraction, thereby allowing for permanently updated databases and reports.
4. Discussion
As a result of this work, a methodology for construction data visualization, making use of dashboards, demonstrates an important change in the way construction project management can visualize and analyze different types of data integrated into building parametric models or in correlated building models to support decision-making, as dashboards can be used for one building or a set of buildings. The dashboards developed in the scope of this work can be reproduced for other projects since Power BI allows for the models that were developed to update the information after the corresponding data is updated. Additionally, in terms of the Revit modelling, a set of families with the shared parameters, which are needed for data extraction to feed the dashboards that can be used in other projects, was created. The developed methodology for cost control and the extraction of planning information is proposed as the basis of a working model that can be used in any type of project, without having to reintroduce all this information. The families and the project template produced with this work already integrates this type of parameter, allowing for the automatic attainment of the necessary information for the construction management using the Revit software, as well as allowing for the subsequent extraction of the same information to be introduced in Power BI. The designed Dashboard is aimed at cross data visualization, and it is a template base for the visualization of the information and sustainable decision-making support. Thus, through this automation and synchronization, it is possible to make any change in the model, with the quantification and duration of activities being automatically and instantly changed also. Furthermore, in any project where the same families are used, or the template that was developed as a result of this work, it is possible to use and extract the same type of information without having to introduce all the parameters.
Considering current construction management procedures, this new methodology permits a holistic vision of all the data that is intended to be analyzed and correlated, as opposed to the current ones, which output fragmented information, making it difficult to visualize and analyze it in an integrated way. The developed dashboards with dynamic information filters allow for data visualization and correlation. This analysis enables easy answers to construction management team questions without needing the verification of a set of dispersed documents with information, such as the planning, the budgeting, and the bill of quantities, among others.
5. Conclusions
This work aims to show the application of new technologies and methodologies for the optimization of construction management processes and, specifically, the planning of those processes. Construction, being a very traditional sector of activity and not very open to the integration of innovative management processes, is facing the challenge of decarbonization, digitalization, and information management.
The IT tools and the existing methodologies allow the sector, like other sectors of activity, to evolve and invest more in R&D. Investing in these Project Management methodologies and technologies helps companies in the construction sector to minimize their waste, their losses, which leads to reduce or even eliminate the rework and improving accuracy, communication, visibility, sustainability, productivity, among other aspects, of the corresponding processes. Despite BI tools being widely used in the most diverse sectors, they are not still used in the scope of construction management. This work developed a methodology for data management during building construction through data with BIM and BI analysis, demonstrated by a study case. The data were organized and linked to a BI tool, and dashboards were designed and produced. It was concluded that this data visualization methodology gives the management and the supervision teams real-time accurate support for data analysis during construction management in a collaborative platform, allowing project stakeholders to access and update data in real-time, in permanent linkage with the BIM model, improving the reliability of decision-making and ensuring the management processes deliverability.
Although this methodology has been developed and applied in a specific case, it can be applied in any type and phase of construction since the information is introduced in the model, organized, and modelled to be visualized and analyzed in the BI tool. With this methodology, all the stakeholders involved in the construction processes, such as the owner, the supervisors, the managers, and the companies, can capture, record, process, synthesize data, analyze what is happening in real-time and detect errors, incompatibilities, and omissions before they happen during the execution phase. This will permit solving time and resource constraints, the remote collaboration between different teams, rapid and automated decision-making on the worksite, better accountability and transparency, increased productivity, efficiency and environmental sustainability, reduced losses, optimization of the construction management, permanent processes control, and answer management questions. By joining the physical construction with the information through cyber physics systems, this methodology contributes to the effective Construction 4.0, in accordance with the challenges of Industry 4.0.
The developed methodology exemplifies how, using the integration of different methodologies and technologies, construction management can evolve towards Leagile management (joining LEAN and Agile techniques), responding efficiently to the changes that are integrated into the process, without errors or omissions, and can implement the most efficient resources and processes while also contributing towards the effective digitalization of the construction sector.
Future works include the simultaneous data visualization and the corresponding 3D representation in the model with Power BI and the extension of this methodology to all the activities of a building construction.


