Article

Highly Integrated Online Multi-Channel Electrochemical Impedance Spectroscopy Measurement Device for Fuel Cell Stack

School of Automotive Studies, Tongji University, Shanghai 201804, China
*
Author to whom correspondence should be addressed.
Energies 2022, 15(9), 3414; https://doi.org/10.3390/en15093414
Submission received: 5 April 2022 / Revised: 1 May 2022 / Accepted: 5 May 2022 / Published: 7 May 2022

Abstract

:
Electrochemical impedance spectroscopy (EIS) can provide information about the internal state of fuel cells, which makes EIS an important tool for fuel cell fault diagnosis. However, high cost, large volume, and poor scalability are limitations of existing EIS measurement equipment. In this study, a multi-channel online fuel cell EIS measurement device was designed. In this device, based on multi-phase interleaved Boost topology and average current control, an excitation source, which can output 1~500 Hz, 10 A sinusoidal excitation current was designed and verified by model simulation. Then, based on the quadrature vector digital lock-in amplifier (DLIA) algorithm, an impedance measuring module that can achieve precise online impedance measurement and calculation was designed. A prototype was then built for the experiment. According to the experiment test, the amplitude error of the excitation source is less than 1.8%, and the frequency error is less than 0.3%. Compared with the reference data, the impedance measured by the prototype has a modulus error of less than 3.5% and a phase angle error of less than 1.5°. Moreover, the waveform control and impedance extraction function of the EIS measurement device is implemented on an embedded controller, which can cut the price and reduce the volume.

1. Introduction

The current energy consumption structure based on traditional fossil fuels has caused serious environmental problems. It has become global consensus to develop clean energy and achieve carbon neutrality [1,2]. Among many clean energy sources, hydrogen as a good energy carrier, has the advantages of zero pollution, high efficiency, and a wide range of uses [3]. The fuel cell is a power generation device that directly converts the chemical energy in hydrogen into electrical energy through an electrochemical reaction. It is one of the best ways to utilize hydrogen energy at this stage, with the advantages of cleanliness and high efficiency [4,5]. Among various fuel cells, the proton exchange membrane fuel cell (PEMFC) is currently the most concerning type and is considered an ideal power source for vehicles [6,7].
However, poor reliability and durability are the main factors that make it difficult for PEMFC to be widely used [8]. Therefore, efficient monitoring and fault diagnosis technology is of great significance to the improvement of life and performance of fuel cells [9]. In recent years, fuel cell fault diagnosis methods based on online impedance measurement have begun to receive attention and research [10,11]. EIS data contain abundant internal information of fuel cell, which is helpful to analyze the state of fuel cells, adjusting working parameters and implementing control strategies [12,13,14,15]. Gallo et al. combined an EIS-based diagnostic algorithm and an online natural aging estimation algorithm to refine detection features extraction and predict the remaining useful life of a fuel cell stack during operation [16]. Janicka et al. used dynamic EIS to fit the equivalent circuit parameters of a fuel cell under different current loads and air humidity and then determined the optimal working conditions [17]. Pivac et al. used EIS and an equivalent circuit model to analyze the degradation effects on the functioning of the catalyst layer, and proposed to use the low-frequency intercept as an indicator of fuel cell degradation [18]. The principle of EIS is to obtain a complete impedance spectrum by applying voltage or current disturbances of different frequencies to the electrochemical system and measuring the response and the amplitude-frequency characteristics produced by the system.
When EIS measurement is performed, a weak excitation current or voltage perturbation must be applied to the fuel cell, so the excitation source must be designed [19]. Commonly used excitation source topologies include those based on DC/DC converters and those based on linear power supplies. Among them, the topology based on the linear power supply has the advantages of simple structure and easy control. However, the disadvantage of this topology is low efficiency and large heat generation, and it is rarely used in engineering [20,21,22]. On the other hand, DC/DC converter-based topologies are difficult to control and have inherent current ripple. Nonetheless, the advantages of high efficiency and flexible topologies make DC/DC converter-based schemes widely used [23,24,25,26,27,28].
At present, there are three commonly used fuel cell impedance measurement schemes: The first is to directly measure the amplitude and phase characteristics of the response signal to the excitation and calculate the impedance. The main drawback of this method is that there are many analog circuits, weak anti-interference ability, and poor reliability [29]. The second is based on various digital signal processing algorithms (including FFT, wavelet transform, etc.). This scheme has been widely used, but the execution of the signal processing algorithm has high requirements on the performance of the processor, so in most cases the upper computer is required to complete the data processing work [30,31,32,33,34]. The third option is to use an integrated chip with integrated EIS measurement capabilities. However, such chips are oriented toward low-power devices or biomedical fields and are not suitable for fuel cell systems [35].
In commercialized fuel cell systems, there are still few examples of applying impedance-based fault diagnosis techniques. The main reason is that most of the existing impedance measuring devices and excitation sources are scientific and experimental equipment designed for single, small-scale fuel cells [36]. Such devices are not only bulky, expensive, and poorly scalable, but also cannot meet the voltage and current level requirements of the fuel cell system. In addition, those impedance measurement systems that have been put into practical applications have the following problems: they can only measure impedance at a few fixed frequencies with insufficient accuracy, and the impedance measurement channel is limited [10]. Therefore, the development of an embedded online EIS measurement device with low cost, small size, high precision, and strong scalability is beneficial to the application of online impedance diagnosis of the fuel cell, improving the overall performance of the fuel cell and reducing the full-cycle cost of the system.
In this study, a multi-channel online EIS measurement device based on the embedded controller was designed. This device includes a fuel cell excitation source and an impedance measuring module. The excitation source is based on a multi-phase interleaved parallel Boost topology, which has the advantages of low current ripple, large excitation amplitude, and high conversion efficiency. Based on the orthogonal vector DLIA algorithm, the impedance measuring module realizes the function of online real-time impedance measurement and calculation on a low-power embedded platform. The device uses the galvanostatic method to measure EIS at frequencies from 1 to 500 Hz. Both excitation control and impedance calculation process are performed in the embedded controller, which has the advantages of small size and low cost. In addition, the impedance measuring module has eight impedance measurement channels and has good scalability, which can meet the needs of multi-channel measurement of high-power fuel cells. In Section 2, the topology design, parameter calculation, and simulation results of the fuel cell excitation source are introduced. In Section 3, the signal processing structure and impedance information extraction algorithm of the online impedance measuring module is introduced. Finally, the performance of the multi-channel online EIS measurement device is verified and evaluated on a fuel cell test bench.

2. Design of Excitation Source

2.1. Design Metrics for Excitation Source

The excitation source uses a DC/DC converter structure, and the overall structure is shown in Figure 1. The input of the converter is connected to the fuel cell, and the output is connected to the DC bus or the energy storage battery pack. The controller continuously adjusts the switching duty ratio of the power components, so that the output current tracks the ideal sine wave signal and realizes the excitation to the fuel cell.
When designing the excitation source, it is necessary to determine the rating power and voltage level of the fuel cell to be adapted for further parameter calculation. The fuel cell tested in this study has six cells, the active area is 227 cm2, the maximum current density is 1.6 A/cm2 (the cell voltage is 0.58 V at this time). The polarization curve of the fuel cell is shown in Figure 2.
To ensure that the fuel cell response is approximately linear during the impedance measurement, the amplitude and current ripple of the excitation waveform should be as small as possible under the premise of ensuring a sufficient signal-to-noise ratio. It is generally considered that the excitation amplitude should not exceed 5% of the DC of the fuel cell [37]. In addition, the excitation source is a unidirectional DC/DC converter, and the output current is not allowed to be reversed. Therefore, the forward offset current also must be included in the output waveform. Finally, the parameters of the excitation source are determined as shown in Table 1.

2.2. Design of Multi-Phase Interleaved Parallel Boost Topology

In a fuel cell system, the commonly used DC/DC converter topology is the Boost topology and its variants, which have the disadvantage of large current ripple. Excessive current ripple will not only reduce the signal-to-noise ratio of the impedance measurement but also reduce the life of the fuel cell. To suppress current ripple and reduce the volume and weight of filter inductors and capacitors, multi-phase interleaved parallel Boost topology is often used in engineering [38,39]. The schematic diagram of multi-phase interleaved parallel Boost topology is shown in Figure 3. The parallel structure distributes the current on each branch, reducing the stress on the power components. Through the phase control of the driving PWM waveform of each branch, the interleaving and cancellation of the current ripple are realized which effectively reduces the total current ripple while increasing the equivalent switching frequency [40]. However, the components required for the multi-phase interleaved parallel topology also increase according to the number of branches, which increases the complexity of the system, reduces the reliability, and increases the total loss. Considering factors such as efficiency, cost, and control difficulty, a four-phase interleaved parallel topology was used.

2.2.1. Determination of Switching Frequency

In the multi-phase interleaved parallel Boost topology there are several parameters to be determined including branch structure, switching frequency, and branch filter inductance value. The following parameters are selected or calculated below.
To improve efficiency, MOSFETs were used to replace high-side diodes. The improved circuit is shown in Figure 4. During operation, the gate voltage of the high-side MOSFET is synchronized with the phase of the rectified voltage, so it is called synchronous rectification. During the freewheeling phase, the high-side power component is turned on, and since the voltage drop across the MOSFET is much smaller than that of the power diode, conduction losses can be significantly reduced.
Then, the switching frequency of the power component needs to be determined. In the Boost topology the power components work in the hard switching mode, and the loss is mainly composed of conduction loss and switching loss. Low switching frequency reduces switching losses but requires larger filter inductors and capacitors to ensure stable output and low ripple. Increasing the switching frequency can improve the dynamic response capability of the system, but the requirements for the controller are increased. The conduction loss is calculated by Equation (1), where I is current, RDS(on) is the on-state resistance of the MOSFET, and D is the duty of the drive signal.
P c o n d = I 2 × R D S ( o n ) × D
Switching losses are estimated by Equations (2) and (3). Where Vout is the output voltage, and f is the switching frequency. Rdri(on) is the on-state resistance of the gate driver, which is 1.25 Ω; Vdri is the gate driving voltage, which is 18 V; Vgs(th) is the gate threshold voltage, which is 4.0 V; Qgd and Qgs are the amounts of charge from the gate to the drain and source, which are 4 nC and 17 nC.
P S W = I × V o u t 2 × f × ( t L H + t H L )
t L H = t H L = ( Q g d + Q g s 2 ) × R d r i ( o n ) V d r i V g s ( t h )
After considering factors such as control difficulty, power loss and the weight of the filter inductor, the switching frequency is set at 100 kHz. At this point, the total loss on each MOSFET is about 0.247 W, and no additional thermal design considerations are required.

2.2.2. Inductor Design

The excitation source is designed to operate in continuous current mode. For DC/DC converters, the filter inductor has an important impact on current ripple and current continuity. The value of the filter inductor is calculated as follows. First, the duty range of the PWM signal is calculated by Equation (4). The obtained duty range is 42.86~70.37%.
D = V o u t V i n V o u t
The suppression effect of the interleaved parallel Boost topology on the input current ripple is related to the duty and the number of interleaved phases [41]. When evaluating the ripple current, the inductor current ripple ratio K(D) is introduced, and the definition of K(D) is shown in Equation (5). Wherein Δii is the total current ripple after each phase current ripple is superimposed, ΔiL is the single-phase current ripple, and D is the duty of the PWM signal.
K ( D ) = Δ i i Δ i L
For the four-phase interleaved parallel Boost topology, the expression of ripple ratio K(D) is segmented and analyzed by the duty. As shown in Figure 5, it is a diagram showing the relationship between the switching states of the low side power component of each phase and the current waveform under different duty ranges in a four-phase interleaved parallel topology.
In one switching cycle, the current change in the inductor can be considered linear and satisfy Equation (6). Where VL is the inductor voltage, L is the inductor value, and dIL/dt is the inductor current change rate. Assuming that the switching period is short enough, dIL can be replaced by the inductor ripple amplitude ΔiL, and dt can be replaced by the inductor current rise time tup.
V L = L · d I L d t = L · Δ i L t u p
where the duty D is greater than 0 and less than 25%, as shown in Figure 5a. During the rising phase, one of the low side power components is turned on and the remaining three are turned off. For the branch in which the low side power component is turned on, the inductor voltage VL is equal to the input voltage Vin, and the inductor current increases. For the other branch, the inductor voltage VL is equal to VinVout, and the inductor current drops, where Vout is the output voltage. At this time, the total current ripple ΔiLo is the sum of the ripple current of each branch inductor ΔiLx, as shown in Equation (7).
Δ i L o = x = 0 4 Δ i L x = t u p · ( V i n L 1 + V i n V o u t L 2 + V i n V o u t L 3 + V i n V o u t L 4 )
where the current rise time tup is equal to the total current ripple period T0 multiplied by the equivalent duty D′. D is the switching duty of the power component, T is the switching period of the power component, and T0 is the equivalent total switching period, as shown in Equations (8) and (9).
t u p = T 0 · D
D = T 0 ( 1 D ) · T T 0 = T 4 ( 1 D ) · T T 4 = 4 D 3
Equation (9) is substituted into Equation (7). The multi-phase Boost topology is known to have the following properties: L1 = L2 = L3 = L4 = L and Vin = (1 − D) · Vout. Equation (10) is simplified and obtained, where f is the switching frequency of the power component.
Δ i L o = D · T · V i n L · 1 4 D 1 D = D · V i n L · f · 1 4 D 1 D
For the single-phase Boost topology, the calculation of the inductor current ripple is shown in Equation (11).
Δ I L = D · ( 1 D ) · V o u t L · f = D · V i n L · f
Equation (10) is divided with Equation (11) to obtain the expression of the K(D) when the switching duty D is greater than 0 and less than 25%, as shown in Equation (12).
K ( D ) = 1 4 D 1 D   ( 0 D < 1 4 )
Accordingly, the equations in the other three cases can be calculated and simplified to obtain the full expression of K(D). The ripple ratio K(D) is multiplied by Equation (11) to obtain the expression of inductor current ripple for the four-phase interleaved parallel Boost topology. As shown in Equation (13), the required minimum inductance value can be calculated from the input voltage, ripple amplitude, and switching frequency.
Δ I 0 = K ( D ) · Δ I L = D · ( 1 4 D ) 1 D · V i n L · f D 1 4 ( 4 D 1 ) ( 1 2 D ) 2 ( 1 D ) · V i n L · f 1 4 < D 1 2 ( 2 D 1 ) ( 3 4 D ) 2 ( 1 D ) · V i n L · f 1 2 < D 3 4 ( 4 D 3 ) · V i n L · f D > 3 4
According to the calculation results and given parameters above, when the input voltage is 4.0 V and the output voltage is 13.5 V, the corresponding maximum duty is 70.37%; when the input voltage is 6.0 V and the output voltage is 10.5 V, the corresponding minimum duty is 42.86%. The boundary conditions are substituted into Equation (13) to obtain the minimum value of the inductance as 53.56 μH.

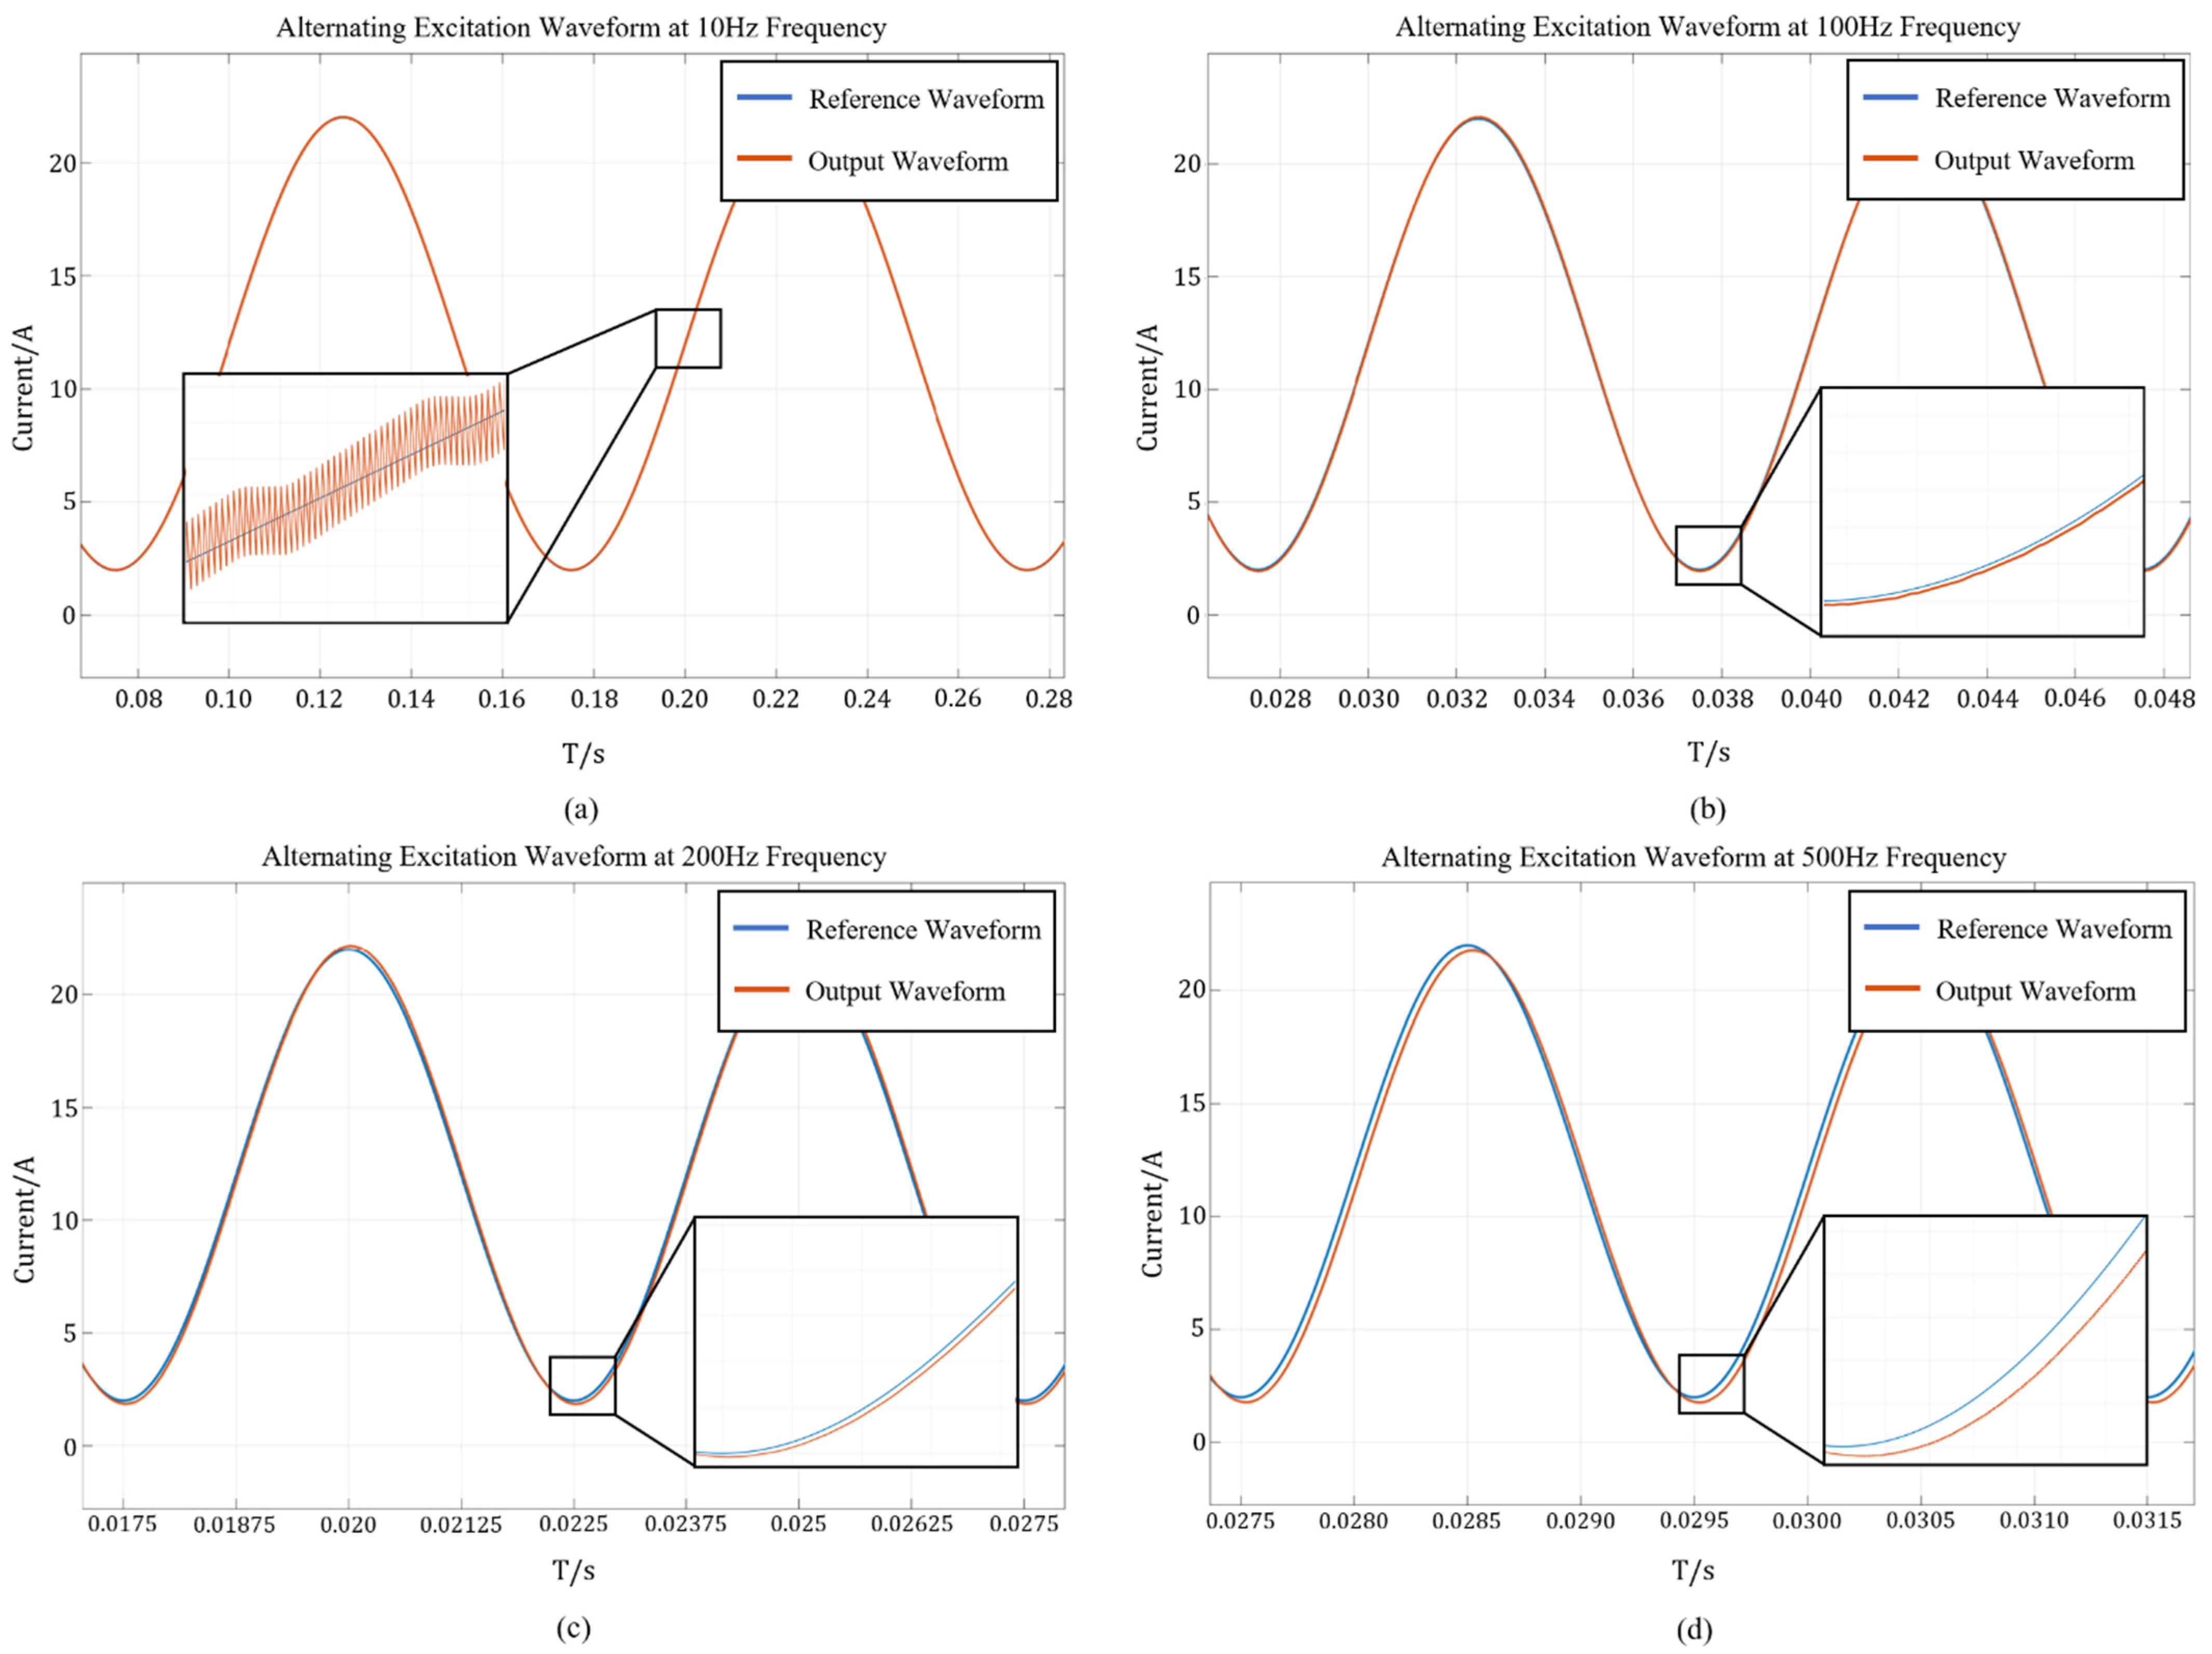
2.3. Excitation Source Simulation Model and Simulation Results

To verify the output capability and waveform quality of the designed multi-phase interleaved parallel Boost topology and to adjust the excitation source control strategy and control parameters, the SimPowerSystem toolbox of MATLAB Simulink was used to build a simulation model. The simulation model of the four-phase interleaved parallel Boost circuit is shown in Figure 6. The parameters of the fuel cell model used the data of the adapted stack. The output terminal was connected to a lead-acid battery model, the rated voltage of lead-acid battery is 12 V, the capacity is 200 Ah, the initial SoC (State of Charge) is 50%, and the remaining parameters were automatically generated by the built-in model. The output sinusoidal excitation amplitude was set to 10 A and the offset current to 12 A.
As shown in Figure 7, the control model uses dual PID loops to implement the average current control logic. The actual excitation amplitude and DC offset of each excitation cycle are used as the feedback value of the outer loop. The outer loop calculates the target current value according to the error between the feedback value and the reference waveform. The target current value and the current sensor feedback value were used as the input parameters of the inner loop PID controller. The inner loop control frequency is 50 kHz, which directly controls the duty of the PWM signal to adjust the output current amplitude. Since at low excitation frequencies the control period is much longer and the inner loop control can achieve good results, the outer loop is effective only when the excitation frequency is greater than 400 Hz.
First, the filter inductor was optimized through simulation. Considering the manufacturing error and the attenuation of the inductance under high current, it was necessary to increase the inductance value appropriately to increase the margin and improve the performance under severe working conditions. However, too large inductance value leads to instability, increased losses, and a significant increase in cost. The details of the current ripple are shown in Figure 8 at the excitation frequency of 500 Hz, when the inductors are 54 μH, 120 μH, and 180 μH. The total current ripple frequency was 400 kHz, as expected. It can be seen from the simulation results that the inductor ripple amplitude can be reduced from 68 mA to 30 mA with a 120 μH inductor. However, increasing the inductance to 180 μH can only further reduce the ripple amplitude of 11 mA, but the DC loss and cost of the inductor all increased significantly. The simulation proves that the 120 μH inductor achieves a good balance between ripple suppression and economy. Therefore, it was determined to use a 120 μH inductor in the prototype.
Then, the output performance of the circuit model was analyzed. As shown in Figure 9, the excitation waveform and partial magnification under the excitation frequency of 10 Hz, 100 Hz, 200 Hz, and 500 Hz were observed. The red curve is the output waveform, and the blue curve is the reference waveform. At each frequency, the output current waveform is a sine wave, and the distortion is small. In terms of waveform tracking ability, the lower the excitation frequency, the more accurate the excitation source can track the reference waveform.
The error analysis of the output waveform characteristics relative to the set value at each frequency is shown in Table 2. The excitation current amplitude error did not exceed 222 mA (1.85%), the offset current amplitude error did not exceed 154 mA (1.54%), and the phase error did not exceed 3.60° (1.00%, at the excitation frequency of 500 Hz). It was proven that the four-phase interleaved parallel Boost topology and the dual-loop PID control model have good waveform tracking and output capabilities which meet the design requirements.

3. Design of Impedance Measuring Module

3.1. Signal Acquisition and Processing Circuit

Figure 10 shows the overall structure of the designed impedance measuring module. It has eight voltage measuring channels and one current measuring channel. During the impedance measurement process, the voltage and current signals are first filtered by the low-pass filter, and the protection circuit realizes the suppression and absorption of transient voltage spikes. The voltage signal of a single cell is connected to the differential amplifier to remove the common-mode voltage signal. The amplifier output is the synthesis of the fuel cell voltage and the response voltage to the excitation. Subsequently, the voltage signal is gated by the multiplexer and enters the post-stage circuit for processing. The input signal of the current sensor also goes through the pre-processing of the differential amplifier. The gated voltage and current signals are then conditioned and buffered by the instrumentation amplifier, at which stage the signal amplitude can be adjusted. Finally, the high-precision ADC samples the two signals continuously and synchronously. The MCU is responsible for controlling the ADC, reading the conversion data, and gating the required voltage signal.
The power supply of the module is an isolated DC/DC converter to isolate the ground plane from the outside. The ground plane of the measuring module is only connected to the lowest potential point of the cells to be measured. The highest common-mode voltage it needs to withstand is the sum of the voltages of eight cells. The measuring module can be used to measure the impedance of a single fuel cell anywhere in the stack. Multiple modules can also be used in parallel for EIS measurements on large stacks.

3.2. Impedance Information Extraction Method

Signal sampling acquires time-domain data, while impedance analysis requires frequency-domain information of the response signal. In engineering, the commonly used method is Fast Fourier Transform (FFT). However, there are the following problems in the implementation of FFT in the embedded controller: First, the FFT calculation can only be performed after N data points are completely collected. A large amount of memory is required to store the sampled data. Second, the FFT calculation takes a long time and occupies a lot of computing resources of the controller. Finally, the result of FFT is the signal amplitude and phase evenly distributed at N/2 frequency points in the frequency range of 0~fs/2 (fs is the sampling frequency). Due to the limited number of excitation frequencies in a single measurement, most of the FFT calculation results will be discarded, which is a waste of computing resources.
In this study, the impedance calculation used a quadrature vector digital lock-in amplifier (DLIA), which is based on the idea of cross-correlation detection [42]. The principle of cross-correlation detection is: if the frequency of the signal to be measured is f0, a reference signal with the same frequency and no noise can be used for cross-correlation operation with the signal to be measured. The input signal expression is x(t) = x1(t) + n(t), where x1(t) is the signal to be measured and n(t) is the noise signal. If the reference signal is y(t), assuming that the noise signal is random and independent of the reference signal, the cross-correlation calculation process is shown as Equation (14).
R x y ( τ ) = lim T 1 2 T T T x ( t ) y ( t τ ) d t = lim T [ 1 2 T T T x 1 ( t ) y ( t τ ) d t + 1 2 T T T n ( t ) y ( t τ ) d t ] = R x 1 y ( τ ) + R n y ( τ )
where y(t) is related to the signal to be measured x1(t) but not related to the noise signal n(t), there is Rny(τ) = 0, that is, Rxy(τ) = Rx1y(τ) + Rny(τ) = Rx1y(τ). After cross-correlation detection, the noise is removed, and the signal-to-noise ratio is improved. Because the output signal amplitude is related to the phase difference between the signal under test and the reference signal, the process is called Phase Sensitive Detector (PSD).
It is known that the excitation signal is a sine wave, and the response signal expression is x(t) = Uscos(2πf0t) + n(t), where f0 is the excitation frequency. The in-phase reference signal is yc(t) = Uycos(2πf0 + φ). Since the phase angle cannot be obtained only by using the in-phase reference signal, a quadrature reference signal ys(t) = Uysin(2πf0 + φ) is added to form a quadrature vector DLIA.
The discrete sequence is obtained by sampling the input signal, the sampling frequency is fs = Nf0, and N is a positive integer. If the signal is sampled for p cycles, the total number of sampling points is M = N × p. Finally, the discrete sequences of the signal to be measured, the in-phase reference signal, and the quadrature reference signal are obtained as shown in Equation (15).
x 1 [ k ] = U s cos [ 2 π k N ] ;   y c [ k ] = U y cos [ 2 π k N + φ ] ;   y s [ k ] = U y sin [ 2 π k N + φ ]
The cross-correlation calculation process is as Equations (16) and (17):
R x y c = 1 M k = 0 M 1 x [ k ] y c [ k ] = 1 M k = 0 M 1 x 1 [ k ] y c [ k ] = U s U y · cos ( φ ) 2
R x y s = 1 M k = 0 M 1 x [ k ] y s [ k ] = 1 M k = 0 M 1 x 1 [ k ] y s [ k ] = U s U y · sin ( φ ) 2
Combining Equations (16) and (17), the amplitude and phase angle of the response signal with frequency f0 can be obtained. The final impedance calculation process is shown in Figure 11. The amplitude and phase of the response voltage signal and the excitation current signal were calculated using two DLIAs, respectively. The ratio of the amplitude of the voltage signal to the amplitude of the current signal is the modulus of the impedance. The phase difference between the two signals is the phase angle of the impedance. Then through the trigonometric function calculation, the real and imaginary parts of the impedance can be obtained.
The DLIA can update the values of Rxyc and Rxys through the computing resources that are idle between two samplings. Reference sequences can be pre-generated and stored in ROM to save memory. In the test, sampling at a speed of 16 kSPS, a total of 2048 data of float data are collected and processed. When calculated on a microcontroller (running at 200 MHz), the FFT algorithm requires 33 kB of memory and consumes 2.4 ms to perform the calculation. Correspondingly, since it is not necessary to store all the sampled data, the DLIA algorithm only takes up less than 1 kB of memory, and the calculation process is performed synchronously with the sampling process. In this way, the signal amplitude and phase results can be output immediately after each sampling cycle. The introduction of DLIA enables the impedance information extraction process to be implemented in a low-cost embedded controller, reducing the size and cost of the module.

4. Experiments and Results

After completing the design of the online fuel cell EIS measurement device, a prototype was fabricated for verification. The prototype uses low-cost embedded controllers, the size of the excitation source is 22 cm × 18 cm × 8 cm, and the size of the impedance measuring module is 17 cm × 13 cm × 4 cm. Experiments were performed on a fuel cell test bench and reference impedance data were collected using a commercial data acquisition system. The main steps of the experiment include the accuracy verification of the data acquisition system based on a standard shunt, the excitation source output experiment, and the impedance measurement experiment.

4.1. Fuel Cell Test Bench

The fuel cell test bench includes programmable DC electronic loads, data acquisition systems, and fuel cell control systems. The fuel cell parameters used for testing are introduced in Section 2. The maximum input power of the DC electronic load is 1.2 kW, and the maximum input current is 240 A. The data acquisition system has four acquisition channels and can upload the acquired data to the host computer for impedance calculation. The impedance measured by the data acquisition system is used as reference data to evaluate the measurement accuracy of the prototype. Due to the limited number of sampling channels, one sampling channel is used to collect current sensor signals. For the remaining three sampling channels, each channel samples the voltage signals of two adjacent cells. The fuel cell control system is used to provide the gas and coolant required by the fuel cell stack, and to adjust working parameters such as temperature and humidity. The total current measurement uses a LEM HTA-200S Hall current sensor with a range of 200 A. During the test, the excitation source works in parallel with the electronic load and charges the 12 V lead-acid battery. The impedance measuring module performs impedance measurement on six cells. The schematic diagram of the test platform is shown in Figure 12.
The operating parameters of the fuel cell are shown in Table 3. At this time, the excitation source output was set to a sinusoidal excitation current of 6 A and an offset current of 8 A. The input current of the DC electronic load was set to 151 A. When measuring, the fuel cell ran continuously for more than 15 min under the given operating conditions. After the voltage of each cell was observed to stabilize, excitation was applied to the fuel cell by the excitation source. The data acquisition system performs impedance measurement first, and then the impedance measuring module performs the measurement. The impedance at each frequency point as measured three times and the results were averaged as the final data. After completing the impedance measurement at one frequency point, the fuel cell was run at a steady current (159 A) under the preset parameters for 5 min, and then the impedance measurement was performed at the next frequency. This cycle was repeated until the impedance data acquisition of all frequency points was completed.

4.2. Data Acquisition System Measurement Accuracy Verification

In previous studies, the accuracy of this data acquisition system has been verified [13]. In the frequency range of 0.5~1000 Hz, the data acquisition system has good accuracy and stability for the measurement results of the impedance modulus and phase angle of the sample shunt. The error of impedance modulus did not exceed ±0.75%. The error of phase angle did not exceed ±1.5%. The test results proved that the measurement results of the data acquisition system can be used as reference data.

4.3. Prototype Testing and Results

In the experiment, the output capability of the excitation source was verified first. The impedance was then measured by an impedance measuring module. Finally, the measurement results were summarized and discussed.

4.3.1. Test Results of Excitation Source

A CYBERTEK CP8030H Hall current sensor probe was used to observe the waveform of excitation current. The sensor has a range of ±30 A and measurement accuracy of 1%. The sensor signal was fed into a PicoScope 5444B oscilloscope. The waveforms of excitation currents at 1 Hz, 10 Hz, 100 Hz, and 500 Hz were selected for analysis, the excitation amplitude was 6 A, and the offset current was 8 A. Figure 13 shows the waveforms and partial magnifications. It can be seen from the figure that the output current waveform was a sine wave. As can be seen from the enlarged image, except for the inherent current ripple, the current waveform has no obvious distortion, glitches, or oscillations.
Parameters such as excitation current amplitude, ripple, and frequency were measured. The parameters of the excitation waveform at each frequency are shown in Table 4. The error of the excitation waveform parameter relative to the set value is shown in Table 5. The data show that the excitation amplitude error did not exceed 1.8%, the frequency error did not exceed 0.3%, and the offset current error did not exceed 3.5%. The result proves that the excitation source has high output precision. The maximum current ripple amplitude was 105.7 mA, which is slightly larger than the design specification, which may be related to the circuit design and the output signal glitch of the sensor. Experiments show that the output of the prototype has high precision and good waveform characteristics. Although in some working conditions, the current ripple was slightly larger than the design value, it can meet the requirements for impedance measurement.

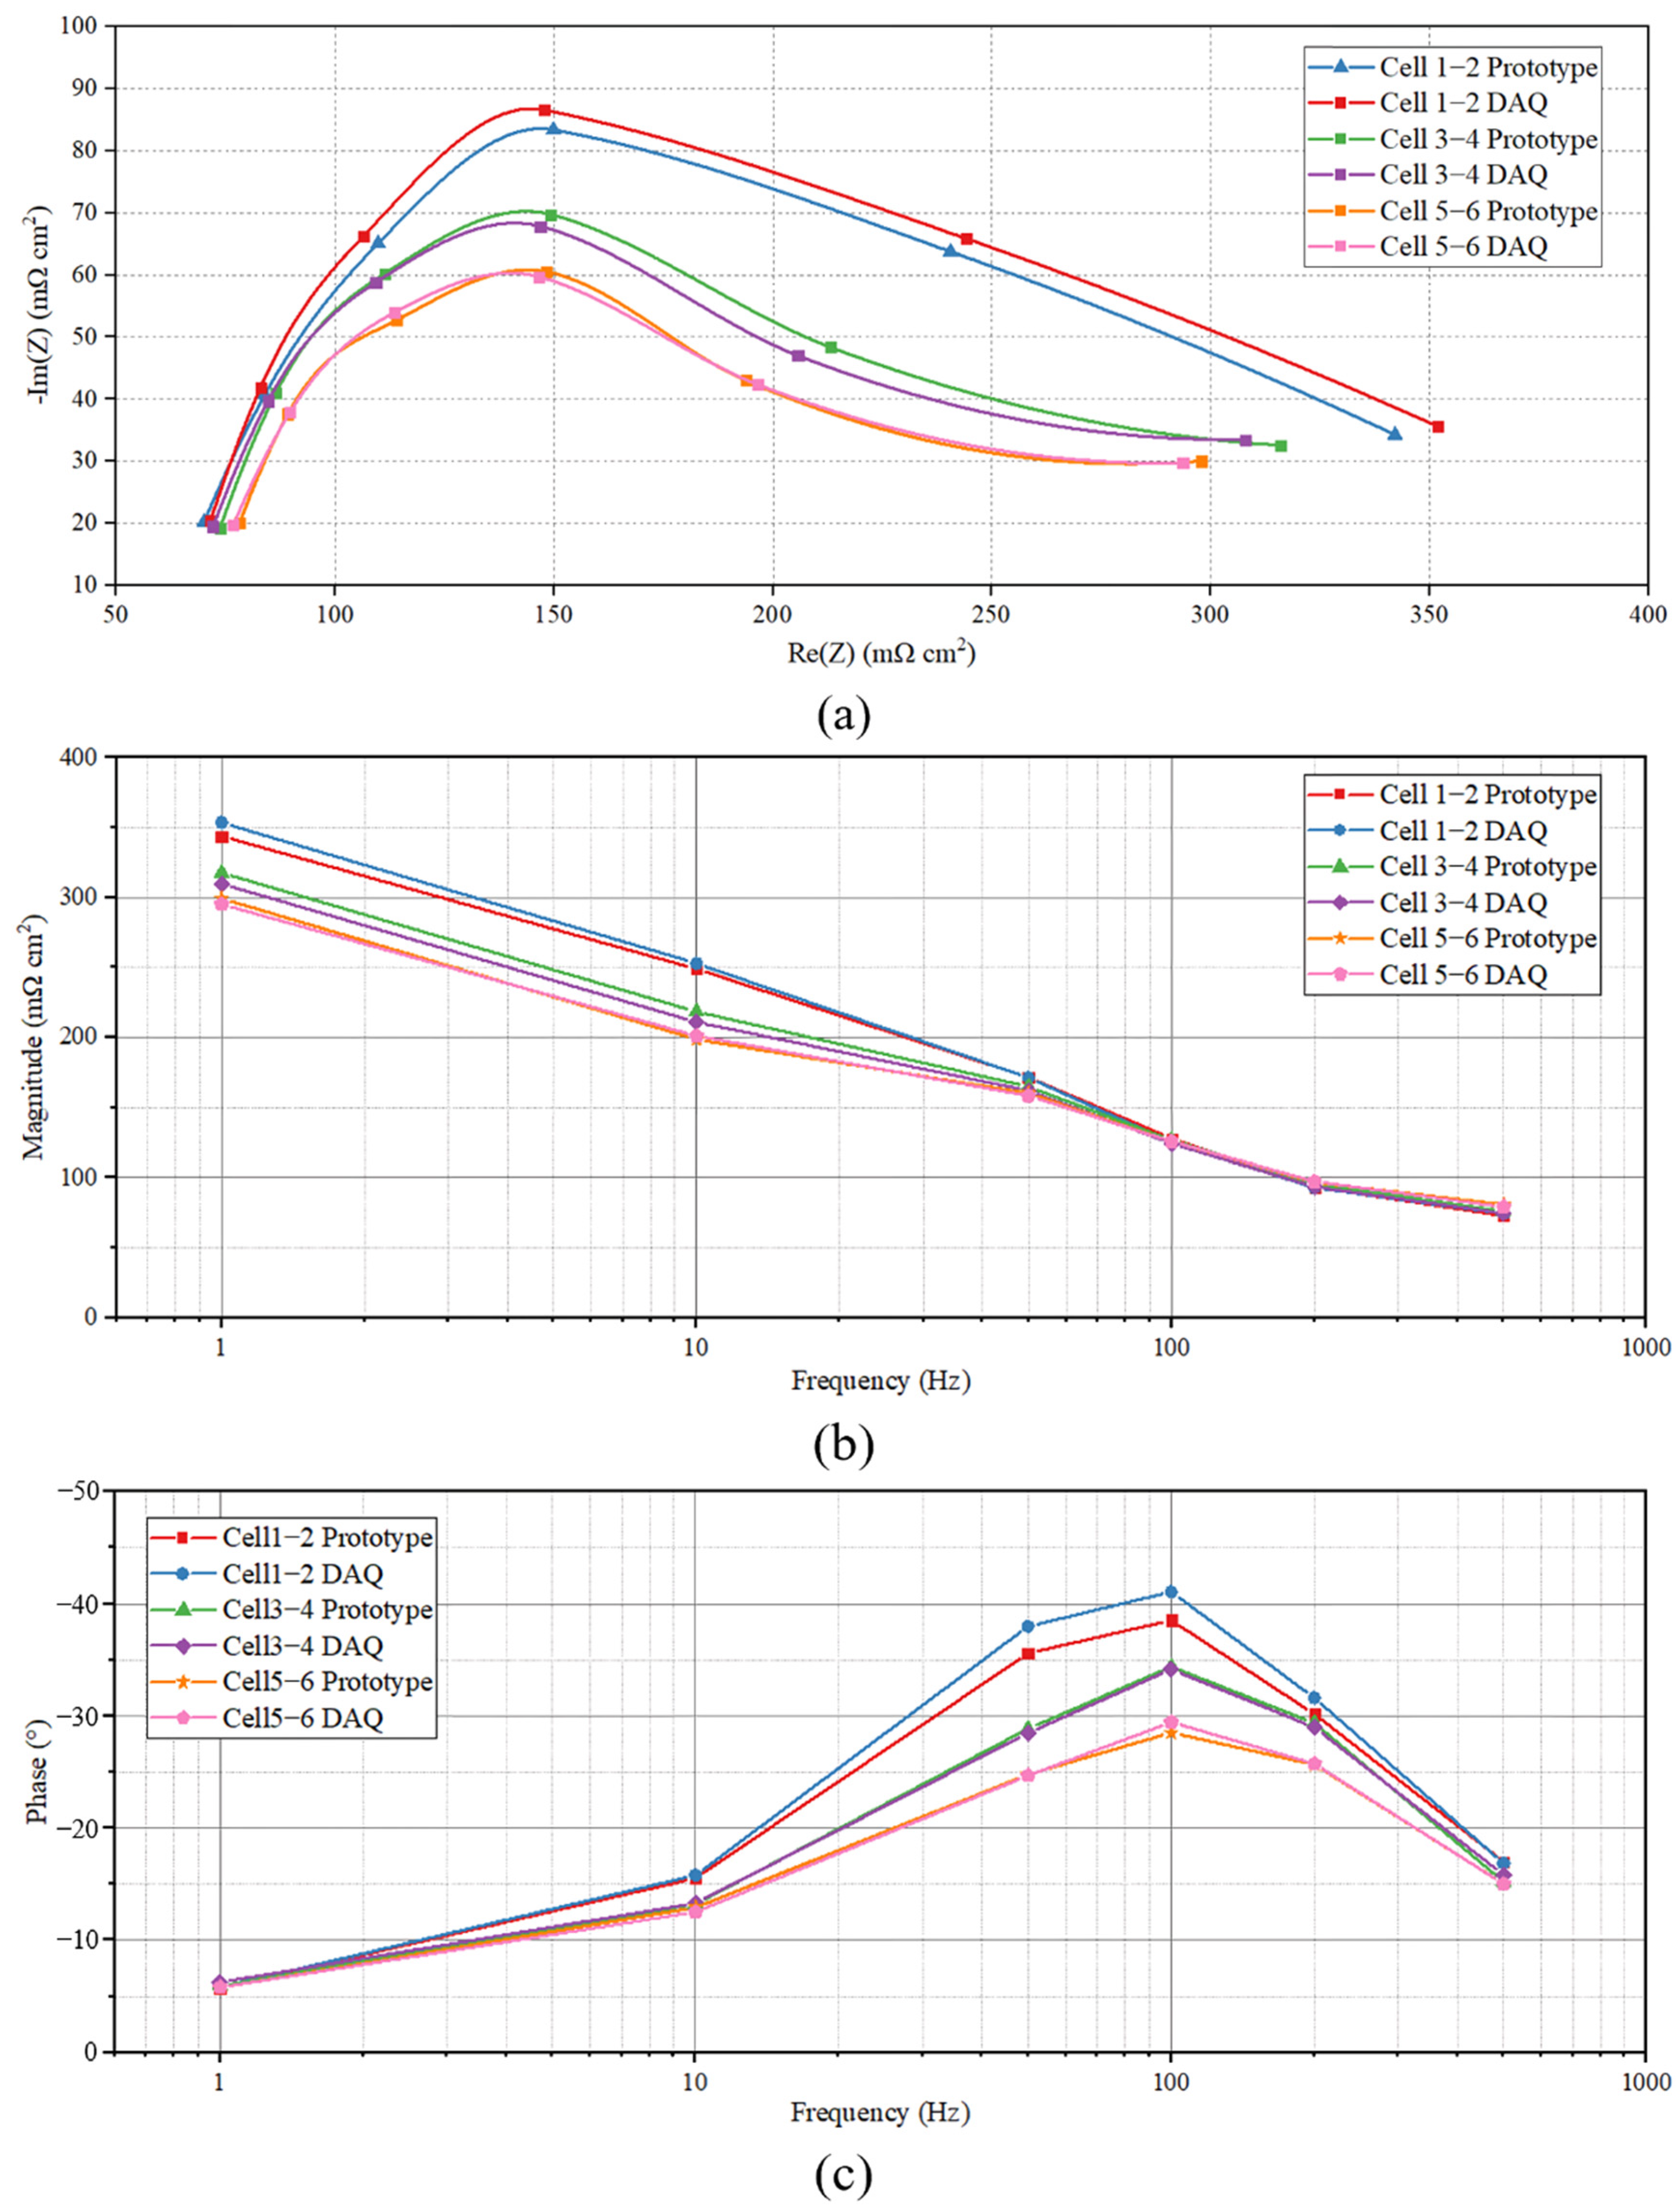
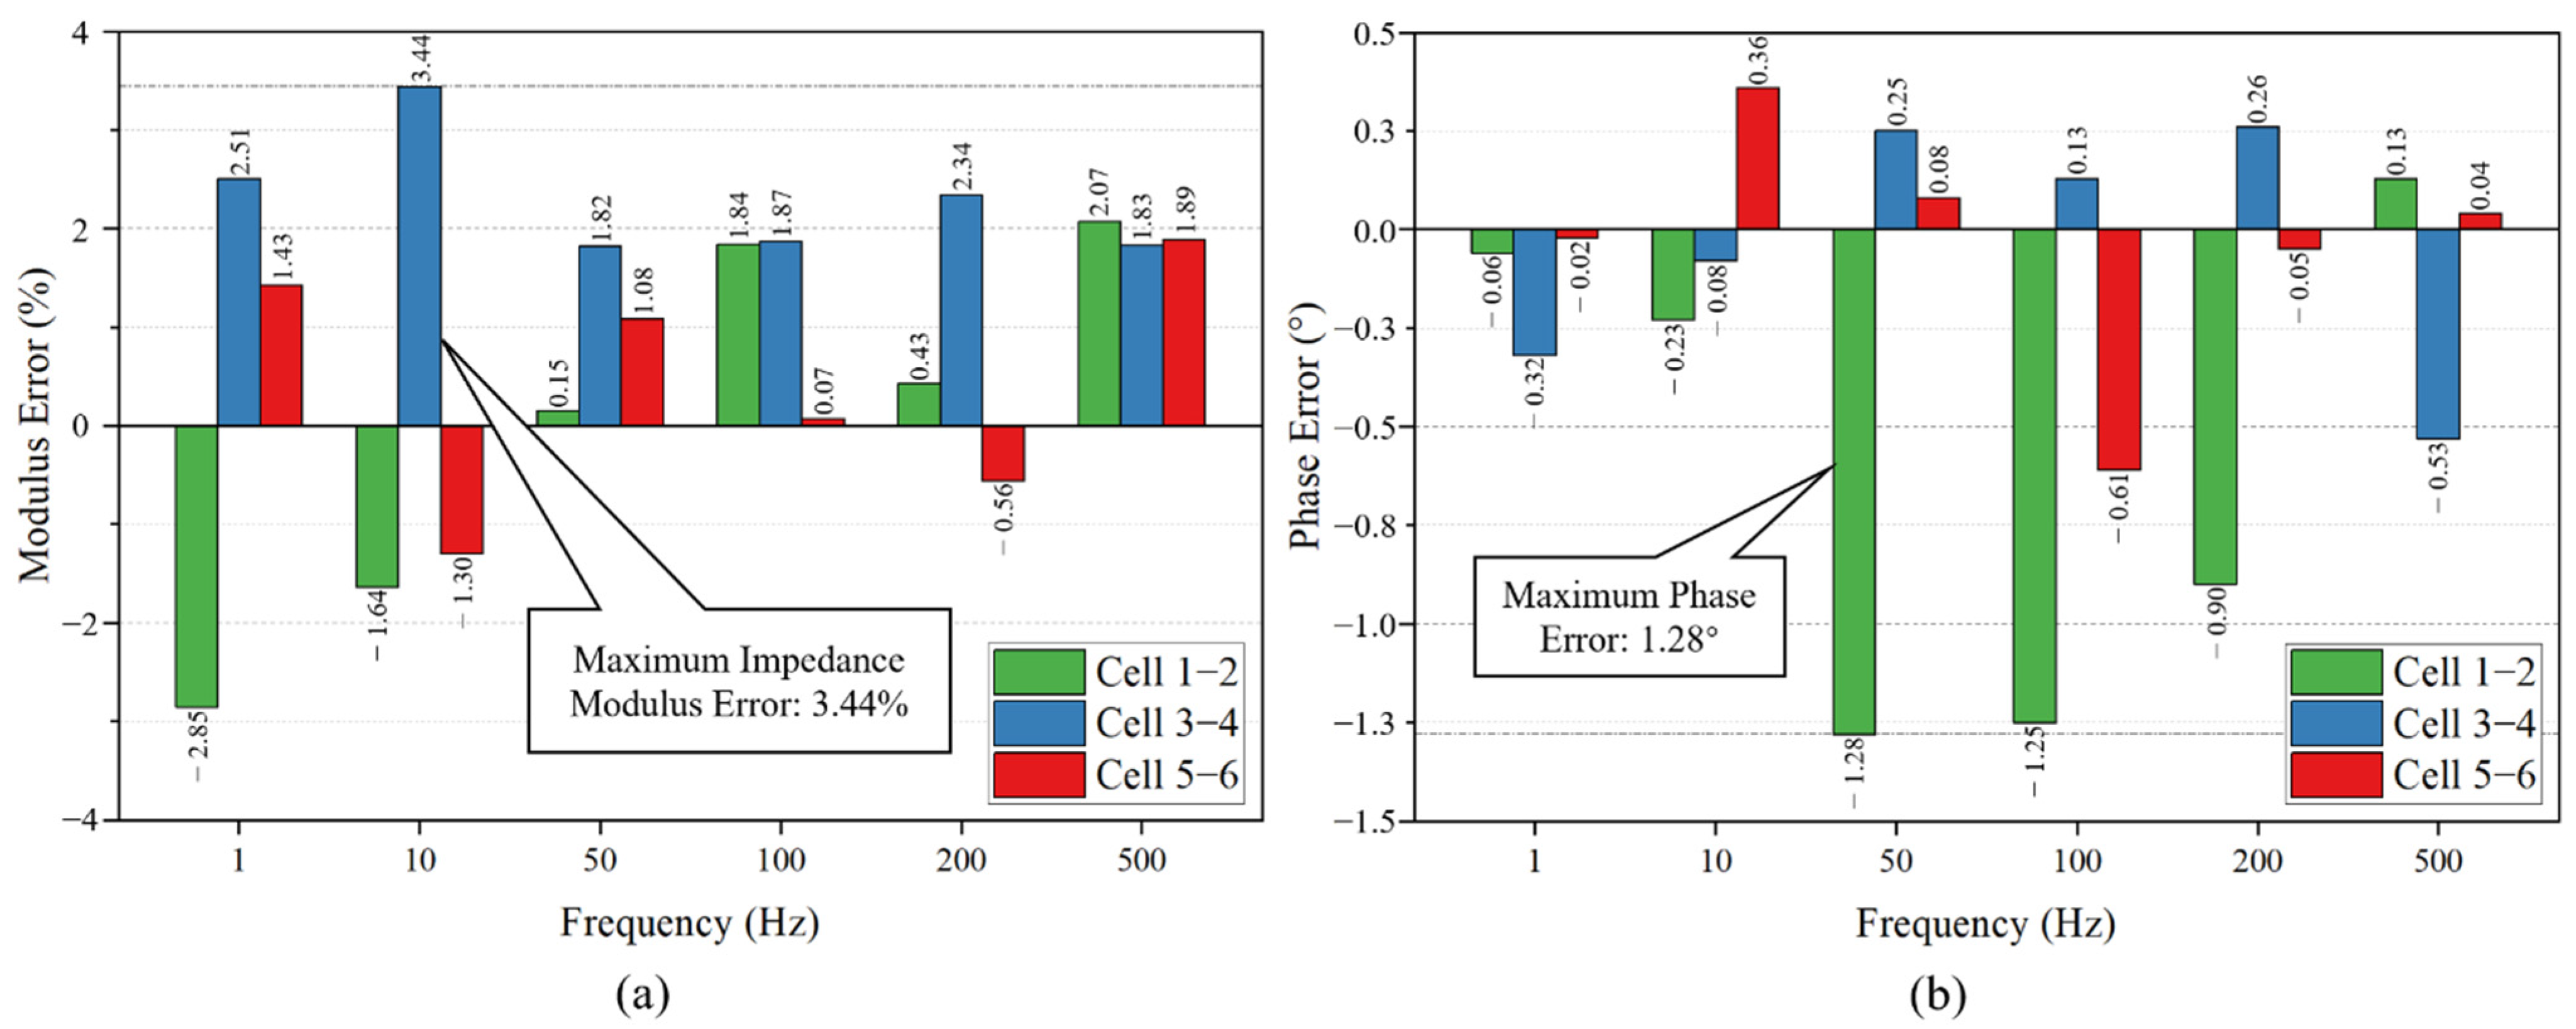
4.3.2. Test Results of Impedance Measuring Module

The impedance data measured by the prototype and data acquisition system are shown in Figure 14. The fuel cell impedance at 1 Hz, 10 Hz, 50 Hz, 100 Hz, 200 Hz, and 500 Hz was measured in the experiments. Depending on the excitation frequency, the sampling rate is adjustable from 8 kSPS (500 Hz) to 32 SPS (1 Hz). For the convenience of comparison and expression, the impedance per unit area (mΩ/cm2) was used as the unit.
Figure 15 is a Nyquist plot and a Bode plot based on impedance data measured by the prototype and data acquisition system. It can be seen from Figure 15 that the Nyquist plots and frequency response characteristic curves of each fuel cell measured by the prototype are close to the measurement results of the data acquisition system. In addition, there are also differences in the frequency response characteristics of fuel cells at different positions. This phenomenon may be caused by the uneven distribution of parameters such as liquid water, reactive gases, and temperature inside the fuel cell. Through the analysis of EIS data, the state identification and fault diagnosis of the fuel cell can be realized.
For the convenience of comparison, the impedance data measured by the prototype are added in pairs and compared with the reference data. The error between the two sets of data is shown in Figure 16. The error between the impedance modulus measured by the prototype and the reference data is less than 3.5%, and the phase error is less than 1.5°, which can meet the needs of embedded online impedance measurement. When the excitation frequency is 500 Hz, the impedance modulus is small and the response voltage is weak, which requires high sensitivity and precision of the impedance measuring module. With the decrease in the excitation frequency, the impedance modulus value and the response amplitude gradually increase, which is beneficial to improving the measurement signal-to-noise ratio. However, due to the low frequency of the signal, the sampling period is correspondingly prolonged, and a longer sampling time will introduce more random errors from the outside, resulting in greater uncertainty in the measurement results of low-frequency impedance. Overall, the prototype has good impedance measurement accuracy, which can meet the needs of online embedded fuel cell impedance spectroscopy measurement.

5. Conclusions

Durability and reliability are the main technical difficulties that restrict the wide application of fuel cells. Impedance-based fault diagnosis technology is an effective method to solve this problem. In this study, according to the problems of existing fuel cell impedance measurement equipment, a low-cost, embedded excitation source and online impedance measuring module are developed for a fuel cell stack. The excitation performance and measurement accuracy were tested on the fuel cell test platform.
The main conclusions of this paper are as follows:
(1)
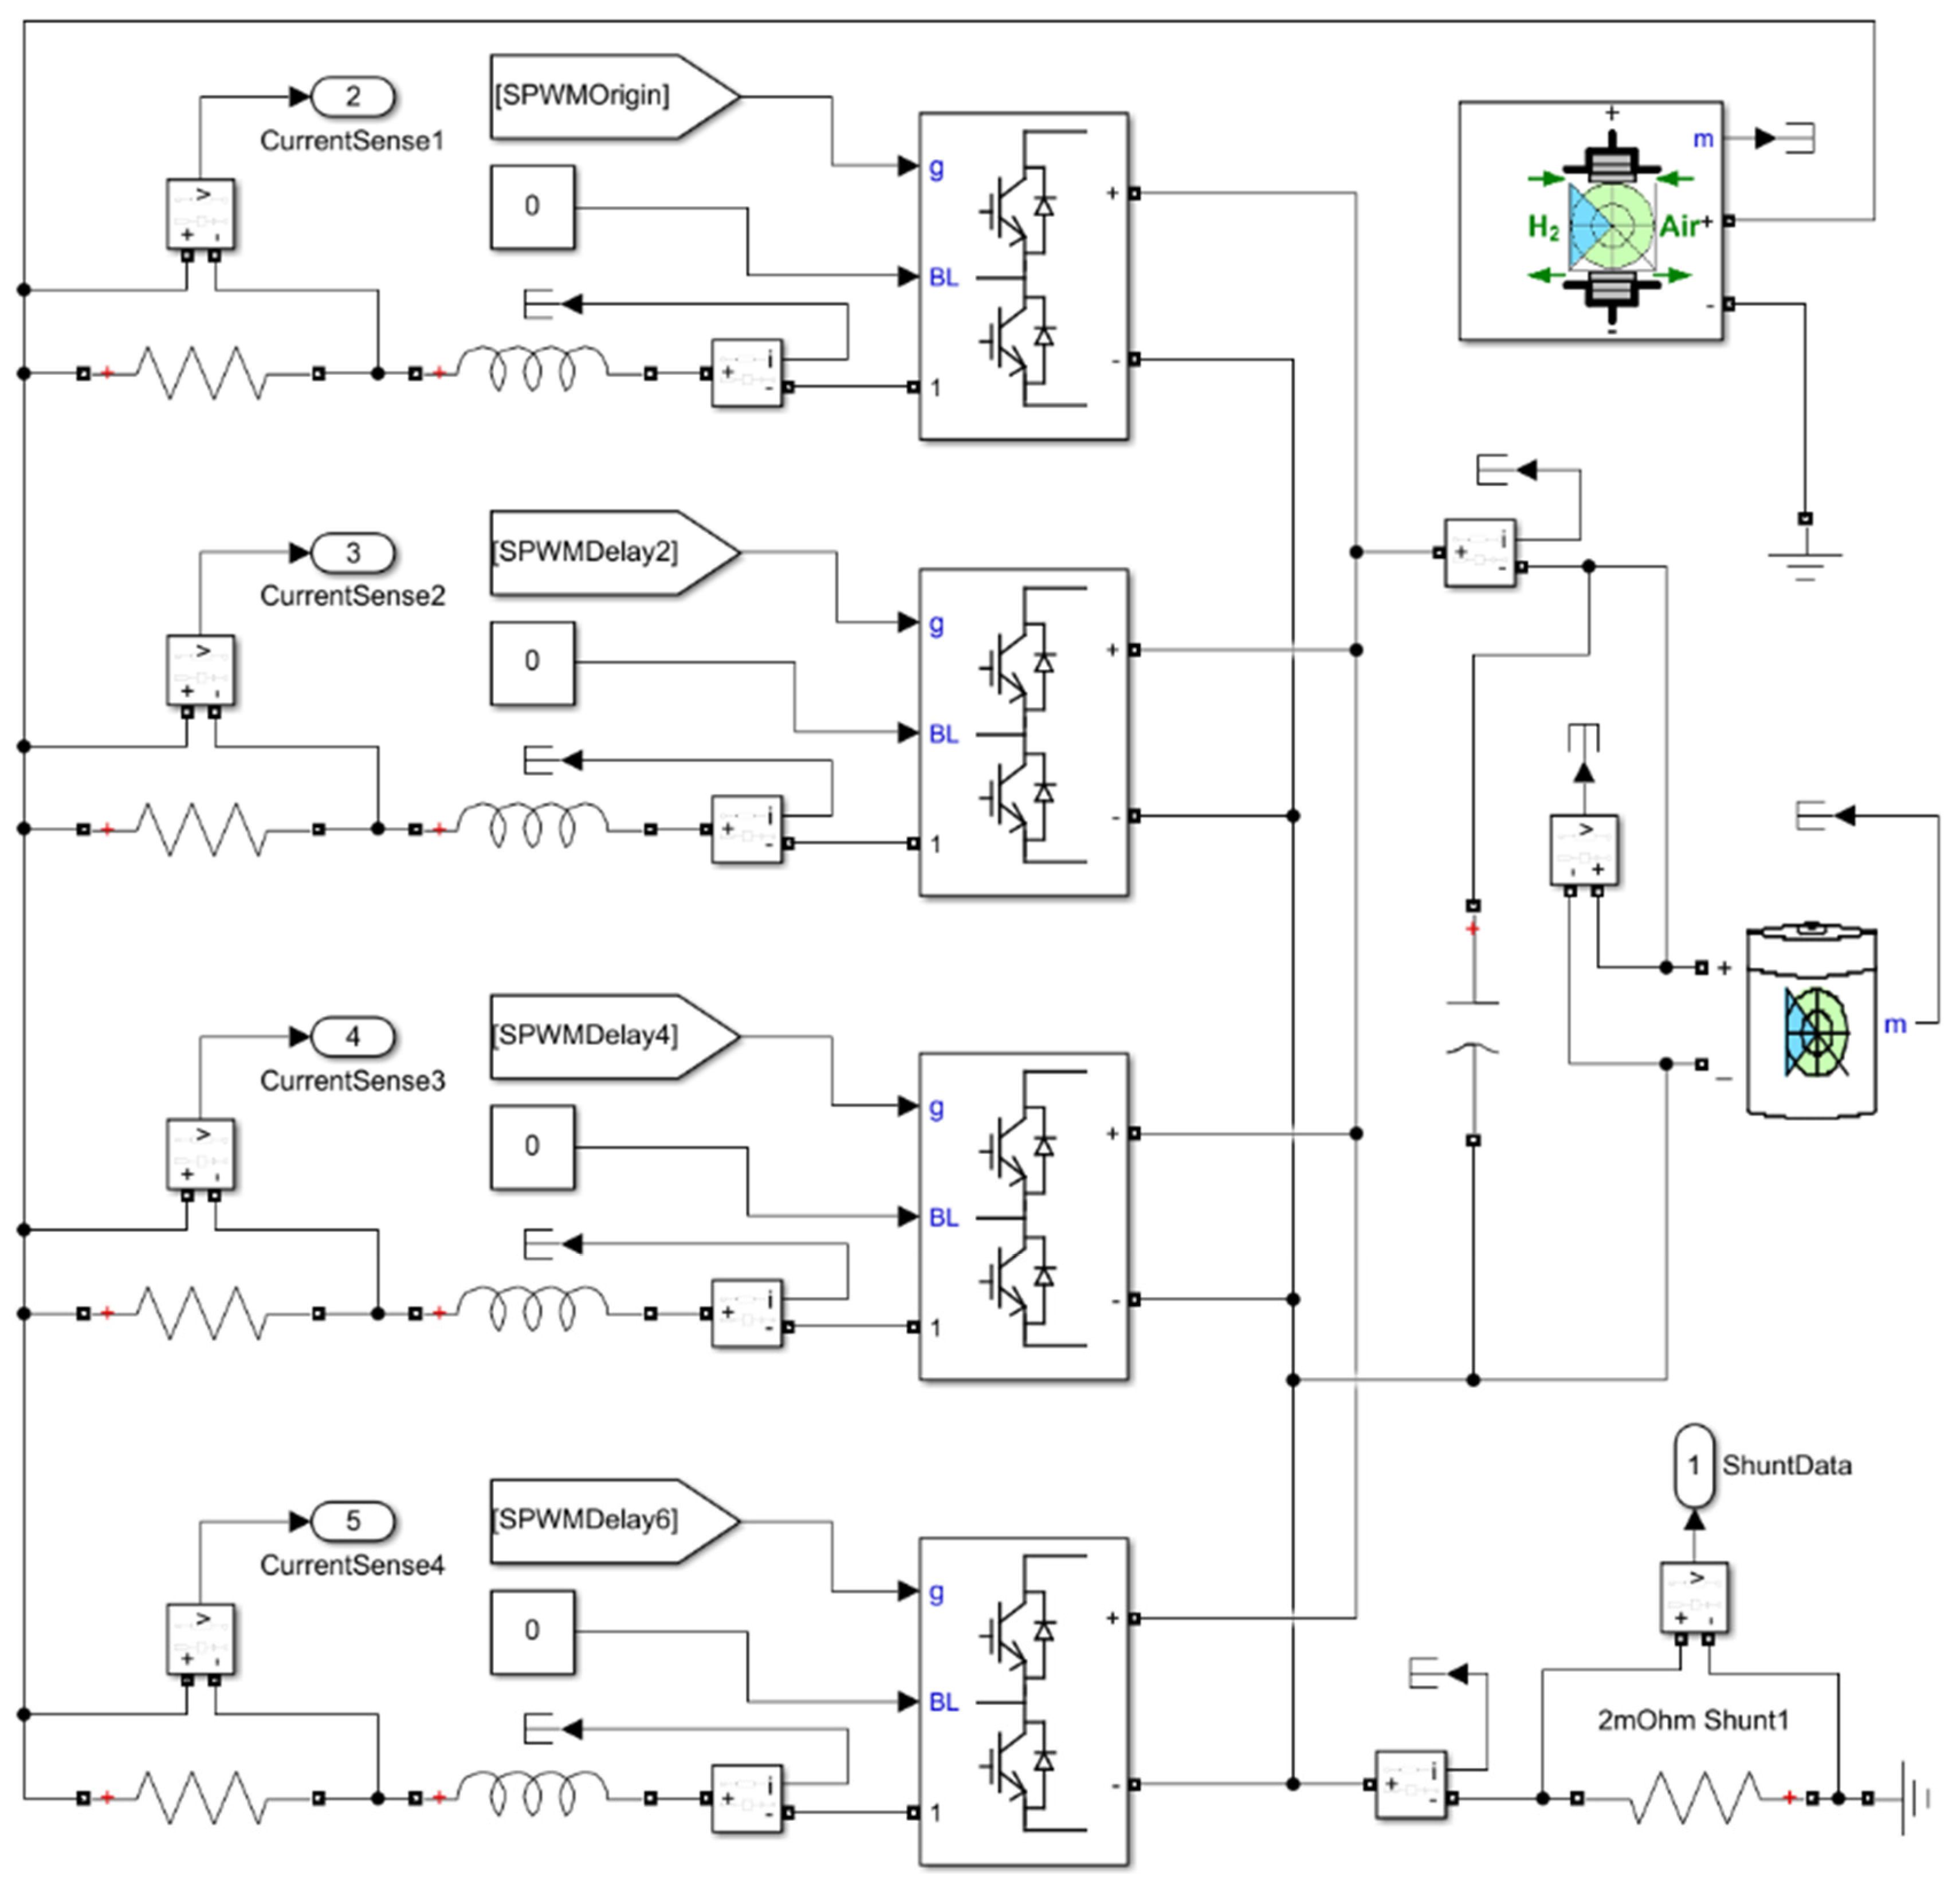
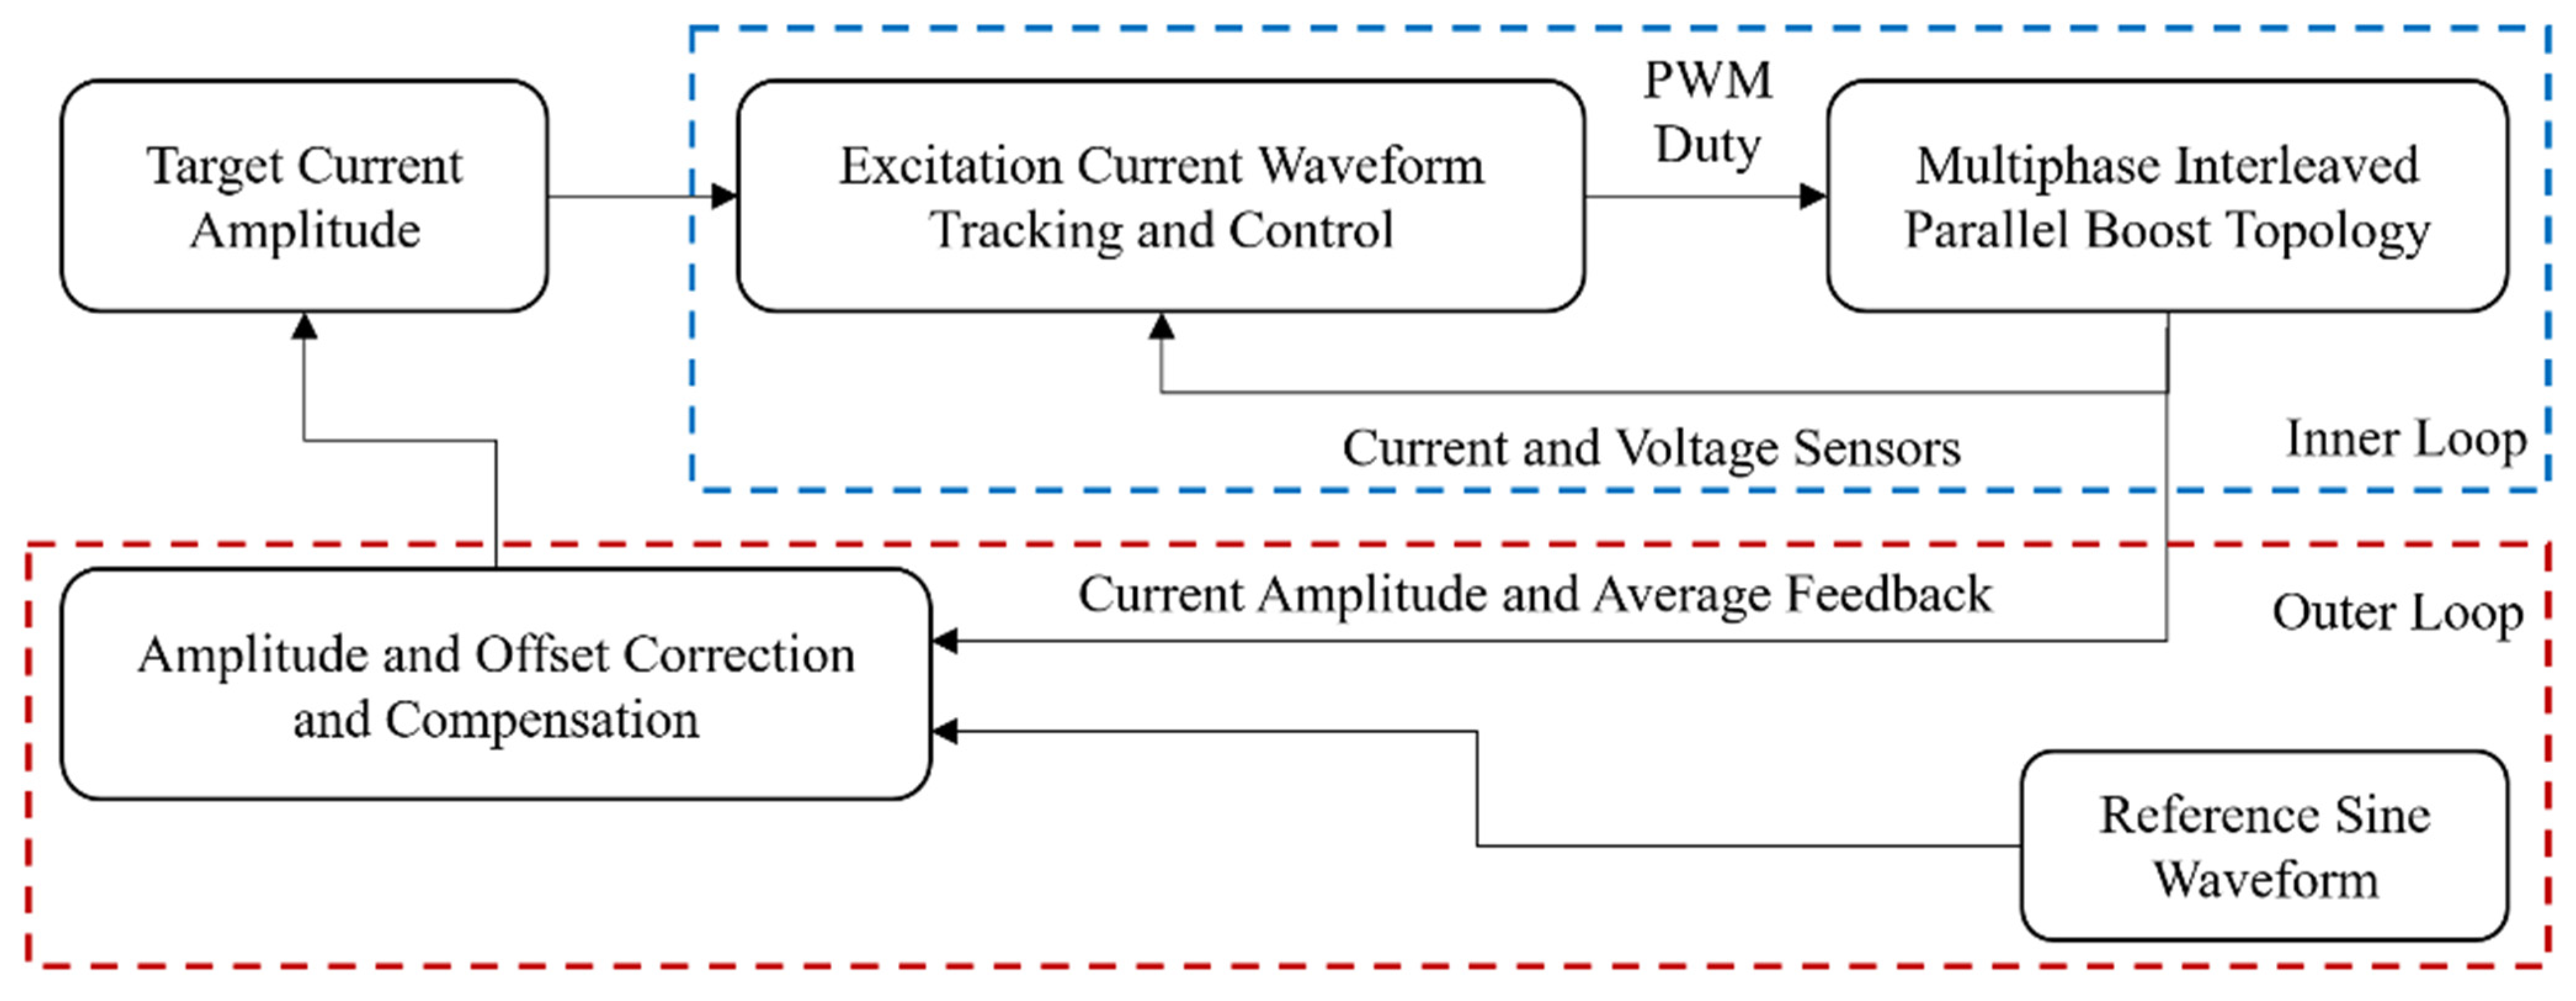
A DC/DC converter based on a four-phase interleaved parallel Boost topology was used as the excitation source. The multi-phase interleaved structure reduces the stress of the power components, increases the equivalent switching frequency, and is beneficial to suppress the current ripple. The excitation source control was based on a double PID closed loop, and the average current control strategy was adopted. Then, the feasibility and output performance of the design was verified by simulation, and the parameters of the filter inductor were optimized;
(2)
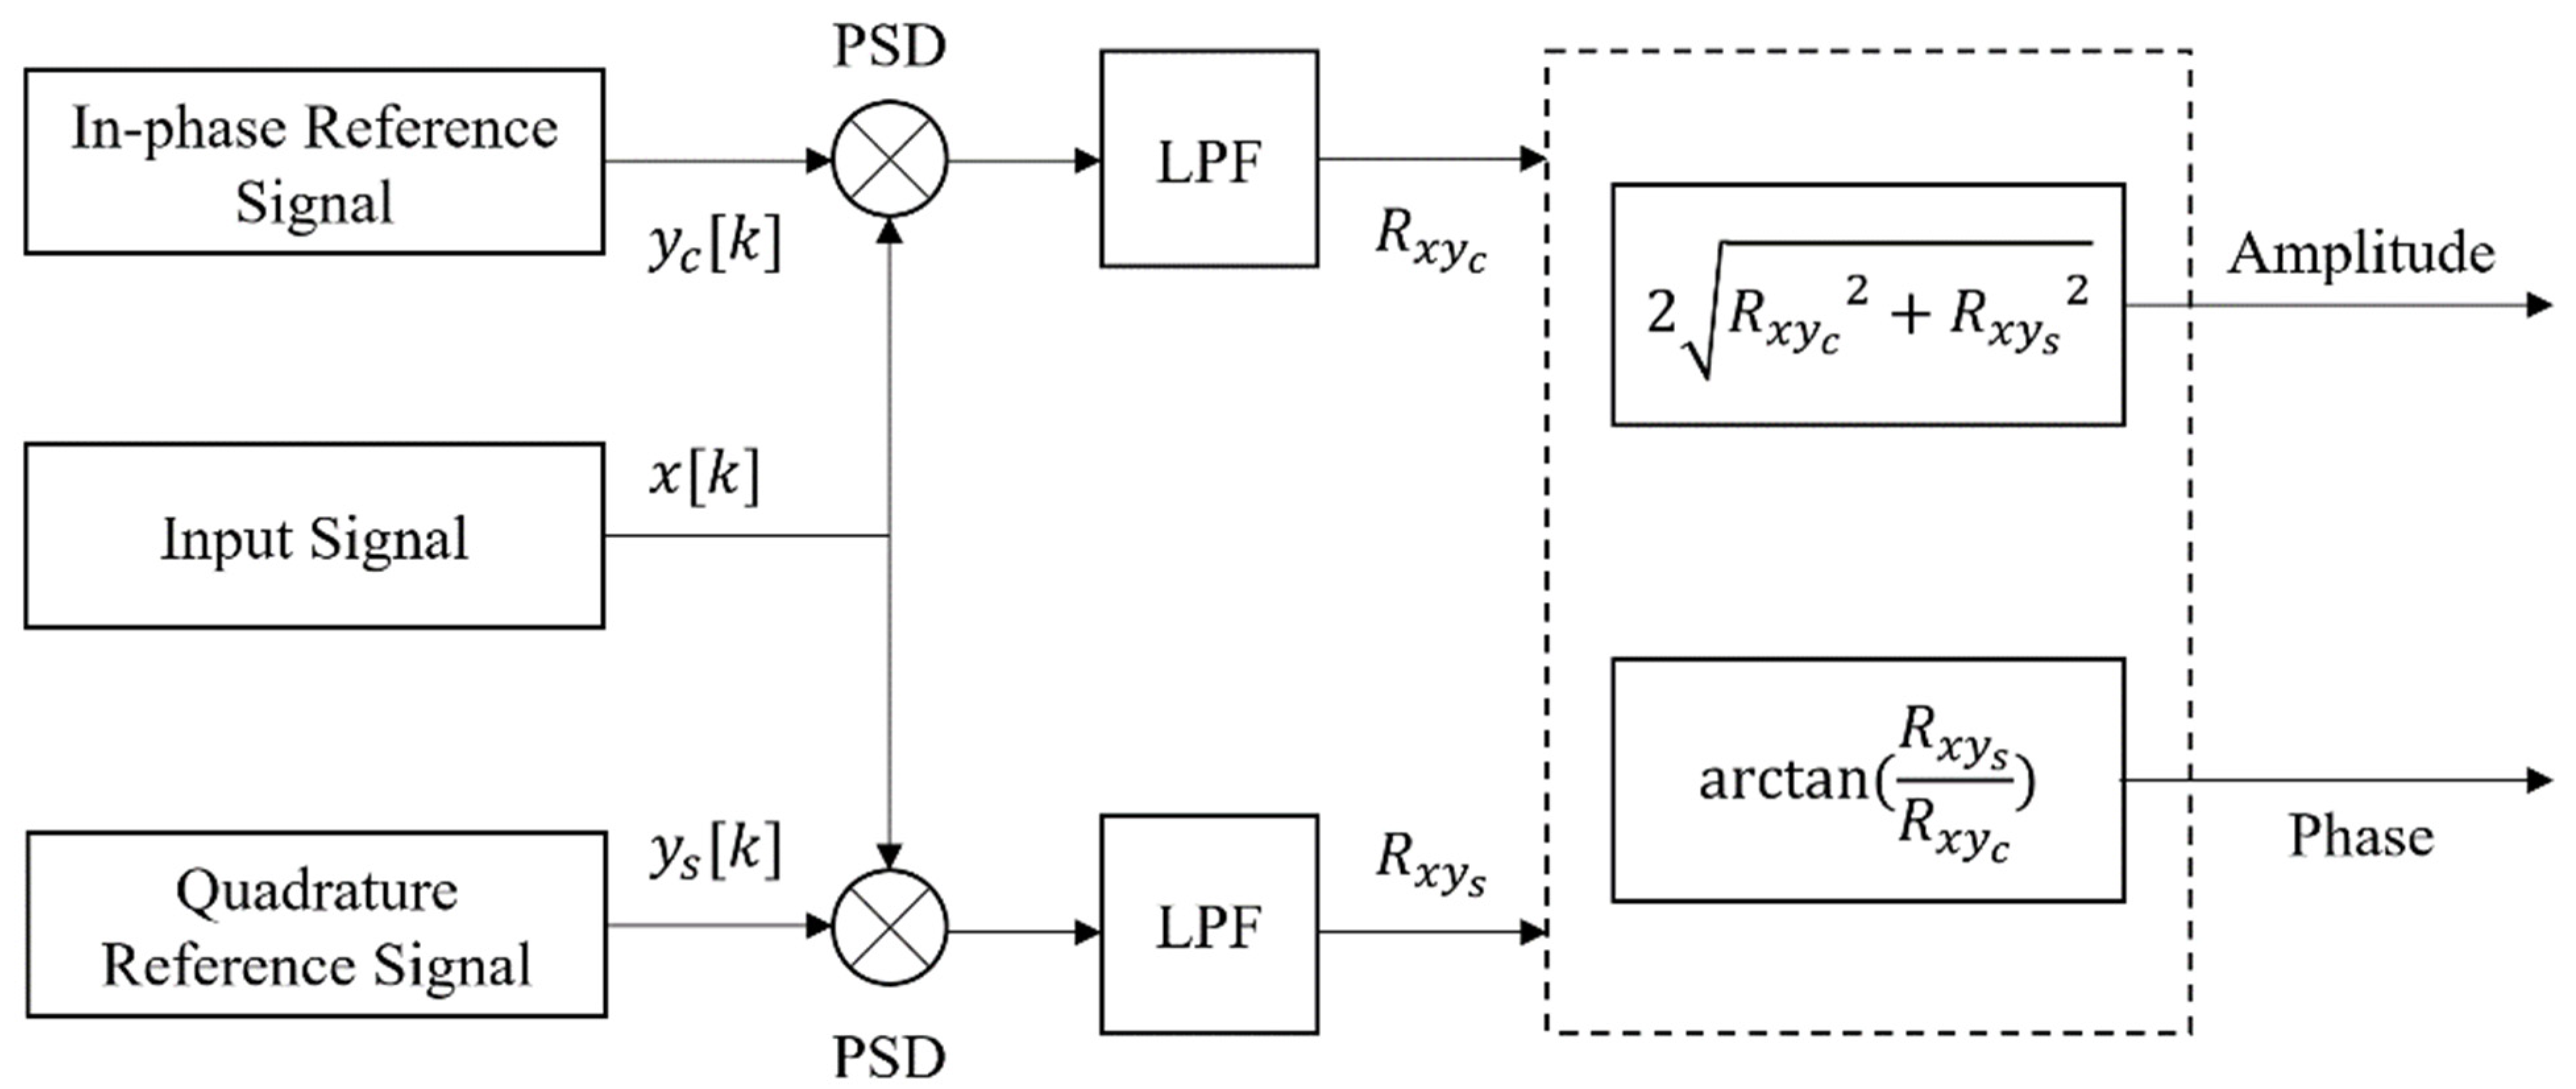
A multi-channel impedance measuring module was designed. Using orthogonal vector DLIA, the online impedance information extraction was realized on the embedded platform with limited computing resources and power consumption. Thereby, the impedance measurement and calculation can be realized using a low-cost embedded controller. In addition, the impedance measurement module has good scalability;
(3)
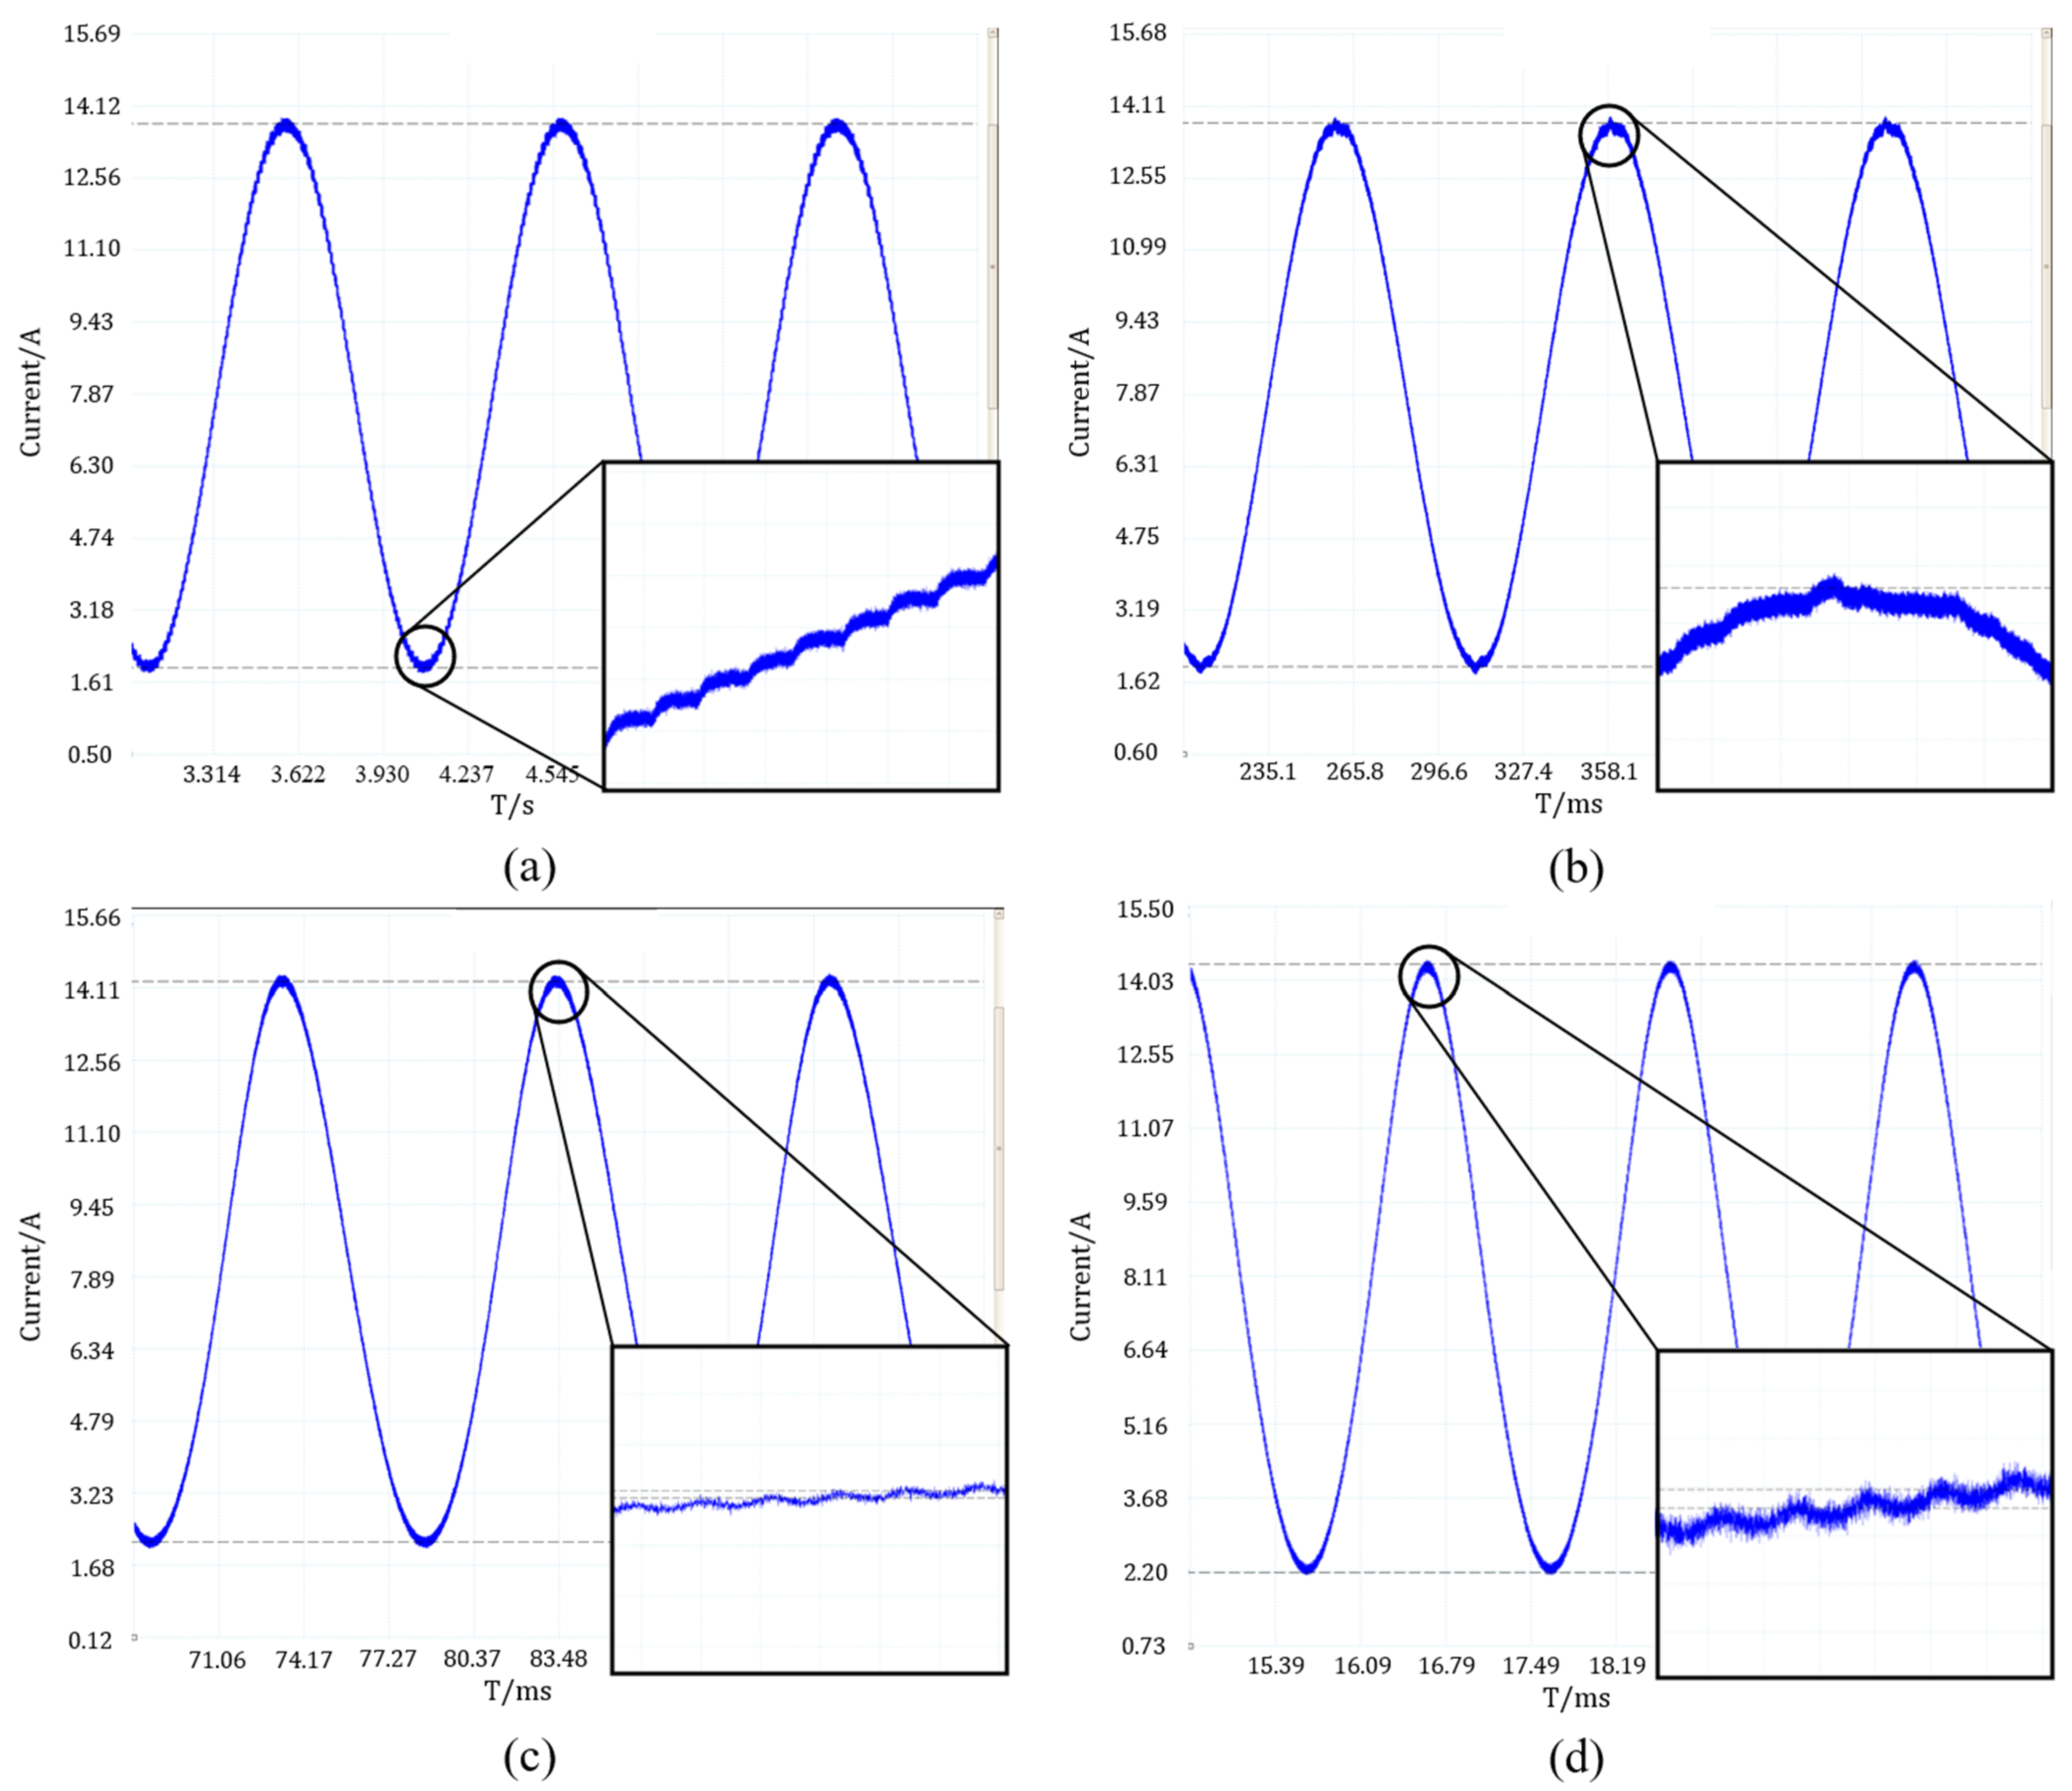
According to the above design, a prototype of the EIS measurement device is fabricated. The device has a small size and can be easily integrated into the fuel cell system. Experiment results conducted on the fuel cell test platform proved that the excitation waveform output by the designed excitation source has an amplitude error of no more than 1.8%, a frequency error of no more than 0.3%, and a maximum current ripple of 105.6 mA. The error between the impedance modulus value measured by the designed impedance measuring module and the reference is within 3.5%, and the error between the phase angle and the reference is within 1.5°. This device can meet the needs of embedded online EIS measurement;
(4)
The total cost of the fabricated impedance measurement device prototype is USD 793 (USD 304 for the excitation source, USD 389 for the impedance measuring module, and USD 100 for the Hall current sensor) and can be further reduced by optimizing the design and mass production. By comparison, the Autolab electrochemical workstation is priced at USD 30,000, and Yokohama Inc. sells an impedance test system for USD 75,000. The two measurement systems described above can be used for EIS measurement and analysis of a variety of electrochemical systems. However, these measurement systems are bulky, expensive, and have limited measurement channels. On the other hand, the designed online multi-channel EIS measurement device has low cost, low power consumption, and good scalability, and can be easily embedded into the fuel cell system which is more in line with the requirements of fuel cell fault diagnosis.
In conclusion, in this study an online multi-channel EIS measurement device for fuel cells was designed and verified experimentally with good excitation performance and measurement accuracy. Moreover, the device has the characteristics of small volume, low cost, and good expandability. The device has good application prospects in impedance-based fuel cell condition monitoring and fault diagnosis applications, which helps to improve the useful life of the fuel cell.

Author Contributions

Conceptualization, T.M. and J.K.; methodology, J.K. and W.L.; software, J.K.; validation, J.K., W.L. and X.X.; formal analysis, T.M.; investigation, J.K.; resources, T.M.; data curation, J.K.; writing—original draft preparation, T.M. and J.K.; writing—review and editing, W.L., Y.Y. and X.X.; visualization, J.K.; supervision, J.K., W.L. and Y.Y.; project administration, T.M.; funding acquisition, T.M. All authors have read and agreed to the published version of the manuscript.

Funding

This study has been funded by the National Natural Science Foundation of China (No. 51876144).

Institutional Review Board Statement

Not applicable.

Informed Consent Statement

Not applicable.

Data Availability Statement

Not applicable.

Conflicts of Interest

The authors declare no conflict of interest.

References

  1. Wang, Y.; Chen, K.S.; Jeffrey, M.; Sung, C.C.; Xavier, C.A. A review of polymer electrolyte membrane fuel cells: Technology, applications, and needs on fundamental research. Appl. Energy 2011, 88, 981–1007. [Google Scholar] [CrossRef] [Green Version]
  2. PPollet, B.G.; Staffell, I.; Shang, J.L. Current status of hybrid, battery and fuel cell electric vehicles: From electrochemistry to market prospects. Electrochim. Acta 2012, 84, 235–249. [Google Scholar] [CrossRef]
  3. Song, J.; Zhu, Y.T.; Liang, D.X.; Cheng, Q.; Yao, D.W.; Bao, W.H. Hydrogen energy system for renewable energy consumption. In Proceedings of the 2nd International Academic Exchange Conference on Science and Technology Innovation (IAECST 2020), Guangzhou, China, 18–20 December 2020. [Google Scholar] [CrossRef]
  4. Tanaka, S.; Nagumo, K.; Yamamoto, M.; Chiba, H.; Yoshida, K.; Okano, R. Fuel cell system for Honda CLARITY fuel cell. eTransportation 2020, 3, 100046. [Google Scholar] [CrossRef]
  5. Huang, Z.Y.; Xing, L.; Tu, Z.K. Load changing characteristics of the hydrogen-air and hydrogen-oxygen proton exchange membrane fuel cells. Int. J. Energy Res. 2022, 46, 1909–1921. [Google Scholar] [CrossRef]
  6. Lü, X.Q.; Qu, Y.; Wang, Y.D.; Qin, C.; Liu, G. A comprehensive review on hybrid power system for PEMFC-HEV: Issues and strategies. Energy Convers. Manag. 2018, 171, 1273–1291. [Google Scholar] [CrossRef]
  7. Gong, C.Y.; Xing, L.; Liang, C.; Tu, Z.K. Modeling and dynamic characteristic simulation of air-cooled proton exchange membrane fuel cell stack for unmanned aerial vehicle. Renew. Energy 2022, 188, 1094–1104. [Google Scholar] [CrossRef]
  8. Ma, T.C.; Xu, J.M.; Li, R.T.; Yao, N.Y.; Yang, Y.B. Online short-term remaining useful life prediction of fuel cell vehicles based on cloud system. Energies 2021, 14, 2806. [Google Scholar] [CrossRef]
  9. Hu, Z.Y.; Xu, L.F.; Li, J.Q.; Gan, Q.Q.; Xu, X.; Song, Z.Y.; Shao, Y.B.; Ouyang, M.G. A novel diagnostic methodology for fuel cell stack health: Performance, consistency and uniformity. Energy Convers. Manag. 2019, 185, 611–621. [Google Scholar] [CrossRef]
  10. Kitamura, N.; Manabe, K.; Nonobe, Y.; Kizaki, M. Development of water content control system for fuel cell hybrid vehicles based on AC impedance. In Proceedings of the SAE 2010 World Congress and Exhibition, Detroit, MI, USA, 13–15 April 2010. [Google Scholar] [CrossRef]
  11. Jeppesen, C.; Araya, S.S.; Sahlin, S.L.; Andreasen, S.J.; Kær, S.K. An EIS alternative for impedance measurement of a high temperature PEM fuel cell stack based on current pulse injection. Int. J. Hydrogen Energy 2017, 42, 15851–15860. [Google Scholar] [CrossRef] [Green Version]
  12. Abe, T.; Shima, H.; Watanabe, K.; Ito, Y. Study of PEFCs by AC impedance, current interrupt, and dew point measurements. J. Electrochem. Soc. 2004, 151, A101–A105. [Google Scholar] [CrossRef]
  13. Ma, T.C.; Lin, W.K.; Zhang, Z.L.; Kang, J.J.; Yang, Y.B. Research on electrochemical impedance spectroscope behavior of fuel cell stack under different reactant relative humidity. Int. J. Hydrogen Energy 2021, 46, 17388–17396. [Google Scholar] [CrossRef]
  14. Ma, T.C.; Lin, W.K.; Yang, Y.B.; Wang, K.; Jia, W.Y. Water content diagnosis for proton exchange membrane fuel cell based on wavelet transformation. Int. J. Hydrogen Energy 2020, 45, 20339–20350. [Google Scholar] [CrossRef]
  15. Wang, Q.; Hu, Z.Y.; Xu, L.F.; Li, J.Q.; Gan, Q.Q.; Du, X.L.; Ouyang, M.G. A comparative study of equivalent circuit model and distribution of relaxation times for fuel cell impedance diagnosis. Int. J. Energy Res. 2021, 45, 15948–15961. [Google Scholar] [CrossRef]
  16. Gallo, M.; Polverino, P.; Mougin, J.; Morel, B.; Pianese, C. Coupling electrochemical impedance spectroscopy and model-based aging estimation for solid oxide fuel cell stacks lifetime prediction. Appl. Energy 2020, 279, 115718–115732. [Google Scholar] [CrossRef]
  17. Janicka, E.; Mielniczek, M.; Gawel, L.; Darowicki, K.; Landowska, P. The impact of air humidity on the operation of proton exchange membrane fuel cells determined using dynamic electrochemical impedance spectroscopy. Electrochim. Acta 2020, 341, 404–414. [Google Scholar] [CrossRef]
  18. Pivac, I.; Bezmalinović, D.; Barbir, F. Catalyst degradation diagnostics of proton exchange membrane fuel cells using electrochemical impedance spectroscopy. Int. J. Hydrogen Energy 2018, 43, 13512–13520. [Google Scholar] [CrossRef]
  19. Yuan, X.Z.; Wang, H.J.; Colin Sun, J.; Zhang, J.J. AC impedance technique in PEM fuel cell diagnosis-A review. Int. J. Hydrogen Energy 2007, 32, 4365–4380. [Google Scholar] [CrossRef]
  20. Lu, H.X.; Chen, J.; Yan, C.Z.; Liu, H. On-line fault diagnosis for proton exchange membrane fuel cells based on a fast electrochemical impedance spectroscopy measurement. J. Power Sources 2019, 430, 233–243. [Google Scholar] [CrossRef]
  21. Aroge, F.A.; Barendse, P.S. Signal Injection by Active Load Modulation for PEM Fuel Cell Diagnostics. In Proceedings of the 2018 IEEE Power and Energy Society and Industrial Applications Society PowerAfrica, Cape Town, South Africa, 28–29 June 2018. [Google Scholar] [CrossRef]
  22. Gong, Z.; Liu, Z.; Wang, Y.; Gupta, K.; Da Silva, C.; Liu, T.; Zheng, Z.H.; Zhang, W.P.; Van Lammeren, J.P.M.; Bergveld, H.J.; et al. IC for online EIS in automotive batteries and hybrid architecture for high-current perturbation in low-impedance cells. In Proceedings of the 33rd Annual IEEE Applied Power Electronics Conference and Exposition, San Antonio, TX, USA, 4–8 March 2018. [Google Scholar] [CrossRef]
  23. Hong, P.; Li, J.Q.; Xu, L.F.; Ouyang, M.G.; Fang, C. Modeling and simulation of parallel DC/DC converters for online AC impedance estimation of PEM fuel cell stack. Int. J. Hydrogen Energy 2016, 41, 3004–3014. [Google Scholar] [CrossRef]
  24. Park, H.S.; Shin, M.H.; Eom, T.H.; Won, C.Y.; Kang, S.D.; Min, T.H. A development of the detection unit of Fuel cell impedance. In Proceedings of the 3rd IEEE International Future Energy Electronics Conference and ECCE Asia, Kaohsiung, Taiwan, 3–7 June 2017. [Google Scholar] [CrossRef]
  25. Wang, H.Q.; Gaillard, A.; Hissel, D. A review of DC/DC converter-based electrochemical impedance spectroscopy for fuel cell electric vehicles. Renew. Energy 2019, 141, 124–138. [Google Scholar] [CrossRef]
  26. Depernet, D.; Narjiss, A.; Gustin, F.; Hissel, D.; Péra, M. Integration of electrochemical impedance spectroscopy functionality in proton exchange membrane fuel cell power converter. Int. J. Hydrogen Energy 2016, 41, 5378–5388. [Google Scholar] [CrossRef]
  27. Hinaje, M.; Sadli, I.; Martin, J.-P.; Thounthong, P.; Raël, S.; Davat, B. Online humidification diagnosis of a PEMFC using a static DC-DC converter. Int. J. Hydrogen Energy 2009, 34, 2718–2723. [Google Scholar] [CrossRef]
  28. Katayama, N.; Kogoshi, S. Real-Time Electrochemical Impedance Diagnosis for Fuel Cells Using a DC-DC Converter. IEEE Trans. Energy Convers. 2015, 30, 707–713. [Google Scholar] [CrossRef]
  29. Lashway, C.R.; Constant, G.; Theogene, J.; Mohammed, O. A real-time circuit topology for battery impedance monitoring. In Proceedings of the SoutheastCon 2016, Norfolk, VA, USA, 30 March–3 April 2016. [Google Scholar] [CrossRef]
  30. Lyu, C.; Liu, H.Y.; Luo, W.L.; Zhang, T.; Zhao, W.G. A Fast Time Domain Measuring Technique of Electrochemical Impedance Spectroscopy Based on FFT. In Proceedings of the 2018 Prognostics and System Health Management Conference, Chongqing, China, 26–28 October 2018. [Google Scholar] [CrossRef]
  31. Darowicki, K.; Orlikowski, J.; Lentka, G. Instantaneous impedance spectra of a non-stationary model electrical system. J. Electroanal. Chem. 2000, 486, 106–110. [Google Scholar] [CrossRef]
  32. Debenjak, A.; Boškoski, P.; Musizza, B.; Petrovčič, J.; Juričić, C.D.S. Fast measurement of proton exchange membrane fuel cell impedance based on pseudo-random binary sequence perturbation signals and continuous wavelet transform. J. Power Sources 2014, 254, 112–118. [Google Scholar] [CrossRef]
  33. Li, W.H.; Huang, Q.A.; Yang, C.P.; Chen, J.; Tang, Z.P.; Zhang, F.Z.; Li, A.J.; Zhang, L.; Zhang, J.J. A fast measurement of Warburg-like impedance spectra with Morlet wavelet transform for electrochemical energy devices. Electrochim. Acta 2019, 322, 134760. [Google Scholar] [CrossRef]
  34. De Beer, C.; Barendse, P.S.; Pillay, P. Fuel Cell Condition Monitoring Using Optimized Broadband Impedance Spectroscopy. IEEE Trans. Ind. Electron. 2015, 62, 5306–5316. [Google Scholar] [CrossRef]
  35. Ehlich, J.; Zhivko, I.; Yordanov, R.; Salyk, O.; Weiter, M. Optimized Impedance Measurement with AD5933. In Proceedings of the 43rd International Spring Seminar on Electronics Technology, Demanovska Valley, Slovakia, 14–15 May 2020. [Google Scholar] [CrossRef]
  36. Hong, P.; Li, J.Q.; Xu, L.F.; Ouyang, M.G. Design and validation of an embedded signal analyzer for AC impedance identification of PEM fuel cell. In Proceedings of the 2016 IEEE Transportation Electrification Conference and Expo Asia-Pacific, Busan, Korea, 1–4 June 2016. [Google Scholar] [CrossRef]
  37. Tang, Z.P.; Huang, Q.A.; Wang, Y.J.; Zhang, F.Z.; Li, W.H.; Li, A.J.; Zhang, L.; Zhang, J.J. Recent progress in the use of electrochemical impedance spectroscopy for the measurement, monitoring, diagnosis and optimization of proton exchange membrane fuel cell performance. J. Power Sources 2020, 468, 228361. [Google Scholar] [CrossRef]
  38. Guilbert, D.; N’Diaye, A.; Gaillard, A.; Djerdir, A. Fuel cell systems reliability and availability enhancement by developing a fast and efficient power switch open-circuit fault detection algorithm in interleaved DC/DC boost converter topologies. Int. J. Hydrogen Energy 2016, 41, 15505–15517. [Google Scholar] [CrossRef]
  39. Garrigós, A.; Marroquí, D.; García, A.; Blanes, J.M.; Gutiérrez, R. Interleaved, switched-inductor, multi-phase, multi-device DC/DC boost converter for non-isolated and high conversion ratio fuel cell applications. Int. J. Hydrogen Energy 2019, 44, 12783–12792. [Google Scholar] [CrossRef]
  40. Al Sakka, M.; Van Mierlo, J.; Gualous, H.; Lataire, P. Comparison of 30KW DC/DC Converter topologies interfaces for fuel cell in hybrid electric vehicle. In Proceedings of the 2009 13th European Conference on Power Electronics and Applications, Barcelona, Spain, 8–10 September 2009. [Google Scholar]
  41. Wang, D.L.; Wang, Z.J.; Peng, Z.Z.; Zhang, Y.L.; Cheng, X.F. A Four-Phase Interleaved Buck-Boost Converter with Changed Load Connection for the Fuel Cell Activation. IEEE Access 2021, 9, 102104–102113. [Google Scholar] [CrossRef]
  42. Qi, C.; Huang, Y.Y.; Zhang, W.S.; Zhou, D.; Wang, Y.M.; Zhu, M. Design of dual-phase lock-in amplifier used for weak signal detection. In Proceedings of the 42nd Conference of the Industrial Electronics Society, Florence, Italy, 23–26 October 2016. [Google Scholar] [CrossRef]
Figure 1. Hardware structure diagram of the excitation source.
Energies 15 03414 g001
Figure 2. Polarization curve of the adapted fuel cell.
Energies 15 03414 g002
Figure 3. Multi-phase interleaved parallel Boost topology.
Energies 15 03414 g003
Figure 4. Schematic of diode rectification and synchronous rectification: (a) diode rectification; (b) synchronous rectification.
Energies 15 03414 g004
Figure 5. Gate drive voltage V g x and current ripple i L x of each branch of the four-phase interleaved parallel boost topology: (a) 0 ≤ D < 25%; (b) 25% ≤ D < 50%; (c) 50% ≤ D < 75%; (d) 75% ≤ D < 100%.
Energies 15 03414 g005
Figure 6. Simulation model of four-phase interleaved parallel topology circuit.
Energies 15 03414 g006
Figure 7. Block diagram of the closed-loop control model of excitation current waveform.
Energies 15 03414 g007
Figure 8. Ripple current of output waveforms with different inductances: (a) 54 μH; (b) 120 μH; (c) 180 μH.
Energies 15 03414 g008
Figure 9. Comparison of the output waveform and reference waveform at different output frequencies: (a) 10 Hz; (b) 100 Hz; (c) 200 Hz; (d) 500 Hz.
Energies 15 03414 g009
Figure 10. Hardware structure diagram of the impedance measuring module.
Energies 15 03414 g010
Figure 11. Schematic diagram of quadrature vector digital lock-in amplifier (DLIA).
Energies 15 03414 g011
Figure 12. Schematic diagram of fuel cell test bench.
Energies 15 03414 g012
Figure 13. Excitation current waveform and partial magnification at different frequencies: (a) 1 Hz; (b) 10 Hz; (c) 100 Hz; (d) 500 Hz.
Energies 15 03414 g013
Figure 14. Impedance data measured by the prototype and data acquisition system (DAQ system): (a) modulus of cell 1 and 2; (b) phase of cell 1 and 2; (c) modulus of cell 3 and 4; (d) phase of cell 3 and 4; (e) modulus of cell 5 and 6; (f) phase of cell 5 and 6.
Energies 15 03414 g014
Figure 15. Nyquist and Bode plots based on the impedance data measured by the prototype and the DAQ system: (a) Nyquist plot; (b) magnitude diagram of the Bode plot; (c) phase angle diagram of the Bode plot.
Energies 15 03414 g015
Figure 16. The error between the measured data of the prototype and the reference data: (a) modulus error; (b) phase error.
Energies 15 03414 g016
Table 1. Parameters of fuel cell excitation source.
ParametersValue
Input voltage range4.0~6.0 V
Output voltage range10.5~13.5 V
Excitation current waveformSingle-frequency sine wave
Excitation frequency range1~500 Hz
Excitation current amplitude10.0 A
DC offset current12.0 A
Input current ripple<100 mA (1% of excitation amplitude)
Table 2. Output waveform characteristics and the error relative to the reference waveform at different frequencies.
Frequency/HzMaximum
Current/A
Minimum
Current/A
Average Offset
Current/A
Excitation
Amplitude/A
Phase Difference to Reference/°
50021.7811.77511.77810.0033.60°
20022.1581.85012.00410.1541.80°
10022.0581.93911.99810.0602.16°
1022.0011.99912.00010.002-
Table 3. Fuel cell operating parameters.
ParametersValue
Air pressure170 kPa
Hydrogen pressure190 kPa
Stoichiometric ratios2:2 (H2/Air)
Relative humidity50%
Coolant temperature70 °C
Output current159 A
Single-cell voltage0.71 V
Table 4. Excitation waveform characteristics and the error relative to the reference waveform at different frequencies.
Frequency/HzMaximum
Current/A
Minimum
Current/A
Average Offset
Current/A
Excitation
Amplitude/A
Ripple
Amplitude/mA
Waveform
Frequency/Hz
113.7381.9367.8385.90288.820.998
1013.7621.9717.8665.895105.7010.02
10014.2412.1828.2116.02980.45100.00
50014.3732.1968.2836.08792.88499.99
Table 5. Errors between excitation waveform parameters and set values.
Frequency/HzOffset Current ErrorExcitation Amplitude ErrorExcitation Frequency Error
1−2.0%−1.6%−0.2%
10−1.7%−1.8%+0.3%
100+2.6%+0.5%0
500+3.5%+1.5%−0.1%
Publisher’s Note: MDPI stays neutral with regard to jurisdictional claims in published maps and institutional affiliations.

