1. Introduction
Development of natural gas reservoirs associated with the continuous changes of temperature and pressure. Determination of pressure–volume–temperature (PVT) properties of natural gas is important. Among these thermodynamic properties, the gas compressibility factor (Z-factor) is a basic and crucial parameter. It is of importance in calculating the material balance equation, evaluating gas reserves, simulating gas reservoir development, etc. [
1,
2]. In addition, the injection of carbon dioxide (
) into gas reservoirs has become an important approach to improve natural gas recovery and reduce
emissions to alleviate climate change [
3]. However, the full miscibility of
and natural gas affects the predictive accuracy of natural gas compressibility factors. Experimental studies show that the compressibility factor has significant differences when the non-hydrocarbon components are in the natural gas system [
4,
5]. The compressibility factor of
is sensitive to temperature and pressure where low temperature reduces the inflection pressure of compressibility factor curve. Traditional methods are found to have large discrepancies in predicting the gas compressibility factor when the
contents are high in the natural gas system. The motivation of this study is to introduce an explicit correlation to accurately estimate compressibility factors of natural gases with different
contents.
1.1. Overview of the Current Methods
Experimental measurements, equation of state (EOS) method, empirical correlations, and artificial intelligence (AI) related methods are the four common approaches to predict compressibility factor. Experimental measurement is the most accurate and reliable method and the Standing and Katz chart (SKC) is the most commonly used benchmark [
6,
7]. Secondly, thermodynamic models based on EOS are used to study the phase behaviour of natural gases and predict compressibility factors [
8,
9]. Several tuning methods are developed to reduce the relative errors observed between simulation and experiments. For example, Shariati et al. [
10] and Jaubert et al. [
9] reported the research concerning with the adjustment of splitting
fractions and correction of binary interaction parameters. Yan et al. [
8] presented a correction, originating from the Soave–Redlich–Kwong (SRK) EOS to improve the prediction accuracy of compressibility factors when applied to high-pressure natural gases. The third method of computing compressibility factors is empirical correlations [
11,
12,
13]. There are more than 20 formulae for fast and convenient estimation of compressibility factors, and these formulae are generally applied to mild pressures and temperatures. The fourth method is artificial intelligence (AI)-based methods, such as neural networks and support vector machine methods [
14,
15], which can be employed to predict the physical properties of hydrocarbons.
Generally speaking, the measured data are customarily used to validate results calculated from empirical correlations because of their reliability and accuracy. However, PVT tests of fluid samples are often unavailable, especially at the early stage of a gas field development. They are also expensive and time-consuming. Thermodynamic models based on EOS are implicit models, while empirical correlations are explicit methods. The latter is relatively simpler and easier in calculating compressibility factors than the former. One reason is that EOS involves numerous calculations and compressibility factors cannot be solved as a root of the EOS. Finally, the AI-based models are accurate and fast in computing compressibility factors, however, the performance of these methods requires a further exploration. As show in
Table 1, comprehensive comparisions are provided to better elaborate on the characteristics of available methods in the literature from both aspects of advantages and limitations.
1.2. Statement of the Problem
In this paper, the empirical correlations are adopted to calculate compressibility factors of natural gases in a condensate gas reservoir with variable
contents. Because empirical correlations are the most efficient and simple methods for industrial applications. However, large discrepancies are found by using these empirical correlations [
2,
11,
12]. These methods perform well in traditional natural gases, whereas the high inclusion of
greatly reduces the prediction accuracy. Therefore, a new correlation is developed in this paper. Similar to the classical correlations, the application of the new one is limited to a certain range of pressures and temperatures. However, the new method has some novelties. First, the proposed correlation can deal with natural gas samples that contain variable
contents. Second, it is applied to condensate gas samples that have relatively large amounts of components than dry and wet gases.
The structure of this paper is outlined below.
Section 2 is the methodology that introduces the general procedures to compute compressibility factors and three basic empirical correlations in the literature. The development of the new correlation is also introduced in this section.
Section 3 shows the results and discussions, which firstly compares the compressibility factors computed from these correlations in a realistic natural gas reservoir. Then, six natural gas mixtures taken from the literature are utilized to validate the accuracy and quantify the uncertainties of the proposed correlation. In addition, the effect of compressibility factors on the estimation of dynamic reserves is studied. Finally, conclusions are drawn in
Section 4.
2. Methodology
This section introduces the natural gas samples used in the laboratory and the general procedures to compute compressibility factors. Three empirical correlations from the literature and the correlation developed in this paper are demonstrated.
2.1. Data Introduction
The natural gas samples used in this paper were taken from a gas field in the south of China. All samples were used without further purification. The JEFRI-PVT apparatus made by the Schlumberger company (Canada) was used to conduct the PVT experiments. Constant composition expansion experiments were performed to determine the gas volume and calculate compressibility factors.
The compressibility factor
z is defined from the EOS:
where
P and
T are the measured pressure and temperature in the PVT cell;
V is the gas volume;
n is the moles of gas; and
R is the universal gas constant. Compressibility factor is a measure of the amount of gas that deviates from its perfect behaviour and is calculated from experiments using:
in which the subscripts
e and
a denote the experiment and ambient conditions. The ambient pressure used here is 0.101325 MPa and the temperature is 20 °C.
Three condensate gas samples with different
contents were utilized and studied.
Table A1 shows the mole fraction of compositions of gas mixtures. Each sample is split into three subsamples to be analysed at different temperatures. Therefore, nine experiments are conducted, and a total of 134 data points are measured. The measured compressibility factors of the three samples are reported in
Table A2,
Table A3 and
Table A4 in
Appendix A.
2.2. Empirical Methods Introduction
This section elaborates on the general procedures of compressibility factor calculation by using empirical correlations. Four empirical correlations are introduced.
2.2.1. General Procedures to Compute Z
The procedures to calculate the compressibility factor using empirical correlations are similar. The input parameters include gas compositions, pressure, and temperature.
First, pseudo critical properties are calculated. Several mixing rules can be used, for example, Kay’s mixing rule, the Stewart–Burkhardt–Voo (SBV) mixing rule, the Sutton modification of SBV (SSBV) and the Piper mixing rule. Kay’s mixing rule is the best-known and is used in this study. The pseudo critical properties are calculated as follows:
where
is the mole fraction of component
i in the gas mixture.
Secondly, the Wichert and Aziz [
19] correlation is applied to correct the pseudo critical properties of natural gases to sour gas components (
and
). The Wichert and Aziz correlation takes the following form:
where
A and
B are mole fractions of
and
.
Thirdly, the reduced pressure and temperature are calculated:
Then compressibility factors can be calculated using empirical correlations.
2.2.2. The Empirical Correlations
There are more than twenty correlations available to compute compressibility factors from fitting the Standing–Katz chart. In this research, three well-known empirical correlations are adopted to calculate gas compressibility factors, the Dranchuk and Abu-Kassem method (DAK) [
12], the Hall and Yarborough method (HY) [
11], and the Granmer method [
20]. Details of these methods are listed below. The implementations of these methods includes an iterative method and a direct calculation. The Newton–Raphson iterative method is used to calculate the result [
20].
The Dranchuk and Abou-Kassem [
12] correlation is a widely used empirical method to calculate the gas compressibility factor:
where
is the reduced density of gas.
Hall and Yarborough [
11] presented an EOS to represent the Standing–Katz chart:
where
y can be found from the following equation using the Newton–Raphson iterative method:
Coefficients
a,
b,
c, and
d are expressed as follows:
The Granmer method is the third used to compute the gas compressibility factor [
20]:
In addition to the above three methods, an empirical correlation is proposed in this paper. Poettman and Carpenter [
21] digitalized the Standing–Katz chart by thousands of data points in different ranges of pressure and temperature. That is how the classical correlations were developed. In this study, the experimental data measured from the real condensate gas reservoir are utilized. Compressibility factors were correlated to reduced pressure and temperature by multiple regression analysis. The tuned coefficients are obtained by minimizing the sum of the squares of the residuals of the compressibility factor formula. The more precise the experimental data, the more accurate the tuned coefficients and the fewer deviations from the predicted results.
where
.
3. Results and Discussions
This section firstly compares the compressibility factors calculated by the correlation proposed in this paper and three classical correlations with the experimental data. Secondly, six natural gas mixtures with contents ranging from 9% to 89% in the literature are utilized to validate the accuracy of the proposed correlation. Thirdly, dynamic reserves are estimated using the material balance equation and the effect of the calculated compressibility factors on the dynamic reserves are analysed.
3.1. Comparisons with the Other Empirical Correlations
The three condensate gas samples are utilized here. Each sample is split into three subsamples that are tested at different temperatures and a total of 134 data points are obtained.
Table 2 reports the absolute average errors of the four correlations compared with the experiments.
Table A2,
Table A3 and
Table A4 in
Appendix A report the measured data. The absolute average error is calculated from:
It can be seen that the total average errors of the three empirical correlations are larger than 8% and the errors in some samples even exceed 10% (for example, the HY method in sample 3 and the Granmer method in sample 2). However, the average errors computed by the correlation proposed in this paper are as smaller as 1.96% and 3% for sample 1 and 2, respectively. All four correlations have large errors in sample 3 but the error of the method proposed in this paper is the smallest. The total average error of the proposed method is 4.53%, which is less than the other three empirical correlations.
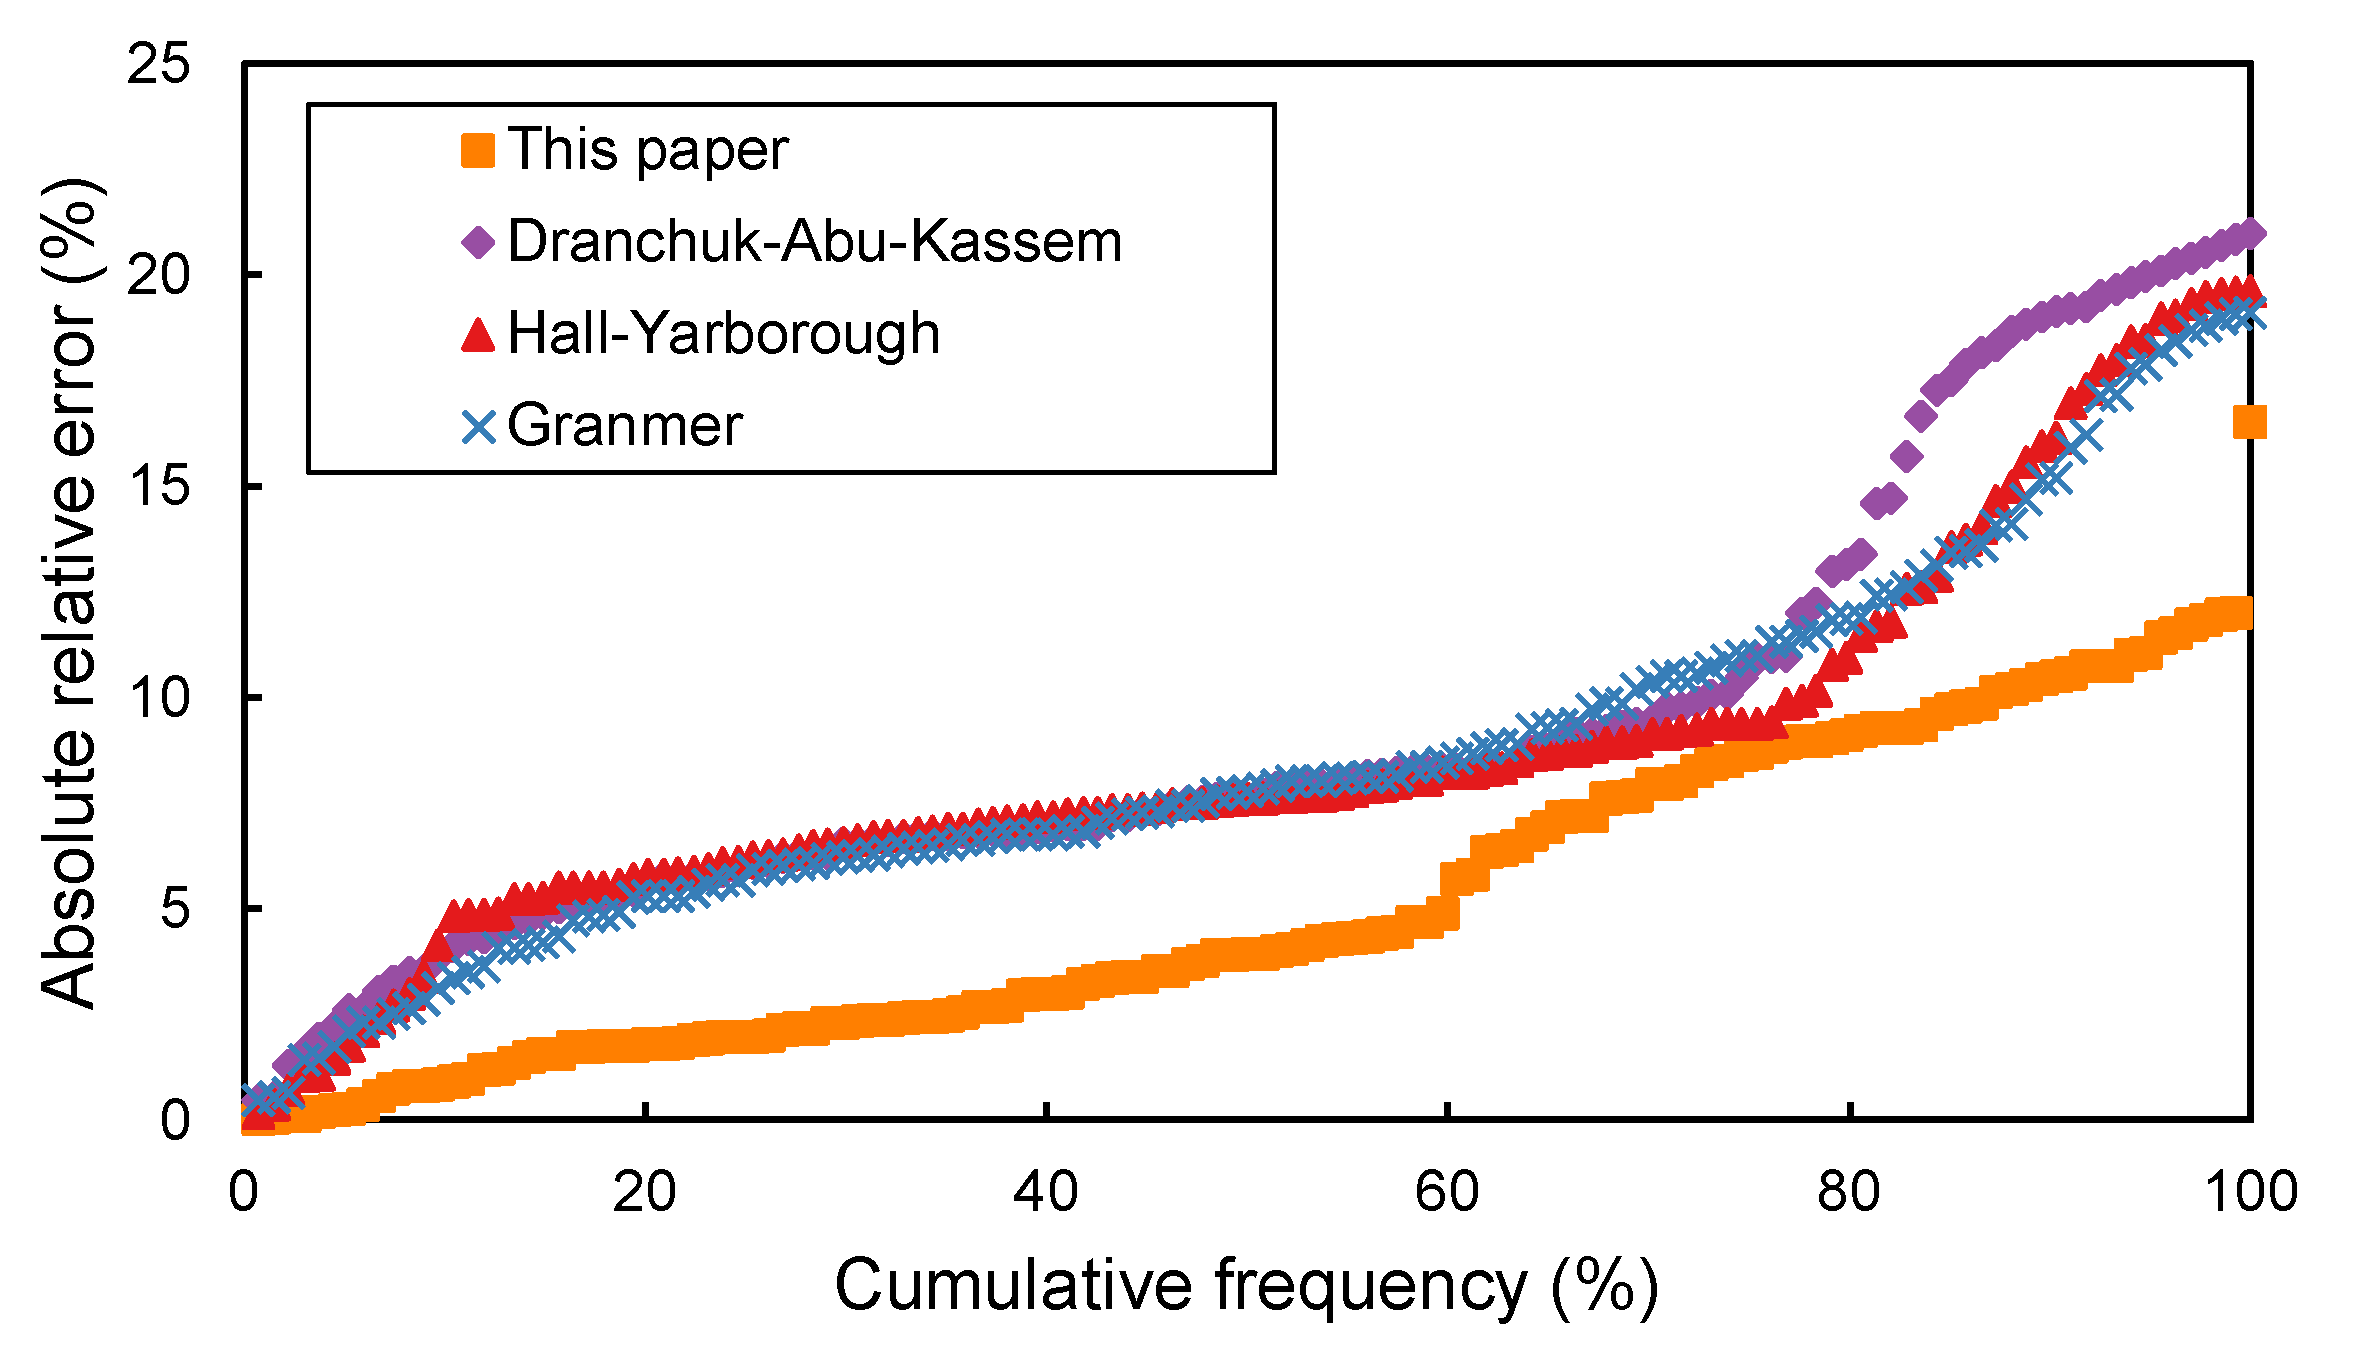
In order to compare the accuracy of the four correlations, the cumulative frequency versus the absolute average errors of the 134 experimental compressibility factor data points is plotted in
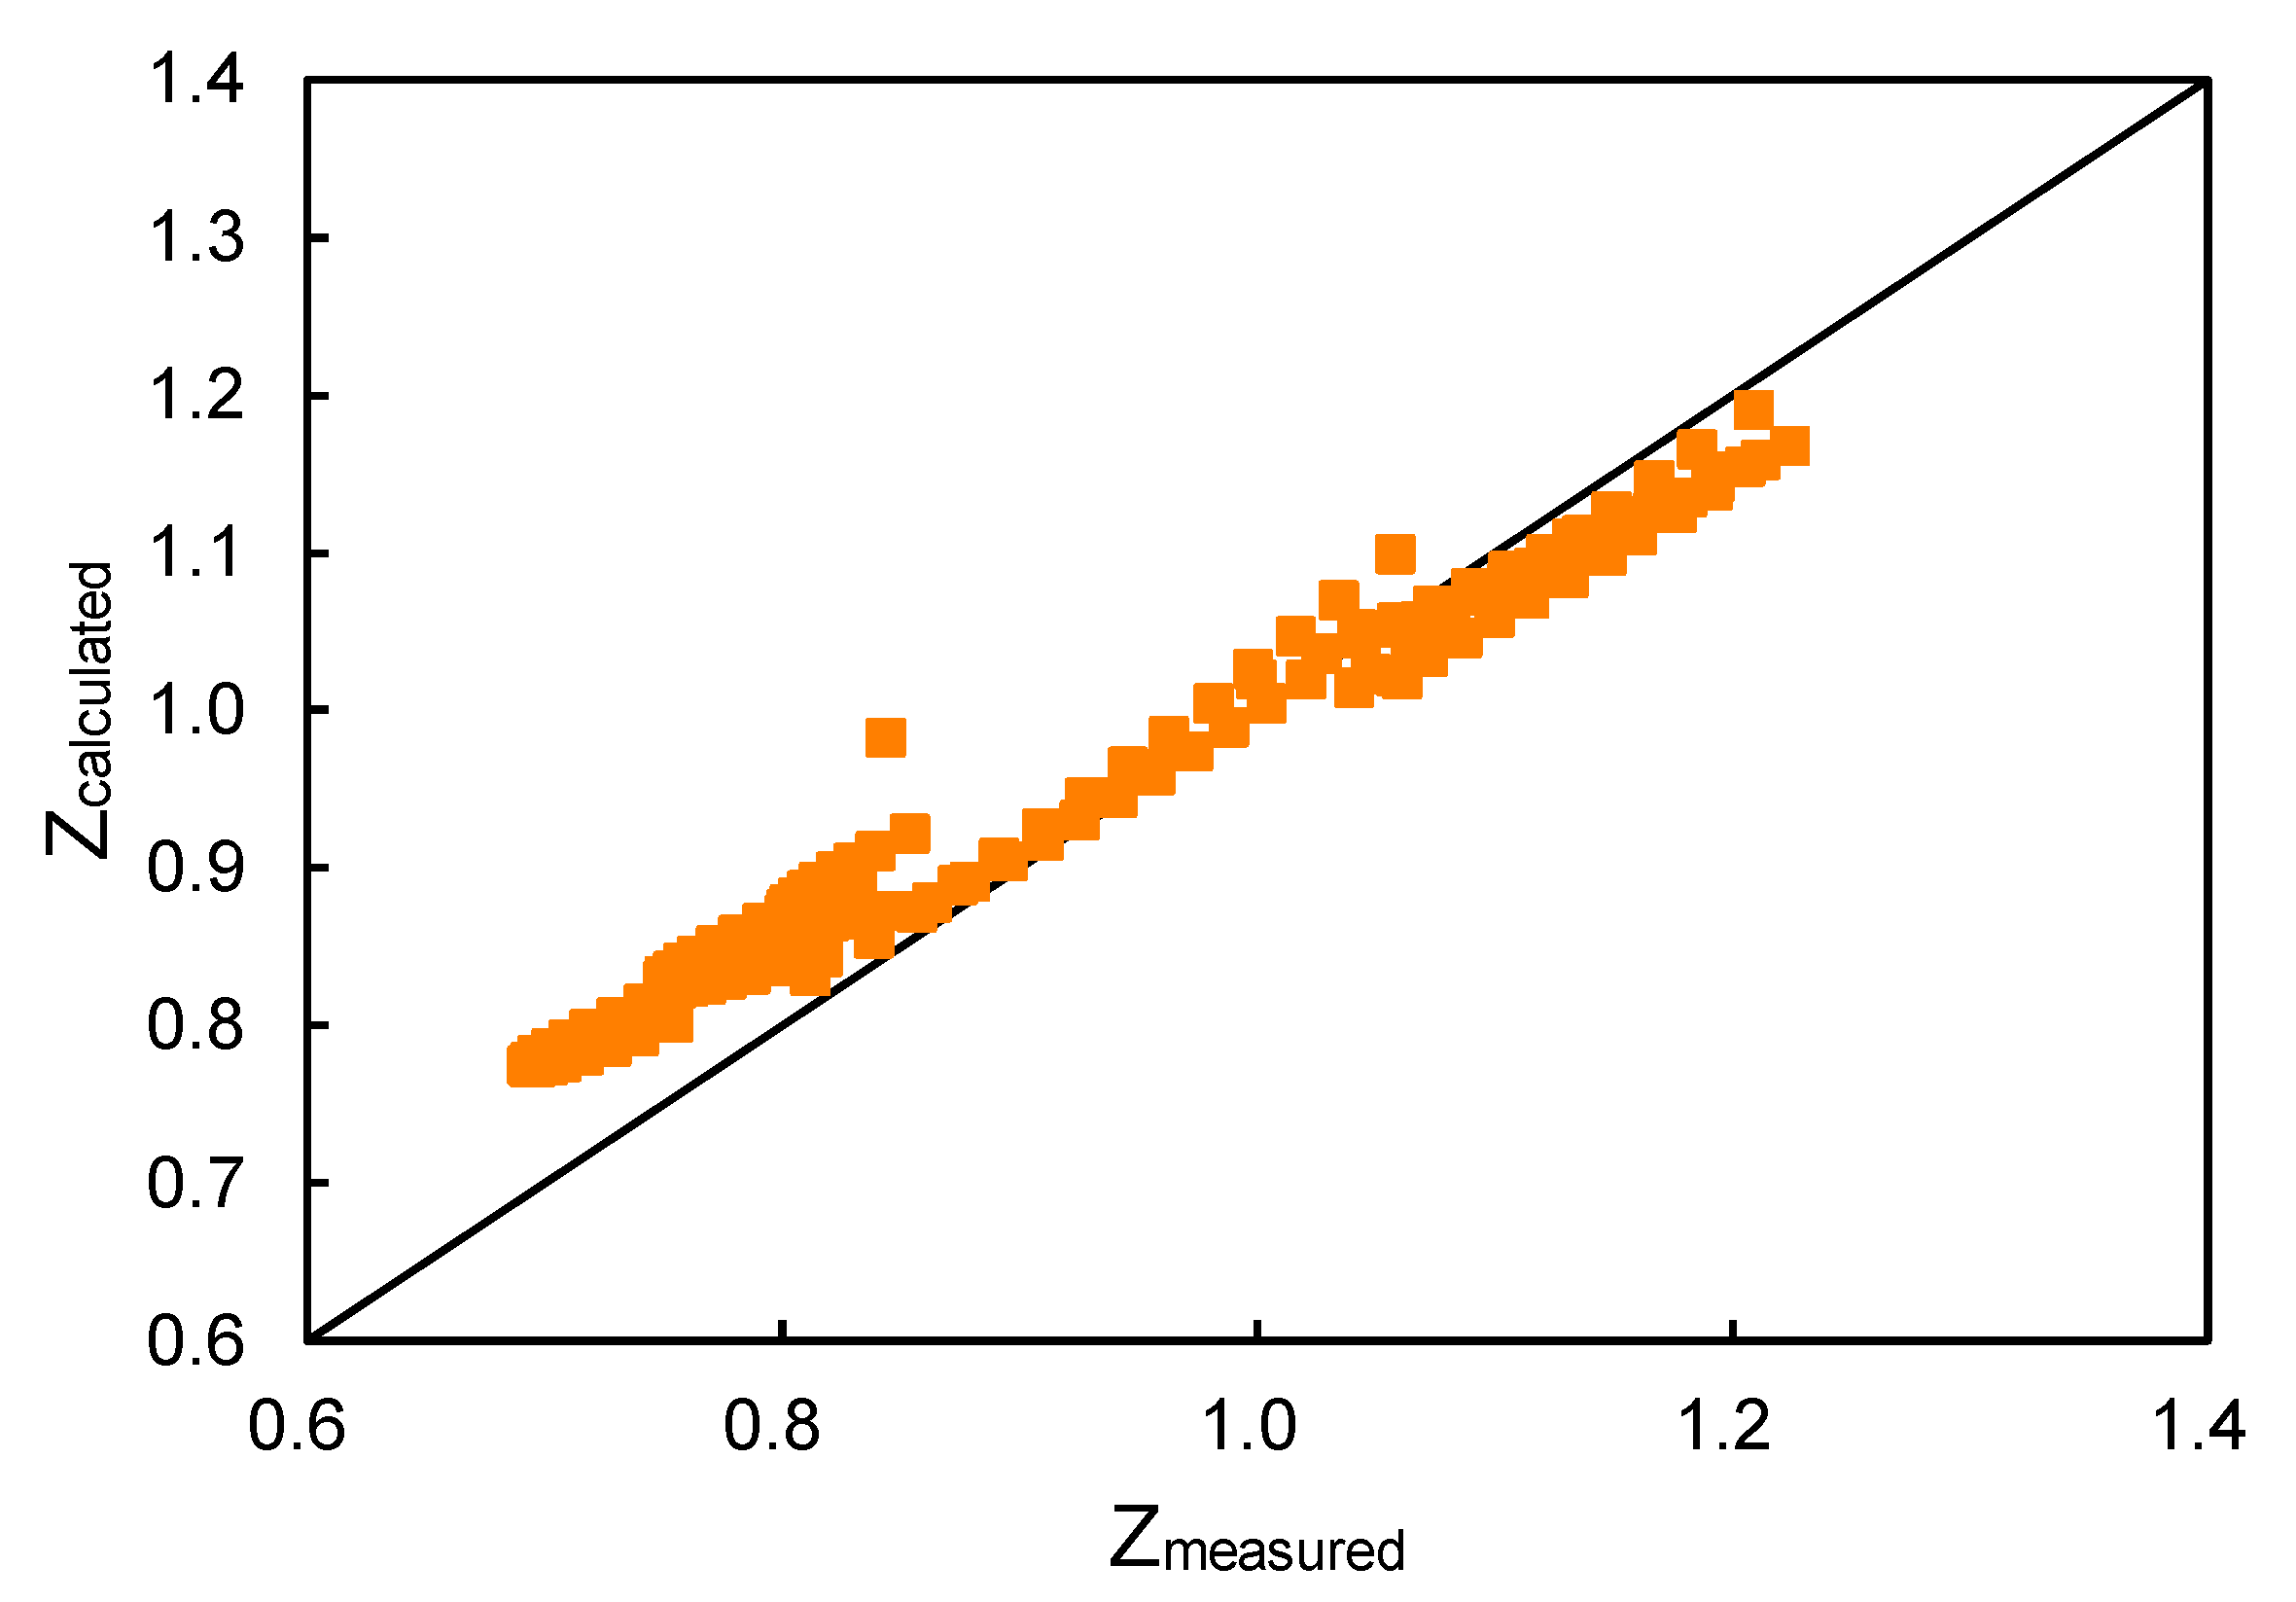
Figure 1. The correlation can predict 90% of the data points accurately by assuming an acceptable error of 10%, while the other three methods predict fewer than 80% of the data points. The cross plot of the calculated and measured compressibility factors of the correlation proposed in this paper is shown in
Figure 2. Compressibility factors predicted by the correlation proposed in this paper have a reasonably good agreement with the experimental results. Therefore, the correlation proposed in this paper is the most accurate of the four empirical correlations.
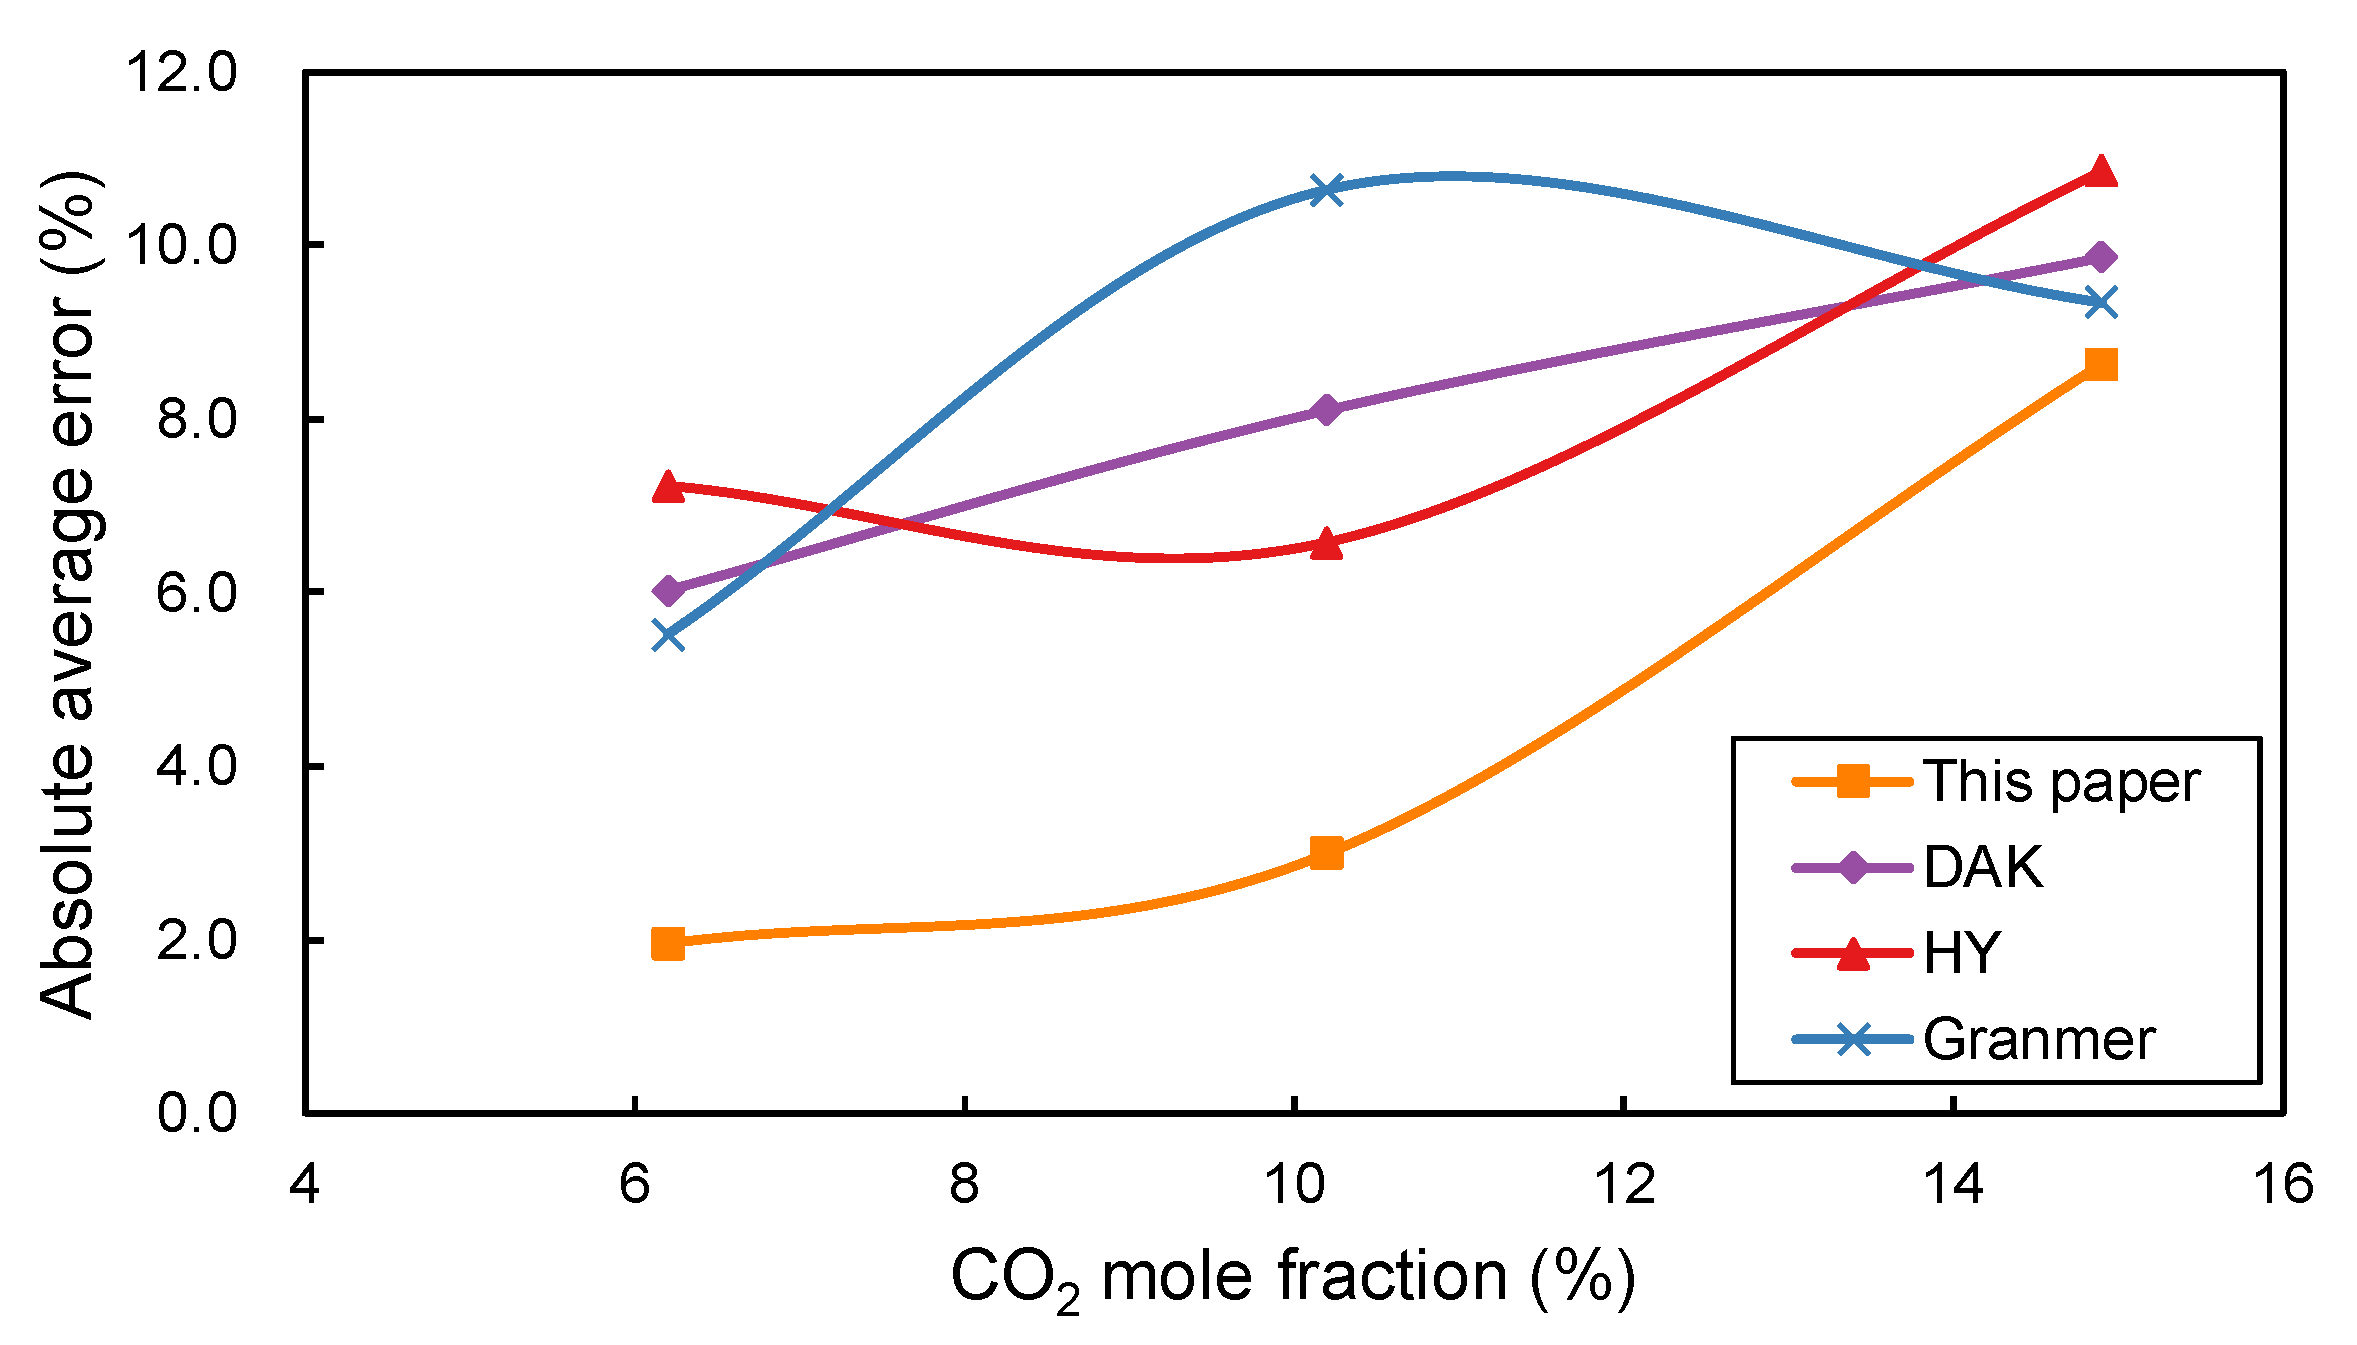
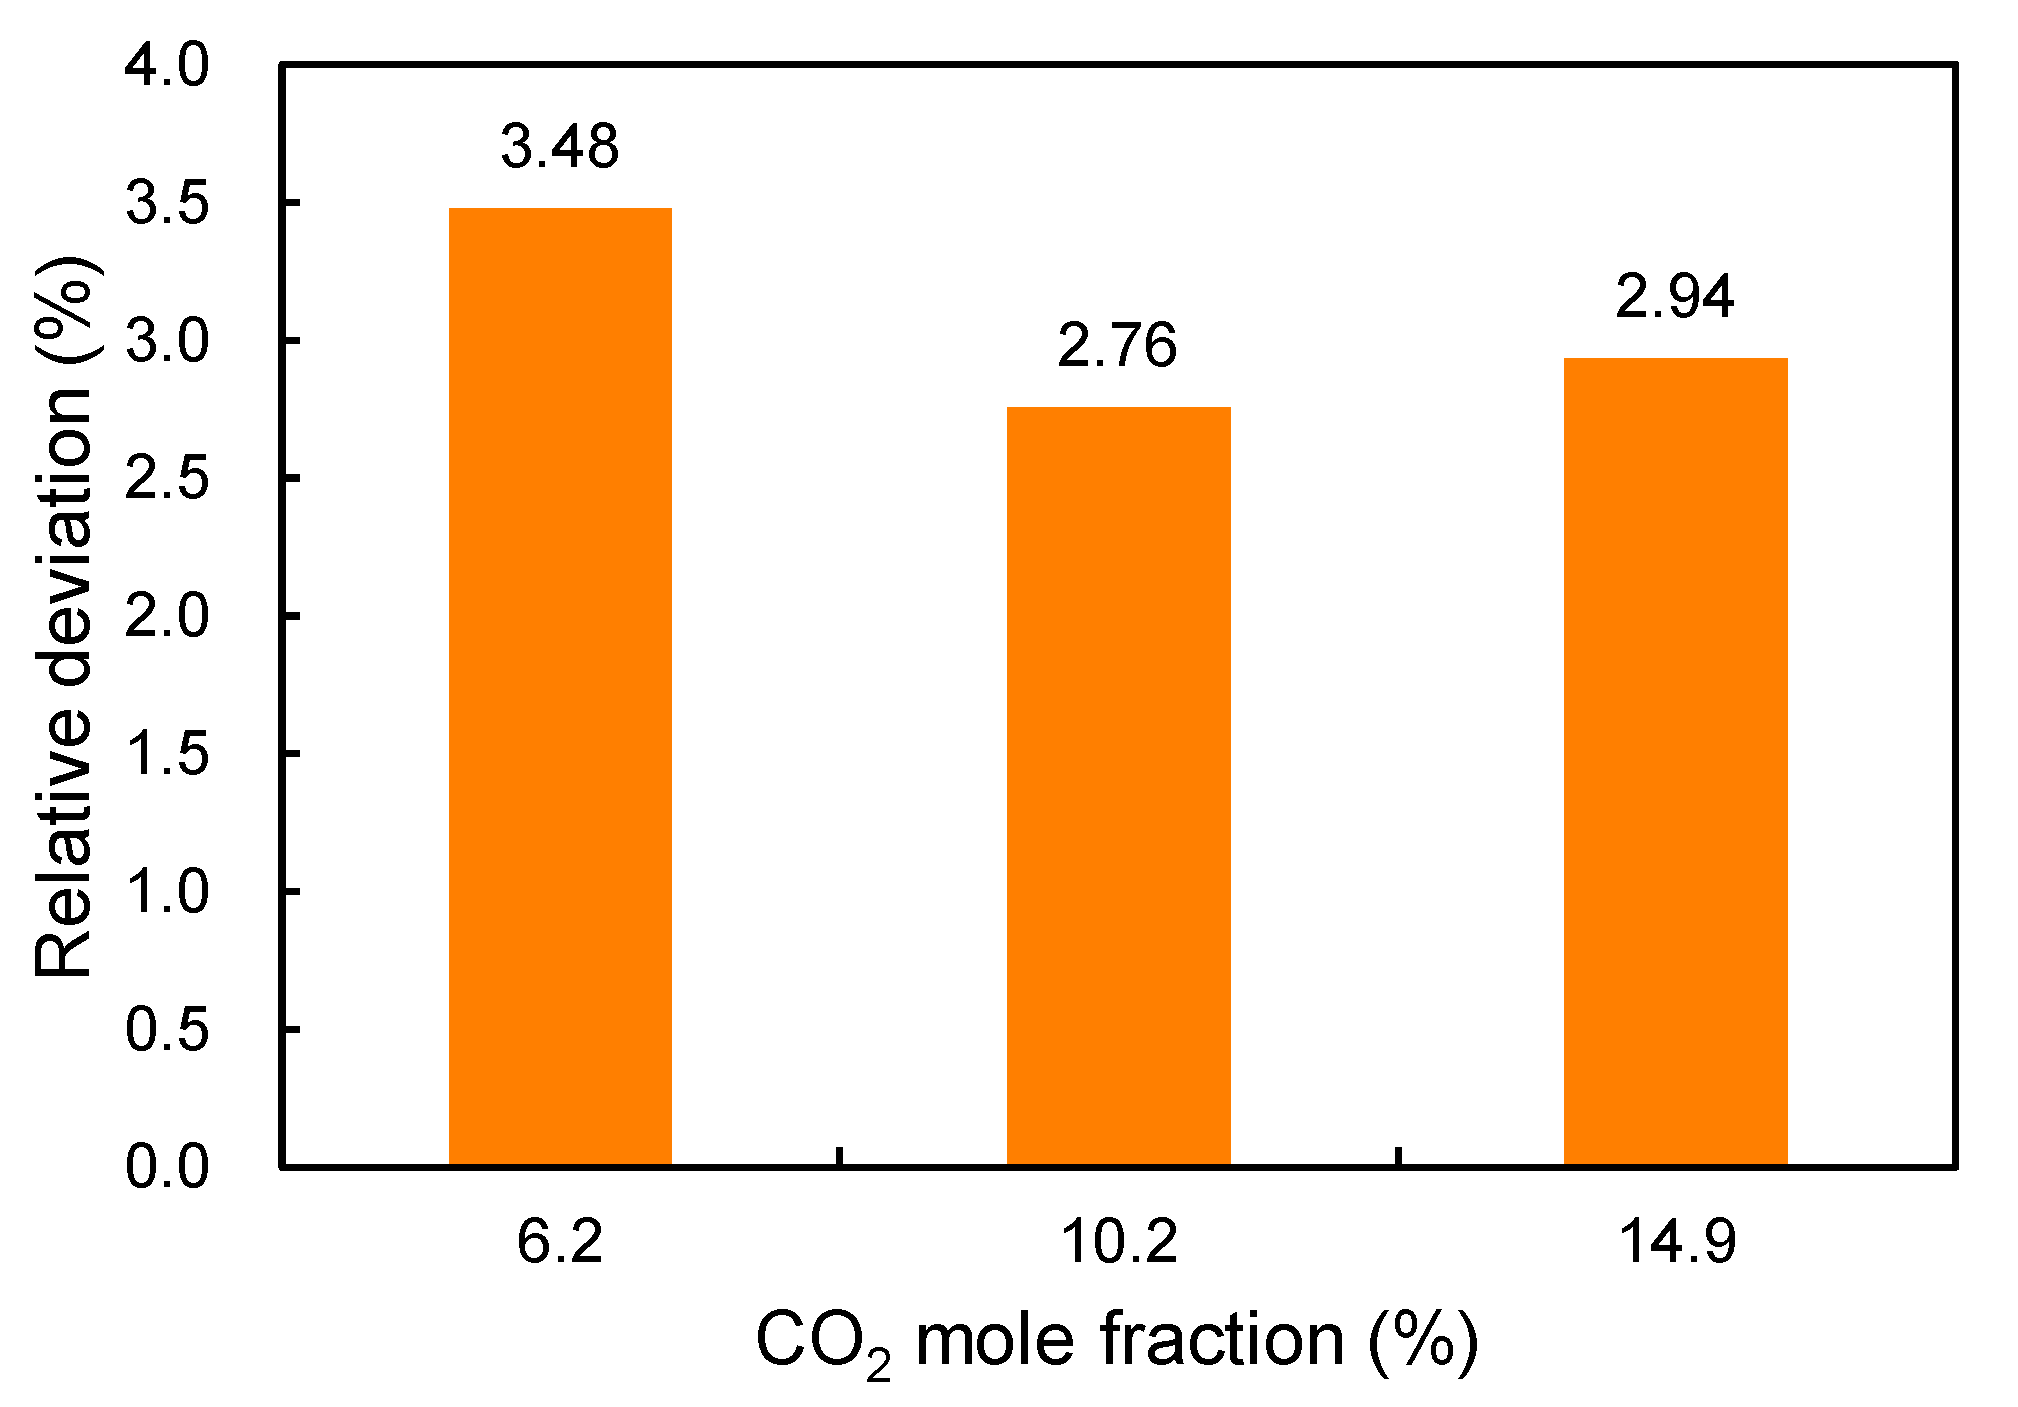
In addition,
Figure 3 shows the absolute average errors of the four empirical correlations versus the
mole fraction. In general, the errors increase with the increase in
content. Large errors are observed when the
mole fraction is larger than 10% for all four correlations. The correlation proposed in this paper has the smallest error when the
mole fraction is smaller than 10%.
3.2. Validation Data from the Literature
In this subsection, six different natural gas mixtures from the literature are utilized to validate the accuracy of the proposed correlations [
7,
22,
23,
24].
Table A5 summarizes the details of compositions of the six samples where the
contents vary from 9% to 89%. Some statistical parameters shown below are used to quantify the performance of the four empirical correlations.
Average relative error (
):
where
is the number of data points and
.
Average absolute relative error (
):
Root mean square error (
):
Coefficient of variation (
CV):
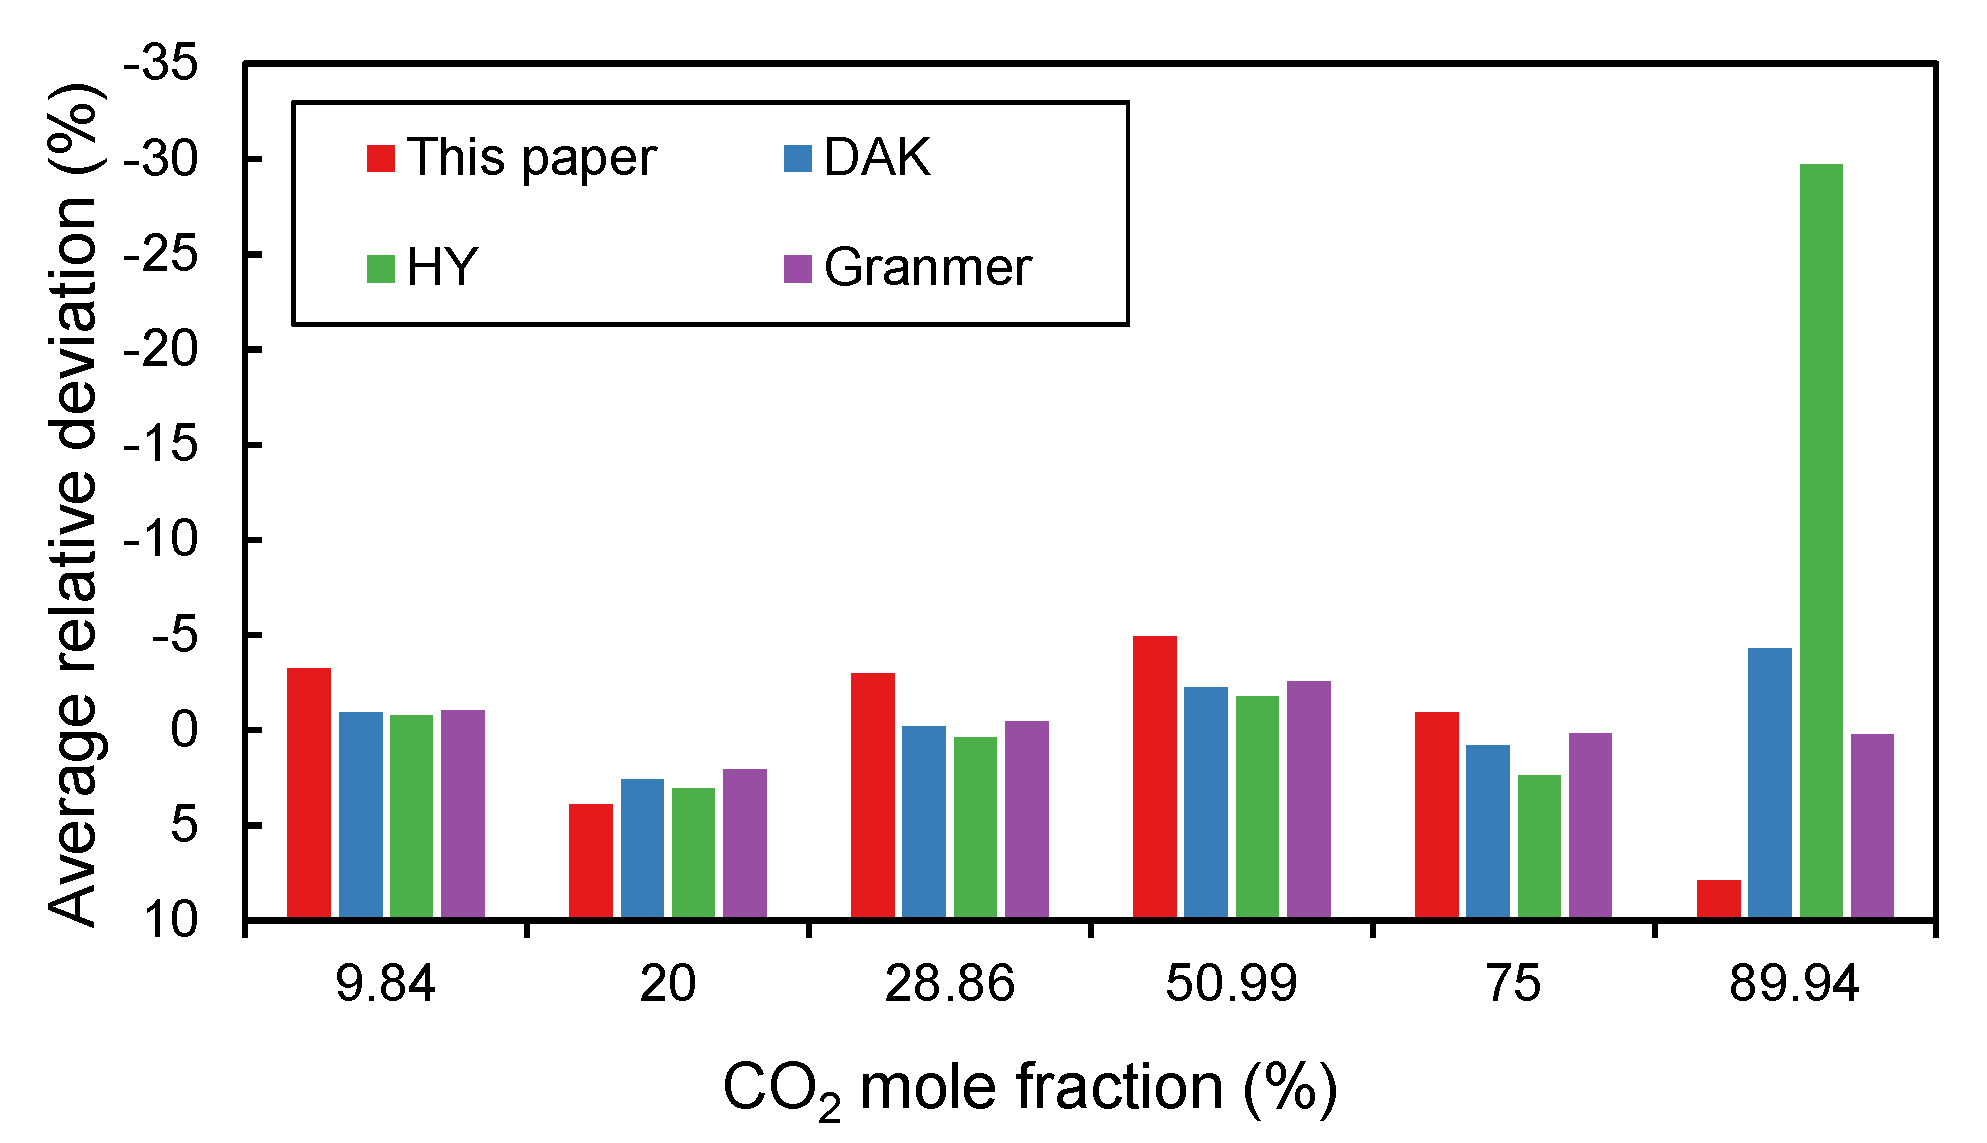
Figure 4 illustrates the average relative errors versus different
contents.
Table 3 summarizes the uncertainties of the four empirical correlations. All four correlations perform reasonably well for most samples. Among them, the DAK method and Granmer method are the best two methods for most samples where the relative errors do not exceed 5%. The correlation proposed in this paper has fewer errors in samples with large
contents and has the smallest coefficient of variation. The low value of the coefficient of variation indicates that the data have little variability and high stability. Therefore, the method proposed in this paper is the most stable one among the four empirical correlations. On the contrary, the HY method is the worst and has the largest average relative error and root mean square error in all samples.
3.3. The Influence on Dynamic Reserves Estimation
This section shows the influence of compressibility factors on the estimation of dynamic reserves by using a material balance equation in a real gas reservoir. Dynamic reserve is defined as the initial hydrocarbon in place that is determined by dynamic methods, compared to the static reserve determined by the traditional volumetric method [
25].
The material balance equation is able to estimate the initial gas in place [
26]. For a constant volume gas reservoir without a water influx, the material balance equation is simplified as [
27]:
where
is the cumulative gas production,
G is the dynamic gas reserve and subscript
i is the initial reservoir condition.
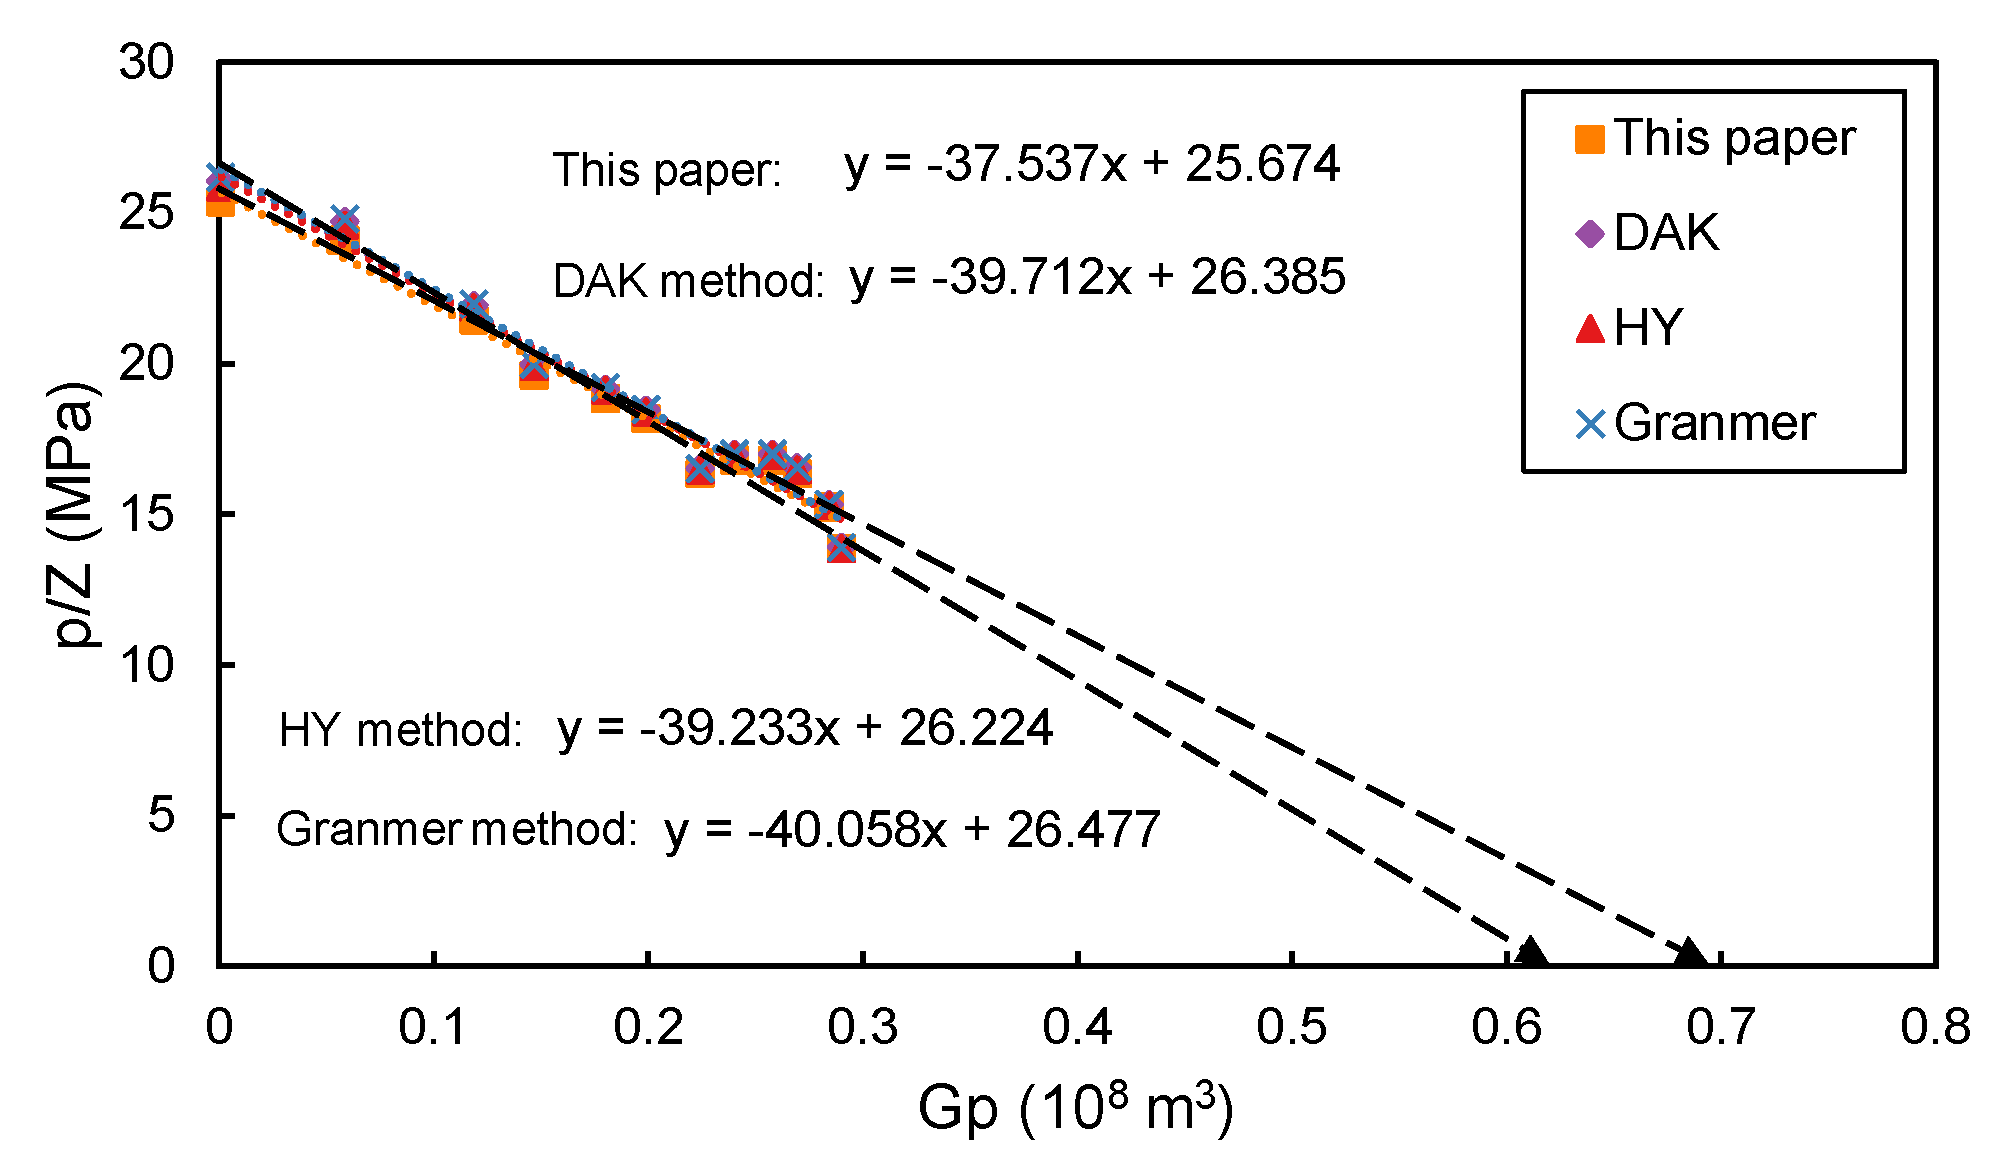
As shown in
Figure 5, pressure drop-down curves (
vs.
) are plotted where the intersection point of the curve with the X-axis is the estimated dynamic gas reserve. Gas compressibility factors are calculated from the four empirical correlations.
Well production data are taken from the H2 gas field, a small gas condensate reservoir surrounded by sealing faults. The H2 gas field has 10 wells and the initial reservoir pressure is about 30 MPa. Three wells are selected to calculate dynamic reserves and the production history data of well #1 are shown in
Table A6. Pressure drop-down curves are plotted in
Figure 5.
Table 4 reports the computed dynamic reserves of three wells. The maximum deviations among the four correlations are calculated:
where
and
are the estimated maximum and minimum dynamic reserves calculated from the four empirical correlations.
Even though the relative deviations of dynamic reserves estimated by the four correlations are small (about 3%), absolute deviations of dynamic reserves are large, for example, well #3 has
m
3 reserve deviation. This indicates that the compressibility factor does influence the estimation of dynamic reserves. In addition,
Figure 6 shows the effect of different
contents on the dynamic reserves calculation. There is no direct relationship between the
mole fraction and the estimated dynamic reserves.
4. Conclusions
In this study, a simple correlation is developed to increase the accuracy of calculating compressibility factors of natural gases with different contents. The advantage of the proposed correlation is that it is an explicit method and does not require an iterative process, which is demanded by the other three classical correlations. Compressibility factors calculated from the new correlation are compared with 202 experimental data measured from 9 natural gas mixtures. The proposed correlation has better statistical parameters and fewer uncertainties than the other three empirical correlations. The average error of the new correlation is less than 4%.
It is found that the relative errors increase with the increase in mole fraction. Compressibility factors affect the estimation of dynamic reserves and a total 3% reduction in reserve is observed, however, there is no direct relationship between the mole fraction and the dynamic reserves calculation.
The proposed correlation has limitations. The analysis of the results are only carried out based on the 202 experimental data. Even though the proposed correlation has small relative errors in these samples, it is still not sufficient to conclude that the correlation is accurate in all conditions. The proposed method is applicable to natural gases that contain high , but it cannot be applied to high-pressure and high-temperature conditions, where compressibility factors are generally larger than 2.0. It is clear that more accurate experimental data would give rise to more precisely tuned coefficients and prediction accuracy. Nevertheless, even though this work is not sufficient, it provides an alternative correlation in calculating compressibility factors with fewer uncertainties for engineers in the oil and gas industry.
In recent years, the AI-based methods have been popular in the oil and gas industry. They can easily calculate the basic petrophysical properties, for example, compressibility factors, viscosity, density, etc. Therefore, our future research directions include the development of an AI-based model in predicting thermodynamic parameters of natural gases. In addition, it is important to study the relationship between the fluid flow properties (e.g., permeability) and reservoir formation parameters by AI techniques.
Author Contributions
Conceptualization, C.W., A.J. and Z.G.; methodology, C.W.; software, C.W.; validation, C.W.; formal analysis, C.W., S.H. and X.S.; resources, A.J., Z.G. and F.C.; data curation, C.W.; writing—original draft preparation, C.W.; writing—review and editing, C.W., A.J. and Z.G.; visualization, C.W.; supervision, A.J. and Z.G.; project administration, A.J. and Z.G.; funding acquisition, A.J., Z.G. and F.C. All authors have read and agreed to the published version of the manuscript.
Funding
This research was funded by the scientific research and technological development project of China National Petroleum Corporation (No. 2021DJ1706).
Data Availability Statement
Not applicable.
Conflicts of Interest
The authors declare no conflict of interest.
Appendix A. Experimental Measured Compressibility Factors
This appendix shows the compositions of the natural gas mixtures from the H2 field and literature, the measured compressibility factors as well as the production history data of the H2 field.
Table A1.
Compositions of three condensate gas mixtures from three different wells in the H2 field, where the unit is the mole fraction (percentage).
Table A1.
Compositions of three condensate gas mixtures from three different wells in the H2 field, where the unit is the mole fraction (percentage).
| Component | Sample 1 | Sample 2 | Sample 3 |
|---|
| 6.165 | 10.184 | 14.893 |
| N2 | 0.269 | 0.485 | 1.034 |
| C1 | 67.499 | 70.704 | 63.68 |
| C2 | 13.945 | 11.461 | 9.899 |
| C3 | 6.896 | 4.126 | 5.855 |
| iC4 | 1.423 | 0.855 | 1.511 |
| nC4 | 1.858 | 0.963 | 1.814 |
| iC5 | 0.773 | 0.409 | 0.675 |
| nC5 | 0.449 | 0.255 | 0.393 |
| C6 | 0.563 | 0.374 | 0.225 |
| C7 | 0.134 | 0.146 | 0.017 |
| C8 | 0.026 | 0.038 | 0.004 |
| Total | 100 | 100 | 100 |
| Reservoir pressure (MPa) | 45.34 | 46.31 | 26.57 |
| Reservoir temperature (°C) | 150.54 | 150.23 | 116.28 |
| relative density | 0.82 | 0.82 | 0.77 |
| Gas oil ratio | 1552 | 3887 | 1685 |
Table A2.
Measured compressibility factors of sample 1 in the H2 field.
Table A2.
Measured compressibility factors of sample 1 in the H2 field.
| P (MPa) | Z (T = 150 °C) | P (MPa) | Z (T = 115 °C) | P (MPa) | Z (T = 80 °C) |
|---|
| 33.3 | 0.9999 | 32.7 | 0.8437 | 31.5 | 0.8117 |
| 35 | 1.027 | 34 | 0.8631 | 33 | 0.8388 |
| 36 | 1.0436 | 35 | 0.8791 | 34 | 0.8567 |
| 37 | 1.0587 | 36 | 0.8951 | 35 | 0.8739 |
| 38 | 1.0741 | 37 | 0.9098 | 36 | 0.8914 |
| 39 | 1.09 | 38 | 0.9255 | 37 | 0.9095 |
| 40 | 1.1054 | 39 | 0.9411 | 38 | 0.9276 |
| 41 | 1.1214 | 40 | 0.9569 | 39 | 0.9453 |
| 42 | 1.1371 | 41 | 0.9729 | 40 | 0.9631 |
| 43 | 1.1532 | 42 | 0.9882 | 41 | 0.9813 |
| 44 | 1.169 | 43 | 1.0039 | 42 | 0.9985 |
| 45.34 | 1.1909 | 44 | 1.0206 | 43 | 1.0164 |
| - | - | 45.34 | 1.042 | 44 | 1.0342 |
| - | - | - | - | 45.34 | 1.0579 |
Table A3.
Measured compressibility factors of sample 2 in the H2 field.
Table A3.
Measured compressibility factors of sample 2 in the H2 field.
| P (MPa) | Z (T = 150 °C) | P (MPa) | Z (T = 107 °C) | P (MPa) | Z (T = 75 °C) |
|---|
| 33.45 | 1.0604 | 35.76 | 1.061 | 36.47 | 1.0405 |
| 34 | 1.0692 | 36 | 1.0579 | 37 | 1.0477 |
| 35 | 1.0804 | 37 | 1.0717 | 38 | 1.0646 |
| 36 | 1.0921 | 38 | 1.086 | 39 | 1.0809 |
| 37 | 1.1047 | 39 | 1.0998 | 40 | 1.0977 |
| 38 | 1.117 | 40 | 1.1146 | 41 | 1.1163 |
| 39 | 1.128 | 41 | 1.1308 | 42 | 1.1325 |
| 40 | 1.1409 | 42 | 1.1469 | 43 | 1.1494 |
| 41 | 1.1533 | 43 | 1.1601 | 44 | 1.1674 |
| 42 | 1.1665 | 44 | 1.1762 | 45 | 1.1851 |
| 43 | 1.1807 | 45 | 1.1917 | 46.31 | 1.2092 |
| 44 | 1.1925 | 46.31 | 1.212 | - | - |
| 45 | 1.2057 | - | - | - | - |
| 46.31 | 1.2244 | - | - | - | - |
Table A4.
Measured compressibility factors of sample 3 in the H2 field.
Table A4.
Measured compressibility factors of sample 3 in the H2 field.
| P (MPa) | Z (T = 116 °C) | P (MPa) | Z (T = 91 °C) | P (MPa) | Z (T = 66 °C) |
|---|
| 9 | 0.8476 | 8 | 0.8168 | 27 | 0.8316 |
| 10 | 0.8365 | 9 | 0.8001 | 8 | 0.7539 |
| 11 | 0.8272 | 10 | 0.787 | 9 | 0.74 |
| 12 | 0.8196 | 11 | 0.7766 | 10 | 0.7281 |
| 13 | 0.813 | 12 | 0.7681 | 11 | 0.717 |
| 14 | 0.8081 | 13 | 0.7607 | 12 | 0.7076 |
| 15 | 0.8053 | 14 | 0.7556 | 13 | 0.7012 |
| 16 | 0.8025 | 15 | 0.7524 | 14 | 0.6968 |
| 17 | 0.8014 | 16 | 0.7501 | 15 | 0.6937 |
| 18 | 0.802 | 17 | 0.75 | 16 | 0.693 |
| 19 | 0.8035 | 18 | 0.7507 | 17 | 0.6942 |
| 20 | 0.8067 | 19 | 0.754 | 18 | 0.6975 |
| 21 | 0.8105 | 20 | 0.7583 | 19 | 0.703 |
| 22 | 0.8158 | 21 | 0.7641 | 20 | 0.7102 |
| 23 | 0.823 | 22 | 0.7723 | 21 | 0.7186 |
| 24 | 0.8302 | 23 | 0.7814 | 22 | 0.7303 |
| 25 | 0.8392 | 24 | 0.7917 | 23 | 0.742 |
| 26.576 | 0.8541 | 25 | 0.804 | 24 | 0.7558 |
| - | - | 26.576 | 0.8243 | 25 | 0.7725 |
| - | - | - | - | 26.2 | 0.7925 |
| - | - | - | - | 26.576 | 0.8006 |
Table A5 shows the gas compositions of the six nature gas mixtures from the literature.
Table A6 shows the production history data for well #1.
Table A5.
Compositions of the six natural gas mixtures from the literature to validate the four empirical correlations, where samples 1–3 are taken from Bian et al. [
7] and samples 4–6 are from Rushing et al. [
22], Adisoemarta et al. [
23], Simon et al. [
24], respectively.
Table A5.
Compositions of the six natural gas mixtures from the literature to validate the four empirical correlations, where samples 1–3 are taken from Bian et al. [
7] and samples 4–6 are from Rushing et al. [
22], Adisoemarta et al. [
23], Simon et al. [
24], respectively.
| Component | Sample 1 | Sample 2 | Sample 3 | Sample 4 | Sample 5 | Sample 6 |
|---|
| 0.0984 | 0.2886 | 0.5099 | 0.2 | 0.75 | 0.8994 |
| N2 | 0.0205 | 0.0124 | 0.0083 | 0 | 0 | 0.0004 |
| C1 | 0.8602 | 0.6773 | 0.4654 | 0.768 | 0.242 | 0.0944 |
| C2 | 0.0167 | 0.0159 | 0.0116 | 0.024 | 0.007 | 0.0021 |
| C3 | 0.0031 | 0.0042 | 0.0033 | 0.008 | 0.001 | 0.001 |
| iC4 | 0.0004 | 0.0006 | 0.0005 | 0 | 0.001 | 0 |
| nC4 | 0.0005 | 0.0007 | 0.0006 | 0 | 0 | 0.0006 |
| iC5 | 0.0001 | 0.0003 | 0.0002 | 0 | 0 | 0 |
| nC5 | – | 0.0001 | 0.0001 | 0 | 0 | 0.0005 |
| C6 | 0.0001 | – | – | 0 | 0 | 0.0016 |
| Total | 1 | 1 | 1 | 1 | 1 | 1 |
Table A6.
Production history data of well #1.
Table A6.
Production history data of well #1.
| Time | Cumulative Production Volume (108 m3) | Pressure (MPa) |
|---|
| 2010.01 | 0.0008 | 24 |
| 2010.06 | 0.0585 | 22.6 |
| 2011.01 | 0.1189 | 19.79 |
| 2011.06 | 0.1470 | 17.94 |
| 2012.01 | 0.1798 | 17.2 |
| 2012.06 | 0.1991 | 16.55 |
| 2013.01 | 0.2239 | 14.81 |
| 2013.06 | 0.2399 | 15.23 |
| 2014.01 | 0.2578 | 15.24 |
| 2014.06 | 0.2693 | 14.83 |
| 2015.01 | 0.2844 | 13.78 |
| 2015.06 | 0.2899 | 12.52 |
| 2016.01 | 0.3020 | 13.83 |
| 2016.06 | 0.3094 | 13.79 |
References
- Elsharkawy, A.; Aladwani, F.; Alostad, N.A. Uncertainty in sour gas viscosity estimation and its impact on inflow performance and production forecasting. J. Nat. Gas Sci. Eng. 2015, 26, 1363–1371. [Google Scholar] [CrossRef]
- Heidaryan, E.; Moghadasi, J.; Rahimi, M. New correlations to predict natural gas viscosity and compressibility factor. J. Pet. Sci. Eng. 2010, 73, 67–72. [Google Scholar] [CrossRef]
- Hamza, A.; Hussein, I.A.; Al-Marri, M.J.; Mahmoud, M.; Shawabkeh, R.; Aparicio, S. CO2 enhanced gas recovery and sequestration in depleted gas reservoirs: A review. J. Pet. Sci. Eng. 2021, 196, 107685. [Google Scholar] [CrossRef]
- Zhang, X.; Yang, S.; Li, G.; Li, W.; Chen, H. Compressibility factor of gas with high content of CO2 in Changshen gas reservoir. In Proceedings of the International Conference on Computational and Information Sciences, Chengdu, China, 21–23 October 2011; pp. 542–545. [Google Scholar] [CrossRef]
- Li, Z.; Jia, W.; Li, C. An improved PR equation of state for CO2-containing gas compressibility factor calculation. J. Nat. Gas Sci. Eng. 2016, 36, 586–596. [Google Scholar] [CrossRef]
- Standing, M.; Katz, D. Density of natural gases. Trans. AIME 1942, 146, 140–149. [Google Scholar] [CrossRef]
- Bian, X.; Du, Z.; Tang, Y.; Du, J. Measurement and correlation of compressibility factor of high CO2-content natural gas. J. Pet. Sci. Eng. 2012, 82–83, 38–43. [Google Scholar] [CrossRef]
- Yan, K.L.; Liu, H.; Sun, C.Y.; Ma, Q.L.; Chen, G.J.; Shen, D.J.; Xiao, X.J.; Wang, H.Y. Measurement and calculation of gas compressibility factor for condensate gas and natural gas under pressure up to 116 MPa. J. Chem. Thermodyn. 2013, 63, 38–43. [Google Scholar] [CrossRef]
- Jaubert, J.N.; Privat, R.; Mutelet, F. Predicting the phase equilibria of synthetic petroleum fluids with the PPR78 approach. AIChE J. 2010, 56, 3225–3235. [Google Scholar] [CrossRef]
- Shariati, A.; Peters, C.J.; Moshfeghian, M. Further evaluation of the Shariati–Peters–Moshfeghian C7+ characterization method. Fluid Phase Equilibria 2001, 179, 23–41. [Google Scholar] [CrossRef]
- Hall, K.R.; Yarborough, L. A new equation of state for Z-factor calculations. Oil Gas J. 1973, 71, 82–90. [Google Scholar]
- Dranchuk, P.M.; Abou-Kassem, J.H. Calculation of Z Factor for Natural Gases Using Equation of State. J. Can. Pet. Technol. 1975, 14, 34–36. [Google Scholar] [CrossRef]
- Heidaryan, E.; Salarabadi, A.; Moghadasi, J. A novel correlation approach for prediction of natural gas compressibility factor. J. Nat. Gas Chem. 2010, 19, 189–192. [Google Scholar] [CrossRef]
- Sanjari, E.; Lay, E.N. Estimation of natural gas compressibility factors using artificial neural network approach. J. Nat. Gas Sci. Eng. 2012, 9, 220–226. [Google Scholar] [CrossRef]
- Khosravi, A.; Machado, L.; Nunes, R.O. Estimation of density and compressibility factor of natural gas using artificial intelligence approach. J. Pet. Sci. Eng. 2018, 168, 201–216. [Google Scholar] [CrossRef]
- Liu, H.; Wu, Y.; Guo, P.; Liu, Z.; Wang, Z.; Chen, S.; Wang, B.; Huang, Z. Compressibility factor measurement and simulation of five high-temperature ultra-high-pressure dry and wet gases. Fluid Phase Equilibria 2019, 500, 112256. [Google Scholar] [CrossRef]
- Hamada, G.M. Effect of Non-hydrocarbon components on Gas Compressibility Factor Values and Correlations. J. Appl. Biotechnol. Bioeng. 2017, 2, 124–134. [Google Scholar] [CrossRef] [Green Version]
- Fayazi, A.; Arabloo, M.; Mohammadi, A.H. Efficient estimation of natural gas compressibility factor using a rigorous method. J. Nat. Gas Sci. Eng. 2013, 16, 8–17. [Google Scholar] [CrossRef]
- Wichert, E.; Aziz, K. Calculate Z’s for sour gases. Hydrocarb. Process. 1972, 51, 119–122. [Google Scholar]
- Wang, X.; Economides, M. Advanced Natural Gas Engineering; Elsevier: Amsterdam, The Netherlands, 2010; pp. 1–368. [Google Scholar] [CrossRef]
- Poettman, F.; Carpenter, P. The Multiphase Flow of Gas, Oil, and Water through Vertical Flow Strings with Application to the Design of Gas-Lift Installations. Drill. Prod. Pract. 1952, 17, 257–263. [Google Scholar]
- Rushing, J.A.; Newsham, K.E.; Van Fraassen, K.C.; Mehta, S.A.; Moore, G.R. Natural Gas z-factors at HP/HT Reservoir Conditions: Comparing Laboratory Measurements with Industry-Standard Correlations for a Dry Gas. Soc. Pet. Eng.—SPE Gas Technol. Symp. 2008, 1, 265–281. [Google Scholar] [CrossRef]
- Adisoemarta, P.S.; Frailey, S.M.; Lawal, A.S. Measured Z-Factor of CO2–Dry Gas/Wet Gas/Gas Condensates for CO2 Storage in Depleted Gas Reservoirs. In Proceedings of the SPE Symposium on Improved Oil Recovery, Tulsa, OK, USA, 12–16 April 2004. [Google Scholar] [CrossRef]
- Simon, R.; Fesmire, C.J.; Dicharry, R.M.; Vorhis, F.H. Compressibility Factors for CO2-Methane Mixtures. J. Pet. Technol. 1977, 29, 81–85. [Google Scholar] [CrossRef]
- Sun, H. Fundamentals of Advanced Production Decline Analysis. In Advanced Production Decline Analysis and Application; Gulf Professional Publishing: Cambridge, MA, USA, 2015; pp. 1–29. [Google Scholar] [CrossRef]
- Ambastha, A.K. Analysis of Material Balance Equations for Gas Reservoirs. Annu. Tech. Meet. 1990, 361–367. [Google Scholar] [CrossRef]
- Zhang, L.; He, Y.; Guo, C.; Yu, Y. Dynamic Material Balance Method for Estimating Gas in Place of Abnormally High-Pressure Gas Reservoirs. Lithosphere 2021, 2021, 6669012. [Google Scholar] [CrossRef]
| Disclaimer/Publisher’s Note: The statements, opinions and data contained in all publications are solely those of the individual author(s) and contributor(s) and not of MDPI and/or the editor(s). MDPI and/or the editor(s) disclaim responsibility for any injury to people or property resulting from any ideas, methods, instructions or products referred to in the content. |
© 2022 by the authors. Licensee MDPI, Basel, Switzerland. This article is an open access article distributed under the terms and conditions of the Creative Commons Attribution (CC BY) license (https://creativecommons.org/licenses/by/4.0/).


