Article

Evaluation of Water Inrush Hazard in Coal Seam Roof Based on the AHP-CRITIC Composite Weighted Method

1
College of Geology and Environment, Xi’an University of Science and Technology, Xi’an 710054, China
2
Shaanxi Provincial Key Laboratory of Geological Support for Coal Green Exploitation, Xi’an 710054, China
3
Shandong Energy Zibo Mining Group Co., Ltd., Jinan 255100, China
*
Author to whom correspondence should be addressed.
Energies 2023, 16(1), 114; https://doi.org/10.3390/en16010114
Submission received: 29 October 2022 / Revised: 19 December 2022 / Accepted: 19 December 2022 / Published: 22 December 2022
(This article belongs to the Section B: Energy and Environment)

Abstract

:
The more complex the hydrogeological conditions of a mine, the more likely the coal seam is to experience water inrush during the mining process, and the greater the degree of the water inrush hazard. The scientific and reasonable prediction of water inrush in mines with complex hydrogeological conditions is of great significance to the safe and efficient operation of coal mines. Taking the roof water inrush problem of the No. 3 lower coal seam in the Jisan Coal Mine as the research object, the factors affecting the roof water inrush of the coal seam were comprehensively considered from three aspects: the aquifer property, the mining fracture development and the geological structure. The evaluation index system was constructed by selecting 10 factors, including the aquifer depth and thickness, core recovery rate, brittle–plastic rock thickness ratio, number of water-resisting layers, development height of the water-conducting fracture zone, fault density, frequency density, scale index and variation coefficient of the coal seam floor dip angle. At the same time, based on the dual influence of subjective and objective weighting, the scientific and reasonable weight of each factor was ensured. The AHP-CRITIC composite weighting method was used to calculate the comprehensive weight of each factor. Finally, the roof water inrush risk prediction model was constructed. According to the prediction results, the study area was divided into a low-risk area, medium-risk area and high-risk area. Compared with the actual situation, the prediction results were basically consistent with the actual situation, and the prediction results can provide the basis for the prevention and control of water in a coal mine.

1. Introduction

Roof water inrush is one of the most important and frequent forms of water disaster in the process of coal mining [1,2,3]. Scientific and effective research on coal mine water disaster has very important guiding significance for coal mine water prevention and control. Many scholars have achieved fruitful results on the basis of a large volume of theoretical and practical research [4,5,6,7,8]. Academician Liu Tianquan put forward the theory of the “upper three zones”, which divides the overlying strata into the caving zone, fracture zone and overall bending subsidence zone. The sum of the height of the caving zone and fracture zone is the height of the water-conducting fracture zone. After a significant amount of practical research, the empirical formula for calculating the height of the water-conducting fracture zone was summarized [9]. This theory is currently the main theoretical basis for studying roof water inrush in China. Professor Gao Yanfa proposed the ‘four-zone’ model of rock movement; that is, roof rock movement is divided into the fracture zone, separation zone, bending zone and loose alluvial zone [10]. This theory first proposed the mechanism of water occurring from roof separation and broadened the understanding of the mechanism of roof water inrush. Academician Qian Minggao put forward the key strata theory on the basis of an in-depth study of mine pressure and rock strata, which further broadened the understanding of the seepage mechanism. Based on the principle of composite superposition of multi-source geological information [11], academician Wu Qiang proposed the ‘three maps-double prediction’ method, which made the factors affecting roof water inrush quantitative analysis and the prediction results more scientific and reasonable [12,13]. At present, research by many scholars has been mostly based on the above theoretical methods, and they suggest different improvements for different conditions, resulting in research on roof water inrush becoming more developed [14,15,16,17,18,19]. For example, Liu et al. [20] used the EM-AHP two-factor model to analyze and process the data of the main controlling factors, and they used ArcGIS to predict the dangerous area of water inrush from a coal seam roof. At the same time, the numerical simulation method was used to verify the prediction results, so as to obtain the final results of water inrush risk in the study area. Gao et al. [21] used IAHP-EWM to evaluate the roof water inrush in the Liangshuijing Coal Mine. The evaluation results were consistent with the actual water inflow data distribution, which verified the accuracy of the evaluation model. Liu et al. [22] proposed a risk assessment method of roof water inrush by using fuzzy and catastrophe theories according to the characteristics of fuzziness and the variability of roof water inrush, and successfully predicted the risk of water inrush in the first mining face of the Jinjitan Coal Mine.
Although increasingly more methods have been used to study the problem of roof water inrush, each method has its own advantages and disadvantages. Knowing how to choose a method by which to delineate the danger zone of roof water inrush and effectively evaluate the danger of a coal seam roof water disaster is required. At the same time, with the continuous deepening of the coal seam mining level and mining depth, the geological conditions of coal mines are becoming more and more complex, resulting in a more complex and diverse influence system of roof water inrush. When roof water inrush occurs, the greater the amount of water inrush, the greater the harm [23,24,25]. Therefore, scientific and reasonable predictions of roof water inrush risk have become an indispensable part of coal mine water control work.
Based on current research on roof water inrush and the actual mining status of the mine, this paper proposes a composite weighted prediction model based on AHP-CRITIC to predict the risk of roof water inrush. AHP is a subjective weighting method that relies on the experience of experts. In the analysis process, the correlation of influencing factors is usually not considered. CRITIC is an objective weighting method, which relies too much on the index data in the analysis process and ignores the actual situation. It is possible to obtain results that are contrary to the actual situation. Therefore, the combination of the subjective weighting method and the objective weighting method makes the index weight more scientific and reasonable, so that the final prediction results are closer to reality. In addition, the complexity of the geological conditions of the mine increases influencing factors, and there is a certain correlation between these factors. Compared with other commonly used objective weighting methods, such as the entropy weight method and coefficient of variation method, CRITIC not only considers the difference in index value, but also considers the correlation between the indices, so it is more suitable for the prediction of roof water inrush risk under complex conditions. Based on this, taking the coal seam roof in the Jisan No. 3 coal mine as the research object, we used the AHP-CRITIC model to predict water inrush risk.

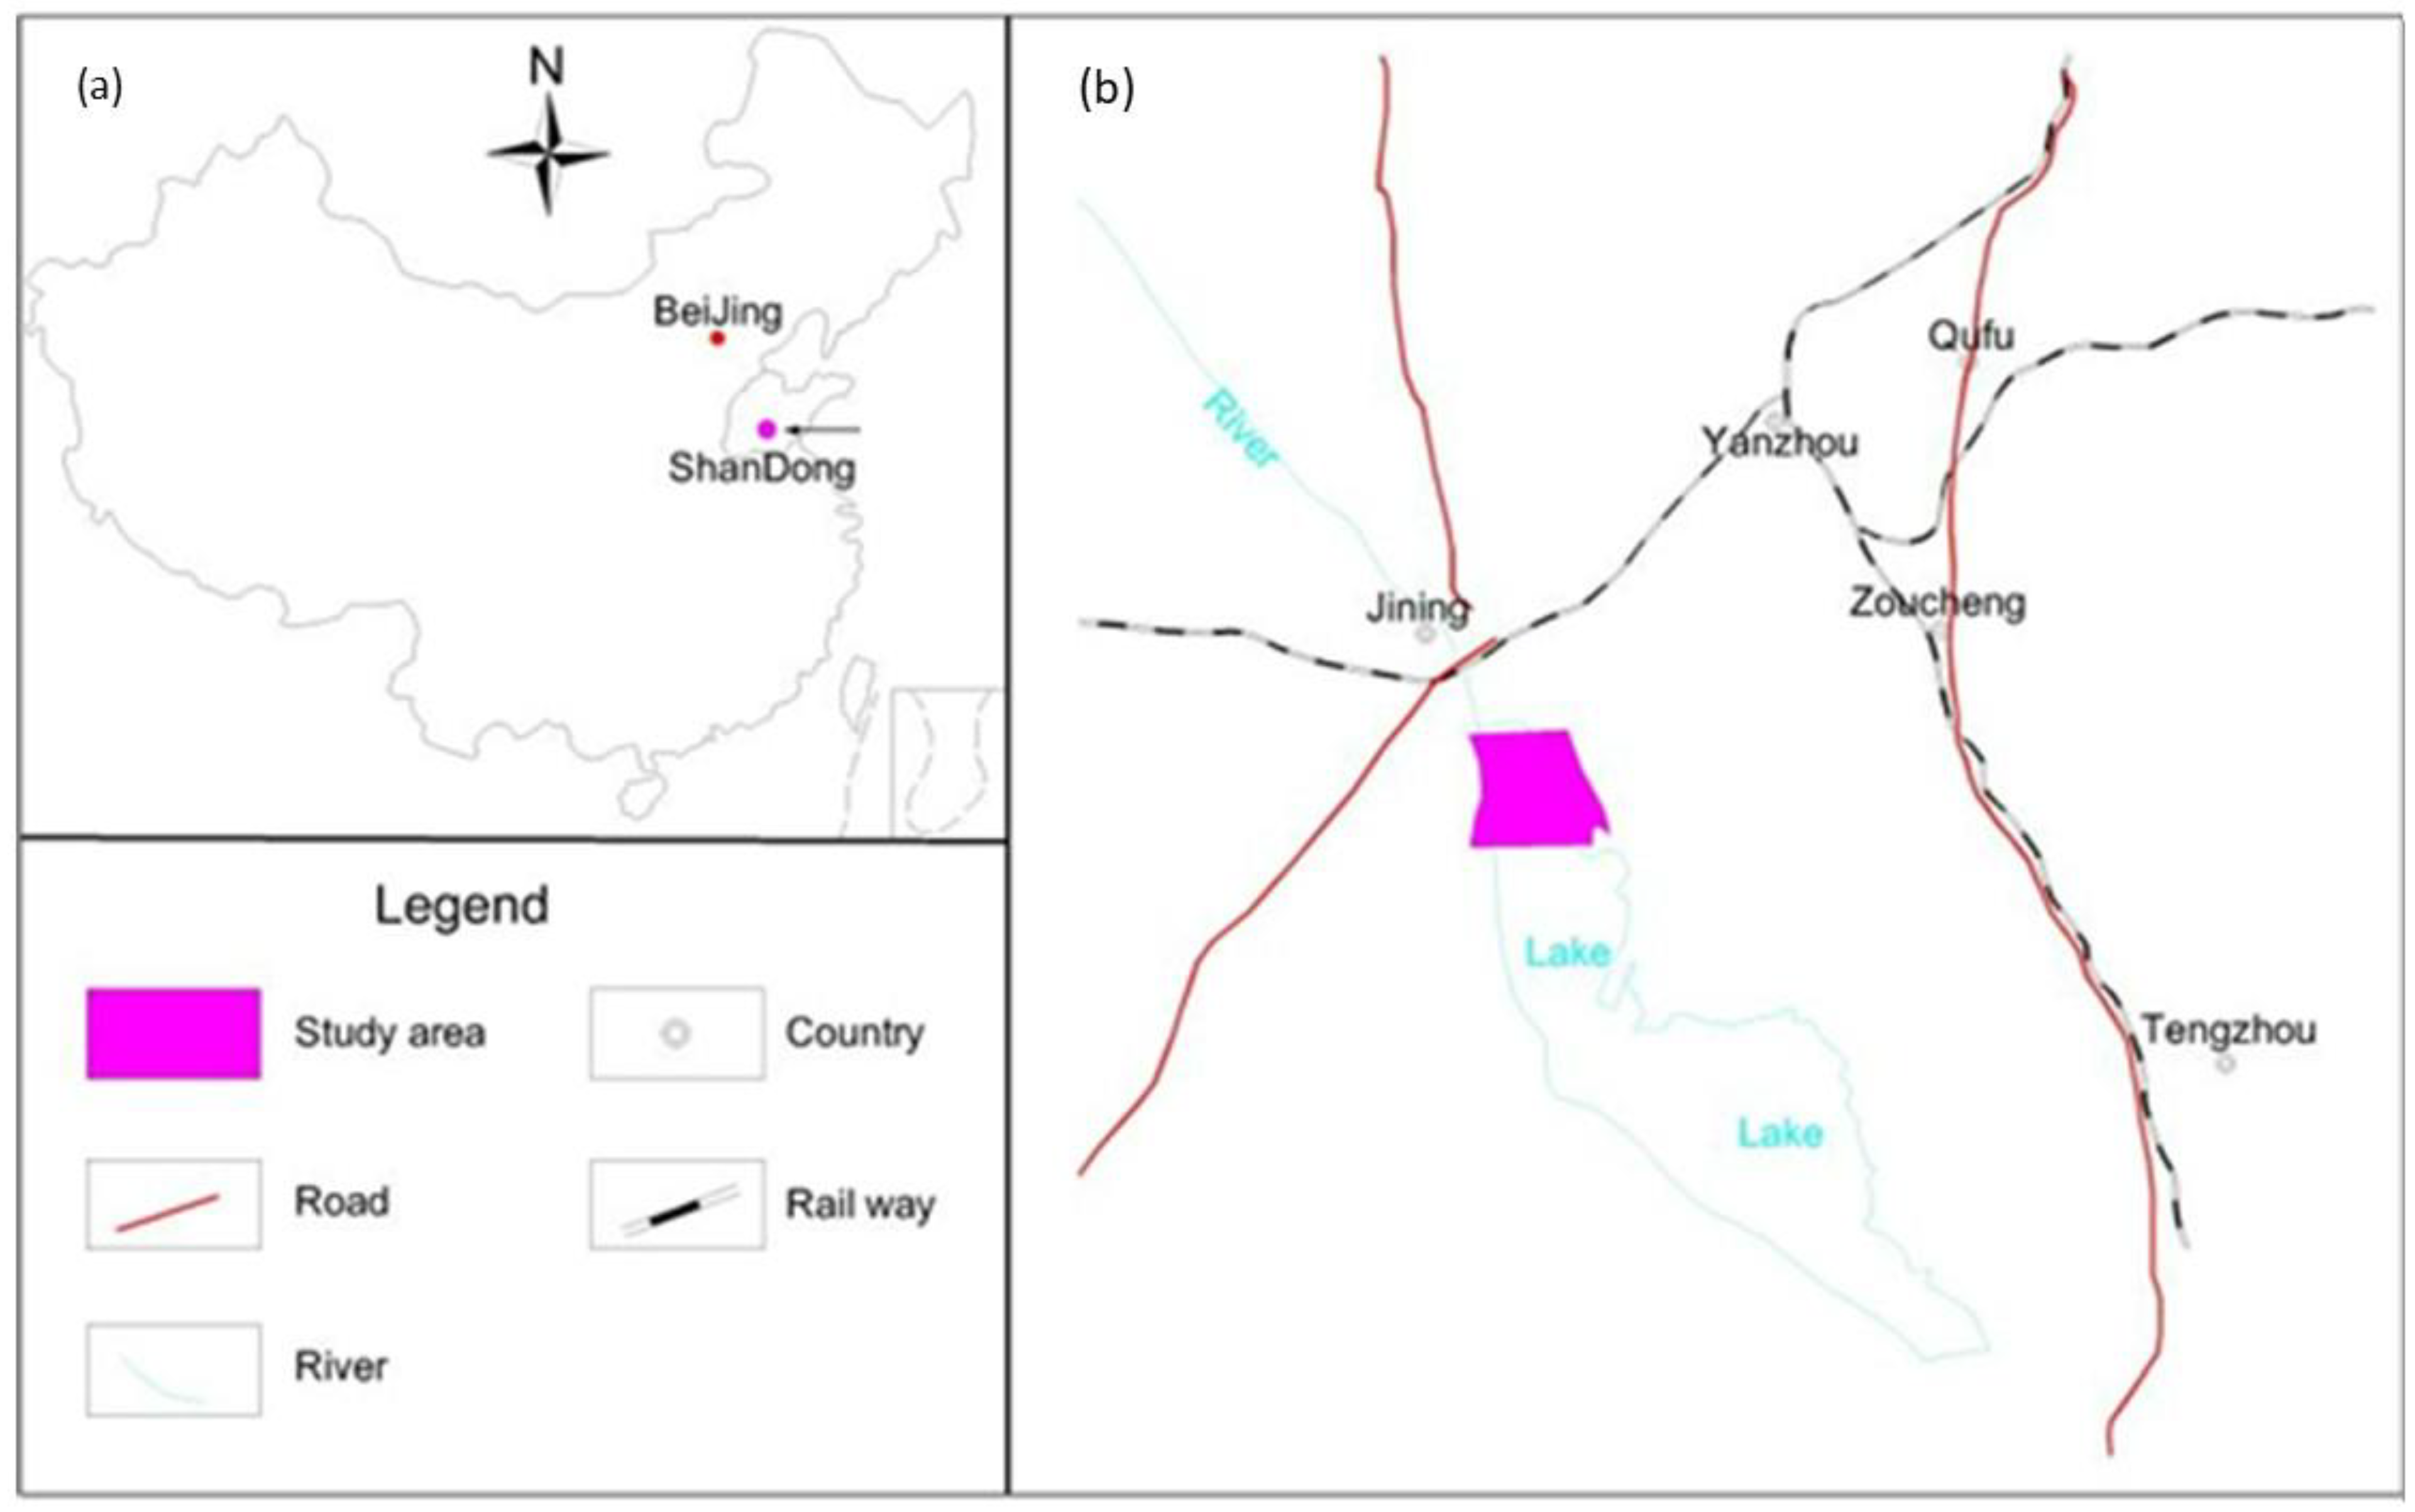
2. Analysis of Mining Conditions and Water Hazards in the Study Area

The Jining No. 3 coal mine is located 14 km southeast of Jining district (as shown in Figure 1), which has an oceanic–continental climate in a temperate monsoon area, with an annual average precipitation of 697.94 mm, an annual average temperature of 14.33 °C and multiple seasonal rivers. Since the mine was built and put into production, it has been threatened by roof water. According to mine water inflow data and the past water inrush situation, the average water inflow of the mine is 419 m3/h, and roof water inrush has occurred several times during the mining process at the working face. Therefore, conducting research on roof water hazards is urgently needed to guarantee safe production in this coal mine.

2.1. Mining Conditions

The Jining No. 3 minefield is a fully concealed North-China-type Carboniferous–Permian minefield. According to the borehole histogram of the mine field; a comprehensive histogram is shown in Figure 2. From the diagram, it can be seen that the coal measure strata are based on the Ordovician, deposited Carboniferous Benxi formation, Carboniferous–Permian Taiyuan formation, Permian Shanxi formation and Shihezi formation, which are covered by Jurassic and Quaternary strata. The main coal-bearing strata are the Taiyuan and Shanxi formations.
The stratigraphy in the study area is generally gentle, with dip angles ranging from 2° to 18°. The northern part of the fold form is characterized by wide and gentle folds, which gradually turn into a monoclinic structure toward the south. On the whole, the fold structure is basically underdeveloped, so the fold amplitude is not large. On the east and west sides of the minefield are the north-south trending regional faults, i.e., the Sunshidian and Jining faults. There are more than 1000 faults in the study area, most of them are positive faults with a drop less than 10 m; only 100 faults have a drop greater than 10 m, they are controlled by regional faults and mainly have a north-south trend, and some break the coal seam to the roof aquifer and cause the roof water to enter the coal seam through the faults. The geological structure of the mine field is moderately complex (as shown in Figure 3).
The coal-bearing strata in this mine field are the Shanxi and Taiyuan Formations. The lower No. 3 coal seam, belonging to the Shanxi Formations, has a thickness of 0.70–9.35 m, with an average of 4.73 m, which is a thick coal seam with abundant reserves and is the main recoverable coal seam. The coal seam structure is simple and contains a small amount of gangue. The roof and floor of the coal seam are primarily silt and mudstones. The water sources of the mine include atmospheric precipitation, surface water, old empty water and aquifer water. As there is no direct recharge and discharge relationship between atmospheric precipitation, surface water and the lower aquifers, the surrounding coal mines have clear water accumulated in the old goaf, and there are boundary protection coal pillars. Therefore, aquifer water is currently the main source of mine water filling, which directly affects mine production.

2.2. Water Hazard Analysis

Presently, the main coal seams of the coal mine are the lower No. 3 coal seams, and the aquifers affected by mining are primarily sandstone-fractured aquifers on the roof of the lower No. 3 coal seams and the lower Jurassic sand-conglomerate aquifers. The former aquifers are composed of medium- to coarse-grained sandstone and fine sandstone, with a thickness between 0.55–56.66 m and an average thickness of 23.86 m. According to the water pumping test results of the relevant boreholes, the unit water inflow (q) is 0.00002–0.476 L/s·m and the TDS value is 0.673–1.982 g/L. The overall water richness is weak, and some parts are medium. The latter ones are primarily composed of fine sandstone, middle sandstone and conglomerate, which are generally distributed and locally missing. According to the water pumping and injection test data, the unit water inflow (q) is 0.0001–0.218 L/s·m and the TDS value is 0.709–4.512 g/L, the water-bearing section is generally weak in terms of water richness, locally medium and the circulation and replenishment conditions are poor, primarily static reserves.
According to the drilling statistics, most of the cracks produced during the mining of the lower No. 3 coal seam spread to the sandstone aquifer of the Shanxi formation on the roof and have reached the Jurassic sand-conglomerate aquifer in a small part of the overall area. During the mining process, under the influence of the structure and mining fissures, a large water inrush occurred several times during coal seam mining in the sixth mining area. Therefore, there is a danger of water inrush from the roof aquifer during mining in the future, which poses a threat to the safety of the mine.

3. Water Inrush Factor Selection

Coal seam water inrush hazards are affected by several factors, and these factors vary from place to place. Moreover, most of them depend on the actual geological and hydrogeological conditions, as well as the degree of exploration [26]. According to the analysis of the water inrush source and water inrush channel from the coal seam roof, the fault in the mining area can be used as both the water inrush source and the water inrush channel. The water inrush source of the No. 3 lower coal seam roof includes the overlying aquifer and fault, and the water inrush channel includes the mining fracture and fault fracture. Therefore, from the three aspects of aquifer properties, coal seam mining fissures and geological structure, the appropriate indicators were selected to analyze the risk of roof water inrush. Index data were generated by collecting and collating the entire mining area borehole histogram and 3D seismic exploration data.

3.1. Nature of the Aquifer

(1)
Burial depth (Dp)
The water-bearing sandstone at the top of the lower No. 3 coal seam is buried at a depth of 233–993 m below the surface. The burial depth data were obtained from 3D seismic exploration, geological exploration, roadways and the working face construction (as shown in Figure 4a). As the burial depth of the rock layer increases, the compactness of the sandstone layer increases with an increase in lithostatic pressure, which reduces the pores and fissures generated in the rock and reduces the water richness of the aquifer to a certain extent.
(2)
Aquifer thickness (Tk)
The thickness of the sandstone aquifer is an important hydrogeological factor; it is a direct indicator of the strength of the water richness. When controlling other factors, the thicker the aquifer, the higher the water richness. In this study, the thickness of the aquifer refers to the thickness of the sandstone layer within the development height of the water-conducting fissure zone in the lower No. 3 coal seam. According to geological exploration data, the thickness of the overlying sandstone in the lower No. 3 coal seam is between 4.16 and 416 m (as shown in Figure 4b).
(3)
Core collection rate (Cr)
The core collection rate refers to the ratio of the length of the core to the thickness of the entire rock formation, and the value ranges from 0.14 to 1 (as shown in Figure 4c). Generally, the core collection rate accurately reflects the degree of fracture development in the rock formation. Therefore, when the value of the core collection rate is larger, the rock is more complete and less cracks are developed. In contrast, it indicates that the greater the degree of damage to the rock, the more cracks develop, and the space becomes more water-filled.
(4)
Brittle–plastic rock thickness ratio (Tkr)
In general rock formations, plastic rocks refer to argillaceous rocks and brittle rocks refer to limestones and sand conglomerate. In this study, the brittle–plastic rock thickness ratio refers to the ratio between the water-bearing sandstone and cement rock within the development height of the water-conducting fracture zone in the lower No. 3 coal seam (as shown in Figure 4d). The larger the ratio, the thicker the brittle rock, and the stronger the water-rich capacity and permeability.
(5)
Number of aquifers and barriers (Num)
An aquifer is usually studied as a whole, but the actual stratum is not continuous in the vertical distribution. The presence of a water barrier hinders the vertical hydraulic connection of the stratum to a certain extent. Therefore, the greater the number of aquifers in the formation, the weaker the vertical hydraulic connection of the aquifer and the weaker the water richness. However, the lower the number, the stronger the water richness of the aquifer as a whole. In this study, the number of impermeable layers refers to the total number of layers of aquifers and impermeable aquifers within the development height of the water-conducting fracture zone in the lower No. 3 coal seam, and the value is between 1 and 58 (as shown in Figure 4e).

3.2. Development Height of Water-Conducting Fracture Zone

A water-conducting fissure zone is a type of fissure formed after the coal seam is mined. It is an artificial disturbance and an important factor pertaining to the danger of water inrush [27]. The development height of the water-conducting fracture zone is directly affected by the mining thickness of the lower coal seam. According to the conclusions of previous surveys and geological reports, this study adopted the equation for calculating the height of the water-conducting crack zone in thick coal seam slicing mining, as specified in: “Buildings, water bodies, railways and main shafts, and coal pillars and coal mining specifications”. Essentially, the roof rock layer is of the medium-hard type, and the calculation equation for the maximum height of the water-conducting fracture zone is as follows:
H l i = 100 M 1.6 M + 3.6 ± 5.6
H l i = 20 M + 10
where H l i is the development height of the water-conducting fracture zone and M is the cumulative thickness.
Based on the thickness of the coal seam exposed by the borehole, Equations (1) and (2) were used to obtain the development height of the water-conducting fracture zone in the lower No. 3 coal seam, and the maximum value was the final development height of the water-conducting fracture zone. The height of the water-conducting fracture zone was between 23.11 and 106.28 m. According to the calculation results and contour map analysis (as shown in Figure 5), most sections of the water-conducting fissure zone did not affect the lower Jurassic aquifer. At this time, the direct water-filled aquifer in the lower No. 3 coal seam was a sandstone fractured aquifer on the top of the coal seam. However, in some areas, the water-conducting fracture zone spread to the Jurassic strata. At this time, the directly water-filled aquifers were the sandstone-fractured aquifers on top of the coal seam and the sand-conglomerate aquifer in the lower Jurassic.

3.3. Geological Structure

The geological structure destroys the integrity of rock formations and increases the probability of water inrush in mines [26,28]. In China, approximately 80% of coal and gas outbursts, mine water inrush and flooding accidents are caused by faults [29]. Faults and other structures rupture rock formations and produce numerous cracks. They provide channels for the water in the aquifer and increase water richness. According to the geological exploration and roadway exposure in the study area, large and small faults are densely developed. The main faults are in the northwest–southeast direction, and the drop is between 0 and 450 m. As faults and other structures are not easy to deal with in the statistical process, the corresponding grid units were established according to the characteristics of the study area, and the fractal structure was adopted to quantify the faults.
(1)
Fault density (Fd)
In previous studies, fault density referred to the number of faults per unit area [30]. Subsequently, considering the fall of the fault to distinguish different scales, Yin et al. [31] introduced the fall of the fault and proposed a correction coefficient that divides the sum of the fall in the grid by the mean value of the fall of all the faults in the study area. Therefore, in this study, we comprehensively analyzed the previous studies, using the fault density proposed by Yin et al., which is expressed in Equation (3):
F d = N i = 1 N H i S H ¯
where N is the number of faults; H i is the sum of the fault drops within the grid; S is the unit area of the grid; and H ¯ is the average value of the fault drops in the study area.
As is shown in Figure 6a, the greater the number and density of faults, the greater the probability of water inrush in the mine.
(2)
Fault frequency density (Ff)
The fault frequency density refers to the sum of the endpoints and intersections of all faults in a unit area [13,32,33], as represented by Equation (4) and Figure 6b:
F f = P I + P E S
where PI and PE are the intersections and end of all faults in the grid, respectively
The densely developed faults in the study area cut each other, which resulted in the weakening of the integrity of the rock formation, significant improvement in the permeability and water storage space of the rock formation and an increase in the probability of water-rich formation and water inrush in the mine.
(3)
Fault size index (Fs)
The fault scale index refers to the sum of the product of the drops of all faults per unit area and their strike length [33], as expressed by Equation (5) and Figure 6c:
F s = i = 1 N L i H i S
where L i is the strike length of the ith fault in the unit; H i is the gap of the ith fault; n is the number of faults in the unit; and S is the unit area.
(4)
Coefficient of variation in the inclination angle of the coal floor (CDVAC)
According to the construction data of geological exploration, roadways, working faces and other construction data, a contour map of the seam floor elevation can be drawn and the floor gradient of the coal seam can be calculated. The coefficient of variation can be defined as the ratio of the standard deviation of the coal seam slope value to the average slope, as expressed by Equation (6):
C D V A C = 1 m i = 1 m ( a i A ) 2 A × 100 %
where α is the dip of the coal seam and A is the average value of the coal seam dip.
The coefficient of variation in the coal floor dip indicates the degree of fold development in the study area [30] (as shown in Figure 6d).
Generally, faults, folds and other structures are directly related to mine water inrush. First, Equations (3)–(6) were used to calculate the relevant values of all grids of 500 × 500 m in the study area. Subsequently, each value was drawn in the center of the corresponding grid. Then, the Kriging interpolation technique was used to interpolate and create a map for each parameter.

4. Methodology

4.1. Assessment Steps

To evaluate the risk of roof water inrush from the lower No. 3 coal seam, the following steps were followed:
(1)
Collect data and comprehensively analyze geological and hydrogeological conditions based on existing geological data in the study area and select the influencing factors.
(2)
Establish an evaluation index system and standardize data processing.
(3)
Determine the weight of the relevant factors and establish a model to determine the water hazard area of the coal roof in the study area to obtain the evaluation results.
(4)
Describe and interpret the results.

4.2. Data Normalization

Since all of the factors above are dimensional, in order to avoid the influence of data with different dimensions on the evaluation results, it is necessary to normalize the evaluation indicator data; the normalized data are comparable and easy to analyze. There are many methods for data standardization, and this article adopts min-max normalization [26,34,35], because this method is a linear transformation of the original data, mapping the original value x by normalization to a value x′ in the interval [0, 1], without changing the original data distribution. The changes to the data do not cause “invalidation”, but rather improve the performance of them. On the other hand, the selected indicators have both positive and negative correlation with the evaluation objectives, the direct summation of the different indicators cannot correctly reflect the comprehensive results, and it is necessary to consider changing the inverse indicators. Therefore, the following formula is chosen, using both the maximum optimal model and the minimum optimal model.
The positive indicatiors (the larger the value, the better the evaluation results) are dimensionless using Equation (7):
x i = x i x m i n x m a x x m i n  
The negative indicators (the larger the value, the worse the evaluation results) are dimensionless using Equation (8):
x i = x m a x x i x m a x x m i n
where x i is the original value of a parameter;   x m a x and x m i n are the original maximum and minimum values, respectively; and x i is the standardized value.

4.3. Evaluation Method

Multi-criteria decision analysis (MCDA) methods are especially appropriate techniques in the evaluation of the water inrush hazard in coal seam roof. The determination of criteria preference in the multi-criteria problem being solved, performed by determining weights, is one of the critical steps of MCDA methods because it significantly affects the final results [36]. Criteria weighting techniques are divided into subjective and objective. Subjective techniques require the participation of the decision-maker in the weighting procedure. The values of the weights are then solely dependent on the opinion of the decisionmaker. Analytic Hierarchy Processes (AHP) is one of the subjective criteria weighting techniques [37,38,39], and is characterized by uncertainty due to varying interpretations of the decision problem by different decision-makers. The core idea of this method is to stratify complex decision-making problems and decompose decision-making problems into different levels of structure, according to the order of the overall goal, sub-goal and evaluation criteria until the specific measures. However, there are obvious defects such as needing expert knowledge and ignoring the actual objective conditions in relying solely on AHP.
On the other hand, objective weighting methods determine criterion weights based on mathematical formulas. They are readily and widely used because they do not require expert knowledge of the problem being solved. The commonly used methods are the standard deviation method, statistical variance method, mean method, CRITIC method and CILOS method. However, the objective weighting method does not take into account the correlation between indicators, ignores the role of subjective decision-making in practical applications and the single weight assignment cannot accurately measure the impact of each factor, causing the evaluation results to deviate from the actual. Due to the advantages and some limitations of both of the methods identified above, a new evaluation method, namely AHP-CRITIC, was proposed, and the objective weighting and subjective weighting were combined; the weight value obtained takes into account the dual influence of subjective and objective, which is more reasonable.

4.3.1. AHP Method

Currently, AHP is the most widely used mathematical analysis method for water inrush risk assessment. The basis of this method is to compare and judge the indicators in the water inrush risk assessment system, and obtain the weight of each indicator in the system. Marchevsky [40] and Adiat [41] described the details and steps of the AHP. The main steps of this study are as follows:
(1)
Building a hierarchical model
According to the roof water hazards encountered in the lower No. 3 coal seam, the threat factors were divided into the following indicators:
Target layer (A): Lower No. 3 coal seam roof water inrush risk assessment layer.
Criterion layer (B): Nature of the aquifer (B1), damage to the overburdened rock (B2) and geological structure (B3).
Model decision layer (C): Buried depth of the aquifer (C1), thickness of the aquifer (C2), core collection rate (C3), brittle–plastic rock thickness ratio (C4), number of aquifers and barriers (C5), water-conduction fracture zone development height (C6), fault density (C7), fault frequency density (C8), fault scale index (C9) and coefficient of variation in the coal floor dip (C10).
(2)
Constructing a judgment matrix and weight calculation
After the model was established, the AHP method was used to perform level analysis, compare each index with other indices, determine the important ratio of each factor, establish the judgment matrix and obtain the weight of each index through matrix calculation.
(3)
Hierarchical consistency test
A consistency test is needed for the judgment matrix obtained above. The consistency test calculation formula is:
C R = C I R I = λ m a x n ( n 1 ) R I
where CR is the consistency ratio; CI is the consistency characteristic indicator; RI is the average random consistency index, whose value criteria are shown in Table 1, RI = 1.49; λmax is the largest eigenvalue of the judgment matrix; and n is the order of the judgment matrix (number of evaluation indices).
When CR < 0.1, the judgment matrix is considered to have satisfactory consistency; otherwise, the elements in the judgment matrix need to be adjusted to have satisfactory consistency.
After calculation, CI = 0.075, CR = CI/RI = 0.05 < 0.1. This shows that the result has passed the consistency test and is acceptable. The weight values of each index are listed in Table 2.

4.3.2. CRITIC Method

This method is an objective weighting method proposed by Diakoulaki, which measures the objective weight according to the two dimensions of the information sent by the index; that is, the contrast intensity of the evaluation index and the conflict between the indices [42]. Contrast intensity refers to the size of the difference between the evaluation schemes of the same indicator, expressed in the form of standard deviation. The larger the standard deviation, the greater the volatility; i.e., the larger the value difference between the various programs, the higher the weight. The conflict between indicators is expressed by the correlation coefficient. If there is a strong positive correlation between the two indicators, the smaller the conflict, the lower the weight. When the standard deviation is certain, the smaller the conflict between the indicators, the smaller the weight, and the greater the conflict, the greater the weight; in addition, when the positive correlation between the two indicators is greater, the correlation coefficient is closer to 1, and the conflict is smaller, which indicates that the information reflected by the two indicators in the evaluation scheme is more similar. This method can use all the information contained in the evaluation criteria to provide more unique weights for each index, which is more effective than the weight values calculated by other objective weighting methods [36]. The main steps are as follows:
(1)
Index variability
Data differences in the indices are expressed in the form of the standard deviation:
{ x j ¯ = 1 n i = 1 n x i j S j = i = 1 n ( x i j x j ¯ ) 2 n 1  
where S j represents the standard deviation of the jth index.
The larger the standard deviation, the greater the numerical difference in the indicator, the more the information that can be displayed, the stronger the evaluation intensity of the indicator, and more weight should be assigned to the indicator.
(2)
Index conflict
The degree of data conflict is expressed by the correlation coefficient:
R j = i = 1 p ( 1 r i j )  
where r i j represents the correlation coefficient between evaluation indices i and j.
The correlation coefficient is used to express the correlation between the indicators. When the correlation with other indicators is stronger, the conflict between the indicators is less; and the more similar information is reflected, the more repetitive the evaluation content. Therefore, the evaluation intensity of this indicator is weakened to a certain extent, and the weight assigned to this indicator is reduced.
(3)
Amount of information
C j = S j i = 1 p ( 1 r i j ) = S j × R j
When C j is larger, the effect of the jth evaluation index on the entire evaluation index system is greater. Therefore, more weight should be assigned to C j .
(4)
Objective weight
The objective weight W j of the jth index is
W j = C j i = 1 p C j    
Based on the abovementioned steps, the weight values of each index calculated using the CRITIC method in this study are listed in Table 3.

4.3.3. Determination of Comprehensive Weight

To ensure the accuracy and objectivity of the results, the weights obtained by the AHP and CRITIC methods were weighted, and the composite weight was as follows (as shown in Table 4):
W i j = W A i j × W C i j W A i j × W C i j
where W i j is the comprehensive weight of the ith index, W A i j is the AHP weight of the ith index, and W C i j is the CRITIC weight of the ith index.

4.4. Model Establishment

Comprehensive multi-factor analysis using the AHP-CRITIC compound weighting method to obtain the weight value of each factor affecting the roof water inrush risk and a new prediction method is constructed in this paper, named as the risk index method of roof water inrush from coal seam roof (RIWI). The evaluation model is constructed as follows (Equation (15)):
R I W I = i = 1 n W i × X i
where RIWI is the water inrush index; W i is the weight value of the ith influencing factor; and X i is the standardized value of the ith influencing factor.
This model uses the linear weighted average method to combine all influencing factors into one formula to obtain the water inrush index model of the lower No. 3 coal seam roof in the study area:
R I W I = 0.058 X 1 + 0.339 X 2 + 0.081 X 3 + 0.058 X 4 + 0.058 X 5 + 0.306 X 6 + 0.039 X 7 + 0.015 X 8 + 0.025 X 9 + 0.022 X 10
where X1, X2, …, X10 are the standardized values of the 10 evaluation indices, such as the buried depth. When the RIWI is used, the larger the value is, the greater the water inrush risk is.

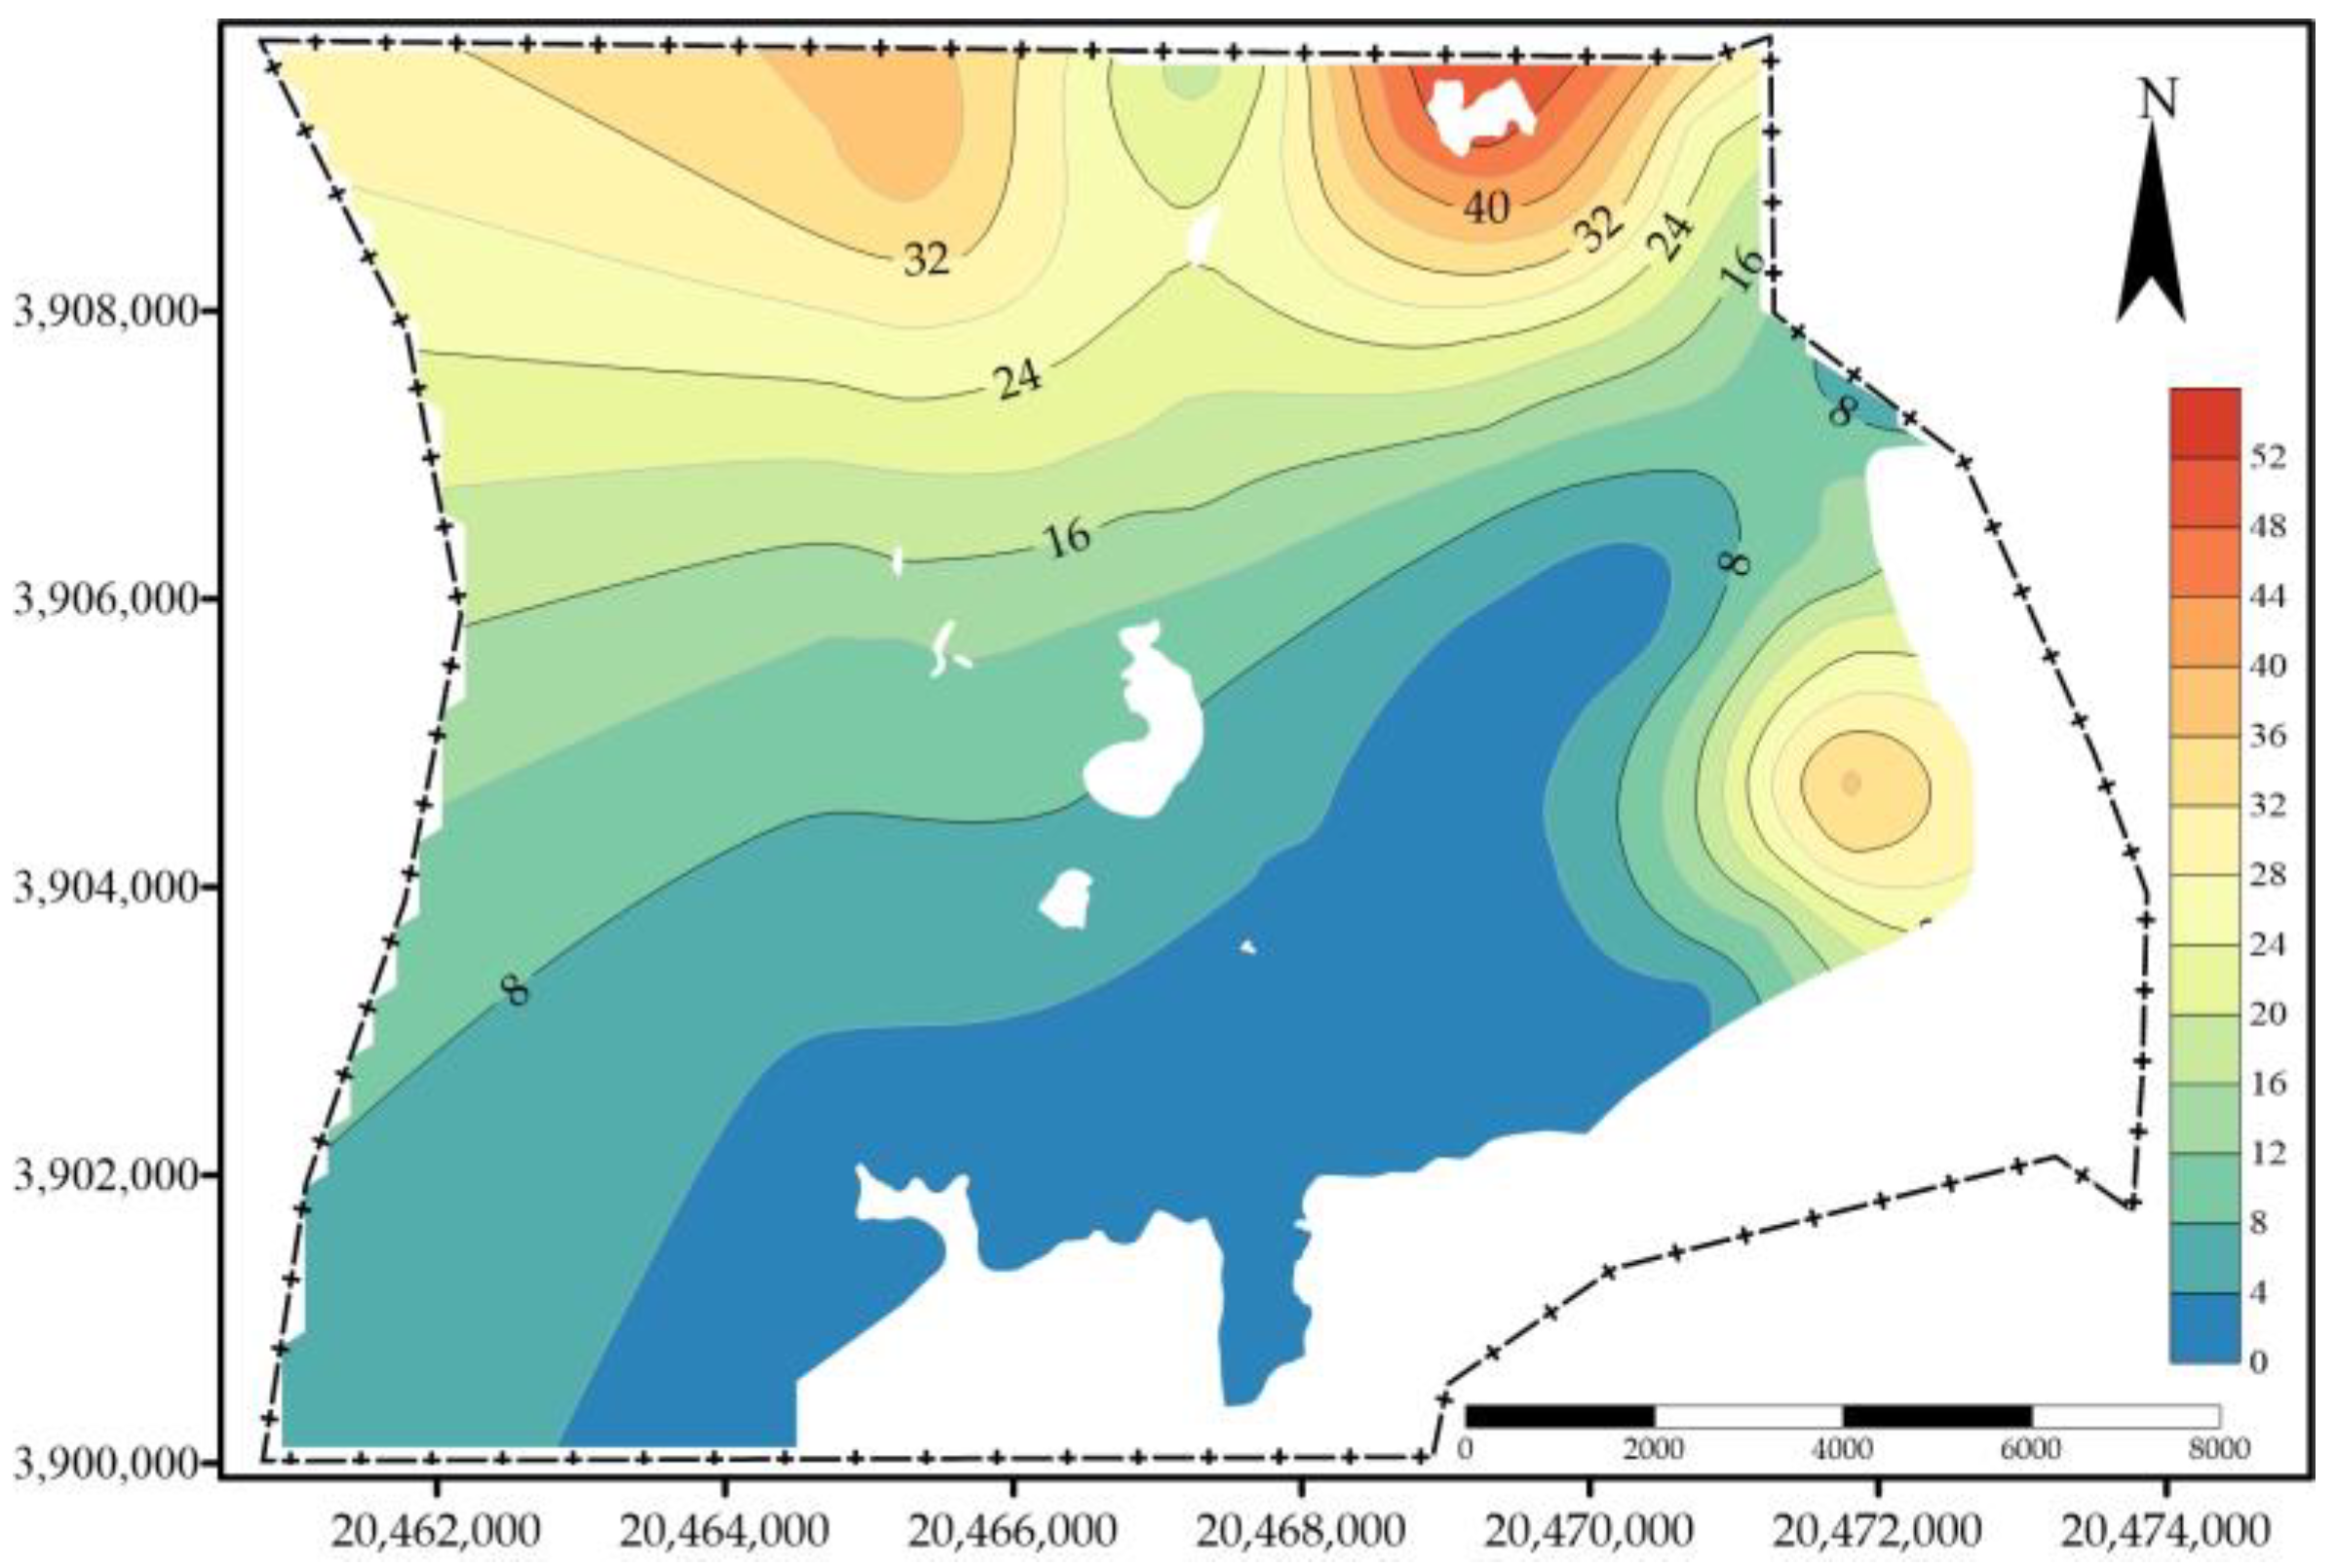
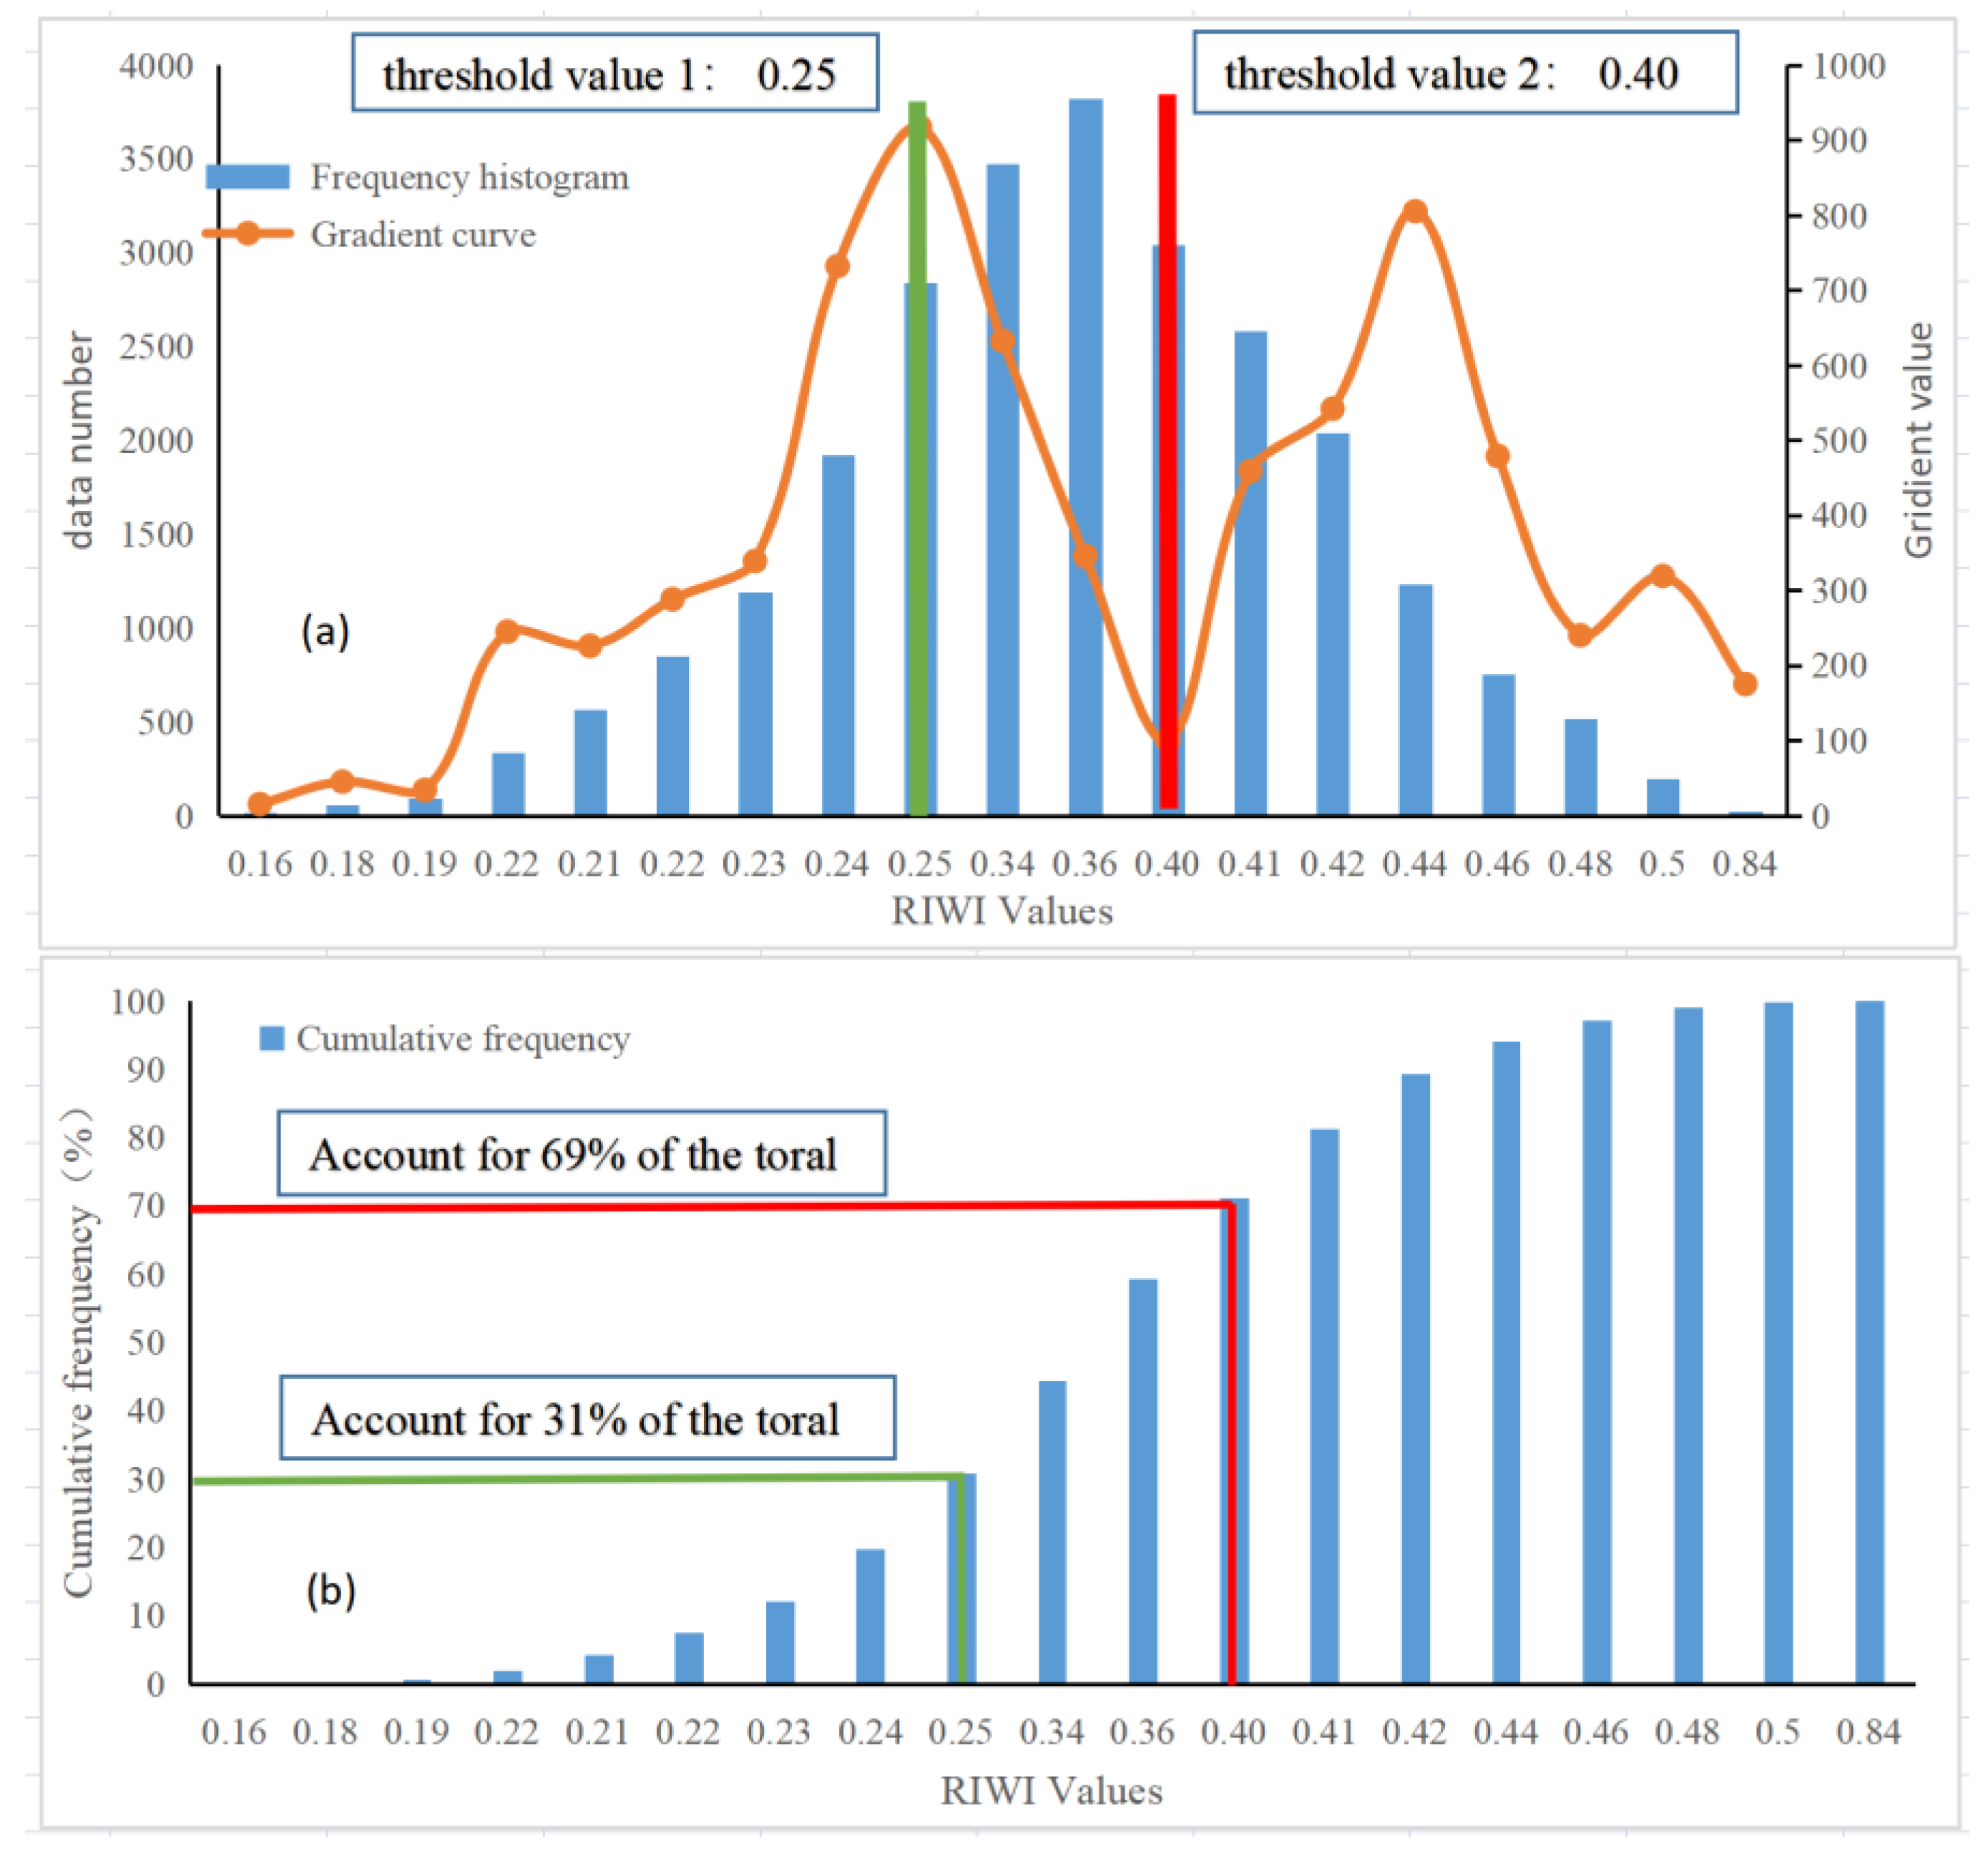
5. Results and Validation

5.1. Results

The RIWI values were calculated for each 50 m × 50 m grid cell. All cell data were then processed using SURFER and MapGIS K9 software, which are specialized in drawing contour maps and spatial overlapping analysis. The RIWI values were plotted at the center of the grid cells. Using the coordinates of the grid cell centers, the overall RIWI contour map was constructed using the Kriging function interpolation technique. The obtained RIWI values were statistically analyzed, which, overall, presented normal distribution. As can be seen from the frequency histogram (Figure 7), they are mainly concentrated in 0.25–0.40. According to the data gradient change curve (Figure 7a), the first big change occurs at 0.25 and the second one occurs at 0.40. As can be seen from the total data distribution map (Figure 7b), data less than 0.25 accounts for 30% of the total data, and data less than 0.40 accounts for 69%. According to the natural break point classification theory (NBC), the threshold value for the RIWI is (0.25, 0.40) (Table 5).
Therefore, the area was divided into three zones (as shown in Figure 8): low-risk (<0.25), medium-risk (0.25–0.4) and high-risk zones (>0.4). The map shows that the high-risk water inrush area in the study area is located in the northwest and east, the medium- risk area is in the southwest and the low-risk area is in the middle and southeast regions.

5.2. Validation

Validation is key to verifying these results [26,31,33]. Therefore, to ensure the accuracy of the roof water inrush prediction by the AHP-CRITIC model, the validation was performed using the data of actual water inrush accidents that occurred in working faces during mining of the lower No. 3 coal seam. The water inrush points (WIPs) are all located in the medium- and high-risk areas (Table 6, Figure 8), and the water sources were all from the sandstone aquifer of the No. 3 lower coal seam roof.

6. Discussion

According to the coal mine’s historical gushing water data and WIPs information, the primarily sandstone-fractured aquifers on the roof of the lower No. 3 coal seam and the lower Jurassic sand-conglomerate aquifers are the main sources, accounting for 54.4% and 46.7%, respectively. However, from Section 2.2 it can be seen that the water richness of these two aquifers is weak to moderate, but there are several WIPs during the mining process, with the water quantity ranging from 30 m3/h to 533.84 m3/h, which is inconsistent with the water richness of the two aquifers themselves, and there are two main reasons: Firstly, only a few boreholes in the study area are hydrological observation boreholes, and there are fewer boreholes for pumping test holes to expose the fault zone, so the pumping test results obtained cannot fully represent the water-richness of the aquifers in the fault zone. Secondly, influenced by coal mining, the water conduction fracture zone is highly developed to the sandstone aquifers on the roof of the lower No. 3 coal seam, and the dense fault zone affects the water-richness of the two aquifers. In the area where multiple faults intersect, the fractures are densely developed, which increases the water storage space of the fractures to a certain extent and also enhances the connectivity between the fractures, changing the water-richness of the two aquifers.

7. Conclusions

According to the complex mine geological conditions of the Jisan No. 3 coal mine, the water inrush source and channel of the lower coal seam roof were comprehensively analyzed, and the main influencing factors were studied, including the water richness of the overlying aquifer, the mining fissure of the coal seam and the geological structure of the mine. From these three aspects, the buried depth, the thickness of the aquifer, the core recovery rate, the brittle–plastic rock thickness ratio, the number of water-resisting layers, the development height of the water-conducting fractured zone, the fault density, the fault frequency density, the fault scale index and the variation coefficient of the dip angle of the coal seam floor were selected to construct the index system of the water inrush risk of the coal seam roof.
The AHP-CRITIC composite weighting model was used to predict the risk of water inrush from the roof of the No. 3 lower coal seam in the Jisan coal mine. The model can combine the advantages of the subjective weighting method and the objective weighting method to avoid the shortcomings of each method. At the same time, in view of the problem of too many influencing indicators, the CRITIC method can reflect the correlation between the indicators, so that the weighting of the indicators is more scientific and reasonable, and the final prediction results are more realistic. According to the final results, the southwest area of the mining area is a low-risk area of water inrush, the southeast and central areas are the medium-risk areas of water inrush and the northeast and northwest areas are the high-risk areas for water inrush. Combined with the actual water inrush position of the mine, most of the water inrush points are located in the high risk areas. This shows that the prediction model is more in line with the actual situation, making it feasible and effective. The division of the water inrush risk areas can provide a certain basis for subsequent water prevention and control by the coal mine, which is of great significance to ensure the safe and efficient operation of the coal mine.

Author Contributions

Conceptualization, L.X. and C.N.; methodology, F.L.; software, Q.Q.; validation, G.D., F.L. and C.L.; formal analysis, Q.Q.; investigation, G.D.; resources, C.L.; data curation, Q.Q.; writing—original draft preparation, F.L.; writing—review and editing, L.X.; visualization, C.N.; supervision, C.N.; project administration, C.N.; funding acquisition, L.X. All authors have read and agreed to the published version of the manuscript.

Funding

This research was funded by National Natural Science Foundation of Shaanxi province (Grant No. 2019JQ-794), National Natural Science Foundation of China (Grant No. 41807190), the China Postdoctoral Science Foundation (Grant No. 2020M673444) and the Open Fund of the Shaanxi Key Laboratory of Coal Green Development and Geological Support (Grant No. DZBZ2020-01).

Data Availability Statement

Not applicable.

Conflicts of Interest

The authors declare no conflict of interest.

References

  1. Cui, F.P.; Wu, Q.; Lin, Y.H.; Zeng, Y.F.; Zhang, K.L. Damage features and formation mechanism of the strong water inrush disaster at the daxing co mine, Guangdong Province, China. Mine Water Environ. 2018, 37, 346–350. [Google Scholar] [CrossRef]
  2. Wang, P.P.; Jiang, Y.D.; Ren, Q.S. Roof hydraulic fracturing for preventing floor water inrush under multi aquifers and mining disturbance: A case study. Energies 2022, 15, 1187. [Google Scholar]
  3. Xie, D.L.; Han, J.; Zhang, H.D.; Wang, K.; Du, Z.W.; Miao, T.Y. Risk assessment of water inrush from coal seam roof based on combination weighting-set pair analysis. Sustainability 2022, 14, 11978. [Google Scholar] [CrossRef]
  4. Xiao, L.L.; Zhang, Q.Q.; Niu, C.; Wang, H.W. Spatiotemporal patterns in river water quality and pollution source apportionment in the arid Beichuan river basin of northwestern China using positive matrix factorization receptor modeling techniques. Int. J. Environ. Res. Public Health 2020, 17, 5015. [Google Scholar] [CrossRef]
  5. Niu, C.; Zhai, T.L.; Zhang, Q.Q.; Wang, H.W.; Xiao, L.L. Research advances in the analysis of nitrate pollution sources in a freshwater environment using δ15N-NO3 and δ18O-NO3. Int. J. Environ. Res. Public Health 2021, 18, 11805. [Google Scholar] [CrossRef]
  6. Wei, M.J.; Wu, J.H.; Li, W.Q.; Zhang, Q.X.; Su, F.M.; Wang, Y.H. Groundwater geochemistry and its impacts on groundwater arsenic enrichment, variation, and health risks in Yongning County, Yinchuan Plain of northwest China. Expo. Health 2022, 14, 219–238. [Google Scholar] [CrossRef]
  7. Han, C.H.; Wei, J.C.; Zhang, W.J.; Yang, F.; Xie, D.L.; Xie, C. Quantitative permeation grouting in sand layer with consideration of grout properties and medium characteristics. Constr. Build. Mater. 2022, 327, 126947. [Google Scholar] [CrossRef]
  8. Niu, C.; Zhang, Q.Q.; Xiao, L.L.; Wang, H.W. Spatiotemporal variation in groundwater quality and source apportionment along the ye river of north China using the PMF model. Int. J. Environ. Res. Public Health 2022, 19, 1779. [Google Scholar] [CrossRef]
  9. Liu, T.Q. Laws of Surface Movement and Overburden Failure in Coal Mines and Their Application; Beijing Coal Industry Press: Beijing, China, 1981. [Google Scholar]
  10. Gao, Y.F. “Four-zone” model of rock mass movement and back analysis of dynamic displacement. J. China Coal Soc. 1996, 21, 51–56. [Google Scholar]
  11. Qu, Q.D.; Xu, J.L.; Qian, M.G. Study on influences of key strata movement on gas emissions of adjacent layers. J. Min. Saf. Eng. 2007, 26, 1478–1484. [Google Scholar]
  12. Wu, Q.; Xu, K.; Zhang, W. Further research on “three maps-two predictions” method for prediction on coal seam roof water bursting risk. J. China Coal Soc. 2016, 41, 1341–1347. [Google Scholar]
  13. Wu, Q.; Fan, S.K.; Zhou, W.F.; Liu, S.Q. Application of the analytic hierarchy process to assessment of water inrush: A case study for the No. 17 coal seam in the Sanhejian coal mine, China. Mine Water Environ. 2013, 32, 229–238. [Google Scholar] [CrossRef]
  14. Shi, S.; Miao, Y.C.; Wu, H.K.; Xu, Z.P.; Liu, C.W. The stress evolution of adjacent working faces passing through an abandoned roadway and the damage depth of the floor. Energies 2022, 15, 5824. [Google Scholar] [CrossRef]
  15. Zhou, X.X.; Ouyang, Z.H.; Sun, B.C. An approach to dynamic disaster prevention in strong rock burst coal seam under multi-aquifers: A case study of Tingnan coal mine. Energies 2021, 14, 7287. [Google Scholar] [CrossRef]
  16. Xu, D.J.; Peng, S.P.; Xiang, S.Y.; He, Y.L. A novel caving model of overburden strata movement induced by coal mining. Energies 2017, 10, 476. [Google Scholar] [CrossRef] [Green Version]
  17. Zeng, Y.F.; Wu, Q.; Liu, S.Q.; Zhai, Y.L.; Lian, H.Q.; Zhang, W. Evaluation of a coal seam roof water inrush: Case study in the Wangjialing coal mine, China. Mine Water Environ. 2018, 37, 174–184. [Google Scholar] [CrossRef]
  18. Zeng, Y.F.; Wu, Q.; Du, X.; Liu, S.Q.; Zan, J.C.; Dou, G.D.; Wu, Z.T. Further research on“water-richness index method”for evaluation of aquifer water abundance. J. China Coal Soc. 2020, 45, 2423–2431. [Google Scholar]
  19. Liu, Y.; Zhu, J.Z.; Liu, Q.M.; Yuan, A.Y.; He, S.F.; Bai, Y.S. Mechanism Analysis of Delayed Water Inrush from Karst Collapse Column during Roadway Excavation Based on Seepage Transition Theory: A Case Study in PanEr Coal Mine. Energies 2022, 15, 4987. [Google Scholar] [CrossRef]
  20. Liu, W.T.; Zheng, Q.S.; Pang, L.F.; Dou, W.M.; Meng, X.X. Study of roof water inrush forecasting based on EM-FAHP two-factor model. Math. Biosci. Eng. 2021, 18, 4987–5005. [Google Scholar] [CrossRef]
  21. Gao, C.Y.; Wang, D.L.; Liu, K.R.; Deng, G.W.; Li, J.F.; Jie, B.L. A multifactor quantitative assessment model for safe mining after roof drainage in the Liangshuijing coal mine. ACS Omega 2022, 7, 26437–26454. [Google Scholar] [CrossRef]
  22. Liu, S.L.; Li, W.P. Fuzzy comprehensive risk evaluation of roof water inrush based on catastrophe theory in the Jurassic coalfield of northwest China. J. Intell. Fuzzy Syst. 2019, 37, 2101–2111. [Google Scholar] [CrossRef]
  23. Wu, Q.; Liu, Y.Z.; Zhou, W.F.; Li, B.Y.; Zhao, B.; Liu, S.Q.; Sun, W.J.; Zeng, Y.F. Evaluation of water inrush vulnerability from aquifers overlying coal seams in the Menkeqing coal mine, China. Mine Water Environ. 2015, 34, 258–269. [Google Scholar] [CrossRef]
  24. Zhang, W.Q.; Li, B.; Yu, H.L. The correlation analysis of mine roof water inrush grade and influence factors based on Fuzzy Matter-Element. J. Intell. Fuzzy Syst. 2016, 31, 3163–3170. [Google Scholar] [CrossRef]
  25. Yin, H.Y.; Zhao, H.; Xie, D.L.; Sang, S.Z.; Shi, Y.L.; Tian, M.H. Mechanism of mine water inrush from overlying porous aquifer in quaternary: A case study in Xinhe coal mine of Shandong Province, China. Arab. J. Geosci. 2019, 12, 163. [Google Scholar] [CrossRef]
  26. Xiao, L.L.; Wu, Q.; Niu, C.; Dai, G.L.; Wang, S.Q.; Ren, D.J.; Luo, S.T. Application of a new evaluation method for floor water inrush risk from the Ordovician fissure confined aquifer in Xiayukou coal mine, Shanxi, China. Carbonates Evaporites 2020, 35, 97. [Google Scholar] [CrossRef]
  27. Zhang, W.; Li, w.; Huang, Y.L.; Ouyang, S.Y.; Ma, K.; Li, J.M.; Gao, H.D.; Zhang, P. A case study of the water abundance evaluation of roof aquifer based on the development height of water-conducting fracture zone. Energies 2020, 13, 4095. [Google Scholar]
  28. Wu, Q.; Zhao, D.K.; Wang, Y.; Shen, J.J.; Mu, W.P.; Liu, H.L. Method for assessing coal-floor water-inrush risk based on the variable-weight model and unascertained measure theory. Hydrogeol. J. 2017, 25, 2089–2103. [Google Scholar] [CrossRef]
  29. Wang, E.Y. Seueral problems of little faults study in coal mining. China Min. 2006, 8, 60–62. [Google Scholar]
  30. Cao, D.Y.; Zhou, Y.X.; Wet, Y.C. Development of the quantitative evaluation information system of mining geology structure. J. China Coal Soc. 2002, 4, 379–382. [Google Scholar]
  31. Yin, H.Y.; Shi, Y.L.; Niu, H.G.; Xie, D.L.; Wei, J.C.; Lefticariu, L.; Xu, S.X. A GIS-based model of potential groundwater yield zonation for a sandstone aquifer in the Juye Coalfield, Shangdong, China. J. Hydrol. 2018, 557, 434–447. [Google Scholar] [CrossRef]
  32. Park, I.; Kim, S.; Lee, S. Groundwater Productivity Potential Mapping Using Evidential Belief Function. Groundwater 2014, 52, 201–207. [Google Scholar] [CrossRef] [PubMed]
  33. Li, Z.; Chen, S.J.; Gong, H.J.; Niu, P.K.; Zeng, Y.F. Risk Evaluation of Water Inrush in Poor Water Yield Capacity Aquifer of Coal Seam Direct Roof. Coal Mine Saf. 2018, 49, 181–184. [Google Scholar]
  34. Xiao, L.L.; Niu, C.; Dai, G.L.; Nie, W.J.; Zhang, H.T.; Gao, Y.F. Evaluation of water abundance in Zhiluo formation based watery structure index method. Coal Sci. Technol. 2018, 46, 207–213. [Google Scholar]
  35. Zhu, Z.K.; Xu, Z.M.; Sun, Y.J.; Huang, X.L. Research on the risk evaluation methods of water inrush from coal floor based on dimensionless multi-source information fusion technique. J. Min. Saf. Eng. 2013, 30, 911–916. [Google Scholar]
  36. Paradowski, B.; Shekhovtsov, A.; Baczkiewicz, A.; Kizielewicz, B.; Salabun, W. Similarity analysis of methods for objective determination of weights in multi-criteria decision support systems. Symmetry 2021, 13, 1874. [Google Scholar] [CrossRef]
  37. Zeng, Y.F.; Wu, Q.; Liu, S.Q.; Zhai, Y.L.; Zhang, W.; Liu, Y.Z. Vulnerability assessment of water bursting from Ordovician limestone into coal mines of China. Environ. Earth Sci. 2016, 75, 1431. [Google Scholar] [CrossRef]
  38. Barbara, W.; Zbigniew, F. Priorities for Research on Sustainable Agriculture: The Case of Poland. Energies 2022, 15, 257. [Google Scholar]
  39. Razandi, Y.; Pourghasemi, H.R.; Neisani, N.S.; Rahmati, O. Application of analytical hierarchy process, frequency ratio, and certainty factor models for groundwater potential mapping using GIS. Earth Sci. Inform. 2015, 8, 867–883. [Google Scholar] [CrossRef]
  40. Malczewski, J. GIS and Multicriteria Decision Analysis; Wiley: New York, NY, USA, 1999; pp. 177–192. [Google Scholar]
  41. Adiat, K.A.N.; Nawawi, M.N.M.; Abdullah, K. Assessing the accuracy of GIS-based elementary multi criteria decision analysis as a spatial prediction tool—A case of predicting potential zones of sustainable groundwater resources. J. Hydrol. 2012, 440–441, 75–89. [Google Scholar] [CrossRef]
  42. Abdel-Basset, M.; Mohamed, R. A novel plithogenic TOPSIS- CRITIC model for sustainable supply chain risk management. J. Clean. Prod. 2020, 247, 119586. [Google Scholar] [CrossRef]
Figure 1. Location map of Jining No. 3 coal mine. ((a) Jining No. 3 coal mine location on the map of China, (b) Traffic location map of Jining No. 3 coal mine).
Energies 16 00114 g001
Figure 2. Stratigraphic column.
Energies 16 00114 g002
Figure 3. Sketch map of structural geology in Jining No. 3 coal mine.
Energies 16 00114 g003
Figure 4. Factors of roof water inrush of aquifer properties: (a) burial depth (Dp); (b) aquifer thickness (Tk); (c) core collection rate (Cr); (d) brittle–plastic rock thickness ratio (Tkr); (e) number of aquifers and barriers (Num).
Energies 16 00114 g004aEnergies 16 00114 g004b
Figure 5. Factors of roof water inrush in development height of water-conducting fracture zone.
Energies 16 00114 g005
Figure 6. Factors of roof water inrush in geological structure: (a) fault density (Fd); (b) fault frequency density (Ff); (c) fault size index (Fs); (d) coefficient of variation in inclination angle of coal floor (CDVAC).
Energies 16 00114 g006
Figure 7. Statistics of the RIWI values. (a) frequency histogram and natural break points distribution (b) cumulative frequency histogram.
Energies 16 00114 g007
Figure 8. Dangerous zoning of water inrush from the roof of the lower No. 3 coal seam.
Energies 16 00114 g008
Table 1. Random consensus index (RI).
n1234567891011
RI000.520.891.121.261.361.411.461.491.51
Table 2. The weight of each evaluation index based on the AHP method.
SuperiorUnderlying FactorsSibling WeightGlobal Weight
Aquifer properties
0.5278
Dp0.1111 0.0586
Tk0.55560.2932
Cr0.11110.0586
Tkr0.11110.0586
Num0.11110.0586
Fracture zone development
0.3325
H10.3325
Geological structure
0.1396
Fd0.50.0698
Ff0.16670.0233
Fs0.16670.0233
CDVAC0.16670.0233
Table 3. Weight of each evaluation index based on the CRITIC method.
Evaluation IndexIndex VariabilityIndex ConflictAmount of InformationWeight
Dp0.2517.7361.94210%
Tk0.2818.1082.27812%
Cr0.23111.8232.72714%
Tkr0.2477.891.94810%
Num0.2049.4911.93610%
H0.2537.1861.81710%
Fd0.1457.6951.1156%
Ff0.1587.9661.2577%
Fs0.2618.1992.13711%
CDVAC0.2148.6161.84410%
Table 4. Comprehensive weight based on the AHP-CRITIC method.
Evaluation IndexDpTkCrTkrNumHFdFfFsCDVAC
Weight0.0580.3390.0810.0580.0580.3060.0390.0150.0250.022
Table 5. Threshold value natural break point classification.
Natural Break Point DistributionRange of ThresholdRisk Level
Break PointFrequency Distribution (Percentage of the Total Data)Gradient Change
0.2530%+665F < 0.25low
0.4069%−840.25 < F < 0.40medium
0.84100%31,230 (total data)0.40 < Fhigh
Table 6. Water inrush points (WIPs) located in the mine.
NO.Risk AreaLocationWater Quantity (m3/h)Water SourceNO.Risk AreaLocationWater Quantity (m3/h)Water Source
1HighNo. 1660Roof of CB333MediumNo. 6120Roof of CB3
23534368
33035180
4No. 630036236.7
56437527.13
6175.638296
7194.6639112
843040No. 770
9274.841105
107542No. 165
11974396Lower Jurassic conglomerate and roof of CB3
1215044533.84
134645497
1446046232
1526047No. 5259
1635048268
1718749LowNo. 1140
18385084.6
19No. 448.45140.3
20126.452West return airway49.8Roof of CB3
21No. 1170Lower Jurassic conglomerate and roof of CB353West auxiliary transportation roadway116
2214054No. 6251.6
23137.555402.2
247256No. 545
25905775
261335848
271405945
28120
29110
30105
31No. 5137
32No. 181Floor of CB3
Disclaimer/Publisher’s Note: The statements, opinions and data contained in all publications are solely those of the individual author(s) and contributor(s) and not of MDPI and/or the editor(s). MDPI and/or the editor(s) disclaim responsibility for any injury to people or property resulting from any ideas, methods, instructions or products referred to in the content.

