Abstract
In this article, energy optimization of the cooling system of IKEA Budaörs is carried out. The cooling system is served by a centrifugal water chiller and includes a large-volume cooling buffer tank. The facility operates the hydraulic system of the buffer storage tank only during the transitional period. The main goal is to reduce energy consumption by changing the operating strategy of the existing system. To test the operating strategies, the operation and the thermal load of the shopping center during the summer season had to be simulated to find the best operation strategy. A hybrid method (real data and calculated values) was used in the simulation. The three operating scenarios examined show that the annual energy consumption and the number of operating hours of the chiller can be reduced by using the buffer tank with the right strategy. In the examined scenarios, a 30% energy improvement was achieved. The possibility of using a buffer tank is significantly limited by the fact that the heat exchangers were sized for low forward water temperatures. By re-sizing the heat exchangers, the utilization of the buffer tank could be considerably improved in conditions close to peak heat load.
1. Introduction
Buildings are responsible for a significant part of energy use in total energy consumption [1,2]. Recent dramatic changes in energy prices are expected to have a major impact on the way buildings are operated [3]. Total energy use in buildings increased by 8.4% over the last decade [4]; therefore, it is essential that we minimize this as much as possible as it represents a crucial task in the building sector [5]. The growth can be linked to climate change (longer cooling season) and the increase in comfort needs [6,7]. The European Parliament has a target to reduce energy consumption by 42.5% compared to 2007 levels [8]. An energy efficiency improvement of an existing building can be achieved by renovating the external building facade to reduce transmission losses through these structures [9,10,11]. Without renovation, one of the solutions for energy-saving purposes is if the building is integrated with renewable energies [12]. If none of the above-mentioned solutions can be applied, a different approach needs to be found to improve energy consumption. First, the building’s energy benchmarking is important [13]. Previous research has focused on using different methods and models to estimate the energy consumption of buildings [4,14,15,16,17,18,19]. One of these models for estimation is the use of energy simulation software, which calculates the heat loss and heat gain of a building with a given set of parameters, from which we can generate energy consumption. Another way of estimating consumption is the engineering method, where physical principles and empirical results are used. Several studies have used mathematical models to investigate heat loss and heat loads in buildings using polynomial regression and D-optimal design [14]. In the optimization process, algorithms were used to estimate the energy demand of a building as accurately as possible. With such a method, the estimation is highly dependent on the model parameters and the accuracy of the input data. In addition, the data-driven method can also be used, where the estimate is made by processing the actual consumption data of a building [16]. In this case, the estimation of future energy consumption can be predicted more accurately if there are no changes in the building’s operational needs and habits. The more annual energy consumption and meteorological data are gathered, the more accurately future energy consumption can be estimated. If the physical parameters of a building do not change, i.e., the building it is not upgraded, energy savings cannot be expected, unless an alternate building operating strategy is applied. In this article, a hybrid method is used and focuses on the summer cooling season, which investigates how to reduce the energy consumption of an existing building by changing the operating strategy of the systems used in the building. In summer, the cooling and ventilation systems consume the most energy in the building; therefore, optimizing the operation of cooling systems is important. Energy storage solutions are often used to separate production and consumption in time, allowing the cooling equipment to operate under more favorable operating conditions even at reduced loads. The impact of different cooling and storage methods are investigated using data from a real facility, to illustrate the differences in seasonal energy consumption. This study will focus on what prevents the use of stored energy in a real building, where the weak points of the system are, and what losses occur. The data and the mechanical system of the IKEA shopping center in Budaörs, Hungary were examined under different cooling modes. During the investigation, the hardware part of the mechanical system is not altered; only the automation control of the mechanical system is modified.
2. Materials and Methods
The examined facility is the IKEA Budaörs shopping center. This facility was built in 1999 and has a floor area of 12,400 m2. It is located in Budaörs in Hungary, in the vicinity of the capital (47.45404, 18.94016 m: 131 m). The building is constructed from a concrete frame with sandwich panel walls. The shopping center has two floors. The main areas on the ground floor are the market hall (see Figure 1a–yellow), the self-serve furniture area (see Figure 1a–green), and the check-out area (see Figure 1a–grey). The showroom sales area (see Figure 1b–peach), kitchen, and restaurant areas (see Figure 1b–purple), the workers’ restrooms and common area, offices (see Figure 1b–orange), and the building’s maintenance rooms are located on the first floor (see Figure 1b–brown). The first floor has a floor area of 7545 m2. The market hall and showroom areas have a maze-like design. Insufficient natural light reaches these areas; therefore, a significant amount of artificial light sources provide the appropriate amount of light. The people inside initiate a significant internal heat gain and fresh air demand, which must be dealt with by the building service systems. The areas most loaded by visitors are the market hall, showroom, restaurant area, and check-out area.
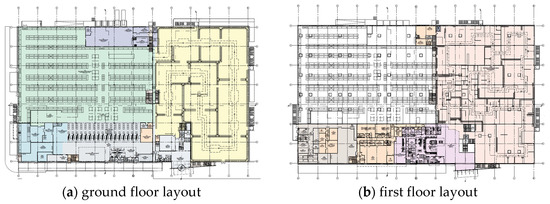
Figure 1.
Shopping center layout with color schemes.
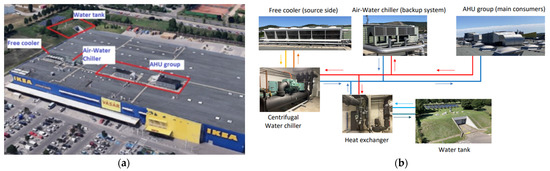
The required cooling and fresh air load are provided by the air handling unit (AHU) group (Figure 2 and Figure A1). The AHUs regulate the amount of fresh air supplied based on the signal from the CO2 sensors installed in the exhaust ducts. The shopping center requires the CO2 concentration level to not exceed 1000 ppm. The AHUs are equipped with a recirculation damper. If the air quality in the shopping center is adequate, the automatic system decides, according to energetic aspects, that by using 100% fresh air or by mixing and tempering the indoor air, it can serve the cooling needs of the shopping center with less mechanical cooling. The cooling requirements are provided by a complex cooling system. Originally, a compact water chiller was placed on the roof when the facility was built. This chiller unit remains on standby as a backup system to this day (Figure 2 and Figure A2). The cooling demand is currently served by a YORK YMC2 type centrifugal compressor water chiller unit [20] (Figure 2 and Figure A3). The source side of the equipment is served by the free cooler unit located on the roof (Figure 2 and Figure A4). The shopping center has an underground fire water storage tank with a volume of 600 m3. The fire water storage tank was prepared to be used as a cooling buffer tank [21] (Figure 2, Figure A5 and Figure A6). The storage tank is connected to the cooling hydraulic system through a heat exchanger [22] (Figure 2 and Figure A7). Currently, the cooling energy stored in the storage tank is used exclusively at the beginning of the cooling season. After discharging the water tank, which is cooled down during the winter season, the system switches to direct mechanical cooling. During the investigation, the main goal is to modify the buffer tank charging and discharging operation strategy to reduce the energy consumption of the mechanical cooling system.
To be able to examine the effect of the cooling buffer storage tank, it is necessary to model the development of the thermal load of the shopping center. (Figure 3) In addition to the external effects, the cooling demand in the shopping center is significantly influenced by internal heat gains. In addition to the human heat load, significant lighting power was installed, especially in the showroom and market place areas, whose radiant heat effect significantly affects the sense of comfort.
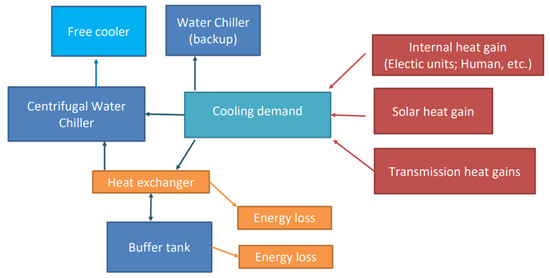
Figure 3.
Scheme of energy flow.
For the investigated summer periods (2019–2021), the data on the external meteorological parameters, the operating parameters of the mechanical systems, the operation of light fixtures, and the number of visitors were made available by the facility (in 10 min increments) (Table 1). Out of the given data, for the annual estimation of energy consumption, the year 2019 was taken into consideration as the other years were affected by the pandemic. Based on the data received, a model was created to estimate the cooling energy demand. The model was validated based on the measured consumption data of the shopping center and the logged data of the cooling and ventilation systems.

Table 1.
Received data for the facility.
Currently, the YORK YMC2 type water chiller with a centrifugal compressor serves the cooling needs of the building. The specificity of the centrifugal compressor units is that the EER is highly dependent not only on the outdoor temperature, but also on the compressor’s degree of expansion [23]. Hence, operating water chillers with centrifugal compressors at part load can achieve significant efficiency improvements [24]. Therefore, if the chiller runs at night on part load, an improved EER can be achieved (Figure 4).
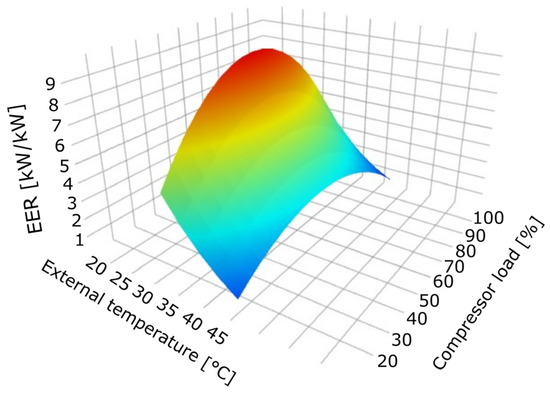
Figure 4.
Working field of the YORK YMC2 water chiller depending on external air temperature and compressor load percentage.
If the water chiller serves a system directly without cooling energy buffer storage, the instantaneous cooling demand of the facility will always determine the compressor capacity. If the hydraulic system includes a cooling buffer storage tank, that would allow the water chiller to operate under more optimal conditions, as the production and consumption of the cooling load can be separated in time. This study aims to develop an operating strategy that minimizes the energy consumption of the cooling system without modifying the mechanical system.
Given the above data, the energy use of the cooling system was compared in the following cases:
- Cooling energy is provided by the centrifugal water chiller (scenario 1);
- The cooling energy is provided by the centrifugal chiller, using the cooling buffer tank:
- 0:00–5:00 charging; discharging when tmean;w.tank < treq.sup.c.w. (scenario 2);
- 0:00–5:00 charging, discharging just after 12:00 when tmean;w.tank < treq.sup.c.w. (scenario 3).
A dynamic simulation was performed in MATLAB to compare the scenarios based on MSZ EN 832:2002 standard [17,25,26]. In the simulation, the thermal calculations were carried out using Winwatt software [27,28,29,30]. The list of standards used by the software can be found in the Appendix A Table A1. With the result of the heat gain calculation, the heat gain coefficient was determined. The heat load was calculated considering the real visitor data of the shopping center. From the number of visitors, we can deduce the primary heat loads they generate (metabolic heat, fresh air demand) and the secondary heat loads (kitchen waste heat, other waste heat related to the number of people) depending on the occupancy of the building. The shopping center area is illuminated by light sources that can be dimmed. The schedule of the luminaires was used to simulate the internal heat load they generate. From a refrigeration point of view, one of the largest consumers are the AHUs. The operation of the AHUs and their cooling requirements were simulated, considering their operating modes. The fresh air ratio and total air delivery required at a given moment in time were obtained from the data of the shopping center building management system (BMS). The data for the external air parameters were taken from IKEA’s measurements. Data were available in 10 min increments for the period 1 May–30 September 2019. The building is currently operating according to scenario 1. The model has been validated with data from scenario 1.
Based on the BMS calculations, the automation system always selects the mode with the lowest energy consumption. The air handling unit operates in the following modes:
- Free cooling mode;
- Comfort mode:
- Based on CO2 signal (<1000 PPM);
- Based on 100% fresh air.
Thanks to the energy-optimizing control of the air handling unit, the required mechanical cooling demand can be significantly reduced during the cooling season. The use of a buffer tank requires the average temperature of the tank to be lower than the supply temperature required by the cooling system. The required supply temperature depends largely on the sizing of the heat exchangers. The air handling units were not designed to maximize the buffer tank discharge, so they were sized for low refrigerant temperatures (7/12 °C). The current heat exchanger logarithmic mean temperature difference in the scaling state is 16.3 °C (Figure 5). The above conditions reduce the utilization potential of the buffer tank, which has been taken into account in the calculations.
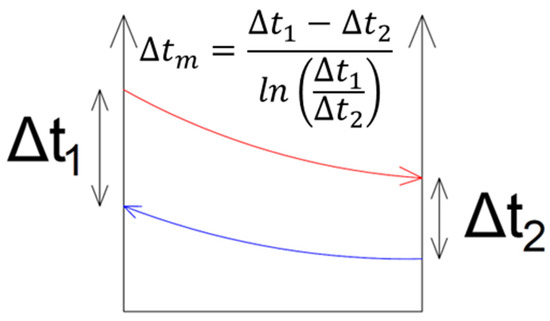
Figure 5.
Logarithmic mean temperature difference. (blue line: cooling water in the heat exchanger, red line: air temperature in the heat exchanger).
For the simulation, a compressor capacity of 60% was assumed when cooling the buffer tank, as this is close to the maximum efficiency of the centrifugal compressor water chiller.
The shopping center management set the indoor air temperature during the cooling season to be 20 °C at the lowest and not exceed 26 °C. According to standard MSZ CR 1752:2000, these temperatures in shops and warehouses are in category C [31]. The simulation was carried out taking these conditions into account. In the simulation, the calculation was made so that the medium temperature of the buffer tank is cooled below 9 °C.
3. Results and Discussion
Based on the measured and simulated results, the peak mechanical cooling demand for the season under study was 620 kW, with a total cooling energy demand of 346619 kWh. In all the cases examined, the aim was to satisfy the mechanical cooling demand. Depending on the cooling demand and the instantaneous EER of the water chiller, the required electrical power demand can be determined.
In scenario 1, producing as much cooling power as the instantaneous cooling demand is always required. If scenario 2 and 3 is examined, the cooling energy production and consumption time can be separated by the cooling buffer. In scenario 2, significantly more cooling energy is used at the beginning of the cooling season compared to scenario 3 (Figure 6). This is because the average temperature of the water tank is lower than the required supply cooling water temperature, and the average amount of energy input, on days with a lower peak temperature, is sufficient to serve the cooling alone. As the daily demand for cooling energy increases, the balance between energy input and energy output changes. When the daily cooling energy demand becomes higher than the average energy produced, additional cooling power needs to be used, either during the day or during the night.
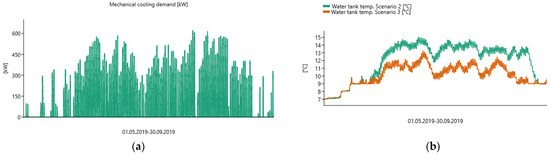
Figure 6.
(a) Mechanical cooling demand, (b) water tank temperatures in different scenarios.
In scenario 2, the tank serves cooling purposes without a time limit, so that a significant part of the stored energy is used during the first days of the season with high heat loads. The temperature of the tank then rises significantly, which reduces the potential of the cooling water in the tank to be used, because, with cooling water with a higher supply temperature, only less cooling capacity can be transferred by a given cooling heat exchanger. This means that with the higher temperature cooling water, only periods with lower cooling demands can be served (e.g., early morning, late afternoon).
In scenario 3, no energy is used from the buffer tank before noon. This means less energy is used at the beginning of the season, so the average temperature of the tank rises less. As a result, from the second third of the season, more cooling energy is used from the cooling tank in scenario 3 than in scenario 2.
During a summer day in the first third of the season (Table 2), in the case of scenario 1, the water chiller operates with good efficiency thanks to the low external air temperature and the fact that it is operated at part load. Considering the cooling energy demand during the whole day, the water chiller does not reach 60% load, so it can operate with a high EER. In the case of scenarios 2 and 3, at night, the system was able to store more energy in the buffer tank than needed to be used on that day. As the average temperature of the buffer tank is low (9–10 °C), the supply water temperature is always sufficient for the heat exchangers. Accordingly, in scenario 2 the total daily cooling demand is covered by the buffer tank and because less energy is used from the tank during the day than produced, the average tank water temperature is lower at the end of the day (24:00, midnight) than at the beginning of the day (0:00). In scenario 3, tank discharge was not allowed until noon, so the compressor operating time was longer than in scenario 2. The lower energy consumption from the buffer tank resulted in a lower average tank water temperature at the end of the day (9.5 °C) in scenario 3 than in scenario 2 (10.7 °C). In the middle of the season, the average water temperature of the buffer tank in scenarios 2 and 3 is significantly different from each other, which affects the usability of the buffer tank. In the case of the hot day from the middle of the season, the initial average temperature of the tank at 0:00 is 15.2 °C in scenario 2 and 12.1 °C in scenario 3 (Table 3).
Table 2.
External air temperature, buffer tank temperature, mechanical cooling demand, and chiller energy consumption, for a summer day.
Table 3.
External air temperature, buffer tank temperature, mechanical cooling demand, and chiller energy consumption, for a hot day.
If scenario 1 is considered, due to the higher heat load and higher external air temperature rise, the water chiller is operating under more unfavorable conditions than in the previous case, and the daily cooling energy produced is significantly higher.
In scenarios 2 and 3, the total cooling energy produced is less than in scenario 1, so the system used the extra energy stored in the buffer tank from the previous days. The average temperature of the tank did not allow the buffer tank to be operated during peak periods, so the water chiller served the cooling needs.
In scenario 3, the required supply water temperature was higher than the average temperature of the tank, so the maximum power required by the water chiller was reduced from 448.5 kW to 406.8 kW. The energy consumption of the water chiller was significantly lower than in scenarios 1 and 2.
The EER of the water chiller with a centrifugal compressor depends significantly on the degree of expansion of the compressor. This means that on summer days with high heat loads, the equipment has significantly higher energy consumption. A good example of such a case is the selected torrid day (Table 4).
Table 4.
External air temperature, buffer tank temperature, mechanical cooling demand, and chiller energy consumption, for a torrid day.
On the examined torrid day in scenario 1, the EER value of the equipment is notably worse than on the days examined previously (daily EER: 2.45). In the third part of the season, the temperature of the cooling buffer tank is higher, which reduces the time of use. Since the cooling heat exchangers of the AHUs were sized for low supply water temperature (7 °C), the energy in the tank cannot be used in cases close to the sizing condition.
Despite the above, the energy consumption of the water chiller was lower in both scenarios 2 and 3 (scenario 2: 5946.2kWh; scenario 3: 5924.0kWh), with the total cooling energy produced being higher than in scenario 1 (5512.2 kWh). As can be seen in Table 4, in scenarios 2 and 3, the produced mechanical cooling energy is higher than the required mechanical cooling energy. This anomaly is caused by the buffer tank’s charging and discharging energy difference. By re-sizing the cooling heat exchangers, the utilization of the buffer tank can be improved. Even though the produced energy is higher, the chiller energy consumption is lower in scenarios 2 and 3, thanks to a better energy efficiency rate. For the possible finding of the system imperfections, it would be interesting to use an exergy-based method to improve the assessment and optimization activities [32].
By examining the whole season, the lowest energy consumption was achieved in scenario 3. However, scenario 2 differed only slightly from scenario 3. For scenarios 2 and 3, the compressor operating hours are remarkably reduced. (Table 5).
Table 5.
Energy consumption of cooling, operating hours, seasonal energy efficiency ratio.
When calculating the SEER of the cooling system, the energy consumption of the pumps serving the hydraulic system of the buffer tank was also taken into account. The SEER value for scenarios 2 and 3 considerably exceeded that of scenario 1.
4. Conclusions
Based on the scenarios examined, the change in the tank’s mid-year temperature has a significant impact on the buffer tank’s utilization. The examined hot day was from the second half of the year when the water temperature in the buffer tank was significantly higher than the average temperature at the beginning of the year. This effect should be considered when sizing the tank.
In addition to the above, the following conclusions can be drawn from the simulation:
- The use of a buffer tank can achieve notably seasonal efficiency improvements for water chillers with centrifugal compressors (in the case examined, between 27.4% and 30.3%);
- By using a buffer tank, the energy demand of the cooling system can be significantly reduced (in the case examined, between 14.6% and 15.0%);
- By using a buffer tank, the seasonal operating time of the water chiller can be remarkably reduced (in our case: between 13.8% and 29.9%);
- For scenario 3, after the first third of the cooling period, less energy is consumed compared to scenario 2;
- The utilization of the buffer tank is severely limited by the design of the heat exchangers for low supply water temperatures, so operation from the buffer tank is not possible during peak heat load periods;
- By re-sizing the cooling heat exchangers (at least 12 °C supply water temperature), the utilization of the buffer tank can be improved.
Author Contributions
Conceptualization, I.C., A.K., C.B and S.S.; Methodology, A.K., C.B and S.S.; Software, C.B., A.K. and S.S.; Validation, C.B., A.K. and S.S.; Formal Analysis, I.C., C.B., A.K. and S.S.; Investigation, I.C., C.B., A.K. and S.S.; Resources, I.C., C.B., A.K. and S.S.; Data Curation, I.C., C.B., A.K. and S.S.; Writing—Original Draft Preparation, I.C., C.B., A.K. and S.S.; Writing—Review & Editing, I.C., C.B., A.K. and S.S.; Visualization, I.C., C.B., A.K. and S.S.; Supervision, I.C. Project administration, I.C.; Funding acquisition, I.C. All authors have read and agreed to the published version of the manuscript.
Funding
Project no. TKP2021-NKTA-34 has been implemented with the support provided by the Ministry of Innovation and Technology of Hungary from the National Research, Development and Innovation Fund, financed under the TKP2021-NKTA funding scheme.
Data Availability Statement
Not applicable.
Conflicts of Interest
The authors declare no conflict of interest.
Appendix A
Table A1.
Standards used for calculations.
Table A1.
Standards used for calculations.
| Thermal calculations | MSZ-04-140-2:1991 |
| MSZ-04-140-3:1991 | |
| MSZ-04-140-4:1978 | |
| MSZ EN ISO 13370:2017 | |
| MSZ EN 12831:2017 | |
| Thermal and moisture properties of building materials and products | MSZ EN ISO 10456:2008 |
| Thermal bridge calculations | MSZ EN ISO 6946:2017 |

Figure A1.
AHUs.

Figure A2.
Water chiller.

Figure A3.
YORK YMC2 type centrifugal compressor water chiller.

Figure A4.
Free cooler.

Figure A5.
Buffer tank on the remote monitoring system.

Figure A6.
Fire water storage tank (buffer tank).

Figure A7.
Heat exchanger.
References
- Antoniadou, P.; Papadopoulos, A.M. Occupants’ thermal comfort: State of the art and the prospects of personalized assessment in office buildings. Energy Build. 2017, 153, 136–149. [Google Scholar] [CrossRef]
- EU Parliament. EU of the European Parliament and of the Council; Directive 2010/31; EU Parliament: Strasbourg, France, 2010.
- Average Monthly Electricity Wholesale Prices in Selected Countries in the European Union (EU) from January 2020 to October 2022. Available online: https://www.statista.com/statistics/1267500/eu-monthly-wholesale-electricity-price-country/ (accessed on 18 October 2022).
- Mui, K.W.; Satheesan, M.K.; Wong, L.T. Building Cooling Energy Consumption Prediction with a Hybrid Simulation Approach: Generalization beyond the Training Range. Energy Build. 2022, 276, 112502. [Google Scholar] [CrossRef]
- Kalmár, F.; Kalmár, T. Interrelation between mean radiant temperature and room geometry. Energy Build. 2012, 55, 414–421. [Google Scholar] [CrossRef]
- Wang, X.; Chen, D.; Ren, Z. Assessment of climate change impact on residential building heating and cooling energy requirement in Australia. Build. Environ. 2010, 45, 1663–1682. [Google Scholar] [CrossRef]
- Huang, K.-T.; Hwang, R.-L. Future trends of residential building cooling energy and passive adaptation measures to counteract climate change: The case of Taiwan. Appl. Energy 2016, 184, 1230–1240. [Google Scholar] [CrossRef]
- The European Parliament and the Council of the European Union. Directive 2012/27/EU of the European Parliament and of the Council of 25 October 2012 on energy efficiency, amending Directives 2009/125/EC and European Union. Off. J. Eur. Union 2012, 315, 1–56. [Google Scholar]
- Ahmad, T.; Chen, H.; Guo, Y.; Wang, J. A comprehensive overview on the data-driven and large scale based approaches for forecasting of building energy demand: A review. Energy Build. 2018, 165, 301–320. [Google Scholar] [CrossRef]
- Szodrai, F.; Lakatos, Á.; Kalmár, F. Analysis of the change of the specific heat loss coefficient of buildings resulted by the variation of the geometry and the moisture load. Energy 2016, 115, 820–829. [Google Scholar] [CrossRef]
- Cabeza, L.F.; Castell, A.; Medrano, M.; Martorell, I.; Pérez, G.; Fernandez, A.I. Experimental study on the performance of insulation materials in Mediterranean construction. Energy Build. 2010, 42, 630–636. [Google Scholar] [CrossRef]
- Tiwari, G.; Mishra, R.; Solanki, S. Photovoltaic modules and their applications: A review on thermal modelling. Appl. Energy 2011, 88, 2287–2304. [Google Scholar] [CrossRef]
- Djuric, N.; Novakovic, V. Review of possibilities and necessities for building lifetime commissioning. Renew. Sustain. Energy Rev. 2009, 13, 486–492. [Google Scholar] [CrossRef]
- CRobinson, C.; Dilkina, B.; Hubbs, J.; Zhang, W.; Guhathakurta, S.; Brown, M.A.; Pendyala, R.M. Machine learning approaches for estimating commercial building energy consumption. Appl. Energy 2017, 208, 889–904. [Google Scholar] [CrossRef]
- Amasyali, K.; El-Gohary, N.M. A review of data-driven building energy consumption prediction studies. Renew. Sustain. Energy Rev. 2018, 81, 1192–1205. [Google Scholar] [CrossRef]
- Zhao, H.-X.; Magoulès, F. A review on the prediction of building energy consumption. Renew. Sustain. Energy Rev. 2012, 16, 3586–3592. [Google Scholar] [CrossRef]
- Kumar, R.; Aggarwal, R.; Sharma, J. Energy analysis of a building using artificial neural network: A review. Energy Build. 2013, 65, 352–358. [Google Scholar] [CrossRef]
- Fumo, N. A review on the basics of building energy estimation. Renew. Sustain. Energy Rev. 2014, 31, 53–60. [Google Scholar] [CrossRef]
- Ngo, N.-T.; Pham, A.-D.; Truong, T.T.H.; Truong, N.-S.; Huynh, N.-T.; Pham, T.M. An Ensemble Machine Learning Model for Enhancing the Prediction Accuracy of Energy Consumption in Buildings. Arab. J. Sci. Eng. 2022, 47, 4105–4117. [Google Scholar] [CrossRef]
- YMC2 Magnetic Bearing Centrifugal Chiller. Available online: https://www.york.com/commercial-equipment/chilled-water-systems/water-cooled-chillers/ymc2_ch/ymc-magnetic-bearing-centrifugal-chiller (accessed on 20 October 2022).
- Renedo, C.; Ortiz, A.; Pérez, S.; Delgado, F.; Fernández, I.; Carcedo, J. Improving the efficiency of an air conditioning system using a fire water tank as thermal accumulator. Build. Serv. Eng. Res. Technol. 2015, 36, 386–405. [Google Scholar] [CrossRef]
- Baur, J.M. Simulation of Energy Storage Tanks with Surface Heat Exchangers. Ph.D. Thesis, University of Wisconsin Madison, Madison, WI, USA, 1992. [Google Scholar]
- Lissandrin, M.; Rampazzo, M.; Cecchinato, L.; Beghi, A. Optimal operational efficiency of chillers using oil-free centrifugal compressors. Int. J. Refrig. 2017, 82, 83–96. [Google Scholar] [CrossRef]
- Wang, Z.; Zhong, J.; Pan, Z. Research of cooling load & chiller selection in metro station. Int. J. Low-Carbon Technol. 2020, 15, 506–512. [Google Scholar] [CrossRef]
- MSZ EN 832:2002. Thermal Performance of Buildings. Hungarian Standard Commitment: Budapest, Hungary, 2002.
- Rasouli, M.; Akbari, S.; Simonson, C.J.; Besant, R.W. Energetic, economic and environmental analysis of a health-care facility HVAC system equipped with a run-around membrane energy exchanger. Energy Build. 2014, 69, 112–121. [Google Scholar] [CrossRef]
- Kassai, M. Prediction of the HVAC Energy Demand and Consumption of a Single Family House with Different Calculation Methods. Energy Procedia 2017, 112, 585–594. [Google Scholar] [CrossRef]
- Nyers, A.; Pek, Z.; Nyers, J. Dynamical behavior of a heat pump coaxial evaporator considering the phase border’s impact on convergence. Facta Univ. Series: Mech. Eng. 2018, 16, 249–259. [Google Scholar] [CrossRef]
- Bodo, B.; Kalmár, F. Analysis of primary energy use of typical buildings in Hungary. Environ. Eng. Manag. J. 2014, 13, 2725–2731. [Google Scholar] [CrossRef]
- Bausoft. WinWatt Summer Heat Load Calculation. Available online: http://www.bausoft.hu/ww_nyari_en.htm (accessed on 7 December 2022).
- MSZ CR 1752:2000. Ventilation for Buildings. Hungarian Standard Commitment: Budapest, Hungary, 2000.
- Szabó, G.L. Exergetic optimization of absorption chillers—A case study. Case Stud. Therm. Eng. 2021, 28, 101634. [Google Scholar] [CrossRef]


Disclaimer/Publisher’s Note: The statements, opinions and data contained in all publications are solely those of the individual author(s) and contributor(s) and not of MDPI and/or the editor(s). MDPI and/or the editor(s) disclaim responsibility for any injury to people or property resulting from any ideas, methods, instructions or products referred to in the content. |
© 2022 by the authors. Licensee MDPI, Basel, Switzerland. This article is an open access article distributed under the terms and conditions of the Creative Commons Attribution (CC BY) license (https://creativecommons.org/licenses/by/4.0/).