Article

Investigation of Thermopressor with Incomplete Evaporation for Gas Turbine Intercooling Systems

1
School of Energy and Power, Jiangsu University of Science and Technology, No. 2 Mengxi Road, Zhenjiang 212003, China
2
Department of Energy and Process Engineering, Norwegian University of Science and Technology, 7491 Trondheim, Norway
3
Heat Engineering Department, Kherson Educational-Scientific Institute, Admiral Makarov National University of Shipbuilding, Ushakov Avenue 44, 73003 Kherson, Ukraine
4
Department of Air Conditioning and Refrigeration, Admiral Makarov National University of Shipbuilding, Heroes of Ukraine Avenue 9, 54025 Mykolayiv, Ukraine
*
Author to whom correspondence should be addressed.
Energies 2023, 16(1), 20; https://doi.org/10.3390/en16010020
Submission received: 12 November 2022 / Revised: 12 December 2022 / Accepted: 15 December 2022 / Published: 20 December 2022
(This article belongs to the Section J: Thermal Management)

Abstract

:
One of the promising ways to increase fuel and modern gas turbine energy efficiency is using cyclic air intercooling between the stages of high- and low-pressure compressors. For intercooling, it is possible to use cooling in the surface heat exchanger and the contact method when water is injected into the compressor air path. In the presented research on the cooling contact method, it is proposed to use a thermopressor that implements the thermo-gas-dynamic compression process, i.e., increasing the airflow pressure by evaporation of the injected liquid in the flow, which moves at near-sonic speed. The thermopressor is a multifunctional contact heat exchanger when using this air-cooling method. This provides efficient high-dispersion liquid spraying after isotherming in the high-pressure compressor, increasing the pressure and decreasing the air temperature in front of the high-pressure compressor, reducing the work on compression. Drops of water injected into the air stream in the thermopressor can significantly affect its characteristics. An increase in the amount of water increases the aerodynamic resistance of the droplets in the stream. Hence, the pressure in the flow parts of the thermopressor can significantly decrease. Therefore, the study aims to experimentally determine the optimal amount of water for water injection in the thermopressor while ensuring a positive increase in the total pressure in the thermopressor under conditions of incomplete evaporation. The experimental results of the low-consumption thermopressor (air consumption up to 0.52 kg/s) characteristics with incomplete liquid evaporation in the flowing part are presented. The research found that the relative water amount to ensure incomplete evaporation in the thermopressor flow part is from 4 to 10% (0.0175–0.0487 kg/s), without significant pressure loss due to the resistance of the dispersed flow. The relative increase in airflow pressure is from 1.01 to 1.03 (5–10 kPa). Based on experimental data, empirical equations were obtained for calculating the relative pressure increase in the thermopressor with evaporation chamber diameters of up to 50 mm (relative flow path length is from 3 to 10 and Mach number is from 0.3 to 0.8).

1. Introduction

Currently, the world’s leading industrial companies are developing new-generation engines. Such engines should have low environmental penalties and high fuel efficiency. A promising direction in achieving low environmental penalties is using new types of fuels [1] and fuel emulsions [2].
Greening of heat engines contradicts their energy efficiency because measures to reduce emissions require additional external energy costs. The peculiarities of the formation of nitrogen oxides, NOx, require the need to reduce the maximum fuel combustion temperature, but on the other hand, reducing this temperature reduces the fuel-energy efficiency of the engine [3,4,5]. Therefore, it is urgent to develop environmentally friendly and energy-efficient technologies that would ensure the reduction in emissions and, at the same time, eliminate the negative impact on the fuel and energy efficiency of the engine [6,7].
The low fuel efficiency of power plants based on existing internal combustion engines and gas turbines is due to the significant waste heat amounts, which exceed half the primary fuel heat [8,9]. Waste heat utilization in most power plants is limited to using waste gas heat for heat production in steam boilers, which is seasonal [10,11]. The high cost of replacing existing power plants with modern steam and gas turbines is challenging [12,13]. In addition, the modern power plant’s efficiency depends on climatic conditions and decreases significantly with increasing ambient temperature: every 10 °C increase in air temperature at the engine’s inlet causes an increase in fuel consumption from 0.5 to 0.7% [14,15]. Therefore, the obvious way forward is using energy-saving technologies to ensure low-potential waste heat utilization [16,17] and compensate for the rising ambient air temperature’s negative impact on the power plant’s fuel efficiency [18,19].
One of the effective ways to improve modern gas turbine energy efficiency is to use intercooling cycle air [20,21]. Such cooling is carried out between low- and high-pressure compressors [22,23]. Intercooling can be carried out using two methods [24,25]: a surface cooler (plate or tubular-plate heat exchanger) or contact cooling due to injected water evaporation. The use of surface heat exchangers is accompanied by significant aerodynamic losses [26,27]. It is simpler and more effective to use water injection into the high-pressure compressor air part [28,29]. Special high-pressure nozzles are most commonly used for water injection, but many problems exist, in particular the drops’ separation of injected water on the blades and the compressor housing [30]. Therefore, modern injection methods and preparation of the dispersed flow should provide an average droplet diameter of less than 20 to 25 μm [31].
One of the promising directions is the use of a thermopressor for cooling cycle air [29,32]. The thermopressor implements a thermo-gas-dynamic compression effect to increase the pressure during cooling in the high-dispersed liquid evaporation process, which is injected into the transonic gas flow [33].
It is necessary to use incomplete water evaporation in the thermopressor flowing part for the preparation of highly dispersed and homogeneous spraying of water [34]. When providing effective highly dispersed liquid sprays with less than 20–25 μm droplet size, there is more efficient compression process isotherming in the high-pressure compressor. Compensation for aerodynamic losses in the compressor air path and reducing the work on compression in the compressor stages is provided by increasing the pressure in the thermopressor while increasing the working fluid consumption and, consequently, increasing efficiency with decreasing specific fuel consumption [35].
However, the efficient technology-based development of the thermopressor is constrained by sufficient data from experimental tests as a cooling system part.

2. Literature Review

The main goal of developing water injection technologies in the compressor is to reduce air compression work [36,37]. In this case, the changing character and the influence of climatic and hydrometeorological conditions should be considered [38,39]. One of the first developments in this area is the Brown Boveri water injection system for gas turbine plants (1968) [40]. An exciting direction is water injection after the gas turbine compressor stage, effectively implemented in systems such as the Humidified Advanced Turbine or Humidified Air Turbine (HAT) [28]. Further developments of technologies for water injection were based on multi-stage air compression and gas expansion—Cascaded Humidified Advanced Turbine (CHAT) [41].
For an experimental two-shaft gas turbine plant AGTJ-100A, experimental studies of the contact intercooling characteristics were carried out (Japan, 1984). The relative humidity in the wind was 90% after evaporative cooling.
A promising two-stage compression technology with contact intercooling of cycling air (SPRINT) was developed by General Electric (Boston, MA, USA). Developments in this field began long ago. General Electric successfully uses the patented SPRINT technology, which provides intercooling of the working fluid by injecting dispersed water between compressors of the low- and high-pressure gas turbine LM6000 PC, one of the most popular conversion gas turbines in the range from 40 to 50 MW [42]. SPRINT technology makes it possible to increase the total gas turbine plant capacity by 8%. At the same time, the effective efficiency was 32% at an inlet air temperature of 32 °C [43]. To improve the capacity produced for hot summer days, Hitachi Ltd. (Ibaraki, Japan) developed a special water injection system for the compressor flow part (“Water Atomization Cooling”). The WAC system increases the gas turbine engine capacity by cooling the compressor air from 5 to 10%. Other advantages include reducing the exhaust gases’ nitrogen oxide concentrations and cleaning the compressor blade’s surface. The water amount supplied does not exceed 1% of the working fluid mass flow rate through the compressor.
In real conditions, effective intercooling achievement is associated with the need to solve a number of engineering problems due to the presence of the negative factors associated with the water injection into the compressor air duct [44]:
(1)
Providing highly dispersed and homogeneous injected water sprays [37,45].
(2)
Injected water drop separation on the blades and the compressor casing and related possible complications in its operation [46,47]. Due to insufficiently efficient spraying of the injected water, already in the compressor’s first stages (according to the injection area) there is an intensive drop separation on the working blades with the liquid layer formation. Moving layers are torn from the edges of the blades, resulting in the formation of so-called secondary drops, which are separated on the compressor housing [48].
(3)
Providing sufficient intensity of injected water evaporation and cooling the compressed airflow [49]. Several times less moisture evaporates from the surface of the droplets in the airflow (the evaporation share from the surface of the droplets is usually less than 20%) than from the liquid layer surface on the blades and compressor housing [50].
(4)
Mechanical losses due to the drop acceleration of the flow and rotating blades’ deceleration of the impellers drop by their repeated deposition and surface failure of the blades and housing, as well as friction, liquid layer on the blades’ surface, and compressor housing [22,51]. As a result, the stage’s internal efficiency and the compressor are reduced [52].
(5)
Blade surface protection from drop erosion when injected water collides with them [49,53].
An effective way to prevent the droplet’s separation on the blade’s surface is the implementation of an injected liquid highly dispersed spray, in which the droplets can move in the airflow to flow around the blades without colliding with them. During the liquid droplets’ evaporation of dispersed flow, the heat transfer intensity increases with a decrease in the average droplet diameter to 3 μm. This determines the compression process efficiency. This requires the implemented injection technologies to provide a highly dispersed spray of injected water in mist form [54,55].
Another effective spraying method for a highly dispersed flow is using a liquid that is superheated relative to the saturation temperature. At the same time, the spray efficiency is ensured by the instantaneous evaporation process and, as a result, the liquid droplet’s effective crushing [51,56].
Several leading modern companies (Bete Fog Nozzle (Greenfield, MA, USA), Spraying Systems Co. (Wheaton, IL, USA), and Amfog Nozzle Technology (Scottsdale, AZ, USA)) have proposed their developments to solve the problem of efficient liquid spraying. Still, the most interesting development belongs to Mee Industries Inc. (Irwindale, CA, USA). The proposed technology uses impact-type nozzles with a high-pressure water supply and provides a dispersion of less than 30 μm, which increases the gas turbine efficiency by 2% [57,58].
Another relevant concept is the use of technologies based on TOPHAT (Alpha Power Systems, Tampa, FL, USA). Its essence is to inject water superheated relative to the saturation temperature at the compressor inlet through centrifugal nozzles. When this water outflows the nozzle duct, its pressure drops sharply, and explosive boiling occurs in the volume of the formed drops, which are crushed into smaller drops [59]. The efficiency analysis and gas turbine-specific power show that the TOPHAT cycle has significantly higher efficiency (57.4%) and specific power (430 kW/kg) compared to simple cycles. In 2001, this technology was first used at a power plant in the Netherlands and is currently being implemented in many gas turbine energy systems [60].
The most intensive droplet evaporation process occurs directly in the sprayed water fluent [36]. In particular, it is known that in the first second, a drop having an initial diameter of 14 μm has time to decrease to a size less than 5 μm. In addition, in experimental studies, it was found that if the droplet diameter does not exceed 10 μm, the centrifugal energy effect on the droplet is nearly negligible, and the droplets move in the direction of the airflow. The installed nozzles of the “wet compression” system form droplets with a diameter not more than 20 to 25 μm at the inlet to the compressor [54,56].
The considered analysis of the technologies of cyclic air intercooling of gas turbines proves the practicality of these systems and can be used for the increase in operational characteristics and the reliability of gas turbine engine work.
Other researchers previously conducted studies of thermopressor characteristics under incomplete evaporation conditions in the flow part. Still, they did not aim to use the thermopressor to organize and prepare a highly dispersed stream. Such research has shown that there are optimal values of the injected water amount to ensure the maximum increase of pressure during incomplete evaporation. The experimental research results of the thermopressor characteristics are shown in [34] and are presented in Figure 1. Data are grouped relative to the relative water injected amount, gw, at different Ma numbers and different initial temperatures. It can be seen that at the cost of gw > 15%, a decrease in the total pressure increase is observed, and the largest increase in pressure corresponds to when gw is 15 to 25% and εtp is 1.00 to 1.01.
Accordingly, we have formulated the following hypotheses:
(1)
Cyclic air intercooling the gas turbine by a thermopressor provides an increase in power by increasing the working fluid mass flow rate, increasing efficiency and reducing fuel consumption by reducing the compressed air temperature, and, consequently, reducing the compression power cost.
(2)
Intercooling of the gas turbine cycle air by a thermopressor provides increased power due to more efficient liquid spraying in the thermopressor itself by providing incomplete droplet evaporation and reducing droplet diameter (dispersion) to less than 30 μm, consequently decreasing relative fuel consumption by reducing power consumption in the compressor since the compression process is approximately isothermal.
(3)
A thermopressor is a multifunctional device that implements three main functions: air (gas) compression–compressor; air (gas) cooling–heat exchanger; and providing an effective liquid (water) spray nozzle. This versatility allows, on the one hand, to increase the power plant efficiency, reduce fuel consumption, and increase power by reducing the cost of compressing the working fluid, therefore increasing the working fluid consumption in the cycle.
These hypotheses determine the following research direction—ensuring efficient energy transformation using a thermopressor for evaporative intercooling cyclic air to increase efficiency and reduce fuel consumption for the gas turbine.
Design factors that affect energy consumption to overcome frictional forces and local resistances in the flow part of the thermopressor (receiving chamber, evaporation chamber, confuser, and diffuser) have a significant influence on the work processes in the thermopressor. The gas velocity in the vaporization chamber of the thermopressor should be in the range of 0.5–0.9 Ma to ensure a positive increase in pressure. However, at such speeds, the hydrodynamic resistance of the flow part of the thermopressor increases significantly.
One of the ways to increase the efficiency of the thermopressor (relative pressure increase) is to inject more liquid into the flow part than is necessary for evaporation. This method ensures the availability of a dispersed flow regime along the entire length of the thermopressor. At the same time, this will reduce pressure losses in the flow part due to the presence of two-phase flow and related processes of aerodynamic resistance and heat and mass transfer. However, the aerodynamic resistance of the liquid drops injected into the airflow will also increase when the liquid is injected over the necessary amount.
Thus, it is necessary to specify the methodology for determining total aerodynamic resistance to determine losses from aerodynamic resistance in thermopressors of low flow rates (up to 1 kg/s). The definition of such dependencies will allow for determining the optimal design characteristics of the thermopressor when the maximum value of the pressure increase is reached.
At the same time, determining the relative and total pressure increase in the flow part of the thermopressor, considering water injection by experiment, will make it possible to specify the design methodology of the thermopressor as a part of power plants based on gas turbines.

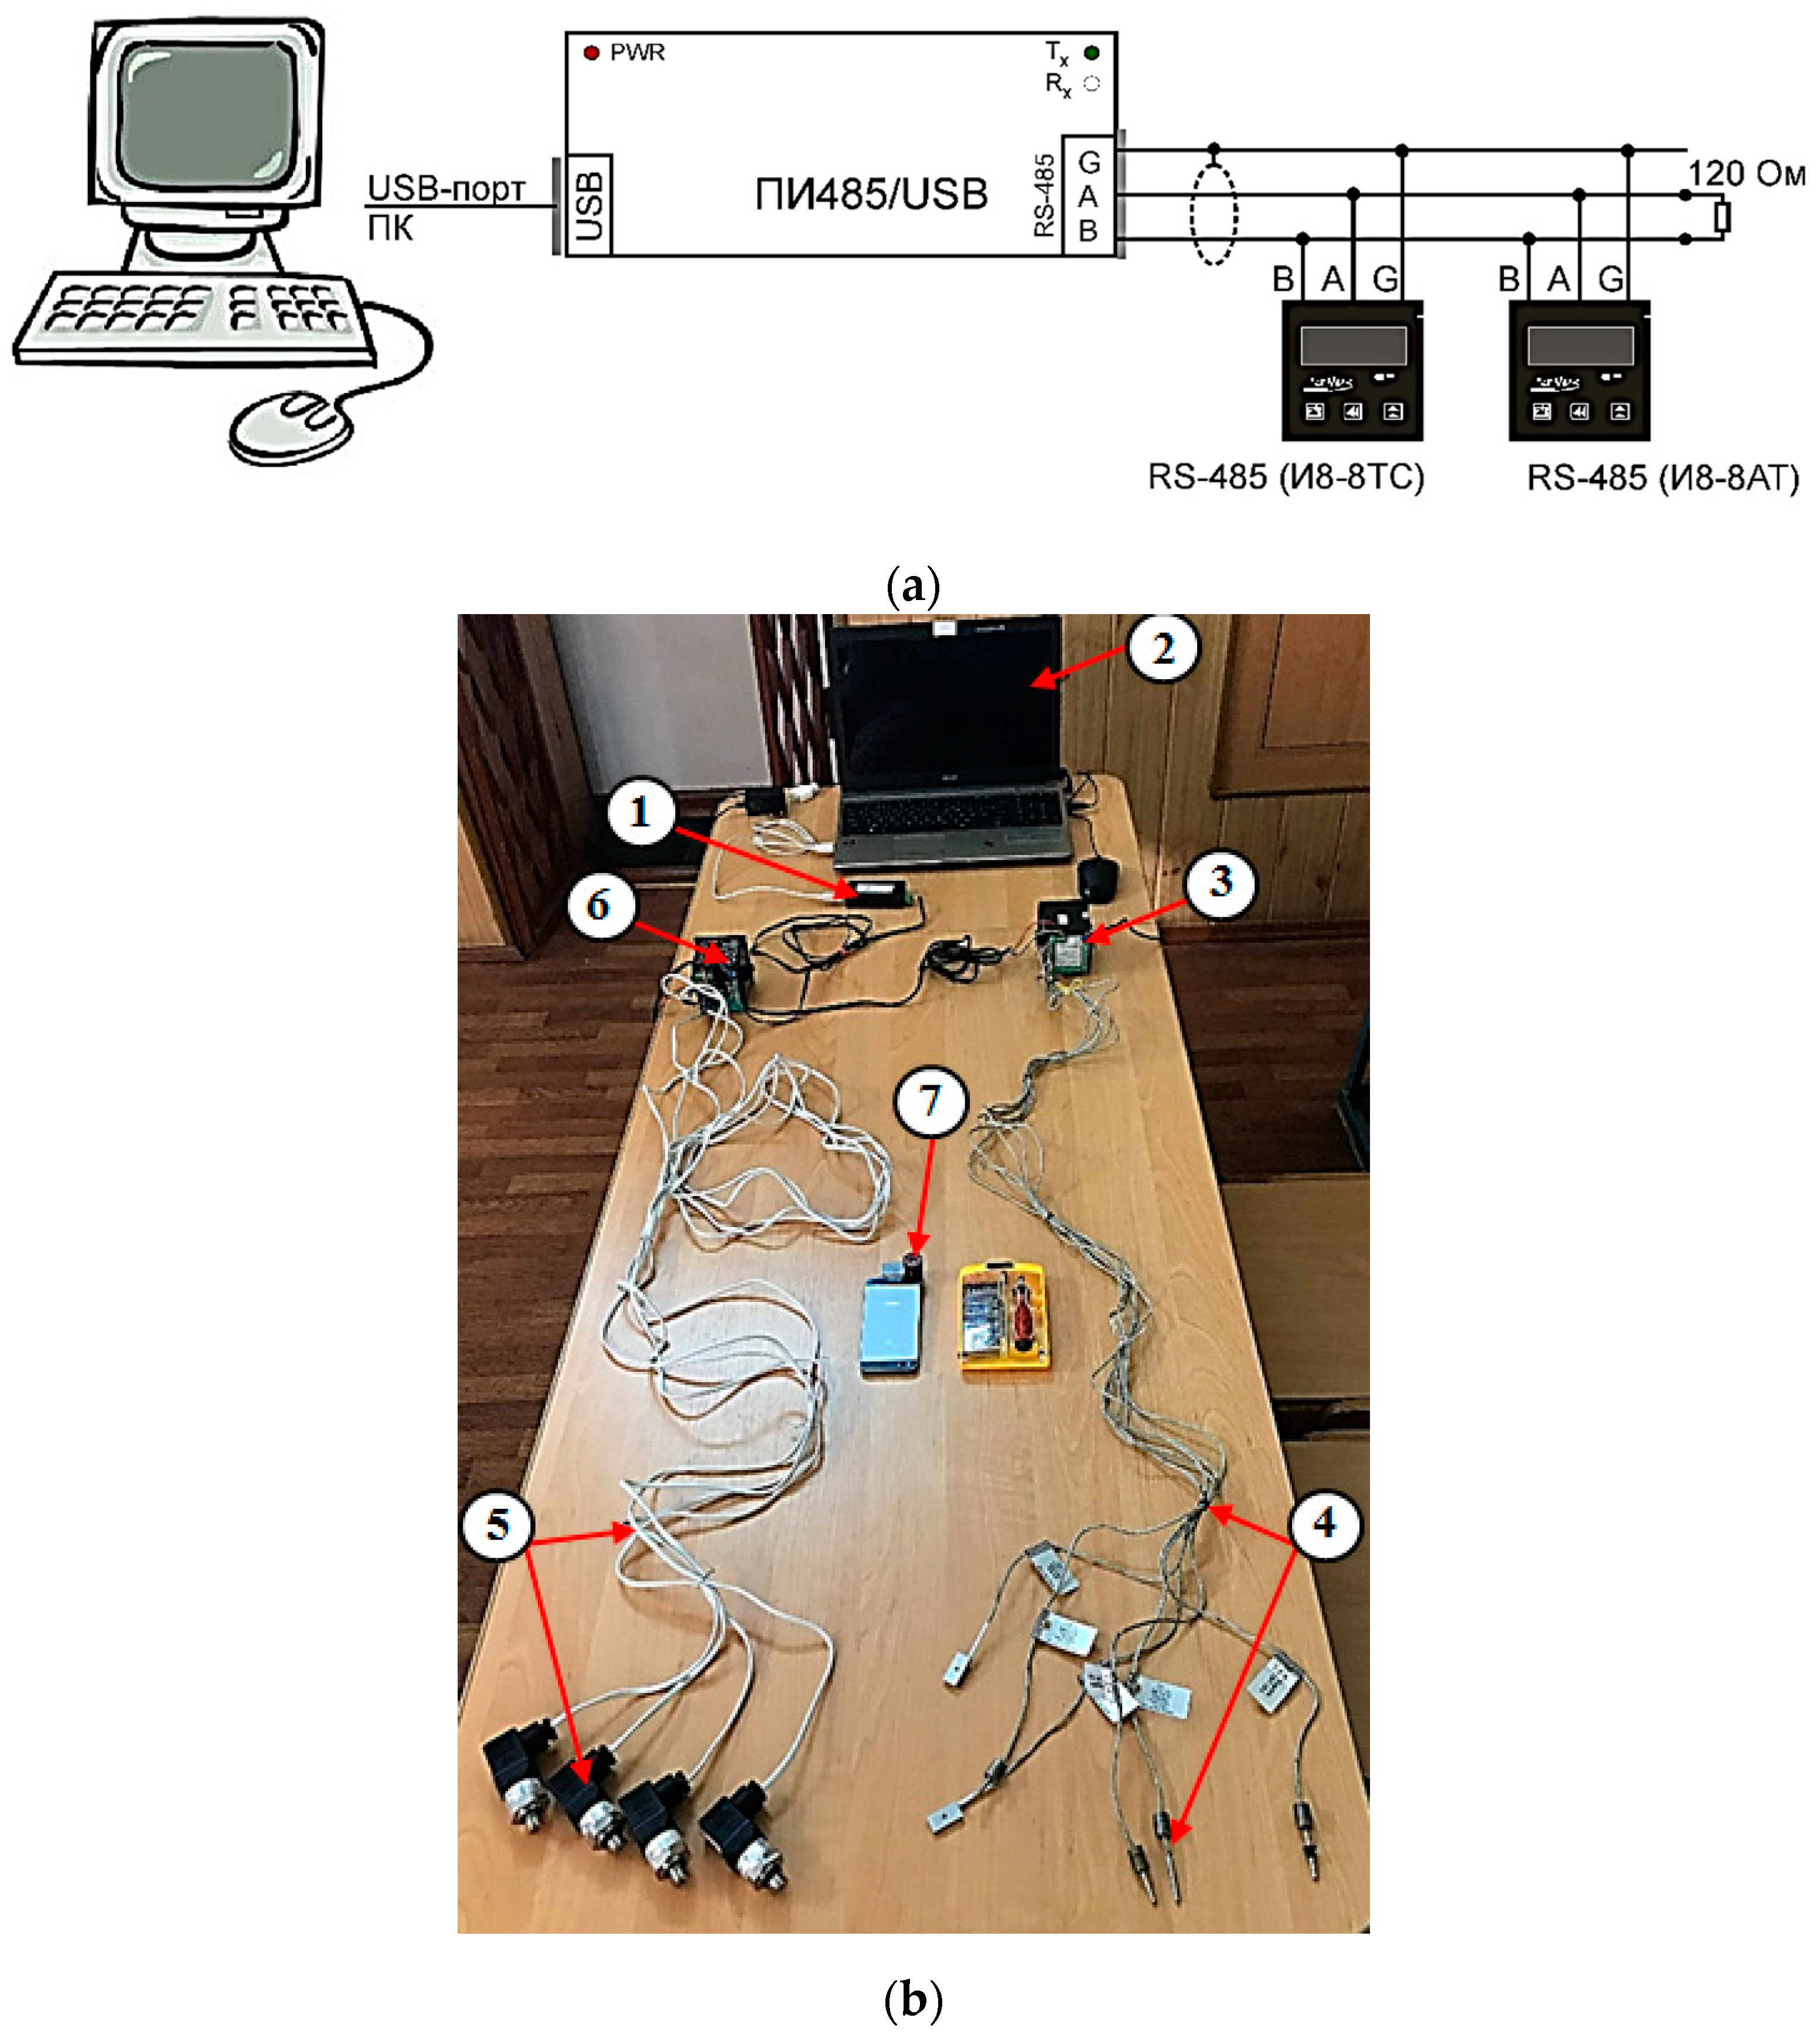
3. Materials and Methods

The study of the thermopressor characteristics was carried out on a specially designed experimental setup (Figure 2). The experimental unit was designed to model the thermopressor for intercooling air of the gas turbine (the thermopressor module part consists of the thermopressors set with a common water injection system).
The developed experimental setup works as follows: the air was purified in a filter (Caterpillar-4N-0015 CAT) and then compressed in an Atlas Copco HA 85-3 screw compressor (0.6 MPa, 6 m3/h) and pumped to the thermopressor. Fog-type nozzles (Figure 3a) was used to spray the liquid. The design of the thermopressor (Figure 3b) includes the following parts: receiving (inlet) chamber (Figure 3c); liquid injection system (Figure 3d); confuser (Figure 3e); evaporation chamber (Figure 3f); and diffuser (Figure 3g). All thermopressor elements are variable, which made it possible to conduct investigations of thermopressors with variable geometric characteristics.
The principle of operation of the experimental setup was as follows: after cleaning the air filter, air followed the screw compressor (maximum discharge pressure is 0.6 MPa, capacity is 6 m3/h), where it was compressed and pumped to the air receiver. After deep cleaning in a three-section moisture–oil separator, the air was heated in a channel gas air heater to a temperature of t1 = 50–180 °C. After preparation (approaching the parameters of cyclic air: the initial pressure at the input to the receiving chamber of the thermopressor P1 up to 0.32 MPa; the flow velocity in the evaporation chamber wair = 0.4–0.9 Ma), the air followed to the experimental thermopressor. Water for injection was pumped up from a distilled water supply tank and was supplied by a low-consumption high-pressure pump.
The error of the experimental results is determined by the error of measuring devices and methodical and systematic errors. The measurement of a physical quantity is based on the measurement method used, the measuring instrument, and the method of recording the result.
The Student’s distribution was used to assess the accuracy of the measurement results, which is recommended for a small number of observations, n ≤ 20, provided that the error distribution of individual measurements follows the normal distribution. In the case of applying the two-sample criterion for independent samples, the condition of variance equality was also observed.
The methodological error was determined with consideration of thermal inertia. MathLab and SigmaPlot software were used to estimate errors and obtain empirical dependences of thermopressor characteristics. Measuring the temperature took into account heat dissipation along the heat removal and thermal inertia.
Air is heated to the set temperature by a heat exchanger (Figure 4). The heat source is a gas burner set. Heat supply was carried out externally using a special thermal shield to reduce environmental losses. To increase efficiency, the heat exchanger has an internal fin located inside the device’s main part of the spiral. Finning is made of steel rods with a diameter of 8 mm. The heat exchanger capacity is Ga = 0.35–0.55 kg/s, while providing the temperature at the inlet Ta1 = 10–40 °C and at the outlet Ta2 = 50–190 °C.
The data collection of the experimental unit parameters was carried out with a measurement interval τ = 1 s, and each parameter was covered by no less than 15 measurements.
The air temperature was measured by resistance temperature sensors, which were set to measure the air temperature along the airflow:
(1)
At the entrance in front of the air filter;
(2)
After compressing the air in the compressor and cleaning from oil and moisture;
(3)
After heating the air in the duct air heater at the entrance of the thermopressor;
(4)
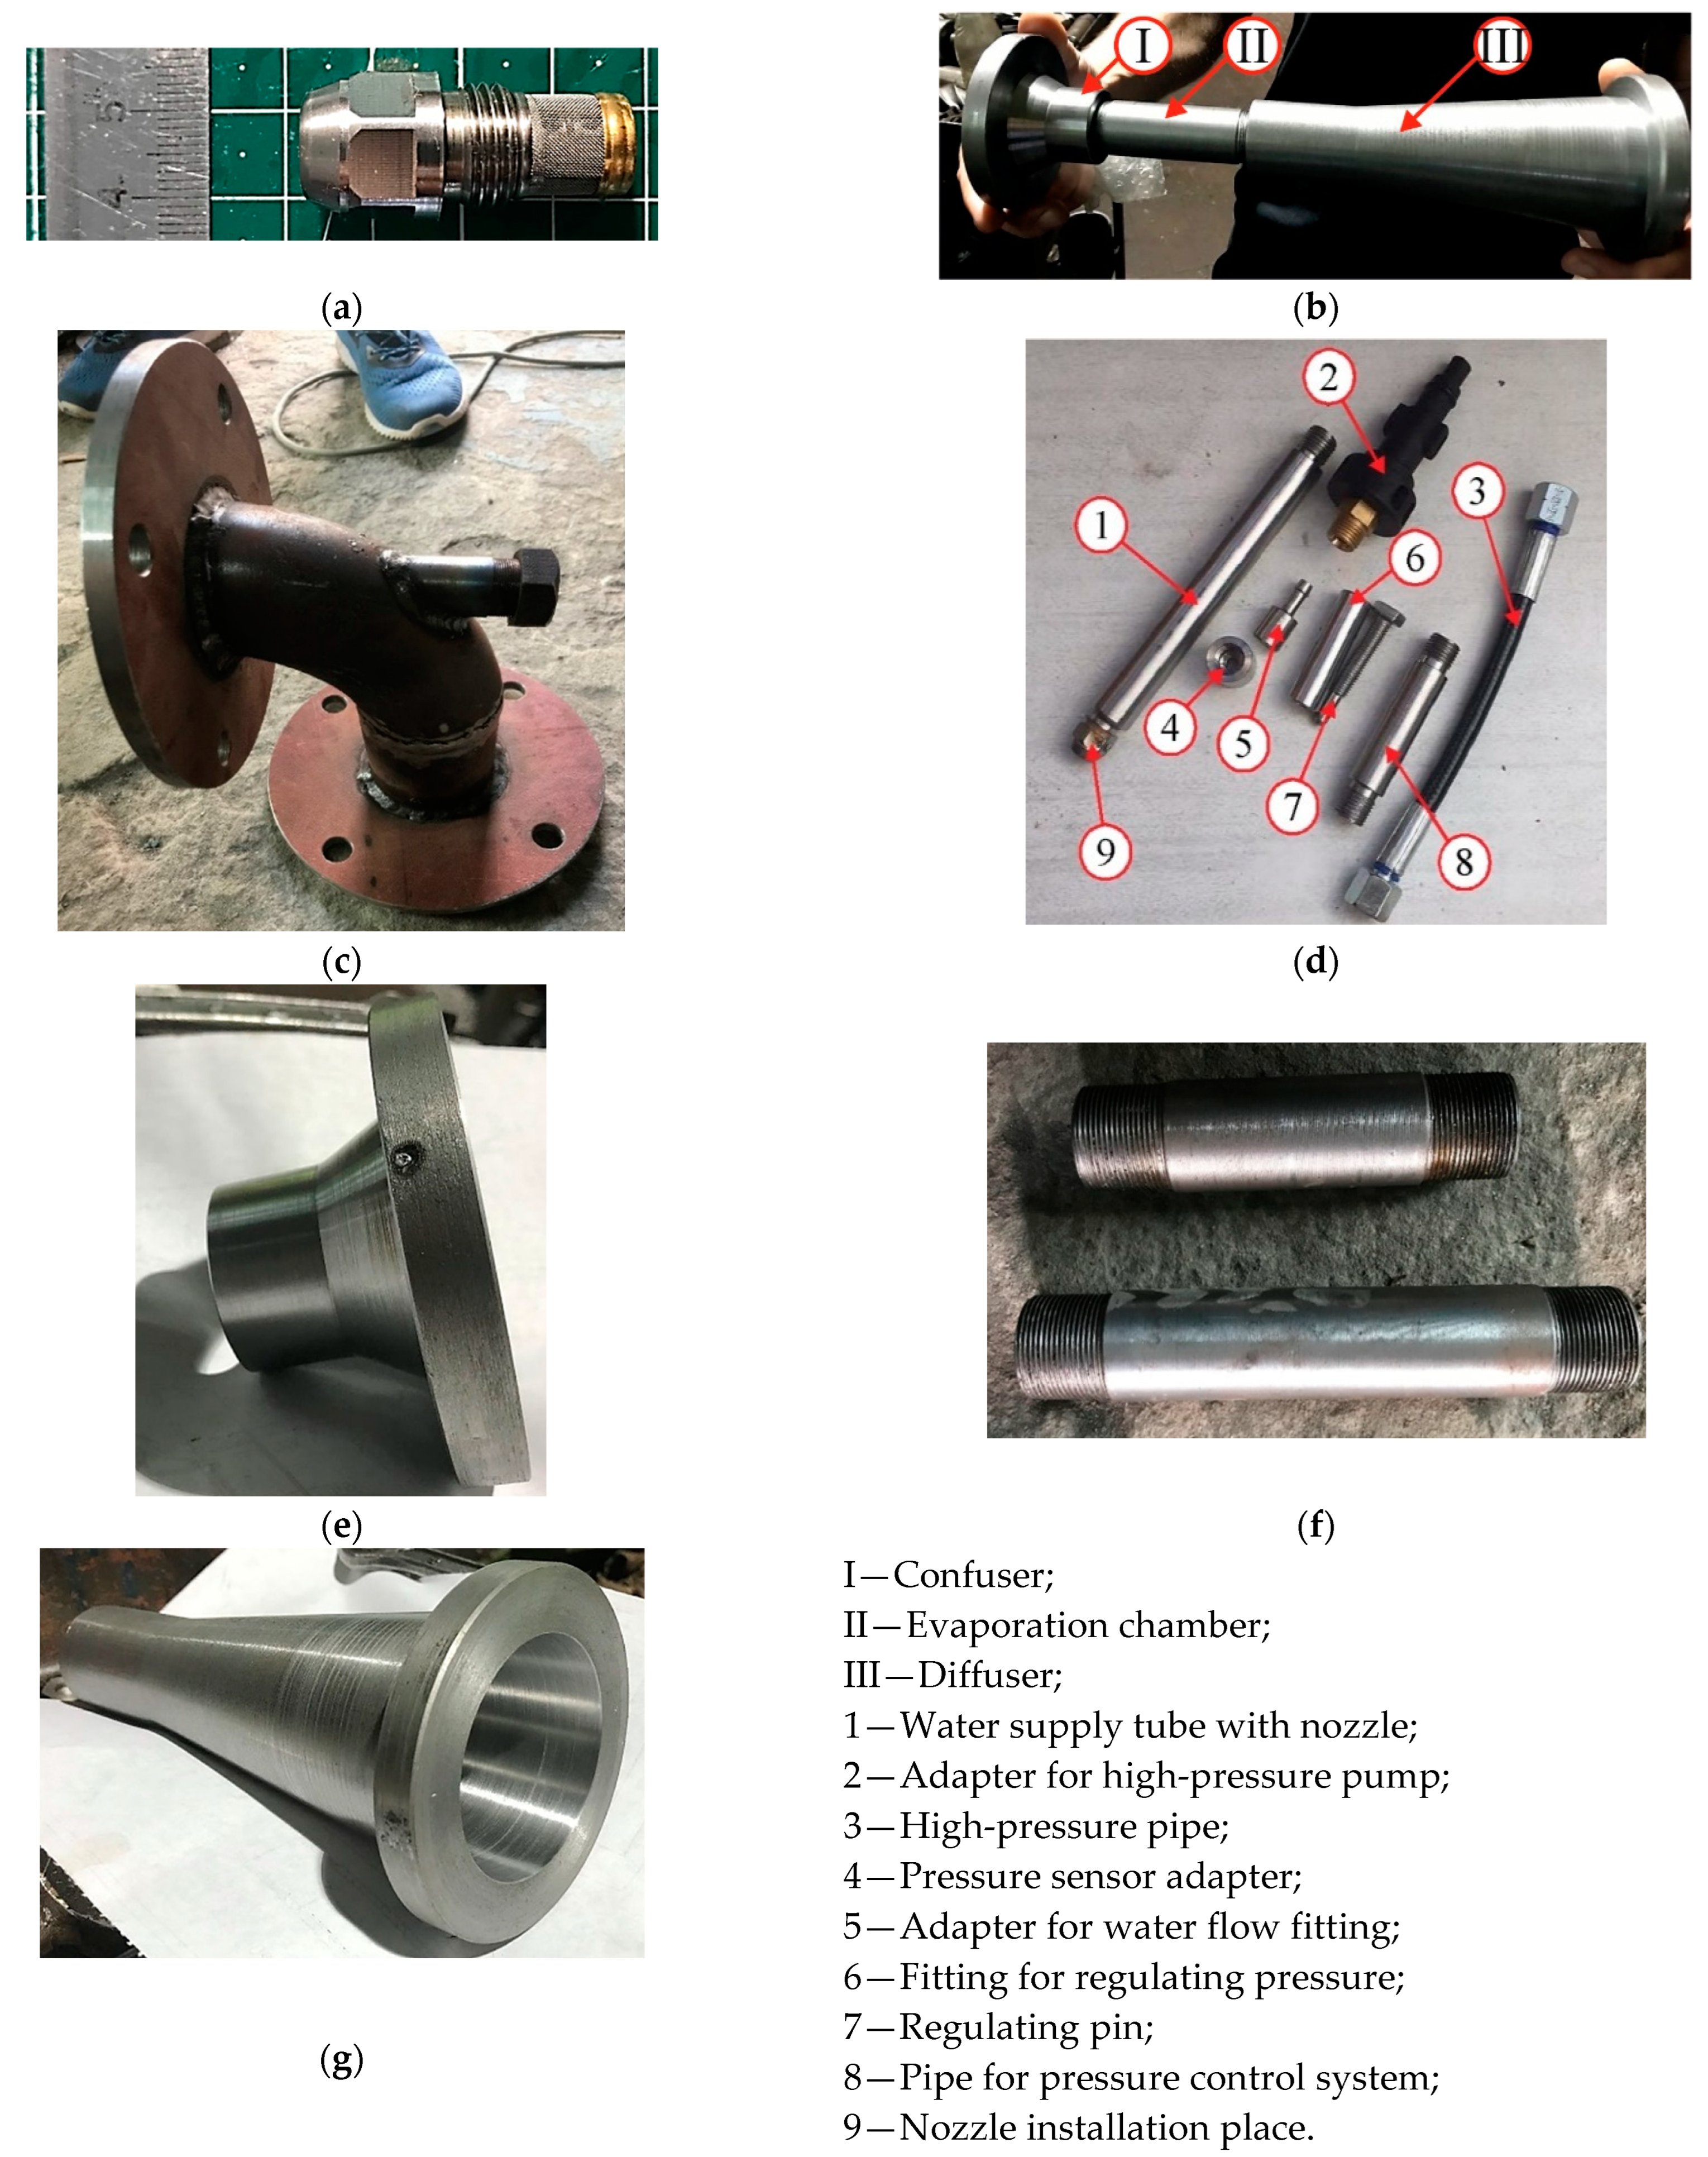
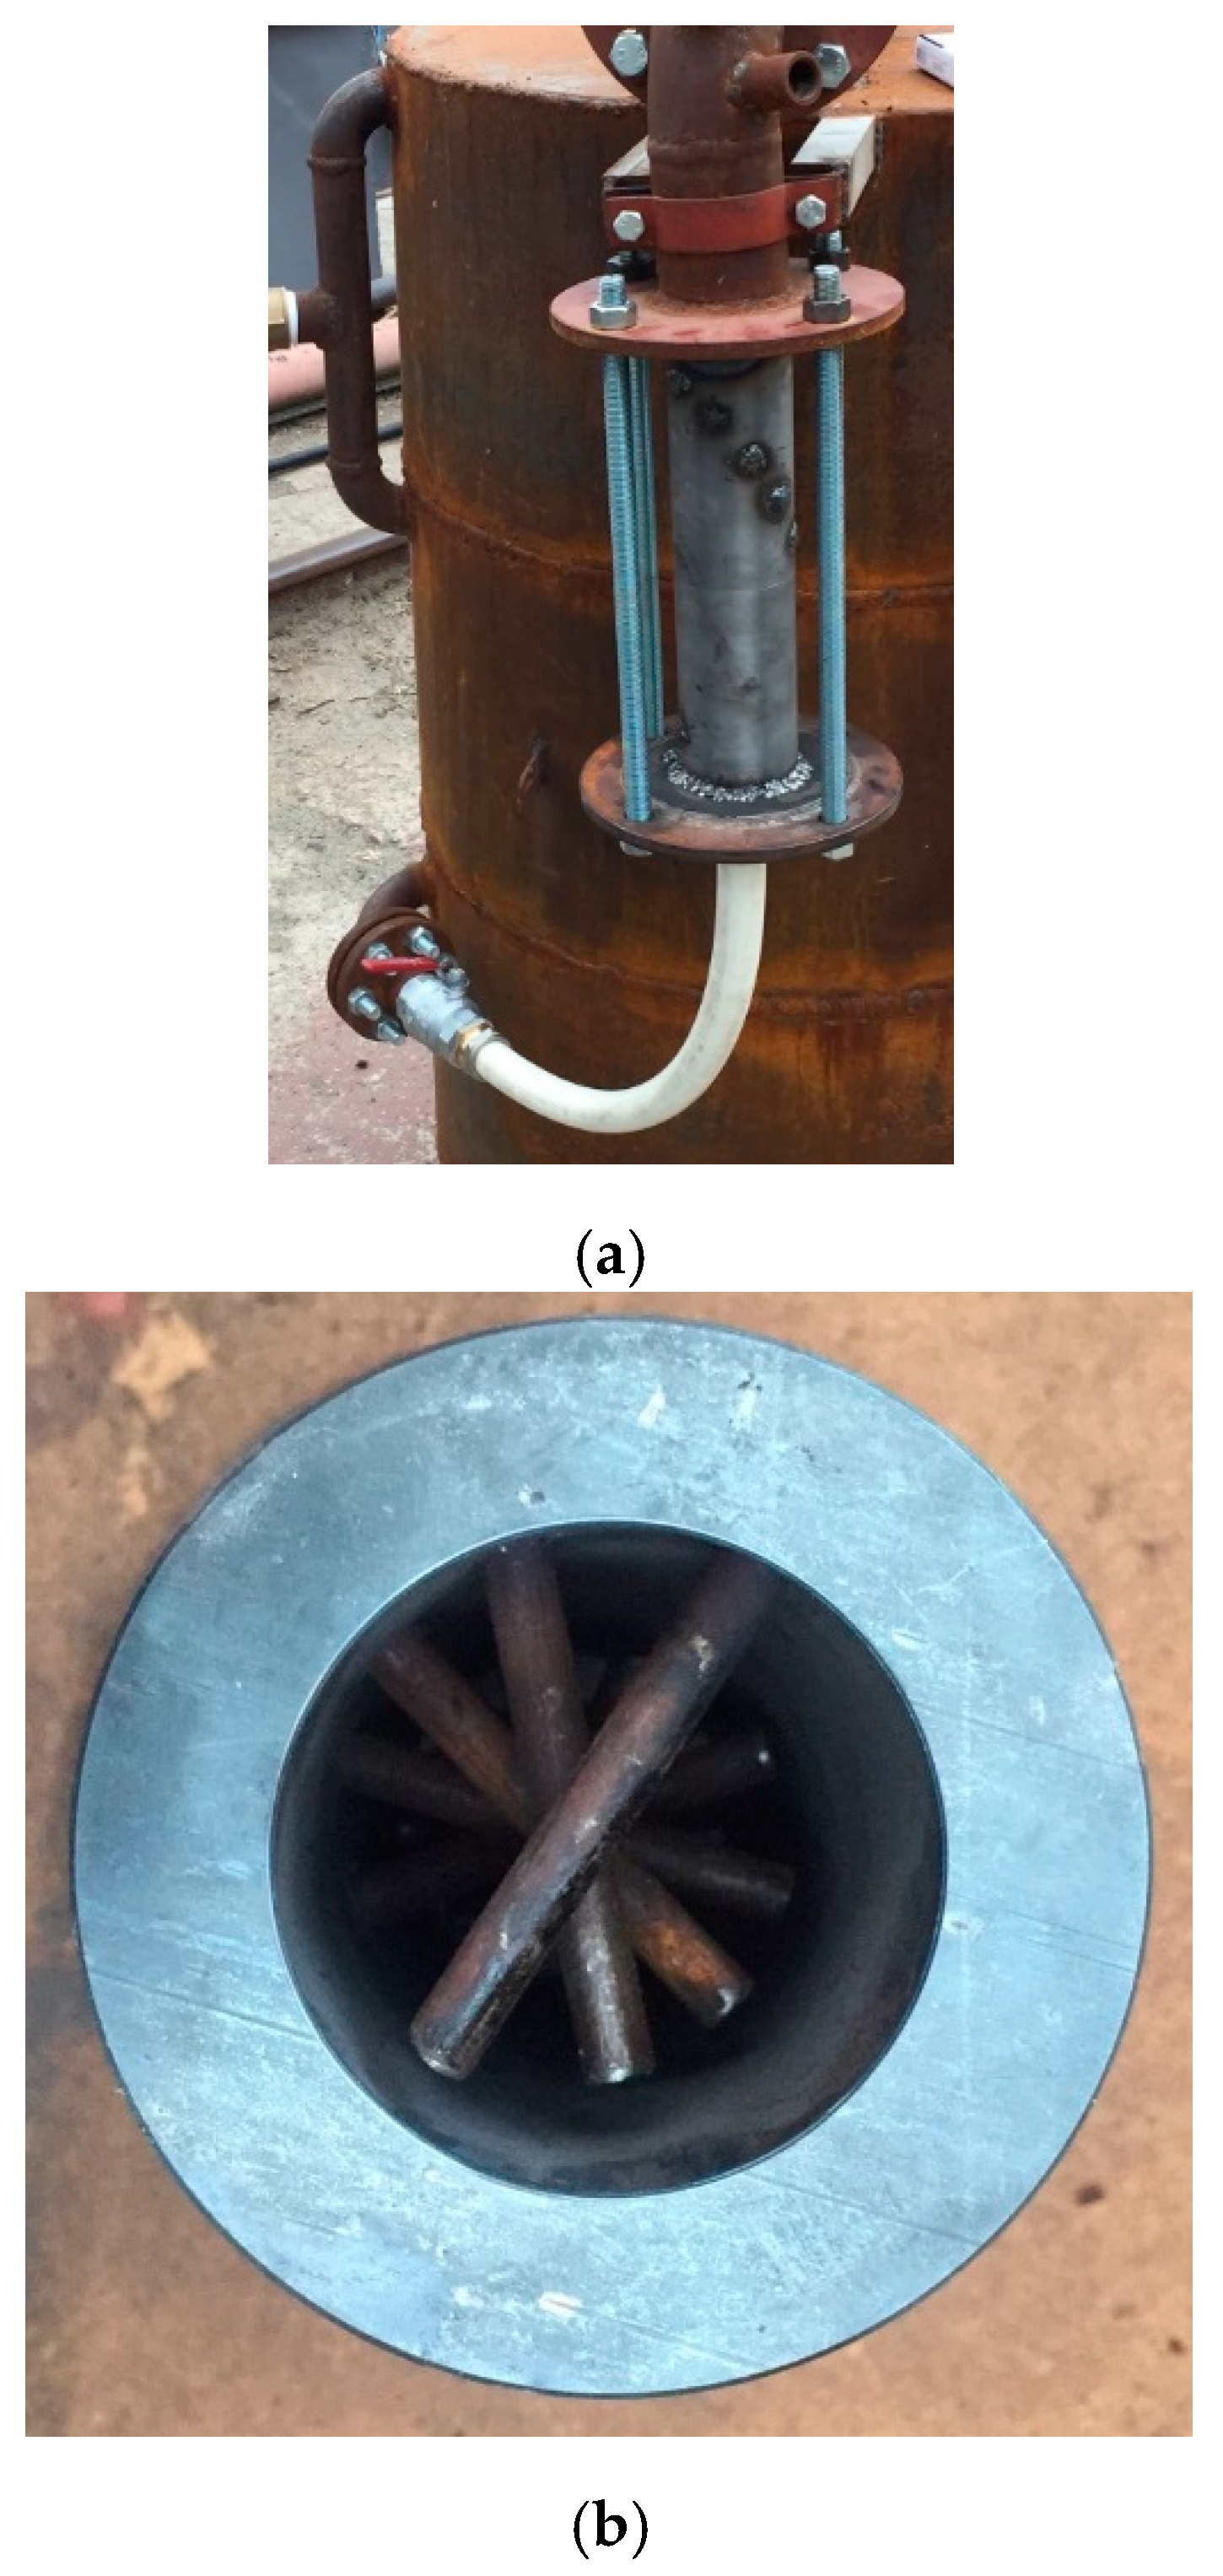
In the thermopressor evaporation chamber;
(5)
At the thermopressor diffuser outlet (the discharge pipe).
To measure the injected water temperature into the thermopressor, submerged resistance temperature sensors were installed in the distilled water supply tank.
The airflow pressure measurement was performed by pressure sensors of the model A-10 (WIKA).
Pressure sensors were installed in front of the thermopressor inlet chamber to measure the discharge pressure after the compressor, along the airflow of the apparatus flowing parts, and at the thermopressor diffuser outlet.
The temperature and pressure measurement data were recorded by an 8-channel I8-TC (for temperature sensors) and an I8-AT (for pressure sensors) by the company RegMik. Measuring instruments are designed to receive and convert sensor signals and display them on the built-in digital indicator. Since the maximum temperature of the measuring medium for sensors of this type was 80 °C, a radiator (cooler) was used to ensure correct readings, which was installed together with a pressure sensor.
The rotameter for measuring the volumetric flow of homogeneous flows with a measurement range of up to 25 m3/h and the permissible measurement error of ±4% were used to measure airflow.
The measuring system automatically monitors the condition of the sensors and determines the measured temperature and pressure of the set measuring range. The measurement data were also recorded in the measurement protocols and in readings graphs. This created an appropriate database for data entry and processing.
The measuring system automatically monitors the condition of the sensors and determines the measured temperature and pressure in the set measurement range. The principle of operation is as follows: the signal from the sensor with a current output makes a voltage on a precision resistance dependent on the measured value of the object, which is fed to a specialized controller through an instrumental amplifier. The source code is processed by a specialized controller, which, in particular, calculates the temperature or pressure of the object based on the entered transformation characteristic and then displays its values on indicators.
The PY485/USB, RS485 communication interface converter is used, which converts USB interface signals (compatible with USB 1.1 and USB 2.0) into RS-485/RS-422/V.11 interface signals (EIA-485 and EIA-422A) to collect and transform information. Figure 5 shows the connection diagram of the PI485/USB communication interface with a computer and two eight-channel meters I8-TS (for resistance thermoconverters) and I8-AT (for measuring pressure converters).
The received information from the measuring system was transmitted directly to the PC and processed using the software SSD 3.5 of the company Regmik. The obtained measurement data were also recorded in special measurement tables and data graphs. An appropriate database was created for processing data results.

4. Results and Discussion

The use of incomplete evaporation to reduce pressure losses along the length of the thermopressor’s working part can result in an opposite effect than the one intended, with an increase in the diameter and drop number. An increase in the injected liquid amount keeps increasing hydraulic resistance from liquid droplets and, as a result, decreases the positive effect of the thermo-gas-dynamic compression effect. To investigate this process in more detail, the effect of the relative water injected amount under different evaporation chamber operating conditions (relative velocity Ma and mass flow rate Gw) was studied.
In the first stage, the influence of the relative increase in pressure εtp of the thermopressor as a function of the velocity airflow Ma and mass water flow consumption Gw was studied. The following input parameters were adopted for the study: the air temperature was Ta1 = 155 °C; water consumption Gw = 0.0175, 0.0407, and 0.0487 kg/s; the water pressure Pw was 7.5 to 8.0 MPa; and air consumption Ga was 0.32 to 0.52 kg/s. The evaporated liquid amount was 15 to 70% of the total amount.
Experimental determinations of pressure losses in the flow part of the thermopressor were carried out for several values of the mass flow of water (Figure 6). Pressure losses for a thermopressor without liquid injection at inlet pressure P1 = 150–300 kPa can reach ΔPtp.r = 20–70 kPa (δtp.r = 10–27%). When injecting liquid Gw = 0.0175 kg/s (2%), pressure losses decrease—ΔPtp.r = 20–55 kPa (δtp.r = 6–22%). However, with an increase in the amount of injected liquid, pressure losses increase: at Gw = 0.0407 kg/s (8%)—ΔPtp.r = 20–60 kPa (δtp.r = 7–24%) and at Gw = 0.0487 kg/s (12%)—ΔPtp.r = 20–65 kPa (δtp.r = 9–26%). This confirms that with a gradual increase in the flow of liquid, the pressure loss of the flow increases.
Further injection of water into the flow already leads to the opposite effect—hydraulic losses due to the resistance of the drops dominated the positive effect of reducing pressure losses in the dispersed flow, and as a result, pressure losses increase more than for a “dry” thermopressor. Thus, it can be concluded that the optimal relative amount of water that can be injected to ensure incomplete evaporation in the flow part of the thermopressor with the maximum effect of reducing hydraulic pressure losses is gw < 10%. Therefore, it is important to experimentally define the optimal range of relative water flow for injection in the thermopressor.
Thermopressor parameter measurements at various relative velocities Ma of the airflow showed that with increasing relative speed Ma from 0.28 to 0.95, the relative increase in pressure increases. Thus, at Gw = 0.0175 kg/s, εtp increases from 0.97 to 1.04, and pressure losses, ΔPtp, are −10 to −8 kPa (a minus sign means that there is an increased total pressure); at Gw = 0.0407 kg/s, the increase in εtp is from 0.88 to 1.01, and the pressure loss, ΔPtp, goes from 0 to 16 kPa. At Gw = 0.0487 kg/s, the increase in εtp is from 0.82 to 0.97, and the pressure loss ΔPtp is from 16 to 28 kPa (Figure 7). The largest value of εtp matches the nozzle with a flow rate of 0.0175 kg/s, and εtp is from 1.02 to 1.03. The decreased relative increase value of the pressure with increasing water flow Gw is due to an increase in the droplet number in the flow and, consequently, an increase in drag resistance at the initial evaporation sector of the flowing part.
The liquid droplet’s initial velocity at the nozzle exit impacts the initial droplet resistance in the flow and depends on the airflow velocity ratio. The closer the value (vw/va) is to 1.0, the lower the initial resistance. In this study, the value equals the value (vw/va) > 0.3.
Analysis and comparison of the obtained experimental data show that at some Ma numbers (the lower permissible limit of the thermo-gas-dynamic effect occurrence), the relative increase in the flow pressure in the thermopressor is completely levelled by hydraulic losses of the flow path. This phenomenon is observed at Gw = 0.0175 kg/s (Ma = 0.28); Gw = 0.0407 kg/s (Ma = 0.32); and Gw = 0.0487 kg/s (Ma = 0.38).
It was also found that the relative temperature (T1/T2) is from 1.36 to 1.41 (Figure 8), and the cooling air temperature at the thermopressor outlet is from 301 to 307 K (i.e., 28 to 34 °C). The cooling process is determined by the temperature of the wet bulb thermometer, and the relative humidity j is 100%.
Data analysis of Figure 7 by the approximation method makes it possible to propose several empirical relations. It describes the dependence of the thermopressor relative pressure increase εtp on two parameters: the relative velocity in the working chamber Ma and the water injected total flow rate Gw (Table 1). Table 1 shows that the largest regression coefficient corresponds to the paraboloid equation—R = 0.9832 (R2 = 0.9667). Thus, the empirical equation for determining the relative pressure increase εtp can be represented as follows:
ε t p = 0.7985 + 0.3159 M a + 9.7491 G w 0.1479 M a 2 209.01 G w 2
The second stage in this study is outlined as follows: the relative flow rate in the thermopressor evaporation chamber Ma was fixed, and the variation in the relative pressure increase εtp from the relative amount of injected water gw was determined (Figure 9 and Figure 10). It can be seen that at Ma = 0.37 in the area of gw being 4 to 8%, the relative increase in pressure decreases slightly, and εtp is 1.00 to 1.03. At values gw > 8%, the pressure loss ΔPtp decreases sharply (up to 16 kPa). The same can be seen for Ma = 0.53, wherein in the area gw = 5–9%, the relative increase in pressure decreases slightly and εtp = 0.97–1.03. However, at values gw > 9%, the pressure losses decrease sharply (ΔPtp = 5–26 kPa), and for Ma = 0.82 in the area gw = 6–10%, the relative increase in pressure decreases slightly and is εtp = 0.92–0.96. Values gw > 10% decrease Ptp = 14–27 kPa sharply. From this, we can conclude that the water injection’s positive effect for the required amount of excess for evaporation will be only in the area gw = 4–10%, and a further increase in gw will result in a decrease in εtp. Moreover, increasing the relative velocity in the evaporation chamber changes the limit value of gw to a smaller value and can reach gw = 6–8%.
The total thermopressor outlet pressure increase will be small for εtp = 1.01–1.03 (1–3%). However, this makes it possible to ensure effective liquid high-dispersion sprays in the airflow with simultaneous cooling.
The Student’s distribution method was used to determine relative pressure measurement errors. In this case, the error deviations δtp ranged from ±1.81% to ±4.00%. The obtained measurement accuracy determines the reliability of the obtained experimental data.
Due to the increased pressure etp when excess water is injected in the working chamber, gw can be presented as a two-variable function (Figure 11). Analysis of these data points by the approximation method makes it possible to obtain empirical equations for determining etp (Table 2). The regression coefficients for the selected functions are approximately the same. The paraboloid function is chosen for simplicity and corresponds to the changes observed in the experimental curves in Figure 11. It is worth noting that the regression coefficients for the selected functions are approximately the same. The paraboloid function is chosen for simplicity and corresponds to the changes observed in the experimental curves in Figure 11.
Accordingly, the obtained coefficients of the empirical equation function to determine the relative pressure increase εtp:
ε t p = 1.0664 + 0.0961 M a 1.3433 g w 0.0869 M a 2 + 0.6821 g w 2
It should be noted that using empirical Equations (1) and (2) to determine the pressure relative increase εtp makes it possible to clarify the calculation method of thermopressor characteristics with incomplete evaporation of water in the working chamber. The initial operating thermopressor conditions correspond to the contact intercooling systems for cyclic air of heat engines. Empirical relations are applicable for a low-consumption thermopressor with an air consumption Ga from 0.32 to 0.52 kg/s, a working chamber diameter Dch from 25 to 50 mm, and a relative flow path length ltp from 3 to 10. At the same time, the operating air temperature at the inlet Ta is at least 100 °C.

5. Conclusions

  • The use of incomplete evaporation in a thermopressor to provide contact cooling of the cycled air of gas turbines makes it possible to obtain a highly dispersed flow before going into the high-pressure compressor.
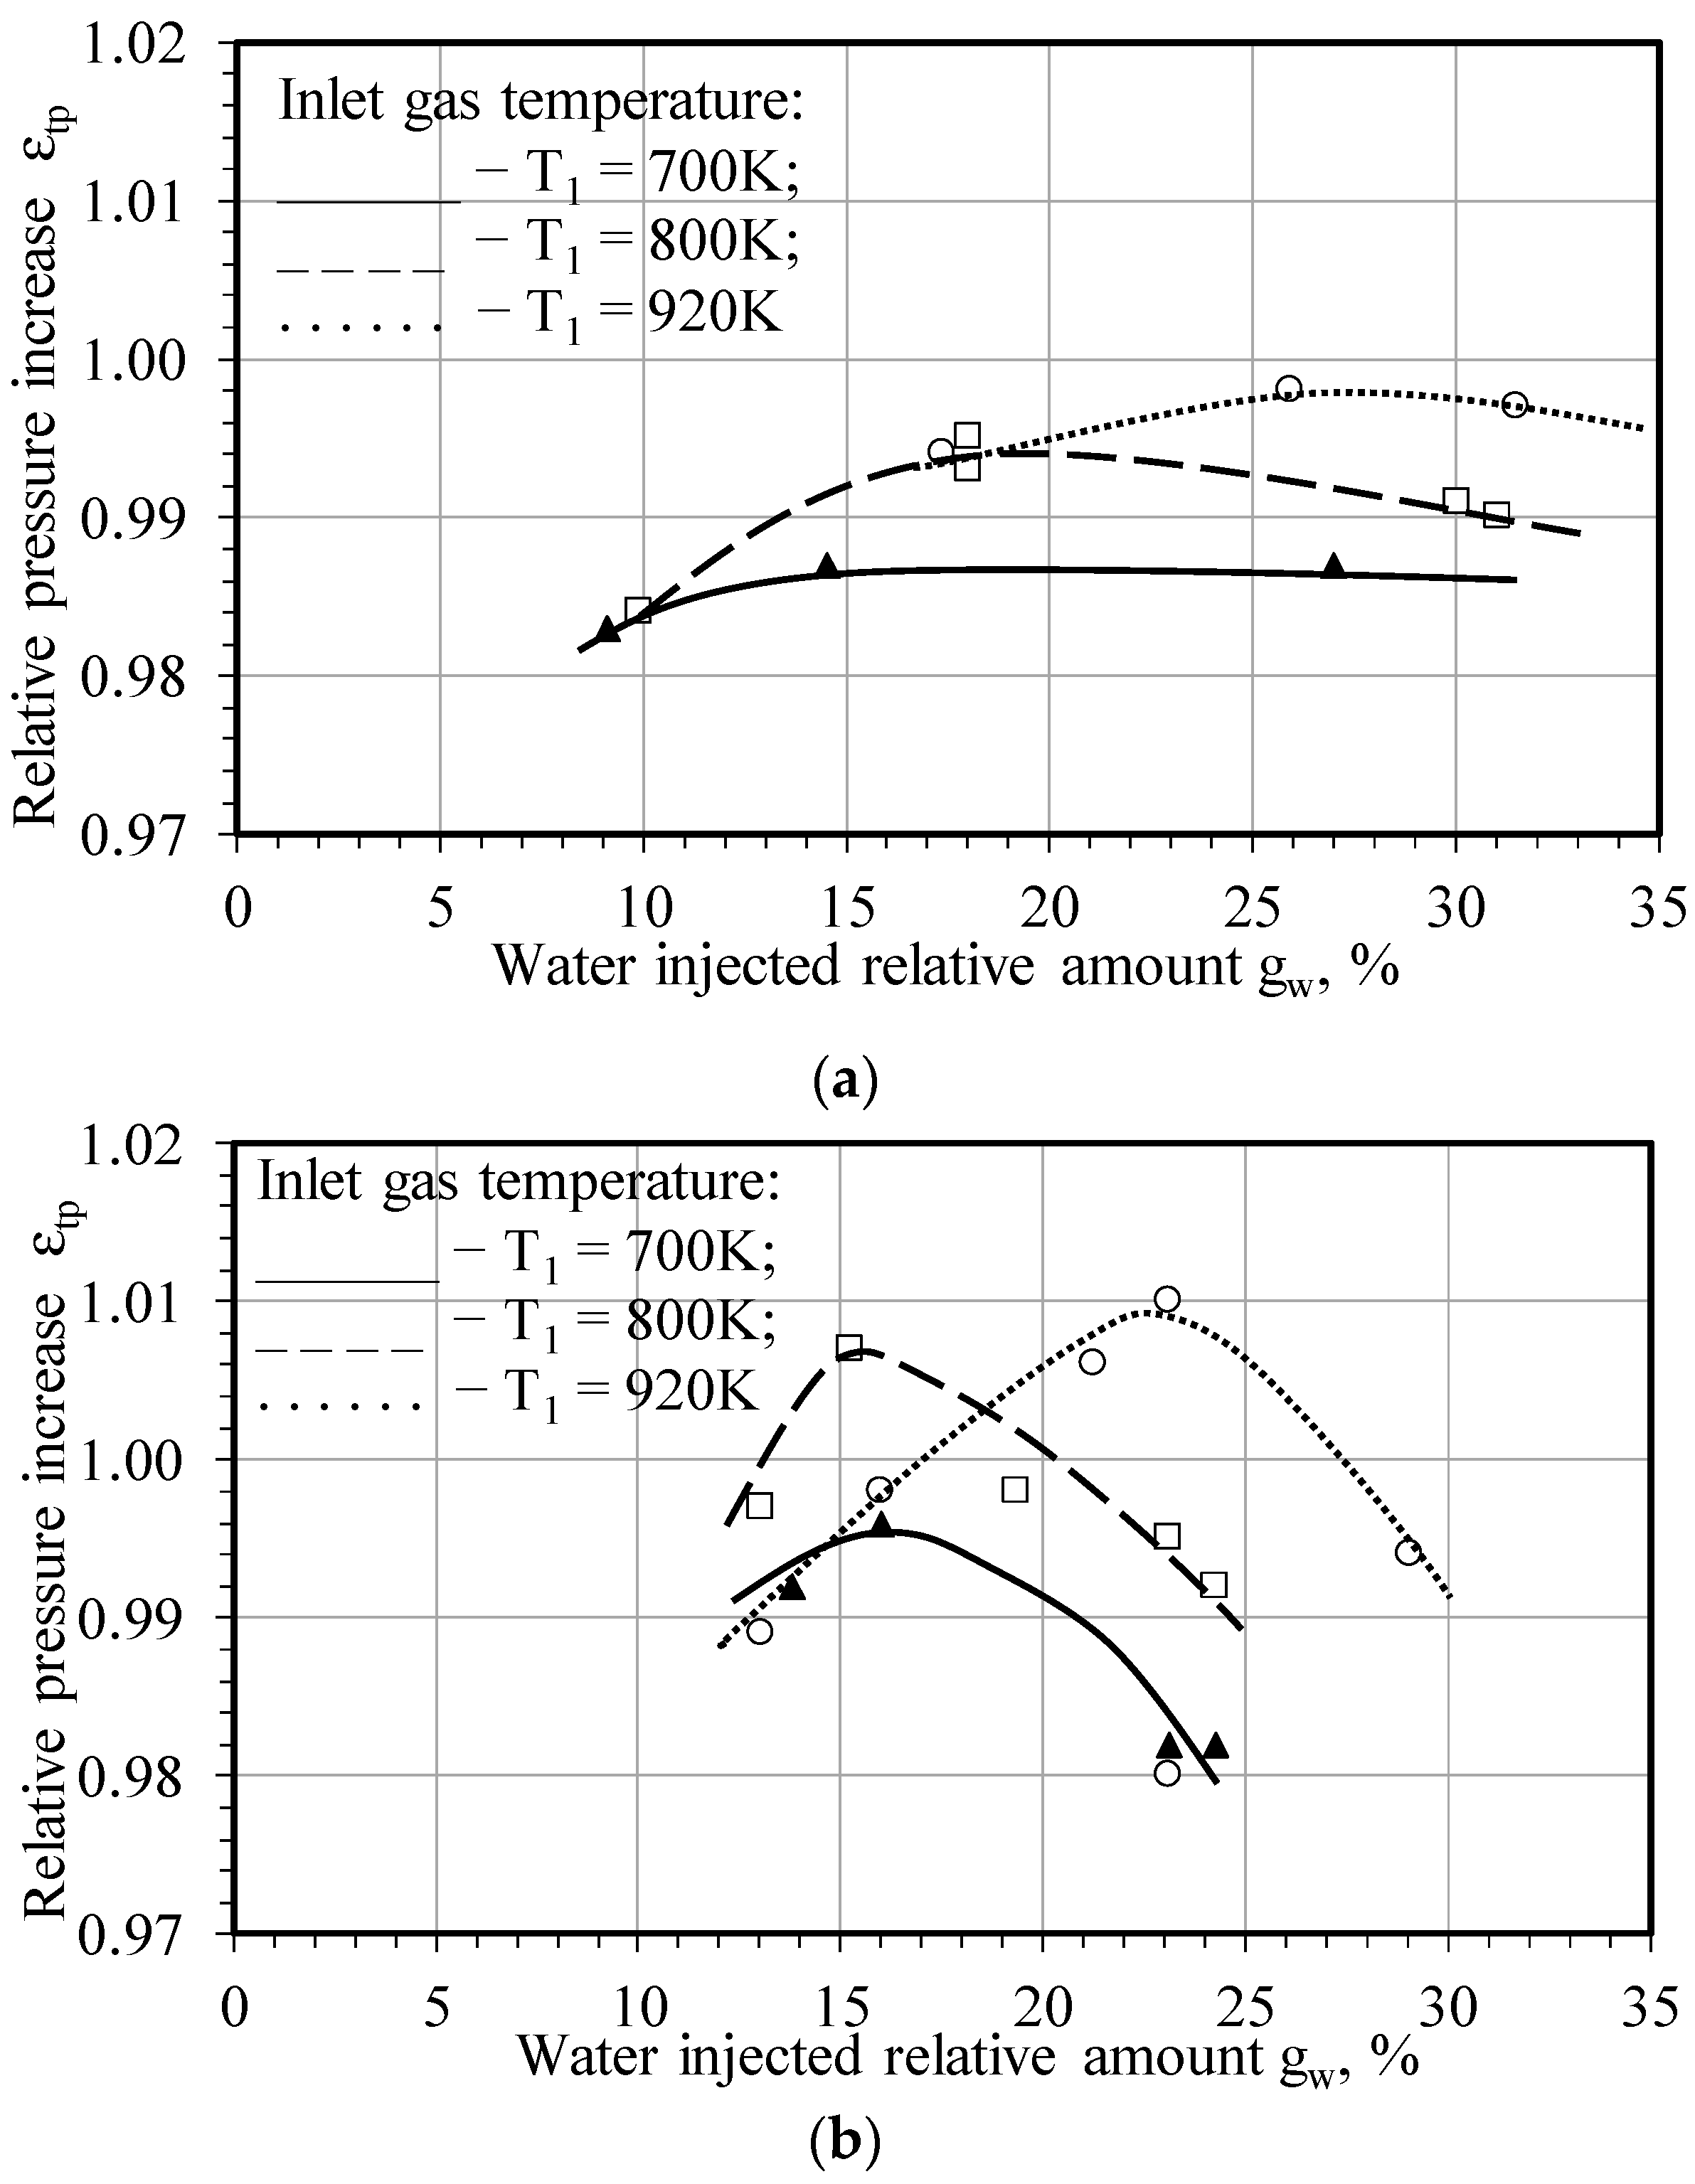
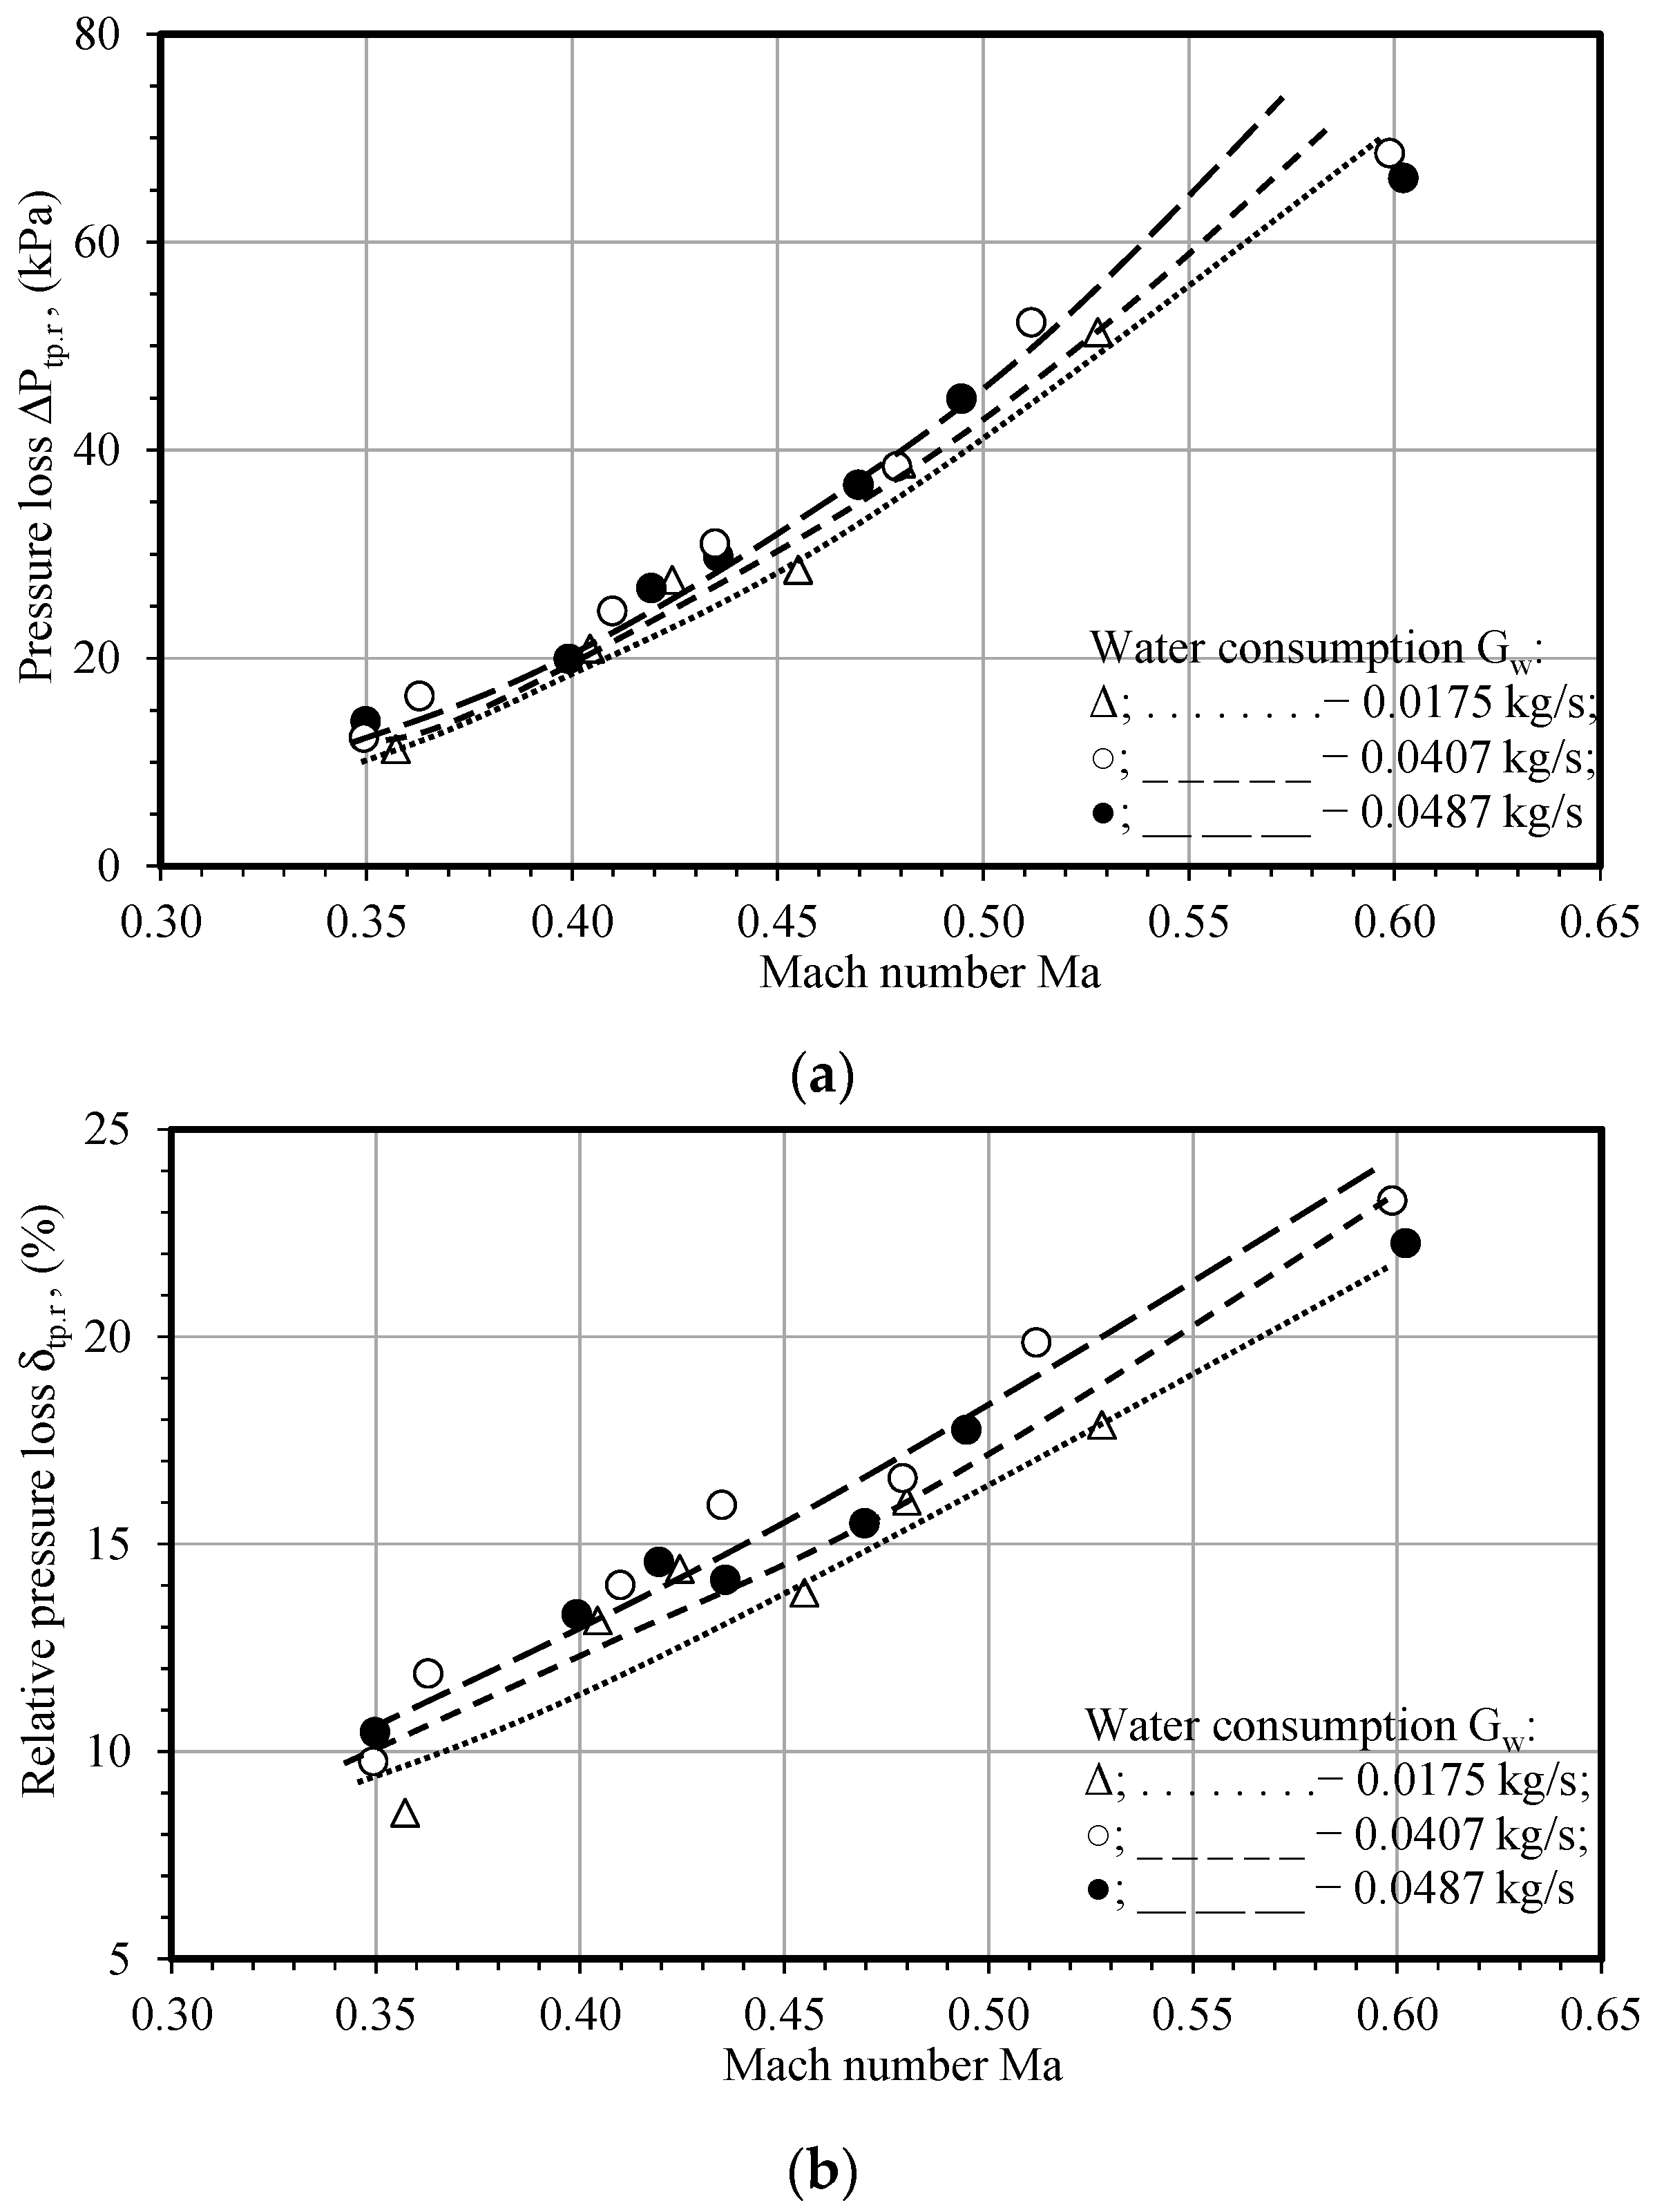
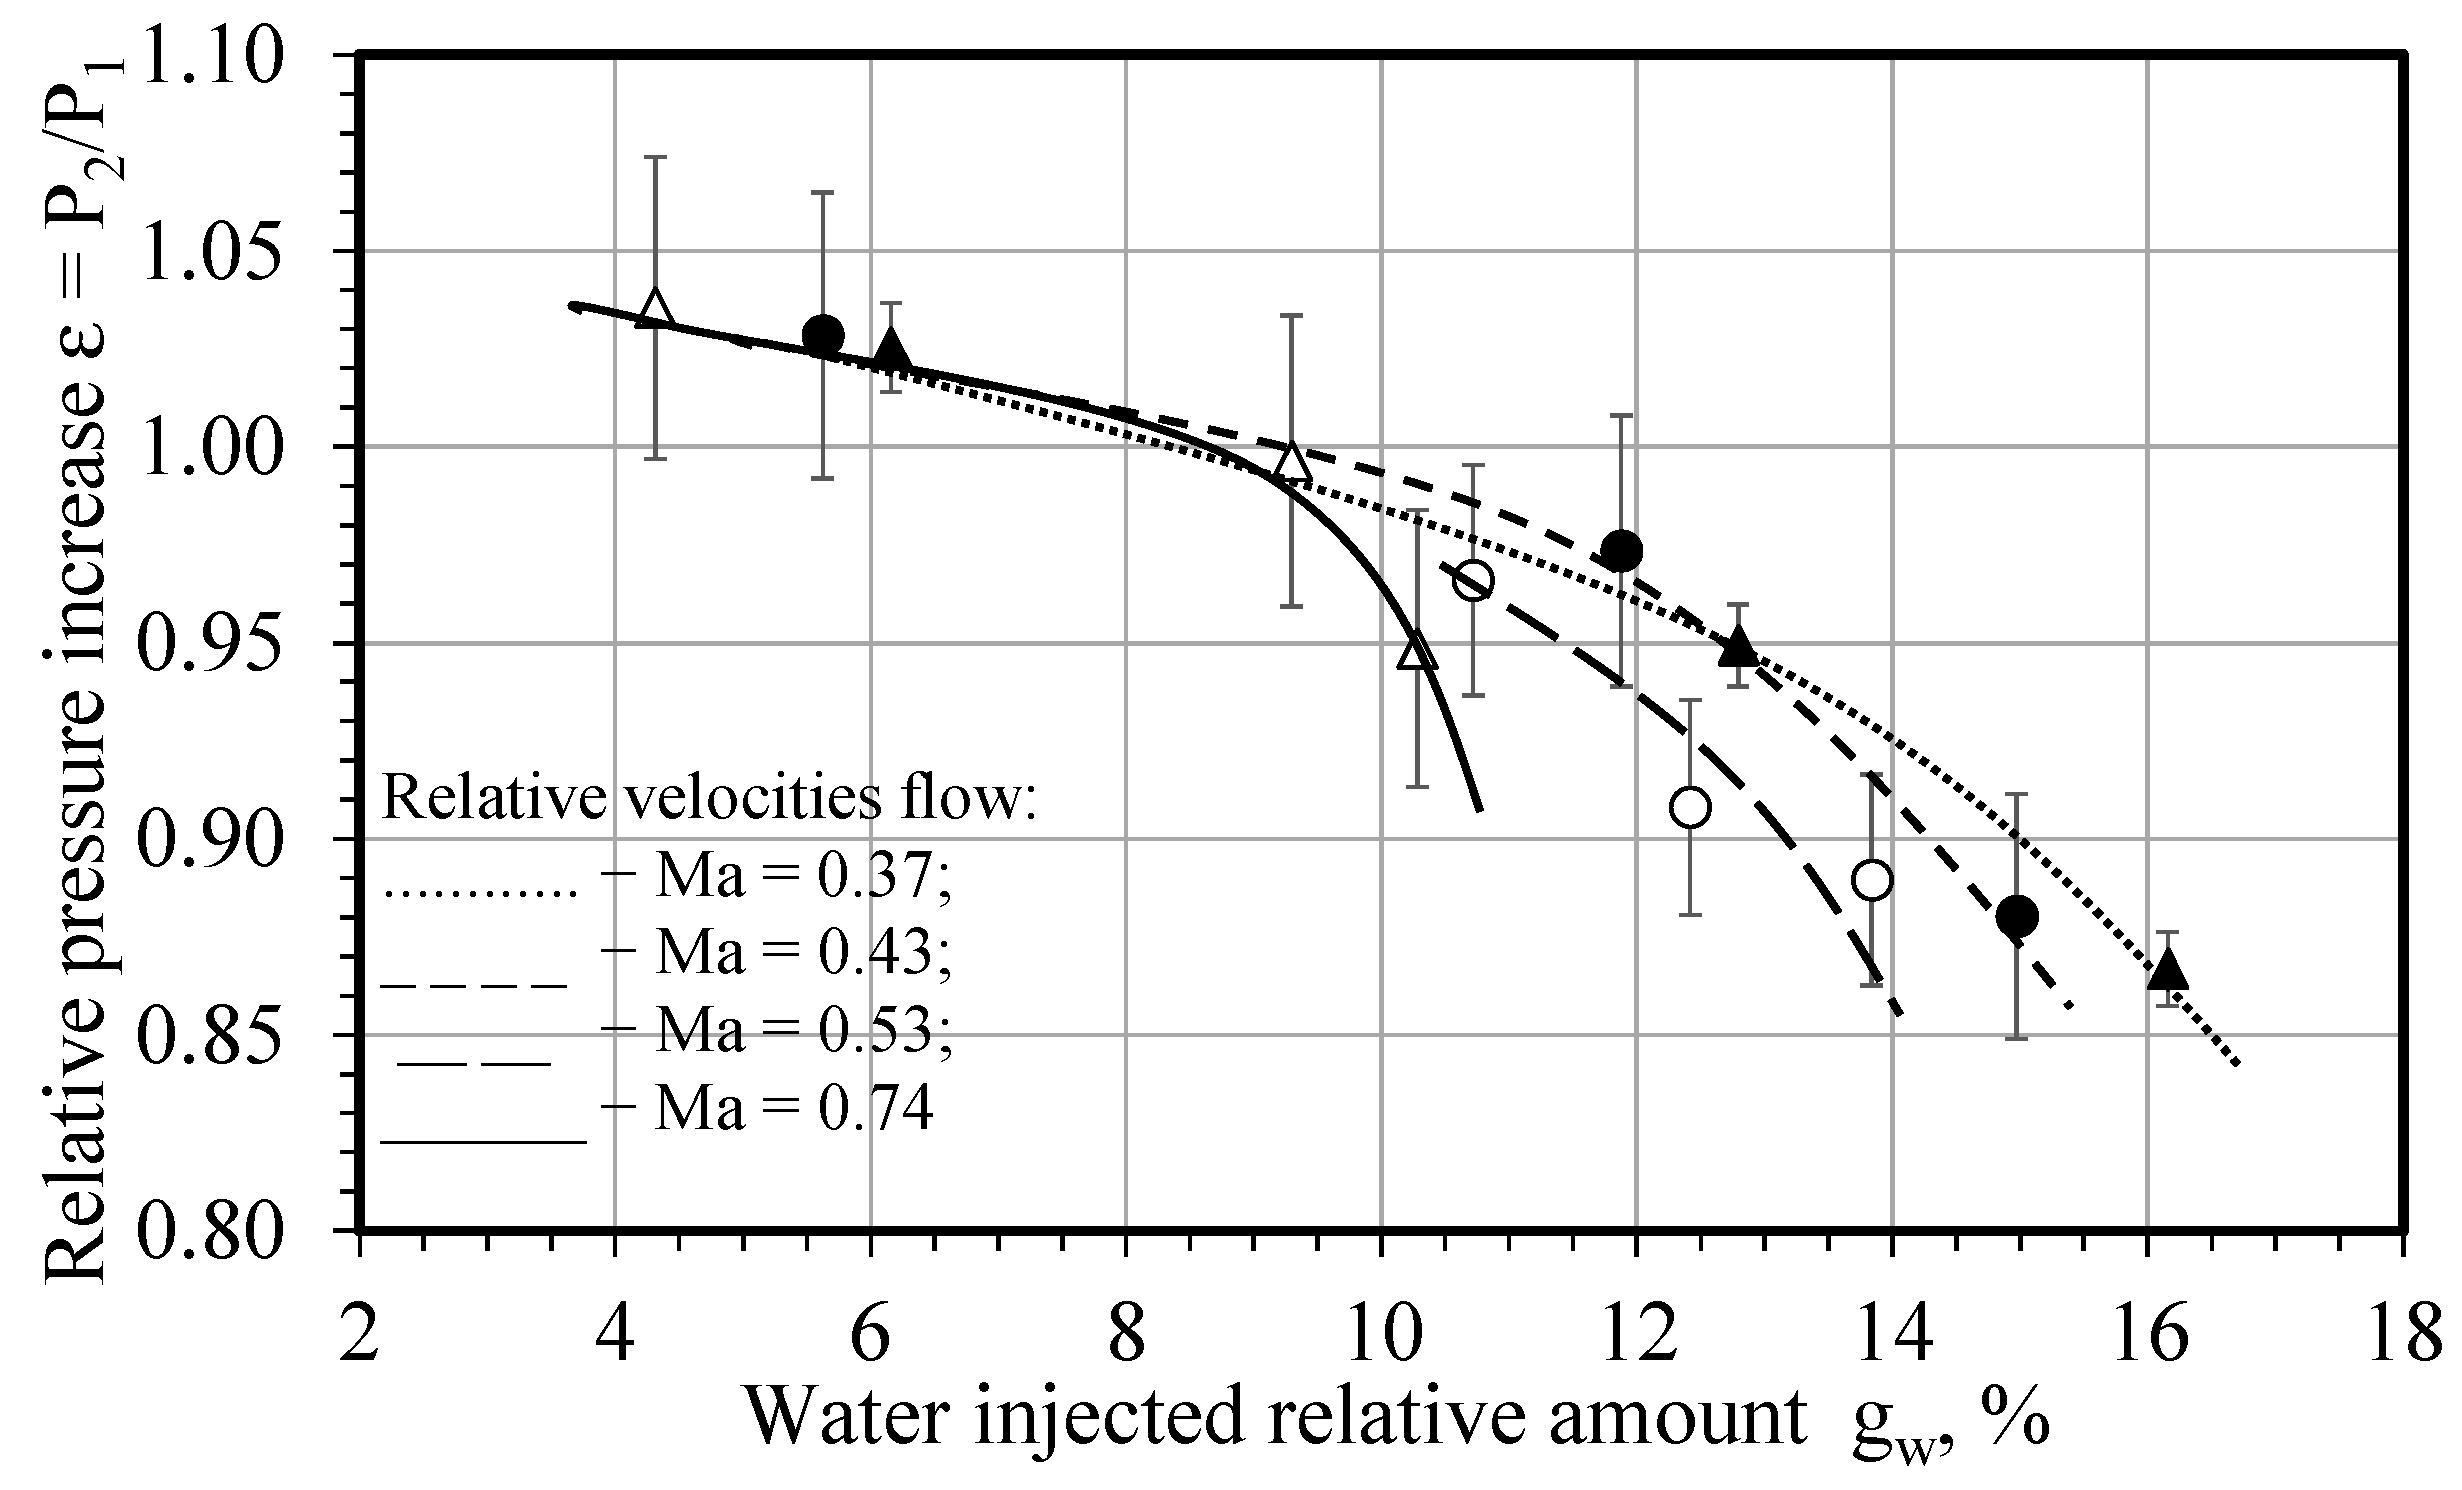
  • It was determined that the increase in pressure due to the effect of thermo-gas-dynamic compression depends on the influence of the aerodynamic resistance of the dispersed flow droplets in the thermopressor evaporation chamber. Water injection has a positive effect over the necessary amount for evaporation, but only in the area gw = 4–10% (0.0175–0.0487 kg/s), and a further increase in gw will result in a decrease in relative increase pressure εtp. Moreover, the increased relative velocity in the evaporation chamber (up to Ma = 0.74) shifts the limit value of gw to a narrower range of gw = 6–8%.
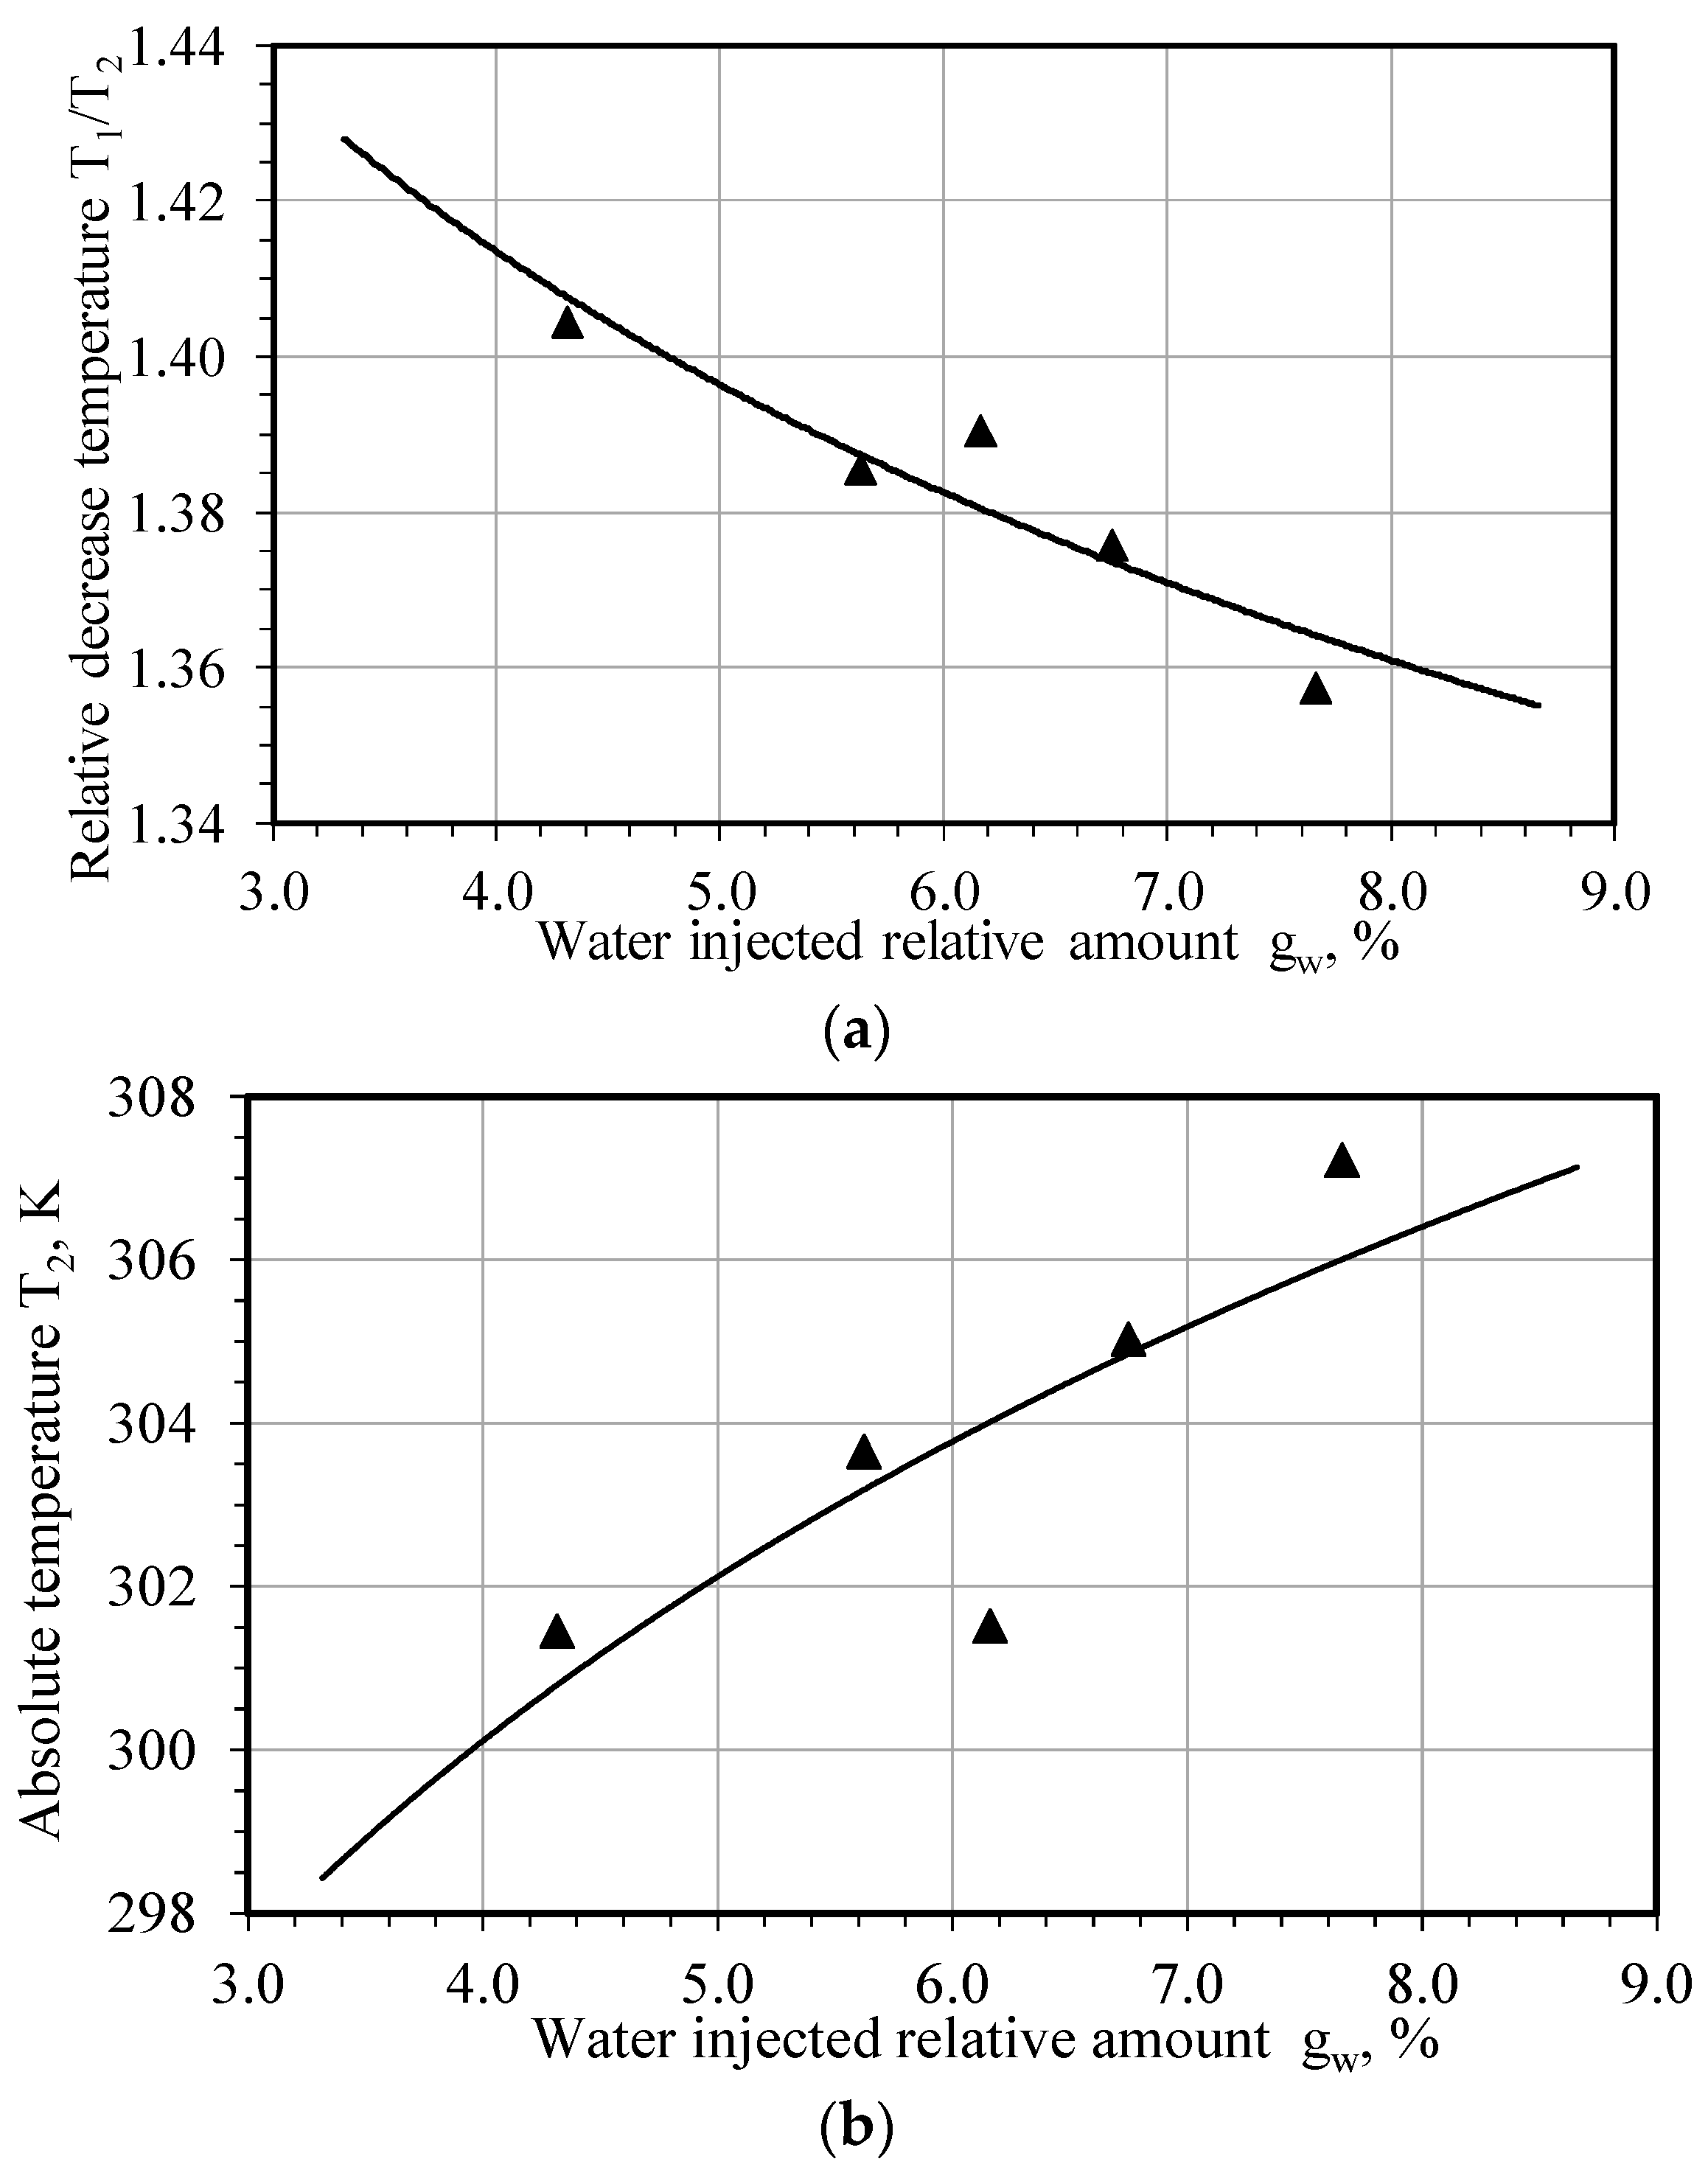
  • It has been experimentally shown that excessive liquid injection into the thermopressor for air cooling makes it possible to increase the relative pressure in the thermopressor to εtp = 1–3% (5–10 kPa). However, this makes it possible to ensure effective liquid high-dispersion spraying in the airflow with simultaneous air cooling up to 301–307 K.
  • The highly dispersed flow thus acquired with the use of the thermopressor can be pre-evaporated in the high-pressure compressor stage. This will allow the compression process to operate closer to an isothermal process.
  • The maximum error value of the increased pressure in the thermopressor during measurements, corresponding to the Student’s dispersion, does not exceed δtp = ±4.00%.
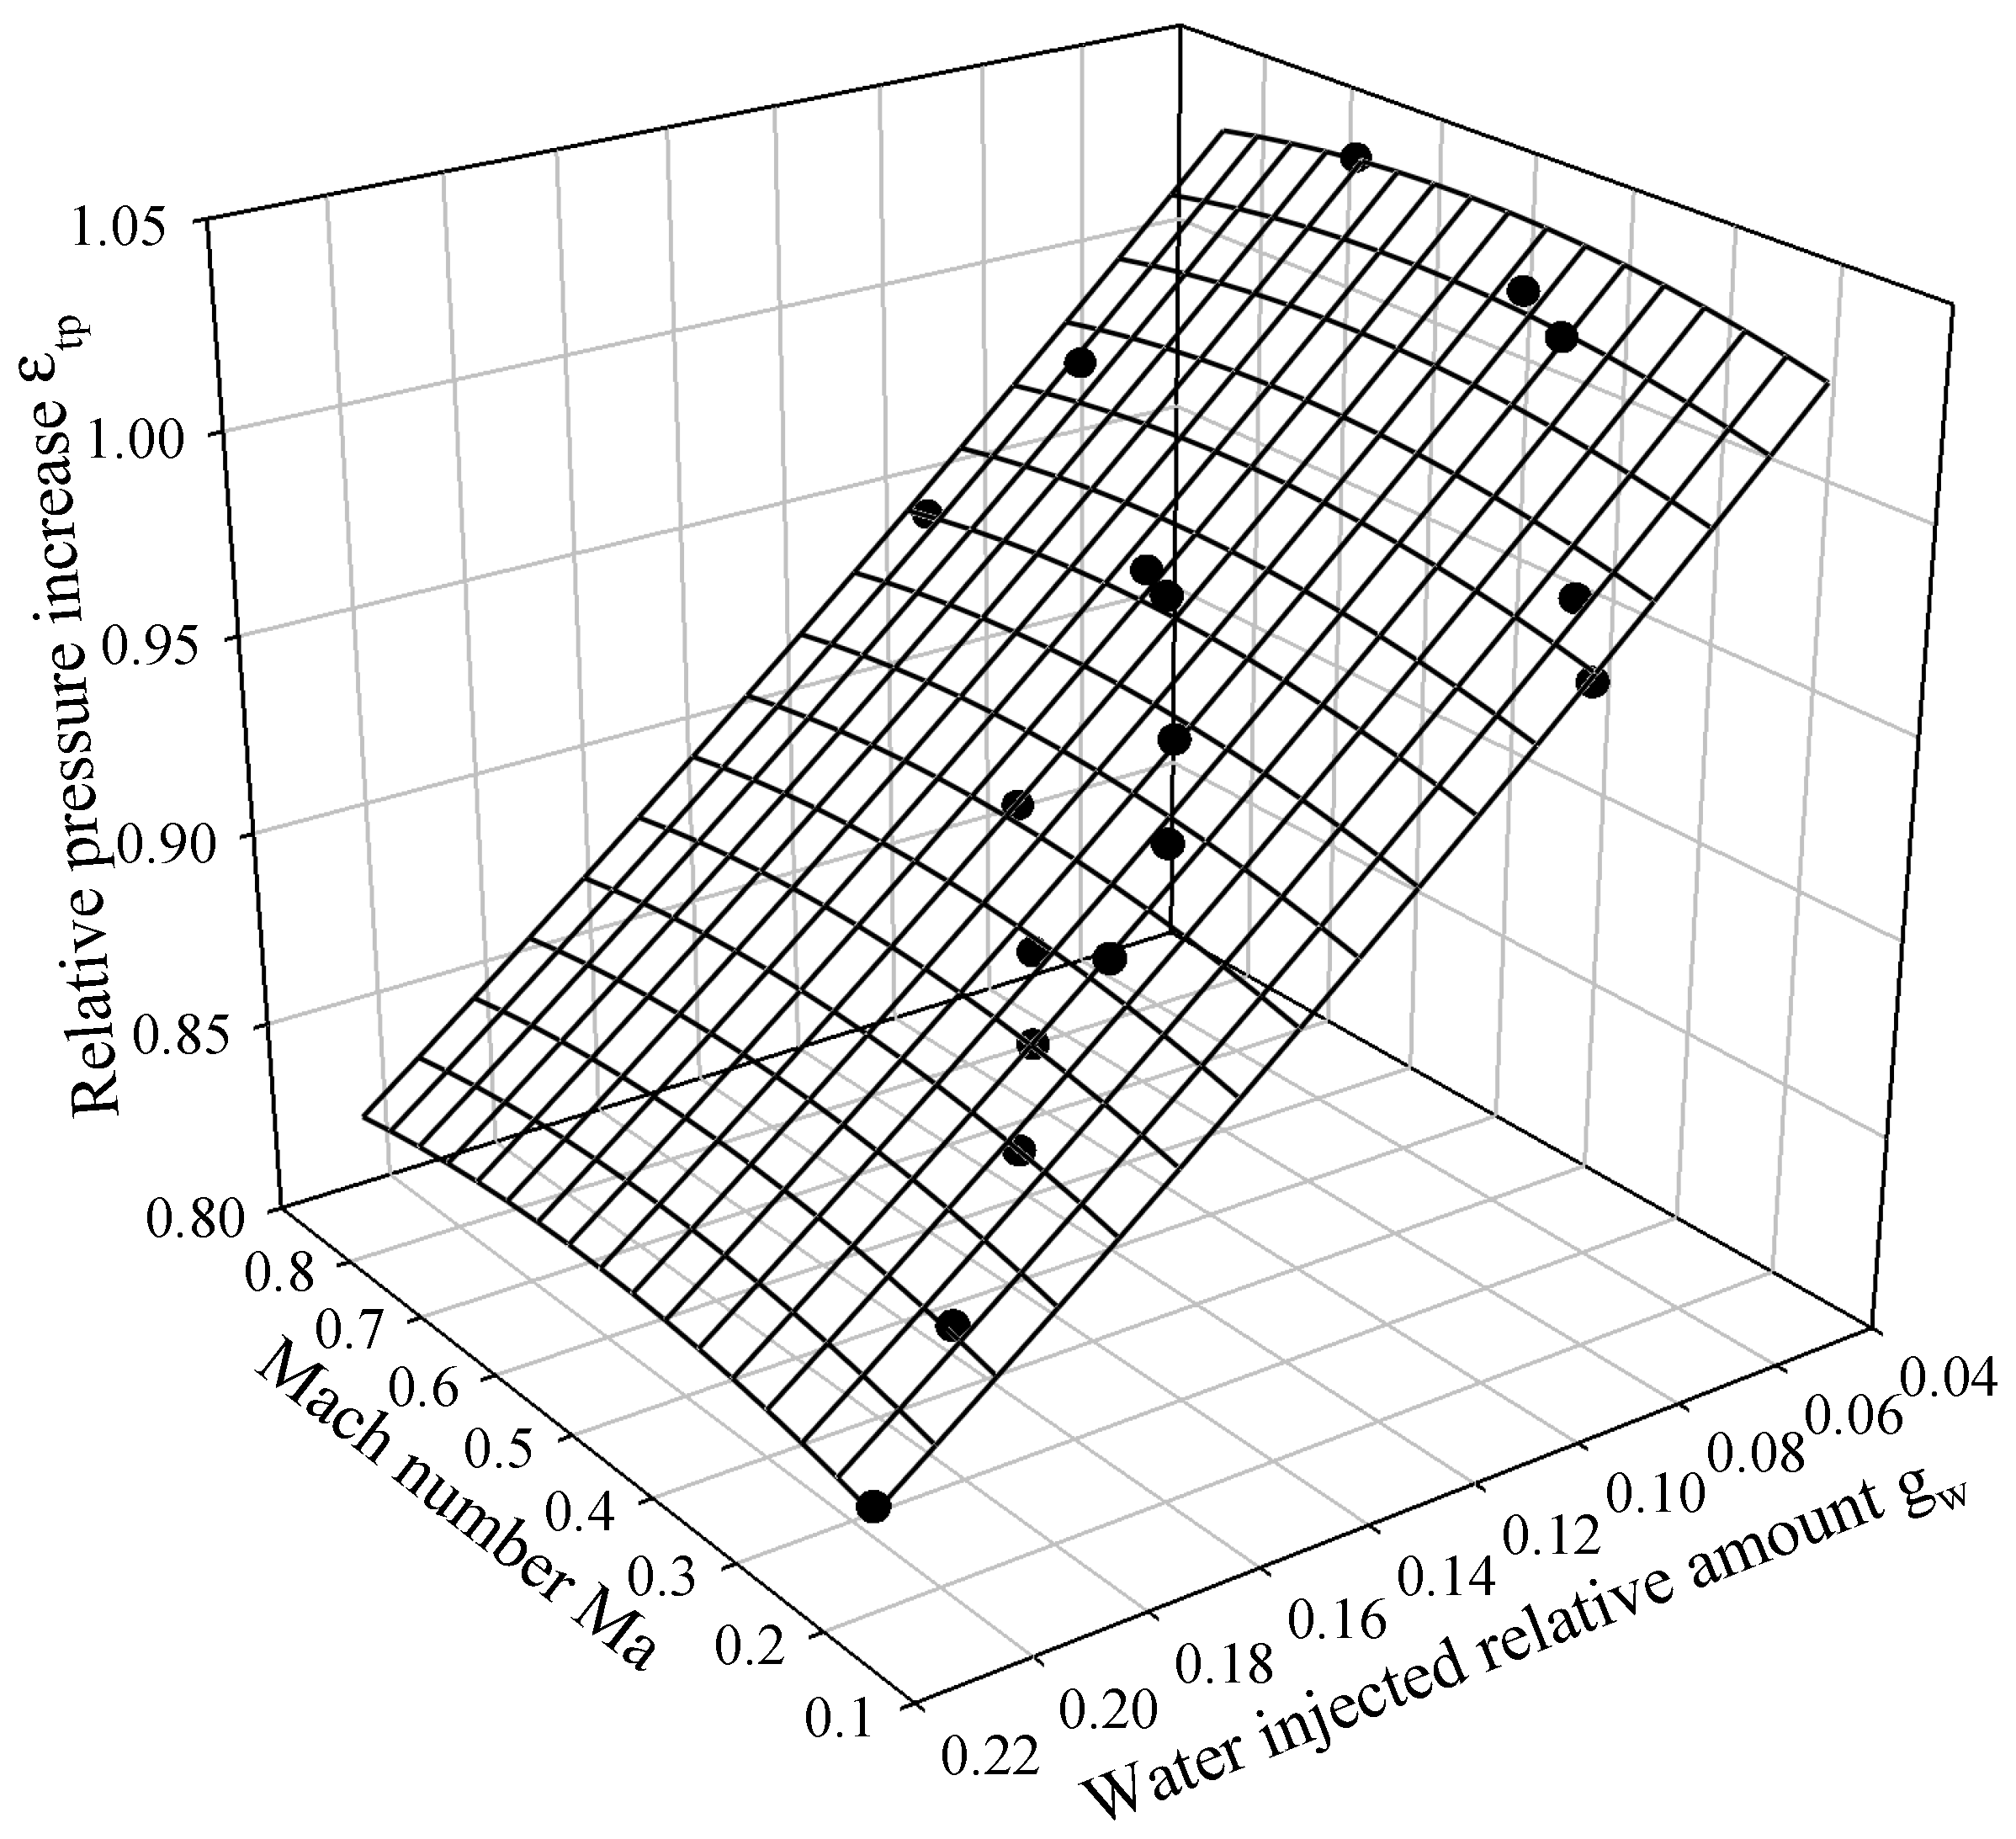
  • Based on experimental data, empirical equations are obtained for calculating the relative pressure increase in the thermopressor for intercooling systems of power plant engines’ cyclic air. The equation can calculate the thermopressor characteristics under incomplete water evaporation (up to gw = 10%) in the flowing part.
  • The obtained data on the optimal amount of water for injection and empirical equations for determining the pressure increase in the thermopressor correspond to low-consumption thermopressors with an airflow rate of up to 0.52 kg/s, evaporation chamber diameters of up to 50 mm (relative flow path length ltp is from 3 to 10), and a Mach number from 0.3 to 0.8.

Author Contributions

Conceptualization, D.K., Z.Y., and M.R.; methodology, D.K., M.R., and E.T.; validation, D.K., M.R., and H.K.; formal analysis, D.K., M.R., and H.K.; investigation, D.K., M.R., H.K., R.R., A.R., and E.T.; resources, H.K.; writing—original draft, D.K. and H.K.; writing—review and editing, T.L. and D.K.; supervision, D.K.; funding acquisition, Z.Y. All authors have read and agreed to the published version of the manuscript.

Funding

This research received no external funding.

Data Availability Statement

Not applicable.

Conflicts of Interest

The authors declare no conflict of interest.

Nomenclature

CHATCascaded Humidified Advanced Turbine
GEGeneral Electric
HATHumidified Advanced Turbine or Humidified Air Turbine
WACWater Atomization Cooling
Symbols and units
δwdroplet diameterμm
Gaair mass flowkg/s
gwrelative water amount%
Gwwater injected mass flowkg/s
ltprelative flow path length
MaMach number
Pflow pressurePa
Pwwater pressure at the inlet to the nozzleMPa
Taair temperature°C; K
ΔPtpflow pressure increases in the thermopressorPa; %
T1/T2relative temperature
εtpthermopressor degree of pressure increase
Subscripts
1before
2after
aair
tpthermopressor
wwater

References

  1. Emberson, D.R.; Wyndorps, J.; Ahmed, A.; Pires Bjørgen, K.O.; Løvås, T. Detailed examination of the combustion of diesel and glycerol emulsions in a compression ignition engine. Fuel 2021, 291, 120147. [Google Scholar] [CrossRef]
  2. Yang, Z.; Kornienko, V.; Radchenko, M.; Radchenko, A.; Radchenko, R.; Pavlenko, A. Capture of pollutants from exhaust gases by low-temperature heating surfaces. Energies 2022, 15, 120. [Google Scholar] [CrossRef]
  3. Sandeep, S.; Senthil Kumar, D.; Krishnan, S.; Pandey, S.K. Assessment of atomized water injection in the intake manifold of a heavy duty diesel engine for NOx reduction potential. In Proceedings of the IOP Conference Series: Materials Science and Engineering, Wuhan, China, 10–12 October 2019. [Google Scholar]
  4. Beltaifa, Y.; Holzberger, S.; Aslan, F.; Kettner, M.; Eilts, P. Optimization of Direct Water Injection Parameters to Improve the Trade-off Between Efficiency and NOx Emissions for a Lean-Burn CHP NG Engine. In Proceedings of the ASME 2020 Internal Combustion Engine Division Fall Technical Conference, Online, 4–6 November 2020. [Google Scholar]
  5. Block Novelo, D.A.; Igie, U.; Prakash, V.; Szymański, A. Experimental investigation of gas turbine compressor water injection for NOx emission reductions. Energy 2019, 176, 235–248. [Google Scholar] [CrossRef]
  6. Ayhan, V.; Ece, Y.M. New application to reduce NOx emissions of diesel engines: Electronically controlled direct water injection at compression stroke. Appl. Energy 2020, 260, 114328. [Google Scholar] [CrossRef]
  7. Kauf, M.; Gern, M.; Seefeldt, S. Evaluation of Water Injection Strategies for NOx Reduction and Charge Cooling in SI Engines. In Proceedings of the 2019 JSAE/SAE Powertrains, Fuels and Lubricants, SAE Technical Papers, Kyoto, Japan, 26–29 August 2019. [Google Scholar]
  8. Yao, Z.M.; Qian, Z.Q.; Li, R.; Hu, E. Energy efficiency analysis of marine high-powered medium-speed diesel engine base on energy balance and exergy. Energy 2019, 176, 991–1006. [Google Scholar] [CrossRef]
  9. Kornienko, V.; Radchenko, R.; Radchenko, M.; Radchenko, A.; Pavlenko, A.; Konovalov, D. Cooling Cyclic Air of Marine Engine with Water-Fuel Emulsion Combustion by Exhaust Heat Recovery Chiller. Energies 2022, 15, 248. [Google Scholar] [CrossRef]
  10. Radchenko, A.; Radchenko, M.; Mikielewicz, D.; Pavlenko, A.; Radchenko, R.; Forduy, S. Energy Saving in Trigeneration Plant for Food Industries. Energies 2022, 15, 1163. [Google Scholar] [CrossRef]
  11. Radchenko, A.; Radchenko, M.; Mikielewicz, D.; Radchenko, R.; Andreev, A. A novel degree-hour method for rational design loading. Proc. Inst. Mech. Eng. Part A J. Power Energy 2022, (online-first). 09576509221135659. [Google Scholar] [CrossRef]
  12. Yang, Z.; Radchenko, M.; Radchenko, A.; Mikielewicz, D.; Radchenko, R. Gas Turbine Intake Air Hybrid Cooling Systems and a New Approach to Their Rational Designing. Energies 2022, 15, 1474. [Google Scholar] [CrossRef]
  13. Zhao, Z.; Wang, Z.; Xie, S.; Zhang, M.; Ouyang, T. A novel design of power-cooling cogeneration system driven by solid oxide fuel cell waste heat in ocean-going vessels. J. Clean. Prod. 2021, 318, 128532. [Google Scholar] [CrossRef]
  14. Radchenko, A.; Scurtu, I.C.; Radchenko, M.; Radchenko, R.; Forduy, S.; Zubarev, A. Monitoring the efficiency of cooling air at the inlet of gas engine in integrated energy system. Therm. Sci. 2022, 26, 185–194. [Google Scholar] [CrossRef]
  15. Radchenko, A.; Trushliakov, E.; Kosowski, K.; Mikielewicz, D.; Radchenko, M. Innovative turbine intake air cooling systems and their rational designing. Energies 2020, 13, 6201. [Google Scholar] [CrossRef]
  16. Yang, Z.; Kornienko, V.; Radchenko, M.; Radchenko, A.; Radchenko, R. Research of Exhaust Gas Boiler Heat Exchange Surfaces with Reduced Corrosion When Water-Fuel Emulsion Combustion. Sustainability 2022, 14, 11927. [Google Scholar] [CrossRef]
  17. Yang, Z.; Korobko, V.; Radchenko, M.; Radchenko, R. Improving Thermoacoustic Low-Temperature Heat Recovery Systems. Sustainability 2022, 14, 12306. [Google Scholar] [CrossRef]
  18. Radchenko, M.; Radchenko, A.; Radchenko, R.; Kantor, S.; Konovalov, D.; Kornienko, V. Rational loads of turbine inlet air absorption-ejector cooling systems. Proc. Inst. Mech. Eng. Part A J. Power Energy 2022, 236, 450–462. [Google Scholar] [CrossRef]
  19. Han, Z.X.; Guo, J.F.; Zhang, H.Y.; Chen, J.L.; Huai, X.L. Study on the Flow and Heat Transfer Characteristics of Pressurized Humid Air in Humidification Cycle Gas Turbine Regenerator. J. Eng. Thermophys. 2021, 42, 2899–2910. [Google Scholar]
  20. Radchenko, M.; Mikielewicz, D.; Andreev, A.; Vanyeyev, S.; Savenkov, O. Efficient Ship Engine Cyclic Air Cooling by Turboexpander Chiller for Tropical Climatic Conditions. In Lecture Notes in Networks and Systems; Springer: Cham, Switzerland, 2021; pp. 498–507. [Google Scholar]
  21. De Paepe, W.; Carrerro, M.M.; Bram, S.; Parente, A.; Contino, F. Advanced Humidified Gas Turbine Cycle Concepts Applied to Micro Gas Turbine Applications for Optimal Waste Heat Recovery. Energy Procedia 2017, 105, 1712–1718. [Google Scholar] [CrossRef]
  22. Salehi, M.; Eivazi, H.; Tahani, M.; Masdari, M. Analysis and prediction of gas turbine performance with evaporative cooling processes by developing a stage stacking algorithm. J. Clean. Prod. 2020, 277, 122666. [Google Scholar] [CrossRef]
  23. Shukla, A.K.; Singh, O. Impact of Inlet Fogging on the Performance of Steam Injected Cooled Gas Turbine Based Combined Cycle Power Plant. In Proceedings of the Gas Turbine India Conference, Bangalore, India, 7–8 December 2017. [Google Scholar]
  24. Zeitoun, O. Two-stage evaporative inlet air gas turbine cooling. Energies 2021, 14, 1382. [Google Scholar] [CrossRef]
  25. Kumar Shukla, A.; Sharma, A.; Sharma, M.; Mishra, S. Performance Improvement of Simple Gas Turbine Cycle with Vapor Compression Inlet Air Cooling. Mater. Today Proc. 2018, 5, 19172–19180. [Google Scholar] [CrossRef]
  26. Yaïci, W.; Ghorab, M.; Entchev, E. 3D CFD study of the effect of inlet air flow maldistribution on plate-fin-tube heat exchanger design and thermal–hydraulic performance. Int. J. Heat Mass Transf. 2016, 101, 527–541. [Google Scholar] [CrossRef]
  27. De Paepe, W.; Pappa, A.; Coppitters, D.; Montero Carrero, M.; Tsirikoglou, P.; Contino, F. Recuperator Performance Assessment in Humidified Micro Gas Turbine Applications Using Experimental Data Extended With Preliminary Support Vector Regression Model Analysis. J. Eng. Gas Turbines Power 2021, 143, 071030. [Google Scholar] [CrossRef]
  28. De Paepe, W.; Delattin, F.; Bram, S.; De Ruyck, J. Water injection in a micro gas turbine—Assessment of the performance using a black box method. Appl. Energy 2013, 112, 1291–1302. [Google Scholar] [CrossRef]
  29. Yang, Z.; Konovalov, D.; Radchenko, M.; Radchenko, R.; Kobalava, H.; Radchenko, A.; Kornienko, V. Analysis of Efficiency of Thermopressor Application for Internal Combustion Engine. Energies 2022, 15, 2250. [Google Scholar] [CrossRef]
  30. Sun, J.; Zhou, X.; Liang, Q.; Zuo, Z.; Chen, H. The effect of wet compression on a centrifugal compressor for a compressed air energy storage system. Energies 2019, 12, 906. [Google Scholar] [CrossRef] [Green Version]
  31. Sun, J.; Hou, H.; Zuo, Z.; Tang, H.; Chen, H. Numerical study on wet compression in a supercritical air centrifugal compressor. Proc. Inst. Mech. Eng. Part A J. Power Energy 2020, 234, 384–397. [Google Scholar] [CrossRef]
  32. Konovalov, D.; Radchenko, M.; Kobalava, H.; Radchenko, A.; Radchenko, R.; Kornienko, V.; Maksymov, V. Research of characteristics of the flow part of an aerothermopressor for gas turbine intercooling air. Proc. Inst. Mech. Eng. Part A J. Power Energy 2022, 236, 634–646. [Google Scholar] [CrossRef]
  33. Shapiro, A.H.; Wadleigh, K.R.; Gavril, B.D.; Fowle, A.A. The Aerothermopressor—A Device for Improving the Performance of a Gas-Turbine Power Plant. Trans. Am. Soc. Mech. Eng. 2022, 78, 617–650. [Google Scholar] [CrossRef]
  34. Fowle, A. An Experimental Investigation of an Aerothermopressor Having a Gas Flow Capacity of 25 Pounds per Second. Ph.D. Thesis, Massachusetts Institute of Technology, Cambridge, MA, USA, 1972. [Google Scholar]
  35. Dixon, S.L.; Hall, C.A. Fluid Mechanics and Thermodynamics of Turbomachinery, 7th ed.; Butterworth-Heinemann: Oxford, UK, 2013; pp. 1–537. [Google Scholar]
  36. Sun, J.; Zuo, Z.; Liang, Q.; Zhang, X.; Guo, H.; Chen, H. Theoretical and experimental study on effects of wet compression on centrifugal compressor performance. Appl. Therm. Eng. 2022, 212, 118163. [Google Scholar] [CrossRef]
  37. Dayyabu, G.K.; Zheng, Q.; Zhang, H.; Sun, L. Effects of water droplets on the numerical simulation of a complete gas turbine. Int. J. Thermodyn. 2018, 21, 7–14. [Google Scholar] [CrossRef]
  38. Kruzel, M.; Bohdal, T.; Dutkowski, K.; Radchenko, M. The Effect of Microencapsulated PCM Slurry Coolant on the Efficiency of a Shell and Tube Heat Exchanger. Energies 2022, 15, 5142. [Google Scholar] [CrossRef]
  39. Radchenko, M.; Korobko, V.; Kantor, S.; Zubarev, A.; Girzheva, O. Turbine Intake Air Combined Cooling Systems. In Lecture Notes in Mechanical Engineering; Springer: Cham, Switzerland, 2022; pp. 278–287. [Google Scholar]
  40. Burger, F.; Jeanne, B.-S.; Uli, R. Combustion Gas Turbine with Cooled Guide Vane Support Structure. US Patent 3408044 A, 29 October 1968. [Google Scholar]
  41. Bhargava, R.K.; Bianchi, M.; Campanari, S.; de Pascale, A.; di Montenegro, G.N.; Peretto, A. A parametric thermodynamic evaluation of high performance gas turbine based power cycles. J. Eng. Gas Turbines Power 2010, 132, 022001. [Google Scholar] [CrossRef]
  42. De Biasi, V. LM6000 Sprint Design Enhanced to Increase Power and Efficiency. Gas Turbine World 2000, 30, 16–19. [Google Scholar]
  43. Boyce, M.P. Gas Turbine Engineering Handbook; Gulf Professional Publishing: Houston, TX, USA, 2017. [Google Scholar]
  44. De Paepe, W.; Montero Carrero, M.; Bram, S.; Contino, F.; Parente, A. Waste heat recovery optimization in micro gas turbine applications using advanced humidified gas turbine cycle concepts. Appl. Energy 2017, 207, 218–229. [Google Scholar] [CrossRef]
  45. Zhang, Q.; He, M.; Wang, Y.; Weng, S. Analysis of air humidification process for humid air turbine cycle with a detailed air humidifier model. Appl. Energy 2020, 279, 115833. [Google Scholar] [CrossRef]
  46. Dolinsky, A.; Basok, B.I.; Nakorchevsky, A.I. Experimental studies of boiling incipience in flow through a contracting-diverging nozzle. Heat Transf. Res. 1997, 28, 510–513. [Google Scholar] [CrossRef]
  47. Mahmood, M.; Martini, A.; Massardo, A.F.; De Paepe, W. Model based diagnostics of AE-T100 micro humid air turbine cycle. In Proceedings of the ASME Turbo Expo, Lillestrøm, Norway, 11–15 June 2018. [Google Scholar]
  48. Guangya, Z.; Chow, T.T.; Fong, K.F.; Lee, C.K. Investigation on humidified gas turbine cycles with Maisotsenko-cycle-based air saturator. Energy Procedia 2019, 158, 5195–5200. [Google Scholar] [CrossRef]
  49. Al-Ansary, H.A.; Orfi, J.A.; Ali, M.E. Impact of the use of a hybrid turbine inlet air cooling system in arid climates. Energy Convers. Manag. 2013, 75, 214–223. [Google Scholar] [CrossRef]
  50. Kim, K.H.; Ko, H.J.; Kim, K.; Perez-Blanco, H. Analysis of water droplet evaporation in a gas turbine inlet fogging process. Appl. Therm. Eng. 2012, 33–34, 62–69. [Google Scholar] [CrossRef]
  51. Barabash, P.; Solomakha, A.; Sereda, V. Experimental investigation of heat and mass transfer characteristics in direct contact exchanger. Int. J. Heat Mass Transf. 2020, 162, 120359. [Google Scholar] [CrossRef]
  52. Chaker, M.; Mee, T.R. Design consideration of fogging and wet compression systems as function of gas turbine inlet duct configurations. In Proceedings of the ASME Turbo Expo, Montreal, QC, Canada, 15–19 June 2015. [Google Scholar]
  53. Khan, J.R.; Wang, T. Three-dimensional modeling for wet compression in a single stage compressor including liquid particle erosion analysis. J. Eng. Gas Turbines Power 2011, 133, 012001. [Google Scholar] [CrossRef]
  54. Doerr, T.; Braun, S.; Schuster, S.; Brillert, D. Proof of concept for a novel interstage injection design in axial compressors. J. Eng. Gas Turbines Power 2021, 143, 061030. [Google Scholar] [CrossRef]
  55. Dutkowski, K.; Kruzel, M. Microencapsulated PCM slurries’ dynamic viscosity experimental investigation and temperature-dependent prediction model. Int. J. Heat Mass Transf. 2019, 145, 118741. [Google Scholar] [CrossRef]
  56. Mohan, A.; Chidambaram, P.K.; Suryan, A.; Kim, H.D. Energy efficiency analysis of wet compression systems through thermo-fluid dynamic considerations. J. Clean. Prod. 2019, 214, 132–144. [Google Scholar] [CrossRef]
  57. Palestrant, L.; Andrews H., L. Atomizing nozzle. Patent US 2009/0308953 A1, 17 December 2009. [Google Scholar]
  58. Wet Compression Power Augmentation. Boost Gas Turbine Power with MeeFog; Mee Industries Inc.: St. Irwindale, CA, USA, 2020; 8p. [Google Scholar]
  59. Van Liere, J.; Laagland, G.H.M. The tophat® Cycle; VDI Berichte: Düsseldorf, Germany, 2000; pp. 161–175. [Google Scholar]
  60. Payling, S.R.; Coleman, R.P.; Brown, C.L. Methods and Apparatus for Water Injection in a Turbine Engine. US Patent 6470667 B1, 29 October 2002. [Google Scholar]
Figure 1. The pressure relative increase ratio εtp = P2/P1 in the flowing part on the water injected relative amount gw: (a) Ma = 0.45; (b) Ma = 0.70; ▲—T1 = 700 K; □—T2 = 800 K; ○—T3 = 920 K.
Energies 16 00020 g001
Figure 2. Experimental unit for research of thermopressor characteristics: TT—temperature sensor; PT—pressure sensor; FIS—flow meter.
Energies 16 00020 g002
Figure 3. Experimental thermopressor: nozzle for liquid injection system (a); main elements of the thermopressor (b); receiving chamber (c); liquid injection system (d); confuser (e); evaporation chamber (f); diffuser (g).
Energies 16 00020 g003
Figure 4. Heat exchanger for heating the air pressurized into the receiving chamber of the thermopressor: (a) installation of the heat exchanger on the thermopressor module; (b) location of internal ribbing.
Energies 16 00020 g004
Figure 5. The measurement system and control of the experimental setup parameters: (a) connection scheme of the PI485/USB communication interface with a PC and eight-channel meters; (b) information and measurement system: 1—PY485/USB communication interface; 2—PC with installed software; 3—eight-channel temperature meter; 4—temperature sensors; 5—pressure sensors; 6—eight-channel pressure meter; 7—thermal imager.
Energies 16 00020 g005
Figure 6. Measurement experimental data of pressure losses (a) and relative pressure losses (b) in the flow part of the thermopressor depend on the relative velocity M in the evaporation chamber.
Energies 16 00020 g006
Figure 7. Experimental dependencies of the relative pressure increase εtp = P2/P1 in the thermopressor flow part on the velocity airflow Ma numbers and water consumption on nozzles Gw.
Energies 16 00020 g007
Figure 8. Experimental dependencies of the temperature ratios (T1/T2) (a) and the temperature T2 (b) on the relative velocity of the evaporation chamber Ma at Gw is 0.0175 kg/s.
Energies 16 00020 g008
Figure 9. Experimental dependencies of the increase pressure εtp = P2/P1 (a) and the pressure loss in the thermopressor Ptp = P1 − P2 on the water injected relative amount into the thermopressor flow part gw (b): ▲—Ma = 0.37; ●—Ma = 0.43; ○—Ma = 0.53; Δ—Ma = 0.74.
Energies 16 00020 g009
Figure 10. The relative pressure increase measuring error at the availability of evaporation εtp from the water injected relative amount gw.
Energies 16 00020 g010
Figure 11. Design of an approximation surface for determining εtp = P2/P1 as function of the relative velocity of the evaporation chamber Ma (Mach number) and water injected relative amount gw.
Energies 16 00020 g011
Table 1. Approximation functions and their coefficients for Figure 7.
Equation CoefficientRR2
y0x0abcd
Plane:
z = x 0 + a x + b y
1.01010.1745−3.86080.92550.8566
Paraboloid:
z = y 0 + a x + b y + c x 2 + d y 2
0.79850.31599.7491−0.1479−209.010.98320.9667
Gaussian:
z = a e 0.5 [ ( x x 0 b ) 2 + ( y y 0 c ) 2 ]
0.02371.01741.08591.70440.04650.98200.9533
Lorentzian:
z = a [ 1 + ( x x 0 b ) 2 ] × [ 1 + ( y y 0 c ) 2 ]
0.02400.99341.08802.28800.06110.98200.9641
Table 2. Approximation functions and their coefficients for Figure 11.
Equation CoefficientRR2
y0x0abcd
Plane:
z = x 0 + a x + b y
1.08080.0048−1.19820.92990.8647
Paraboloid:
z = y 0 + a x + b y + c x 2 + d y 2
1.06640.0961−1.3433−0.08690.68210.93070.8663
Gaussian:
z = a e 0.5 [ ( x x 0 b ) 2 + ( y y 0 c ) 2 ]
−3.00780.55536.71762.18821.57810.93120.8672
Lorentzian:
z = a [ 1 + ( x x 0 b ) 2 ] × [ 1 + ( y y 0 c ) 2 ]
−0.63910.55681.80023.01520.79550.93130.8673
Disclaimer/Publisher’s Note: The statements, opinions and data contained in all publications are solely those of the individual author(s) and contributor(s) and not of MDPI and/or the editor(s). MDPI and/or the editor(s) disclaim responsibility for any injury to people or property resulting from any ideas, methods, instructions or products referred to in the content.

