Article

Countercurrent Flow Limitation in a Pipeline with an Orifice

1
Nuclear and Radiation Safety Center, Ministry of Ecology and Environment of the People’s Republic of China, Beijing 100082, China
2
State Key Laboratory of Nuclear Power Safety Monitoring Technology and Equipment, China Nuclear Power Engineering Co., Ltd., Shenzhen 518172, China
3
Institute of Thermal Science and Technology, Shandong University, Jinan 250061, China
*
Author to whom correspondence should be addressed.
Energies 2023, 16(1), 222; https://doi.org/10.3390/en16010222
Submission received: 26 October 2022 / Revised: 13 December 2022 / Accepted: 21 December 2022 / Published: 25 December 2022
(This article belongs to the Special Issue Thermal-Hydraulic Challenges in Advanced Nuclear Reactors)

Abstract

:
Countercurrent flow limitation (CCFL) refers to an important class of gravity-induced hydrodynamic processes that impose a serious restriction on the operation of gas–liquid two-phase systems. In a nuclear power plant, CCFL may occur in the liquid level measurement system where an orifice is applied in the pipeline, which may introduce error into the level measurement system. CCFL can occur in horizontal, vertical, inclined, and even much more complicated geometric patterns, and the hot-leg channel flow passage has been widely investigated; however, a pipeline with variable cross-sections, including an orifice, has not yet been investigated. An experimental investigation has been conducted in order to identify the phenomenon, pattern, and mechanism of CCFL onset in this type of geometry. Both visual and quantified experiments were carried out. A high-speed camera was applied to capture the flow pattern. Visual experiments were implemented at atmospheric pressure, while quantified pressurizer experiments were implemented at higher pressures. It was determined that if the condensate drainage is low and the liquid level is also low, with a stable stratified flow upstream of the orifice, there is no oscillation of the differential pressure. However, at higher condensate drainage levels, when the liquid level increases, a stratified wavy flow occurs. One of these waves can suddenly rise upstream of the orifice to choke it, which subsequently gives rise to differential pressure across the orifice, with periodic variation. This pattern alternately features stratified flow, stratified wavy flow, and slug flow, which indicates the occurrence of CCFL. The CCFL occurring under these experimental conditions can be expressed as a Wallis type correlation, where the coefficients m and C are 0.682 and 0.601, respectively.

Graphical Abstract

1. Introduction

Gas–liquid two-phase countercurrent flow occurs widely in practical applications of industrial systems such as nuclear reactors, steam generators, oil and gas pipelines, refrigeration equipment, reflux condensers, packed columns, heat pipes, etc. If the liquid and gas are flowing in opposite directions, the flow is called countercurrent flow (CCF). For a certain range of gas and liquid flow rates, the countercurrent flow is stratified flow. If the gas flow rate increases to a certain value, the liquid flow is stopped and is subsequently taken over by the gas, partially or completely flowing in the opposite direction. This phenomenon is known as countercurrent flow limitation (CCFL), or the onset of flooding.
In nuclear power plants, it is necessary to accurately measure and control the liquid level of the pressurizer. The pressurizer’s measurement system is shown in Figure 1. One port of the liquid level measuring device (MN) is connected to the liquid domain in the pressurizer, and the measured pressure is P1. The other port is connected to the condenser (C), and the measured pressure is P2. The condenser is connected to the steam space of the pressurizer via the orifice (A), valve (B), and the connection pipelines. The measured pressures P1 and P2 are then calculated to obtain the liquid level in the pressurizer. The accuracy of the pressurizer liquid level measurement should be guaranteed, both in the steady and transient states.
The orifice is applied to prevent the measurement system from overpressurizing during an accident. Its details are shown in Figure 2.
In the measurement process, the vapor condenses in the condenser, and the condensate attempts to flow back to the pressurizer by gravity, while the vapor attempts to rise, leading to a countercurrent flow configuration. The rising vapor can seriously reduce the rate of liquid backflow, or even completely block it; thus, countercurrent flow limitation (CCFL) occurs. Once CCFL happens in the liquid level measurement system, the condensate drainage capacity is restricted, and a liquid column emerges in the pipeline between the orifice and the condenser, which may introduce error into the level measurement system. Therefore, CCFL represents a major issue that must be considered in the design and operation of the pressurizer liquid level measurement system.
CCFL refers to an important class of gravity-induced hydrodynamic processes that impose a serious restriction on the operation of gas–liquid two-phase systems. Some examples in which CCFL determines what we can and cannot be done include the following: (a) the “reflux” phenomenon in vertically oriented condenser channels with bottom-up vapor flow, and (b) the emergency coolant injection into nuclear reactor cores following accidents inducing a loss of coolant [1].
The Wallis correlation is the most widely used method of evaluation, and it can be written as [2]:
j G * 1 / 2 + m j L * 1 / 2 = C ,
where
j G * = ρ G Δ ρ g D j G ,
j L * = ρ L Δ ρ g D j L .
The identification of the CCFL onset mechanism and the corresponding CCFL onset correlation is the first important step in studying the CCFL phenomenon. Over several decades, a number of researchers have carried out experimental and theoretical studies considering two-phase countercurrent flow to explore the CCFL mechanism and CCFL characteristics. The earliest work was performed by Wallis [2], which later became the reference standard for many other researchers. Extensive relevant experiments have been conducted using vertical channels, horizontal channels, inclined channels, and other complex channels, including the PWR hot leg and the surge line.
Bankoff and Lee [3] reviewed the flooding studies using vertical and inclined channels. They suggested that more experiments are needed to investigate the effect of the important parameters. For vertical channels, horizontal channels, and inclined channels, a series of experimental and theoretical studies have been performed to instigate the geometric and the fluid properties effect of CCFL [4,5,6,7,8,9,10,11,12]. In particular, the possible occurrence of CCFL in the hot leg of a PWR during SBLOCA or LOCA accidents is of special interest for nuclear safety research; therefore, large numbers of experimental investigations and numerical studies have been carried out on these topics in recent years [13,14,15,16,17,18,19].
Some researchers also conducted countercurrent flow experiments in a channel with flow obstructions to evaluate the influence of the obstructions on CCFL [20,21,22,23,24]. Sun [20] carried out two-phase countercurrent flow experiments in a BWR bundle model. He obtained the CCFL data for vertical orifices, and empirical flooding correlations were proposed based on these data. Murase et al. [21] also conducted CCFL experiments in the test facility of a boiling system simulating a BWR core. Celata et al. [22] performed air–water experiments with a transparent circular duct test section, inside which the orifices are inserted, to test the effect of obstructions on the flooding phenomenon. The results indicated that the obstruction advances the flooding phenomenon. Kawaji et al. [23] experimentally investigated the countercurrent flooding in pipes containing multiple elbows and an orifice. They found that the orifice placed in the horizontal section generally lowered flooding gas velocities, with the greatest effect noted for the smallest orifice tested. Later, Teyssedou et al. [24] presented experimental data regarding air–water countercurrent slug flow in vertical-to-horizontal pipes containing orifice type obstructions to characterize slug flow occurring due to the hydrodynamic interaction between an elbow and an orifice located in a horizontal pipe. They stated that the position of the orifice does not affect the onset of flooding and slugging.
It can be seen that the orifices or obstructions employed in previous experimental investigations comprised constant diameters, and there are no CCFL experimental investigations carried out in a channel with a variable cross-section orifice. The orifice employed in this study is used to prevent the measurement system from overpressurizing in the event of an accident. Moreover, most of the studies regarding CCFL used air–water as test fluids, whereas relatively fewer studies dealt with steam–water. Therefore, it is necessary to investigate the effect of an orifice with variable cross-sections on steam–water CCFL in the pressurizer liquid level measurement pipeline.
The pressurizer liquid level measurement pipeline consists of a condenser on the top, a horizontal pipe between the valve and the condenser, the valve, an inclined pipe between the valve and the orifice, the orifice, and the horizontal pipe between the orifice and the pressurizer, as shown in Figure 1. The piping is complicated, particularly regarding the diameter of the pipe, which is not constant due to the existence of the orifice, as shown in Figure 2. The CCFL phenomenon has not yet been reported for this piping setup. The aim of this paper is to investigate the steam–water CCFL phenomena, pattern, and mechanism of the above-mentioned pressurizer liquid level measurement piping system.

2. Experimental Setup and Procedure

The experimental system consists of an oil heating system, a pressurizer, a standard pipeline, a test pipeline, pressure difference transducers, and a condensate measuring cylinder (Figure 3). The inner diameter of the stainless steel pressurizer is 600 mm, and the height is 2400 mm, with a total volume of 0.68 m3. The height of the pressure tapping point T-A is 1050 mm from the bottom of the pressurizer. The fluid in the pressurizer was kept in a stable two-phase state using the oil heating system. The diameter of the horizontal standard (S) pipeline is 20 mm. The geometry of the test pipeline is the same as the prototype of the pressurizer liquid level measurement system shown in Figure 1. The inner diameter of the pipe between the pressurizer and the orifice is 18.88 mm, and the inner diameter between the orifice and the condenser is 23.9 mm. The orifice’s inner diameter is 9.38 mm. The condenser is a tube, with one end connected to the test pipe, and the other closed. The inner diameter of the condenser tube is 66.6 mm, and the length is 330 mm. The condenser was cooled by a fan on the outer surface. The experiment begins when the water level in the pressurizer drops down in this location. At the beginning of the experiment, the water volume in the pressurizer is about 0.3 m3, or 300 kg. Thus, even though the condensate will drain out of the pressurizer with a flow rate of about 0.54 kg/h, this flow rate is still lower compared to that of the water in the pressurizer. The water level will drop very slowly, and the vapor generated in the pressurizer will continuously flow to the condenser. The pressure in the pressurizer was measured by a Rosemount type 3051CD class 0.1 pressure transducer with a range from 0 to 5 bar.
Before each experimental case, the whole system, including the pressurizer, the condenser, the pipeline, and the transducers, was filled with water until all the vent valves overflowed in order to remove the air. Then, all the air vent valves were closed, except for the one on the top of the pressurizer, and the oil heating system was switched on to increase the temperature of the water in the pressurizer. The valve on top of the pressurizer was opened to continuously vent the non-condensable air until the pressure in the pressurizer was a little higher than the atmospheric pressure. The water level of the pressurizer was then gradually decreased using a drainage valve. The temperatures of the vapor and the water in the pressurizer were measured with T-type thermocouples with an accuracy of ±0.5 K. When the measured temperature is equal to the corresponding saturated temperature of the pressure in the pressurizer, it means that the air has been entirely vented; the valve was then closed. Steam and water occupied the upper and the bottom regimes of the pressurizer, respectively. The pressure of the whole system was kept higher than the atmospheric pressure to avoid air leakage. There was also a vent valve on the highest point of the condenser to exhaust the non-condensable gas, if necessary.
The schematic to identify any water accumulation in the test pipe and to determine whether CCFL occurs is shown in Figure 4. The elevation of the condenser (T-C) is 96 mm higher than the orifice (T-A). DPS indicates the pressure difference between the standard pipeline (S) and the common pressure pipe, DPT indicates the pressure difference between the test pipeline (T) and the common pressure pipe, and DPST indicates the pressure difference between the standard pipeline and the test pipeline. The pressure difference of DPT, DPS and DPST are evaluated using a Rosemount type 3051CD class 0.1 transducer. Their measurement ranges are 0~20 kPa, 0~20 kPa, and 0~2 kPa, respectively.
During the experiment, the condenser was cooled with a rotational speed-adjustable fan. The air velocity outlet of the fan was measured with an anemoscope. The pressure in the condenser decreased due to steam condensation. Steam flowed from the pressurizer to the condenser under the pressure difference. In contrast, the condensate flowed countercurrently to the steam.
First, an orifice made of silica glass was applied to observe the countercurrent flow pattern in the orifice and to investigate the mechanism of CCFL occurrence using a Phantom V411 high-speed camera. At this period, the pressure in the pressurizer was 1.1 bar (a). As shown in Figure 4, the standard pressure tapping tube S is a horizontal pipe with an inner diameter of 16 mm. The height between the pressurizer level and the pressure difference transducers is H w , the height between the standard pressure tapping tube S is H S , and the height between the condenser and the pressure difference transducers is H T , which is equal to H S . The pressure difference of DPS can then be indicated as
Δ P S = ρ W , S g H S ρ W , C g H w
where ρ W , S and ρ W , C are the water density in the standard pipeline and the common pressure pipe, respectively. The pressure difference of DPT can be indicated as
Δ P T = ρ W , T g H T ρ W , C g H w ρ W , T A B g H T A B
where ρ W , T is the water density in the test pipe, and ρ W , T A B and H T A B are the water density and the liquid column accumulated in the test pipe between points T-A and T-B. The tube between the condenser and the pressure difference transducer DPT, and the tube between S-B and DPS are close and are insulated together; as a result, ρ W , S = ρ W , T . Considering H T = H S , The pressure difference DPST can be obtained from Equations (4) and (5)
Δ P S T = ρ W , T A B g H T A B
From Equation (6), we find that if no CCFL occurs in the test pipe, H T A B = 0 , Δ P S T = 0 , and Δ P T = Δ P S . Whereas, if CCFL occurs in the test pipe, the condensate will accumulate in the test pipe between point T-A and T-B, H T A B > 0 , Δ P S T > 0 , and Δ P T > Δ P S . Thus, whether or not CCFL occurs can be identified with the pressure differences.
Second, an orifice made of stainless steel was applied to quantitatively determine the CCFL of the test pipeline in different operating conditions, i.e., the pressures in the pressurizer were 1.1, 1.5, 2.0, 2.5, and 3.0 bar. The condensate drained from the test pipeline was measured with a specially designed measuring cylinder, shown in Figure 5. The condensate from the condenser was drained to the receiver inside the pressurizer and then to the measurement cylinder through the connection tube. Therefore, the condensate drainage flow rate could be measured through the scale on the cylinder and/or a pressure difference transducer attached to the cylinder. When the system was stable, the steam and the condensate mass flows were identical.
The instruments employed in this experiment are shown in Table 1. The types and specifications of these instruments are also listed. In this experiment, the uncertainty of the drainage mass flow rate mainly depends on the accuracy of the diameter of the measurement cylinder, the saturated temperature, the water level difference in the measurement cylinder, and the duration of the experiment. The maximum uncertainty of the drainage mass flow rate in the experiments is 1.64%.

3. Results and Discussion
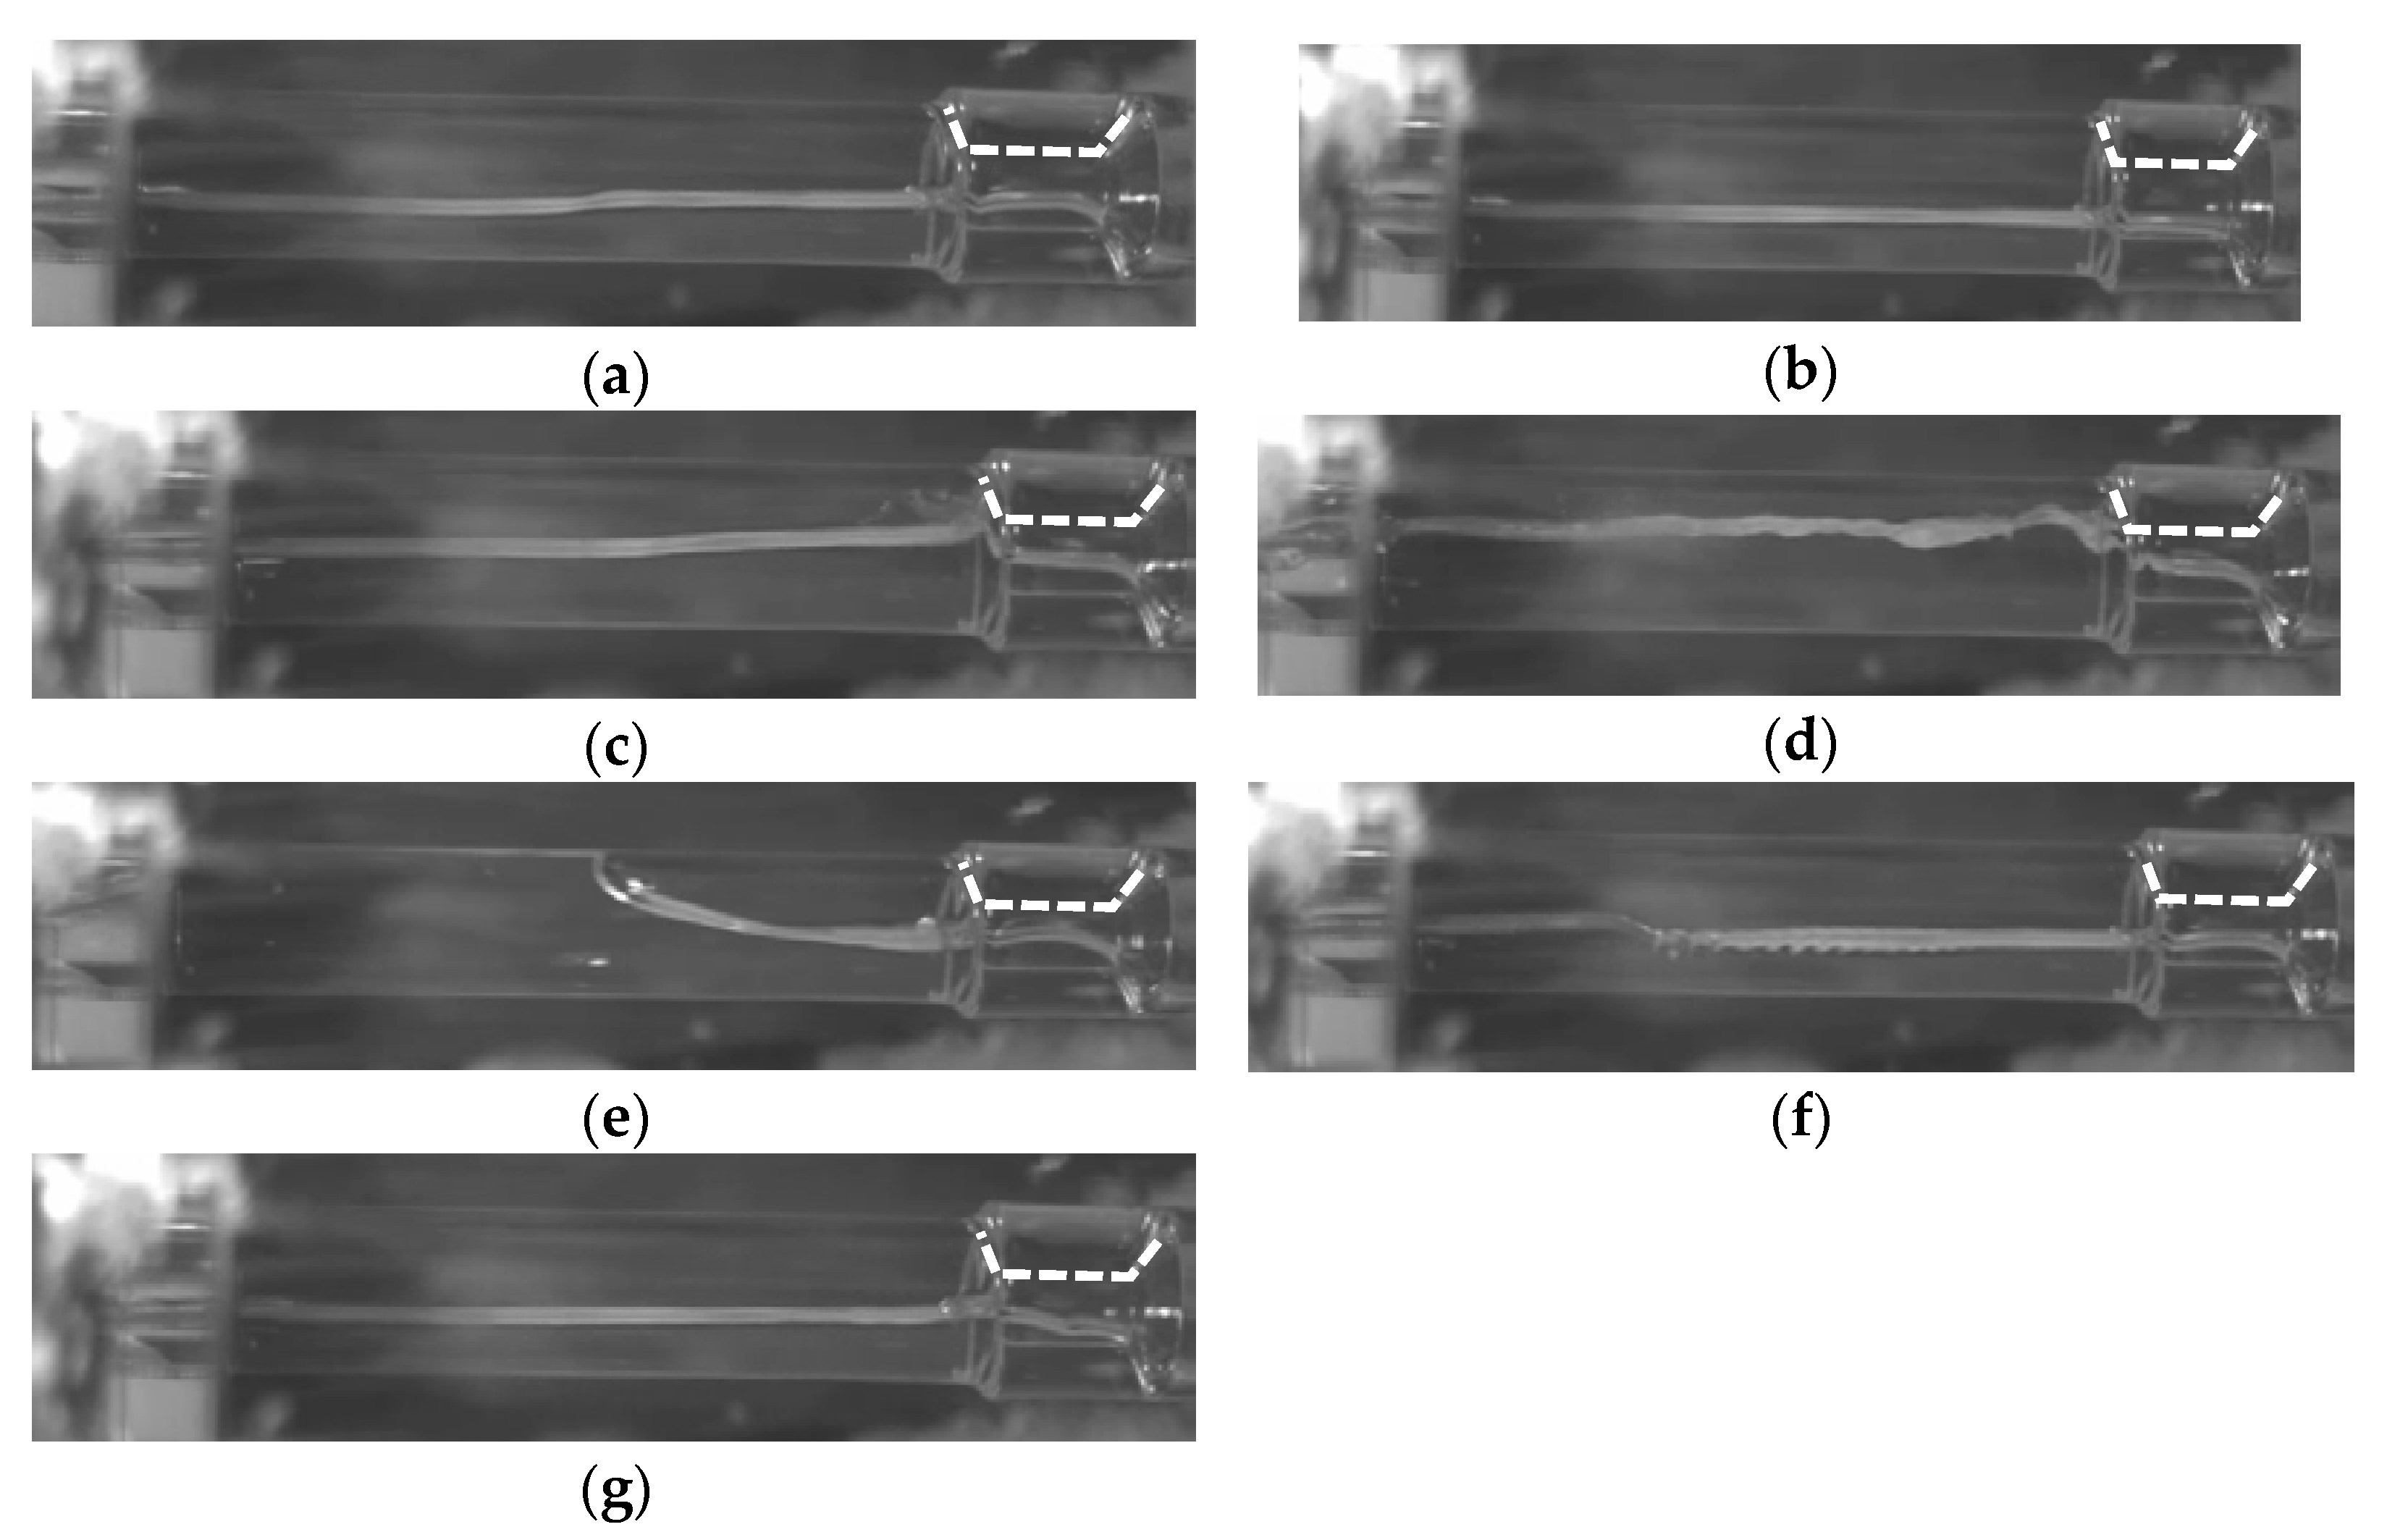
3.1. Visualizations

During the visualization tests, vapor and condensate flowed countercurrently. The flow rates of the liquid phase and the vapor phase were identical. The condensate drainage increases as the fan air velocity increases up to about 1.8 m/s. The pressure difference DPST showed no oscillation when the fan cooling air velocity was less than 1.8 m/s. The cases recorded are listed in Table 2. For case 2 and 3, when the air velocities were 1.8 m/s, the pressure difference DPST did not show any oscillation. However, for case 4, when the air velocity was the same, the system experienced a transition process from stable to oscillation. This means the condition of the system reaches a critical point when the air velocity is 1.8 m/s. Under this condition, even an unperceivable disturbance of air velocity or ambient temperature would cause the system to lose stability. When the air velocity was higher than 1.8 m/s, oscillation always occurred quickly. The condensate drainage was almost constant, even at a higher air velocity, once oscillation occurred.

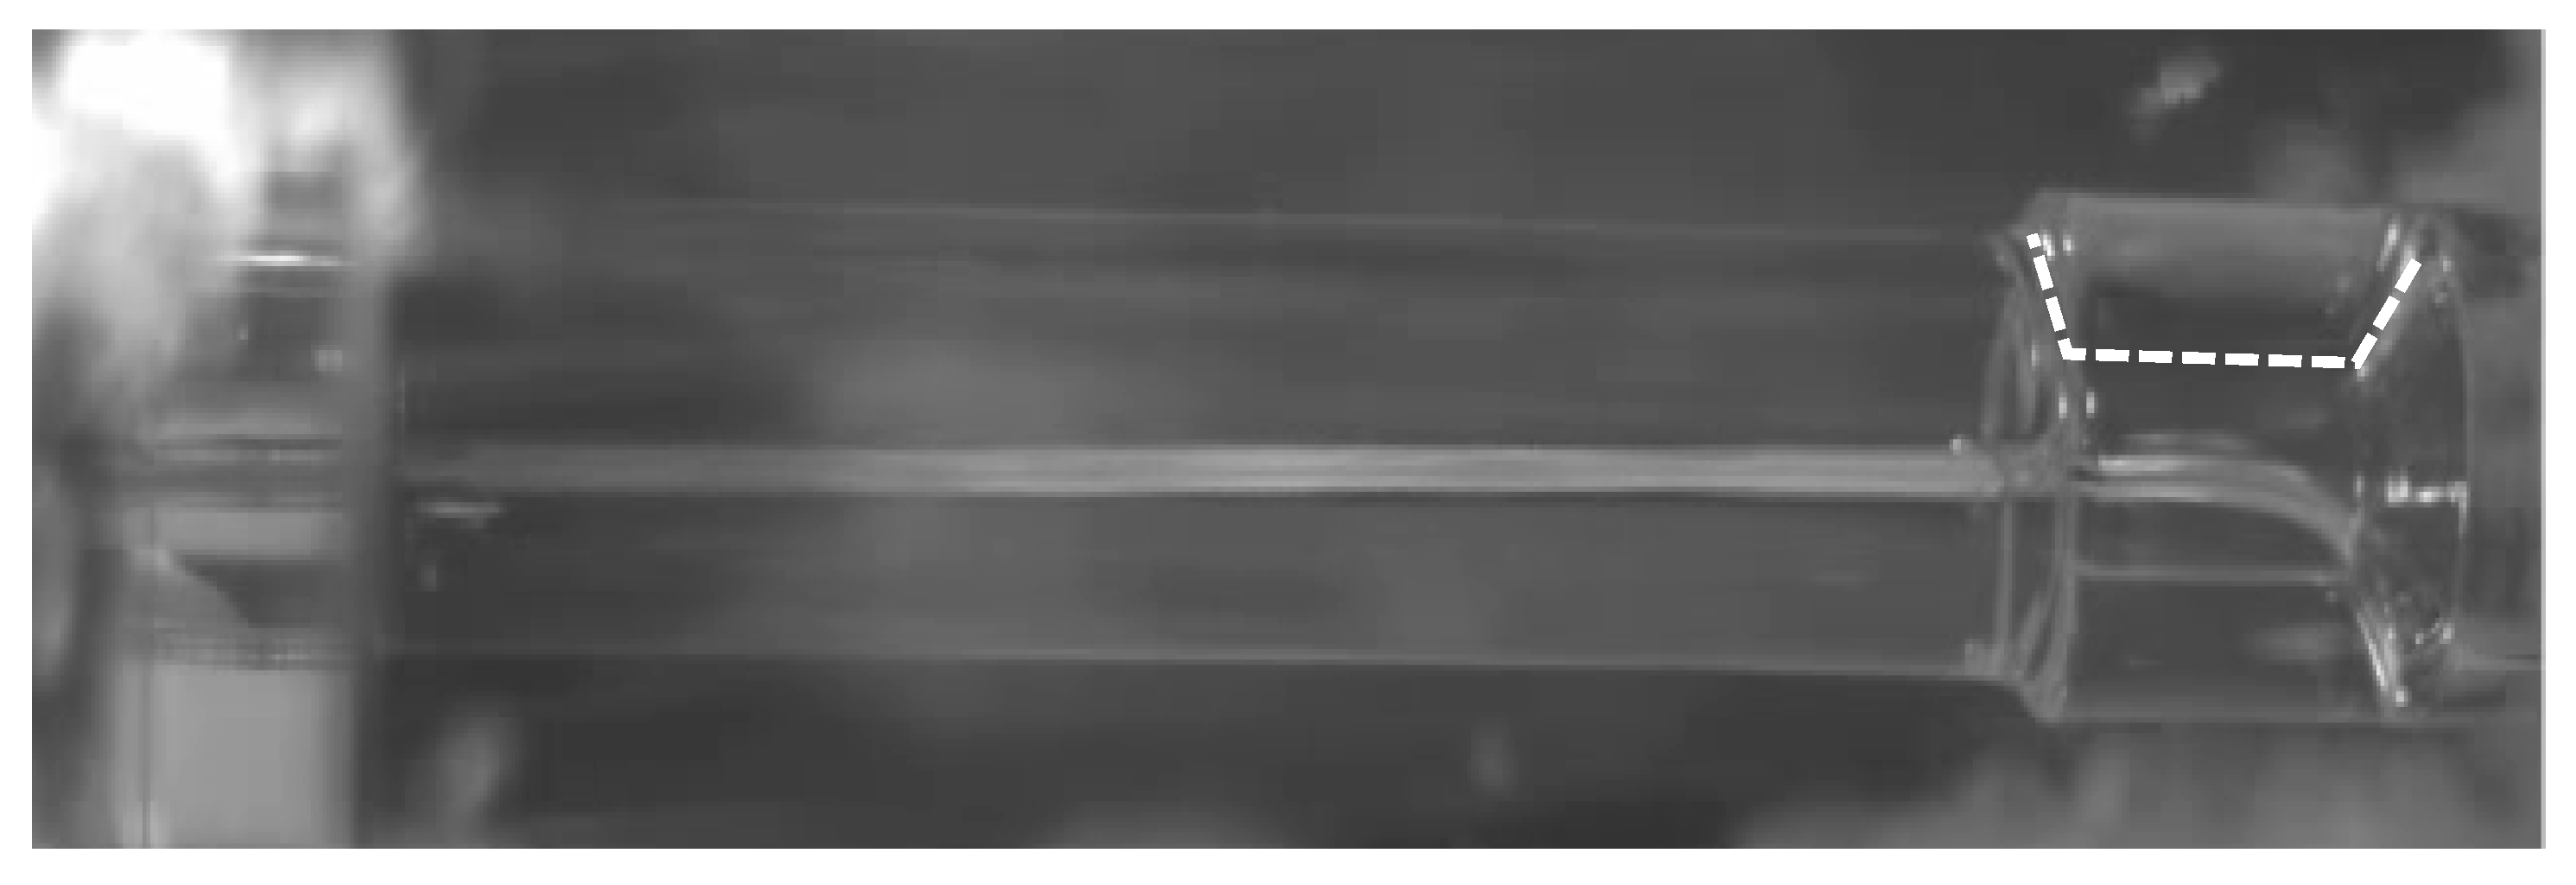
3.1.1. Stable Conditions

Taking case 1 as an example, during the experiment, the fan was switched on at 04:24:00, with an air velocity of 1.7 m/s. The ambient temperature was 297.95 K, and the pressurizer pressure was 0.1 bar (g), whose corresponding saturated temperature was 376.35 K. The evolution of the differential pressure of DPST, DPS, and DPT is shown in Figure 6 and Figure 7. The condensate flow rate was measured by the volumetric cylinder at an interval of 2 min. The liquid in the cylinder must be discharged after the cylinder is full, and the average flow rate for each cylinder is then calculated. The liquid level in the pressurizer gradually decreases, and the DPS and DPT continue to rise. The differential pressure DPST is small, about 5 mm in the water column. There was no significant oscillation throughout the experimental process, but the differential pressure decreased slightly and then increased rapidly every 15 min or so.
The above-mentioned phenomena can be interpreted as follows. The condensate generated in the condenser is quite small. Under the action of surface tension, a meniscus surface may occur at the location T-B, where the horizontal pipeline changes to an inclined position. Therefore, the liquid levels in the condenser and the horizontal pipeline will gradually rise, and until gravity can overcome the capillary force, the condensate will flow downward. Then, the condensate will gradually accumulate in the horizontal pipeline again, repeating the next cycle. As a result, differential pressure DPT and DPST vary periodically. Due to low condensate flow and the long pipeline, drainage of the pipeline is not intermittent, but continuous, although the condensate flow from the condenser is intermittent. It exhibits a stable stratified flow throughout the pipeline, including the orifice (Figure 8). A total of 7 cylinders were measured in this case, and the average drainage capacity was 0.537 kg/h.

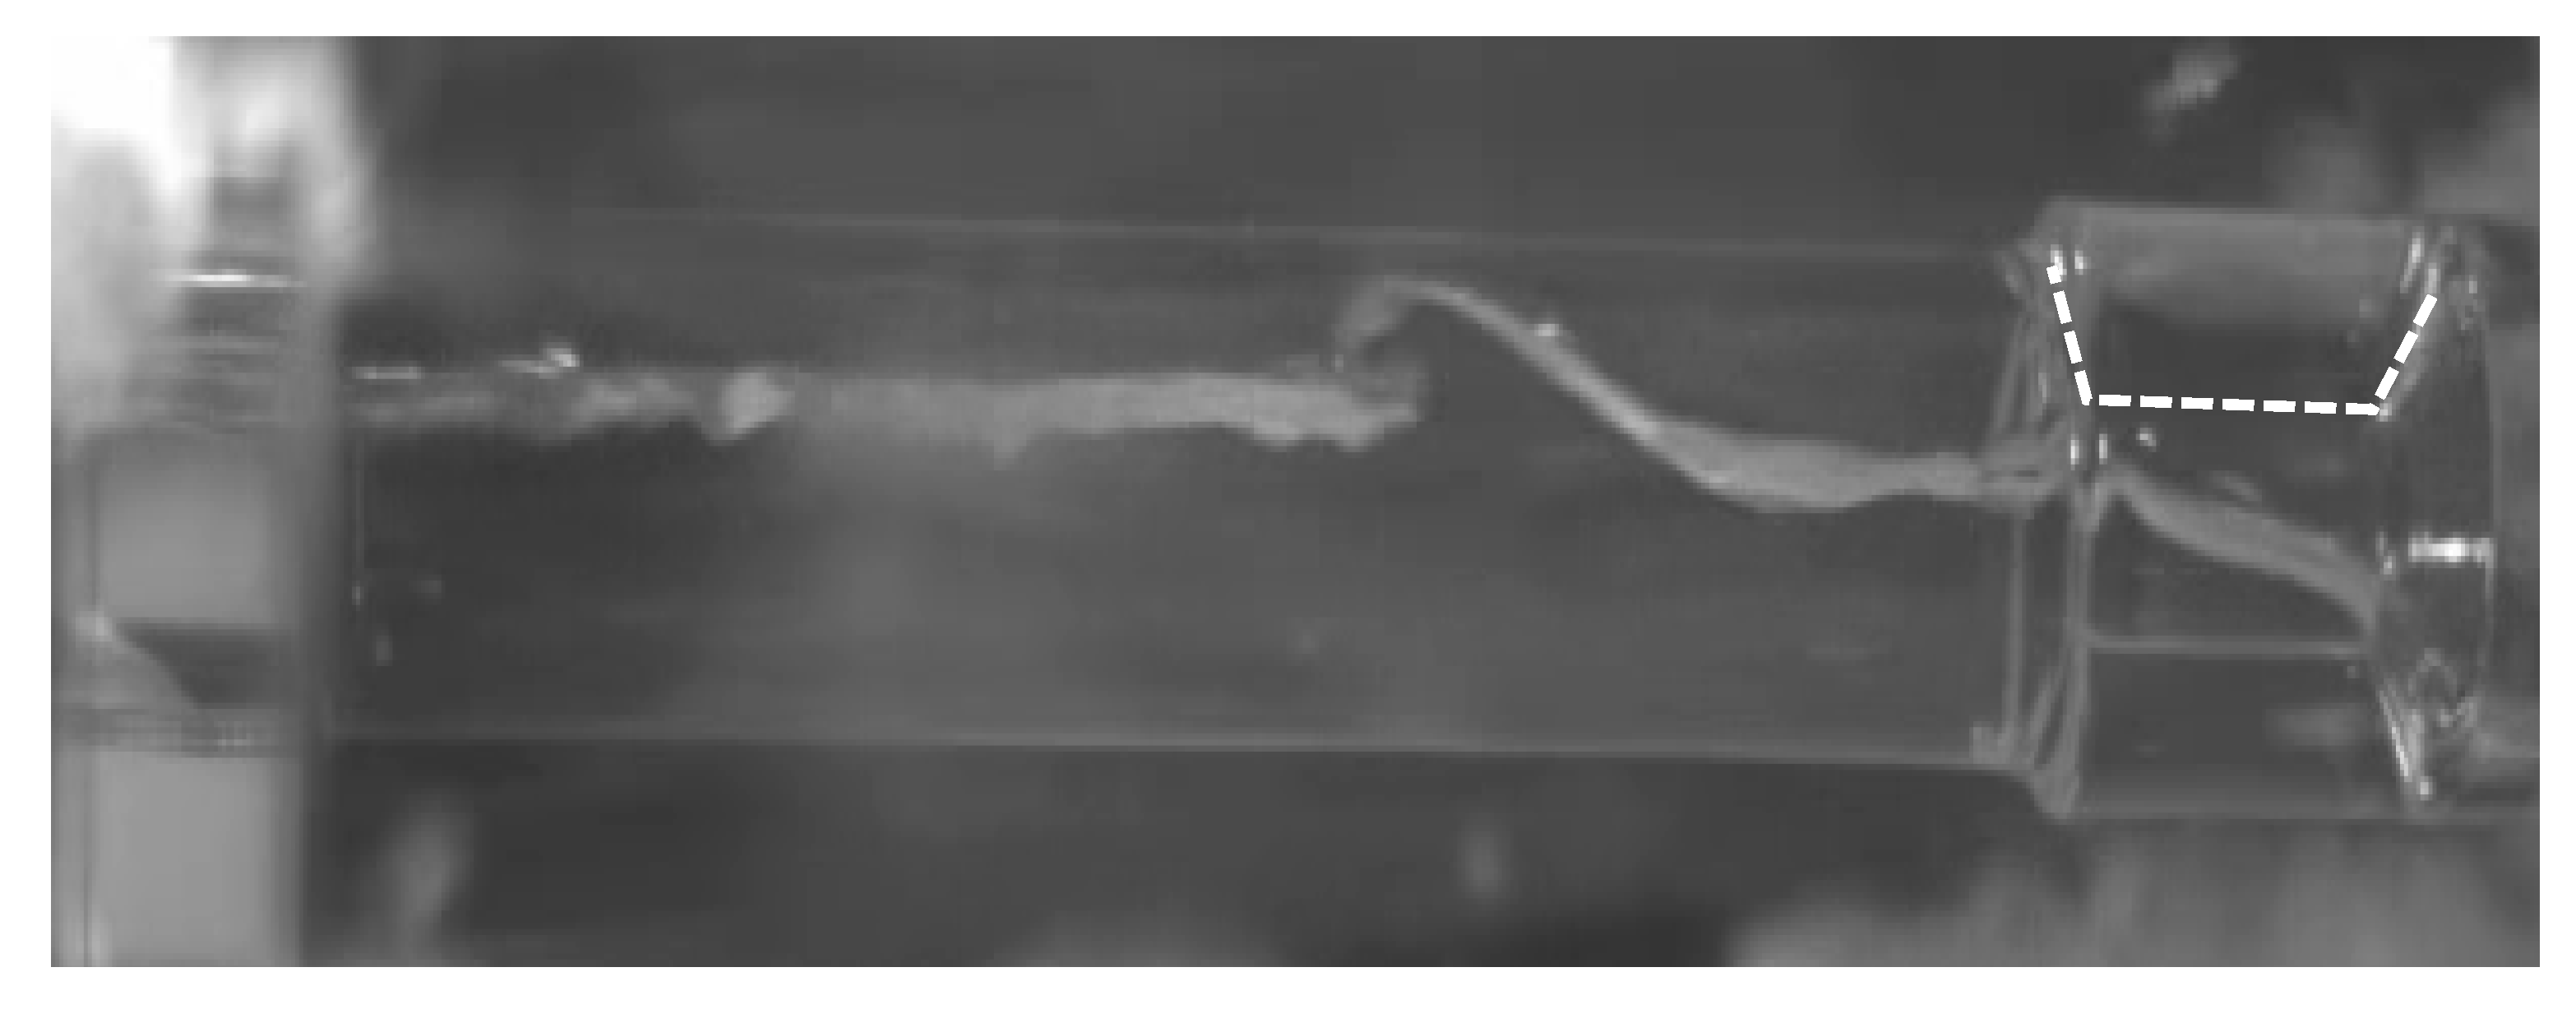
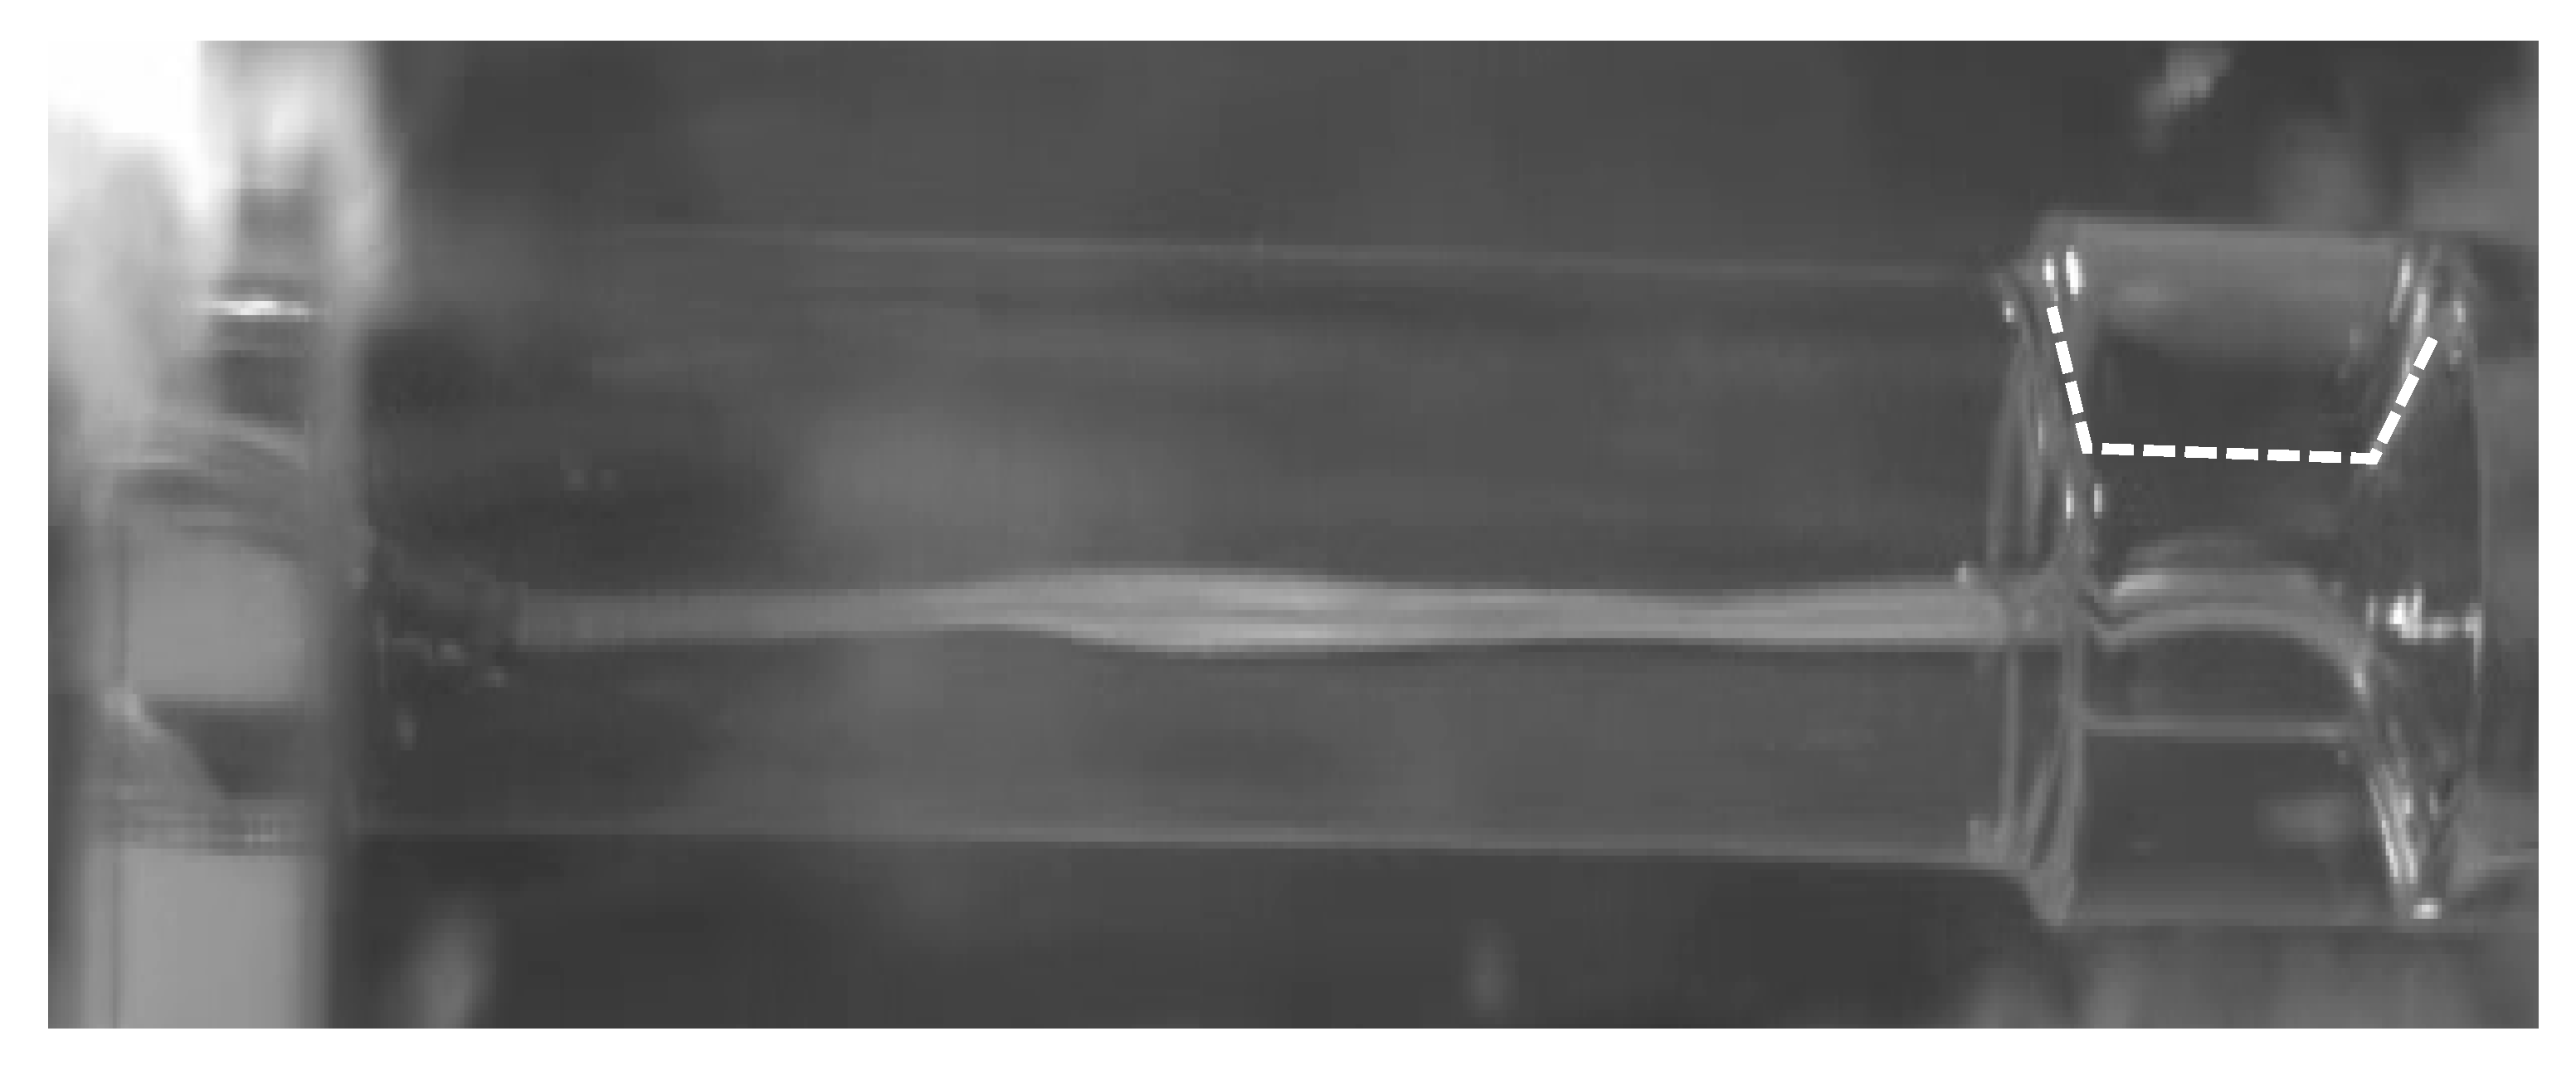
3.1.2. Unstable Conditions
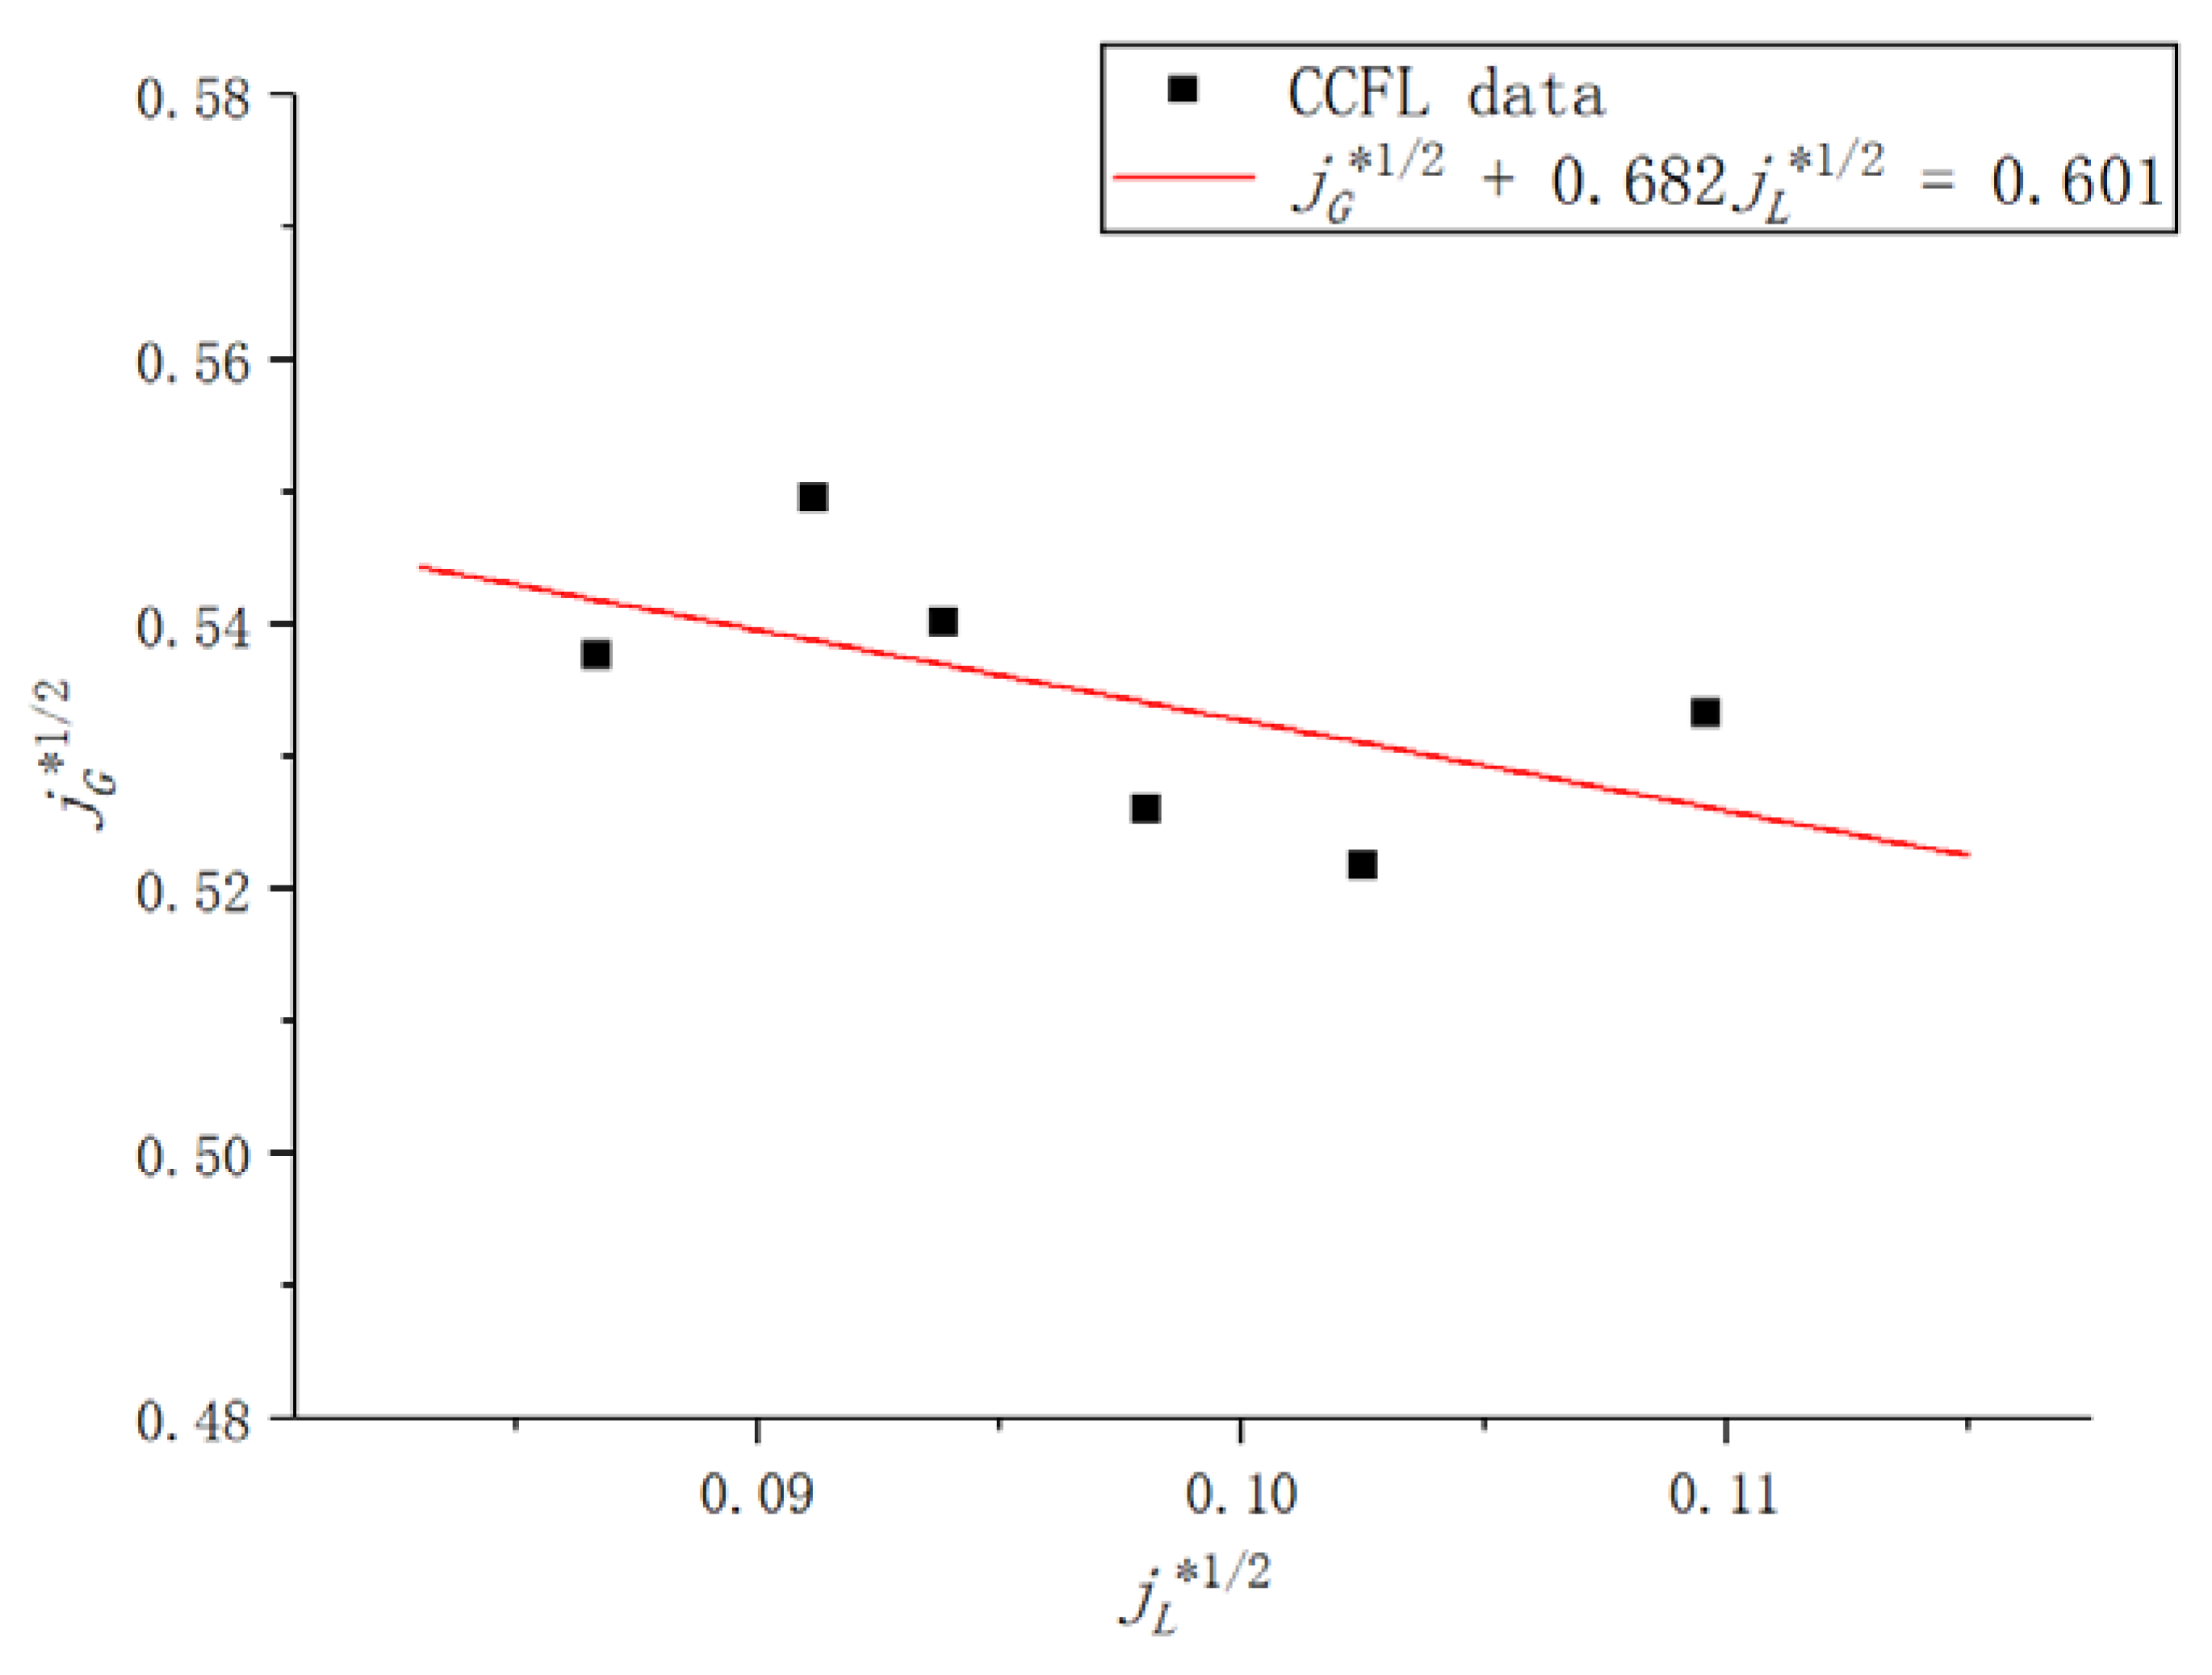
Taking case 6 as an example, during the experiment, the fan was switched on at 15:31:00, with the air velocity of 2.2 m/s. The ambient temperature was 298.35 K, and the pressurizer pressure was 0.1 bar (g), whose corresponding saturated temperature was 376.35 K. The evolution of the differential pressure of DPST, DPS, and DPT is shown in Figure 9 and Figure 10. The pressure difference DPS was stable, while the DPT oscillated with a positive value. This meant that the orifice was blocked with liquid condensate, and flooding occurred.
The differential pressure DPST, DPS, and DPT are stable until 15:51:42, and a smooth stratified flow occurs in the vicinity of the orifice (Figure 11). DPT and DPST fluctuated slightly from 15:51:42 until 16:00:07, when stratified wavy flow occurs, and one of these waves can suddenly rise in the horizontal pipe upstream of the orifice (Figure 12) to form a slug (Figure 13 and Figure 14). If a slug forms, there is a sudden increase in pressure and a calming of the liquid interface behind the slug. Liquid in the stratified flow is swept up, and the liquid level in the whole pipeline drops (Figure 15). When the level builds up, the whole cycle is repeated. The fan was turned off at 23:42:00, and fluctuations disappeared around 1:02:00.
The mechanism can be explained by comparing the detailed flow pattern with the corresponding differential pressures. A cycle from 16:10:31 can be taken as an example. It shows that in a stratified flow, the differential pressure DPT is at its minimum, and the DPST is at its maximum, i.e., the pressure difference across the orifice is at its maximum levels (Figure 16 and Figure 17a). The vapor flowrate is higher throughout the orifice, whereas the condensate drainage is lower, leading to an increase in DPT and a decrease in DPST, while DPS remians stable (Figure 16 and Figure 17b). As the pressure difference across the orifice decreases, the steam flowrate decreases, and the condensate drainage increases, which causes choking (Figure 17c) at the inlet of the orifice and subsequent stratified wavy flow (Figure 17d), followed by slug flow (Figure 17e). Meanwhile, the differential pressure DPT begins to decrease (Figure 16 and Figure 17f) until it reaches its minimum levels, at which time, the stratified flow occurs (Figure 17g). The whole cycle is then repeated.
The PSD (power spectral density) of differential pressure DPT fluctuation is shown in Figure 18. The peaks of PSD are observed at frequencies of 0.1148 and 0.1551, meaning that the time period is about 6.4~8.7 s. A total of 14 cylinders were measured in this case, and the average drainage capacity was 0.535 kg/h.

3.2. CCFL

The CCFL in our study is also known as the onset of flooding. In our experiments, CCFL only occurred in the orifice. The occurrence of CCFL can be judged with the pressure differences DPS, DPT, and DPST. If oscillation occur with the pressure differences of DPT and DPST, it means the orifice is periodically blocked by the condensate, and CCFL occurs. In order to determine the CCFL of the piping system, we carried out experiments using a stainless steel orifice under variant pressurizer pressures of 1.1 bar (a), 1.25 bar (a), 1.5 bar (a), 2.0 bar (a), 2.5 bar (a), and 3.0 bar (a), respectively. The results are shown in Table 3.
Linear regression through the measured points was used to calculate the coefficients m and C in the Wallis correlation. The coefficients are 0.682 and 0.601, respectively, for the measured parameter ranges. Therefore, the CCFL correlation is:
j G * 1 / 2 + 0.682 j L * 1 / 2 = 0.601
The comparison of Equation (7) with the CCFL datapoints is shown in Figure 19. According to this correlation, under the operating conditions of the pressurizer at which the pressure is 155 bar (a), the corresponding saturated temperature is 617.95 K, the CCFL velocity of vapor in the orifice is 0.0925 m/s, and the condensate drainage flowrate is 2.95 kg/h. The condensate generation in the condenser and the pipeline should not increase beyond the flowrate. Otherwise, CCFL will occur.

4. Conclusions

An experimental facility was constructed in order to investigate CCFL in a pipeline with an orifice. Both visual and quantified experiments were carried out. The visual experiments were implemented at atmospheric pressure, while the quantified experiments were implemented at higher pressures produced by the pressurizer. The mechanism of CCFL in the pipeline with the orifice was investigated, and the Wallis CCFL correlation was applied by deriving the related coefficients from the present experimental data. As a result, the following conclusions were obtained, based on experimental parameter ranges.
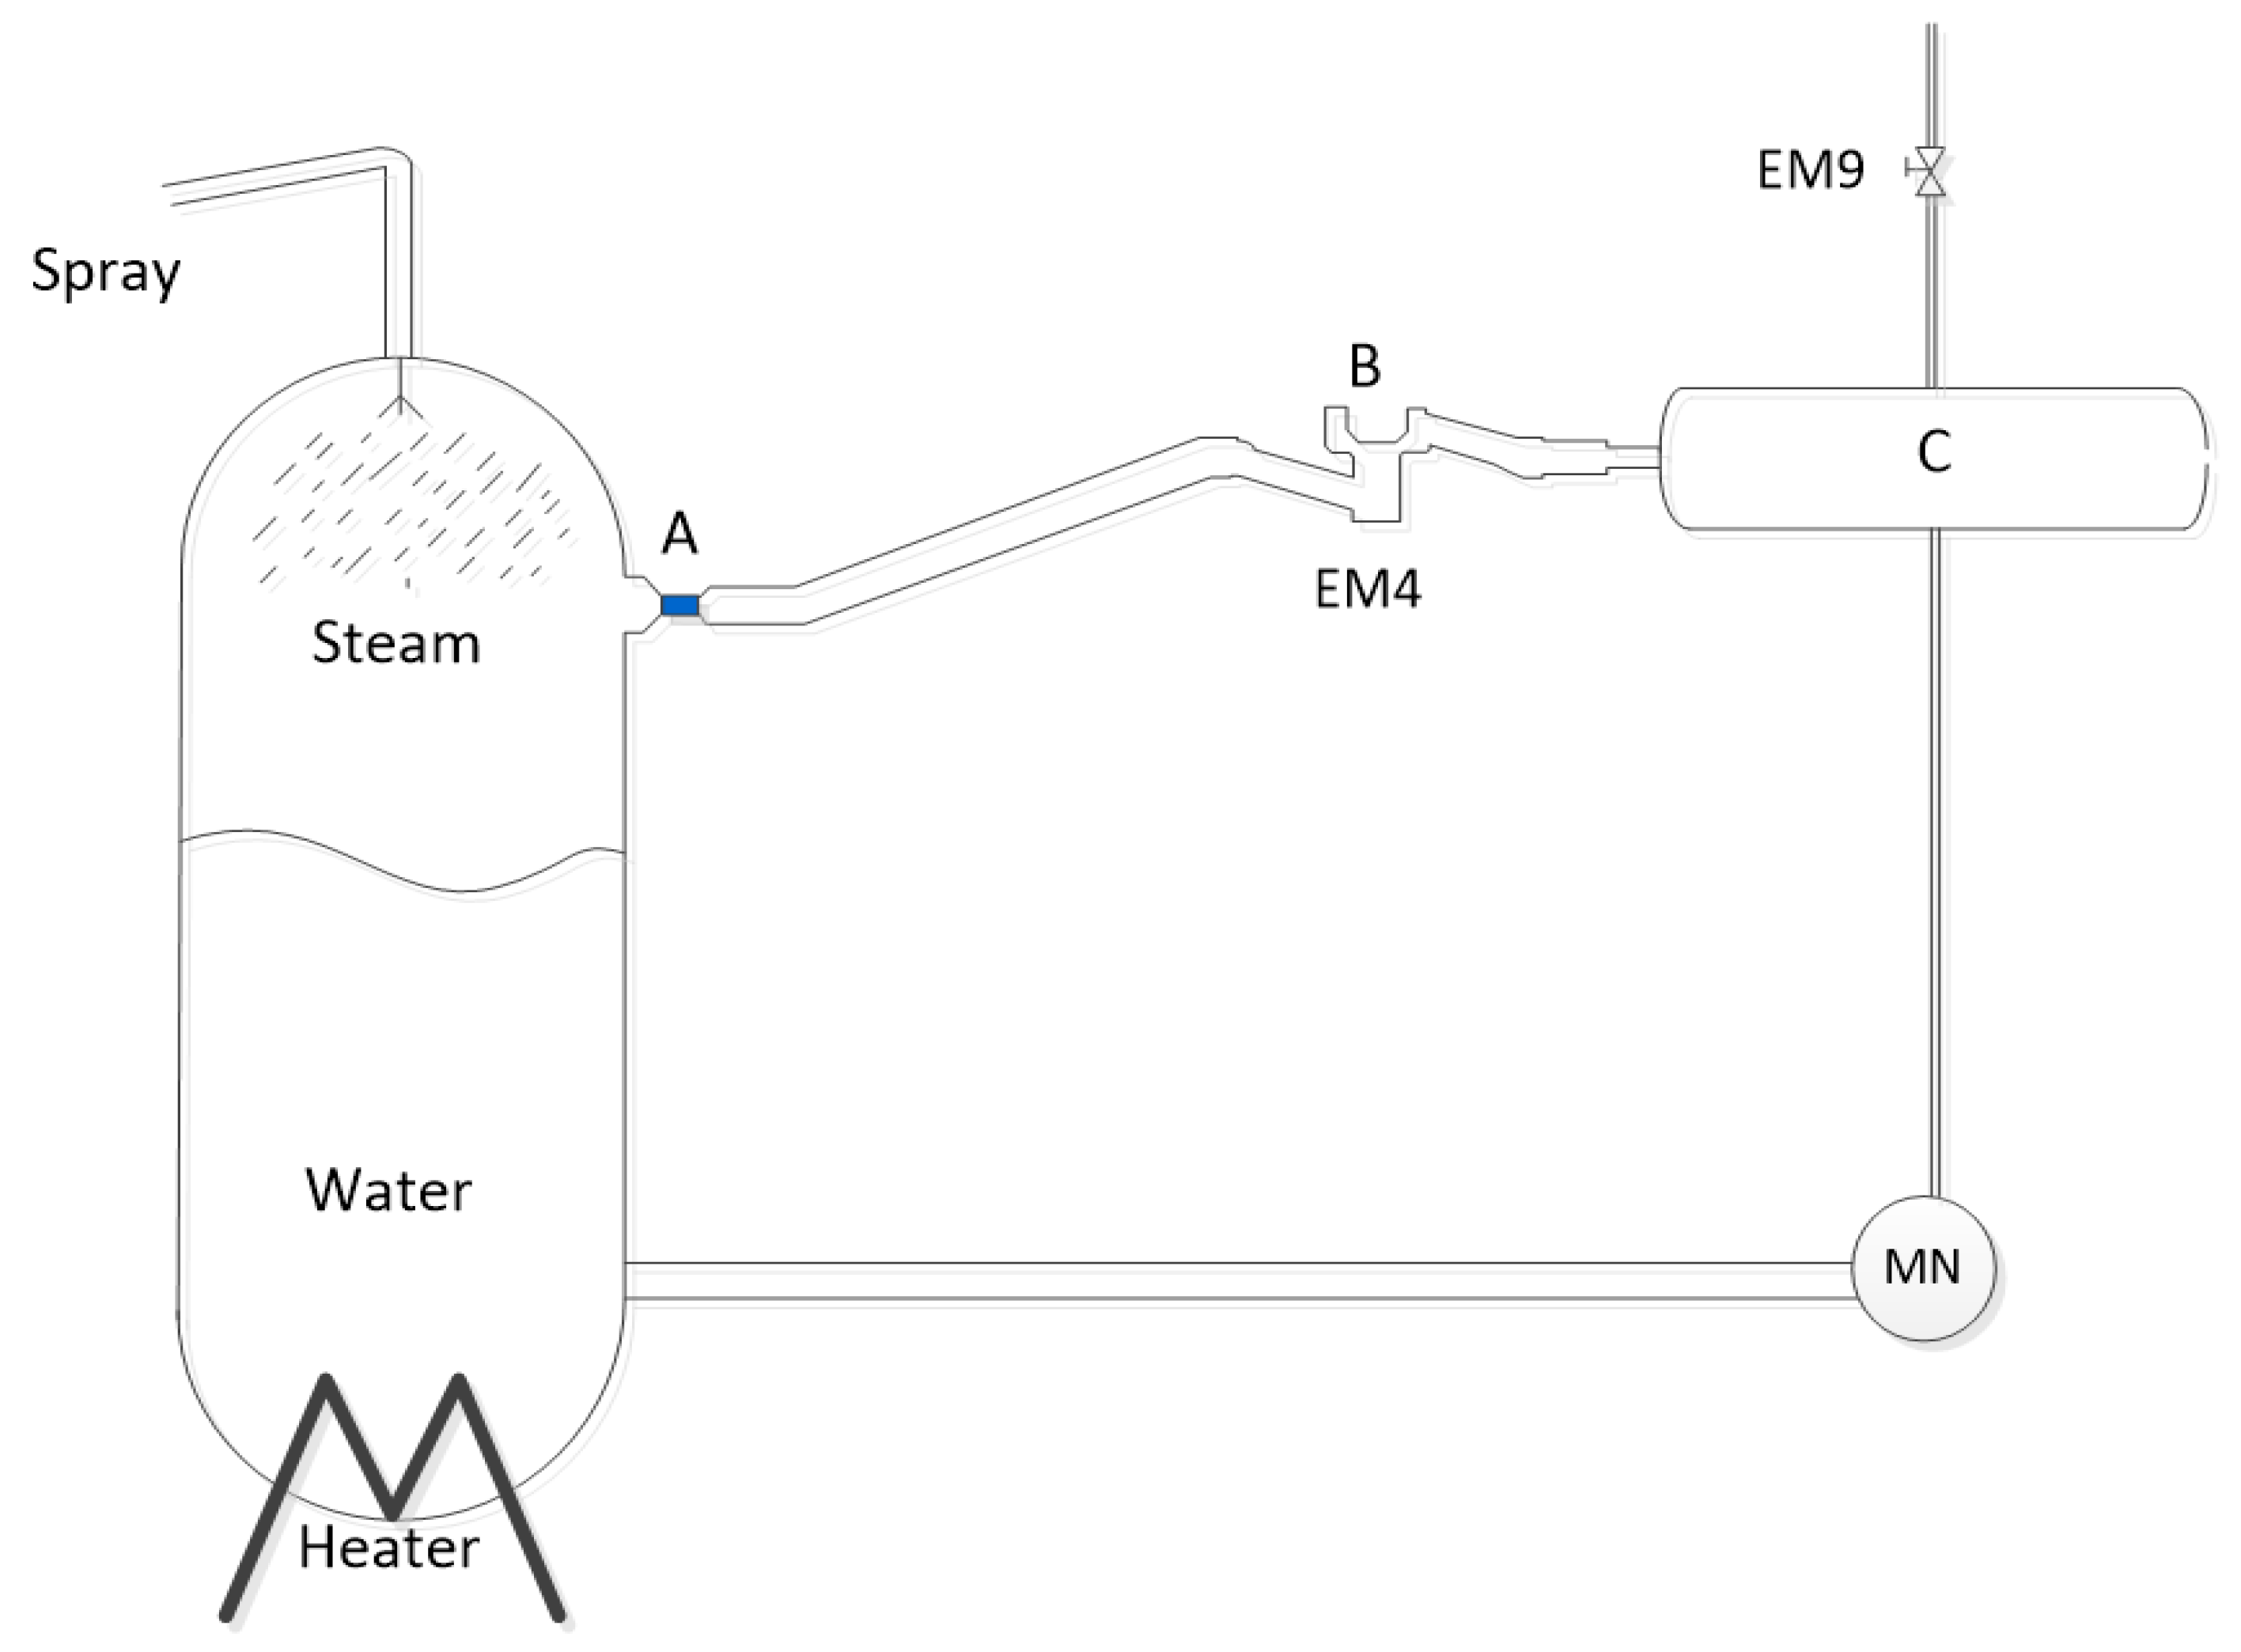
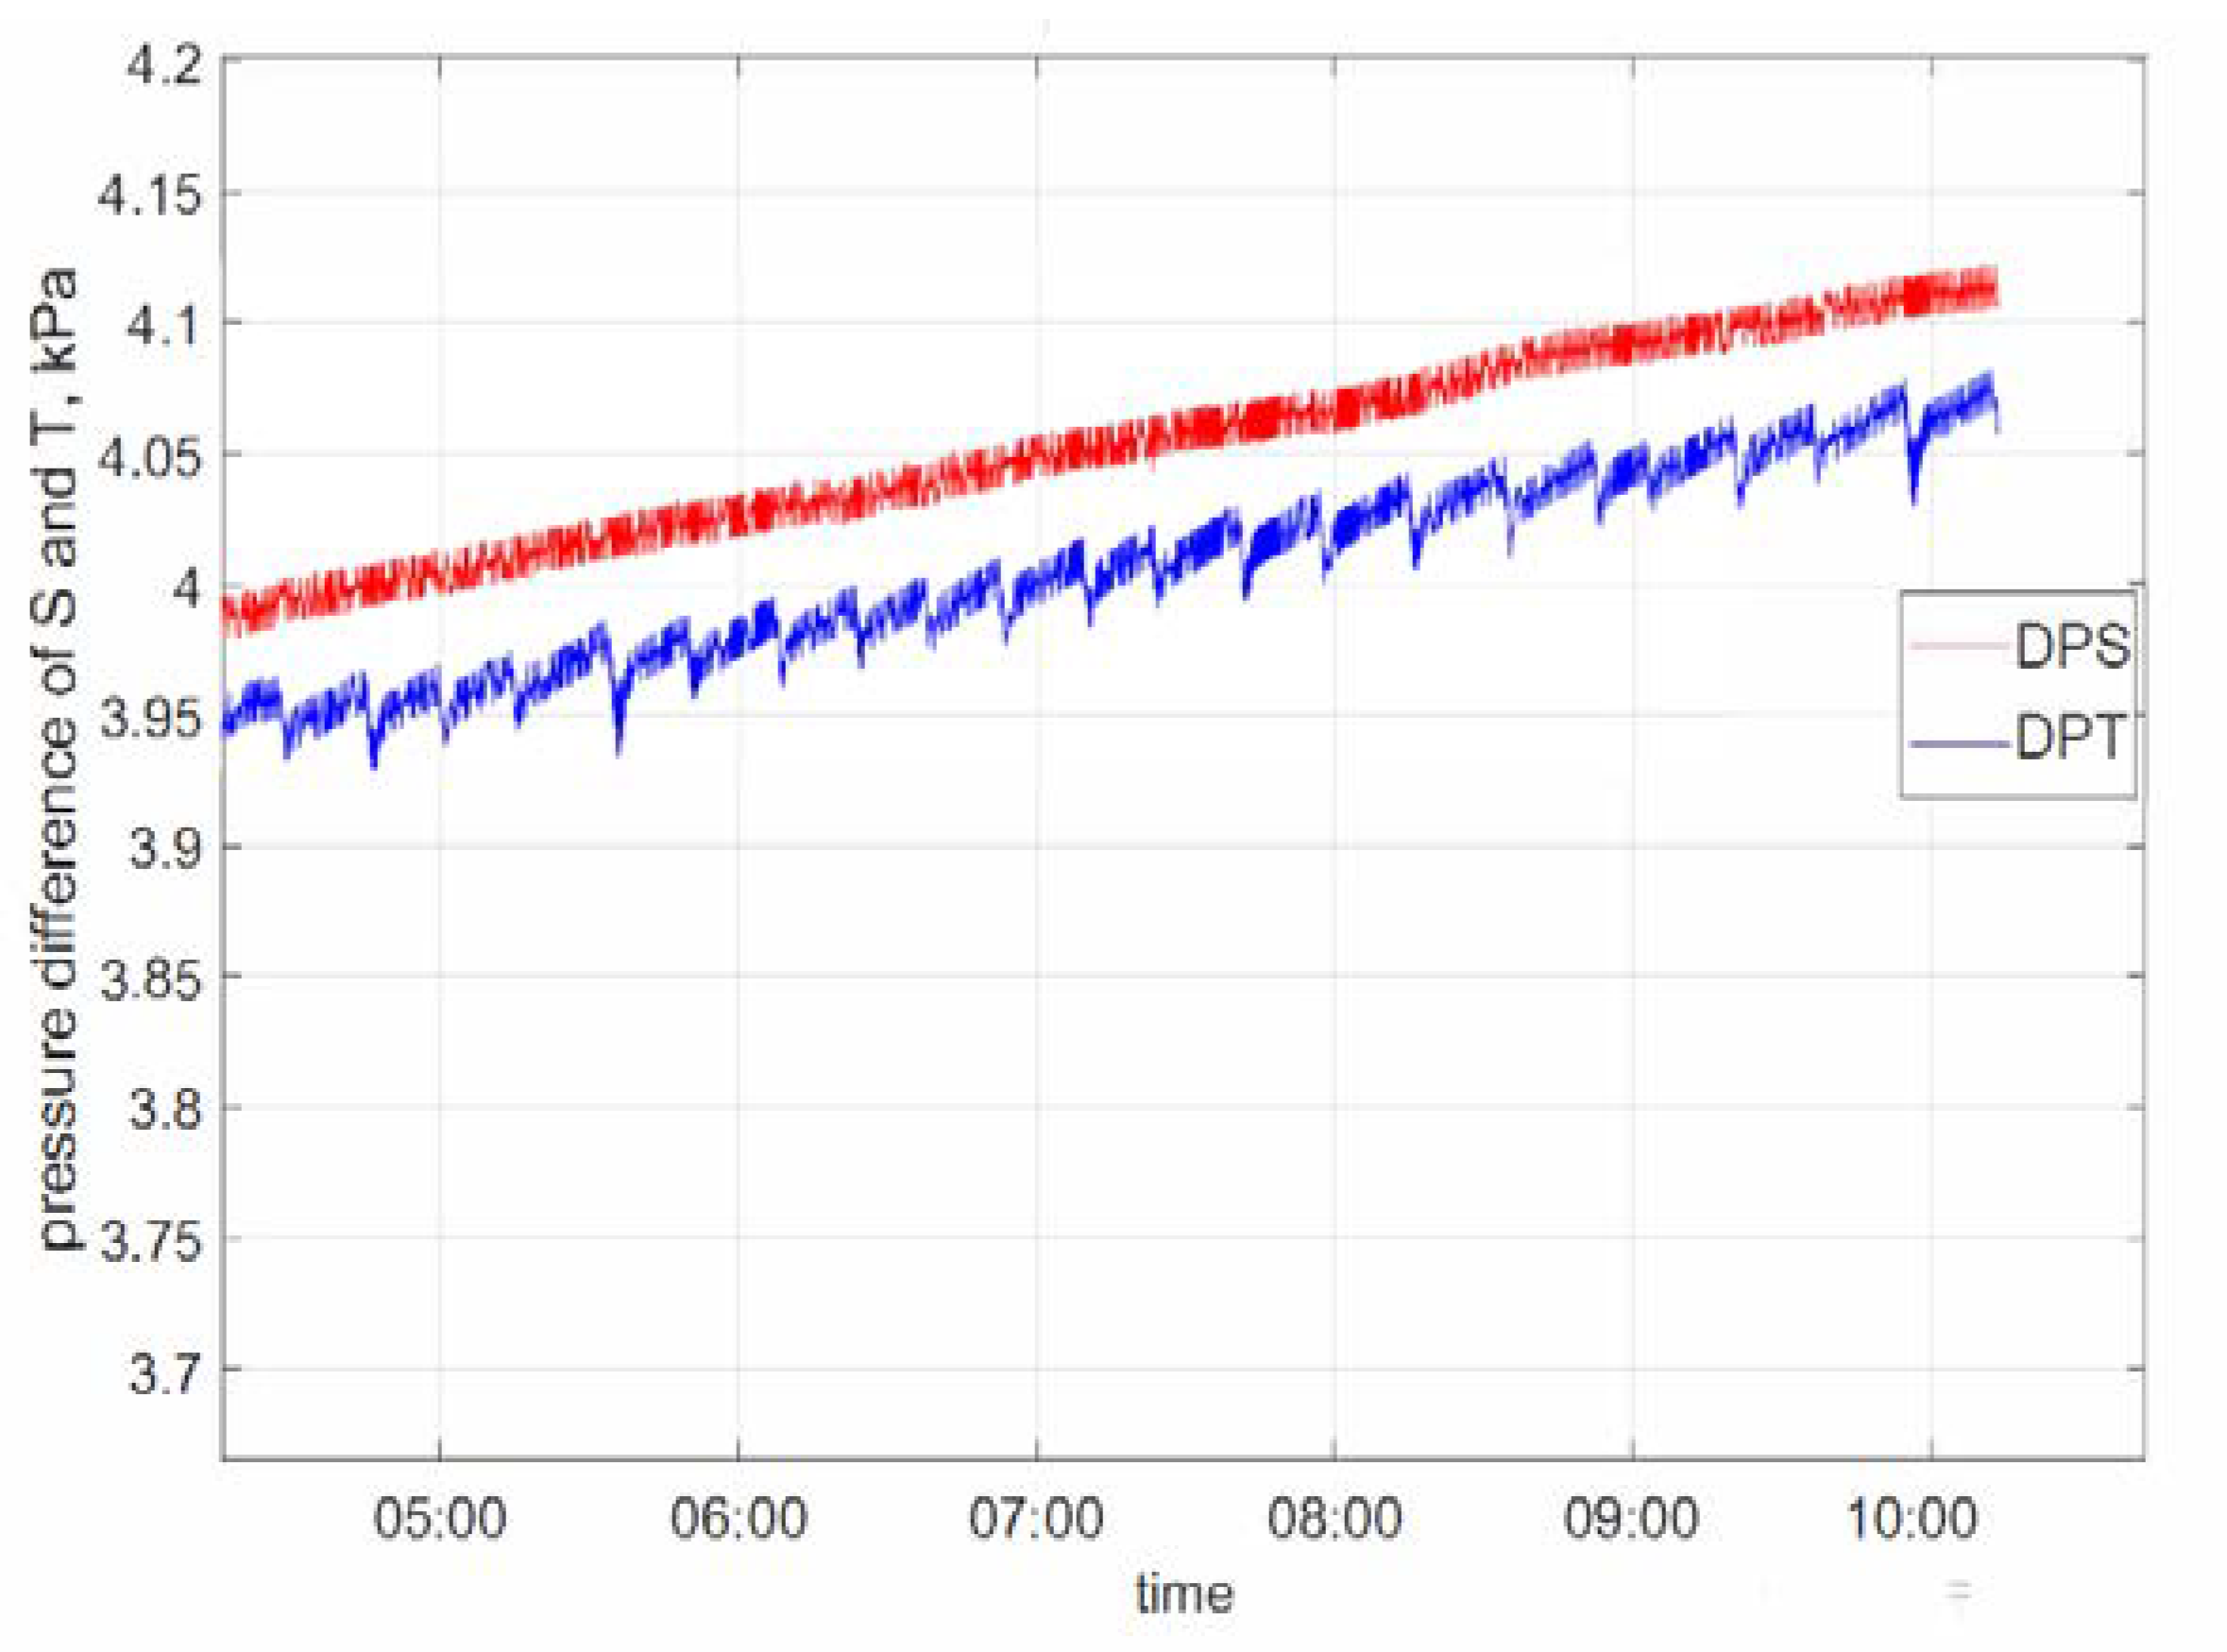
  • If the condensate drainage is low, the liquid level is low, with a stable stratified flow in the orifice, and there is no differential pressure oscillation. However, when a higher condensate is generated in the condenser, the liquid level increases to some extent, and the stratified wavy flow occurs. When the steam flowrate decreases and the condensate drainage increases, the inlet of the orifice is choked by the water flow, which subsequently gives rise to differential pressure across the orifice, with periodic variation. The pattern alternately features stratified flow, stratified wavy flow, and slug flow, which indicates the occurrence of CCFL.
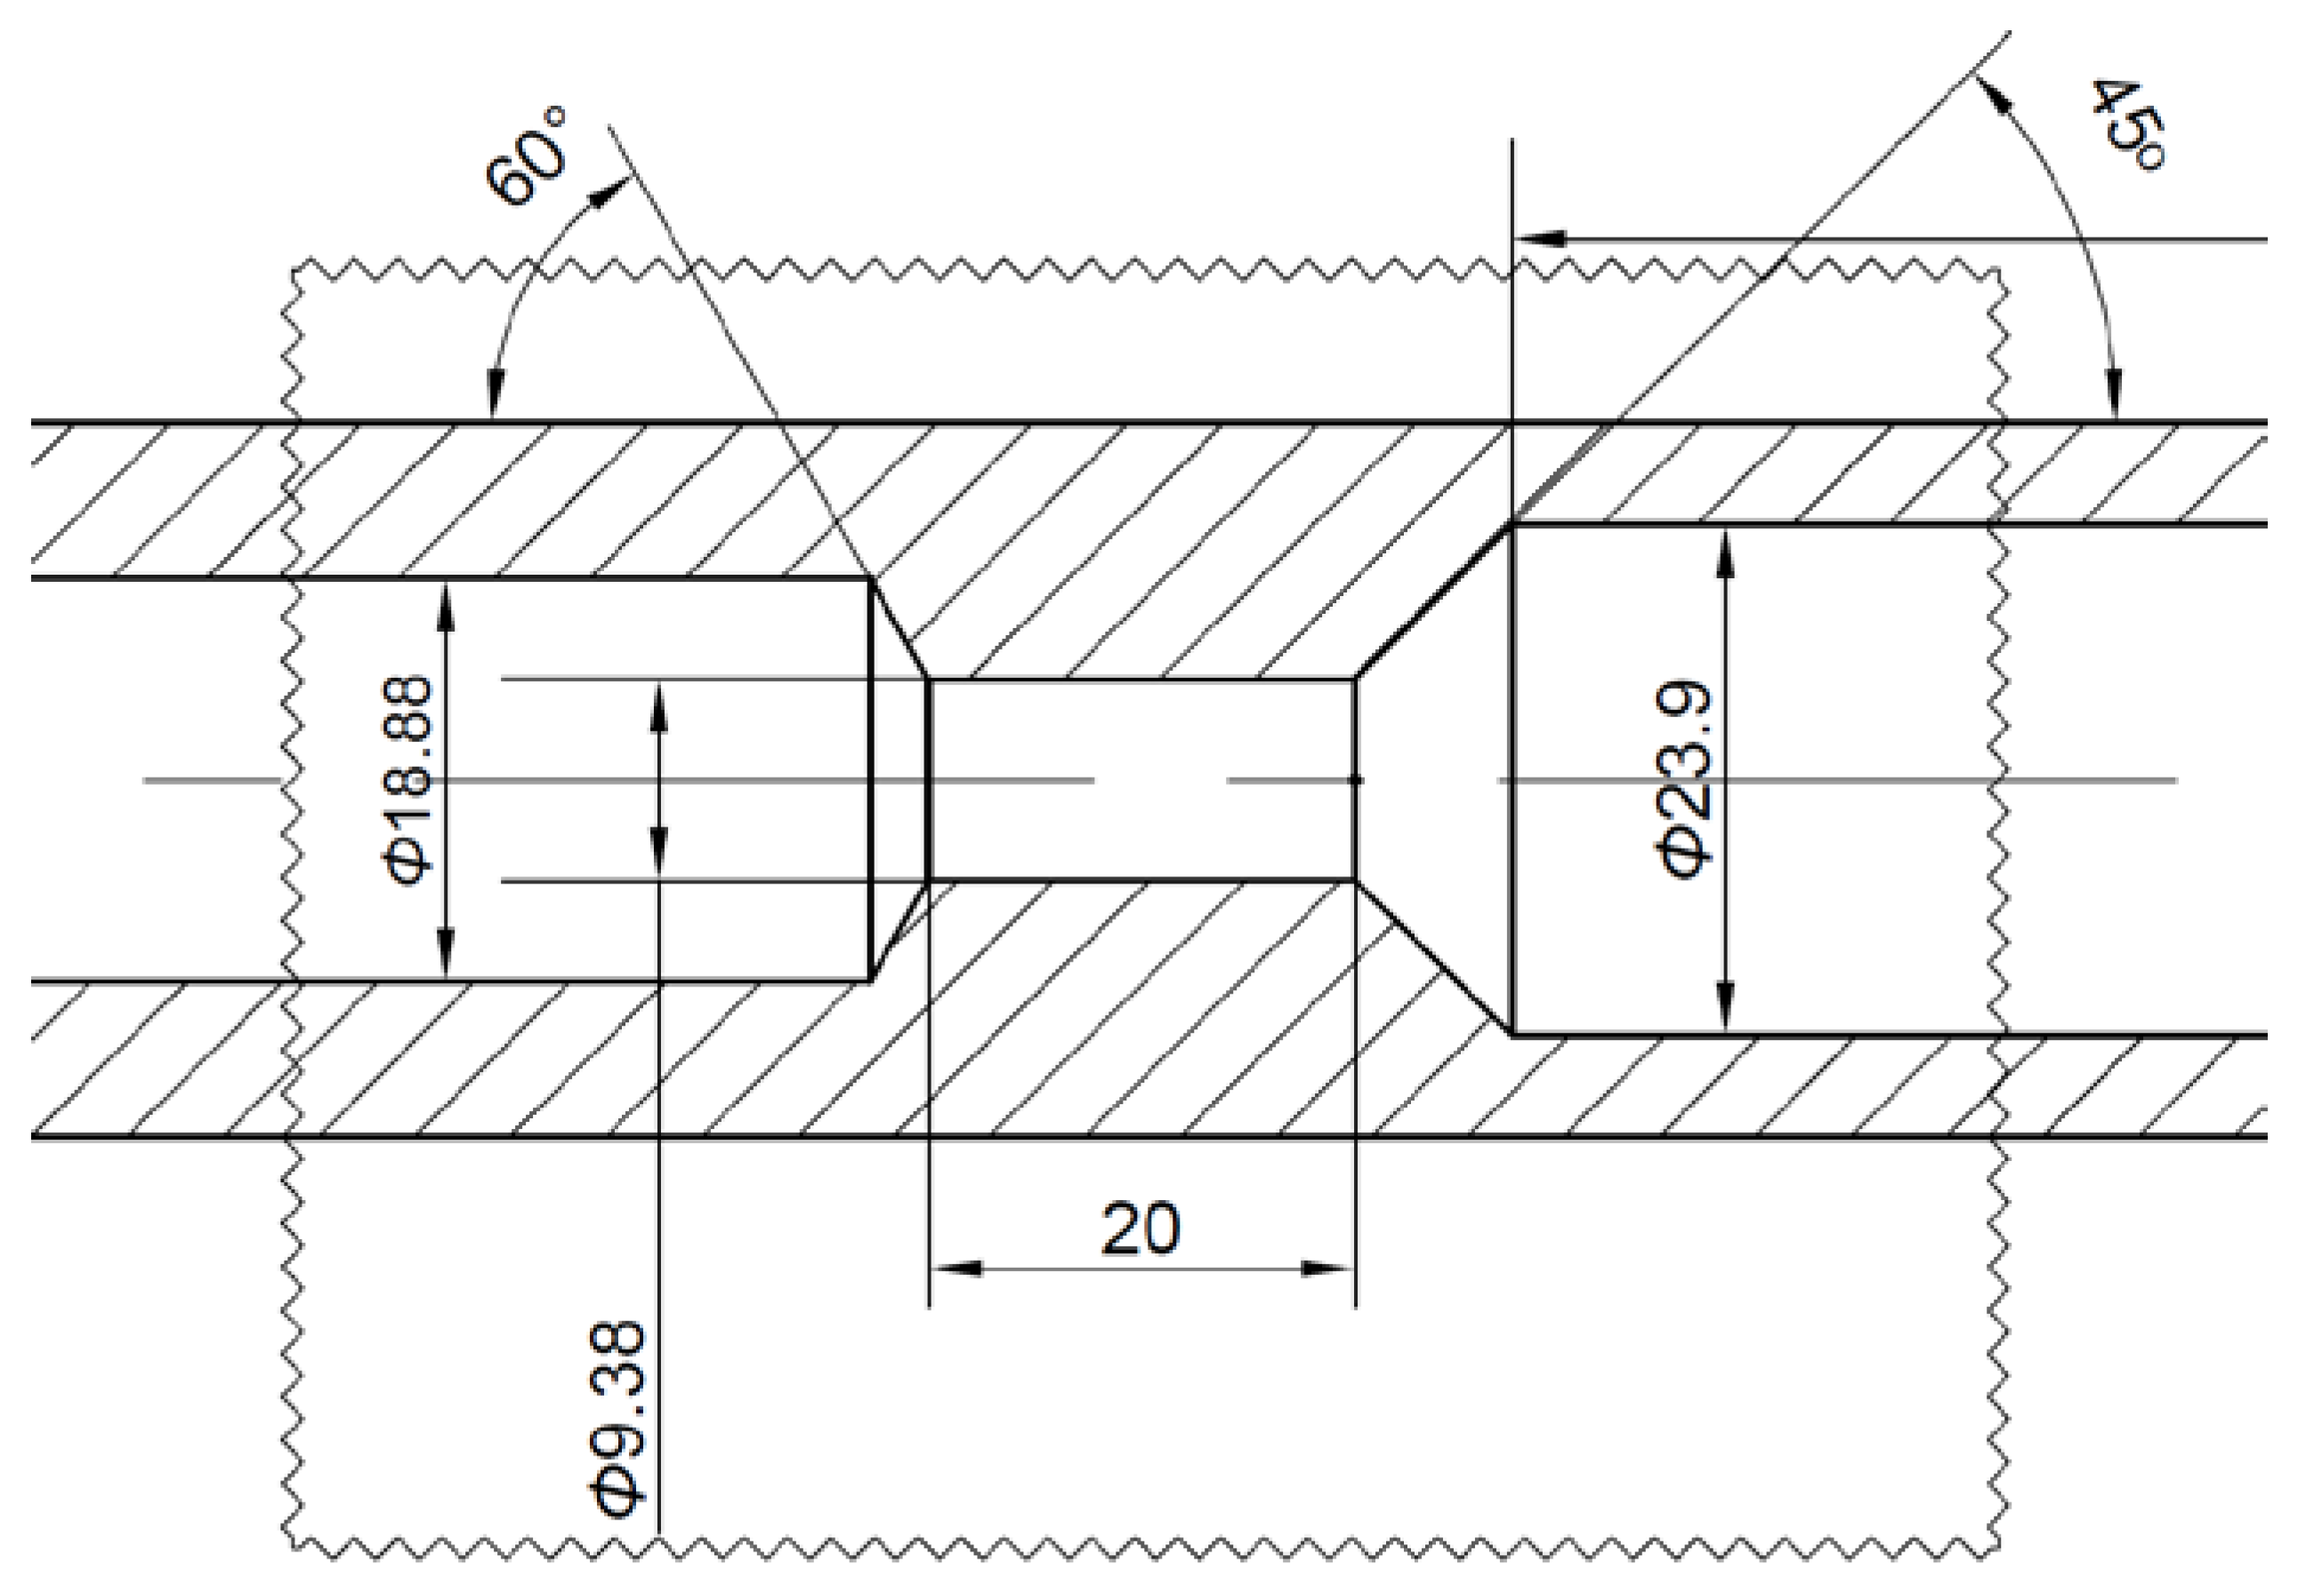
  • The CCFL for the orifice geometry, as described in the manuscript, can be expressed as a Wallis correlation, where m and C are 0.682 and 0.601, respectively.
  • Assuming the correlation obtained for the experimental test conditions is still valid and applicable for the operating conditions of the pressurizer, where the pressure is 155 bar (a), and the corresponding saturated temperature is 617.95 K, when CCFL occurs, the condensate drainage flowrate is estimated to be 2.95 kg/h.

Author Contributions

Conceptualization, D.Z. and N.W.; methodology, D.Z., C.X. and Z.W.; validation, D.Z., C.X. and X.Z.; formal analysis, D.Z., C.X. and X.Z.; investigation, D.Z., Y.L. and X.C.; resources, Z.W. and N.W.; data curation, D.Z., X.Z. and Y.L.; writing—original draft preparation, D.Z., C.X. and N.W.; writing—review and editing, D.Z., Z.W. and N.W.; visualization, D.Z., X.C. and N.W.; supervision, N.W.; project administration, N.W. All authors have read and agreed to the published version of the manuscript.

Funding

This research received no external funding.

Data Availability Statement

Not applicable.

Conflicts of Interest

The authors declare no conflict of interest.

Nomenclature

General Symbols:
Dinner diameter of pipe, m
gacceleration of gravity, m / s 2
jsuperficial velocity, m / s
j*dimensionless superficial velocity
Ppressure, Pa
Hheigth, m
Greek alphabet”
ρdensity, kg / m 3
Δpressure difference, Pa
Subscripts:
Ggas
Lliquid
Wwater
Sstandard pipeline
Ttest pipeline
STthe difference between the standard pipeline and the test pipeline
Ccondenser

References

  1. Mostafa Ghiaasiaan, S. Two-Phase Flow, Boiling and Condensation: In Conventional and Miniature Systems; Cambridge University Press: Cambridge, UK, 2007; ISBN 9780511619410. [Google Scholar]
  2. Wallis, G.B. One-Dimensional Two-Phase Flow; McGraw Hill: New York, NY, USA, 1969. [Google Scholar]
  3. Bankoff, S.G.; Lee, S.C. A Critical Review of the Flooding Literature; NUREG/CR-3060; U.S. Nuclear Regulatory Commission: Washington, DC, USA, 1983.
  4. Suzuki, S.; Ueda, T. Behaviour of Liquid Films and Flooding in Counter-Current Two-Phase Flow—Part 1. Flow in Circular Tubes. Int. J. Multiph. Flow 1977, 3, 517–532. [Google Scholar] [CrossRef]
  5. Vijayan, M.; Jayanti, S.; Balakrishnan, A.R. Effect of Tube Diameter on Flooding. Int. J. Multiph. Flow 2001, 27, 797–816. [Google Scholar] [CrossRef]
  6. Kusunoki, T.; Murase, M.; Fujii, Y.; Nozue, T.; Hayashi, K.; Hosokawa, S.; Tomiyama, A. Effects of Fluid Properties on CCFL Characteristics at a Vertical Pipe Lower End. J. Nucl. Sci. Technol. 2015, 52, 887–896. [Google Scholar] [CrossRef]
  7. Bankoff, S.G.; Lee, S.C. Flooding and Hysteresis Effects in Nearly-Horizontal Countercurrent Stratified Steam-Water Flow. Int. J. Heat Mass Transf. 1987, 30, 581–588. [Google Scholar] [CrossRef]
  8. Choi, K.Y.; No, H.C. Experimental Studies of Flooding in Nearly Horizontal Pipes. Int. J. Multiph. Flow 1995, 21, 419–436. [Google Scholar] [CrossRef]
  9. Chun, M.H.; Yu, S.O. Effect of Steam Condensation on Countercurrent Flow Limiting in Nearly Horizontal Two-Phase Flow. Nucl. Eng. Des. 2000, 196, 201–217. [Google Scholar] [CrossRef]
  10. Lee, S.C.; Bankoff, S.G. Stability of Steam-Water Countercurrent Flow in an Inclined Channel. J. Heat Mass Transfer. 1982, 105, 713–718. [Google Scholar] [CrossRef]
  11. Zapke, A.; Kröger, D.G. Countercurrent Gas-Liquid Flow in Inclined and Vertical Ducts—I: Flow Patterns, Pressure Drop Characteristics and Flooding. Int. J. Multiph. Flow 2000, 26, 1439–1455. [Google Scholar] [CrossRef]
  12. Deendarlianto; Ousaka, A.; Indarto; Kariyasaki, A.; Lucas, D.; Vierow, K.; Vallee, C.; Hogan, K. The Effects of Surface Tension on Flooding in Counter-Current Two-Phase Flow in an Inclined Tube. Exp. Therm. Fluid Sci. 2010, 34, 813–826. [Google Scholar] [CrossRef]
  13. Al Issa, S.; MacIan, R. A Review of CCFL Phenomenon. Ann. Nucl. Energy 2011, 38, 1795–1819. [Google Scholar] [CrossRef]
  14. Deendarlianto; Höhne, T.; Lucas, D.; Vierow, K. Gas-Liquid Countercurrent Two-Phase Flow in a PWR Hot Leg: A Comprehensive Research Review. Nucl. Eng. Des. 2012, 243, 214–233. [Google Scholar] [CrossRef]
  15. Ohnuki, A. Experimental Study of Counter-Current Two-Phase Flow in Horizontal Tube Connected to Inclined Riser. J. Nucl. Sci. Technol. 1986, 23, 219–232. [Google Scholar] [CrossRef]
  16. Navarro, M.A. Study of Countercurrent Flow Limitation in a Horizontal Pipe Connected to an Inclined One. Nucl. Eng. Des. 2005, 235, 1139–1148. [Google Scholar] [CrossRef]
  17. Vallée, C.; Lucas, D.; Beyer, M.; Pietruske, H.; Schütz, P.; Carl, H. Experimental CFD Grade Data for Stratified Two-Phase Flows. Nucl. Eng. Des. 2010, 240, 2347–2356. [Google Scholar] [CrossRef] [Green Version]
  18. Lucas, D.; Beyer, M.; Pietruske, H.; Szalinski, L. Counter-Current Flow Limitation for Air-Water and Steam-Water Flows in a PWR Hot Leg Geometry. Nucl. Eng. Des. 2017, 323, 56–67. [Google Scholar] [CrossRef]
  19. Astyanto, A.H.; Pramono, J.A.E.; Catrawedarma, I.G.N.B.; Deendarlianto. Indarto Statistical Characterization of Liquid Film Fluctuations during Gas-Liquid Two-Phase Counter-Current Flow in a 1/30 Scaled-down Test Facility of a Pressurized Water Reactor (PWR) Hot Leg. Ann. Nucl. Energy 2022, 172, 109065. [Google Scholar] [CrossRef]
  20. Sun, K.H. Flooding Correlations for BWR Bundle Upper Tie Plates and Bottom Side-Entry Orifice. In Proceedings of the Second Multi-Phase Flow and Heat Transfer Symposium-Workshop, Miami Beach, FL, USA, 16–18 April 1979; pp. 399–401. [Google Scholar]
  21. Murase, M.; Suzuki, H.; Matsumoto, T.; Naitoh, M. Countercurrent Gas-Liquid Flow in Boiling Channels. J. Nucl. Sci. Technol. 1986, 23, 487–502. [Google Scholar] [CrossRef]
  22. Celata, G.P.; Cumo, N.; Farello, G.E.; Setaro, T. The Influence of Flow Obstructions on the Flooding Phenomenon in Vertical Channels. Int. J. Multiph. Flow 1989, 15, 227–239. [Google Scholar] [CrossRef]
  23. Kawaji, M.; Lotocki, P.A.; Krishnan, V.S. Countercurrent Flooding in Pipes Containing Multiple Elbows and an Orifice. J. Ser. B Fluids Therm. Eng. 1993, 36, 397–403. [Google Scholar] [CrossRef] [Green Version]
  24. Teyssedou, A.; Önder, E.N.; Tye, P. Air-Water Counter-Current Slug Flow Data in Vertical-to-Horizontal Pipes Containing Orifice Type Obstructions. Int. J. Multiph. Flow 2005, 31, 771–792. [Google Scholar] [CrossRef]
Figure 1. Pressurizer liquid level measurement system.
Energies 16 00222 g001
Figure 2. Details of the orifice.
Energies 16 00222 g002
Figure 3. Experimental system.
Energies 16 00222 g003
Figure 4. Principle of CCFL identification.
Energies 16 00222 g004
Figure 5. Condensate collection and measurement device.
Energies 16 00222 g005
Figure 6. DPST vs. time.
Energies 16 00222 g006
Figure 7. DPS and DPT vs. time.
Energies 16 00222 g007
Figure 8. Countercurrent flow in the orifice.
Energies 16 00222 g008
Figure 9. DPS and DPT vs. time.
Energies 16 00222 g009
Figure 10. DPS and DPT vs. time.
Energies 16 00222 g010
Figure 11. Smooth stratified flow upstream of the orifice.
Energies 16 00222 g011
Figure 12. Stratified wavy flow upstream of the orifice.
Energies 16 00222 g012
Figure 13. Sudden rise of a wave upstream of the orifice.
Energies 16 00222 g013
Figure 14. Slug flow upstream of the orifice.
Energies 16 00222 g014
Figure 15. Smooth stratified flow upstream of the orifice.
Energies 16 00222 g015
Figure 16. DPS, DPT, and DPST vs. time in one cycle.
Energies 16 00222 g016
Figure 17. Flow pattern in the horizontal pipe at (a) time: 16:10:31.020; (b) time: 16:10:32.400; (c) time: 16:10:33.450; (d) time: 16:10:33.821; (e) time: 16:10:34.070; (f) time: 16:10:34.444; and (g) time: 16:10:34.996.
Energies 16 00222 g017
Figure 18. PSD of differential pressure DPT.
Energies 16 00222 g018
Figure 19. CCFL data.
Energies 16 00222 g019
Table 1. Instruments for the experiment.
ItemInstrumentTypeSpecification
Pressure difference between the standard pipeline and the common pressure pipe, DPSPressure transducerRosemount type 3051CD0~20 kPa, 0.1% measurement accuracy
Pressure difference between the test pipeline and the common pressure pipe, DPTPressure transducerRosemount type 3051CD0~20 kPa, 0.1% measurement accuracy
Pressure difference between the standard pipeline and the test pipeline, DPSTPressure transducerRosemount type 3051CD0~20 kPa, 0.1% measurement accuracy
Saturated steam temperatureThermocoupleT-type±0.5 K measurement accuracy
Saturated water temperatureThermocoupleT-type±0.5 K measurement accuracy
Ambient temperatureThermocoupleT-type±0.5 K measurement accuracy
Water level of the measurement cylinderMeasurement cylinder-D = 35.4 mm, 1 mm measurement accuracy
Table 2. Visualization experiments.
CasesFan Air VelocityOscillationDrainage Mass FlowrateAmbient Temp.
m/s kg/hK
11.7No0.537297.95
21.8No0.541298.15
31.8No0.549298.95
41.8No-Yes0.549298.45
51.9Yes0.545298.95
62.2Yes0.535298.35
72.5Yes0.543300.05
82.7Yes0.538298.75
93.0Yes0.535298.45
Table 3. CCFL.
Table 3. CCFL.
CasesCooling Fan Air VelocityPressurizer
Pressure
Drainage
(CCFL)
Ambient Temp.
m/sBar (a)kg/hK
101.81.10.542 298.95
111.91.250.600 295.85
121.61.50.630 297.15
131.32.00.681 297.55
141.42.50.741 295.65
151.83.00.841 295.95
Disclaimer/Publisher’s Note: The statements, opinions and data contained in all publications are solely those of the individual author(s) and contributor(s) and not of MDPI and/or the editor(s). MDPI and/or the editor(s) disclaim responsibility for any injury to people or property resulting from any ideas, methods, instructions or products referred to in the content.

