Article

Extended Natural Gas Characterization Method for Improved Predictions of Freeze-Out in LNG Production

by
Hassan A. Attalla
1,*,
Nour A. El-Emam
1,
Tarek M. Aboul-Fotouh
1 and
Eric F. May
2,3,*
1
Mining and Petroleum Engineering Department, Faculty of Engineering, Al-Azhar University, Cairo 11884, Egypt
2
Fluid Science and Resources Division, The University of Western Australia, 35 Stirling Hwy, Crawley, Perth 6009, Australia
3
Future Energy Experts Corporative Research Center, 35 Stirling Hwy, Crawley, Perth 6009, Australia
*
Authors to whom correspondence should be addressed.
Energies 2023, 16(1), 254; https://doi.org/10.3390/en16010254
Submission received: 11 November 2022 / Revised: 3 December 2022 / Accepted: 22 December 2022 / Published: 26 December 2022

Abstract

:
The formation and the blockage of plant equipment such as heat exchangers by heavy hydrocarbon (HHC) solids is an inherent risk in cryogenic natural gas processing. The accuracy of the gas mixture’s compositional characterization significantly impacts the reliability of solid formaiton temperature predictions. Recently, we showed that complete characterization of the mixture is necessary to obtain accurate predictions of the melting temperature, as current methods based on pseudocomponent characterizations of HHCs are inadequate. Here, we present an improved method of characterizing HHCs that represents each pseudocomponent up to C14+ by a paraffinic, isoparaffinic, naphthenic and aromatic (PINA) composition and allocates an associated defined component to represent these sub-fractions. This new, extended PINA-based characterization of HHC pseudocomponents is derived from 46 different pipeline natural gas samples, and the method is validated against three representative gas samples that were fully characterized. The melting temperatures of the three gas samples based on their full characterizations are 263.2 K (14.1 °F), 260.1 K (8.5 °F) and 248.3 K (−12.8 °F), respectively. Predictions made with the new method match these within (1 to 2) K, while previous correlation methods under-predict them by (10 to 20) K. The improved performance arises from (1) the selection of suitable discrete components to represent each PINA fraction within a pseudocomponent, (2) the more representative distribution of PINA fractions as a function of carbon number, and (3) the use of discrete components to represent the pseudocomponent’s thermodynamic properties in both the fluid and solid phases. These results show how the new characterization method can reliably predict HHC freeze-out conditions, particularly when a full compositional analysis is unavailable. Future research should aim to test the new method on natural gas samples from regions other than the US Gulf Coast.

1. Introduction

Conditioning and processing of natural gas in cryogenic gas processing plants usually require cooling of the feed gas in refrigeration systems to separate the heavy hydrocarbons (HHC). This is required to meet the delivery hydrocarbon dew-point pipeline specifications of the sales gas and/or to separate the natural gas liquids (NGL), C2+, for further fractionation to make NGL products. Production of Liquefied Natural Gas (LNG) requires deep cooling of the gas to condense it to a liquid state.
The feed to gas processing and liquefaction plants may contain trace amounts of heavy hydrocarbons such as BTEX compounds (benzene, toluene, ethylbenzene, and xylenes) and heavier hydrocarbon components, which have high melting points [1]. These components may freeze out during the cooling process of the gas and precipitate in the small flow channels of the heat exchangers, control valves, and process strainers. The precipitation of these solids may cause partial blockage of the process equipment leading to unplanned shutdowns, production loss and costly downtime required to defrost the clogged process systems [2]. To reduce the level of contaminants, such as acid gases, moisture, and heavy hydrocarbons to acceptable levels before liquefaction, feed natural gas is subjected to a variety of treatment operations, as shown in Figure 1.
BTEX and HHC compounds can precipitate at the very low temperatures in the cold section of the LNG production process when excessive concentrations of these undesired heavy components slip into the liquefaction exchangers during process upsets. Table 1 shows the relatively high triple point temperatures of BTEX and HHC. These components are typically removed in the Heavies Removal Unit, which consists mainly of a refluxed cryogenic distillation column (called Scrub Column or NGL Absorber) where BTEX and HHC are removed to acceptable and safe limits along with the NGL.
The gas analysis for designing new gas processing and liquefaction plants is usually detailed for the light hydrocarbons from methane to pentanes and also typically shows the BTEX composition. However, the heavier hydrocarbons, including those with high melting points, are typically lumped in pseudo components (usually C6+) according to their normal boiling points (NBP). For the operating gas processing and LNG plants, the routine gas analysis used to monitor the process usually has a similar limited resolution. This resolution needs to provide the required information about the compositions and the molecular type; paraffinic, iso-paraffinic, naphthenic, and aromatic (PINA) distribution of the heavy hydrocarbons lumped in the pseudo components. This information is required to provide a robust process design for the new gas processing and LNG plants. It is also required to effectively troubleshoot the freeze-out problems that may occur in the operating plants.
Chen and Ott [4] reported that lean feed gases are becoming increasingly common as more LNG is based on unconventional gas resources, such as shale gas, tight sands gas, coal-bed methane, and domestic pipelines. Both also reported that the feed gas to some plants operating LNG plants had been gradually replaced by newer sources, such as gas produced from wells in deep water. These new feed gas sources often contain more methane and considerably fewer natural gas liquid (NGL) components than conventional feed gas sources while also having heavy paraffinic and aromatic hydrocarbon content comparable to conventional feed gas sources. This trend has brought a new challenge to the design and operation of these liquefaction units. Additionally, Chen and Ott [4] reported that many lean feed gas sources contain disproportionately large amounts of HHCs. These heavy components can exceed the maximum amount allowed to avoid freezing in the liquefaction process. Another characteristic of some unconventional gas sources is the significant variation in feed composition over a relatively short period, which can occur when the feed gas is supplied from multiple sources.
The presence of the long-chain HHC in the feed gas to LNG plants, even in trace amounts, increases the risk of freeze-out of these complex components at the Precooling Section of the LNG plant shown in Figure 2, which has a typical lower-limit temperature of 238.7 K (−30 °F) [1,5]. The higher risk is caused by their higher melting points, as shown in Table 2 and Table 3. These tables show that the characterization of HHC should not be assumed to be 100% n-paraffins due to the increased risk of heavy aromatic isomers freeze-out in the Precooling Section. Rather an accurate estimate of the molecule class (PINA distribution) of these HHC components is crucial for the robust design of new LNG plants and the effective troubleshooting of HHC freeze-out in actively operating LNG plants.
Miethe et al. [6] reported that the light hydrocarbons up to n-pentane are generally detailed in the design basis of LNG, NGL or ethane separation plants. However, the HHCs that might foul the pipes at lower temperatures are often lumped into pseudocomponents according to their boiling point. They also proposed a new method developed to improve the calculation of solids precipitation in natural gases using correlations endorsed by the American Petroleum Institute (API), as described in Riazi and Daubert [7]. Their method consists of two steps:
  • Splitting the pseudo-components into four sub-fractions each: n-paraffin (P), branched paraffins (I), naphthenes (N), and aromatics (A).
  • Representing the fusion properties of each sub-fraction with a discrete component, where no additional physical properties need to be generated for the pseudo component (PC).
To validate their approach, henceforth referred to as PINAAPI, they compare the melting points and precipitation curves of a fully characterized mixture up to C10+, where the fusion properties are estimated with multiple approaches, as described in Table 4. These approaches are accompanied by a characterization of the gas mixture into a Lump component list containing discrete single carbon number (SCN) groups of HHCs heavier than isopentane up to C10+. In their comparison of the Full methods with various Lump + Freeze-out approaches, they showcased that the Lump + PINAAPI predicted the melting point of the mixture within 1 °C of the Full method with a very similar precipitation curve when aromatics were considered explicitly. However, there has been no application of the Lump + PINAAPI approach to defined mixtures that are known to have heavy HHCs up to C14.. Additionally, Miethe et al. [
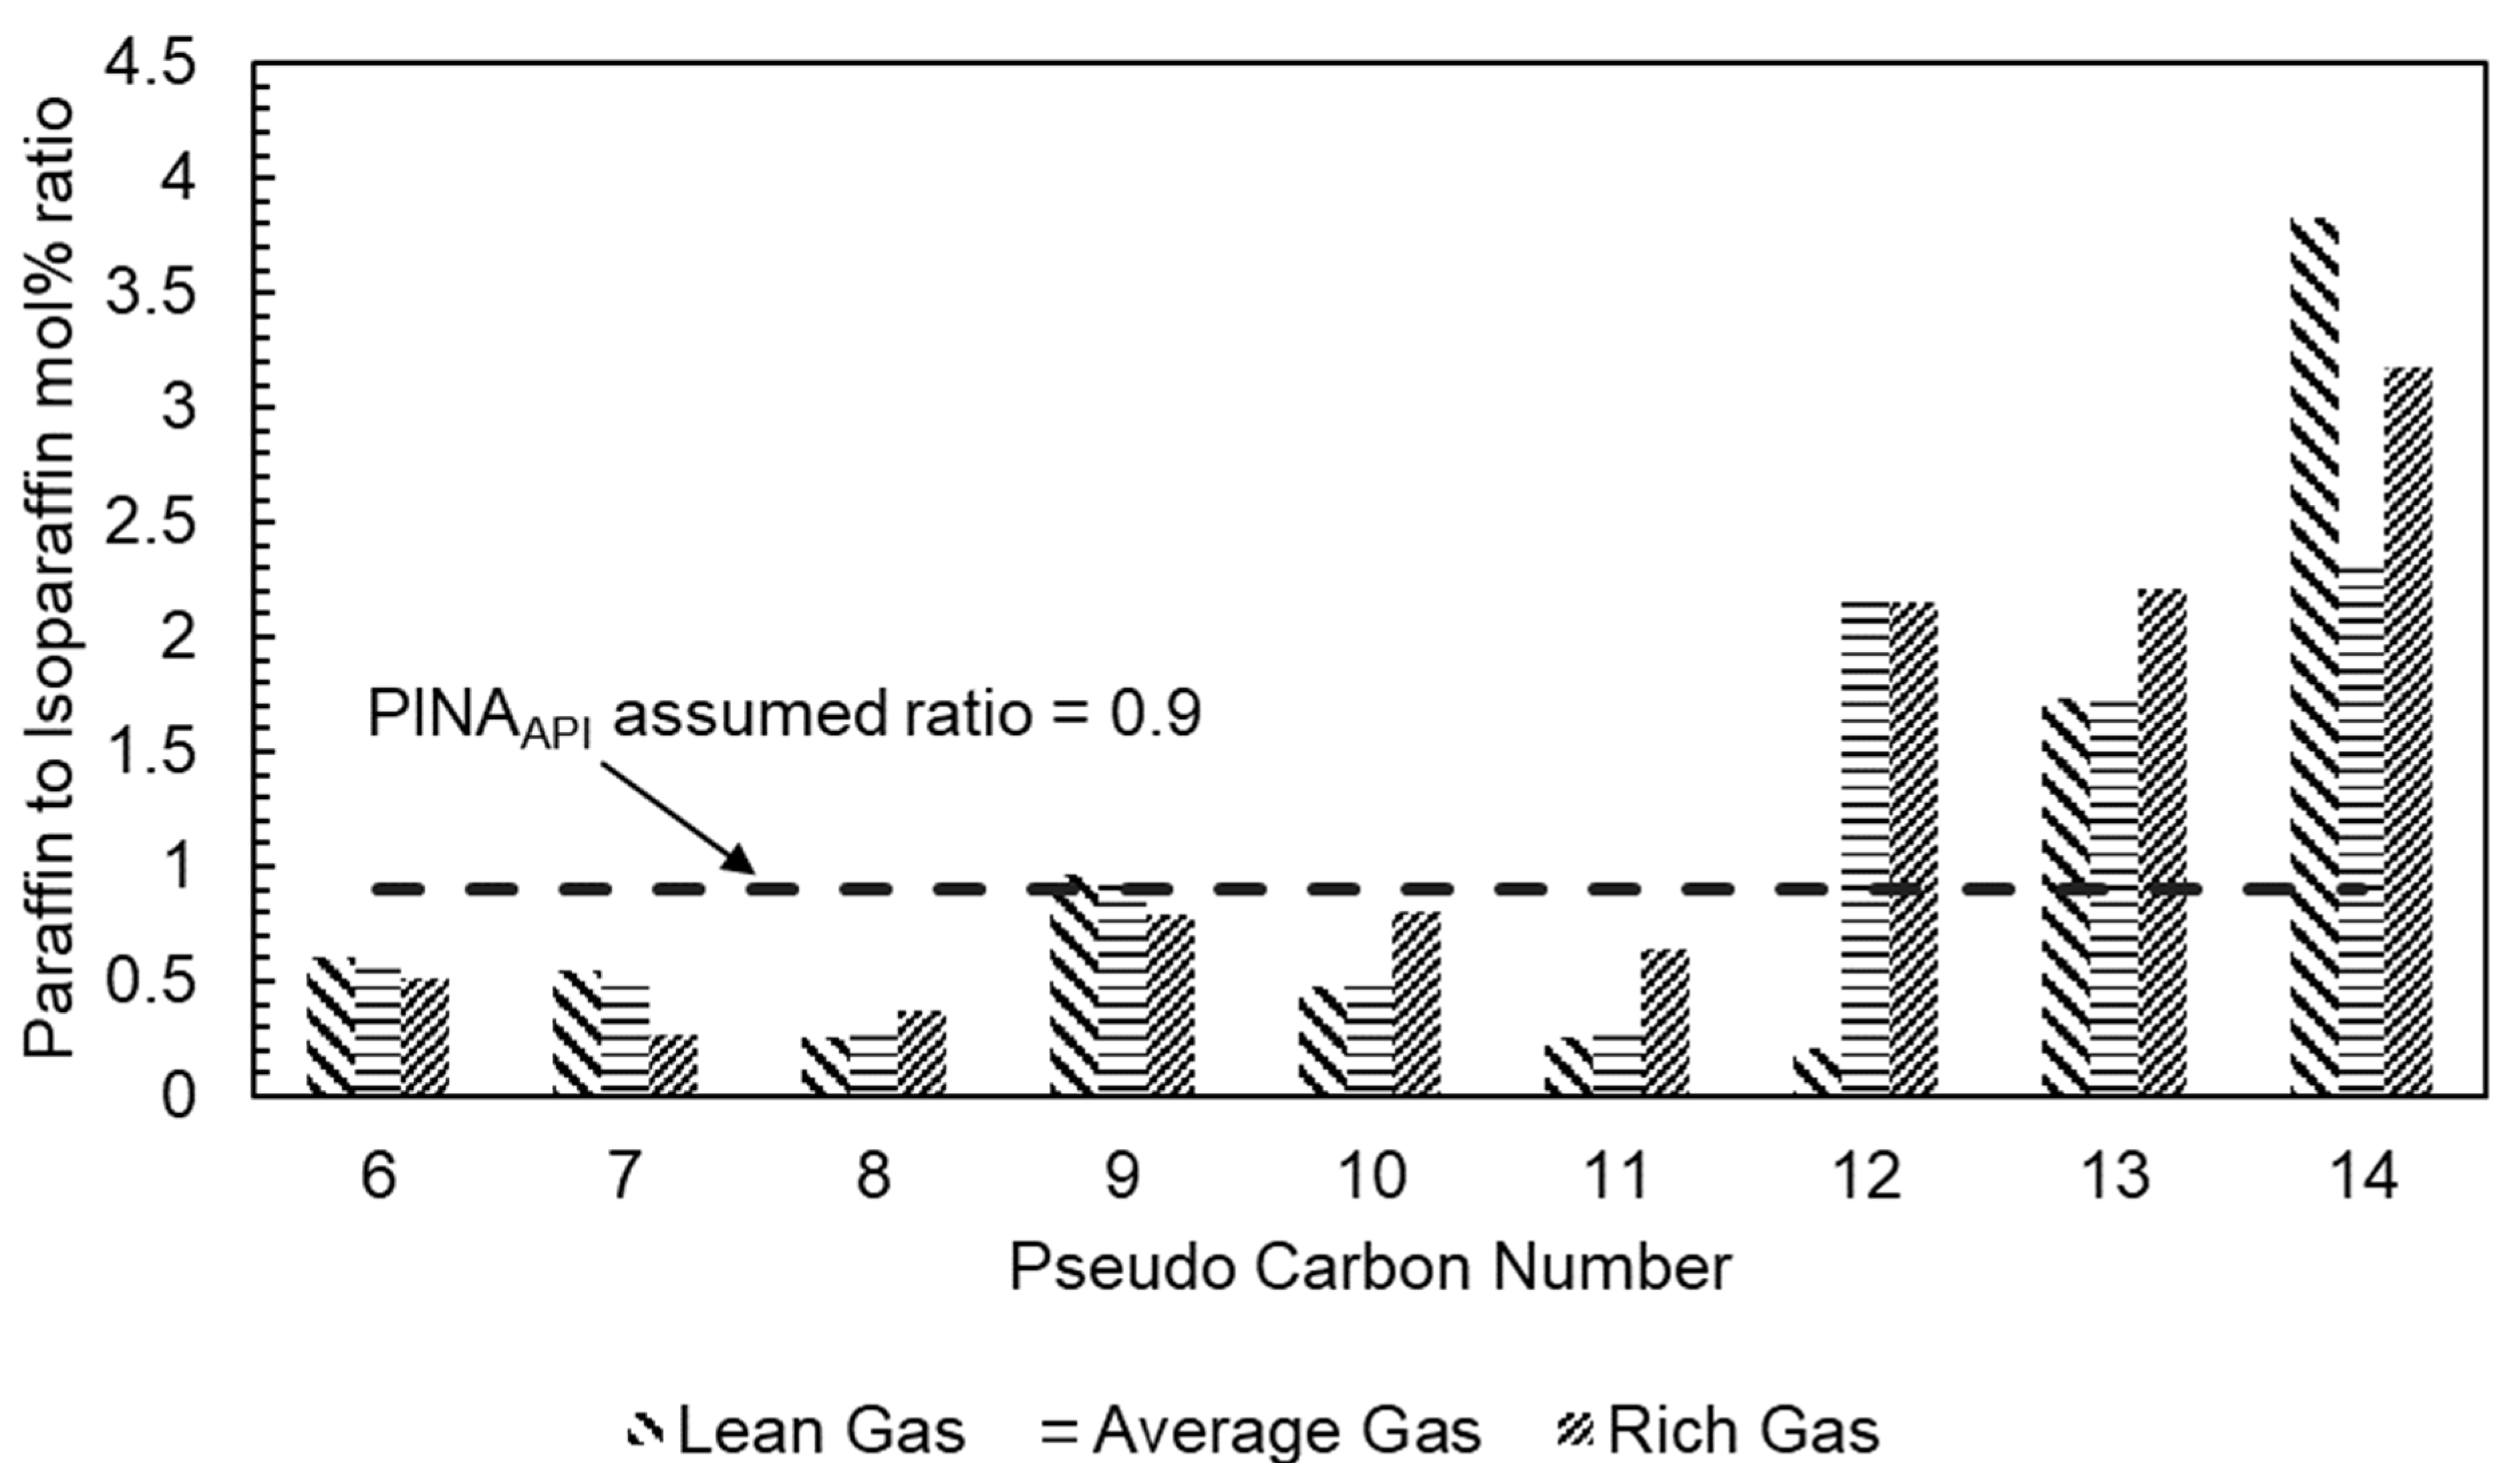
6] make an unvalidated assumption that the ratio of paraffinic ( x p ) to isoparaffinic ( x i ) content is x p = 0.9 x i . Therefore, it is unlikely that the estimated PINA splits will reflect the actual PINA split of HHCs of LNG feed gas sources with high methane content and fewer NGL components.
Recently, Attalla et al. [8] demonstrated that the approach developed by Miethe et al. [6] was inadequate for multiple reasons. First, their Lump characterization does not extend to C14 compounds and second, the methods for estimating the PINA splits were developed for petroleum fractions and are not necessarily applicable to high-methane content gas condensates. Attalla et al. [8] demonstrated that for natural gas mixtures known to freeze out in LNG production, Lump + Freeze-out methods underpredict melting temperatures by more than 85 K relative to the melting temperatures determined from a full compositional characterization of the gas mixture. Their work demonstrated the necessity for either a complete characterization of natural gas mixtures up to C14+ compounds to accurately predict freeze-out conditions in LNG plants and/or the development of an improved approach to predicting freeze-out when only limited compositional information is available.
This work builds upon the approach of Miethe et al. [6] by incorporating more robust methods suited for estimating the PINA splits for natural gas mixtures based on experimental measurements of natural gas samples. This work also extends the use of representative compounds in the Lump + PINAAPI method to consider up to C14+ compounds. Representative compounds are enhanced to include properties relevant to both the fluid and solid phases in contrast to previous Lump approaches where only properties relevant to solid formation by the representative compounds were used. The efficacy of this new approach, labelled PINAAttalla, is evaluated using predictions of the melting temperature against the PINAAPI method from Miethe et al. [6], and the full characterization of three different gas samples.

2. Heavy Hydrocarbon Characterization for Freeze-Out Predictions

The available published methods for predicting heavy hydrocarbon characterization are summarized in Table 4. Attalla et al. [8] present a detailed description of each method and its implementation within the software package ThermoFAST [9].

2.1. Full Method: Detailed Characterizations of Three Samples

The full method refers to the representation of the fluid by all the compounds resolved in a compositional characterization. This section briefly describes the compositional characterizations up to C14 for three different samples of natural gas that were used with the full method to provide robust calculations of each sample’s HHC melting temperature. The three natural gas feed gas mixtures constitute Sample 1, which corresponds to a lean Gas case; Sample 2, which corresponds to a rich gas case; and Sample 3, which corresponds to an average gas case. The complete compositions for each these samples are shown below in Table 5, Table 6 and Table 7, respectively. The C14+ heavy fraction in each table was by represented with tetradecane but includes C15 and iso-C16 compounds in reality.

2.2. The PINAAttalla Method

This work introduces a new method of modelling the PINA distribution of HHCs for pseudocomponents with (pseudo-) carbon numbers between 6 and 14. The correlations used in the PINAAttalla method were developed from compositional analyses of 46 different natural gas samples collected from the US Gulf Coast of Mexico. Each of these samples was classified according to the molecular weight (MW) of their C6+ fractions (determined by GPA Method 2286 [10] and GPA Method 2186 [11]) to define the three categories of gas as shown in Table 8. The fully characterized gas sample compositions in Table 5, Table 6 and Table 7 reflect exemplar samples from each of these categories. Within a given type of gas mixture the HHCs are classified into single carbon number (SCN) pseudocomponents based on the normal boiling point (NBP) ranges shown below in Table 9.
A central feature of PINA methods is estimating the ratio of paraffinic, isoparaffinic, naphthenic and aromatic compounds within a given pseudocomponent. The PINAEqual method assumes an equal distribution of compounds across the four classes, while the PINAAPI methods uses API correlations to calculate the ratios of the combined paraffin + isoparaffin class to the naphthenic and aromatic classes. Additionally, for the PINAAPI method, Miethe et al. [6] assumed that the fraction of paraffins, xp, was related to the fraction of isoparaffins, xi via xp = 0.9 xi. However, as shown Figure 3, across the 46 samples analyzed the average ratio of paraffin to isoparaffin content in each SCN pseudocomponent and gas mixture type varied significantly, and was generally quite different from 0.9.
To improve the accuracy of freeze-out predictions new average PINA distributions were calculated from the 46 samples for each SCN pseudocomponent and each type of gas mixture. These average PINA distributions are shown for the lean gas, average gas, and rich gas types, as shown in Table 10, Table 11 and Table 12, respectively. Common to all gas mixture types is the absence of naphthenes and aromatics in either the C6 pseudocomponent or the C13 pseudocomponent. The former absence simply reflects the fact that the normal boiling points of cyclohexane and benzene lie within the range of the C7 pseudocomponent, while the latter appears to be a characteristic of the 46 natural gas samples from the US Gulf Coast.
To accompany the improved description of PINA distributions up to C14 for natural gases, the PINAAttalla method also extends the discrete compounds used to represent pseudocomponents up to C14, from the C9 limit considered by the PINAAPI method [6]. The criteria used to select the representative discrete compounds were:
  • Either the representative compound has a carbon number equal to the SCN;
  • The representative compound has an NBP that falls within range covered by the SCN pseudocomponent;
  • The representative compound has the highest melting point among the other components within the NBP range of the SCN pseudocomponent.
Table 13 presents the discrete compounds used in the PINAAttalla method to represent each PINA sub-fractions of the SCN pseudocomponents to C14. The implementation of the PINAAttalla method into the ThermoFAST software package [9] involved ensuring each of the discrete compounds used to represent pseudocomponent PINA fractions were defined together with all necessary thermodynamic parameters, as detailed by Attalla et al. [8]. Specifically, two additional discrete compounds were added for this work, as shown Table A1 in the Appendix A. When implementing the PINAAttalla method to a natural gas sample, the mole fraction of each representative compound is determined by multiplying the mole fraction of the corresponding pseudocomponent by the mole fraction of the PINA class (xp, xi, xn, or xa) listed in either Table 10, Table 11 and Table 12, depending on the type of gas mixture the sample falls into according to Table 8.
Other methods for predicting HHC freeze-out typically use different correlations to describe the thermodynamic properties of the pseudocomponents in the fluid phase from those used to describe the solid phase properties [6,8]. This is particularly pertinent to the normal implementations of the PINAEqual and PINAAPI methods developed by Miethe et al. [6], where discrete compounds are used to represent the solid properties of each pseudocomponent’s PINA fractions while a single ‘lumped’ pseudocomponent is considered when evaluating its fluid phase properties. In contrast, the PINAAttalla method as implemented in ThermoFAST simply considers the representative discrete compounds; however, they partition across all phases present at equilibrium. To ensure that the comparisons of the different HHC freeze-out methods considered in this work were focussed on the relative accuracy of the PINA distributions, the same approach was applied here to the PINAEqual and PINAAPI methods. The Lump-PINAEqual and Lump-PINAAPI methods used by Miethe et al. [6] and Attalla et al. [8] were replaced, and only the representative compounds were used together with the PINA distributions of these methods were used for melting temperature calculations. The ThermoFAST software package contains implementations of both the Lump + PINA and the PINA-only versions of all these methods. To elucidate the novelty of the PINAAttalla approach, Table 14 presents the differences between the Lump-PINAAPI and the PINAAttalla methods.

3. Results and Discussion

The melting temperatures based on the complete characterizations for Sample 1 (lean gas), Sample 2 (rich gas), and Sample 3 (average gas) indicate that the freeze-out can occur at temperatures around 263.2 K (14.1 °F), 260.1 K (8.5 °F), and 248.3 K (−12.8 °F), respectively. These temperatures are well within the cooling curve of a typical LNG production plant’s Precooling Section and are consistent with the freeze-out observed in some of operating LNG facilities.
Figure 4, Figure 5 and Figure 6 compare the melting temperatures predicted using the various PINA methods with those determined from the Full method for the lean gas, average gas and rich gas samples, respectively. Across all three samples, the new PINAAttalla method predicts melting temperatures within 1 K of those determined from the full compositional characterization. Full compositional characterizations with the resolution presented here for Samples 1–3 are uncommon and often unavailable during the design or normal operation of an LNG plant. While actual natural gas compositions are inevitably more complex, the correlations in the PINAAttalla method deliver a significant improvement in the ability to predict heavy hydrocarbon freeze out in LNG production, which is currently a significant operational problem for plants on the US Gulf Coast, from more standard, lower resolution compositional analyses. This improved performance reflects the fact that representative compounds and the PINA distributions used by the correlations are based on those measured for 46 actual pipeline gas samples collected from the US Gulf Coast.
The lower estimations of the PINAEqual and PINAAPI methods highlight the importance of accurately characterizing the PINA distribution of each SCN fraction for predicting the melting point accurately for natural gas mixtures. In particular, as the melting point is influenced by the composition of the heaviest components considered, achieving an accurate estimate of the PINA-split in the C14+ pseudocomponent for the paraffin component is vital for accurate results. Despite the poorer performance of the PINAAPI and PINAEqual methods relative to the new PINAAttalla approach, the melting points predicted are only about 20 K below the temperature determined using the Full method. This is a significant improvement relative to the predictions made using the Lump + PINAEqual and Lump + PINAAPI methods for the lean gas and rich gas samples detailed by Attalla et al. [8], which were low by around 100 K. By describing the properties of all phases using the representative compounds from the PINA-only methods (i.e., without using any lumped pseudocomponents to describe fluid-phase properties), the predicted melting temperature is at least above the lowest temperature of an LNG plant’s precooling section. These comparisons underscore the improvement brought by characterizing gas mixtures with pseudocomponents up to at least C14+ and robust PINA distributions coupled to representative discrete compounds.

4. Conclusions

This paper showcases the new PINAAttalla method for estimating the PINA distribution of pseudocomponents within natural gas mixtures classed according to the molecular weight of their C6+ fractions. New correlations were established based on 46 samples of natural gas from the US Gulf Coast, grouped into three classes of mixture: lean gas (C6+ MW < 92 g/mol), rich gas (C6+ MW > 100 g/mol) and average gas. Each class is accompanied by a distinct characterization of PINA distributions for each pseudocomponent up to C14+ together with discrete compounds that should be used to represent each SCN sub fraction. Representative samples of each gas type were fully compositionally characterized to enable determination of the HHC melting temperatures: 263.2 K (14.1 °F), 260.1 K (8.5 °F) and 248.3 K (−12.8 °F) for the lean, rich and average gas samples, respectively. The results of the melting point predictions made using the PINAAttalla method are within 1–2 K of the melting temperature obtained from the full method, while the PINAAPI and PINAEqual methods lead to under estimates of 10 to 20 K. Importantly, this work also shows that PINA-only methods provide superior HHC melting temperature predictions relative to Lump-PINA methods where correlations are used to estimate the thermodynamic properties of the pseudocomponent in the fluid phase.
Thus, this work demonstrates the use of the PINAAttalla method as a robust alternative to the complete characterization of natural gas mixtures to predict freeze-out conditions in cryogenic natural gas processing. This method can be directly applied to the design of new cryogenic gas plants, including LNG plants. Additionally, in operating cryogenic plants the PINAAttalla method could help with the design of process system modifications needed to ensure the safe removal of HHCs at a point upstream of where they would otherwise freeze-out.
The new PINAAttalla method was developed from the detailed compositional analysis of 46 natural gas samples from the US Gulf Coast, and accordingly is likely to be most accurate when applied to LNG plants operating in this region. Future work should explore the efficacy of the PINAAttalla method for natural gas feeding LNG plants in other regions, such as Qatar or Australia, where the PINA distribution within a SCN fraction might be different. However, other features of the PINAAttalla method—namely using representative discrete compounds for SCNs up to C14 in both the solid and fluid phases—suggest that it is likely to still be more accurate than other correlation-based approaches derived from basin-specific data. Exploring the viability of using representative compounds for SCN fractions beyond C14+ to predict freeze-out of HHCs in different hydrocarbon mixture types, such as waxes from crude oils and petroleum fractions might also be worthy of further investigation.

Author Contributions

Conceptualization, H.A.A.; Methodology, H.A.A.; Software, E.F.M.; Investigation, H.A.A.; Writing—original draft, H.A.A., and E.F.M.; Writing—review & editing, N.A.E.-E., T.M.A.-F. and E.F.M.; Supervision, N.A.E.-E., T.M.A.-F. and E.F.M. All authors have read and agreed to the published version of the manuscript.

Funding

This research received no external funding.

Institutional Review Board Statement

Not applicable.

Informed Consent Statement

Not applicable.

Data Availability Statement

Data is contained within this article.

Acknowledgments

The authors thank David J. Zhu, Peter E. Falloon, and Xiong Xiao for upgrading ThermoFAST Software to enable the freeze-out calculation methods tested in this study. Special thanks to David J. Zhu for his assistance in editing this paper. We thank the Future Energy Exports Cooperative Research Centre for providing access to the free ThermoFAST software package developed by the Fluid Science Research group at the University of Western Australia. This is FEnEx CRC Document 2022/RP1.CM1.3.2-FNX-002.

Conflicts of Interest

The authors declare no conflict of interest.

Appendix A. Two Discrete Components Added to ThermoFAST to Facilitate the PINAAttalla Method

Table A1. Parameters for two discrete compounds added to ThermoFAST to enable PINAAttalla method of representative compounds, in addition to the 43 discrete compounds previously added in Attalla et al. [8]. Parameter symbols and their primary sources: Δ H f —enthalpy of fusion [3]; T f —melting point [3]; Δ c p —specific heat difference between liquid and solid phase [3]; Δ V —volume change between liquid and solid phase (set to zero, or from MultiFlash 7.0) [12]; critical properties T c (critical temperature), P c (critical pressure), ρ c (critical density), and ω (acentric factor) [13,14,15].
ComponentFormulaHf (kJ/mol)Tf [K]cp (J/mol/K)V (m3/mol)CASTc [K]Pc [MPa]ρc [mol/m3]ωMolar Mass [g/mol]
3-methyloctaneC9H2017.00165.5585.62.30E-5002216-33-3590.152.341890.360.412346128.255
heptylcyclopentaneC12H2420.77219.9855.105617-42-5685.8192.085031542.020.49388168.32

References

  1. Kidnay, A.J.; Parrish, W.R. Fundamentals of Natural Gas Processing; CRC Press: Boca Raton, FL, USA, 2006. [Google Scholar]
  2. Baker, C.; Siahvashi, A.; Oakley, J.; Hughes, T.; Rowland, D.; Huang, S.; May, E.F. Advanced predictions of solidification in cryogenic natural gas and LNG processing. J. Chem. Thermodyn. 2019, 137, 22–33. [Google Scholar] [CrossRef]
  3. Yaws, C.L.; Gabbula, C. “Yaws” Handbook of Thermodynamic and Physical Properties of Chemical Compounds; Knovel: New York, NY, USA, 2003. [Google Scholar]
  4. Chen, F.; Ott, C.M. Lean gas. LNG Industry Magazine, Spring: Surrey, UK, January/February 2013. [Google Scholar]
  5. Ransbarger, W. A fresh look at LNG process efficiency. LNG Industry Magazine, Spring: Surrey, UK, 2007. [Google Scholar]
  6. Miethe, I.; Lauermann, G.; Jungfer, B. Improve the calculation of solids precipitation in gas compositions. Hydrocarbon Processing Magazine, Houston, TX, USA, May 2015; 45. [Google Scholar]
  7. Riazi, M.R.; Daubert, T.E. Prediction of molecular-type analysis of petroleum fractions and coal liquids. Ind. Eng. Chem. Process Des. Dev. 1986, 25, 1009–1015. [Google Scholar] [CrossRef]
  8. Attalla, H.A.; El-Emam, N.A.; Abdul-Fotouh, T.M.; May, E.F. Performance Tests of Gas Characterization Methods for Predicting Freeze-out in LNG Production. Int. J. Thermophys. 2022, 44, 25. [Google Scholar] [CrossRef]
  9. ThermoFAST 2.0. Fluid Science and Resources; The University of Western Australia, 35 Stirling Hwy, Crawley, Perth 6009, Australia 2022. Available online: https://www.fsr.ecm.uwa.edu.au/software/thermofast/ (accessed on 14 October 2022).
  10. Gas Processors Association. GPA-2286: Method for the Extended Analysis of Natural Gas and Similar Gaseous Mixtures by Temperature Programmed Gas Chromatography; Gas Processors Association: Tulsa, OK, USA, 2014. [Google Scholar]
  11. Gas Processors Association. GPA-2186: Method for the Extended Analysis of Hydrocarbon Liquid Mixtures Containing Nitrogen and Carbon Dioxide by Temperature Programmed Gas Chromatography; Gas Processors Association: Tulsa, OK, USA, 2014. [Google Scholar]
  12. KBC Advanced Technologies. Infochem Multiflash 7.0; Walton-on-Thames: England. 2018. Available online: https://www.kbc.global/software/advanced-thermodynamics/ (accessed on 14 October 2022).
  13. Aspen Properties V12; AspenTechnolgy Inc.: Bedford, MA, USA, 2021.
  14. PURE38 Databank, Aspen Properties; AspenTechnolgy Inc.: Bedford, MA, USA, 2021.
  15. AIChE DIPPR® Data Compilation Project; Aspen Properties: New York, NY, USA, 2022.
Figure 1. Block Diagram of a Typical LNG Plant.
Energies 16 00254 g001
Figure 2. Potential locations of HHC freeze-out in an LNG plant.
Energies 16 00254 g002
Figure 3. Average ratios of paraffin to isoparaffin mole fraction in each single carbon number pseudocomponent for each gas mixture type across the 46 gas samples analyzed in this work. The dotted line represents the fixed ratio assumed in the PINAAPI approach detailed by Miethe et al. [6].
Energies 16 00254 g003
Figure 4. Comparison of the melting temperatures calculated using various PINA freeze-out prediction methods at a pressure of 6.307 MPa (900 psig) with that based on the full compositional characterization of the lean gas sample.
Energies 16 00254 g004
Figure 5. Comparison of the melting temperatures calculated using various PINA freeze-out prediction methods at a pressure of 6.307 MPa (900 psig) with that based on the full compositional characterization for the rich gas sample.
Energies 16 00254 g005
Figure 6. Comparison of the melting temperature calculated using various PINA freeze-out prediction methods at a pressure of 6.307 MPa (900 psig) with that based on the Full compositional characterization for the average gas sample.
Energies 16 00254 g006
Table 1. Molecular weights and melting points of BTEX and heavy hydrocarbon compounds [3].
ComponentMolecular Weight (g/mol)Melting Point (°F)Melting Point (°C)
Benzene78.1+42+5.6
Toluene92.1−138.9−94.9
Ethylbenzene106.2−138.9−94.9
o-Xylene108.2+55.9+13.3
m-Xylene106.2−54.1−47.8
n-Hexane86.2−139.6−95.3
n-Heptane100.2−131−90.6
n-Octane114.2−56.8−49.3
n-Nonane128.3−53.5−47.5
n-Decane142.3−29.7−34.3
Table 2. Molecular weights and melting points of heavy hydrocarbons n-C11 through n-C14 [3].
ComponentMolecular Weight (g/mol)Melting Point (°F)Melting Point (°C)
n-Undecane (n-C11)156.3−14.0−25.6
n-Dodecane (n-C12)170.3+14.8−9.6
n-Tridecane (n-C13)184.4+22.3−5.4
n-Tetradecane (n-C14)198.4+42.5+5.9
Table 3. Molecular weights and melting points of heavy aromatic hydrocarbons [3].
ComponentMolecular Weight (g/mol)Melting Point (°F)Melting Point (°C)
1-Ethyl-2-propylbenzene (A11)148.25−5.8−21.0
Cyclohexylbenzene (A12)160.25945.27.4
Heptylbenzene (A13)176.302−54.4−48.0
Octylbenzene (A14)190.32−32.8−36.0
Table 4. Summary and comparison of the available methods of pseudocomponent melting point calculations in natural gas systems [6]. Here, Tf is the melting point temperature while Hf is the enthalpy of fusion.
MethodDescriptionProsCons
Full T f     and   H f are estimated for each component in the gas analysis.Accurate estimation of the melting temperature
  • Expensive
  • Difficult to obtain
Alkanes T f   and   H f of the respective n-paraffin are used for the entire PC. Rough   estimate   of   the   T f is obtained.
  • Calculated Tf is too conservative.
  • Calculated Tf is based on solubility date of binary systems and/or thermodynamic prediction models that are not totally validated against experimental or data.
  • PINA fractions are not distinguished.
Won T f   and   H f of the PC are used based on the average MW of the PC.Calculated properties are specific to each PC.
  • Optimistic calculated Tf
  • PINA fractions are not distinguished.
PINAEqualPCs are split into PINA fractions equally and represented by individual components.1.Fast Tf calculation.
2.Improved in precision compared to previous methods.
  • Calculated Tf is based on solubility date of binary systems and/or thermodynamic prediction models that are not totally validated using experiments or data.
  • Actual PINA fractions are not estimated.
PINAAPIPCs are split into PINA fractions according to API correlations and represented by individual components.Increased precision regarding solids precipitation behavior (with exception of full method)
  • The used API correlations are based on and developed for petroleum fractions.
  • The used API correlations estimate the PNA split not PINA. The PINA split is obtained for the unvalidated assumption that P = 90% I.
  • Not examined for PC higher than C9.
Table 5. Fully characterized composition of Sample 1 (Lean Gas).
Component x i mol % Component x i mol %
Carbon Dioxide0.0030n-Nonane0.0001
Nitrogen0.6454m-Xylene0.0001
Methane97.0391p-Xylene0.0001
Ethane2.0520sec-Butylbenzene0.0002
Propane0.1049n-Decane0.0001
n-Butane0.12201-Ethyl-2-propylbenzene0.0001
isoButane0.0151Undecane0.0001
n-Pentane0.0020Dodecane0.0002
isoPentane0.0040Pentamethylbenzene0.0001
n-Hexane0.0016Tridecane0.0005
Benzene0.00082,3-Dimethyldodecane0.0005
Cyclohexane0.00051-Ethylnapthalene0.0001
n-Heptane0.00042-Ethylnapthalene0.0001
Toluene0.0004C14+0.0064
n-Octane0.0001
Total100.0000
Table 6. Fully characterized composition of Sample 2 (Rich Gas).
Component x i mol % Component x i mol %
Carbon Dioxide0.00301n-Nonane0.0026
Nitrogen0.87838Ethylbenzene0.0021
Methane96.24016m-Xylene0.0000
Ethane2.21501p-Xylene0.0001
Propane0.08523o-Xylene0.00112
n-Butane0.210571,2,4-Trimethylbenzene0.00112
isoButane0.01103n-Decane0.00034
n-Pentane0.00201Undecane0.00018
isoPentane0.00301p-Diisopropylbenzene0.00001
n-Hexane0.00166Dodecane0.01982
Benzene0.000212-Methyldodecane0.0002
Cyclohexane0.00020Tridecane0.1675
n-Heptane0.000992,3-Dimethyldodecane0.01623
Toluene0.00015Cyclohexylbenzene0.0014
cis-1,3-dimethylcyclohexane0.000241-Ethylnapthalene0.0024
n-Octane0.001332-Ethylnapthalene0.0051
C14+0.1266
Total100.0000
Table 7. Fully characterized composition of Sample 3 (Average Gas).
Component x i mol % Component x i mol %
Carbon Dioxide0.00300n-Octane0.00010
Nitrogen1.63088n-Nonane0.05397
Methane94.17644Ethylbenzene0.00083
Ethane3.94729m-Xylene0.00074
Propane0.09593p-Xylene0.00074
n-Butane0.00600o-Xylene0.00092
isoButane0.002001,2,4-Trimethylbenzene0.00036
n-Pentane0.00000n-Decane0.00125
isoPentane0.00000Undecane0.00056
n-Hexane0.00054Dodecane0.00637
Benzene0.000042-Methyldodecane0.00011
Pentamethylbenzene0.00001
Cyclohexane0.00012Tridecane0.03504
n-Heptane0.000202,3-Dimethyldodecane0.00835
Toluene0.00004Cyclohexylbenzene0.00142
cis-1,3-dimethylcyclohexane01-Ethylnapthalene0.00168
2-Ethylnapthalene0.00305
C14+0.02202
Total100.0000
Table 8. Classification of the 46 gas samples evaluated by this work to develop the PINAAttalla method in accordance with their C6+ MW.
Gas TypeC6+ MW (g/mol)
Lean Gas87–92
Average Gas92–100
Rich Gas100–117
Table 9. Normal boiling point ranges used to classify single carbon number (SCN) pseudocomponents, as obtained from gas chromatography elution.
SCNNBP Range (K)NBP Range (°F)
C6322.04–347.04120–165
C7349.82–377.59170–220
C8380.37–408.15225–275
C9410.93–433.15280–320
C10435.93–447.04325–345
C11449.82–477.59350–400
C12480.37–505.37405–450
C13508.15–519.26455–475
C14+522.04–538.71480–510
Table 10. Average PINA distribution for each pseudocomponent in the Lean gas type. The mole fractions of paraffins, isoparaffins, naphthenics and aromatics are denoted x p , x i ,   x n and x a , respectively.
Pseudocomponent x p x i x n x a
C60.3790.62100
C70.1280.2330.1860.453
C80.09360.3640.1880.354
C90.1980.2050.2520.346
C100.1470.3120.1320.409
C110.1420.5620.07290.223
C120.3940.1850.004190.418
C130.6330.36700
C14+0.6740.1760.001760.148
Table 11. Average PINA distribution for each pseudocomponent for the average gas type. The mole fractions of paraffins, isoparaffins, naphthenics and aromatics are denoted x p , x i ,   x n and x a , respectively.
Pseudocomponent x p x i x n x a
C60.3740.62600
C70.1260.2610.1780.435
C80.1090.3720.1780.341
C90.2210.2160.2330.330
C100.1490.2990.1220.430
C110.1460.5270.06800.259
C120.4020.1850.003830.409
C130.6390.36100
C14+0.5980.2580.001550.142
Table 12. Average PINA distribution for each SCN for the rich gas type. The mole fractions of paraffins, isoparaffins, naphthenics and aromatics are denoted x p , x i ,   x n and x a , respectively.
Pseudocomponent x p x i x n x a
C60.3390.66100
C70.1180.4480.1440.290
C80.1860.4930.09390.227
C90.2810.3570.1080.253
C100.1600.1990.05110.590
C110.1700.2680.03530.526
C120.4430.2050.002150.350
C130.6880.31200
C14+0.6890.21700.0939
Table 13. Discrete compounds used by the PINAAttalla method to represent the paraffin, isoparafin, naphthenic aromatic (PINA) classes of single carbon number (SCN) pseudocomponents to C14, together with their normal boiling point (NBP), molecular weight (MW) and melting temperature T f .
SCNPINAComponent NameFormulaMWNBP (°F)NBP (K)Tf (°F)Tf (K)
C6C6-Pn-hexaneC6H1486.18155.7341.87−139.6177.82
C6-I2-methylpentaneC6H1486.18140.5333.43−244.9119.32
C6-NCyclopentaneC5H1070.14120.6322.37−136.9179.32
C7C7-Pn-heptaneC7H14100.2209.2371.59−131182.59
C7-I2-methylhexaneC7H14100.2194.1363.21−180.9154.87
C7-NCyclohexaneC6H1284.16177.3353.8743.8279.71
C7-ABenzeneC6H678.11176.2353.2642278.71
C8C8-Pn-octaneC8H18114.2258.2398.82−70.2216.37
C8-I2-methylheptaneC8H18114.2243.8390.82−164.2164.15
C8-Ncis-1,3-dimethylcyclohexaneC8H16112.2248.2393.26−104197.59
C8-ATolueneC7H890.14231.2383.82−138.9178.21
C9C9-Pn-nonaneC9H20128.3303.5423.98−64.3219.65
C9-I3-methyloctaneC9H20128.3291.6417.37−161.7165.54
C9-N1,1,2-trimethylcyclohexaneC9H18126.2293.4418.37−20.2244.15
C9-Ap-XyleneC8H10106.2281411.4855.9286.43
C10C10-Pn-decaneC10H22142.3345.5447.32−21.4243.48
C10-I2,3-dimethyloctaneC10H22142.3327.8437.48−65.2219.15
C10-NisobutylcyclohexaneC10H20140.27340.34444.45−102.5198.43
C10-A1,2,3,5-tetramethylbenzeneC10H14134.2388.4471.15−10.6249.48
C11C11-PUndecaneC11H24156.3384.6469.04−14247.59
C11-I3-ethylnonaneC11H24156.3351.48450.64−102.9198.21
C11-NPentylcyclohexaneC11H22154.3398.7476.87−71.5215.65
C11-A1-ethyl-2-propylbenzeneC11H16148.25393.71474.1−5.8252.15
C12C12-PDodecaneC12H26170.3421.4489.4814.8263.59
C12-I2,2,3,3-tetramethyloctaneC12H26170.3381.83467.5−46.9229.32
C12-NHeptylcyclopentaneC12H24168.3435.5497.32−63.7219.98
C12-ACyclohexylbenzeneC12H16160.26464.22513.2745.2280.48
C13C13-PTridecaneC13H28184.4455508.1522.3267.76
C13-I2-methyldodecaneC13H28184.36433.85496.4−14.8247.15
C13-NHeptylcyclohexaneC13H26182.35459.05510.4−22.9242.65
C13-AHeptylbenzeneC13H20176.3474.98519.25−54.4225.15
C14C14-PTetradecaneC14H30198.4488.3526.6542.5278.98
C14-I2,3-dimethyldodecaneC14H30198.4474.24518.84−69217.04
C14-NOctylcyclohexaneC14H28196.4490.73528−3.4253.48
C14-AOctylbenzeneC14H22190.32508.73538−32.8237.15
Table 14. Summary of the differences between the PINAAPI and the PINAAttalla methods.
AspectPINAAPIPINAAttalla
Reference CorrelationsPseudocomponents are split into PINA fractions according to API correlations.Pseudocomponents are split into PINA fractions according to new correlations developed by Attalla. based on 46 actual gas samples.
Representative ComponentsThe pseudocomponents are represented by individual components those are not necessarily have the highest freezing point for each PINA category.The pseudocomponents are represented by individual components those are either identified by the detailed gas chromatograph analysis, or conservatively assumed based on the highest freezing point that could be found as HHC over the NBP range defined for each pseudocomponent.
Basis of Reference CorrelationsThe used API correlations are based on and developed for petroleum fractions.The new correlations developed by Attalla are based on 46 actual pipeline gas samples collected from US Gulf Coast of Mexico.
Paraffins to Iso-paraffins RatioThe used API correlations estimate the PNA split not PINA. The PINA split is obtained for the unvalidated assumption that x i = 0.9   x p The new correlations developed by Attalla estimate the PINA split including the P to I ratio for each pseudocomponent based on 46 actual gas samples.
Range of PCsNot examined for pseudocomponents greater than C9.Examined up to C14+ which includes some of i-C15 and i-C16.
Gas ClassificationThe used API correlations are the same regardless of the richness of the gas.The new correlations developed by Attalla are categorized based on the richness level of the gas to Lean, Average, and Rich based on the molecular weight of the C6+ obtained from the GC analysis of the gas.
Disclaimer/Publisher’s Note: The statements, opinions and data contained in all publications are solely those of the individual author(s) and contributor(s) and not of MDPI and/or the editor(s). MDPI and/or the editor(s) disclaim responsibility for any injury to people or property resulting from any ideas, methods, instructions or products referred to in the content.

