Article

Computed Tomography Observation and Image-Based Simulation of Fracture Propagation in Compressed Coal

1
School of Energy and Mining Engineering, China University of Mining and Technology, Beijing 100083, China
2
Coal Industry Engineering Research Center of Top-Coal Caving Mining, Beijing 100083, China
*
Author to whom correspondence should be addressed.
Energies 2023, 16(1), 260; https://doi.org/10.3390/en16010260
Submission received: 1 November 2022 / Revised: 4 December 2022 / Accepted: 9 December 2022 / Published: 26 December 2022
(This article belongs to the Special Issue New Insights: Deep Exploitation of Coal-Based Energies)

Abstract

:
In this study, the fracture propagation characteristics and associated mechanisms of coal are investigated by using computed tomography (CT) observation and image-based simulation. The spatial distribution and the structural morphology of original fractures provide significant influences on the failure behavior of fractured coal. The fractures with small dip angles and large openings result in more-obvious fracture closure and stable propagation stages, while failure pattern is more sensitive to those with large dip angles. The coal tends to experience brittle failure, which transits from a splitting to mixed-splitting faulting mode because of the difference in original fracture distribution. The final failure fracture network originates mainly from the propagation of original fractures, driven by localized tensile stress. Fracture interaction and mineral influence tend to increase the complexity in the failure fracture network. Moreover, image-based numerical models are established on the basis of CT reconstruction, where the spatial distribution and the structural morphology of original fractures are properly considered. Numerical modeling reproduces similar stress–strain responses and failure fracture networks to that observed in the experiment. The predicted distribution of tensile stress shows a similar evolution trend to the failure fracture network, implying that the fracture propagation of coal is dominated by tensile failure. Shear cracks emerge mainly after the large fracture running through the coal sample has been formed.

1. Introduction

In underground coal mining, the miners and corollary equipment are surrounded by the exposed coal seam at the face area of the longwall panel. The seam commonly consists of various discontinuous structures, such as pores, fractures, and mineralized veins, drastically deteriorating seam integrity. Regarding the mentioned structural defects, the fractures result in the strength deterioration and mechanical anisotropy of coal and, thus, play an important role in promoting the coal failure process. As a result, face collapse occurs frequently at the face area after being exposed to mining-induced stress, seriously threatening the safety of the mining environment [1,2]. It has been widely accepted that both the material properties and the geometric characteristics of the pre-existing fractures provide significant influences on the mechanical behavior of coal [3]. If such influences are sufficiently investigated, mining and supporting methods can be reasonably designed for coal mines to improve the load-bearing capacity of coal, and, hence, the face stability would be effectively strengthened [4,5]. The progressive failure process of fractured coal and of other fractured sedimentary rocks has caught the attention of the mining engineering field.
Rock fracturing behavior was initially investigated with a relatively simple laboratory experiment [6,7,8,9]. On the basis of a uniaxial compression test conducted on rocks with shear fracture, the criteria for failure in both the rock matrix and the shear fracture were established [10,11]. The mechanical properties and the failure mode of rocks are significantly affected by the fractures. Such an influence is susceptible to the end-boundary conditions and confining pressure utilized in the experiment [12]. Because of the close relation between rock behavior and natural fractures, the International Society for Rock Mechanics suggested standard methods for testing fractured rocks [13,14]. Compression-induced fracture propagation in rocks is classified into two types: parallel growth with axial compression and shear sliding along the initial fracture surface [15,16]. By introducing several sets of fractures into the rock sample, axial splitting, shear faulting, local buckling, and mixed-splitting faulting are identified, which enriches the failure mode of compressed rock [17,18]. Fracture orientation and fracture spacing lead to obvious variation in the failure fracture networks of rocks, which is attributed to fracture interaction [19,20]. Compared with quasistatic loads, impact loads result in more-complex failure patterns in fractured rock [21]. Modern testing systems make it possible to investigate the failure behavior of fractured rock under more-complex stress environments [22,23,24,25,26]. A cyclic loading test indicates that the failure characteristics of fractured rock are strongly influenced by the frequency and magnitude of the cyclic load and the fracture orientation [27]. According to shear tests conducted on fractured rock masses, fracture propagation mechanisms are classified according to shearing, buckling, mixed shearing and sliding, and tensile failure accompanied by the rotation of rock blocks, in an order starting from high shear strength to the low shear strength [28,29]. In addition, the impact pulsing method helps to identify a representative element volume for hard rocks. The relation between the informative parameters of impact pulse and the mechanical properties of rocks is established [30]. Recently, acoustic emission (AE), digital image correlation (DIC), and computed tomography (CT) techniques provide more-accurate ways of analyzing fracture propagation. Microcracks nucleating in rock can be properly characterized by the AE count, AE energy, and AE location. The AE signal presents fractal characteristics, and the fractal dimension declines with the increase in the number of microcracks [31,32,33]. In addition, the relation between elastic deformability and the AE source parameters of rocks is achieved [34]. Stressed rock commonly experiences four deformation stages: uniform deformation, localized deformation, weak zone formation, and fracture development. Such a deformation process can be captured by DIC observation, providing crucial precursors for fracture development in rock [35,36,37,38]. CT scanning is effective in detecting the continuous evolution of spatial fracture networks in rock. The location, number, and structural morphology of failure fractures can be precisely recorded, presenting more valuable information on fracture propagation mechanisms in rock [39,40,41,42]. For example, the coal cleat network evolution of the loading process has been analyzed at the pore scale. Moreover, the discrete fracture network (DFN) model is developed on the basis of a stochastic analysis on CT images, which helps to evaluate coal permeability, hydraulic conductivity, and gas diffusivity in rock materials [43,44,45].
Because of the fast development of computational techniques, numerical simulation has emerged as a useful supplement for laboratory experiments in analyzing rock-fracturing behavior. Given the experimental data and fracture mechanics, a series of continuum-damage models have been proposed for simulating rock-fracturing processes [46,47,48,49]. In continuum models, pre-existing defects are characterized by material heterogeneity [50,51,52,53]. Multiscale simulations on rock failure processes have been carried out. That means micropores and macrofractures in rocks are taken into account in such models [54,55]. Though the macroanisotropy of fractured rock can be properly captured, such models fail to reproduce rock-fracturing processes in a realistic way. Only the stress–strain response is underlined as being comparable with experimental results. Such a limitation restricts their application in engineering problems where fracture development stands as the major concern. By describing initial fractures with a stochastic distribution, fracture length and fracture orientation are considered in the modified continuum models [56,57,58]. The propagating path of the fracture can then be properly reproduced to match what is observed in the laboratory. However, the spatial distribution and the structural morphology of the original fractures are unrealistically simplified in such models. In contrast, the discrete element method (DEM) explicitly simulates rock-fracturing behavior without using the complex constitutive model. However, the disk and square elements involved in the early DEM models fail to characterize the complex geometry of rock grain, and, hence, the strong interlocking effect between the irregular rock grains is underrated in such models. In order to characterize microdefects in the grain scale, a grain-based model (GBM) has recently been proposed by introducing Voronoi tessellation into the DEM [59,60,61,62]. The GBM greatly improves the modeling accuracy of studying fracture propagation within intact rock. It has, moreover, been extended to investigate the fracturing behavior of fractured rock by incorporating DFN logic [63]. A DFN represents a set of fractures achieved by a geological mapping technique. Stochastic description of the fractures is also used in generating the DFN, similarly to that adopted by continuum models. If the fractures are installed with appropriate DFN, the scale effect and orientation anisotropy of fractured rocks can be properly characterized. Through the use of the modified models, the influences of the loading path, mechanical properties, original fracture distribution, and grain characteristics of rock-fracturing behavior have been extensively studied [64,65,66]. In addition, the mineralized veins of rock can also be simulated by combining the GBM with the DFN. The veins result in a higher stress threshold, helping to identify the transition from a stable to an unstable fracturing stage for veined rock [67,68].
In deep coal mining, rock instabilities present an increasing trend due to the development of new fractures in the coal seam. If propagation characteristics and associated mechanisms are properly revealed, support measures can be designed reasonably and rock stability can be strengthened effectively. However, previous CT-based studies on rock failure mainly focus on the mode of fracture propagation. The underlying mechanisms are commonly analyzed qualitatively. In order to remove this limitation, this study tries to develop a numerical model based on CT investigation, with which stress evolution around the fracture network is identified. Such a combination of experimental and numerical methods helps to reveal fracture propagation mechanisms properly. The main contents of this study are presented as follows. Coal samples collected from a kilometer-deep coal mine are first prepared for a uniaxial compression test. Compression-induced propagation of the pre-existing fractures is observed directly with a CT scanning technique. Based on CT reconstruction, a novel image-based method is proposed for numerical modeling. Spatial distribution and structural morphology of original fractures are taken into account in the established model. The new model realistically reproduces both deformation behavior and fracture propagation pattern of fractured coal. That means that the new modeling method has significant potential in further analyzing fracture propagation under more complex stress environments. In addition, main findings of this study may be implemented in other geological conditions, such as in coal seams with menthane gas. If the failure fracture network in a coal seam is revealed properly, the parameters of a gas extraction borehole, such as location, length, and diameter, can be reasonably designed, which helps to improve gas extraction efficiency.

2. Experimental Procedures

2.1. Sample Preparation

The coal blocks are collected from Kouzidong coal mine, which reaches a kilometer in depth and is located in the Anhui Province, China. Due to large cover depth, original fractures are well-developed in the coal seam. As a result, longwall face failure occurs frequently after being exposed to mining induced stress. Both large blocks and small flowing fragments are observed at the face area. Such variation in the failure pattern is attributed to well-developed fractures. In order to realize a reasonable design of rock reinforcement at the face area, the influence from the pre-existing fractures on failure behavior of fractured coal should be sufficiently revealed. Thus, cylindrical coal samples are drilled from the large blocks in the laboratory. The sample diameter and height are 50 and 100 mm, respectively. The influence of persistent fractures on coal failure behavior has been thoroughly researched [69,70,71]. This study mainly focuses on the influence of non-persistent fractures, which also play an important role in dominating progressive failure process of coal. Three coal samples displayed in Figure 1 are tested in this study. Although no visible surface fractures are observed, it is inevitable that non-persistent fractures are involved in the prepared samples due to the development of pre-existing fractures in the coal seam of Kouzidong mine. The prepared coal samples are numbered as N1, N2, and N3.

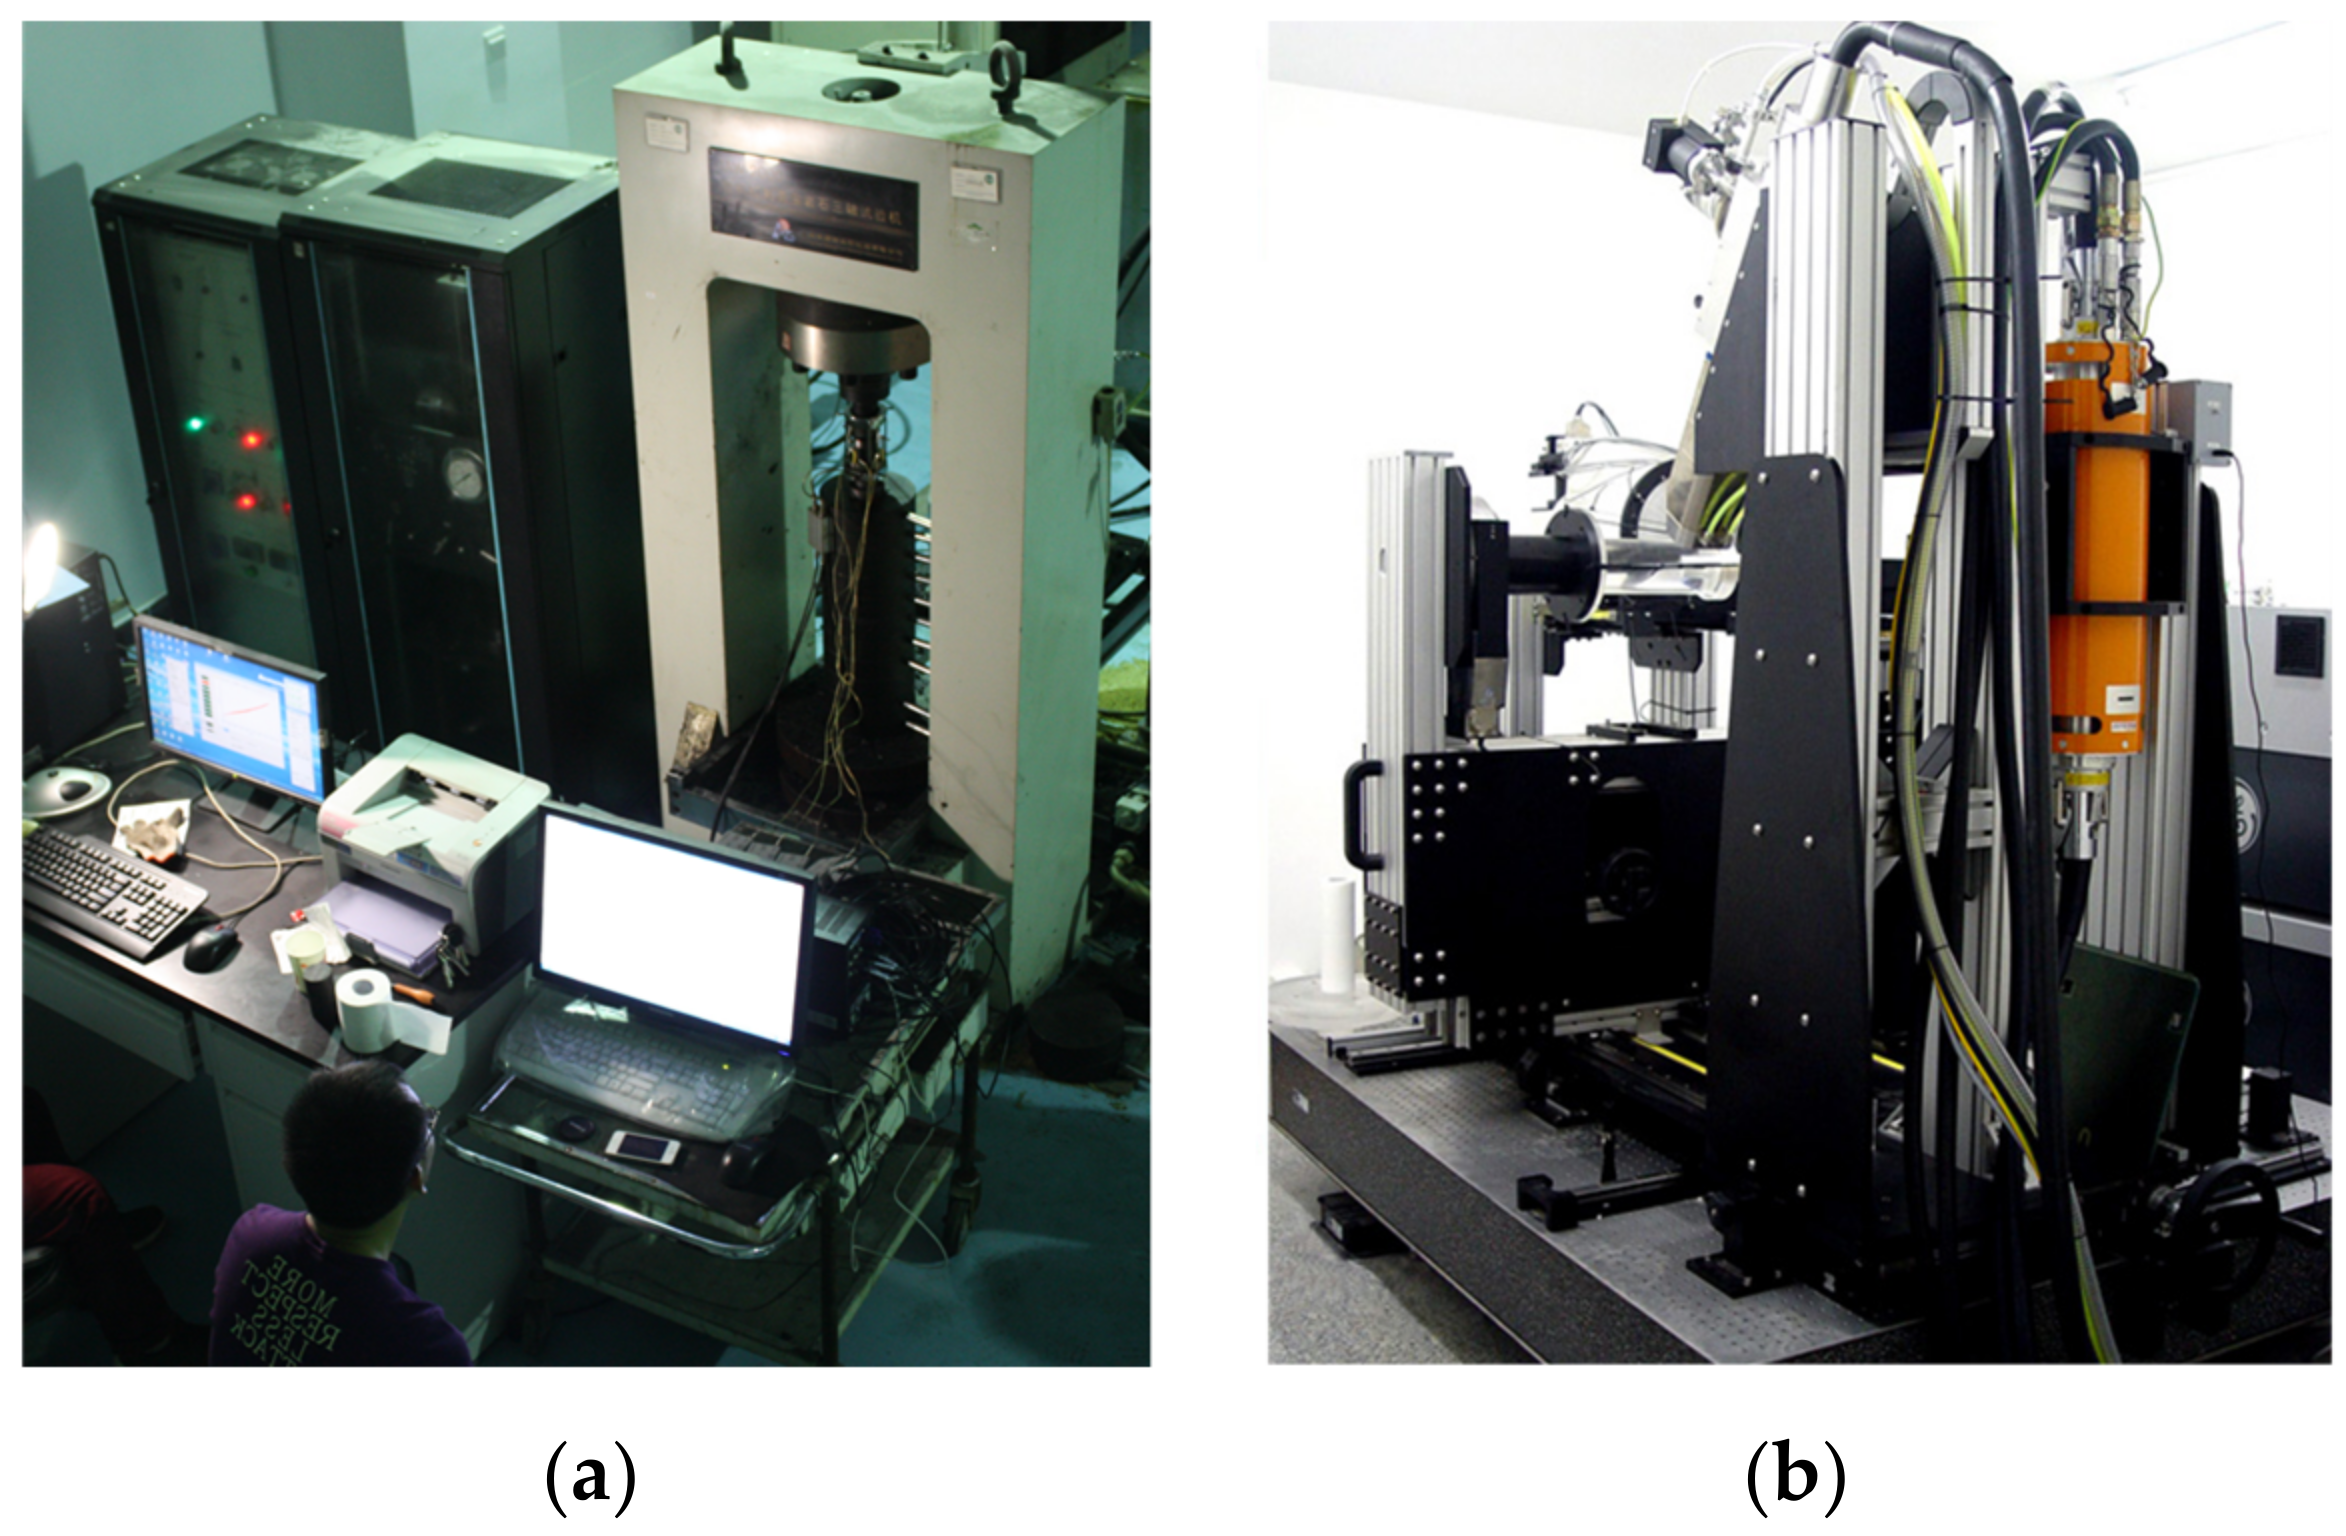
2.2. Testing and Monitoring Methods

In order to observe the propagation path of the pre-existing fractures directly, the prepared coal samples are tested under uniaxial compressive condition. The tests are carried out on a TAW3000 rock mechanics testing machine incorporating a CT observation, as shown in Figure 2. The high rigidity and servo-controlled testing machine has a loading capacity of 800 KN. Both stress- and strain-controlled loading methods can be realized in the loading process. The latter method is utilized in the present study and the utilized loading rate is 0.2 mm/min. The ACTIS300-320/225 X-ray CT scanner is applied to observe the distribution of non-persistent fractures in the tested coal samples and their propagation pattern. Spatial resolution of the CT scanning system reaches 5 μm. The coal sample is scanned two times before and after the uniaxial compression test, respectively. The former scan aims to achieve spatial distribution of original fractures, and the latter scan is to observe final failure fracture network. In each scanning process, 1000 slices of CT images are obtained at an interval of 0.1 mm in axial direction of the prepared coal sample.

3. Experimental Results

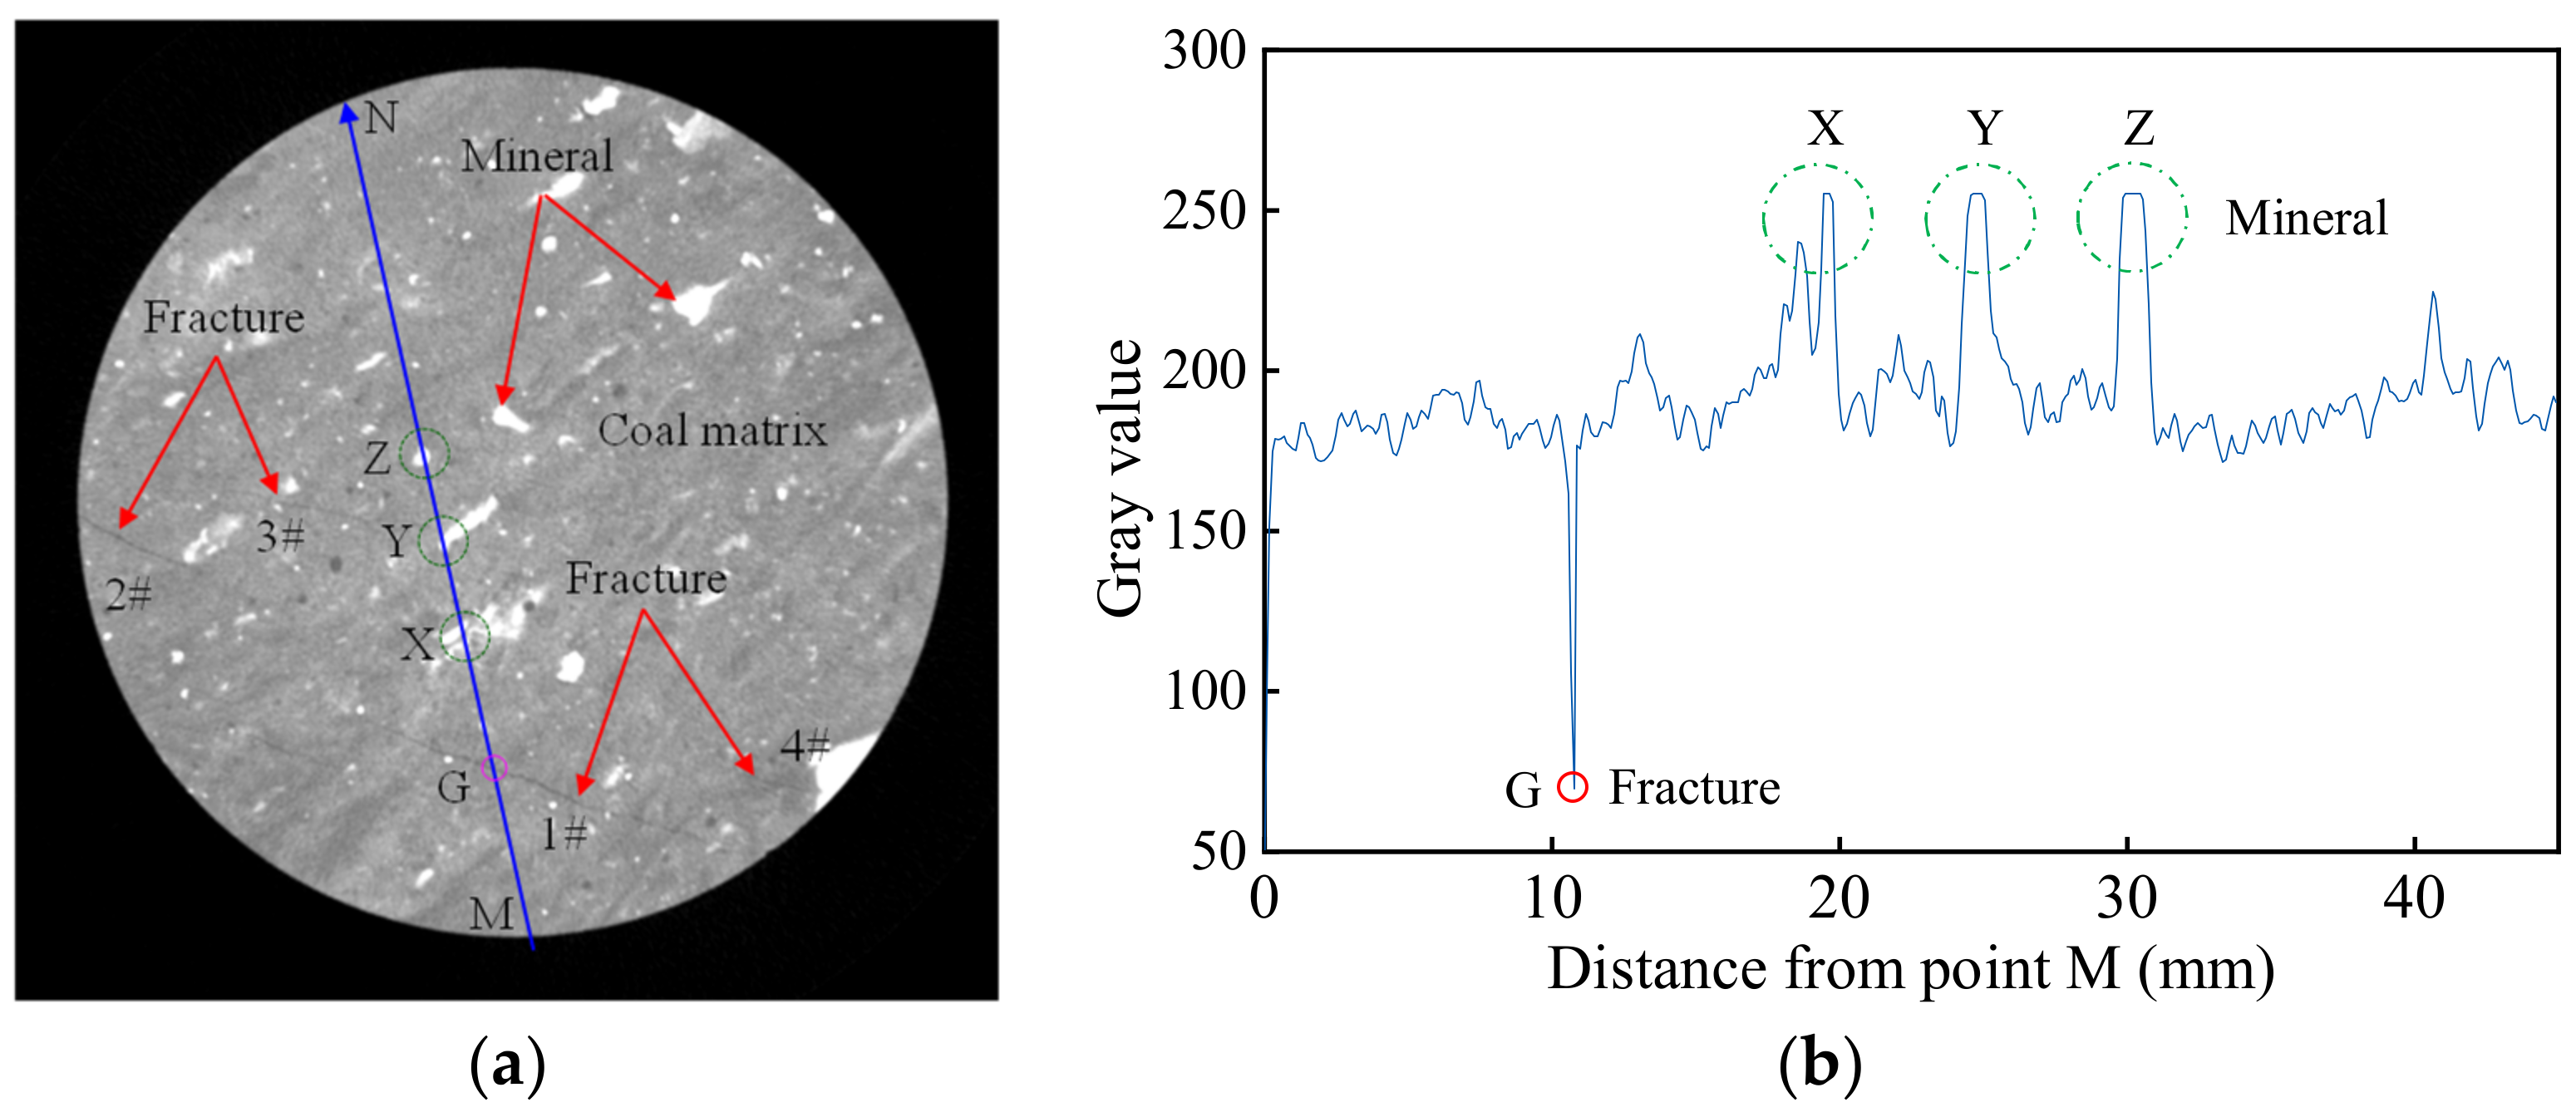
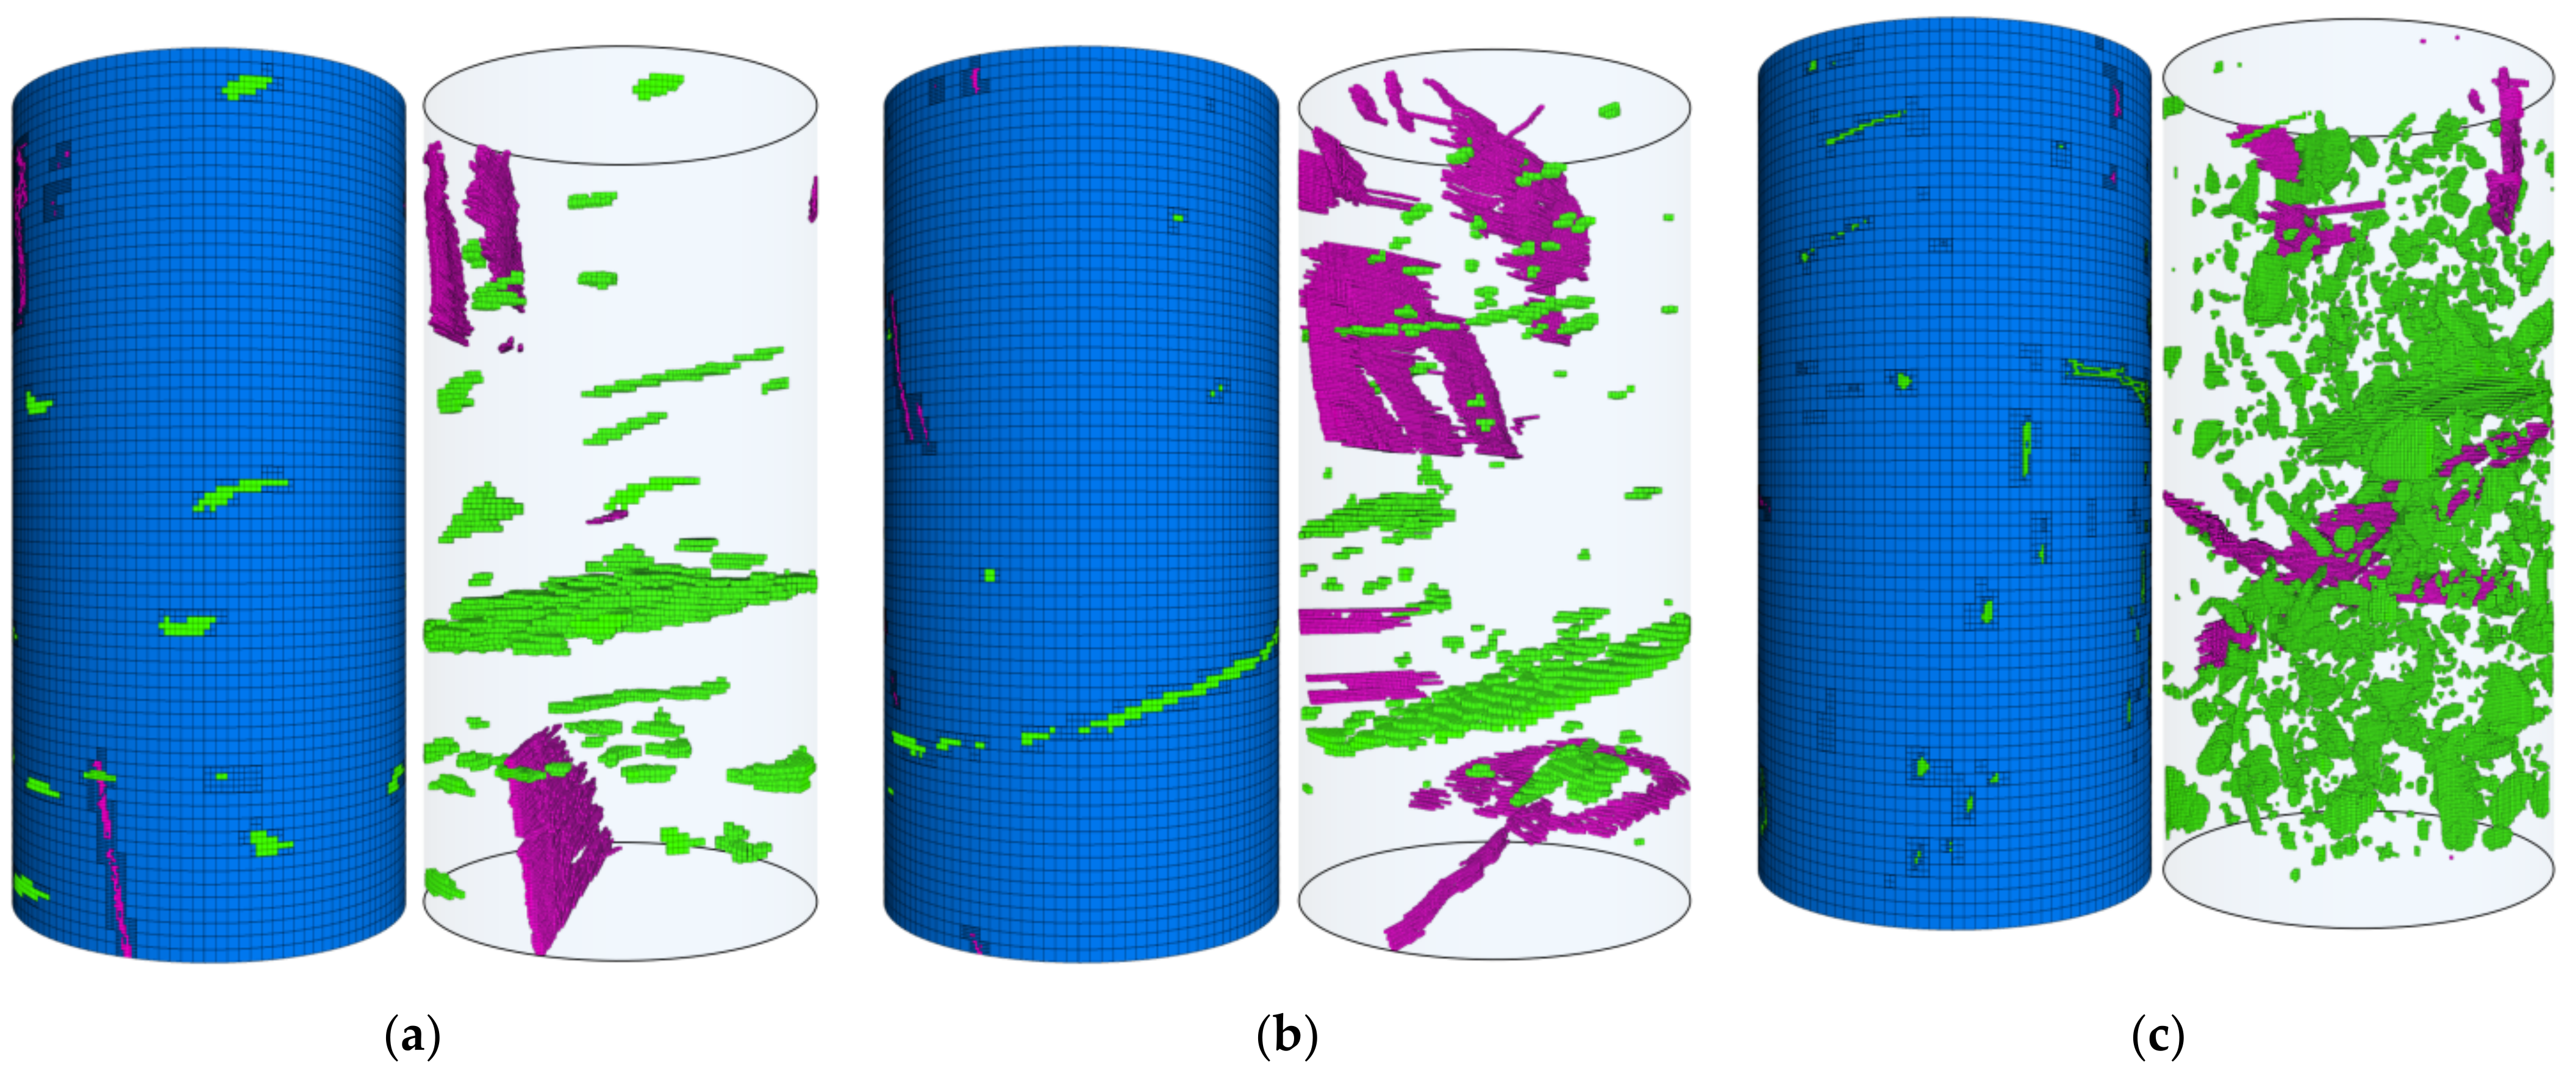
3.1. Spatial Distribution of the Original Fractures

One typical CT image achieved before the uniaxial compression test is shown in Figure 3a. In the CT image, the brightness is positively related to the density of the scanned object. This implies that different constituents of the coal sample can be easily distinguished. In addition to the coal matrix, both original fractures and mineral inclusions are included in the scanned sample. There are four closed fractures intersecting with the slice image. The mineral inclusions scatter across the image. Only the intersection curve between the fracture plane and the slice image can be observed in Figure 3a. Such information is not enough to demonstrate the geometric characteristics of original fractures involved in the coal sample. In order to overcome this limitation, the gray value of CT images is analyzed. As shown in Figure 3b, the distribution of the gray value along line MN in Figure 3a is achieved. A very low gray value is assigned to the intersection point (G) between the line and the fracture while relatively high values are assigned to the intersection points (X, Y, Z) between the line and mineral inclusions. Based on the gray value, original fractures and mineral inclusions can be easily distinguished in the CT image, and the left region of the slice image is then identified as the coal matrix.
By overlaying the obtained 1000 slice images along the axial direction of the tested coal sample, the spatial distribution of the fractures and mineral inclusions is reconstructed and shown in Figure 4. There are four non-persistent fractures and a layer of minerals existing in sample N1. At the top end, the parallel fractures (1# and 2#) are nearly in a vertical direction. Dip angles of 3# fracture and the mineral layer are about 75° and 15°, respectively. The size of 4# fracture, with a dip angle of about 80°, is relatively small. In sample N2, two fractures (1# and 2#) near the top end, with dip angles of 60° and 70°, respectively, are significantly larger than the bottom 3# fracture. There are three clusters of small fractures, circled by the dash line, being involved in sample N2. In addition, there is a layer of minerals located at the bottom section of sample N2, whose dip angle reaches about 30°. In addition to the mineral layer, there are many minerals with small size scattering in samples N1 and N2. In sample N3, two large fractures (1# and 2#), with dip angles of about 20° and 45°, respectively, intersect with each other at about the middle section of the sample. Near the top end, there are a vertical fracture (3#) and a cluster of small fractures, which are circled by the dash line. The volume of mineral inclusions in sample N3 is significantly larger that in samples N1 and N2. The large composition of mineral inclusions dramatically deteriorates the sample integrity.

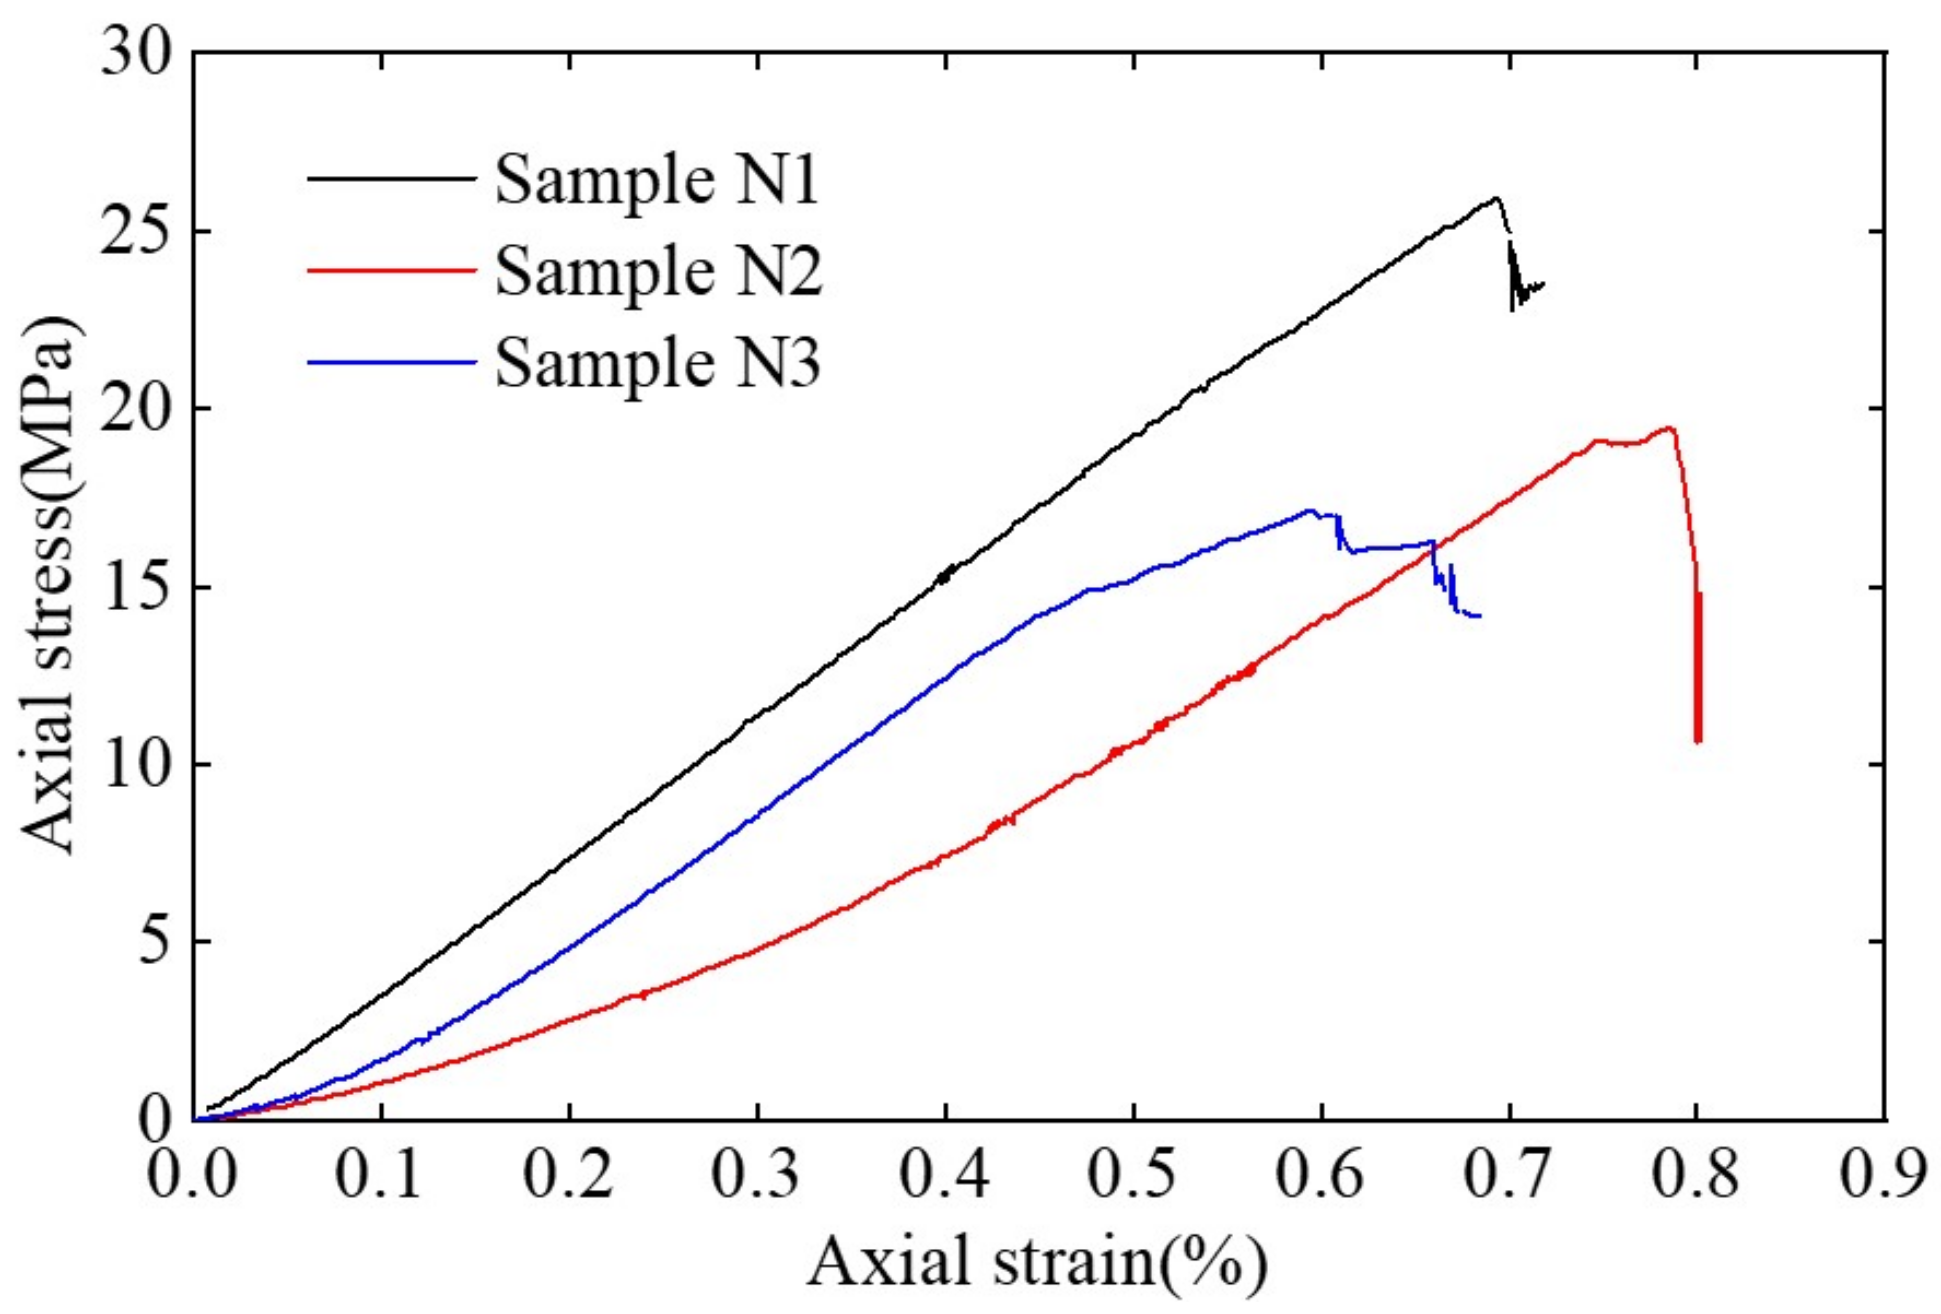
3.2. Stress–Strain Responses of Fractured Coal Sample

After the first CT scanning, a uniaxial compression test is conducted on the prepared coal samples. The stress–strain responses observed in the loading process are presented in Figure 5. Due to the existence of original fractures, the stress–strain diagram of coal sample experiences an initial concave process. It is commonly referred to as the fracture closure stage. As plotted in Figure 4, the dip angle of the original fractures in sample N1 is larger than that in samples N2 and N3. Closure behavior of the fracture with large dip angle is relatively insusceptible to compressive stress. Thus, the fracture closure stage in sample N2 and N3 is more obvious than that in sample N1. After the concave stage, the stress–strain curve becomes nearly linear, which is commonly denoted as the elastic deformation stage. In this stage, continuous deformation would not produce irreversible changes in the interior structure of the sample. The elastic stage ends when axial stress increases to the initial yield strength. Then, the stress–strain curve deviates from the linear stage and evolves into a convex region. This region is denoted as the strain-hardening stage, indicating that non-persistent fractures start to propagate in the sample. However, the propagation behavior is stable, so that the sample remains intact in this stage. The strain-hardening behavior is most obvious in sample N3, followed by that in sample N2. It is indistinctive in sample N1. Such variation in the hardening behavior is attributed to the differences in spatial distribution and structural morphology of original fractures. In fact, original fractures with a small dip angle and large opening result in more obvious fracture closure and stable propagation stages in compressed coal. When the peak value is reached by the axial stress, the fractures begin to propagate unstably, causing the onset of post-failure behavior. The quick propagation of the fractures leads to brittle failure of the coal sample. Note that the loading process is stopped simultaneously when the intersection between failure fracture and sample surface is observed. At the referred point, the sample still has certain load-bearing capacity while the failure fracture network is well-developed, which is convenient to conduct CT observation after failure. According to Figure 5, tangent modules, secant modulus, initial yield strength, and uniaxial compression strength (UCS) of the tested coal samples are calculated and summarized in Table 1.

3.3. Fracture Propagation in 2D CT Images

A series of typical CT images are presented in Figure 6. The first row represents the sample state before the uniaxial compression test and the second row represents the sample state after failure. The top and bottom images are achieved by scanning the same slice of the tested coal samples, which is located at 30 mm below the top end. According to the first row of CT images, the sample slice presents a favorable circular shape, consistent with the standard cylindrical coal sample shown in Figure 1. The proportion occupied by mineral inclusions becomes increasingly larger from sample N1 to N2 and finally to N3. That means sample N1 is more homogeneous compared to the other two samples. Only the intersection between 2# fracture in sample N1 (Figure 4a) and the sample slice can be identified in Figure 6(a1). There are four non-persistent fractures existing in the slice of sample N2 as shown in Figure 6(a2). It can be determined that 1-1# and 1-2# fractures are the intersection between the sample slice and 1# fracture displayed in Figure 4b. The size of 4# and 5# fractures is so small that they are not considered in 3D reconstruction of the original fractures. As a result, they are invisible in Figure 4b. According to Figure 6(a3), there is no original fracture existing in sample N3, but this sample is obviously stratified. Such differences between the tested coal samples indicate a spatial variation in structural geometry and material property of coal is a common phenomenon.
After the uniaxial compression test, failure fractures are well-developed in coal samples, as shown in the second row of CT images. Overall, the failure fracture network in samples N2 and N3 is more complex than that in sample N1. Such difference is attributed to the strong interaction between original fractures in samples N2 and N3. The high content of mineral inclusions may also contribute to the complexity in the failure fracture network. Another interesting finding is that the fracture opening tends to become smaller as bifurcation phenomenon occurs in the propagation process of the failure fractures. This phenomenon can be explained with the energy theory. The released strain energy serves as the main power source for driving fracture propagation in the compressed coal. After fracture bifurcation, the released energy is used for stimulating the propagation of the new fracture branches simultaneously. Thus, the energy consumed by each fracture branch is drastically reduced, causing the shrinkage in the fracture opening. The slice image indicates the coal sample is obviously enlarged in radial direction, causing onset of volumetric dilation. However, the deformation in the fractured coal sample is not uniform due to localized fracture development. Compression induced fracture propagation characteristics in each slice image are analyzed in detail in the following content.
In sample N1, the opening of 2# fracture is enlarged by the compression, as shown in Figure 6(a2). Due to the small distance to the sample surface, slight propagation of 2# fracture quickly leads to surface slippage of sample N1. However, its influence on sample failure pattern is weak. At about 13 mm inward of the 2# fracture, a large fracture (1-1#) is newly formed, which is approximately parallel with the 2# fracture. Sample N1 is completely broken through by the new fracture. At point A, the new fracture propagates along the boundary of mineral inclusion. The change in propagation direction is so quick that the new fracture is split into two branches. According to the 3D distribution of the original fracture displayed in Figure 4a, it can be concluded that the 1-1# fracture is formed by the propagation of the 1# fracture.
Due to the compression induced fracture propagation in sample N2, the bifurcation phenomenon appears at the left tip of the 1-1# fracture, as shown in Figure 6(b2). One branch propagates in the direction perpendicular to the initial fracture surface from point A. After a short propagation process, the propagation direction becomes nearly parallel with the initial fracture surface again. Parallel propagation continues until this branch intersects with the sample surface. Another branch propagates directly along the initial fracture trace. It bifurcates again at point B. The new branches intersect with the fracture branches extending from the right tip of the 1-2# fracture at points C and D, respectively. The coalescence of the 1-1# and 1-2# fractures results in the appearance of the penetrating fracture in sample N2. Regarding the 4# and 5# fractures, the wing crack initiates at their end tips. Such cracks propagate along the major principal direction. However, the propagation is not sufficient and, thus, the crack size is relatively small. The wing of the 4# fracture intersects with the 1-1# fracture at point O. The left wing of the 5# fracture intersects with the 1-2# fracture at point E. The right wing intersects with a new large fracture at point F, which is formed by the propagation of the 2# fracture displayed in Figure 4b. The propagation paths of the 3# and 4# fractures are obviously influenced by the 1# and 2# fractures. In fact, the propagation of small fractures is inhibited by both the destressing and stress shadow effects resulted from large fractures. Due to the roughness of the large fracture surface, local stress discontinuity appears on two sides of the fracture surface, causing a sudden stress drop. The destressing effect prevents fracture propagation by decreasing tensile stress localized in the compressed sample. The increase in the minor principal stress within the stress shadow area neutralizes the tensile stress localized around the fracture tip. In addition, the fractures tend to propagate along the boundary between the mineral inclusions and coal matrix when mineral inclusions are encountered in the propagation path.
Regarding sample N3, three large fractures are observed in the slice image after failure as shown in Figure 6(c2). The propagation of the 1# fracture, displayed in Figure 4c, causes the appearance of the 1-1# fracture in the slice image. At point A, the propagation of the 1-1# fracture is greatly influenced by mineral inclusions. Thus, it is split into several branches at this point. The branches mainly propagate along the boundaries between the coal matrix and mineral inclusions, where tensile strength is relatively small. Such a propagation mode makes them reach the sample surface easily. The appearance of the 2-1# fracture is a result of the growth of the 2# fracture displayed in Figure 4c. This fracture initiates at point B and propagates inward in the sample. At point C, it is split into two branches. One branch grows along the stratified plane until the sample surface is reached. Another branch runs into the area with many mineral inclusions. At this stage, the released energy is so large that the fracture can break through the mineral inclusions with a relatively small size. At point D, this branch fracture bifurcates again. One branch demonstrates propagation toward the 1-1# fracture, but the fracture opening is so small that it is difficult to be identified. Another branch propagates along the original orientation until a mineral inclusion is reached at point O. Most of the released energy has been consumed in the previous propagation process, so that this branch fails to break through the mineral inclusion located at point O. Thus, its propagation orientation becomes parallel with the stratified plane for reducing energy cost. Fracture growth remains in this orientation until the sample surface is reached. The propagation of the 3# fracture in Figure 4c leads to the existence of the 3-1# fracture in the slice image. Similarly to the 1# fracture in sample N1, the distance between the 3# fracture and the sample surface is so small that its propagation stops quickly because of the occurrence of surface slippage.

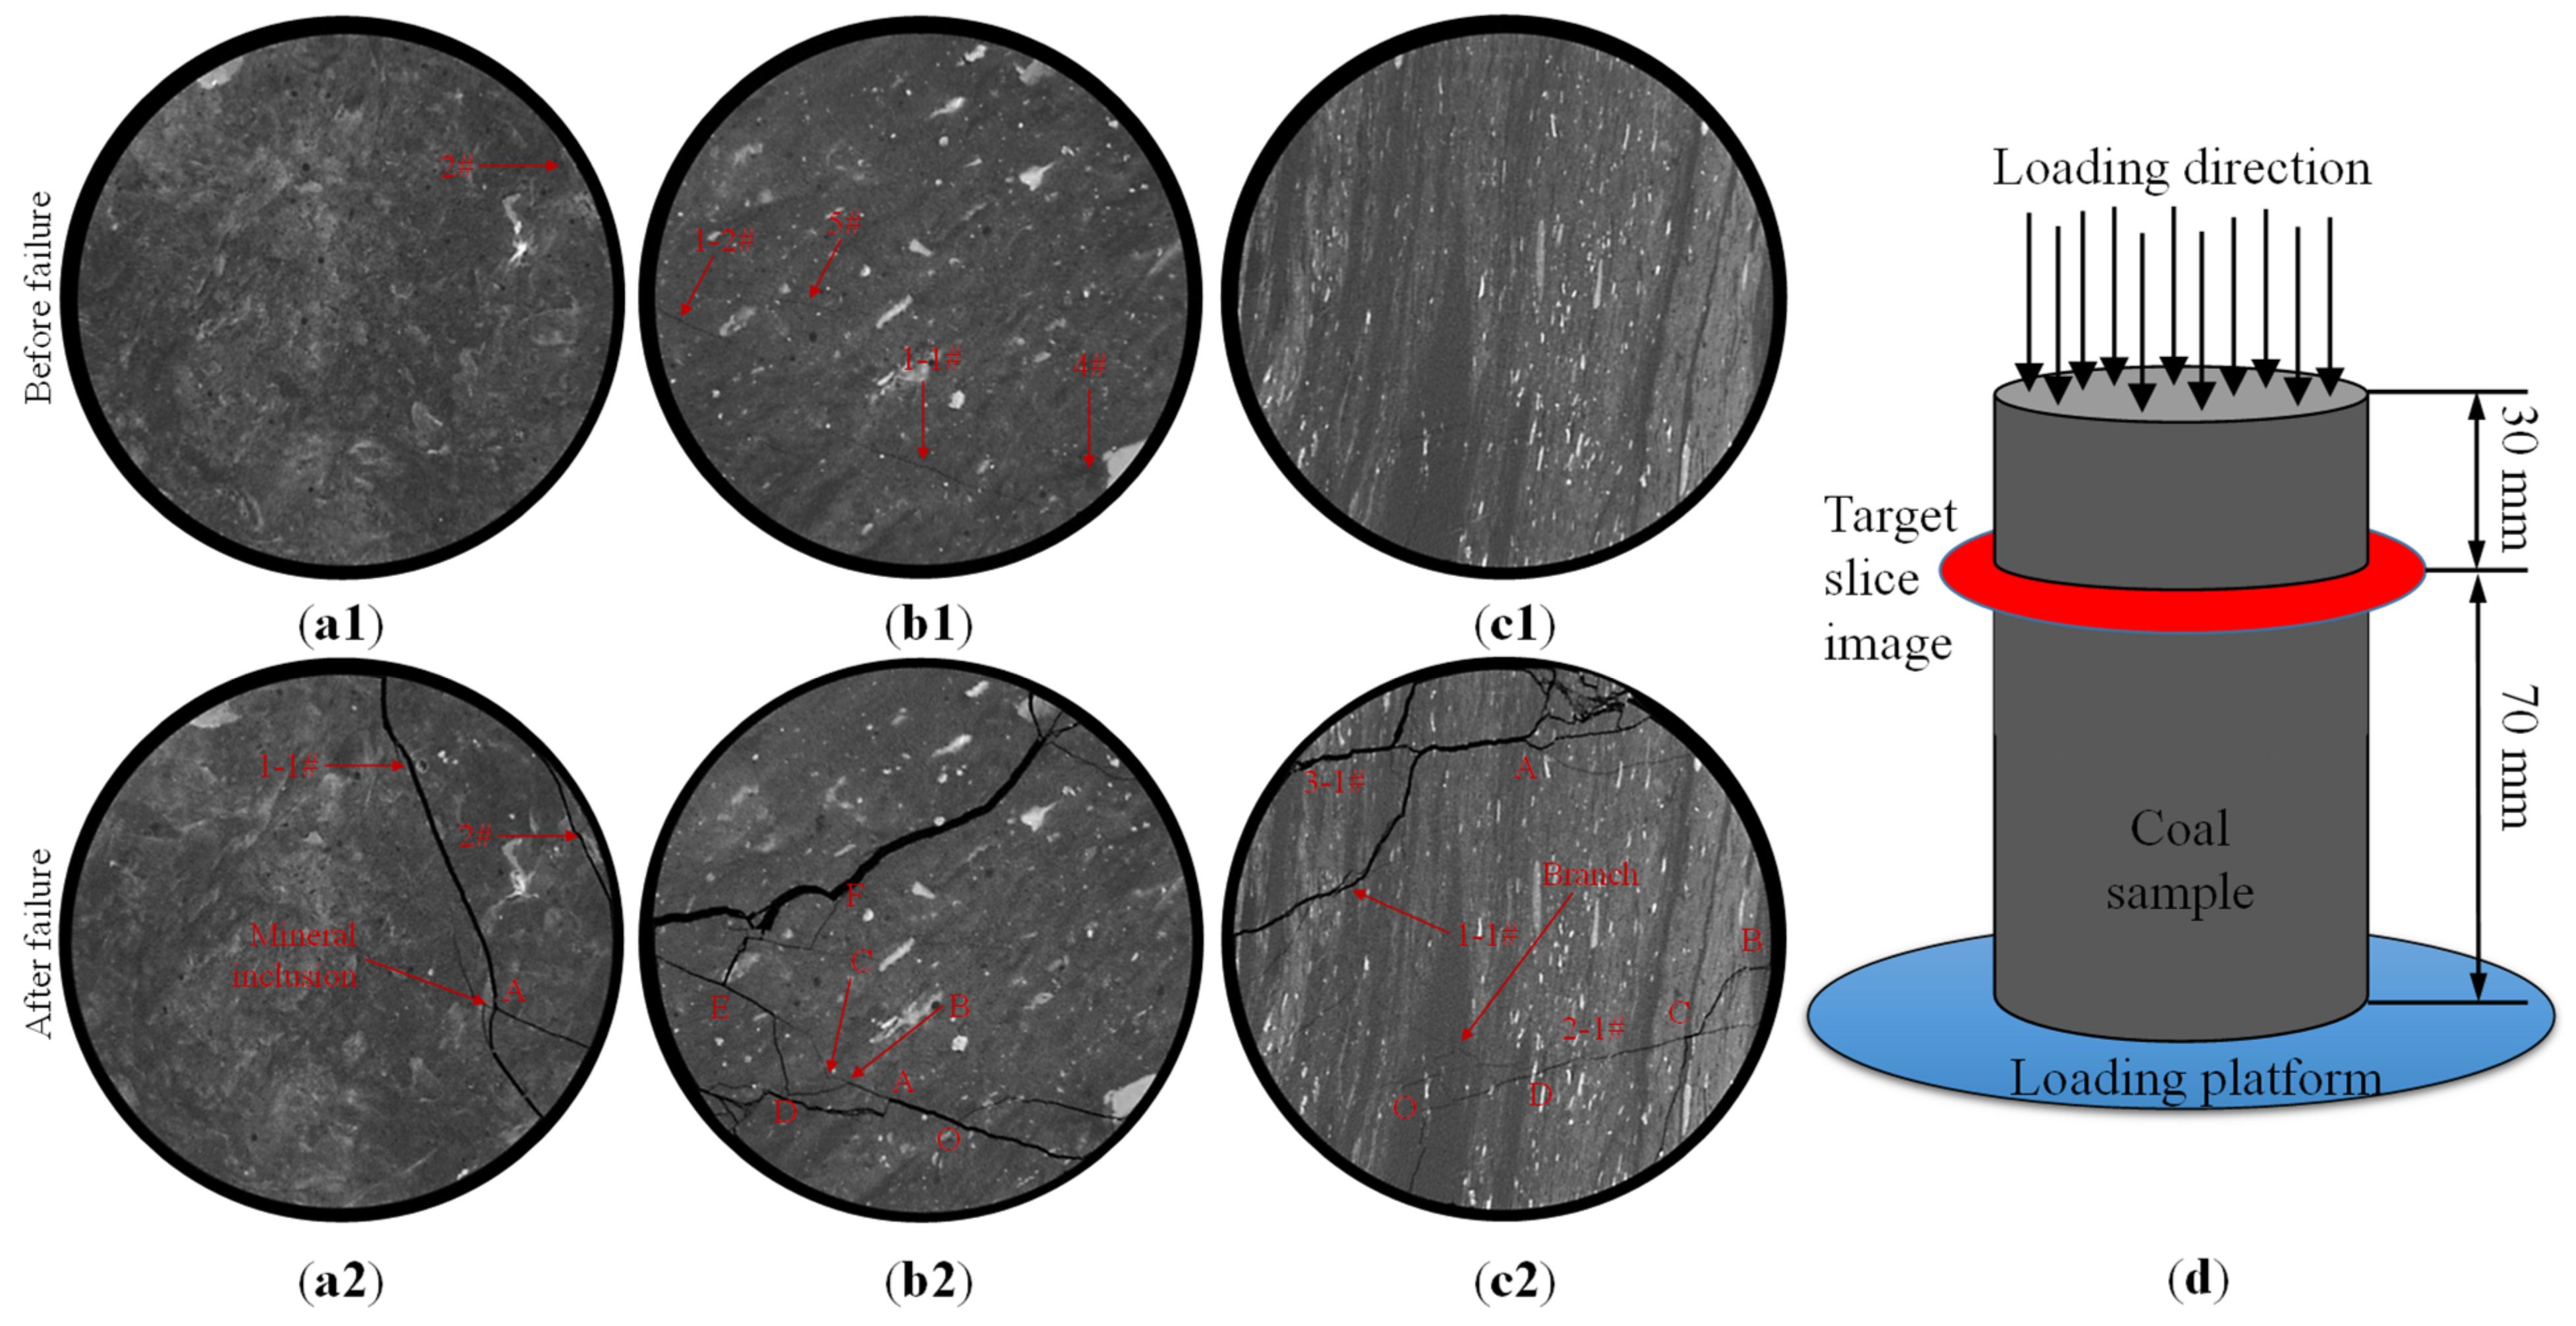
3.4. Spatial Distribution of 3D Failure Fractures

In 2D CT scanning images, only the fracture traces intersecting with the slice plane of the fractured coal sample are displayed and analyzed. Such information is not enough to investigate the fracture propagation characteristics in stressed coal. In order to overcome this limitation, spatial distribution of 3D failure fracture network is moreover reconstructed and displayed in Figure 7. The view direction is consistent with that presented in Figure 4. It is obvious that original fractures propagate sufficiently under the uniaxial compressive condition.
According to Figure 7a, axial splitting failure occurs in sample N1, where the 1# fracture directly propagates toward the bottom end of the sample along a vertical direction. The top edge of the 2# fracture propagates to the top end of the sample while the propagation of bottom edge is restricted due to stress shadow effect induced by the 1# fracture. At the bottom section, a cluster of small fractures appears and centralizes around the mineral layer. In respect to the 3# fracture, it initially propagates upward along its surface. When the mineral layer is reached, the propagation direction becomes parallel with the 1# fracture. At about 25 mm above the mineral layer, the propagation of the 3# fracture is inhibited by the stress shadow effect provided by the 1# fracture. In the horizontal direction, the 1# and 3# fractures extend significantly until the sample surface is reached. Their horizontal propagation kept in parallel with original fracture surface. The smallest 4# fracture remains stable in the loading process. At the left bottom, several inclined fractures occur due to the concentration of the compressive stress, causing slippage of the sample surface.
In sample N2, fracture propagation becomes more complex, as shown in Figure 7b. Horizontal propagation of the 1# fracture is similar with that observed in sample N1. In the vertical direction, it propagates along the original fracture surface. In the vicinity of the mineral layer, a new fracture is formed, which has the same inclination angle with the mineral layer. The new fracture causes the change in the propagation path of the 1# fracture, which deviates from the initial direction and rotates approximately toward the vertical direction. After passing through the mineral layer, the propagation of the 1# fracture is quickly stopped. In respect to the 2# fracture, its propagation in horizontal direction forms a curve surface. The large fracture trace in Figure 6(b2) is the intersection between this fracture and the slice image. The bottom edge of the 2# fracture initially propagates in a vertical direction, forming a splitting surface. At about 25 mm above the mineral layer, its propagation direction becomes parallel with the 1# fracture. The propagation is completely inhibited at 8 mm above the mineral layer under composite influences of the 1# fracture and the new fracture around the mineral layer. In addition, two large wing fractures appeared between the 1# and 2# fractures, leading to the connection of referred fractures. The intersection between the wing fractures and the slice image forms the fracture trace between points E and F in Figure 6(b2).
The most complex failure fracture network is formed in sample N3 after the uniaxial compression test, as displayed in Figure 7c. In horizontal direction, the 1# and 2# fractures propagate to the sample surface quickly. The vertical propagation path of the 1# fracture is similar with that observed in the stressed rocks with internal fracture [72]. The wrapping wing fractures almost synchronously appear at both top and bottom edges of the 1# fracture. When the axial load rose to the peak value, wrapping wing fractures propagate unstably along the loading direction until end boundary of the sample is reached. At the top edge of 2# fracture, a vertical splitting fracture is directly formed, causing slippage of the coal sample. The propagation of bottom edge of 2# fracture is inhabited under the influence provided by the 1# fracture. Regarding the 3# fracture, it propagates downward vertically and penetrates through the 1# fracture surface until the bottom edge of the 2# fracture is reached. In horizontal direction, the 3# fracture extends slightly and quickly intersects with the 1# fracture and the sample surface. Due to large volume of mineral inclusions, propagation path of the fractures in sample N3 is not as smooth as that observed in samples N1 and N2. Such characteristics greatly increased the complexity of the failure fracture network.
Comparing Figure 7 with Figure 4, structural morphologies of the failure fractures are different to that of original fractures. The failure fracture network becomes increasingly complex from sample N1 to N2 and, finally, to N3, which is caused by the differences in spatial distribution and structural morphology of original fractures. The fracture with a large dip angle tends to dominate the failure process, causing a splitting failure of the coal sample. In this scenario, fracture interaction is weak, so that the failure fracture network is relatively simple. When the dip angle of original fractures decreases, mixed splitting and shearing failure finally occurs to the coal sample. In this scenario, fracture interaction is strengthened, resulting in a complex failure fracture network. The final failure fracture network mainly originates from the propagation of original fractures, which is driven by tensile stress localized at the fracture tip. In addition, deformation localization is easily distinguished on the sample surface, which is attributed to the development of interior failure fractures.

4. Numerical Modeling

The information obtained from laboratory experiment is always limited, making it difficult to conduct deeper investigation into the mechanisms underlying the rock fracturing process [73,74,75]. Thus, rock failure associated studies are commonly carried out by using laboratory testing in corporation with numerical modeling [76,77]. The modeling data provide a good supplement for that obtained from the testing. Thus, an image-based modeling method is established based on CT reconstruction, which is moreover utilized to conduct numerical simulation in this section.

4.1. Image-Based Modeling Method

According to the experimental results, the final failure mode of fractured coal is dominated by the pre-existing fractures. That means accurate characterization of spatial distribution and structural morphology of the original fractures is crucial to the modeling capability of the numerical model. In order to reproduce failure behavior of fractured coal more realistically, complex geometric characteristics of original fractures should be taken into account in developing the numerical model. Thus, a novel method is proposed to establish numerical model based on CT scanning images in the Fast Lagrangian Analysis Code in 3D (FLAC3D), which is mainly composed of five steps:
(1)
Spatial distribution of original fractures and mineral inclusions in the tested coal sample is first determined by reconstructing 2D CT scanning images, as shown in Figure 4. The coordinate information of involved fractures and mineral inclusions is then extracted and exported from the reconstructed model. The obtained coordinate data include the position of the point, edge, polygon, and polyhedron, which are composed of the reconstructed fractures and minerals.
(2)
Original fractures and mineral inclusions are imported into FLAC3D with the help of the determined coordinate data. Such data are used to generate geometry object, which can interact with mechanical model but has no influence on mechanical calculation in FLAC3D. The original fractures and mineral inclusions are represented by polygonal and polyhedral geometry sets, respectively. In addition, geometry sets can also be distinguished by assigning different names.
(3)
A numerical model is then developed for subsequent simulation, which has the same shape and size with the tested coal sample. In this study, the numerical model is discretized into zones. The generated geometry sets are then moved to the same position with the numerical model and thus, the overlaying between them is realized in FLAC3D.
(4)
The zones representing the fractures and mineral inclusions of the coal sample are identified based on the type of the geometry set. The zones intersecting with polyhedral geometry set are identified as the mineral inclusions and these intersecting with a polygonal geometry set are identified as pre-existing fractures. The left zones are defined as a coal matrix. In this way, the main components of the tested coal sample, namely, coal matrix, original fractures, and mineral inclusions, are precisely separated in the numerical model.
(5)
In the modeling process, failure behavior of coal is mainly controlled by the zones representing pre-existing defects. They are further subdivided into smaller zones. Such densification and refinement of local zone discretization ensures that fracture propagation can be realistically reproduced by the image-based model, which takes spatial distribution and structural morphology of original fractures into account.
Based on the abovementioned method, numerical models corresponding to the tested coal samples are established and displayed in Figure 8. The blue zone represents the coal matrix. The pink and green zones represent pre-existing fractures and mineral inclusions, respectively. Three numerical modes are intact looking from the exterior sample surface. However, many pre-existing defects exists in the interior body. By comparing Figure 8 with Figure 4, good consistency can be found between spatial distribution of pre-existing defects in the numerical models and that observed in the experiment.

4.2. Mechanical Properties

In order to characterize failure behavior of the components involved in the tested coal sample, the constitutive model developed by Wang et al. [53] is assigned to the numerical model. If the zone fails in shear, cohesive, and tensile strengths decrease gradually, which is controlled by the softening parameters involved in the constitutive model. If the zone fails in tension, it is assumed that brittle failure occurs, namely, both cohesive and tensile strengths are completely lost by the zone. With such a configuration, the shear and tension failure zones could be taken as close and open cracks, respectively. Their appearance results in stress redistribution in the numerical model. In the open crack scenario, local tensile stress would appear around the fracture tip, similar with that observed in the experiment. Thus, fracture propagation characteristics of the fractured coal could be realistically reproduced even in the continuum model. The failure of single zone is taken as the appearance of the micro-crack. The macro-fracture is composed of many coalesced micro-cracks. Thus, the scale of failure fractures can be evaluated by counting the number of micro-cracks composed of then.
Mechanical properties used for subsequent numerical modeling are initially evaluated from the experimental data. The properties for original fractures are equal to the values assigned to coal matrix except that the cohesive and tensile strengths are set to be zero. The properties for mineral inclusions are significantly larger than that of coal matrix, which are evaluated from the properties of overburden rocks in Kouzidong mine. Then, a series of numerical tests are conducted to calibrate the properties by comparing the predicted stress–strain diagram with that obtained from the experiment. The final values of the mechanical properties determined for the numerical model are summarized in Table 2. Note that m, k, and n are softening parameters.

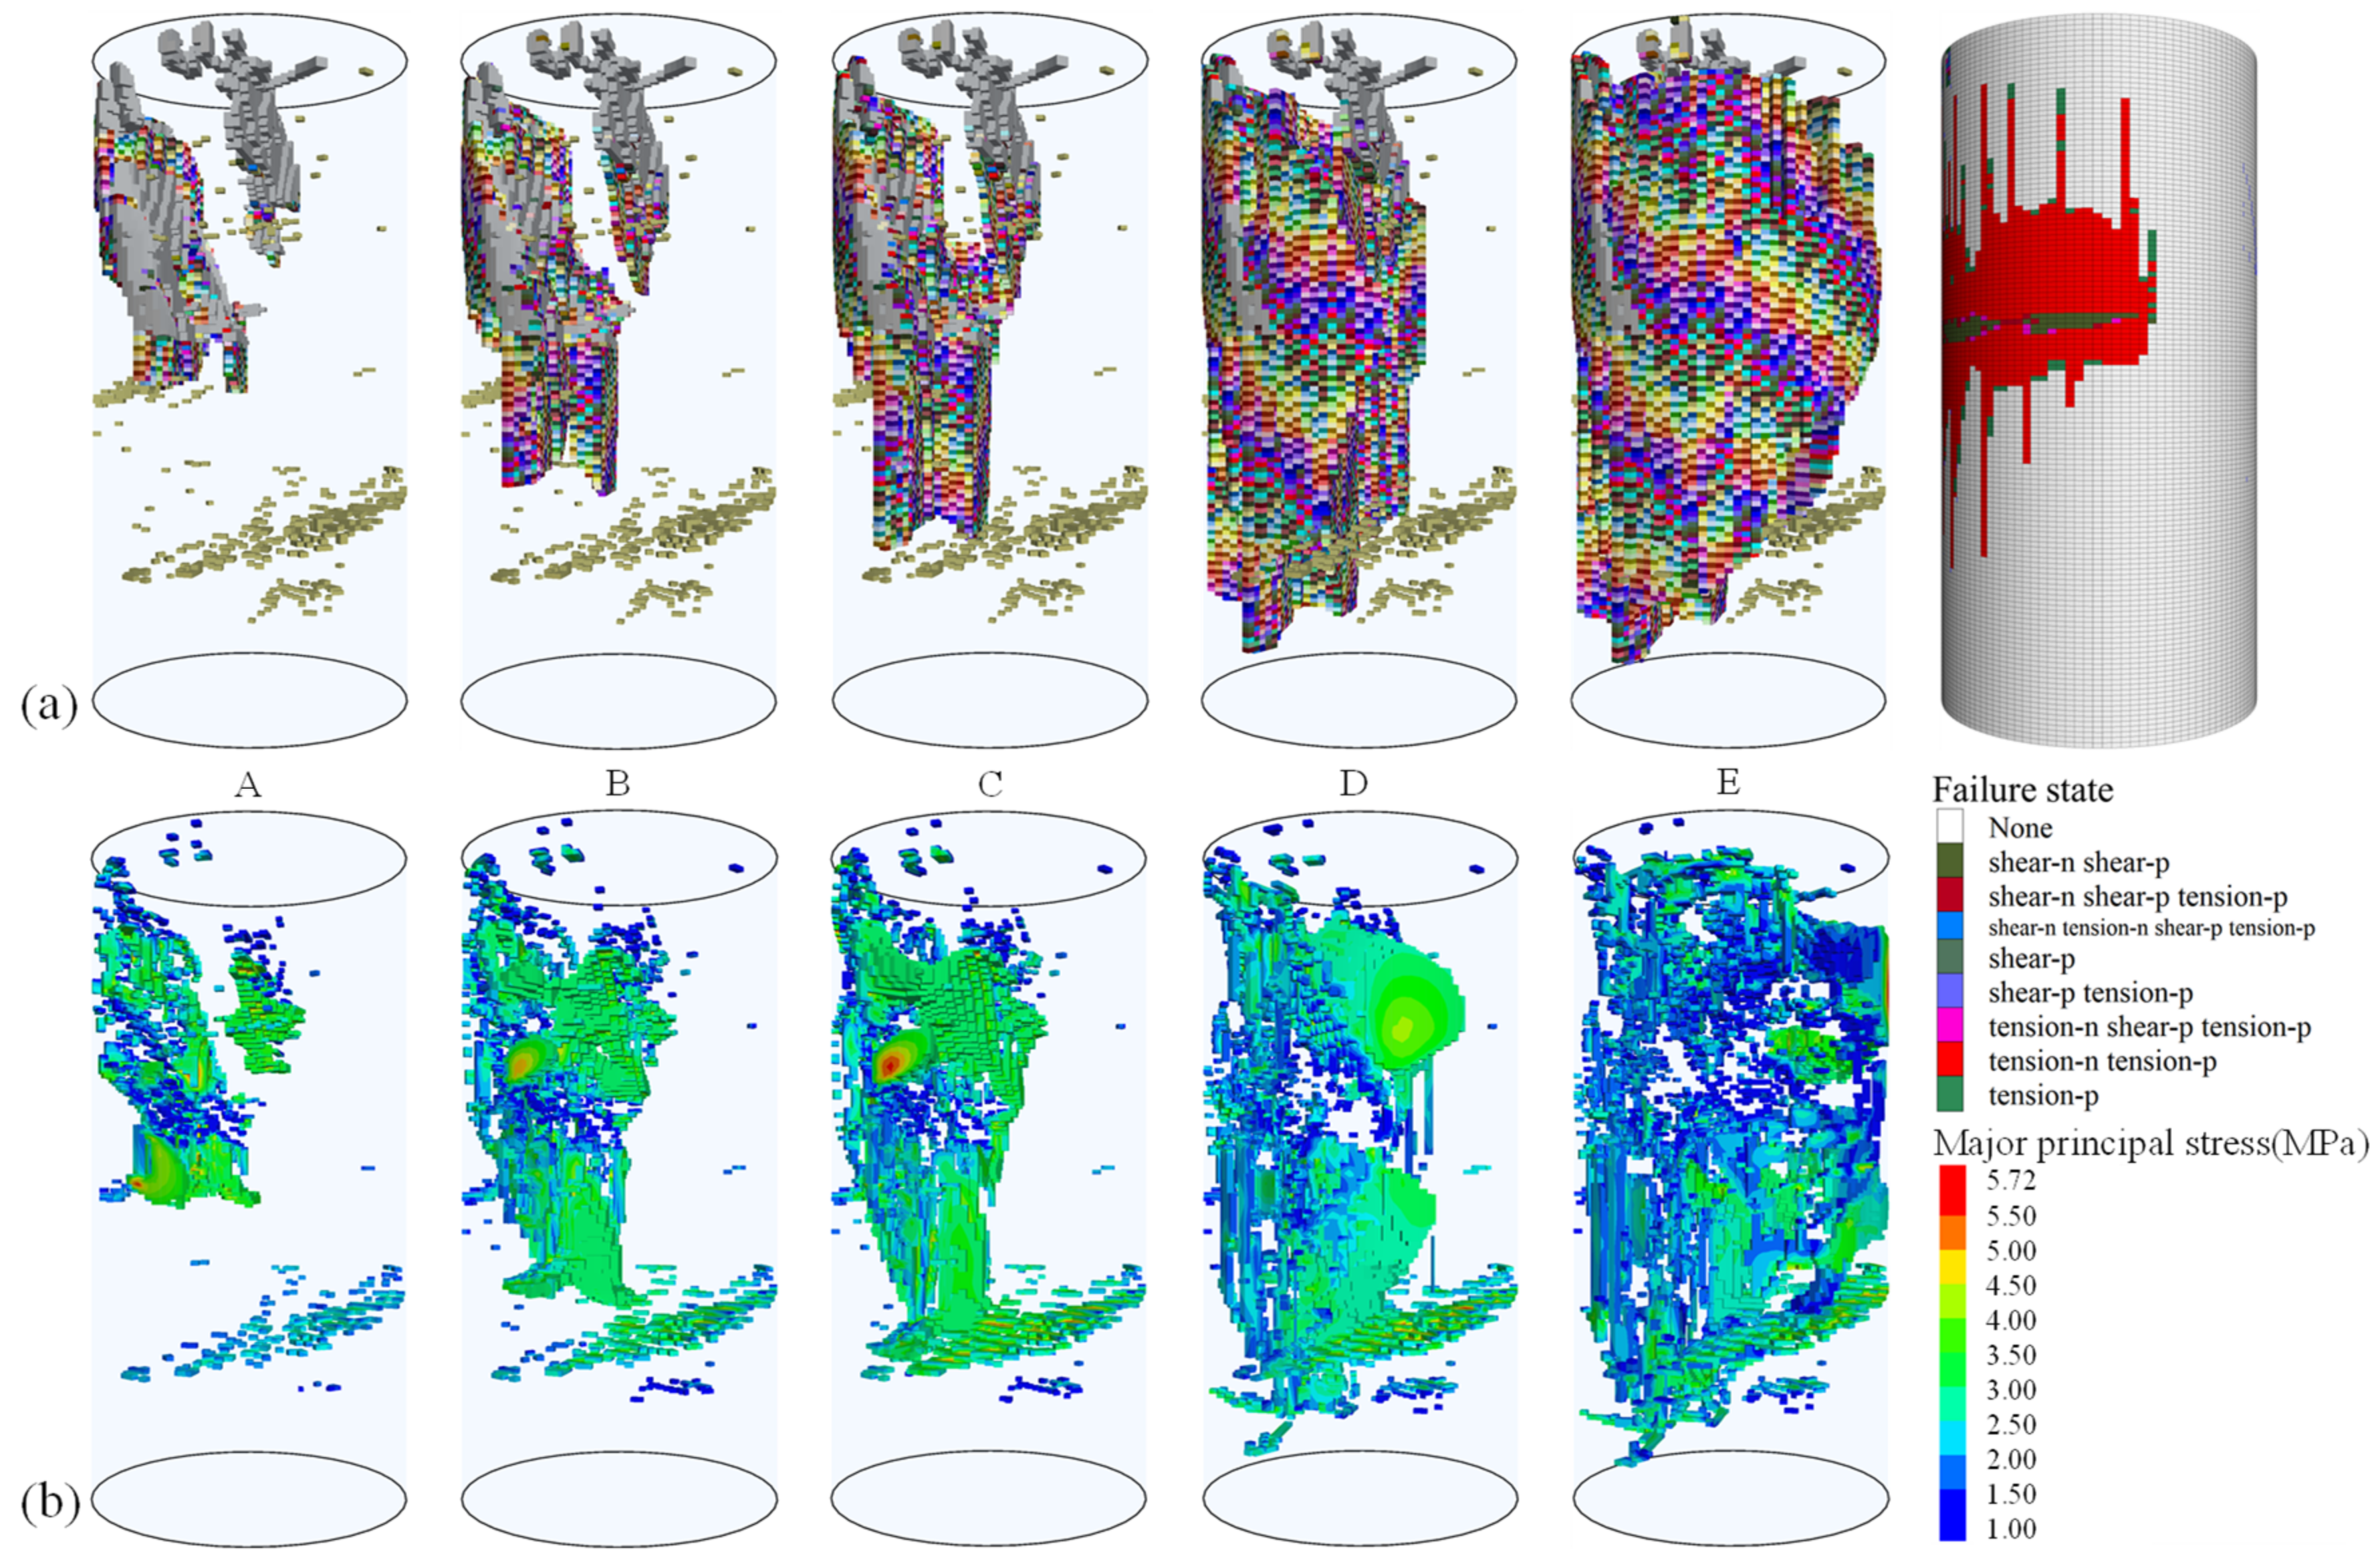
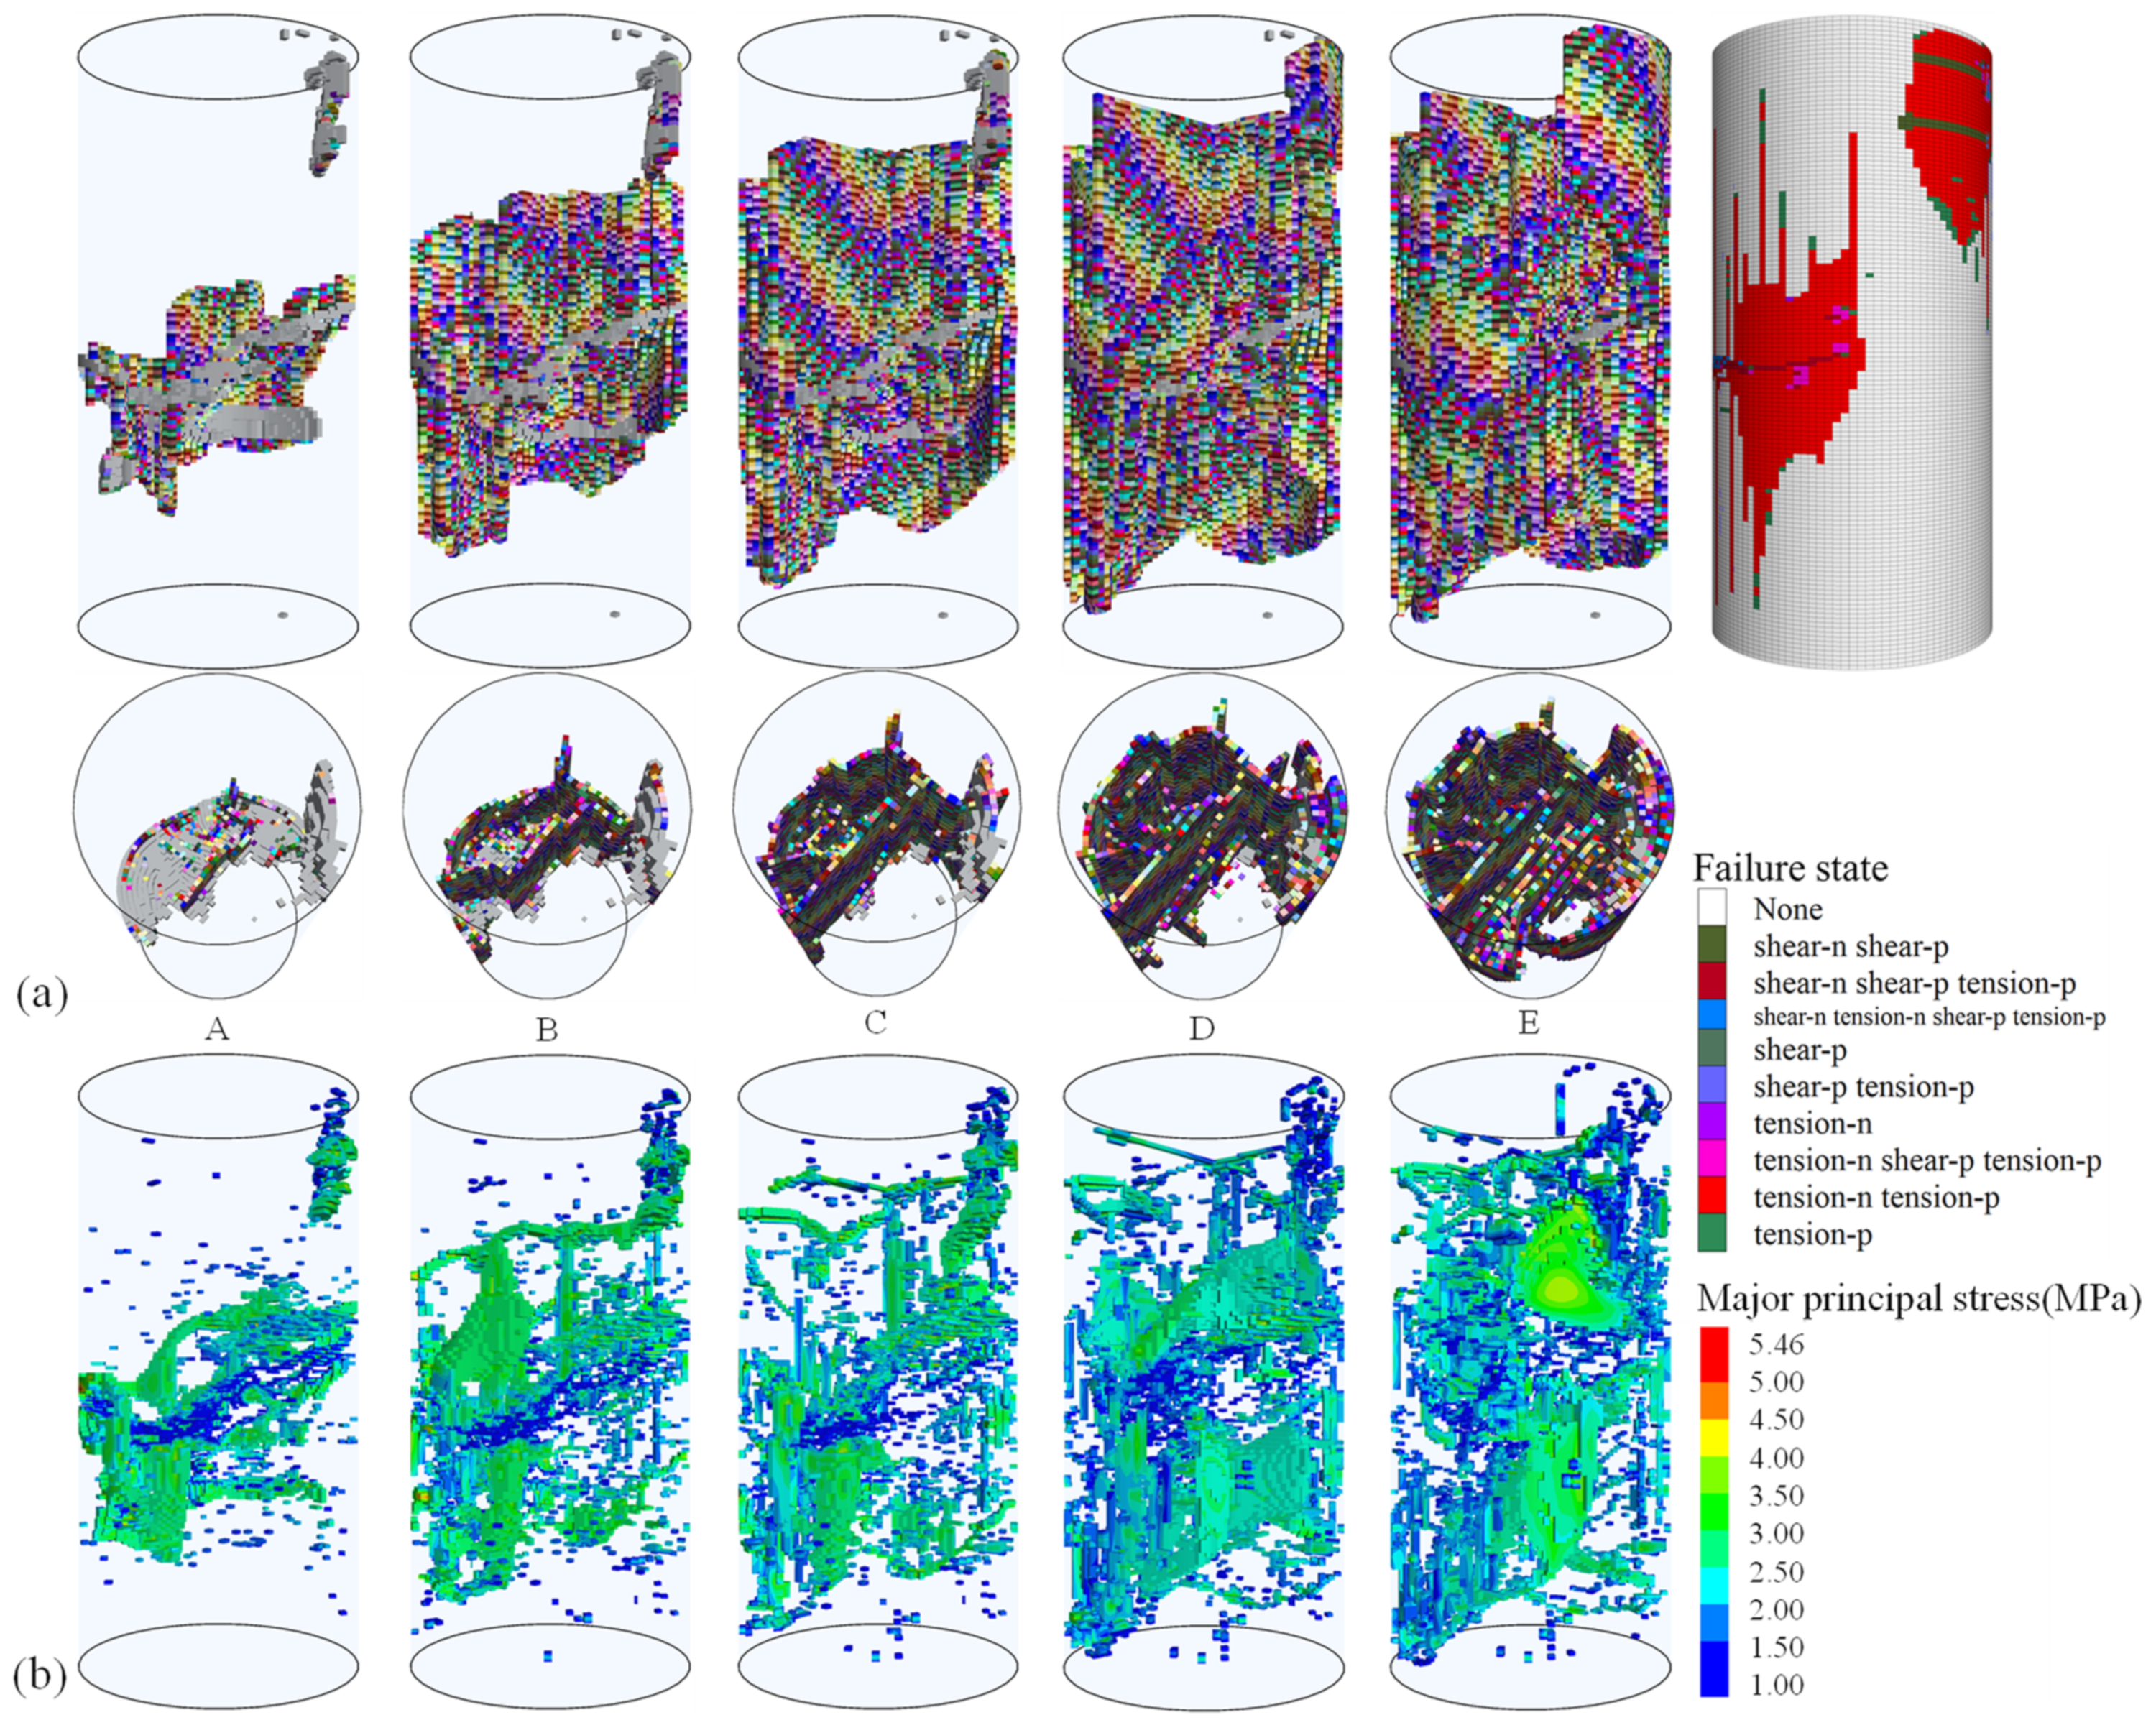
4.3. Modeling Results

Stress–strain responses and crack number increases obtained from numerical modeling are presented in Figure 9. Comparing with experimental data, the fracture closure stage disappears from the predicted deformation curves, which is commonly experienced in the numerical modeling [53]. The strain-hardening stage presented by samples N2 and N3 is more obvious than that displayed by sample N1. Such a characteristic agrees well with the shape of the stress–strain diagram plotted in Figure 5. The predicted magnitudes of the UCS for samples N1, N2, and N3 are 27, 19.5, and 15.6 MPa, respectively, in good accordance with the experimental data summarized in Table 1. Both deformation characteristics and UCS of the tested coal samples are realistically reproduced by the numerical model reconstructed from CT scanning images. However, the reconstructed numerical model fails to simulate the influence of pre-existing fractures on elastic modulus of coal. Such a limitation appears because the image-based model simulates fractures implicitly. In the numerical model, the fracture is represented by the zones without cohesive and tensile strengths. That means that fracture volume in the tested coal samples is not considered in the model development. Thus, fracture closure behavior cannot be taken into account in the modeling process realistically, which has a great influence on the deformability of fractured coal. The crack number remains constant in three numerical samples as axial strain is smaller than 2.5%. After that, the crack number grows continuously with increase in the external stress. In the strain-hardening stage, increasing rate in samples N2 and N3 is significantly faster than that in sample N1. That means stable propagation is more sufficient if the dip angle of pre-existing fractures is relatively small. In the post-peak stage, increasing rate in sample N1 is greatly stimulated. That means instable propagation is faster when dip angle of pre-existing fractures is large. After failure, the number of micro-cracks shows an increasing order from sample N1 to N2 and, finally, to N3, which implies the failure fracture network becomes increasingly complex, consistent with the failure fracture network displayed in Figure 7.
Visual representation of modeling results extracted from samples N1, N2, and N3 are presented in Figure 10, Figure 11 and Figure 12, respectively. Spatial evolutions of failure fracture network and tensile stress corresponding to five stress levels (A, B, C, D, and E) marked on stress–strain diagrams in Figure 9 are displayed. Note that, in FLAC3D, compressive stress is negative while tensile stress is positive. In Figure 10, Figure 11 and Figure 12, the top row of subfigures shows failure fracture network development and the bottom row of subfigures plots tensile stress evolution. In order to make the presentation more clear, pre-existing fractures providing no influence on failure behavior of fractured coal are not illustrated in the figures. An interesting phenomenon is that structural morphology of failure fracture network shows a similar evolution trend with spatial distribution of tensile stress. The failure fractures are mainly composed of tension-induced micro-cracks in the pre-peak stage. Shear failure-induced micro-cracks mainly appear after the large fracture running through the coal sample has been formed in the pos-peak stage.
According to Figure 10a, both the top and bottom edges of the 1# fracture and top edge of the 3# fracture propagate in a vertical direction in sample N1. Note that the 1# and 3# fractures are located near the top and bottom ends of the sample, respectively. Due to the small stress, the propagation length of two fractures is short at point A. Tensile stress appears in close vicinity of the pre-existing fractures. Due to the deformability difference between the coal matrix and minerals, tensile stress also emerges around the mineral layer. As axial stress increases to point B, propagation length of the fractures increases greatly. At the same time, some small cracks initiate near the mineral layer. The distribution range of tensile stress grows gradually with a continuous propagation of the fractures. From point B to point C, both the 1# and 3# fractures propagate to the mineral layer. In this stage, the 1# fracture starts to propagate in horizontal direction. At point C, tensile stress around pre-existing fractures and mineral layer overlays, forming a tensile stress region running through the sample in vertical direction. As the axial stress increased to its peak value at point D, the top and bottom fractures coalesce, leading to axial splitting of sample N1. In addition, the horizontal extension of the top fracture is greatly stimulated by a large external stress, causing a significant increase in the distribution range of tensile stress in the top section of the sample. After the peak point, the rapid horizontal extension of the 1# fracture continues, resulting in an obvious concentration area of tensile stress in the right section of the sample. A similar evolution trend of the failure fracture network and tensile stress distribution implies the fracture propagation is dominated by local tensile stress. Final axial splitting fracture formed in sample N1 is in good accordance with that plotted in Figure 7a.
Fracture propagation and tensile stress evolution in sample N2 are presented in Figure 11. At point A, both the top and bottom edges of the left fracture start to propagate, while only the bottom edge of the right fracture propagates in a vertical direction. The distribution range of tensile stress around the left fracture is much larger than that around the right fracture. The relatively small tensile stress also appears at the mineral layer. As the axial stress increases to point B, the left fracture propagates much more quickly than the right fracture. Due to an increase in fracture size, tensile stress around the two fractures overlays. Thus, the left fracture propagates toward the right one in a horizontal direction, indicating the onset of fracture interaction. From point B to point C, the bottom edge of the left fracture reaches the mineral layer. The left and right fractures intersect with each other due to the horizontal extension. Tensile stress around the fracture and mineral layer overlays at the bottom edge of the left fracture. As the peak axial stress is reached at point D, horizontal propagation of the left fracture is stimulated while its vertical propagation is inhabited after it slightly penetrates through the mineral layer. At the same time, the right fracture starts to propagate rapidly in vertical direction until the mineral layer is reached. Due to significant increase in the size of both pre-existing fractures, distribution range of tensile stress expands greatly, which presents a similar structural morphology with the failure fracture network. After the peak point, continuous loading leads to quick horizontal extension of the failure fracture network. Such extension is restricted to the region above the mineral layer, which is almost fully covered by tensile stress. Distribution range of the tensile stress becomes relatively larger than the volume of the failure fracture network in this stage. The predicted fracture propagation mode is similar with the failure fracture network presented in Figure 7b.
Fracture propagation and tensile stress evolution in sample N3 are presented in Figure 12. The mineral volume involved in sample N3 is so large that it greatly influences a visual presentation resolution of the modeling results. Thus, the minerals in this sample are not presented in Figure 12. The geometry of the inclined fractures, locating at the middle section of the sample, is so complex that their propagation paths are difficult to be identified from the front view of the sample. To resolve this limitation, the top view of the modeling results is displayed with the front view in Figure 12. Under uniaxial compression, many new vertical fractures initiate along the edges of the inclined fractures at the middle section of the sample. The new fractures propagate towards the top and bottom ends of the sample, simultaneously. The small fracture near the top end propagates along its initial fracture surface. In addition to concentrated tensile stress around the fractures, relatively small tensile stress also scatters in sample N3, which is attributed to the mineral inclusions. From point A to points B and C, the new fractures propagate quickly in a vertical direction. Horizontal propagation of original fractures is not obvious in this stage. Accordingly, the distribution range of tensile stress mainly evolves in a vertical direction. As the axial stress reaches the largest value at point D, horizontal propagation of the failure fractures is greatly stimulated. At point E, the failure fractures propagate to two ends and side surface of the sample, forming a complex failure fracture network. Comparing fracture propagation path in sample N3 with that in samples N1 and N2, it is easily identified that the most complex failure fracture network is formed in sample N3 due to strong fracture interaction and large volume of mineral inclusions. After failure, tensile stress nearly covers the total sample volume. The final failure fracture network presented similar geometric characteristics with that plotted in Figure 7c.

5. Conclusions

In underground coal mining, the instability of surrounding rocks is closely related to mining-induced fracture propagation. In particular, in deep coal mines, original fractures are well-developed in the coal seam, which increases the frequency of rock instability. In order to improve mining safety, coal samples collected from a kilometer-deep coal mine are prepared for uniaxial compression test in the current study. Fracture propagation characteristics and the associated mechanisms are thoroughly investigated with CT observation and numerical simulation. According to experimental and numerical results, the following conclusions are drawn.
(1)
Based on CT observation, both original fractures and mineral inclusions in coal samples are identified and reconstructed. Original fractures with small dip angle and large opening result in more obvious fracture closure and strain-hardening behaviors of coal while failure mode tends to be dominated by those with large dip angle. Spatial distribution and structural morphology of original fractures provide significant influence on the final failure fracture network, which mainly originates from the propagation of the original fractures. The fractures with a large dip angle result in splitting dominated failure fracture network. Fracture interaction is enhanced between original fractures with small dip angle, leading to a mixed splitting and shearing dominated failure fracture network.
(2)
An image-based modeling method is proposed by importing original fractures of coal into numerical model. The location and geometry of pre-existing fractures and mineral inclusions are obtained from CT image reconstruction. The coordination data are utilized to generate geometry sets in FLAC3D, which is, moreover, used for model refinement. Original fractures and mineral inclusions are accurately represented by polygonal and polyhedral geometry objects, respectively. The zones intersecting with the geometry objects are distinguished from coal matrix and defined as original defects. That means both spatial distribution and structural morphology of original defects are properly characterized in the image-based model, which strengthens its modeling capability.
(3)
The predicted complexity in a failure fracture network is consistent with that observed in the experiment. Both fracture interaction and mineral influence are accurately captured by the proposed model. In the loading process, tensile stress distribution presents a similar evolution trend with failure fracture network, implying that the propagation of original fractures is mainly dominated by tensile stress. Under a compressive condition, tensile stress mainly appears around the fracture and in the vicinity of mineral layer. In the pre-peak stage, propagation speed of the fractures with small dip angle is faster than that with large dip angle. In the post-peak stage, propagation speed of the fractures with large dip angle is greatly stimulated. Shear cracks mainly occur after the large tensile fracture running through the coal sample has been formed.
It should be noted that the influences of stress path and scale effect on fracture propagation characteristics of coal are not considered in this study. In the future, the authors will investigate propagation pattern and propagation mechanism of the fractures existing in coal under different stress paths and sample sizes. Such works will moreover contribute to rock reinforcement design in deep mining.

Author Contributions

Conceptualization, methodology and writing—original draft, Z.W.; formal analysis and writing—review and editing, W.S.; investigation, Y.S.; visualization, P.L. All authors have read and agreed to the published version of the manuscript.

Funding

This study is sponsored by National Natural Science Foundation of China (No. 51904304; 51934008). It is also supported by the Fundamental Research Funds for the Central Universities (No. 2022YQNY13).

Data Availability Statement

The data and material are available from the corresponding author upon reasonable request.

Conflicts of Interest

The authors declare no conflict of interest.

References

  1. Wang, Z.H.; Wang, J.C.; Yang, Y.; Tang, Y.S.; Wang, L. Mechanical relation between support stiffness and longwall face stability within fully-mechanized mining faces. J. China Univ. Min. Technol. 2019, 48, 258–267. [Google Scholar]
  2. Zhang, G.C.; Wen, Z.J.; Liang, S.J.; Tan, Y.L.; Tian, L.; Zhao, Y.Q.; Zhao, D.S. Ground response of a gob-side entry in a longwall panel extracting 17 m-thick coal seam: A case study. Rock Mech. Rock Eng. 2020, 53, 497–516. [Google Scholar] [CrossRef]
  3. Li, H.Q.; Wong, L.N.Y. Influence of flaw inclination angle and loading condition on crack initiation and propagation. Int. J. Solids Struct. 2012, 49, 2482–2499. [Google Scholar] [CrossRef] [Green Version]
  4. Wang, Z.H.; Wang, J.C.; Yang, S.L. An ultrasonic-based method for longwall top-coal cavability assessment. Int. J. Rock Mech. Min. Sci. 2018, 112, 209–225. [Google Scholar] [CrossRef]
  5. Wang, Z.H.; Wang, J.C.; Yang, S.L.; Li, L.H.; Li, M. Failure behaviour and acoustic emission characteristics of different rocks under uniaxial compression. J. Geophys. Eng. 2020, 17, 76–88. [Google Scholar] [CrossRef]
  6. Jaeger, J.C. Shear failure of anisotropic rocks. Geol. Mag. 1960, 97, 65–72. [Google Scholar] [CrossRef]
  7. Hoek, E.; Bieniawski, Z.T. Brittle fracture propagation in rock under compression. Int. J. Fract. Mech. 1965, 1, 137–155. [Google Scholar] [CrossRef]
  8. Wawersik, W.R.; Fairhurst, C. A study of brittle rock fracture in laboratory compression experiments. Int. J. Rock Mech. Min. Sci. Geomech. Abstr. 1970, 7, 561–575. [Google Scholar] [CrossRef]
  9. Hudson, J.A.; Brown, E.T.; Fairhurst, C. Optimizing the control of rock failure in servo-controlled laboratory tests. Rock Mech. 1971, 3, 217–224. [Google Scholar] [CrossRef]
  10. Jaeger, J.C.; Cook, N.G.W.; Zimmerman, R.W. Fundamentals of Rock Mechanics; Methuen: London, UK, 1969. [Google Scholar]
  11. Jaeger, J.C. Friction of rocks and the stability of rock slopes. Geotechnique 1971, 21, 97–134. [Google Scholar] [CrossRef]
  12. Peng, S.; Johnson, A.M. Crack growth and faulting in cylindrical specimens of chelmsford granite. Int. J. Rock Mech. Min. Sci. 1972, 9, 37–86. [Google Scholar] [CrossRef]
  13. ISRM Testing Commission. Suggested methods for the quantitative description of discontinuities in rock masses. Int. J. Rock Mech. Min. Sci. Geomech. Abstr. 1978, 15, 319–368. [Google Scholar]
  14. ISRM Testing Commission. Suggested method for determining mode I fracture toughness using cracked chevron Brazilian (CCNBD) specimens. Int. J. Rock Mech. Min. Sci. Geomech. Abstr. 1995, 32, 57–64. [Google Scholar] [CrossRef]
  15. Nemat-Nasser, S.; Horii, H. Compression-induced nonplanar crack extension with application to splitting, exfoliation, and rockburst. J. Geophys. Res. Solid Earth 1982, 87, 6805–6821. [Google Scholar] [CrossRef]
  16. Horii, H.; Nemat, N.S. Compression-induced microcrack growth in brittle solids: Axial splitting and shear failure. J. Geophys. Res. 1985, 90, 3105. [Google Scholar] [CrossRef]
  17. Yang, Z.Y.; Huang, T.H. Effect of joint sets on the aniso-tropic strength of rock masses. In Proceedings of the 8th ISRM, Tokyo, Japan, 25–29 September 1995. [Google Scholar]
  18. Yang, Z.Y.; Chen, J.M.; Huang, T.H. Effect of joint sets on the strength and deformation of rock mass models. Int. J. Rock Mech. Min. Sci. 1998, 35, 75–84. [Google Scholar] [CrossRef]
  19. Gong, Q.M.; Zhao, J.; Jiao, Y.Y. Numerical modeling of the effects of joint orientation on rock fragmentation by TBM cutters. Tunn. Undergr. Space Technol. 2005, 20, 183–191. [Google Scholar] [CrossRef]
  20. Gong, Q.M.; Jiao, Y.Y.; Zhao, J. Numerical modelling of the effects of joint spacing on rock fragmentation by TBM cutters. Tunn. Undergr. Space Technol. 2006, 21, 46–55. [Google Scholar] [CrossRef]
  21. Klawitter, M.; Esterle, J.; Collins, S. A study of hardness and fracture propagation in coal. Int. J. Rock Mech. Min. Sci. 2015, 76, 237–242. [Google Scholar] [CrossRef]
  22. Mishra, B.; Nie, D. Experimental investigation of the effect of change in control modes on the post-failure behavior of coal and coal measures rock. Int. J. Rock Mech. Min. Sci. 2013, 60, 363–369. [Google Scholar] [CrossRef]
  23. Gao, F.Q.; Kang, H.P. Experimental study on the residual strength of coal under low confinement. Rock Mech. Rock Eng. 2016, 50, 285–296. [Google Scholar] [CrossRef]
  24. Alejano, L.R.; Arzúa, J.; Bozorgzadeh, N.; Harrison, J.P. Triaxial strength and deformability of intact and increasingly jointed granite samples. Int. J. Rock Mech. Min. Sci. 2017, 95, 87–103. [Google Scholar] [CrossRef]
  25. Bruning, T.; Karakus, M.; Nguyen, G.D.; Goodchild, D. Experimental study on the damage evolution of brittle rock under triaxial confinement with full circumferential strain control. Rock Mech. Rock Eng. 2018, 51, 3321–3341. [Google Scholar] [CrossRef]
  26. Xiong, L.; Wu, S.; Zhang, S. Mechanical behavior of a granite from Wuyi mountain: Insights from strain-based approaches. Rock Mech. Rock Eng. 2019, 52, 719–736. [Google Scholar] [CrossRef]
  27. Liu, M.; Liu, E. Dynamic mechanical properties of artificial jointed rock samples subjected to cyclic triaxial loading. Int. J. Rock Mech. Min. Sci. 2017, 98, 54–66. [Google Scholar] [CrossRef]
  28. Jiang, Y.; Li, B.; Tanabashi, Y. Estimating the relation between surface roughness and mechanical properties of rock joints. Int J. Rock Mech. Min. Sci. 2006, 43, 837–846. [Google Scholar] [CrossRef]
  29. Li, B.; Jiang, Y.; Mizokami, T.; Ikusada, K.; Mitani, Y. Anisotropic shear behavior of closely jointed rock masses. Int. J. Rock Mech. Min. Sci. 2014, 71, 258–271. [Google Scholar] [CrossRef] [Green Version]
  30. Serhii, S.; Oleksandr, K.; Tatiana, P.; Liliia, P. On the methodology for considering scale effect of rock strength. Min. Miner. Depos. 2020, 14, 24–30. [Google Scholar]
  31. Zuo, J.P.; Wei, X.; Shi, Y.; Liu, C.; Li, M.; Wong, R.H.C. Experimental study of the ultrasonic and mechanical properties of a naturally fractured limestone. Int. J. Rock Mech. Min. Sci. 2020, 125, 104162. [Google Scholar] [CrossRef]
  32. Li, D.; Wang, E.; Kong, X.; Ali, M.; Wang, D. Mechanical behaviors and acoustic emission fractal characteristics of coal specimens with a pre-existing flaw of various inclinations under uniaxial compression. Int. J. Rock Mech. Min. Sci. 2019, 116, 38–51. [Google Scholar] [CrossRef]
  33. Zhu, Q.; Li, D.; Han, Z.; Li, X.; Zhou, Z. Mechanical properties and fracture evolution of sandstone specimens containing different inclusions under uniaxial compression. Int. J. Rock Mech. Min. Sci. 2019, 115, 33–47. [Google Scholar] [CrossRef]
  34. Arstanbek, A.; Rakhat, M.; Aziz, A.; Sher, A. Studying a correlation between characteristics of rock and their conditions. Min. Miner. Depos. 2020, 14, 87–100. [Google Scholar]
  35. Munoz, H.; Taheri, A.; Chanda, E.K. Pre-peak and post-peak rock strain characteristics during uniaxial compression by 3D digital image correlation. Rock Mech. Rock Eng. 2016, 49, 2541–2554. [Google Scholar] [CrossRef]
  36. Munoz, H.; Taheri, A.; Chanda, E.K. Fracture energy-based brittleness index development and brittleness quantification by pre-peak strength parameters in rock uniaxial compression. Rock Mech. Rock Eng. 2016, 49, 4587–4606. [Google Scholar] [CrossRef]
  37. Sharafisafa, M.; Shen, L.; Xu, Q. Characterisation of mechanical behaviour of 3D printed rock-like material with digital image correlation. Int. J. Rock Mech. Min. Sci. 2018, 112, 122–138. [Google Scholar] [CrossRef]
  38. Tran, T.P.H.; Bouissou, S.; Chemenda, A.; Ambre, J.; Vacher, P.; Michel, P. Initiation and evolution of a network of deformation bands in a rock analogue material at brittle–ductile transition. Rock Mech. Rock Eng. 2019, 52, 737–752. [Google Scholar] [CrossRef]
  39. Zhou, H.W.; Zhong, J.C.; Ren, W.G.; Wang, X.Y.; Yi, H.Y. Characterization of pore-fracture networks and their evolution at various measurement scales in coal samples using X-ray μCT and a fractal method. Int. J. Coal Geol. 2018, 189, 35–49. [Google Scholar] [CrossRef]
  40. Ju, Y.; Xi, C.; Zhang, Y.; Mao, L.; Gao, F.; Xie, H. Laboratory in situ CT observation of the evolution of 3D fracture networks in coal subjected to confining pressures and axial compressive Loads: A novel approach. Rock Mech. Rock Eng. 2018, 51, 3361–3375. [Google Scholar] [CrossRef]
  41. Zhao, Y.; Song, H.; Liu, S.; Zhang, C.; Dou, L.; Cao, A. Mechanical anisotropy of coal with considerations of realistic microstructures and external loading directions. Int. J. Rock Mech. Min. Sci. 2019, 116, 111–121. [Google Scholar] [CrossRef]
  42. Zhou, S.; Liu, D.; Cai, Y.; Yao, Y.; Li, Z. 3D characterization and quantitative evaluation of pore-fracture networks of two Chinese coals using FIB-SEM tomography. Int. J. Coal Geol. 2017, 174, 41–54. [Google Scholar] [CrossRef]
  43. Akhondzadeh, H.; Keshavarz, A.; Al-Yaseri, A.Z.; Ali, M.; Awan, F.U.R.; Wang, X.; Yang, Y.; Iglauer, S.; Lebedev, M. Pore-scale analysis of coal cleat network evolution through liquid nitrogen treatment: A Micro-Computed Tomography investigation. Int. J. Coal Geol. 2020, 219, 103370. [Google Scholar]
  44. Keishanu, B.; Jyotirmoy, M. An optimum solution for coal permeability estimation from mesoscopicscale calibrated stochastic and deterministic discrete fracturenetwork models. Fuel 2023, 331, 125620. [Google Scholar]
  45. Mohammad, E.; Denis, O.; Vladislav, A.; Alexander, B.; Vladislav, K.; Dmitry, K. Lift the veil of secrecy in sub-resolved pores by Xe-enhanced computed tomography. Fuel 2022, 328, 125274. [Google Scholar]
  46. Anderson, T.L. Fracture Mechanics: Fundamentals and Applications; CRC Press: Boca Raton, FL, USA, 1995. [Google Scholar]
  47. Zhao, Y.; Huang, J.; Wang, R. Real-time SEM observations of the microfracturing process in rock during a compression test. Int. J. Rock Mech. Min. Sci. Geomech. Abstr. 1993, 30, 643–652. [Google Scholar] [CrossRef]
  48. Zhao, Y. Crack pattern evolution and a fractal damage constitutive model for rock. Int. J. Rock Mech. Min. Sci. 1998, 35, 349–366. [Google Scholar] [CrossRef]
  49. Paliwal, B.; Ramesh, K.T. An interacting micro-crack damage model for failure of brittle materials under compression. J. Mech. Phys. Solids 2008, 56, 896–923. [Google Scholar] [CrossRef]
  50. Tang, C.A.; Liu, H.; Lee, P.K.; Tsui, Y.; Tham, L. Numerical studies of the influence of microstructure on rock failure in uniaxial compression—Part I: Effect of heterogeneity. Int. J. Rock Mech. Min. Sci. 2000, 37, 555–569. [Google Scholar] [CrossRef]
  51. Tang, C.A.; Lin, P.; Wong, R.H.C.; Chau, K.T. Analysis of crack coalescence in rock-like materials containing three flaws—Part II: Numerical approach. Int. J. Rock Mech. Min. Sci. 2001, 38, 925–939. [Google Scholar] [CrossRef]
  52. Chen, W.; Konietzky, H. Simulation of heterogeneity, creep, damage and lifetime for loaded brittle rocks. Tectonophysics 2014, 633, 164–175. [Google Scholar] [CrossRef]
  53. Wang, J.C.; Wang, Z.H.; Yang, S.L. A coupled macro- and meso-mechanical model for heterogeneous coal. Int. J. Rock Mech. Min. Sci. 2017, 94, 64–81. [Google Scholar] [CrossRef]
  54. De Bellis, M.L.; Pandolf, A. Applications of a micro-structured brittle damage model to laboratory tests on rocks. Int. J. Fract. 2022, 238, 57–69. [Google Scholar] [CrossRef]
  55. Kishan, R.K.; Hadi, H. Multiscale simulation of inelastic creep deformation for geological rocks. J. Comput. Phys. 2021, 440, 110439. [Google Scholar]
  56. Konietzky, H.; Heftenberger, A.; Feige, M. Life-time prediction for rocks under static compressive and tensile loads: A new simulation approach. Acta Geotech. 2009, 4, 73–78. [Google Scholar] [CrossRef]
  57. Li, X.; Huai, Z.; Konietzky, H.; Li, X.; Wang, Y. A numerical study of brittle failure in rocks with distinct microcrack characteristics. Int. J. Rock Mech. Min. Sci. 2018, 106, 289–299. [Google Scholar] [CrossRef]
  58. Shi, F.; Liu, J.S. A fully coupled hydromechanical XFEM model for the simulation of 3D non-planar fluid-driven fracture propagation. Comput. Geotech. 2021, 132, 103971. [Google Scholar] [CrossRef]
  59. Lan, H.X.; Martin, C.D.; Hu, B. Effect of heterogeneity of brittle rock on micromechanical extensile behavior during compression loading. J. Geophys. Res. Solid Earth 2010, 115, B01202. [Google Scholar] [CrossRef]
  60. Potyondy, D.O. A grain-based model for rock: Approaching the true microstructure. In Proceedings of the Rock Mechanics in the Nordic Countries, Kongsberg, Norway, 9–12 June 2010. [Google Scholar]
  61. Gao, F.Q.; Stead, D.; Coggan, J. Evaluation of coal longwall caving characteristics using an innovative UDEC Trigon approach. Comput. Geotech. 2014, 55, 448–460. [Google Scholar] [CrossRef] [Green Version]
  62. Wang, Z.H.; Yang, S.L.; Tang, Y.S. Mechanical behavior of different sedimentary rocks in the Brazilian test. Bull. Eng. Geol. Environ. 2020, 79, 5415–5432. [Google Scholar] [CrossRef]
  63. Ivars, D.M.; Pierce, M.T.; Darcel, C.; Reyes-Montes, J.; Potyondy, D.O.; Young, R.P.; Cundall, P.A. The synthetic rock mass approach for jointed rock mass modelling. Int. J. Rock Mech. Min. Sci. 2011, 48, 219–244. [Google Scholar] [CrossRef]
  64. Marilyn, S.; Mohammad, A.; Antoine, N.; Fabrice, E.; Christian, G.; Annette, E.F. DEM modeling of biocemented sand: Influence of the cohesive contact surface area distribution and the percentage of cohesive contacts. Comp. Geotech. 2022, 149, 104860. [Google Scholar]
  65. Nazanin, M.M.; Ardakani, A.M.; Noorzad, A. Experimental and numerical studies of a three-dimensional bonded contact model of cemented granular soils. Comp. Part. Mech. 2022. [Google Scholar] [CrossRef]
  66. Mostafa, A.; Saeed, K.; Javad, K.; Taghi, S.; Sanaz, V.; Hossaini, M.F. Mechanical behavior of single-flawed cylindrical specimens subjected to axial loading: A numerical investigation. Bull. Eng. Geol. Environ. 2022, 81, 442. [Google Scholar]
  67. Turichshev, A.; Hadjigeorgiou, J. Experimental and numerical investigations into the strength of intact veined rock. Rock Mech. Rock Eng. 2015, 48, 1897–1912. [Google Scholar] [CrossRef]
  68. Turichshev, A.; Hadjigeorgiou, J. Triaxial compression experiments on intact veined andesite. Int. J. Rock Mech. Min. Sci. 2016, 86, 179–193. [Google Scholar] [CrossRef]
  69. Yang, S.Q.; Tian, W.L.; Huang, Y.H.; Ranjith, P.G.; Ju, Y. An experimental and numerical study on cracking behavior of brittle sandstone containing two non-coplanar fissures under uniaxial compression. Rock Mech. Rock Eng. 2015, 49, 1497–1515. [Google Scholar] [CrossRef]
  70. Yang, S.Q.; Huang, Y.H.; Tian, W.L.; Yin, P.F.; Jing, H.W. Effect of high temperature on deformation failure behavior of granite specimen containing a single fissure under uniaxial compression. Rock Mech. Rock Eng. 2019, 18, 1725. [Google Scholar]
  71. Gomar, M.; Goodarznia, I.; Shadizadeh, S.R. Fully coupled analysis of interaction between the borehole and pre-existing fractures. Int. J. Rock Mech. Min. Sci. 2016, 89, 151–164. [Google Scholar] [CrossRef]
  72. Fu, J.W.; Chen, K.; Zhu, W.; Zhang, X.; Li, X. Progressive failure of new modelling material with a single internal crack under biaxial compression and the 3-D numerical simulation. Eng. Fract. Mech. 2016, 165, 140–152. [Google Scholar] [CrossRef]
  73. Lu, Y.; Wang, L.; Elsworth, D. Uniaxial strength and failure in sandstone containing a pre-existing 3-D surface flaw. Int. J. Fract. 2015, 194, 59–79. [Google Scholar] [CrossRef]
  74. Gao, F.Q.; Kang, H.P. Effects of pre-existing discontinuities on the residual strength of rock mass–Insight from a discrete element method simulation. J. Struct. Geol. 2016, 85, 40–50. [Google Scholar] [CrossRef]
  75. Wang, J.C.; Wang, Z.H.; Yang, J.; Tang, Y.S.; Li, B.B.; Meng, Q.B. Mining-induced stress rotation and its application in longwall face with large length in kilometer deep coal mine. J. China Coal Soc. 2020, 45, 876–888. [Google Scholar]
  76. Liu, X.S.; Tan, Y.L.; Ning, J.G.; Lu, Y.W.; Gu, Q.H. Mechanical properties and damage constitutive model of coal in coal-rock combined body. Int. J. Rock Mech. Min. Sci. 2018, 110, 140–150. [Google Scholar] [CrossRef]
  77. Mohammadi, H.; Pietruszczak, S. Description of damage process in fractured rocks. Int. J. Rock Mech. Min. Sci. 2019, 113, 295–302. [Google Scholar] [CrossRef]
Figure 1. The coal samples prepared for uniaxial compression test.
Energies 16 00260 g001
Figure 2. The lab testing system: (a) rock mechanics testing machine and (b) CT scanning equipment.
Energies 16 00260 g002
Figure 3. Typical CT scanning results: (a) slice image and (b) gray value distribution along line MN.
Energies 16 00260 g003
Figure 4. Spatial distribution of the fractures and minerals before uniaxial compression test: (a) sample N1; (b) sample N2; and (c) sample N3.
Energies 16 00260 g004
Figure 5. Stress–strain responses of the fractured coal samples.
Energies 16 00260 g005
Figure 6. Typical CT scanning images before and after failure of the tested coal samples: (a1,a2) sample N1; (b1,b2) sample N2; (c1,c2) sample N3; and (d) location of the slice image.
Energies 16 00260 g006
Figure 7. Spatial distribution of failure fractures after uniaxial compression test: (a) sample N1; (b) sample N2; and (c) sample N3.
Energies 16 00260 g007
Figure 8. Numerical models for the tested coal samples: (a) sample N1; (b) sample N2; and (c) sample N3.
Energies 16 00260 g008
Figure 9. The predicted stress–strain curve and crack number evolution in coal samples: (a) sample N1; (b) sample N2; and (c) sample N3.
Energies 16 00260 g009
Figure 10. Compression induced (a) fracture propagation and (b) tensile stress evolution in sample N1.
Energies 16 00260 g010
Figure 11. Compression induced (a) fracture propagation and (b) tensile stress evolution in sample N2.
Energies 16 00260 g011
Figure 12. Compression induced (a) fracture propagation and (b) tensile stress evolution in sample N3.
Energies 16 00260 g012
Table 1. Mechanical properties of fractured coal samples tested in this study.
Sample NumberTangent Modulus (GPa)Secant Modulus (GPa)Initial Yield Stress (MPa)UCS (MPa)
N13.93.725.026.2
N23.42.418.019.5
N33.72.814.616.1
Table 2. Mechanical properties utilized in the numerical modeling.
Material
Properties
Elastic Modulus (GPa)Poisson’s
Ratio
Internal Cohesion
(MPa)
Friction Angel
(°)
Tensile Strength
(MPa)
Softening Model Parameters
mkn
Coal3.20.3012366.00.000250.1500
Mineral5.00.2815427.50.000160.3800
Fracture0.80.320280------
Disclaimer/Publisher’s Note: The statements, opinions and data contained in all publications are solely those of the individual author(s) and contributor(s) and not of MDPI and/or the editor(s). MDPI and/or the editor(s) disclaim responsibility for any injury to people or property resulting from any ideas, methods, instructions or products referred to in the content.

