1. Introduction
The mining industry was responsible for approximately 7% of global carbon dioxide emissions in 2020 [
1]. A large portion of these emissions is due to diesel trucks, which consume 30–50% of a mine’s total energy use and can account for over 50% of the GHG emissions from mining operations [
1,
2]. Collectively, mining haul trucks are responsible for 68 million tons of CO
2 emissions globally per year. Decarbonizing these large mining trucks is a key focus for the mining industry. The large energy consumption of these vehicles and high utilization (24/7 operation in many cases) makes this a difficult application to decarbonize with batteries. Hydrogen and fuel cells offer a potential route for decarbonizing these vehicles; the motivation of this work is to objectively assess this potential.
Polymer electrolyte membrane fuel cells (PEMFCs) convert hydrogen energy to electric power without CO
2 or pollutant criteria emissions and can replace diesel engines in transportation applications. Advances in fuel cells for on-road vehicles of heavy-, medium-, and light-duty sizes have brought PEMFCs to nascent commercial viability [
3,
4,
5]. Although considerable technical and economic challenges remain for transportation fuel cells [
6], advances in the performance, cost, and manufacturing economies of scale suggest that they can be competitive with diesel platforms as the hydrogen economy scales up [
7,
8]. Rail, maritime, and construction off-road vehicles are being evaluated for conversion to PEFC propulsion [
9,
10], and recent attention has been extended to emissions-free ultra-class mining haul trucks [
11,
12,
13,
14]. In May 2022, Anglo American unveiled a prototype hydrogen fuel cell hybrid ultraclass haul truck to operate in South Africa’s Mogalakwena open pit mine [
15].
Figure A1 in
Appendix A summarizes some important attributes of the commercially available MW-sized haul trucks. The data has been collected from the websites maintained by the equipment manufacturers and shows that these trucks are powered by diesel engines rated at 1000 to 4000 gross horsepower (hp), are capable of handling a nominal payload between 100 and 400 tons (t), and provide a fuel tank capacity of between 360 and 1140 gal. The ultraclass generally refers to haul trucks with a payload capacity exceeding 270 t (300 short tons).
Figure A1 indicates that the commercial ultraclass haul trucks are equipped with >2700 hp diesel engines and >700 gal fuel tanks with the preponderance at the 3500 hp and 2700 hp engine sizes.
The purpose of this work is to investigate the performance, durability, and cost of fuel cells for ultraclass mining trucks relative to diesel engines. A 3500 hp engine was selected as the diesel baseline for evaluating the fuel cells because it is close to the largest machine in
Figure A1, and it is likely in demand judging by the number of manufacturers offering it. The specific objectives are to characterize the performance of fuel cells for mining trucks in terms of heat rejection, efficiency, and fuel consumption, determine the operating conditions and hybridization strategies to mitigate the fuel cell thermal management problem, develop a criterion for evaluating the range of fuel cell trucks and propose the appropriate fuel storage method for achieving this, evaluate the fuel cell and battery durability for performance degradation, lifetime, and component oversizing, and conduct a total cost of ownership analysis considering the initial capital expenditures, as well as the lifetime cost of fuel, operation, and maintenance.
The contributions of this paper are organized into three sections. The section on our approach, methods, and data presents the diesel and fuel cell powertrain configurations, engine efficiencies, mining haul route/duty cycle, the fundamentals of energy storage system performance and lifetime, FCS thermal management, and the performance and financial metrics. The section on the results presents the heat rejection consideration that limits FCS-rated power and requires the adoption of a hybrid platform, battery performance, and durability for the mining truck drive cycle, battery thermal management system, power profiles and operating strategies of the hybrid platform, powertrain efficiencies and fuel consumption, and total cost of ownership. The discussion section summarizes and interprets the unique results of this study regarding the technology, performance, lifetime, and cost of hybrid fuel cells for ultraclass haul trucks in mining applications.
2. Approach, Methods, and Data
2.1. Powertrain Configuration
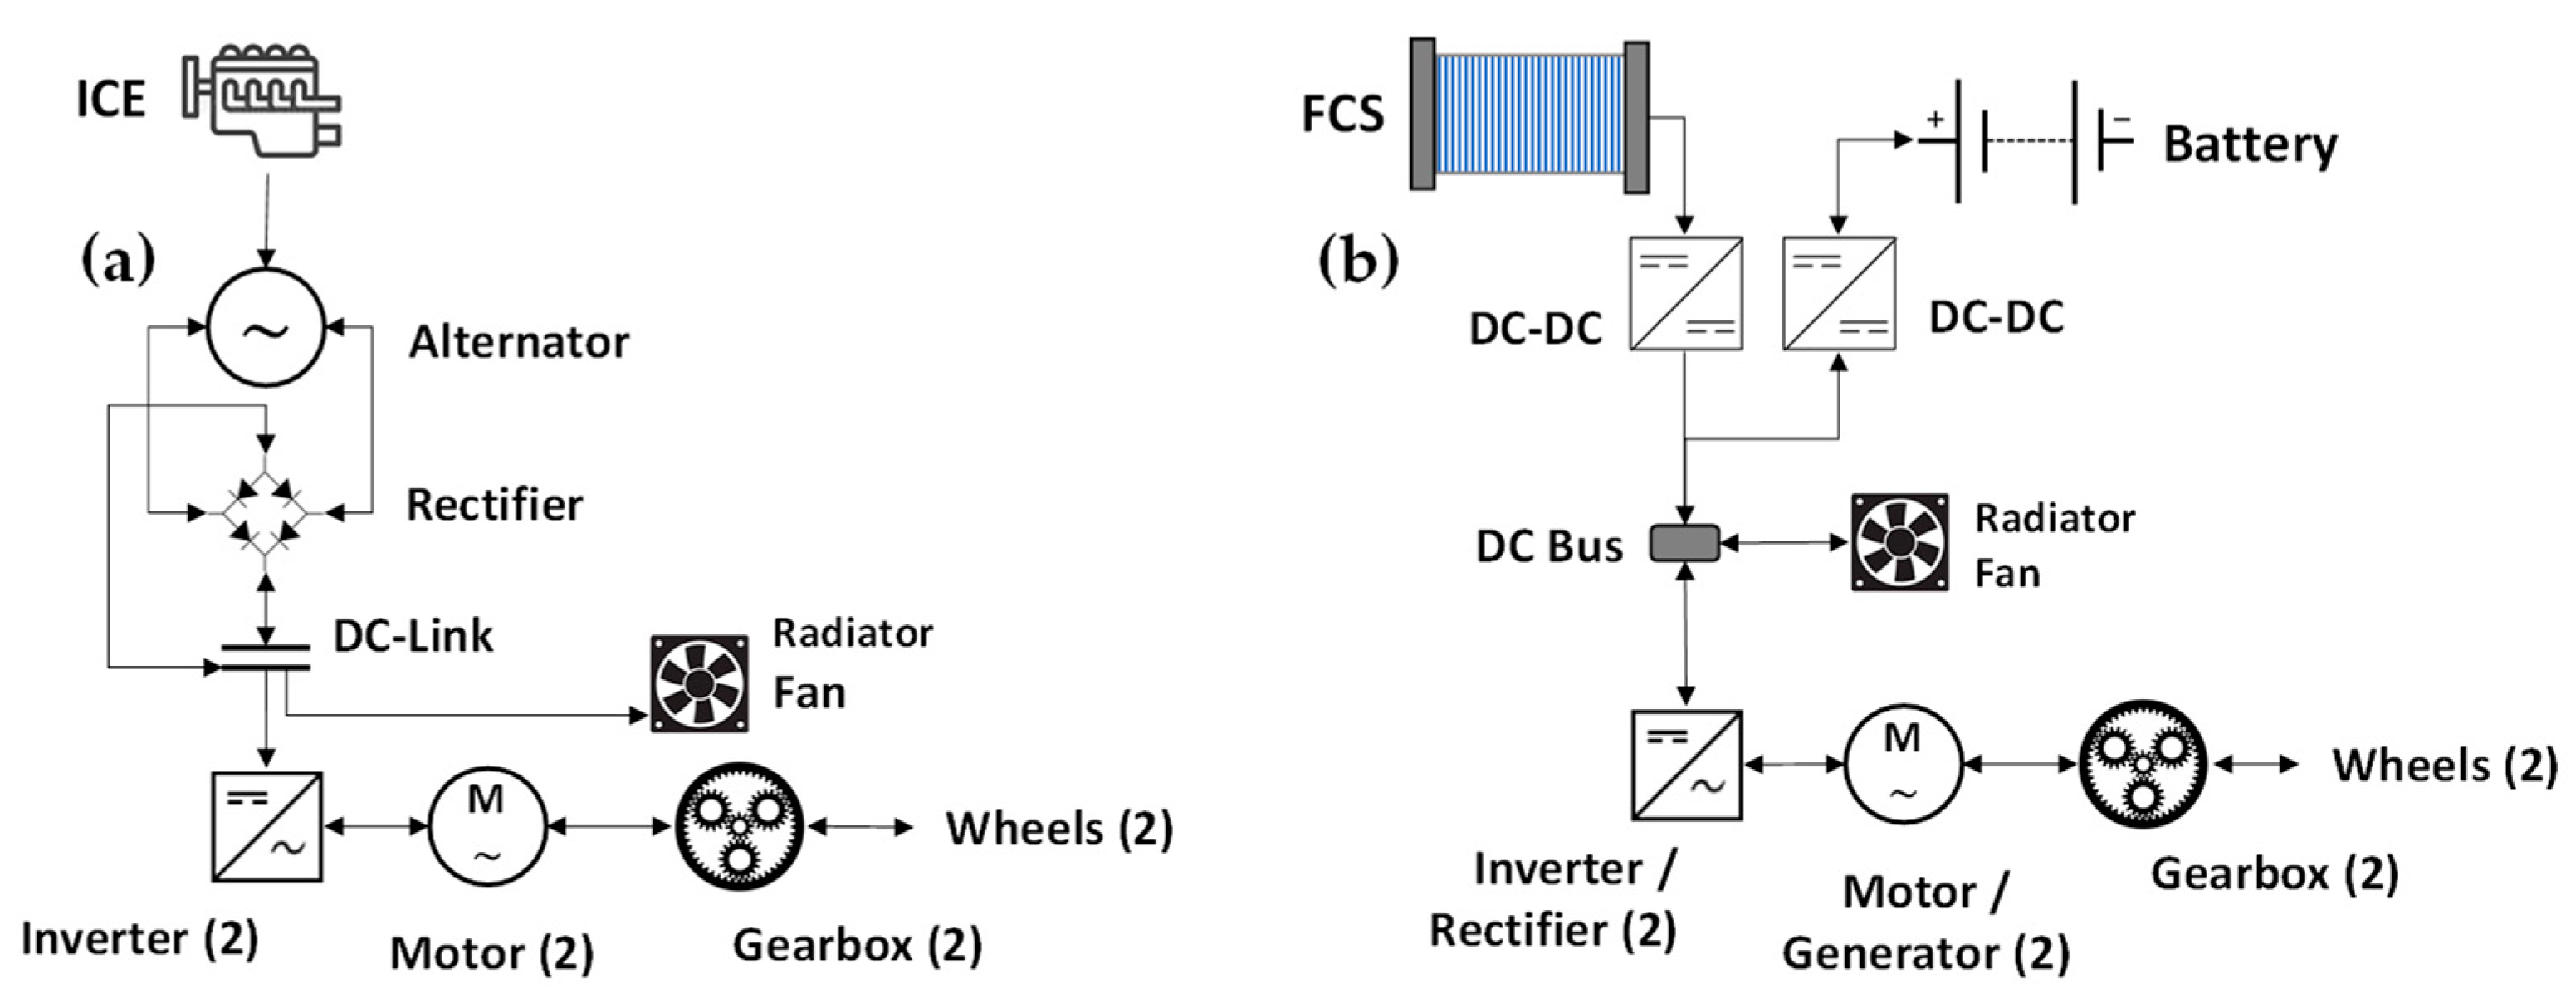
Figure 1a shows the diesel powertrain for MW-class mining trucks. The genset in
Figure 1a produces electrical power with a diesel internal combustion engine and an alternator [
16,
17]. Electric power is rectified from AC to DC, is conditioned through a DC link, and is then delivered to the inverters, motors, gearboxes, and wheels to propel the truck [
16,
17]. The power for the radiator systems is siphoned after conditioning in the DC-link before delivery to the inverters.
The FCS hybrid powertrain in
Figure 1b is similar to the diesel powertrain, but it directly generates DC electrical power that is delivered to a DC bus and then either stored in the battery or delivered to the inverter/rectifier, motor/generator, gearbox, and wheel for traction [
7,
12,
18]. An electric braking retarder is used for the regenerative recovery of braking energy and storing it in the battery.
Two FCS hybrid powertrain operating strategies are considered: (1) a fuel cell hybrid (FCH), in which the FCS delivers maximum power during ascent, idles during descent, and delivers 36% power otherwise, and (2) a fuel cell as a battery charger (FCBC), in which the FCS operates at constant power except during the descent, during which it idles. In both cases, the battery operates in a charge-sustained mode, i.e., zero-net energy during the duty cycle, and no external charging is required. The architecture for these two systems is the same, but the sizes of the components vary. For both fuel cell architectures, the number of stack startups and shutdowns are minimized by idling the stack when the power demand on the duty cycle drops below 10% of its rated power. Idling at a minimum power also protects the cells from high voltages (near-open circuit potentials), which can damage the cathode catalysts and membrane. The fuel cell system and battery are sized to satisfy duty cycle power demand at end of life (EOL). The FCS platform has the same radiator frontal area and fan size as the diesel system to avoid packaging challenges. To simultaneously achieve equal time between refills (TBR) as the diesel platform while avoiding further packaging challenges, a liquid hydrogen (LH
2) storage system [
19] is used for the ultraclass mining truck.
2.2. Engine Efficiency
It is assumed that the MW-class fuel cell system for mining trucks is modular and assembled from multiple 175–275 kW
e PEMFC systems for heavy-duty trucks [
20,
21,
22]. Each module has its own thermal, fuel, water, and thermal subsystems but shares a common radiator for heat rejection. The FCS is sized to satisfy the power requirements at end of life (EOL) to ensure no loss of functionality, throughput, or productivity over the lifetime of the vehicle. The EOL is defined as 25,000 h and may be achieved by voltage clipping to mitigate electrode and membrane degradation, membrane-active area oversizing to compensate for performance losses, and catalyst overloading.
This study uses the FCS and diesel genset steady-state efficiencies shown in
Figure 2. The FCS efficiency in
Figure 2a declines from the beginning of life (BOL) to EOL, as determined from a model and the assumptions described in previous publications [
20,
21,
22]. The FCS has 63.1% peak efficiency at BOL. The FCS efficiency at the rated power is 56.0% at BOL, decreasing to 50.6% at EOL. The diesel genset efficiency in
Figure 2a is modeled from CAT C175-16 data [
23]. This genset powers several relevant ultraclass haul trucks: model 793F (2650 hp), 794AC (3500 hp), and 798AC (3500 hp). The genset efficiency peaks at ~41% at 80% of the rated power and exhibits a steep decline at a power below 20% [
23]. All engine efficiencies exclude losses due to fan power.
Figure 2b shows the steady-state battery efficiency, which is lower during discharge than charge and decreases as the capacity fades over its lifetime due to loss of lithium and SEI growth.
2.3. Haul Route and Duty Cycle
Pit mine haul routes include a descent down the grade into the mine, travel to the fill site, fill, return travel to the grade, ascent up the grade, ingress to the dump site, dump, egress from the dump site, and then the cycle repeats.
Table 1 provides a representative mining haul route from Terblanche et al. [
23] that is used in this study. Sectors 15 and 0 are ingress to and egress from the dump site, which must be traversed carefully as the dynamic soil poses a significant danger to the haul truck [
17,
24].
The ramp grade is 10%, and the fill takes 120 s [
17,
18,
24,
25]. The vehicle remains nearly stationary during fill and dump, maneuvering only slightly to receive and deposit the earth. The vehicle speed is determined by road limits which are regulated and depend on the quality and degree of maintenance of the roads. Speed is maximized (subject to 28 mph road limit) to increase the rate of earth hauled, except for during the ascent, where the vehicle’s rated power (3500 hp for the diesel genset) limits the speed [
17,
18,
24,
25]. The true ascent speed and time are calculated using a vehicle dynamics model, given by Equation (1) [
17,
18,
26,
27].
m is the vehicle mass,
v is the vehicle velocity,
is the traction force,
is the braking force,
is the force of gravity,
is the force of rolling resistance, and
is the aerodynamic drag force. The model inputs are the haul route, engine gross power, and vehicle mass. Well-maintained roads exhibit a 2% rolling resistance factor, and the aerodynamics include a drag coefficient of 0.9, air density of 1.146 kg/m
3 at 35 °C and 1 atm, and a vehicle frontal area of 67.5 m
2 [
17,
18,
23].
Simulations were performed for a 3500 hp (2610 kW) diesel vehicle weighing 258 tons (empty) with a 330-ton payload at a 1 s time resolution. The FCS hybrid vehicle is sized to accomplish the same duty cycle while delivering an equal payload with an equal TBR (as the diesel vehicle). Simulations determine the power demand and vehicle speed. The vehicle’s depth in the mine, mine grade, vehicle speed, and vehicle power demand at the wheel are shown in
Figure A2 in
Appendix A. Ascent speed and travel time up the grade are limited by the engine’s rated power and are calculated as 7.6 mph and 294 s. Regenerative power and the energy available after battery charging and drivetrain losses during the descent on the 10% grade are 1851 kW
e and 62 kWh, respectively. The maximum traction power required at the wheel is 2033 kW, and the total energy requirement over the complete cycle is 202 kWh. The FCS hybrid powertrain is approximately 2% lighter than the diesel-electric powertrain; power demand duty cycles are mass-corrected. The total duty cycle time is 883 s, during which ~40% is idling, ~15% descending, and ~35% ascending.
2.4. Energy Storage System
Battery performance and lifetime are based on the literature data for lithium iron phosphate (LFP) batteries. LFP batteries have good cycling durability when maintained at a modest temperature, moderate energy density, a flat voltage-discharge curve, low-cost cf. containing the Li-ion batteries, and are relatively safe. Lithium titanium oxide (LTO) batteries could be candidates due to their exceptional heat tolerance and durability; however, they are presently more expensive and lack “at-scale” manufacturing. Battery cycling and calendar aging cause loss of lithium inventory and SEI growth: battery degradation modes manifest as capacity fade and internal resistance increase [
28]. A cycling capacity fade model [
29], a calendar-aging model [
30], and an internal resistance model are coupled to simulate battery performance and lifetime while operating on the mining duty cycle [
31].
After Olmos et al. [
29], the cyclic aging of LFP batteries, i.e., capacity fade (
), is represented as a product of the cluster functions that describe the individual degradation caused by the main stress factors: operating temperature (
), depth of discharge (
), charge rate (
), discharge rate (
), mean state of charge (
), and full equivalent cycles (
).
Following Sui et al. [
30], the capacity fade (
) of LFP batteries due to calendar aging is expressed as a product of the cluster functions that represent the degradation caused by the individual stress factors:
for storage temperature,
for battery state-of-charge, and
for storage time.
Following Tran et al. [
31], the Thevenin equivalent circuit model (ECM) is used to calculate the battery terminal voltage (
E) in response to the changes in load current (
). The open-circuit voltage (
) is considered an ideal voltage source that correlates with the battery’s state of charge,
denotes the ohmic resistance of the battery, and the voltage drop (
) across the parallel RC network (
and
) represents the transient behavior caused by the interfacial charge-transfer reactions at the electrode.
and
denote the interfacial capacitance and charge-transfer resistance at the electrode surfaces, respectively.
The parameters
,
, and
are functions of the battery state of health (
), temperature, and SOC [
31]. The battery efficiency (
) during charge or discharge is defined as the ratio of the terminal voltage to OCV as follows.
The energy storage system includes a liquid-cooled battery thermal management system (BTMS) shown in
Figure 3a with two loops: ethylene glycol circulating from the battery pack through a pump, a heat exchanger, and a chiller before returning to the battery pack. A second loop circulates a refrigerant through the chiller, an evaporator, a compressor, a condenser, an expansion valve, and then returns to the chiller [
32]. The battery cooling system is sized to accommodate heat removal at the battery maximum discharge power at EOL in a 50 °C ambient environment while maintaining a battery temperature of 35 °C.
2.5. FCS Thermal Management
As shown in
Figure 3b, the FCS thermal management system includes (a) an A/C condenser for truck cabin cooling, (b) a low-temperature radiator (LTR) for cooling the stator of the motor in the air management system, and the air precooler upstream of the membrane humidifier, (c) a high-temperature (HTR) radiator that cools the fuel cell stack, and (d) radiator fan. The stacked radiator arrangement in
Figure 3b is identical to that in a diesel powertrain, except that LTR has replaced the charged air cooler. The diesel thermal management system includes a circuit for the rear-axle retarder [
33]. The FCS platform employs regenerative energy capture and rejects waste heat through the independent BTMS. Both systems share the same oil loop for oil-cooling the final drive and an independent system for air-cooling the motors and inverters.
2.6. Performance and Financial Metrics
The total cost of ownership (TCO) is the ultimate technoeconomic metric for comparing commercial favorability. The duty-cycle-optimized powertrain performance and cost metrics are synthesized into one-time expenses, capital expenses (CAPEX), and recurring expenses, including operating expenses (OPEX), operation and maintenance expenses (O&M), and fuel expenses. CAPEX is amortized over the economic life of the vehicle into equal annualized payments according to the capital recovery factor,
, where
is the internal rate of return and
is the economic lifetime [
34]. The first fuel cell stack and battery are considered CAPEX. Fuel cell stack and battery replacements are treated as OPEX; however, their lifespans greatly surpass one year. Accordingly, replacements are amortized over the economic life of the vehicle. Other OPEX costs, for example, diesel exhaust fluid (DEF), are consumed rapidly, obviating amortization.
3. Results
Table 2 lists the important performance and cost metrics grouped into five categories for performance, vehicle parameters, component costs, fuel-related costs, and financial parameters. A diesel genset-specific power of 158 W/kg was determined by correlating the available literature data for MW-class engines. The FCS-specific power of 1000 W/kg corresponds to the upper limit for light-duty vehicles, but the ruggedization for heavy-duty applications may result in a lower value. The specific energy of the fuel storage systems is comparable after accounting for the nearly three times greater lower heating value (LHV) of H
2 than diesel: 42.8 MJ/kg-diesel vs. 120.2 MJ/kg-H
2.
In the TCO analysis, the mining truck operates for 6000 h/year, and the diesel engine undergoes a major overhaul after 20,000 h, whereas the fuel cell stack is replaced after 25,000 h.
The cost metrics include (a) the initial cost of USD 250/kW for the genset after a 20% allowance for tier-4 modifications and USD 323/kWe for FCS at 10,000 units/year manufacturing volume; (b) the comparable costs of diesel overhaul and fuel cell stack replacement, and (c) the cost of the battery and drivetrain components.
Table 2 lists the baseline costs of diesel and H
2; however, recognizing the volatility of fuel costs, the analysis also determines the relative cost of H
2 that leads to TCO parity.
The TCO analysis only considers the costs of the powertrain components shown in
Figure 1, and the fuel storage system applies a 30% surcharge for the installation and omits the common components, such as the chassis, tires, labor, and insurance.
3.1. FCS Heat Rejection
An analysis was conducted to determine the maximum FCS size that can reject waste heat using the same frontal radiator area and fan size as in a 3500 hp diesel mining truck. Compared to diesel engines, despite their higher efficiency, fuel cells have a unique thermal management problem because they operate at a lower temperature, and a smaller fraction of the fuel heating value is rejected through the exhaust gas. The analysis considers 50 °C as the maximum ambient temperature, a maximum coolant exit temperature of 110 °C for diesel and 95 °C for fuel cell stack, and 0.7 V cell voltage at EOL.
Table 3 summarizes the heat loads on the diesel HTR, CAC, and A/C condenser for these conditions. Diesel engines are generally equipped with one or more radiator fans that may consume up to 8% of the engine BOP.
A finite-volume model was developed to determine the pressure drop and heat transfer parameters from the diesel radiator heat loads. The model and parameters were then used to determine the maximum FCS size subject to the specified HTR frontal area.
Table 3 indicates that the HTR heat transfer constraint and 95 °C coolant temperature limit the stack size to a 1568 kW
e gross power at a 0.7 V cell voltage. The parasitic loads are 144 kW
e for the compressor-expander-motor (CEM) module in the air management system, 38 kW
e for the coolant pump and H
2 recirculation blower in the fuel management system, 29 kW
e for the cabin A/C hydraulic fan for the direct air cooling of the inverter, alternator, and traction motor, 209 kW
e for the radiator fans, and 45 kW
e for the BTMS. The FCS produces 1387 kW
e net power, and the balance of 1125 kW
e must be supplied by the battery during the ascent phase.
Table 3 also lists the heat loads on the HTR and LTR in the FCS, cabin A/C condenser, and the air-cooled HX, evaporator, and A/C condenser in the BTMS.
A method was formulated to determine the smallest FCS size in the FCBC configuration that can power the hybrid powertrain over the truck duty cycle with ESS operated in a charge-sustaining mode. The average power requirement over the duty cycle, the peak power required during the ascent, the energy required for the duty cycle, and the recoverable braking energy were calculated using the weight of the vehicle and the load. The average power required was 1172 kW
e, which defines the minimum size of the fuel cell that can be operated in a hybrid system in the charge-sustaining mode. The calculations show that an 1172-kW
e FCS, together with 62-kWh ESS regenerative braking energy, can provide 202 kWh to the traction motor, which is necessary to propel the mining truck on the truck duty cycle. As indicated in
Table 3, the FCBC configuration downsizes the fuel cell stack to 1325 kW
e from 1568 kW
e in the FCH but requires a larger battery and BTMS. The smaller radiator heat loads in the FCBC configuration allow the maximum stack coolant exit temperature to be lowered to 78 °C. Lower stack operating temperatures favor extended membrane and electrode lifetimes.
3.2. Battery
The combined battery performance and durability model was used to determine the battery capacity for the same lifetime as the fuel cell, i.e., 25,000 operating hours. The simultaneous replacement of these major powertrain components prevents long, extraneous vehicle downtime periods, which are costly opportunity losses for mine operators. The EOL is defined as a failure to absorb 62 kWh at 1851 kW
e during the descent or to provide 1125 kW
e or 1350 kW
e for the FCH and FCBC platforms, respectively, during ascent. When allowing for 30% capacity fade during the lifetime, the modeled nominal battery capacities are 1405 kWh and 1468 kWh for the FCH and the FCBC platforms, respectively. As shown in
Figure 4a, cycling capacity loss dominates calendar aging loss for the high-uptime mining truck with 6000 operating and 2760 nonoperating annual hours. The 25,000 h battery lifetime corresponds to 5038 full equivalent cycles for the FCH platform.
Figure 4b,c show that, as the battery ages and the capacity fades, its C-rate for charge and discharge increases by 45% from BOL to EOL, and the battery depth of discharge, the difference between the cycle maximum SOC and the minimum SOC, increases from 7.5% at BOL to 10.2% at EOL for FCH (9.1% at BOL to 13.1% at EOL for FCBC). Because of a higher C-rate, the battery discharges more during discharge than during charge.
Figure 4a shows that the battery capacity fades at a faster rate as it ages because of the increasing C-rates and DOD in
Figure 4b,c.
Figure 5 presents the illustrative results from a trade-off study between battery capacity and battery lifetime. A smaller battery has a shorter lifetime because it must be operated at a larger DOD to provide the target charge and discharge power. As an example, the battery lifetime reduces to 15,000 h if its capacity is decreased from 1405 kWh to 975 h for the FCH platform and from 1468 kWh to 1050 h for the FCBC platform. A smaller battery has the advantages of being compact, lighter, and easier to package. The disadvantages are a shorter lifetime, increased downtime for battery replacement, lower efficiency, and possibly, a higher lifetime cost.
3.3. Battery Thermal Management System
The BTMS system is sized to limit the steady-state battery temperature to 35 °C at a maximum discharge power on the hottest day (50 °C ambient temperature). Because battery efficiency degrades and heat generation increases as the battery ages, the temperature limit is enforced at its EOL. At these operating temperatures, a coefficient of performance (COP) of 1.1 may be representative of the BTMS state-of-the-art. The COP is the ratio of the power consumed in the compressor, coolant pump, and HX blower fan (see
Figure 3a) to the waste heat generated in the battery. Under these conditions, the calculated peak BTMS parasitic power consumption is 45 kW
e for the FCH platform and 63 kW
e for the FCBC platform.
Figure 6 presents the BTMS power consumption over the duty cycle for the FCH and FCBC platforms. The peak in power consumption occurs at the end of the ascent phase. The results are shown for the two extreme conditions: the hottest day at EOL (50 °C ambient; 35 °C battery temperatures) and normal operating conditions at BOL (25 °C ambient; 25 °C battery temperatures). Because the available peak power during regenerative braking greatly exceeds the peak discharge power during the ascent, only a portion of the available braking energy is recoverable at EOL and a 50 °C ambient temperature.
3.4. Power Profiles and Operating Strategies
Figure 7 summarizes the BOL and EOL power outputs for all the powertrain components at 25 °C and 50 °C ambient temperatures. The results are calculated with 1 s time resolution over the duty cycle. The FCS in the FCH platform delivers maximum power during the ascent, idles during the descent, and delivers 36% power otherwise. The power split during the ascent is 50% FCS and 50% battery. The battery power maxima are 2154 kW
e during charge and 1125 kW
e during discharge. The FCS in the FCBC platform operates at constant power, except during the descent when it idles. The power split during the ascent is 40% FCS and 60% battery, and the battery power maxima are 2134 kW
e during charge and 1350 kW
e during discharge. At EOL and a 50 °C ambient temperature, the recovered fraction of the braking energy is ~55% and ~65% for the FCH and FCBC platforms, respectively. Nearly 100% of the available braking energy may be recovered at BOL and a 25 °C ambient temperature.
3.5. Powertrain Efficiencies and Fuel Consumption
Figure 8 presents the time-resolved BOL and EOL efficiencies for the FCS and battery over the truck duty cycles at a 25 °C ambient temperature. The FCS in FCBC platform is less efficient than in the FCH platform because it operates closer to the rated power (87–90% of the rated power), except during descent. Battery efficiency is also lower in the FCBC platform because higher C-rates are demanded during charging and discharging.
The overall powertrain efficiency,
, can be defined as the ratio of the total energy supplied to the wheel to the lower heating value of the fuel consumed.
where
is the power at the wheel at time t,
is the rate of fuel consumption,
is the lower heating value of the fuel, and τ is the duty cycle duration. When applying Equation (4) to the truck duty cycle, the powertrain efficiencies are 20.3% for diesel, 38.3% for FCH at BOL, decreasing to 33.6% at EOL and 33.7% for FCBC at BOL, decreasing to 28.8% at EOL. Inclusive of FCS and battery performance degradation, the lifetime efficiencies of the FCH and FCBC are, respectively, 77% and 54% higher than the diesel powertrain.
The reference diesel truck holds 1311 gallons of fuel and consumes it at a rate of 16.5 gal/cycle for 19.1 h of operating time between refueling (TBR). On the same duty cycle, the H2 consumption rate is 9.9 kg/cycle at BOL, increasing to 11.3 kg/cycle at EOL for the FCH platform, and 11.3 kg/cycle at BOL, increasing to 13.2 kg/cycle at EOL for the FCBC platform. For an equal TBR (19.1 h) at EOL, the required H2 storage capacity is 947 kg for the FCH platform and 1003 kg H2 for the FCBC platform.
3.6. Total Cost of Ownership
Figure 9a summarizes a breakdown of the initial capital expenditure (CAPEX) amortized over the component economic lifetimes. The CAPEX includes a selective catalyst reduction system for tier 4 diesel emissions compliance (selective catalyst reduction; SCR) [
35], powertrains, and fuel storage. All other common cost elements, such as the chassis and tires, are omitted for ease of comparison between the platforms. CAPEX only includes the cost of the first installed FCS and battery. The cost of the FC stack and battery replacements are considered OPEX. The platform ranking of the most expensive to the cheapest is FCH Status > FCBC Status > Diesel > FCH Ultimate ~ FCBC Ultimate. The CAPEX is higher for the diesel drivetrain than the genset. The rankings for most expensive to least expensive components for the FCS platform are as follows: FCH Status: Drivetrain > FCS > Fuel Storage > Battery, FCBC Status: Drivetrain > FCS > Fuel Storage > Battery, FCH Ultimate: Drivetrain > Fuel Storage > (FCS ~ Battery), FCBC Ultimate: Drivetrain > Fuel Storage > (FCS ~ Battery).
Figure 9b summarizes the TCO breakdown in terms of the CAPEX, OPEX, O&M, and fuel cost. OPEX includes the amortized cost of the FC stack and the battery replacements and the major diesel engine overhauls. O&M includes the scheduled repair of the FCS and diesel platforms, diesel lubrication, DEF, SCR catalyst recharge, and insurance.
Figure 8b shows that fuel cost dominates, as it represents ~75% of the TCO for FCS platforms and ~65% for the diesel platform. The FCH option has the lowest TCO, with a Status technology of USD 27/h less than the diesel vehicle and an FCH Ultimate of USD 146/h less than diesel. The FCBC has a USD 9/h–4/h higher TCO than the FCH but has the advantage of a lower operating temperature that can stabilize the electrode and membrane by mitigating Pt dissolution and the fluoride release rate in membranes. Further work is needed to quantify the impact of the operating temperatures on TCO. If hydrogen cost does not reach USD 5/kg, the FCS platform is still favored if it equals or surpasses the breakeven cost for TCO parity. The breakeven costs of H
2 relative to diesel at USD 3.25/gal are USD 6.18/kg-H
2 for FCH Status, USD 5.79/kg-H
2 for FCBC Status, USD 6.85/kg-H
2 for FCH Ultimate, and USD 6.31/kg-H
2 for FCBC Ultimate.
Finally,
Figure 10 summarizes the results from a sensitivity analysis on the H
2 breakeven cost as a function of FCS cost. Currently, fuel cells are produced at a low manufacturing volume and may cost upward of USD 1000/kW
e. At this FCS price and an ESS cost of USD 157/kWh, the breakeven H
2 cost for TCO parity with diesel is USD 4.88–5.64/kg. Ramping up the production volume to 100,000 units/year and with certain improvements in stack technology may help in reaching the ultimate FCS cost target of USD 60/kW
e. In this case, the breakeven H
2 cost relaxes to USD 6.31–6.85/kg if the ESS cost also decreases to its ultimate target of USD 80/kWh.
4. Discussion
Our technoeconomic analysis indicates that fuel cells can compete with diesel gensets in MW-class mining trucks. A total cost of ownership analysis that only extends the powertrain components and fuel storage system shows that fuel cost dominates the TCO. This is advantageous for fuel cell hybrids since they can have 54–87% higher efficiency than the diesel engines on the representative mining truck duty cycle considered in this study. The FCH is the lowest cost option; its TCO is USD 27/h less than the diesel option with status technology and USD 146/h less with the ultimate technology. The FCBC platform has a slightly higher TCO than the FCH platform but has the advantage of lower operating temperatures that can mitigate electrode and membrane degradation. For TCO parity, breakeven H2 costs relative to diesel at USD 3.25/gal are USD 5.79–6.85/kg for the FCH and FCBC status and ultimate technologies.
Fuel cell stack lifetime, thermal management, FCS cost, and vehicle driving range are the major impediments to deploying fuel cells in off-road applications, including mining trucks. As investigated elsewhere for heavy-duty class 8 trucks [
36], approaches to reach a 25,000 h lifetime may entail voltage clipping to mitigate electrode and PFSA membrane degradation, membrane-active area oversizing to compensate for performance losses, and catalyst overloading. The 175–275 kW
e fuel cell systems for class 8 trucks are arranged as racks and modules in this study to build MW-class propulsion engines for ultraclass mining trucks.
Despite higher efficiency, the fuel cells have a unique thermal management problem because they operate at lower temperatures than diesel engines, and a smaller fraction of the fuel heating value is rejected through exhaust gases. One approach for dealing with this issue is to downsize the fuel cell system by 47% with the help of a battery to supply the make-up power during the ascent phase of the duty cycle while essentially maintaining the same radiator frontal area and fan power. The FCS can be further downsized by 55% and still operate the battery in a charge-sustaining mode. This work indicates that a 3500 hp diesel engine can be replaced with a hybrid platform of 1387-kWe FCS and 1405-kWh ESS (the FCH configuration) or 1172-kWe FCS and 1468-kWh ESS (the FCBC configuration).
The baseline 3500 hp diesel genset with tier-4 modifications has a specific cost of about USD 250/kW. Fuel cell systems must be manufactured at a high volume for comparable costs. Standardization and proliferation across multiple platforms may be a plausible approach to increase the FCS manufacturing volume. This study assumes that fuel cell systems for class 8 trucks are manufactured at 1000 units/year or a higher rate, find use in many off-road applications and can be arranged as racks and modules to reach a ~1500 kWe rated power. Considering the hybrid system, the weighted cost of FCS and ESS is USD 256/kWe for the FCH platform and USD 233/kWe for the FCBC configuration.
Time between refueling (TBR) is a suitable metric for the driving range of a mining truck. The FCS platform needs to store 947 kg of H2 for FCH and 1003 kg for FCBC to equal a 19.1 h TBR for the diesel truck. Storing such large quantities of H2 onboard a truck probably renders LH2 the only viable option. Even then, based on the stored fuel volume alone, the packaging is a challenge since LH2 occupies 13,153–13,931 L in the FCH and FCBC platforms, which is 2.7–2.8 times the 4962 L for diesel. Volumetric inefficiencies due to vacuum-insulated double-walled tanks and the ancillary components required for LH2 storage further add to the challenge.
Further work and actual field data are needed to assess the durability and maintenance and operating costs of fuel cells in mining applications, particularly the impacts of high ambient temperatures and dusty environments. Vastly disparate duty cycles and haul routes to those modeled in this work may require trucks with different fuel cell sizes, thermal management systems, hybridization strategies, and/or operating strategies. Mines themselves are dynamic, albeit on the timescale of years or decades. Optimal fuel cell hybrid vehicle design may account for not only a specific haul route but also the anticipated changes over the mine’s lifetime. The possible salvage values of the batteries and fuel cells need to be addressed in the future once the markets mature and generate reliable data.
Author Contributions
Conceptualization, R.K.A.; methodology, R.K.A., X.W. and A.G.S.; software, X.W. and A.G.S.; validation, R.K.A., X.W. and A.G.S.; formal analysis, X.W. and A.G.S.; investigation, R.K.A., X.W., A.G.S. and D.D.P.; data curation, X.W. and A.G.S.; writing—original draft preparation, A.G.S.; writing—review and editing, R.K.A.; visualization, X.W. and A.G.S.; supervision, R.K.A.; project administration, R.K.A.; funding acquisition, R.K.A. All authors have read and agreed to the published version of the manuscript.
Funding
This research was funded by the U.S. Department of Energy (DOE), Office of Energy Efficiency and Renewable Energy (EERE), Hydrogen and Fuel cell Technologies Office (HFTO), under contract DE-AC02: 06CH11357. The U.S. Government retains for itself, and others acting on its behalf, a paid-up nonexclusive, irrevocable, worldwide license in said article to reproduce, prepare derivative works, distribute copies to the public, and perform publicly and display publicly, by or on behalf of the Government.
Data Availability Statement
Not applicable.
Acknowledgments
Peter Devlin of DOE/EERE/HFTO was the Technology Development Manager for this study. Argonne National Laboratory, a U.S. Department of Energy Office of Science laboratory, is operated by UChicago Argonne, LLC.
Conflicts of Interest
The authors declare no conflict of interest.
Appendix A
Figure A1.
Nominal engine size, payload (filled circles), and fuel tank capacities (filled triangles) of commercially available MW-class haul trucks. The data are color-coded (green, blue, red and yellow) to distinguish the equipment manufacturers (Caterpillar, Komatsu, Liebherr and Terex) and were gathered from the websites maintained by them. It was only used in this work for selecting the baseline engine size and guiding discussions.
Figure A2.
Vehicle duty cycle: depth in the pit mine, grade, speed, and power demand at the wheel. Truck speed and power demand are calculated during the duty cycle, including the segments for truck loaded up the hill, loaded down the hill, empty up the hill, empty down the hill, and on a flat surface. The hybrid fuel cell system has been sized to satisfy the power demand for the speed achieved by the diesel platform: (a) Depth; (b) Speed; (c) Grade and (d) Power at wheel.
References
- Cox, B.; Innis, S.; Kunz, N.C.; Steen, J. The Mining Industry as a Net Beneficiary of a Global Tax on Carbon Emissions. Commun. Earth Environ. 2022, 3, 17. [Google Scholar] [CrossRef]
- Muralidharan, R.; Kirk, T.; Blank, T.K. Pulling the Weight of Heavy Truck Decarbonization: Exploring Pathways to Decarbonize Bulk Material Hauling in Mining; Rocky Mountain Institute: Basalt, CO, USA, 2019; Available online: https://rmi.org/insight/pulling-theweight-of-heavy-truck-decarbonization (accessed on 15 June 2022).
- Cullen, D.A.; Neyerlin, K.C.; Ahluwalia, R.K.; Mukundan, R.; More, K.L.; Borup, R.L.; Weber, A.Z.; Myers, D.J.; Kusoglu, A. New Roads and Challenges for Fuel Cells in Heavy-Duty Transportation. Nat. Energy 2021, 6, 462–474. [Google Scholar] [CrossRef]
- Morrison, G.; Stevens, J.; Joseck, F. Relative Economic Competitiveness of Light-Duty Battery Electric and Fuel Cell Electric Vehicles. Transp. Res. Part C Emerg. Technol. 2018, 87, 183–196. [Google Scholar] [CrossRef]
- Marcinkoski, J.; Vijayagopal, R.; Adams, J.; James, B.; Kopasz, J.; Ahluwalia, R.K. DOE Advanced Truck Technologies Subsection of the Electrified Powertrain Roadmap Technical Targets for Hydrogen-Fueled Long-Haul Tractor-Trailer Trucks. 2019. Available online: https://www.hydrogen.energy.gov/pdfs/19006_hydrogen_class8_long_haul_truck_targets.pdf (accessed on 15 June 2022).
- Reyes-Valenzuela, M.; Sanchez-Squella, A.; Barraza, R.; Osses, M.; Valdivia-Lefort, P. Economic Evaluation of Fuel Cell Powered Offroad Machinery Using Stochastic Analysis. Int. J. Hydrogen Energy 2022, 47, 2771–2782. [Google Scholar] [CrossRef]
- Koellner, W.G.; Brown, G.M.; Rodríguez, J.; Pontt, J.; Cortés, P.; Miranda, H. Recent Advances in Mining Haul Trucks. IEEE Trans. Ind. Electron. 2004, 51, 321–329. [Google Scholar] [CrossRef]
- Vega, C.A. Study of Hydrogen Global Market and Technical and Economic Prefeasibility of Using the Proton Exchange Membrane Fuel Cell (Pem) Fueled with Hydrogen in Chilean Mining Mobility. Ph.D Thesis, University of Chile, Santiago, Chile, 2020. Available online: https://repositorio.uchile.cl/bitstream/handle/2250/178550/Study-of-hydrogen-global-market-and-technical-and-economic-prefeasibility-of-using-the-proton-exchange-membrane-fuel-cell.pdf (accessed on 15 June 2022).
- Ahluwalia, R.K.; Papadias, D.; Wang, X. Rail and Maritime Metrics. U.S. DOE Hydrogen and Fuel Cells Program. In Proceedings of the Annual Merit Review and Peer Evaluation Meeting, Washington, DC, USA, 10–21 May 2020; Available online: https://www.hydrogen.energy.gov/pdfs/review20/ta034_ahluwalia_2020_o.pdf (accessed on 6 June 2021).
- Ahluwalia, R.K.; Wang, X.; Star, A.G.; Papadias, D. Performance and Cost of Fuel Cells for Off-road Heavy-duty Vehicles. Int. J. Hydrogen Energy 2022, 47, 10990–11006. [Google Scholar] [CrossRef]
- Feng, Y.; Dong, Z. Integrated Design and Control Optimization of Fuel Cell Hybrid Mining Truck with Minimized Lifecycle Cost. Appl. Energy 2020, 15, 115164. [Google Scholar] [CrossRef]
- Feng, Y.; Dong, Z. Optimal Energy Management with Balanced Fuel Economy and Battery Life for Large Hybrid Electric Mining Truck. J. Power Sources 2020, 454, 227948. [Google Scholar] [CrossRef]
- Zhang, W.; Yang, J.; Zhang, W.; Ma, F. Research on Regenerative Braking of Pure Electric Mining Dump Truck. World Electr. Veh. J. 2019, 10, 39. [Google Scholar] [CrossRef] [Green Version]
- Lindgren, L.; Grauers, A.; Ranggård, J.; Mäki, R. Drive-Cycle Simulations of Battery-Electric Large Haul Trucks for Open-Pit Mining with Electric Roads. Energies 2022, 15, 4871. [Google Scholar] [CrossRef]
- Anglo American Unveils a Prototype of the World’s Largest Hydrogen-Powered Mine Haul Truck—A Vital Step Towards Reducing Carbon Emissions over Time. 2022. Available online: https://www.angloamerican.com/media/press-releases/2022/06-05-2022 (accessed on 15 June 2022).
- Komatsu 930E-4SE Electric Drive Truck, Technical Paper AESS921(01); Komatsu America Corp: Chicago, IL, USA, 2019; Available online: https://www.komatsu.jp/en/worldwide/PDF/KAC_930E-4SE.pdf (accessed on 15 June 2022).
- Caterpillar Performance Handbook, 45th ed.; SEBD0351-45; Caterpillar: Peoria, IL, USA, 2015; Available online: https://wheelercat.com/wp-content/uploads/2015/05/SEBD0351-45-2.pdf (accessed on 15 June 2022).
- Terblanche, P.J. Technical and Economic Potential of Energy Recovery and Re-Use on Board Surface Mining Haul Trucks. Ph.D Thesis, The University of Queensland, Brisbane, Austria, 2018. [Google Scholar]
- Ahluwalia, R.K.; Papadias, D.D.; Peng, J.-K.; Roh, H.S. System Level Analysis of Hydrogen Storage Options. DOE Hydrogen and Fuel Cells Program. 2020. Available online: https://www.hydrogen.energy.gov/pdfs/review20/st001_ahluwalia_2020_o.pdf (accessed on 6 June 2021).
- Ahluwalia, R.K.; Wang, X.; Steinbach, A.J. Performance of Advanced Automotive Fuel Cell Systems with Heat Rejection Constraint. J. Power Sources 2016, 309, 178–191. [Google Scholar] [CrossRef] [Green Version]
- Ahluwalia, R.K.; Wang, X.; Peng, J.-K.; Cetinbas, C.F.; Papadias, D.D. Fuel Cell System Modeling and Analysis. DOE Hydrogen and Fuel Cells Program Annual Merit Review. 2019. Available online: https://www.hydrogen.energy.gov/pdfs/review19/fc017_ahluwalia_2019_o.pdf (accessed on 6 June 2020).
- Ahluwalia, R.K.; Wang, X.; Peng, J.-K.; Cetinbas, C.F.; Papadias, D.D. Fuel Cell System Modeling and Analysis. DOE Hydrogen and Fuel Cells Program Annual Merit Review. 2020. Available online: https://www.hydrogen.energy.gov/pdfs/review20/fc017_ahluwalia_2020_o.pdf (accessed on 6 June 2021).
- Terblanche, P.; Kearney, M.P.; Nehring, M.; Knights, P.F. Potential of On-Board Energy Recovery Systems to Reduce Haulage Costs over the Life of a Deep Surface Mine. Min. Technol. 2019, 128, 51–64. [Google Scholar] [CrossRef]
- US Dept. of Labor; MSHA. Haul Road Inspection Handbook; PH99-I-4; U. S. Department of Labor: Washington, DC, USA; MSHA: Arlington, VA, USA, 1999.
- Mazumdar, J. All Electric Operation of Ultra class Mining Haul Trucks. In Proceedings of the 2013 IEEE Industry Applications Society Annual Meeting, 2013-MIC-409, Lake Buena Vista, FL, USA, 6–11 October 2013. [Google Scholar]
- Guzzella, L.; Sciarretta, A. Vehicle Propulsion Systems; Springer: Berlin/Heidelberg, Germany, 2013. [Google Scholar] [CrossRef]
- Zhang, T.; Chen, X.; Yu, Z.; Zhu, X.; Shi, D. A Monte Carlo Simulation Approach to Evaluate Service Capacities of EV Charging and Battery Swapping Stations. IEEE Trans. Ind. Inform. 2018, 14, 1551–3203. [Google Scholar] [CrossRef]
- Bach, T.; Schuster, S.F.; Fleder, E.; Müller, J.; Brand, M.J.; Lorrmann, H.; Jossen, A.; Sextl, G. Nonlinear Aging of Cylindrical Lithium-Ion Cells Linked to Heterogeneous Compression. J. Energy Storage 2016, 5, 212–223. [Google Scholar] [CrossRef]
- Olmos, J.; Gandiaga, I.; Saez-de-Ibarra, A.; Larrea, X.; Nieva, T. Modelling the Cycling Degradation of Li-Ion Batteries: Chemistry Influenced Stress Factors. J. Energy Storage 2021, 40, 102765. [Google Scholar] [CrossRef]
- Sui, X.; Swierczynski, M.; Teodorescu, R.; Stroe, D.-I. The Degradation Behavior of LiFePO4/C Batteries during Long-Term Calendar Aging. Energies 2021, 14, 1732. [Google Scholar] [CrossRef]
- Tran, M.-K.; Mathew, M.; Janhunen, S.; Panchal, S.; Raahemifar, K.; Fraser, R.; Fowler, M. A Comprehensive Equivalent Circuit Model for Lithium-Ion Batteries, Incorporating the Effects of State of Health, State of Charge, and Temperature on Model Parameters. J. Energy Storage 2021, 43, 103252. [Google Scholar] [CrossRef]
- Hasselby, F. Dynamic Modelling of Battery Cooling Systems for Automotive Applications. Master’s Thesis, Chalmers University of Technology, Göteborg, Sweden, 2013. Available online: https://publications.lib.chalmers.se/records/fulltext/195310/195310.pdf (accessed on 15 June 2022).
- Caterpillar C175-16 Diesel Generator Set Product Data. Available online: https://www.cat.com/en_US/products/new/power-systems/electric-power/diesel-generator-sets/1000028916.html (accessed on 15 June 2022).
- Perry, R.H.; Green, D.W. Perry’s Chemical Engineers’ Handbook, 7th ed.; McGraw-Hill: New York, NY, USA, 1997. [Google Scholar]
- Dallmann, T.; Posada, F.; Bandivadekar, A. Costs of Emission Reduction Technologies for Diesel Engines Used in Non-Road Vehicles and Equipment. The ICCT Working Paper. 2018. Available online: https://theicct.org/wp-content/uploads/2021/06/Non_Road_Emission_Control_20180711.pdf (accessed on 15 June 2022).
- Borup, R.; Weber, A.; Ahluwalia, R.K.; Mukundan, R.; Myers, D.; Neyerlin, K.C. M2FCT: Million Mile Fuel Cell Truck Consortium. DOE Hydrogen Fuel Cell Technologies Office. In Proceedings of the Annual Merit Review and Peer Evaluation Meeting, Virtual, 6–8 June 2022; Available online: https://www.hydrogen.energy.gov/pdfs/review22/fc339_weber_borup_2022_o.pdf (accessed on 15 June 2022).
Figure 1.
Powertrain configurations: (a) diesel genset; (b) hybrid fuel cell. The reference diesel truck has an electric drivetrain with dual motors and gearboxes. The fuel cell powertrain retains the same electric drivetrain but has DC–DC converters for matching the voltages of the battery, FC stack, and traction motors.
Figure 2.
Steady-state FCS and battery performance are presented to illustrate the effect of degradation. Actual performance is dynamic and depends on ambient temperature. (a) FCS and diesel genset efficiencies at steady state; (b) battery charge and discharge efficiencies at steady state.
Figure 2.
Steady-state FCS and battery performance are presented to illustrate the effect of degradation. Actual performance is dynamic and depends on ambient temperature. (a) FCS and diesel genset efficiencies at steady state; (b) battery charge and discharge efficiencies at steady state.
Figure 3.
Thermal management systems for battery and FCS. The drivetrains have separate circuits for cooling the traction motor and the final drive. (a) Battery thermal management system (BTMS); (b) FCS heat rejection system.
Figure 3.
Thermal management systems for battery and FCS. The drivetrains have separate circuits for cooling the traction motor and the final drive. (a) Battery thermal management system (BTMS); (b) FCS heat rejection system.
Figure 4.
Illustration of battery capacity sizing methodology to achieve 25,000 h operating life by controlling the charge and discharge C-rates, mean SOC, and DOD: (a) Capacity fade; (b) Average C-rates for charge and discharge; (c) Upper and lower SOC.
Figure 4.
Illustration of battery capacity sizing methodology to achieve 25,000 h operating life by controlling the charge and discharge C-rates, mean SOC, and DOD: (a) Capacity fade; (b) Average C-rates for charge and discharge; (c) Upper and lower SOC.
Figure 5.
The trade-off between battery capacity and battery lifetime in the FCH and FCBC configurations. A smaller battery has a shorter lifetime and requires one or more replacements over 25,000 h.
Figure 5.
The trade-off between battery capacity and battery lifetime in the FCH and FCBC configurations. A smaller battery has a shorter lifetime and requires one or more replacements over 25,000 h.
Figure 6.
Dynamic BTMS power consumption on truck drive cycle at extreme conditions representing 100% and 70% battery state of health (BOL and EOL) and the hot and normal ambient temperatures (50 and 25 °C), which also affect the battery temperature (35 and 25 °C): (a) FCH platform; (b) FCBC platform.
Figure 7.
Power sharing between FCS and battery during a mining truck duty cycle at extreme conditions: BOL vs. EOL and 50 °C vs. 25 °C ambient temperatures: (a) FCH platform; (b) FCBC platform.
Figure 7.
Power sharing between FCS and battery during a mining truck duty cycle at extreme conditions: BOL vs. EOL and 50 °C vs. 25 °C ambient temperatures: (a) FCH platform; (b) FCBC platform.
Figure 8.
Degradation in FCS and battery efficiencies over the lifetime of the FCH and FCBC platforms. The results are presented over the truck duty cycle to emphasize the dynamic variations in battery performance during the charge and discharge cycles: (a) FCS efficiencies; (b) Battery efficiencies.
Figure 9.
Total cost of ownership of the diesel and fuel cell hybrid platforms is USD 3.25/gal for diesel, USD 5/kg-H2 for the status technologies, and USD 3/kg-H2 for the ultimate technologies. The TCO is dominated by fuel costs and is more aptly described by the breakeven cost of H2 relative to diesel for TCO parity: (a) CAPEX; (b) TCO.
Figure 10.
Sensitivity of breakeven H2 price to FCS-specific cost relative to USD 3.25/gal diesel and an ESS cost of USD 157/kWh (solid lines) and USD 80/kWh (dashed lines).
Figure 10.
Sensitivity of breakeven H2 price to FCS-specific cost relative to USD 3.25/gal diesel and an ESS cost of USD 157/kWh (solid lines) and USD 80/kWh (dashed lines).
Table 1.
Haul route from Reference [
23].
Table 1.
Haul route from Reference [
23].
| | Sector | Distance [m] | Grade % | Speed [mph] | Normalized Truck Mass | Time [s] |
|---|
| Ingress | 0 | 25 | 0 | 1.4 | 1 | 40 |
| 1 | 125 | 0 | 9.3 | 1 | 30 |
| 2 | 175 | 0 | 28 | 1 | 14 |
| 3 | 50 | 0 | 18.6 | 1 | 6 |
| Descent | 4 | 1005 | −10 | 18.6 | 1 | 121 |
| 5 | 250 | 0 | 28 | 1 | 20 |
| 6 | 100 | 0 | 9.3 | 1 | 24 |
| 7 | 20 | 0 | 4.5 | 1 | 10 |
| Fill | 8 | 1 | 0 | 0 | 2.28 | 120 |
| 9 | 100 | 0 | 9.3 | 2.28 | 24 |
| 10 | 250 | 0 | 18.6 | 2.28 | 30 |
| Ascent | 11 | 1005 | 10 | 18.6 | 2.28 | calculated |
| 12 | 50 | 0 | 18.6 | 2.28 | 6 |
| 13 | 175 | 0 | 28 | 2.28 | 14 |
| 14 | 125 | 0 | 9.3 | 2.28 | 30 |
| Egress | 15 | 25 | 0 | 1.1 | 2.28 | 52 |
| Dump | 16 | 1 | 0 | 0 | 1 | 40 |
Table 2.
Performance and cost metrics for diesel genset, status FCS, and ultimate FCS.
Table 2.
Performance and cost metrics for diesel genset, status FCS, and ultimate FCS.
| | Units | Genset | FCS Status | FCS Ultimate |
|---|
| Performance Metrics | | | | |
| Engine Specific Power | W/kg | 158 | 1000 | 1000 |
| Fuel Storage System-Specific Energy | kWh/kg | 8.0 | 6.0 | 6.0 |
| ESS Specific Energy | Wh/kg | | 200 | 200 |
| BTMS Specific Power | W/kg | | 123 | 123 |
| Vehicle Parameters | | | | |
| Annual Operating Hours | h | 6000 | 6000 | 6000 |
| Engine TBO (Diesel) or Lifetime (FCS) | h | 20,000 | 25,000 | 25,000 |
| Cost Metrics | | | | |
| Tier-4 Genset or FCS | USD/kW | 250 | 323 | 60 |
| Engine Overhaul, Stack Replacement | % | 79 | 73 | 73 |
| Battery | USD/kWh | | 157 | 80 |
| Engine or FCS Routine Maintenance | USD/MWh | 5.3 | 8.3 | 8.3 |
| Drivetrain Components | | | | |
| Alternator | USD/kW | 59 | | |
| Rectifier | USD/kW | 90 | | |
| DC Link | USD/kW | 1.5 | | |
| DC-DC Converter | USD/kW | | 75 | 75 |
| Inverter | USD/kW | 75 | 75 | 75 |
| AC Motor | USD/kW | 120 | 120 | 120 |
| Gearbox | USD/kW | 70 | 70 | 70 |
| Power Conditioning | USD/kW | 60 | 60 | 60 |
| Fuel Related Cost | | | | |
| Fuel | USD/gal, USD/kg | 3.25 | 5 | 3 |
| Lubrication | USD/gal | 0.49 | | |
| Diesel Exhaust Fluid (Urea) | USD/gal | 0.18 | | |
| Financial Parameters | | | | |
| Economic Lifetime | years | 15 | 15 | 15 |
| Salvage Value | % Price | 23 | 23 | 23 |
| Internal Rate of Return (IRR) | % | 7 | 7 | 7 |
| Inflation | % | 2 | 2 | 2 |
| Installation Cost Multiplier | | 1.3 | 1.3 | 1.3 |
Table 3.
Radiator heat loads, power sharing, and system parasitic sources at the rated power condition of 50 °C ambient temperature. Thermal management systems for FCS and ESS are independent.
Table 3.
Radiator heat loads, power sharing, and system parasitic sources at the rated power condition of 50 °C ambient temperature. Thermal management systems for FCS and ESS are independent.
| 3500 hp Equivalent Mining Truck | Units | Diesel | FCH | FCBC |
|---|
| Powertrain | | | | |
|---|
| Engine/FCS, w/o Fan | kWe | 2611 | 1387 | 1172 |
| FC stack | kWe | | 1568 | 1325 |
| CEM Parasitic | kWe | | 144 | 122 |
| Other FCS Parasitics 1 | kWe | | 38 | 32 |
| Other System Parasitics 2 | kWe | 29 | 29 | 29 |
| Radiator Fan | kWe | 209 | 209 | 209 |
| BTMS 3 | kWe | | 45 | 63 |
| Battery Discharge Power | kWe | | 1125 | 1350 |
| Heat Duty Parameters | | | | |
| High-Temperature Radiator | kW | 1352 | 1292 | 1092 |
| CAC/Low-Temperature Radiator | kW | 451 | 130 | 110 |
| AC Condenser | kW | 7 | 7 | 7 |
| BTMS 3 | kW | | 50 | 70 |
| Disclaimer/Publisher’s Note: The statements, opinions and data contained in all publications are solely those of the individual author(s) and contributor(s) and not of MDPI and/or the editor(s). MDPI and/or the editor(s) disclaim responsibility for any injury to people or property resulting from any ideas, methods, instructions or products referred to in the content. |
© 2022 by the authors. Licensee MDPI, Basel, Switzerland. This article is an open access article distributed under the terms and conditions of the Creative Commons Attribution (CC BY) license (https://creativecommons.org/licenses/by/4.0/).


