Article

Techno-Economic and Environmental Analysis of Renewable Mix Hybrid Energy System for Sustainable Electrification of Al-Dhafrat Rural Area in Oman

1
Department of Electrical and Computer Engineering, College of Engineering, Sultan Qaboos University, Muscat 123, Oman
2
Sustainable Energy Research Center, Sultan Qaboos University, Muscat 123, Oman
3
Mazoon Electricity Company (MZEC), Muscat 123, Oman
*
Authors to whom correspondence should be addressed.
Energies 2023, 16(1), 288; https://doi.org/10.3390/en16010288
Submission received: 5 December 2022 / Revised: 22 December 2022 / Accepted: 23 December 2022 / Published: 27 December 2022
(This article belongs to the Special Issue Renewable Energy, Environmental Quality and Sustainability)

Abstract

:
Affordable and clean energy for any rural community is crucial for the sustainable development of the community and the nation at large. The utilization of diesel-based power generation is one of the barriers to the sustainable development of these communities. Such generations require fuel that has a volatile market price and emits massive greenhouse gas emissions. This paper presents the design, modeling, and simulation of a hybrid power system for a rural area in the Sultanate of Oman that aims to reduce daily consumption of diesel fuel and greenhouse gas emissions. Hybrid Optimization of Multiple Energy Resources (HOMER) is utilized to model multiple energy mix hybrid systems and to propose the best optimal energy mix system for a selected community. In addition, Electrical Transient Analyzer Program (ETAP) software is employed to assess hybrid system operational performances, such as bus voltage profiles and active and reactive power losses. This study revealed that the PV–wind–diesel system is the optimal energy mix hybrid microgrid for the Al-Dhafrat rural area in Oman, with a net present cost of USD 14.09 million. Compared to the currently operating diesel-based system, the deployment of this microgrid can reduce the levelized cost of energy, diesel fuel consumption, and greenhouse gas emissions per year by 54.56%, 70.44%, and 70.40%, respectively. This study confirms that the Sultanate of Oman has a substantial opportunity to install a hybrid microgrid system for rural diesel-based communities to achieve sustainable development in the country.

1. Introduction

The global use of renewable energy sources for electrification is rapidly increasing due to their technological improvement and economic and environmental benefits. The world renewable power production capacity was 3064 GW by 2021, with 849 GW and 825 GW solar and wind capacities, respectively. The largest source of the majority share of the world’s capacity is hydropower, which accounted for 1203 GW. Figure 1 illustrates the consistent capacity growth of renewable power worldwide [1]. In 2021, the capacity growth for off-grid applications was 466 MW, among which solar increased by 312 MW, followed by hydropower. The integration of renewables, such as wind and solar power, for off-grid and rural electrification is much lower compared to that for urban electrification.
A common approach to electrifying rural and isolated areas is diesel-based power generation. Diesel power generation produces significant greenhouse gas emissions. The cost of diesel prices varies and increases due to geopolitical situations. Moreover, the transportation of diesel fuel to rural, isolated areas becomes difficult and thus increases the operating cost of diesel-based power generation [2,3]. Deploying renewable-based electricity for rural and off-grid electrification can significantly reduce the consumption of fossil fuel, especially diesel, and production of greenhouse gas emissions. Hence, integrating of renewable sources in rural area electrification can improve the quality of life for the citizens in rural areas and accelerate the local and global sustainable development process.
In the Sultanate of Oman, the Rural Areas Electricity Company (Tanweer) serves remote areas to generate, distribute, and supply electricity. Electricity supply from the main interconnected system (MIS) or the primary grid to these areas is not economically feasible. The Tanweer network provides electricity to the Governorates of Musandam, Al Wusta, Dhofar, Al Dakhliya, Al Dahirah, and Sharqiyah, which account for almost 73% of the land area of the Sultanate. In 2021, the total energy sent to the Tanweer customers was 1296 GWh. Among this, 28 diesel power plants in the Tanweer network supply 866.143 GWh. The rest of the power was purchased by Tanweer from Petroleum Development of Oman, the Tibat gas-fired power plant, and Al-Mazyunah (solar photovoltaic (PV)) sources. In addition, the Tanweer network has commissioned a 50 MW wind farm (the first in Oman and the region) in the Dhofar region and produced 120.5 GWh of energy in 2021. It is worth mentioning that the growth of customers for the Tanweer network was 6.5% in 2021. This has increased the energy supply by 7.8% compared to 2020. The electricity production in 2021 requires 160.28 million liters of diesel fuel consumption and emits approximately 357,638.86 tonnes of CO2 annually. The overall system loss was 8.8% for 2021 [4]. Nevertheless, almost 90% of the energy requirement in the Tanweer network depends on diesel-based power generation, which restricts sustainable and carbon neural future development for the well-being of the rural area communities. Therefore, it is crucial to investigate the opportunity to develop renewable-based power generation facilities for the rural areas within the Tanweer network that can supplement or replace the diesel-based generation and provide a pathway toward low-carbon rural area electrification.
Renewable integration in a hybrid form is an effective solution for sustainable electrification for diesel-based communities. A hybrid microgrid system improves system efficiency and stability, increases reliability and resiliency, reduces emission and energy costs, and maximizes the use of locally available renewable resources [5,6]. Over the last decades, many research works have been conducted on hybrid microgrid systems design and investigation for stand-alone [7,8,9,10,11,12,13,14,15,16,17,18,19,20,21,22,23,24,25,26,27] or grid-connected [28,29,30,31,32,33,34,35,36,37] applications. Researchers in [7] conducted a techno-economic feasibility study, including sensitivity analysis for a renewable mix microgrid system for an island application using Hybrid Optimization of Multiple Energy Resources (HOMER) software. This research outcome indicated that the energy cost of using a renewable mix hybrid system is 28% lower and can reduce by 23% CO2 emissions compared to the existing diesel-based system. Saeedahmed et al. [8] performed a feasibility analysis of a hybrid power system supplying load in an off-grid application. They found that the wind–diesel–fuel cell battery system provides low-cost energy over the other combinations of hybrid microgrid systems, such as wind–fuel cell battery and diesel-only. In a study by Rad et al. [9], a techno-economic analysis of a hybrid system using HOMER, and a multicriteria decision-making tool for supplying power to a rural village was conducted. Wind–PV–fuel cell battery was found to be a low-cost energy system for this village load.
The authors of [10] investigated the feasibility of developing a hybrid power production system for an off-grid application using the HOMER software. The study revealed that a wind–PV–diesel battery-based hybrid system could produce low-cost energy for the load. With the use of a multicriteria decision-making tool, the sizing of a hybrid power system was carried out based on economic and environmental aspects, where a wind–biogas–PV system was found to be more economical than the existing PV–diesel system [11]. Giallanza et al. [12] studied reliability-constrained-based sizing of a PV–wind–battery off-grid hybrid system using an iterative process in MATLAB, which indicated that improvement in reliability has increased with the increase in the cost of the system. The optimal energy mix and socio-economic analysis of an off-grid hybrid system were examined using the nondominated sorting genetic algorithm II in MATLAB. PV–wind–biogas–fuel cell-based configuration was found to be an optimal hybrid system [13]. The excess energy of this system was utilized in a water desalination plant to produce freshwater for this rural community. Amupolo et al. [14] examined different configurations of hybrid power systems for an off-grid application using HOMER software. The analysis revealed PV–diesel–battery as a low-energy cost system; however, this system requires government subsidies for implementation since the system cost is still unaffordable for the customers.
A detailed feasibility analysis was conducted for a remote coastal region using HOMER and MATLAB software [15]. It revealed that a floating PV–battery system could produce energy at a cost that is in line with the grid energy cost with a significant reduction in greenhouse gas emissions. Authors in [16] assessed the techno-economic analysis of a hybrid microgrid system for the semielectrification of a rural village using HOMER. They have found that a PV–diesel–battery hybrid system is economically viable; however, the energy cost is almost double that of a grid-connected hybrid system. A comparative analysis of various configurations of isolated microgrid systems using techno-economic indices was carried out for various rural areas worldwide [17]. This study found that PV–diesel could produce energy at a low cost; however, government incentives and community support are required to successfully implement this hybrid system. A hybrid microgrid system for remote village electrification using HOMER software was studied in [18]. It was found that PV–diesel–battery is a low-cost optimal system for this rural village electrification. Researchers in [19] evaluated the techno-economic feasibility of a hybrid system for a remote island using a genetic algorithm and HOMER software. They discovered that a PV–wind–battery system is sufficient to supply the island load without violating the constraints but needs a high initial capital cost.
In [20], a feasibility study of a hybrid microgrid system for a rural community was presented using the HOMER tool. It also examined the impact of renewable resource variability on the electrical characteristics of hybrid systems using MATLAB/Simulink software. The wind–PV–battery system was found as the least-cost energy system that could maintain voltage at various buses and power balance in the system. Authors of [21] conducted a comparative study among various hybrid microgrid systems to identify the optimal mixed energy system for remote villages using HOMER and PVsyst software. It devised PV–diesel as an optimal hybrid system for one village while PV–wind–diesel is optimal for others. Manama et al. [22] assessed the techno-economic feasibility of a hybrid system that mitigates the load shedding and electricity deficits problem for a remote island. They used HOMER software for this study and found the PV–wind–fuel cell–diesel system to be optimal. A PV–wind–battery hybrid system for a remote household application was studied using the HOMER optimization tool, where the temperature effect and varying load conditions were considered [23]. With the various tilt angle adjustment, this research revealed a 10% reduction in net present cost compared to the similar system in the literature. The authors in [24] conducted a techno-economic analysis of a renewable sources-based hybrid power system for an island application using HOMER software. They discovered that a PV–wind–diesel–battery system produces power at the lowest levelized cost of energy with a renewable penetration was 58%. Sensitivity analysis only considered the load variation, whereas diesel cost and renewable resource uncertainties were not accounted for.
A techno-economic analysis of a hybrid microgrid system applied to healthcare premises in three rural areas revealed PV–wind–diesel–battery as an optimal mixed energy system [25]. The use of the HOMER optimization tool showed that the optimal system could reduce cost and emission compared to the diesel-only system and achieve zero loss of power supply probability. Authors of [26] discussed a PV–wind hybrid power systems for a remote base station in the telecommunication sector. This hybrid system could significantly reduce CO2 emissions and about 70–80% fuel costs compared to its existing diesel system. Researchers in [27] experimented with a PV–wind–battery hybrid system for performance evaluation. They revealed that the excess electricity charged the battery during the day and, the solar power had a significant contribution compared to the wind.
In view of the above review, while some research works focus on the technical feasibility (optimal configuration, energy production, and excess electricity production) of a system, others spotlight on economic (net present cost (NPC), levelized cost of energy (LCOE), initial cost, and fuel cost) viability of the system. Most of the past research assessed the environmental benefits (CO2) of adding a hybrid power system and examined the effect of uncertainties of the input variables by sensitivity analysis. However, the hybrid microgrid system operational performances, such as the voltage profile at the different buses in the distribution network supplied by the hybrid system and the system’s power loss profile in the network with a variation in renewable fraction, were not investigated. Different methods and optimization tools were utilized; however, HOMER emerged as the most widely adopted tool, and it was selected to determine the optimal mixed energy system in this study. In addition, the system’s operational performance was examined using Electrical Transient Analyzer Program (ETAP) software. It is also evident from the literature that each rural site has its unique characteristics (load profile, geographical location, locally available energy resources, the effect of temperature, etc.) and constraints, which leads to no unique solution for the sites. Therefore, the main objective of this study is to analyze the techno-economic–environmental aspects and operational performances of a hybrid microgrid power system for the Al-Dhafrat rural area located in the Sultanate of Oman. Accomplishing this objective allows the contributions of this study as follows:
  • Spotlight on technical, economic, and environmental aspects of installing a renewable–mix hybrid energy system for a diesel-based rural area community in the Sultanate of Oman.
  • Establish an optimal renewable–mix hybrid microgrid system for the Al-Dhafrat rural community for sustainable development and well-being of the people.
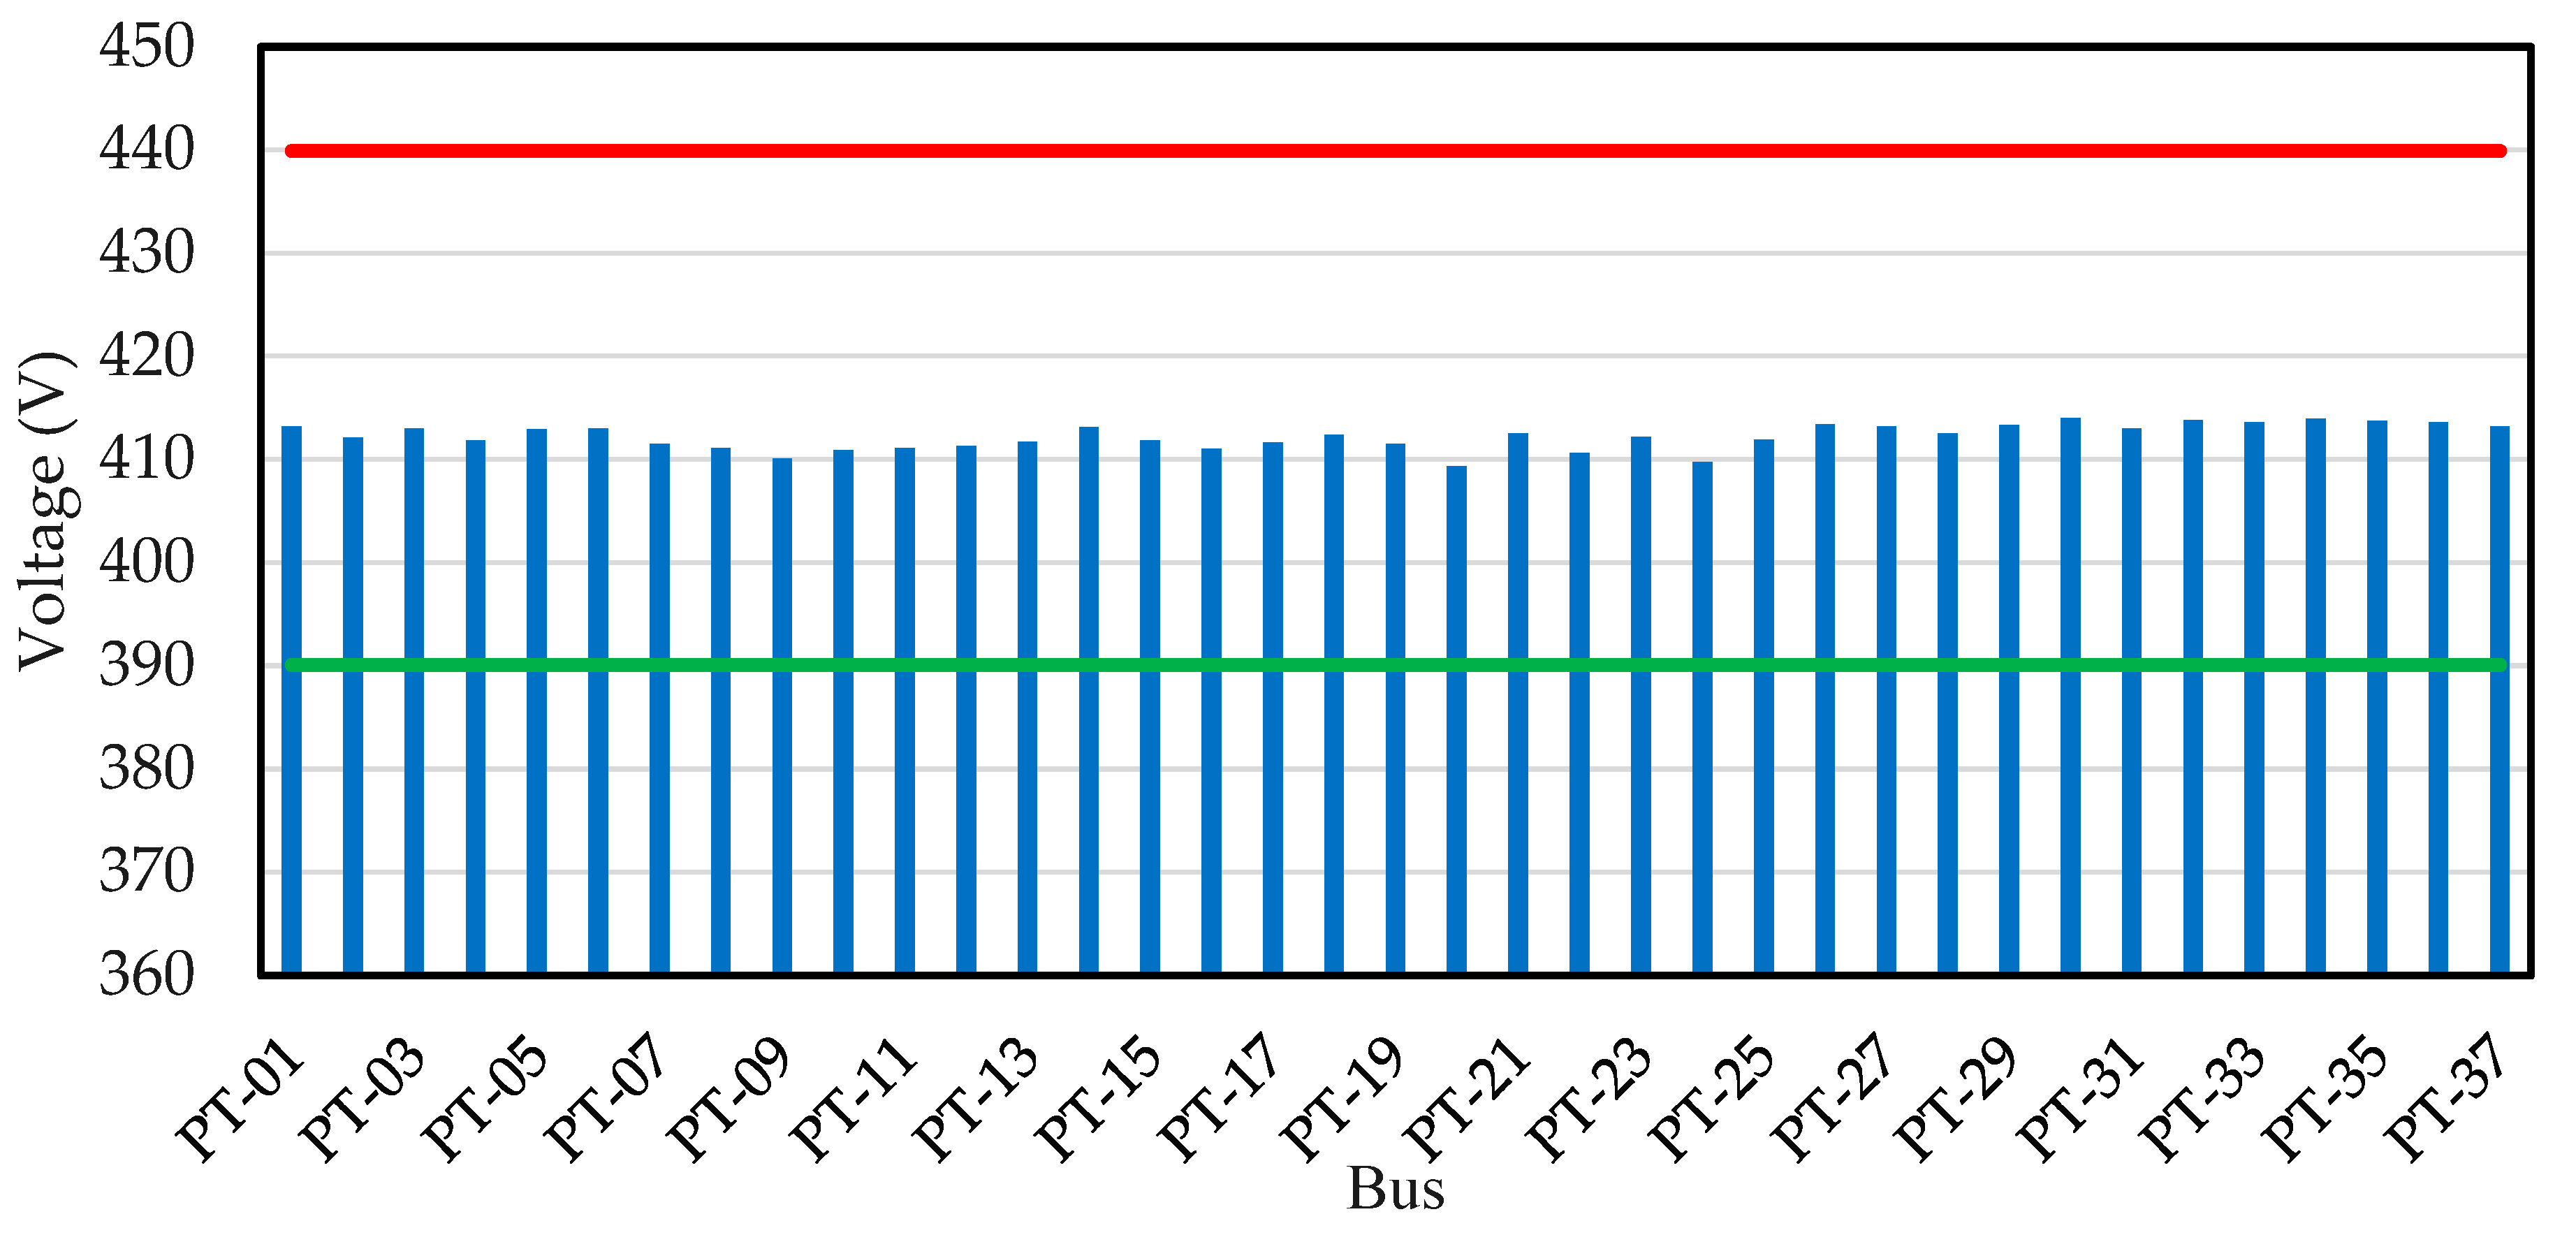
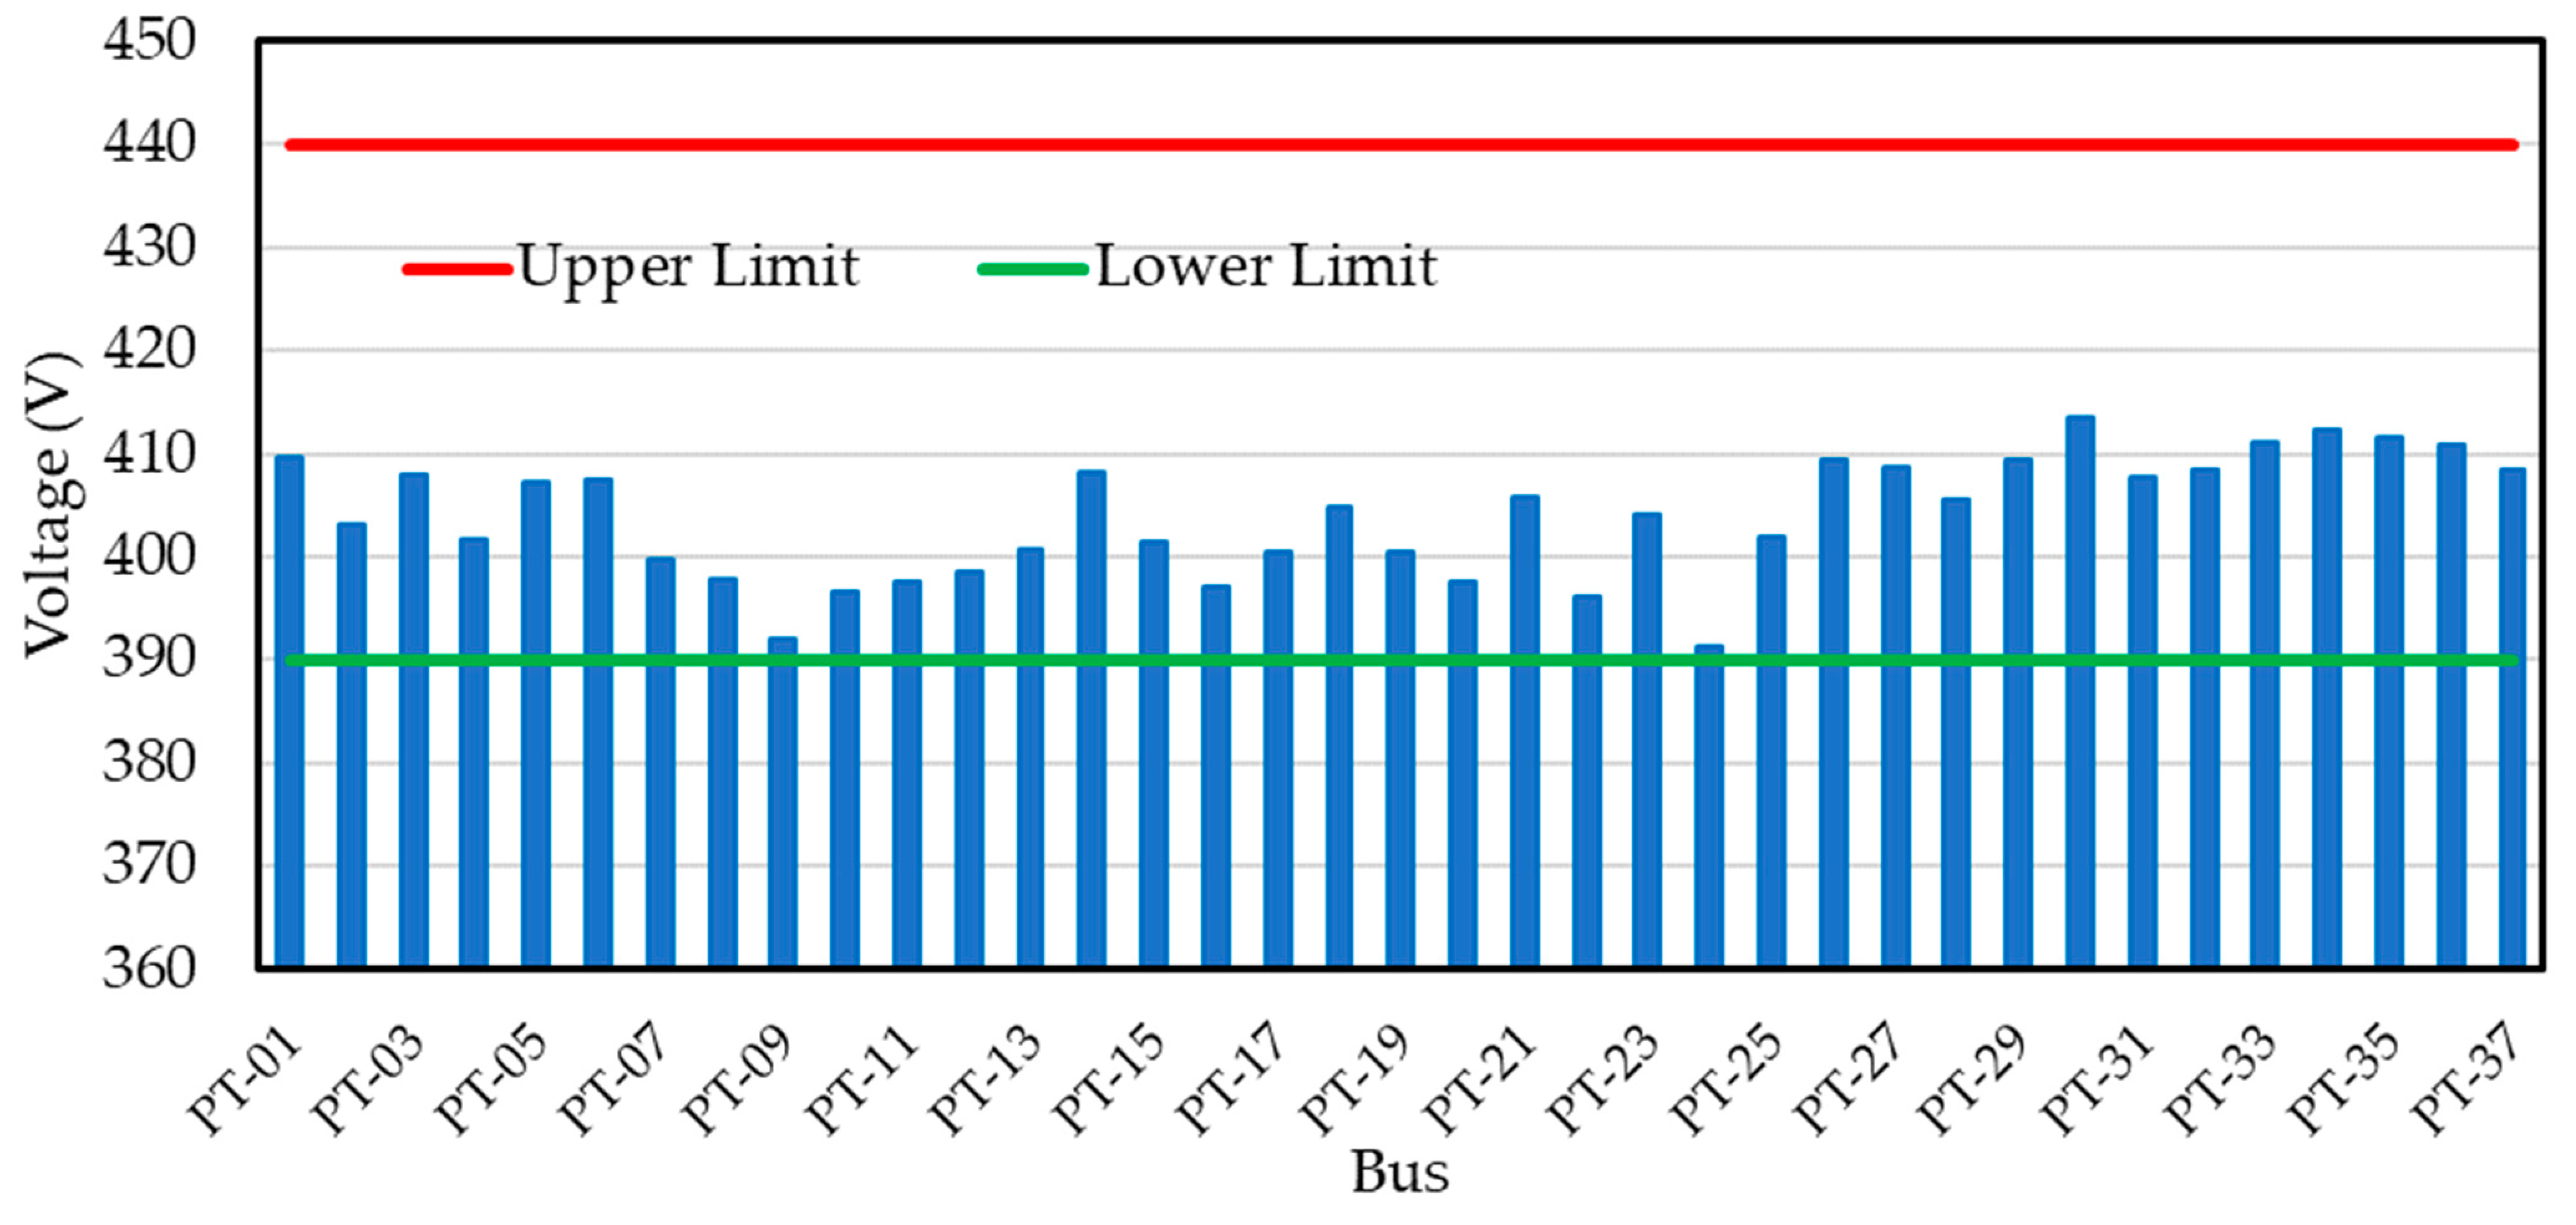
  • Testing system operational performance, such as bus voltage profile and system losses, while optimally designing a hybrid power system supplying power to the rural community loads.
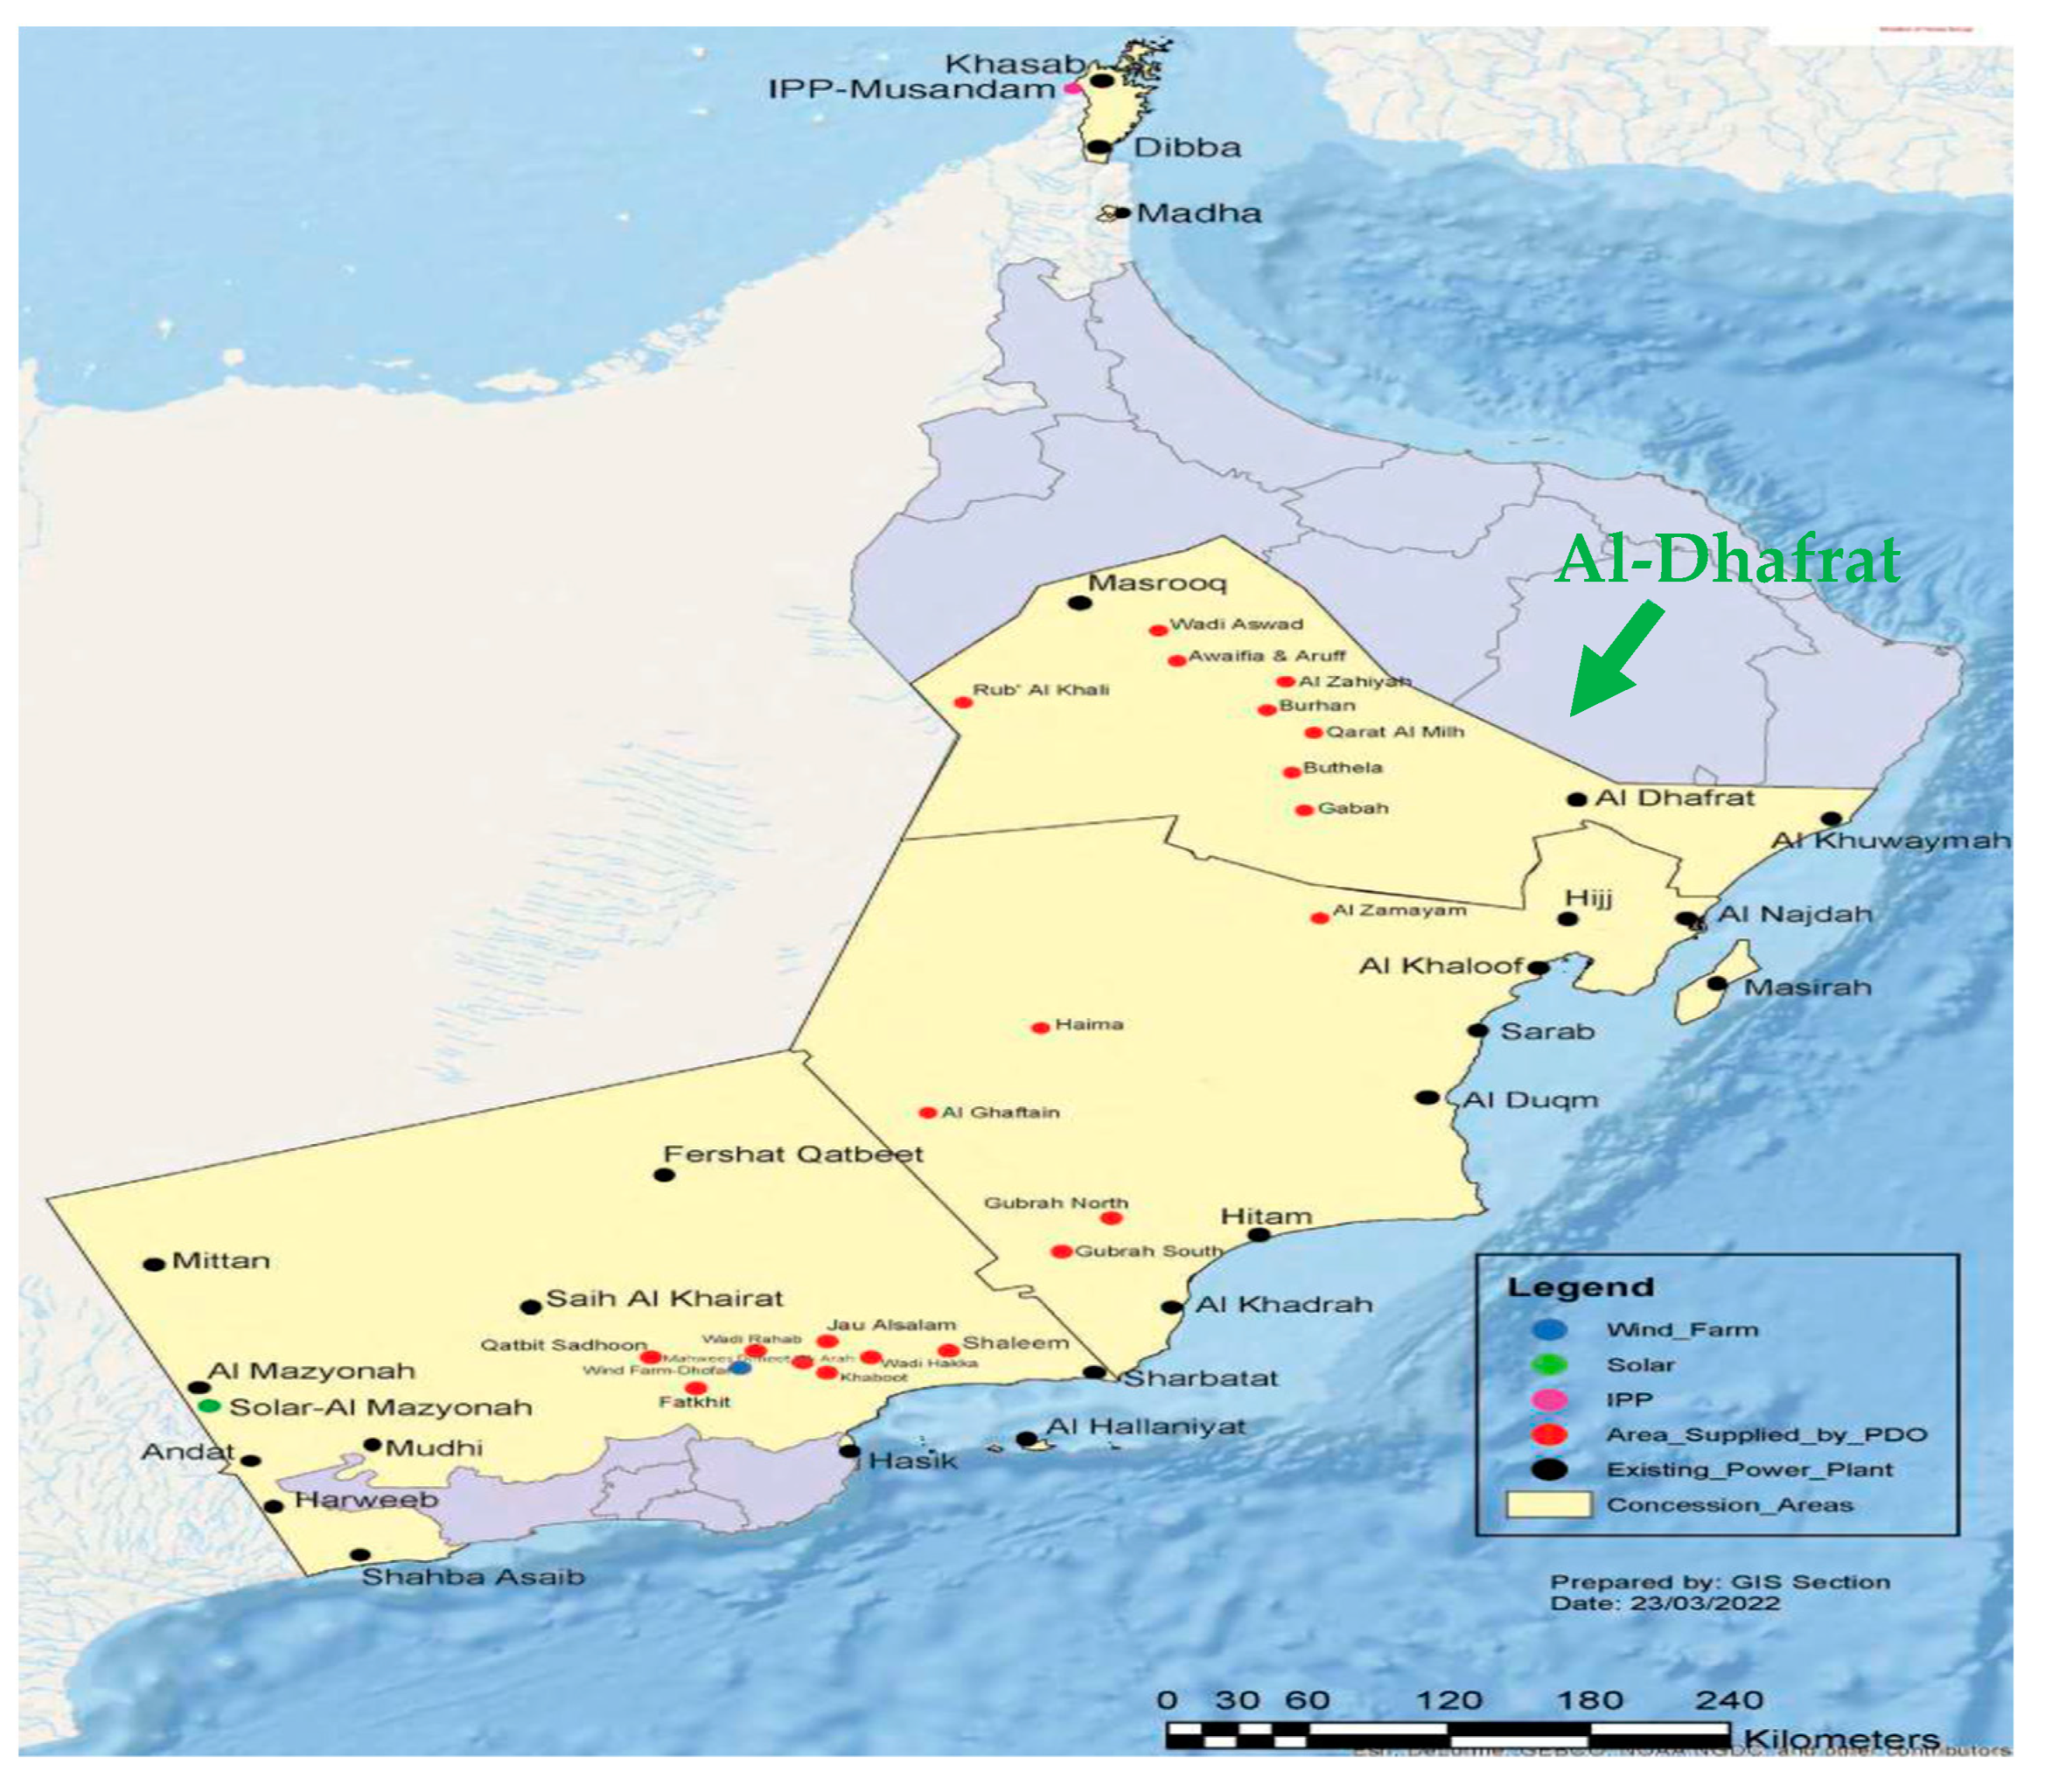
The rest of the paper is organized as follows: Section 2 presents a detailed study area. Section 3 describes the research methodology. The research results obtained through HOMER optimization and ETAP software are presented and discussed in Section 4. Section 5 concludes the paper with the future research direction.

2. Study Area

Al-Dhafrat is one of the rural areas covered by Tanweer and located (Figure 2) in wilayat Al-Mudaybi in Ash Sharqiyah North governorate in Oman. Al-Dhafrat’s rural area power network depends on diesel-based power generation, and its distribution network is isolated from the utility grid. There are four diesel generators in this network, and the installed capacity of each generator is 3.5 MW. The total installed capacity is 14 MW. The network consists of two feeders with 11 kV lines and 37 distribution transformers of three different ratings 100 kVA, 200 kVA, and 1000 kVA. In 2020, the peak load in the network was 1310 kW, and the daily energy consumption was 10.303 MWh. Figure 3 illustrates the monthly average power consumption, which indicates a higher consumption during the summer session, especially in April and June. Winter, especially January, represents low energy consumption season. It is clear that there is a significant difference in power consumption between the winter load and the summer load. The Dhafrat power station reveals significant fuel consumption in summer, especially in April, May, and June. However, the highest fuel consumption was in May due to peak power demand. The amount of diesel consumption was 161,005.00 L. The lowest fuel consumption was in January, only 38,849.00 L. The total amount of diesel consumption for one year is 1,089,664 L. Figure 4 shows the consumed fuel for one year. High fuel consumption leads to high operating costs and substantial greenhouse gas (GHG) emissions for the Al-Dhafrat power network.

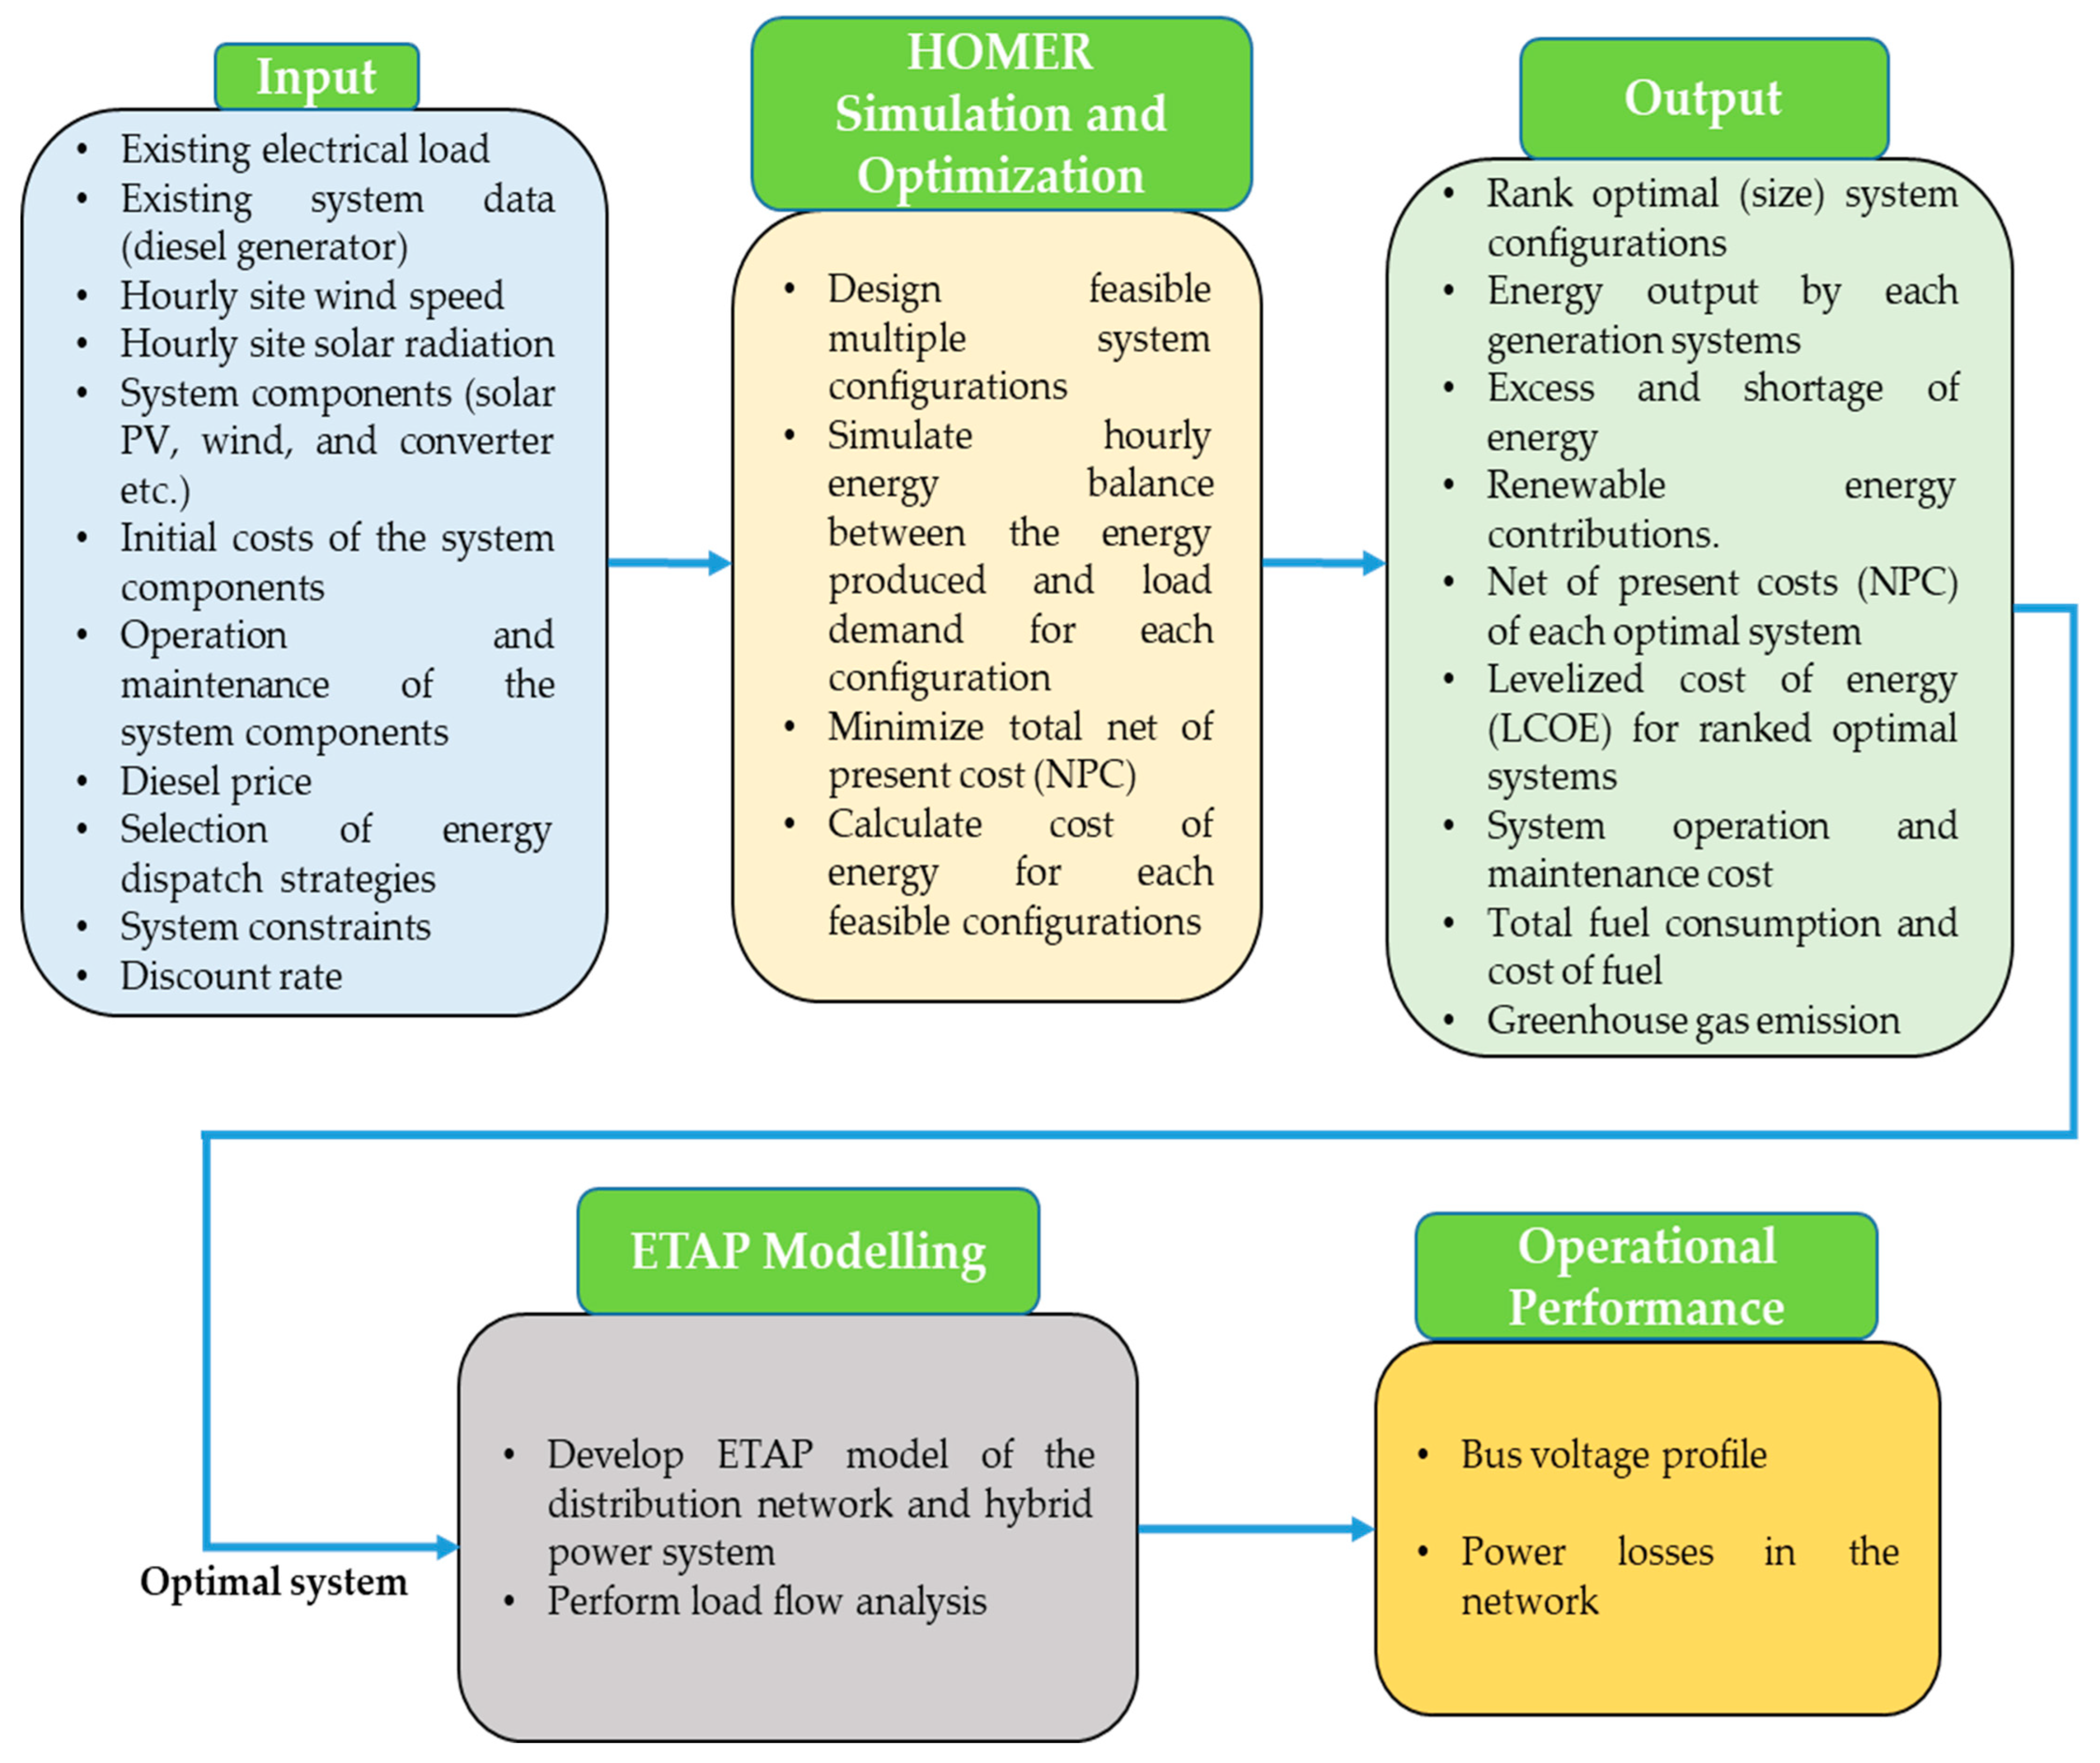
3. Research Methodology

This study establishes a framework for examining techno-economic, environmental, and operational performance aspects of a hybrid microgrid system for rural area applications. Figure 5 depicts the steps in the frameworks to analyze an optimal energy mix hybrid system for a diesel-based community. HOMER Pro and ETAP software are used to implement the proposed framework in order to analyze the technical, economic, environmental, and operational performance of the hybrid microgrid system.
A techno-economic-environmental study using HOMER requires specific inputs for a particular site. With the selection of a specific site or system, electrical load data, renewable energy resources, existing generator information (such as diesel generator capacity), proposed system components, and economic data, such as initial cost of the system components, operation and maintenance cost, diesel fuel cost, project lifetime, inflation rate, and discount rate, are used as inputs to the HOMER optimizer. HOMER performs simulation and optimization to determine the cost-effective feasible system that meets hourly load demand. The output of the HOMER optimizer provides technical (rank of optimal system configurations, energy production of each generation, renewable energy fraction, and excess energy), economic (NPC of each optimal system, LCOE of the ranked hybrid system, and renewable power generations, system operation and maintenance cost, savings in fuel consumption, and savings in cost), and environmental (greenhouse gas emission) outcomes of various feasible systems.
The most techno-economic feasible (optimal energy mix and low energy cost) system is chosen to analyze system operational performances. The optimal hybrid system is modeled using ETAP software. Models of the system components, distribution lines, and transformers are obtained from the ETAP library and customized to develop the complete model of the optimal microgrid system. A power flow analysis is carried out in the ETAP platform to examine the system operational performances (bus voltage profiles and system power losses) of the hybrid microgrid system.

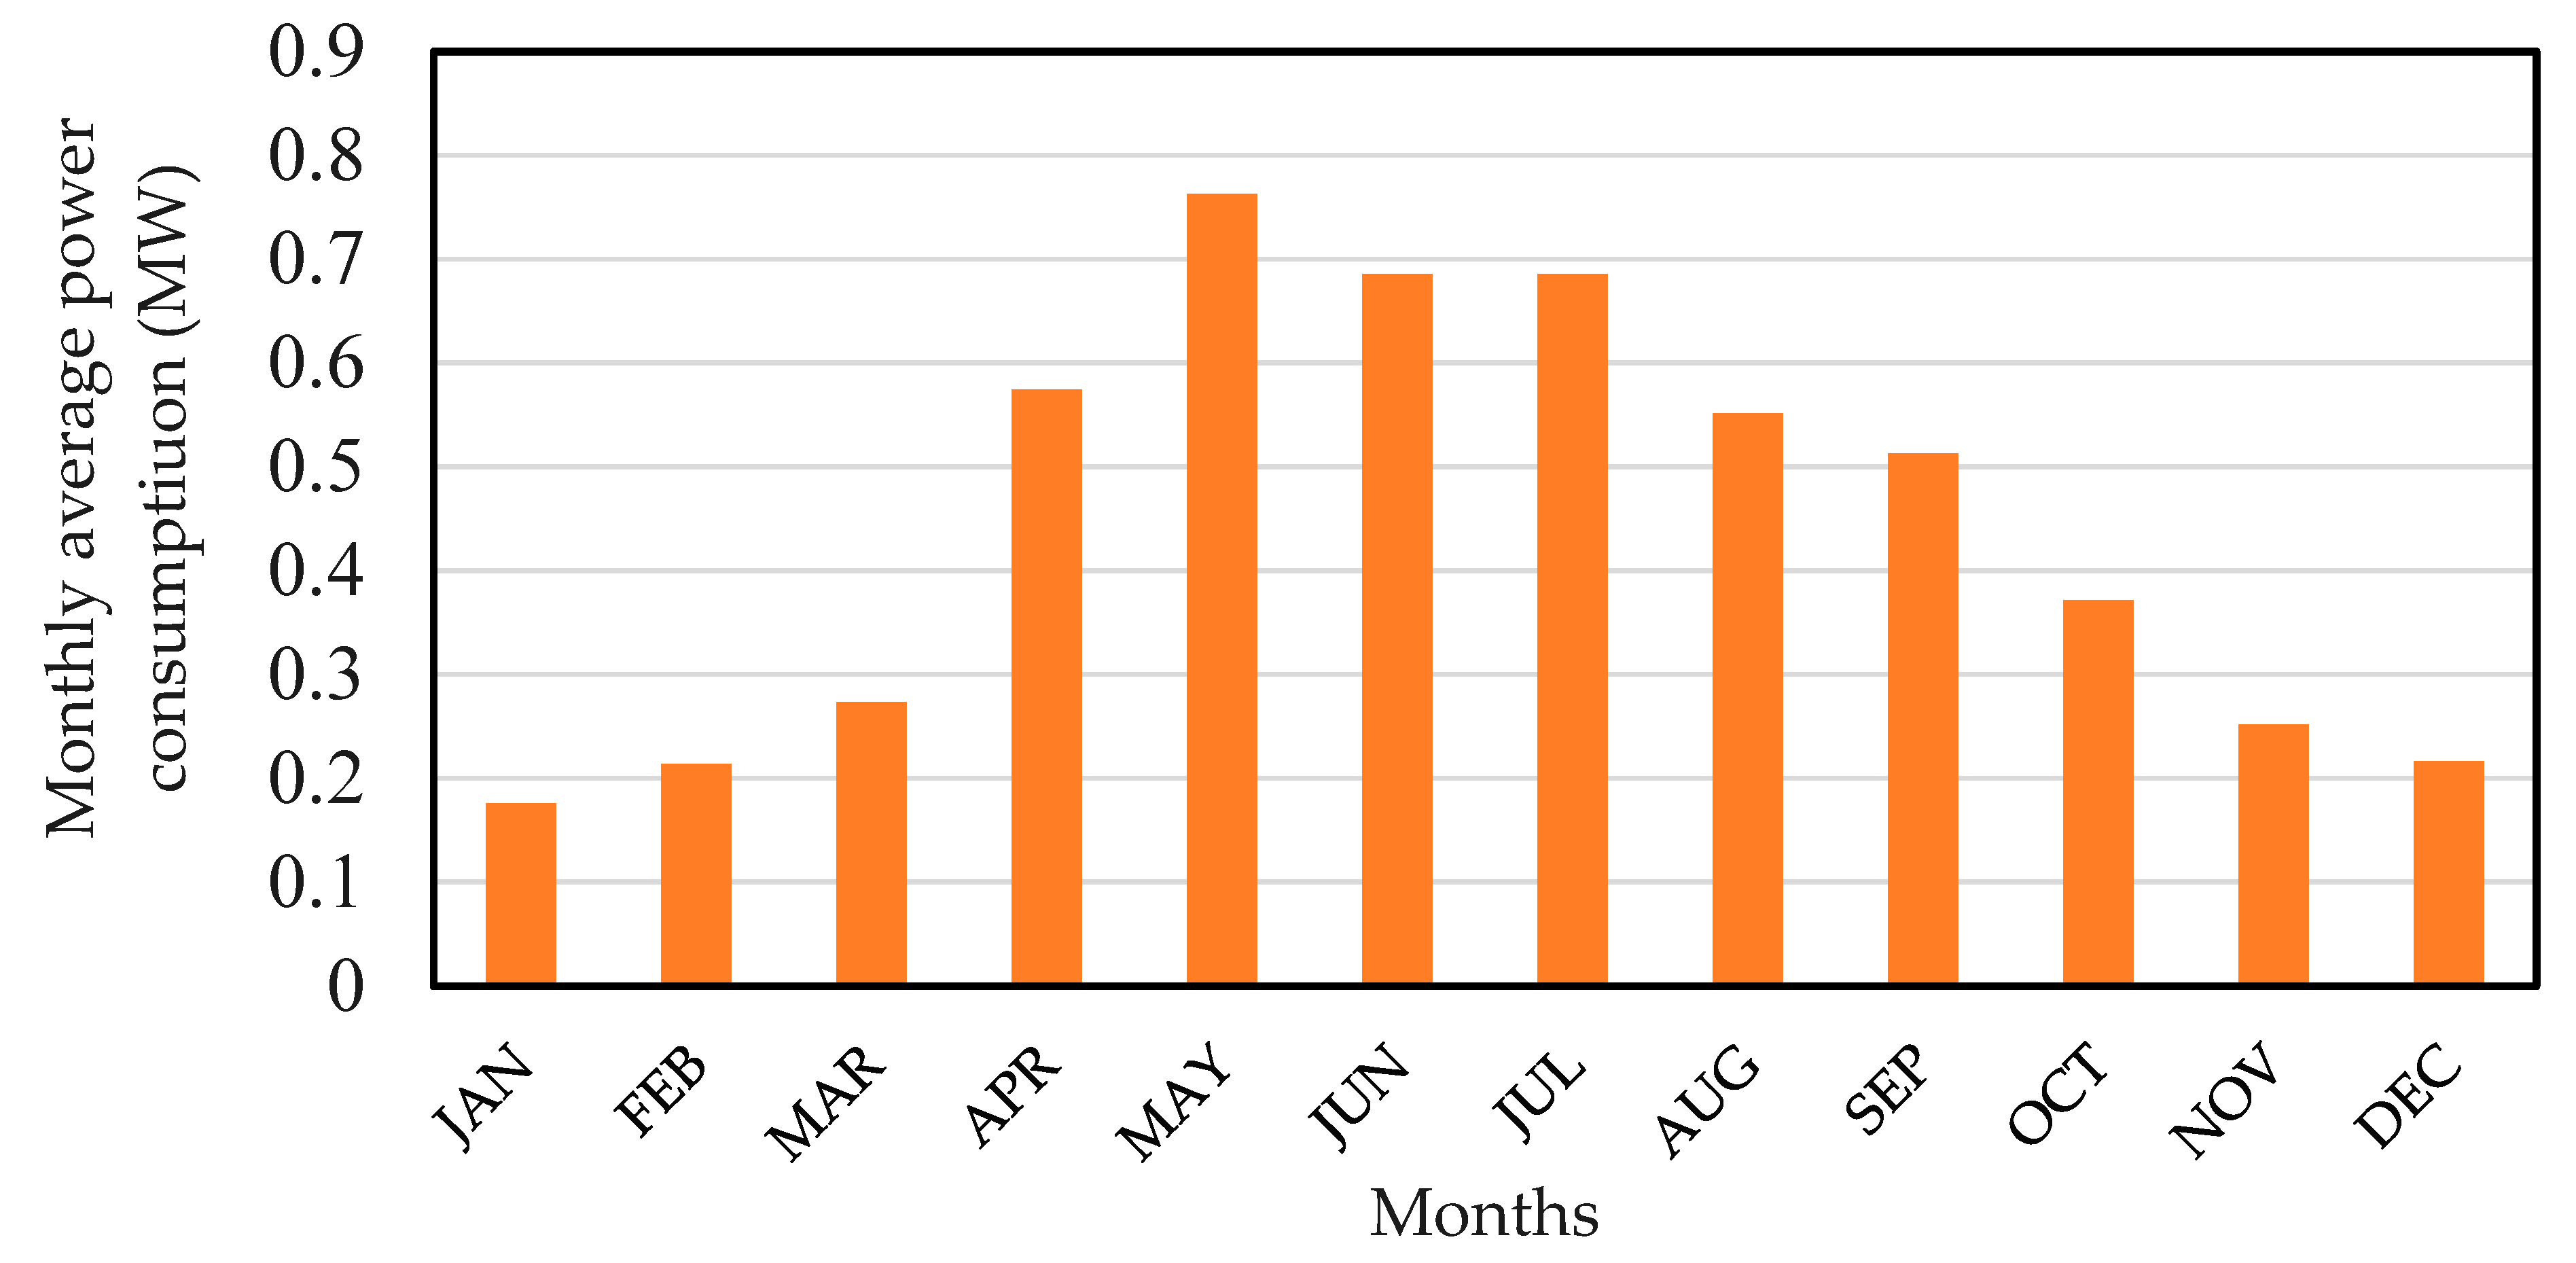
3.1. Electrical Load

One-year hourly load data of the Al-Dhafrat rural area power network was obtained from the Mazoon Electricity Company (MZEC) for the year 2020. Figure 6 illustrates the highest and lowest hourly load consumption for a day. The highest energy consumption occurred on April 24 (summer season), and the lowest was found on January 15 (winter season) of the same year. During summer, the load consumption increases gradually between 7:00 AM to 3:00 PM, and then it decreases again up to 8:00 PM. The load consumption reaches its peak at 3:00 PM, which is about 1310 kW. In summer, the load consumption variation is significant due to the operation of many air conditioners. In contrast, the variation in load consumption during the winter season is lesser, and the peak power consumption was 210 kW, while the minimum power consumption was 120 kW.

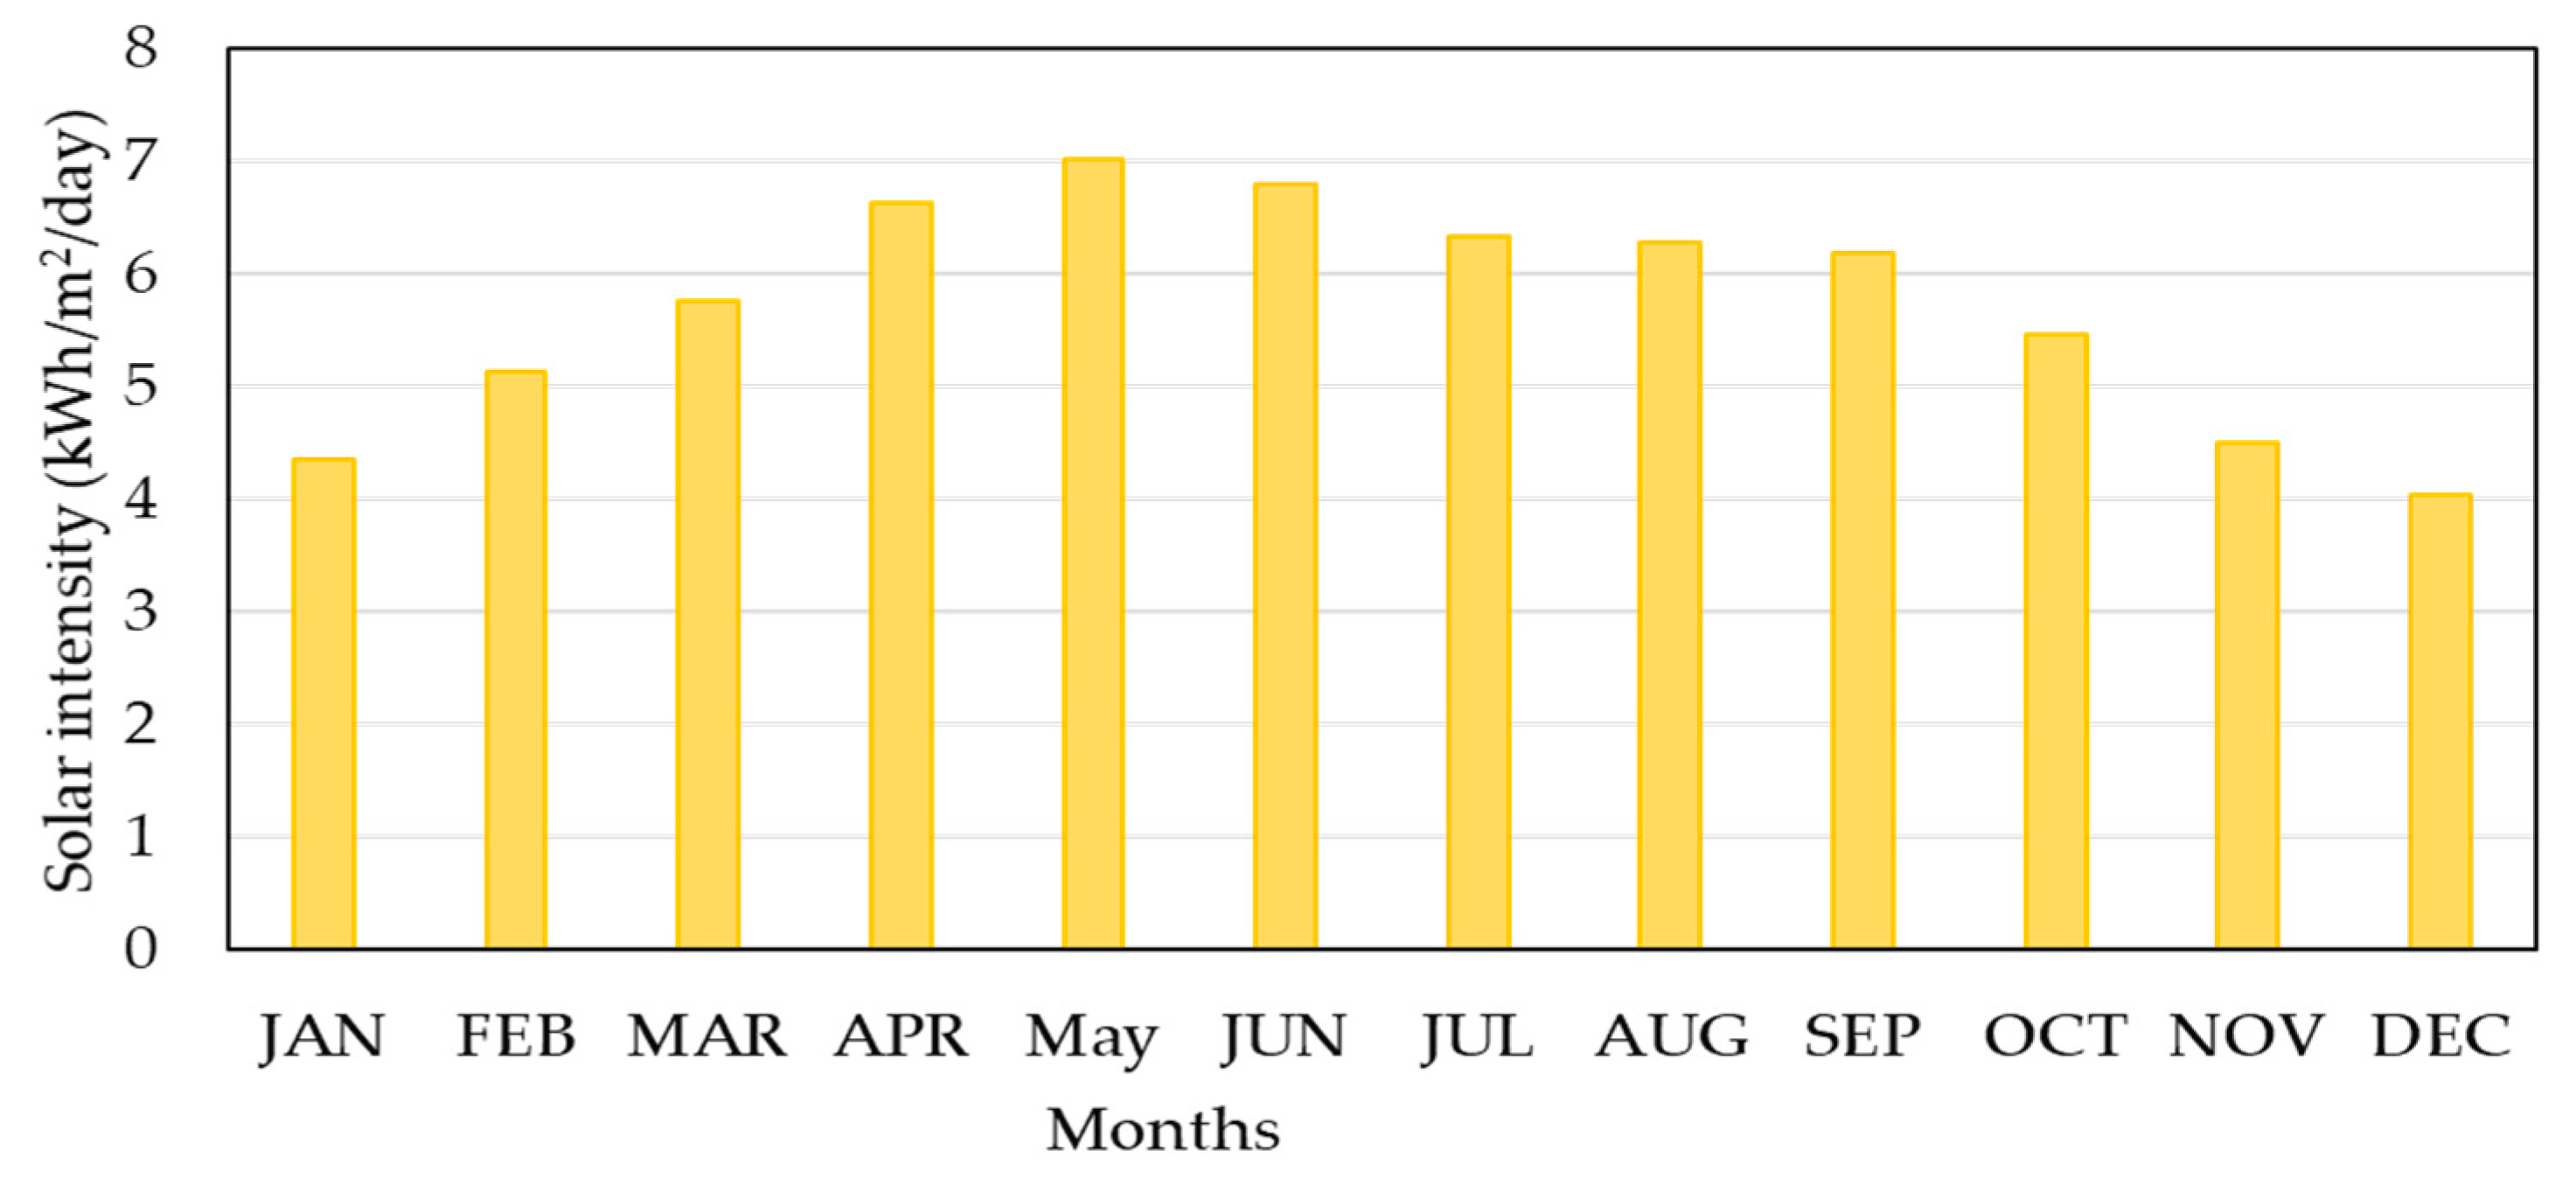
3.2. Site Solar Irradiation

The solar resource profile of the Dhafrat area is obtained from the National Aeronautics and Space Administration (NASA) database using the coordinate of the selected site [37]. Figure 7 describes the monthly average solar irradiation over the 22 years for the Dhafrat area. The annual average solar irradiation of Al-Dhafrat site is 5.71 kWh/m2/day. The highest solar irradiation was 7.25 kWh/m2/day in June. July has the lowest solar radiation with a value of 4.05 kWh/m2/day.

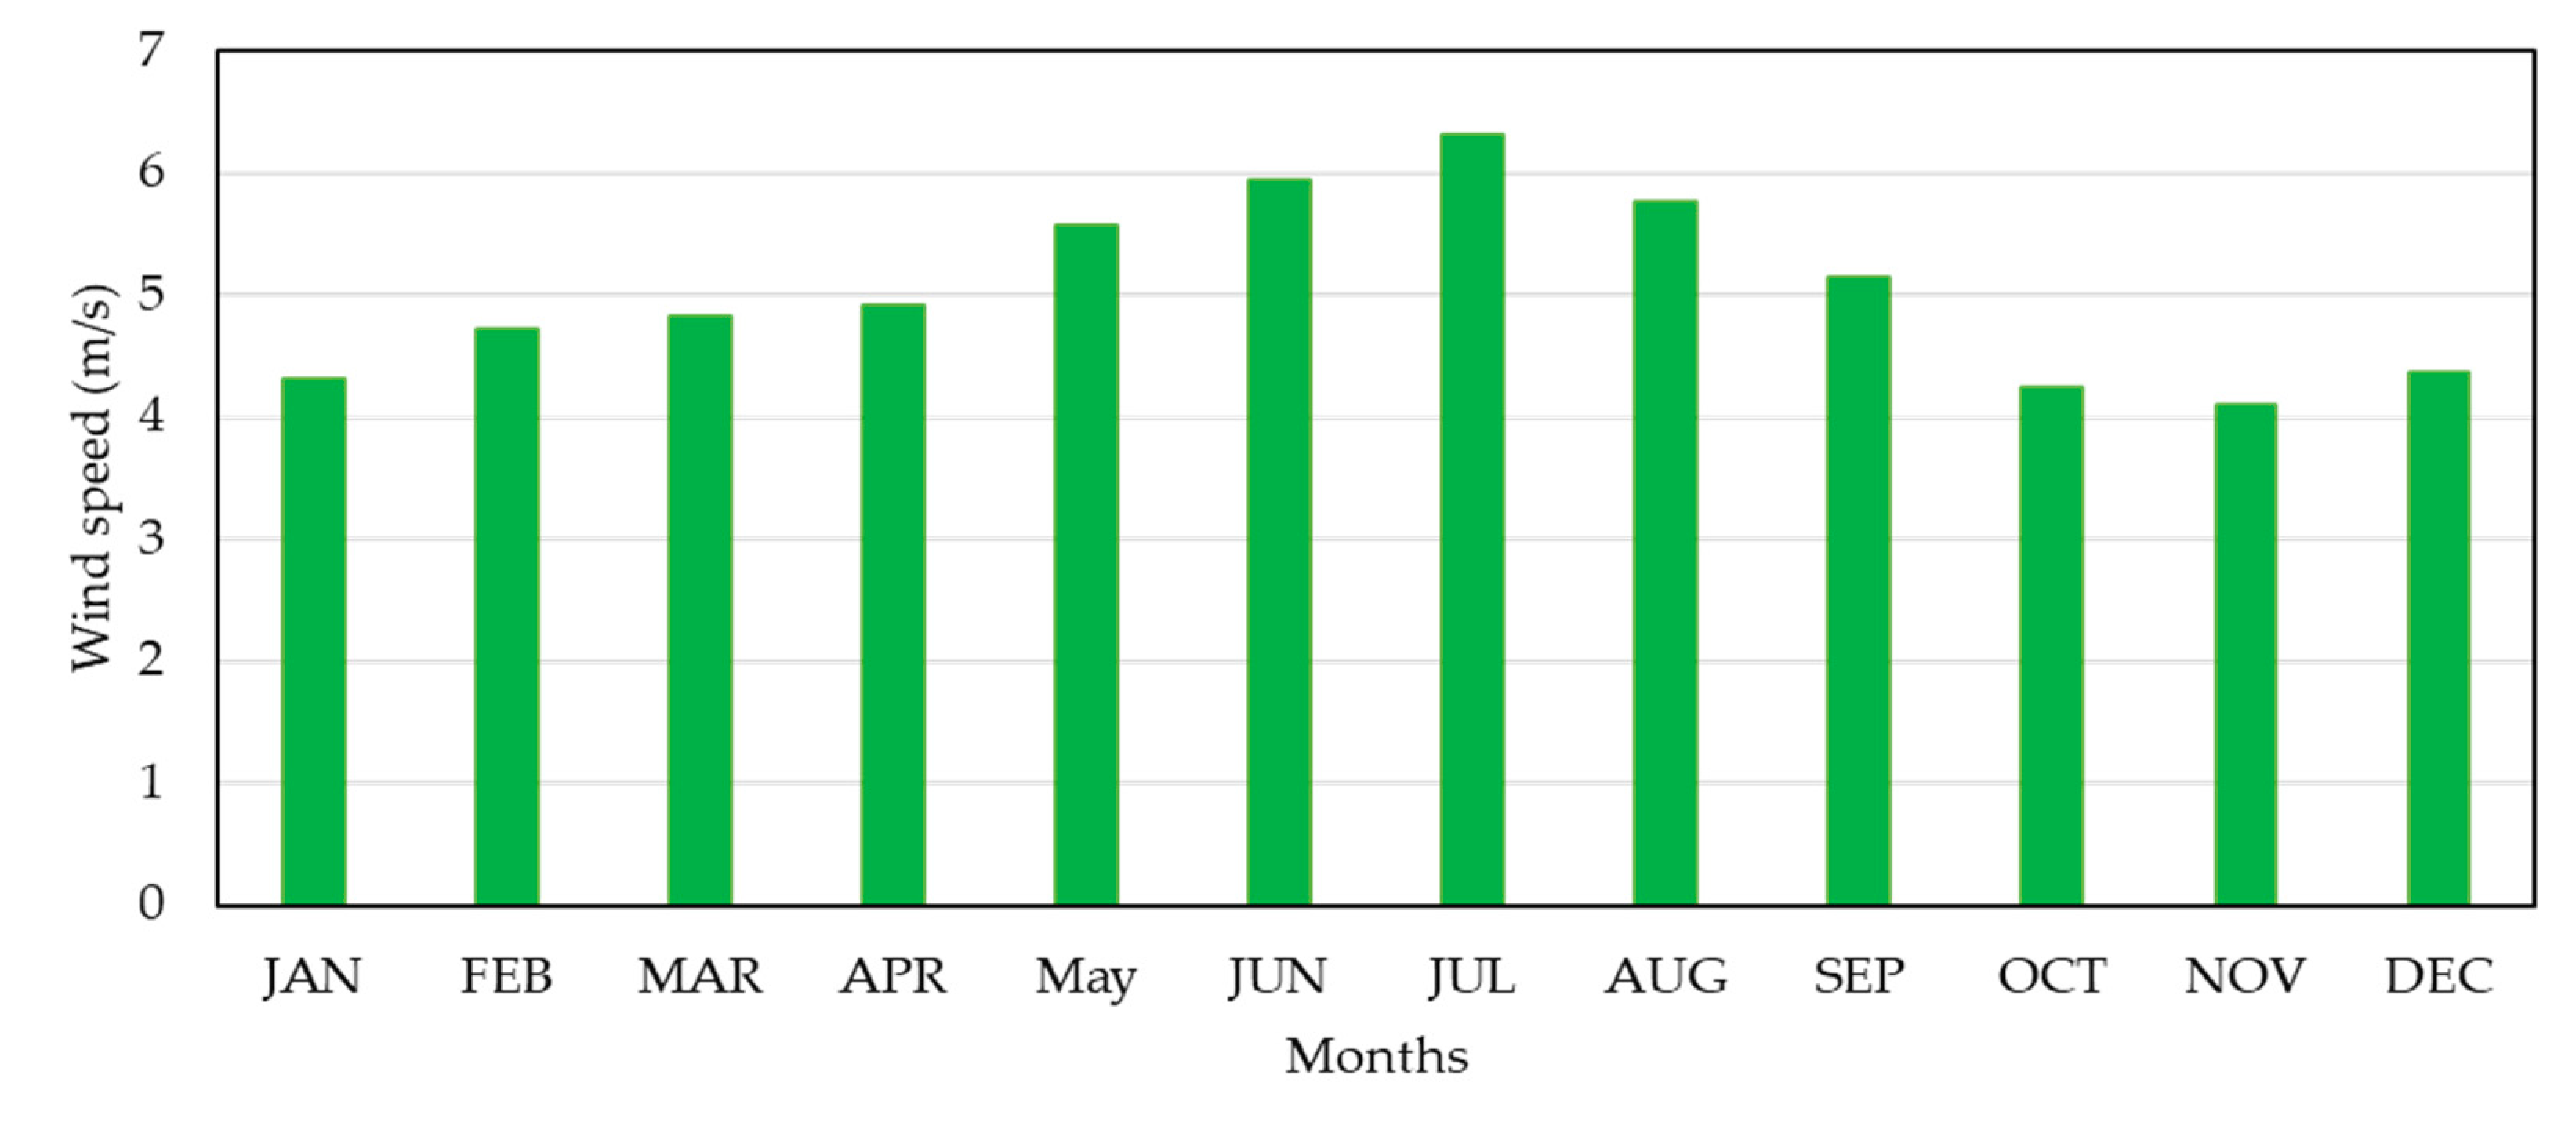
3.3. Site Wind Speed

The wind speed data of the Dhafrat area were extracted from the NASA database using the coordinates of the selected site [38]. Figure 8 shows the monthly average wind speeds over 30 years for the Dhafrat area. The yearly average wind speed of the Al-Dhafrat site is 5.02 m/s at the anemometer height. The highest average wind speed was 6.32 m/s in July. November has the lowest average wind speed, with a value of 4.11 m/s. One can see that the wind speed and solar irradiation profiles match the load demand profile for the selected site.

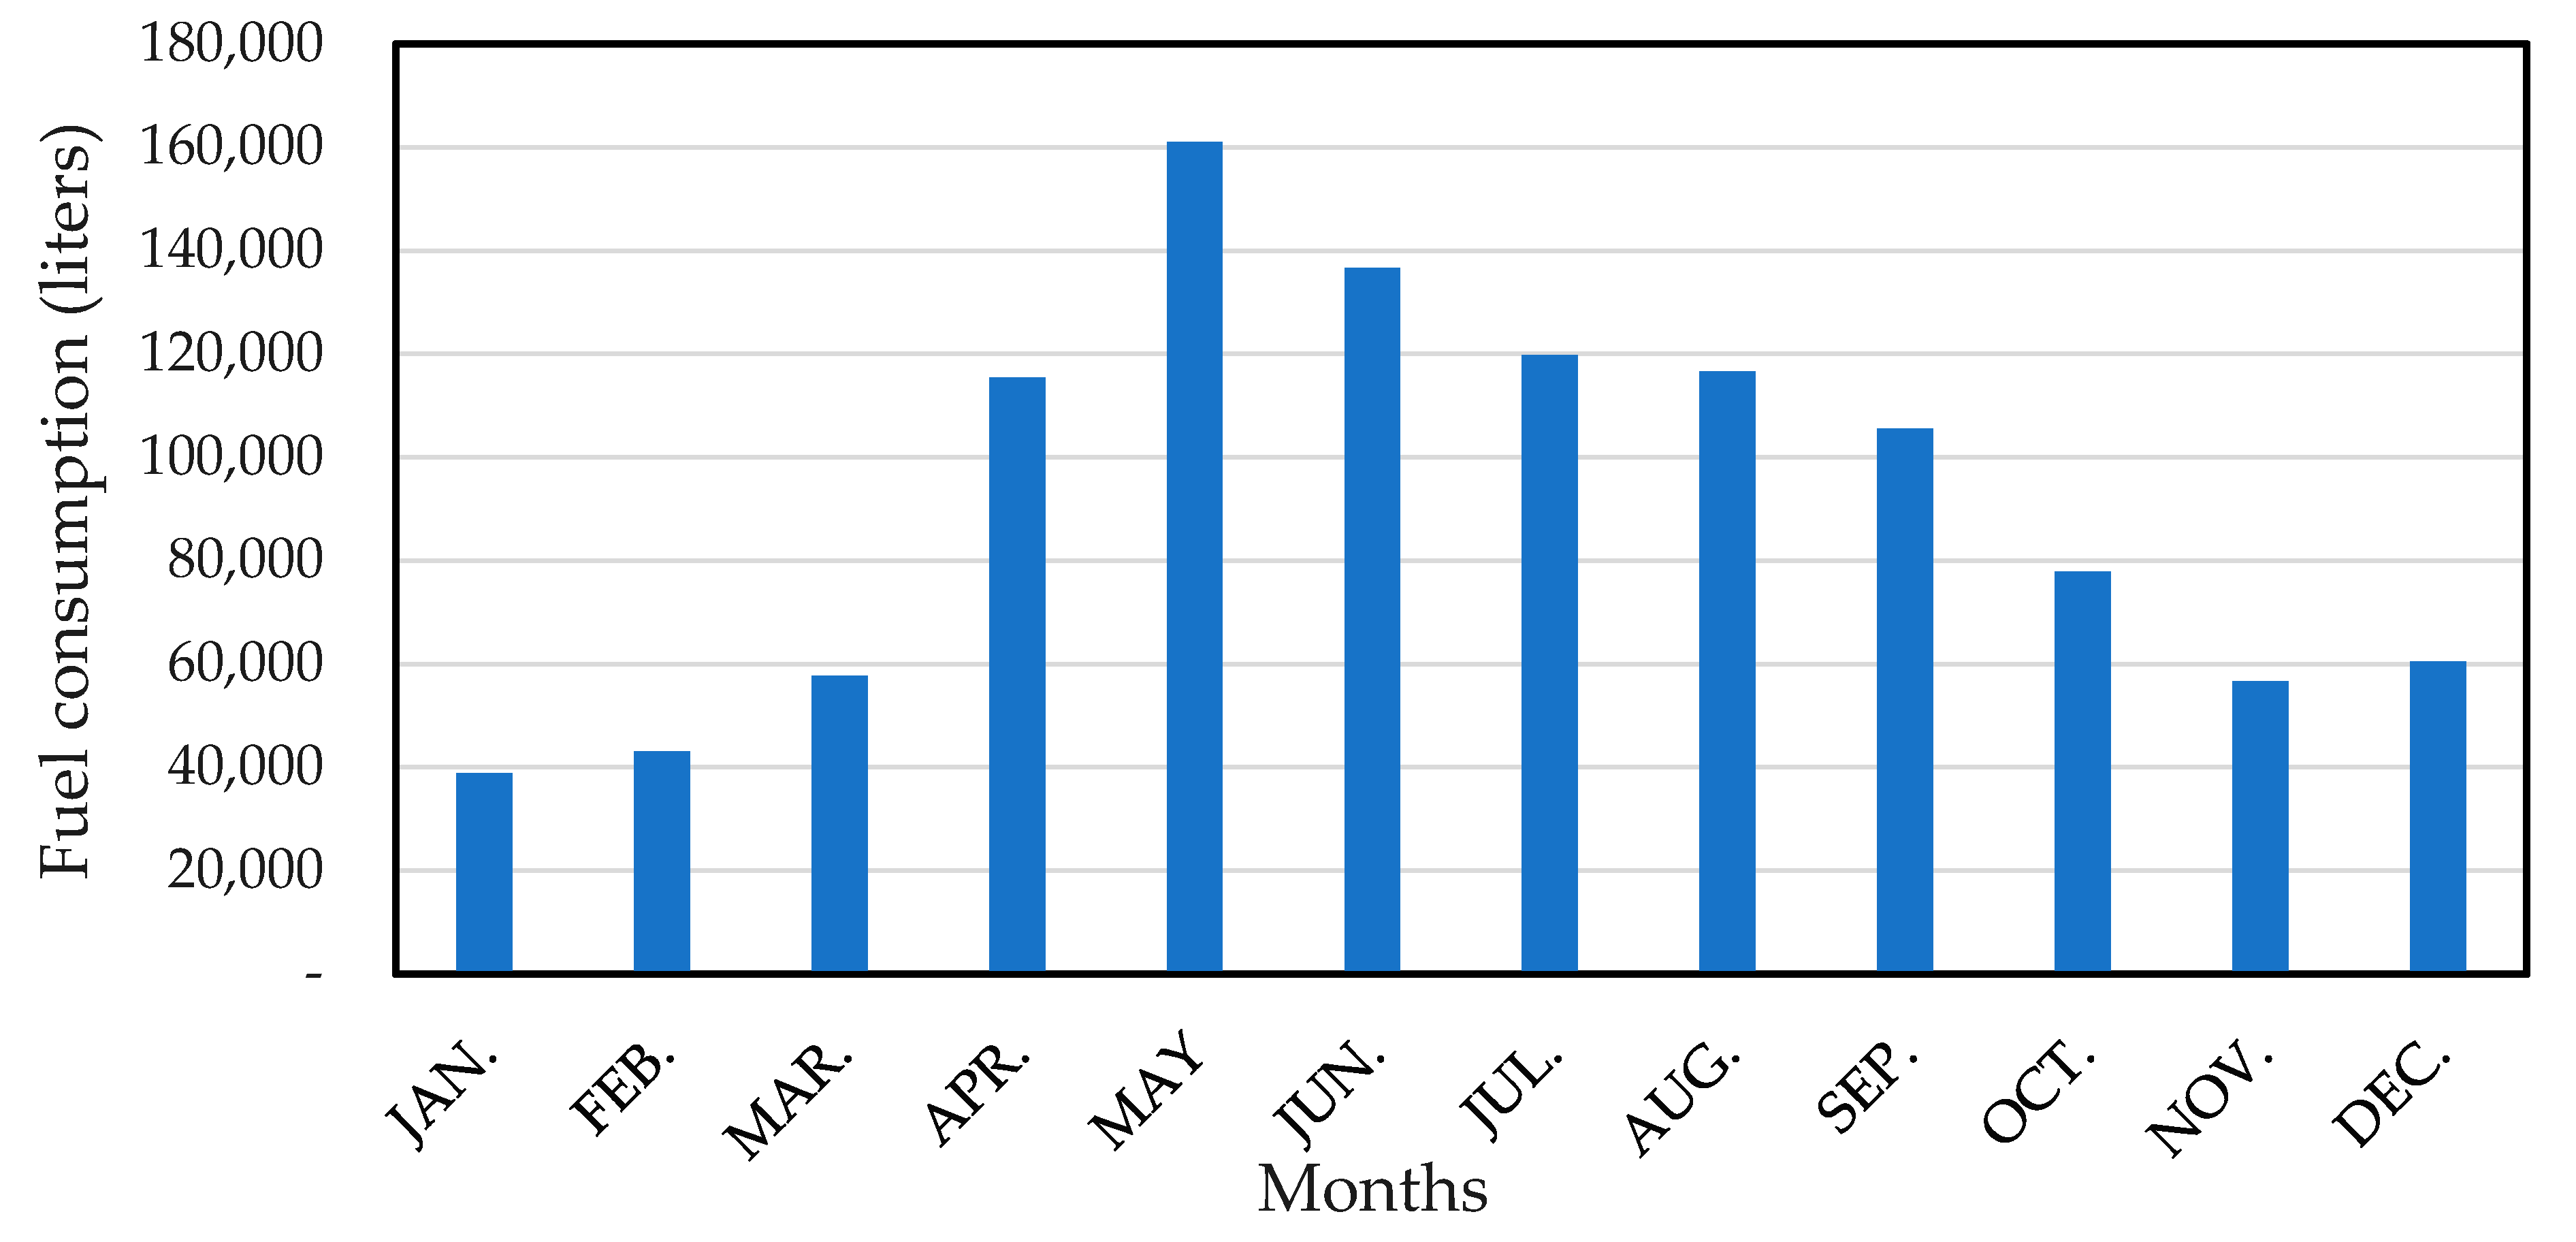
3.4. Diesel Generator

Diesel is the only currently existing power generator for the Al-Dhafrat area. A diesel unit was modeled in HOMER based on the fuel and efficiency curves. The fuel curve determines the amount of required fuel to generate electricity and is defined as [39]:
F d = ( γ 1 Q d + γ 2 P d )
where F d is the diesel fuel consumption rate (L/h), γ 1 and γ 2 are the fuel intercept coefficient and fuel slope (L/kWh), and Q d and P d are the diesel generator capacity and its output. The efficiency curve is modeled using Equation (2) [39]:
η d = 3600 P d ρ F ( γ 1 Q d + γ 2 P d ) L H V F
where ρ F and L H V F are the density of the fuel (kg/m3) and a lower heating value (MJ/kg). The diesel generators are modeled as per the existing diesel system in the Al-Dhafrat area. The diesel generator data were obtained from Mazoon Electricity Company (MZEC) and shown in Table 1.

3.5. Solar Photovoltaic Array

The power output of a solar photovoltaic array can be calculated as [40]:
P P V = P r , p v D p v ( S S S s , S T C ) [ 1 + β t ( T c T c , S T C ) ]
where P P V is the photovoltaic (PV) array output power (kW), P r , p v is the rated capacity of the PV array in standard testing condition (STC), D f is the PV derating factor, S S is the solar irradiation at the site (kW/m2), S s , S T C is the solar irradiation at the STC (kW/m2), β t is the temperature coefficient of power (%/°C), T c is the present cell temperature (°C), and T c , S T C is the cell temperature at the STC. Table 2 represents PV module data used in this study [41,42].

3.6. Wind Generator

The wind generator output power for the selected site is calculated using Equation (4) [39]:
P w g = ( ρ s i t e ρ S T P ) P w g , S T P
where P w g is the wind generator power at the site (kW), P w g , S T P is the wind generator power (kW) at the standard temperature and pressure (STP), ρ s i t e is the air density at the site of wind turbine installation (kg/m3), and P S T P is the air density at the STP (kg/m3). The adjusted air density for a site is determined using Equation (5) [43]:
ρ s i t e = 3.4837 ( p H H T H H )
where p H H and T H H are the pressure (kPa) and temperature (K) at the turbine hub height, and they are calculated using Equations (6) and (7):
p H H = 101.29 ( 0.011837 ) h H H + ( 4.79 × 10 7 ) h H H 2
T H H = T g T l ( h H H h H H , g )
where h H H is the height of the wind turbine hub (m), T H H is the hub height temperature (K), T g is the site ground temperature (K), Tl is the rate of lapse temperature (0.0065 K/m), and h H H , g hub height at the ground and it is equal to be zero. The wind speed at the hub height (m) is computed using Equation (8) [43]:
V H H = V 1 ln ( h H H z o ) ln ( h 1 z o )
where V H H is the hub height wind speed (m/s), V 1 is the wind speed at the anemometer level (m/s), and Z 0 is the surface roughness for the selected location (m). The wind generator data are shown in Table 3 [44].

3.7. Inverter

The PV system requires an inverter in this study since the diesel-and-wind generator (has in-built power converter stages) produces AC power. The system inverter is sized to minimize the system cost. A ratio between the PV and inverter sizes is considered greater or equal to 1 to size the inverter. This is because PV only produces its rated power some of the time. However, the oversized inverter would be helpful to produce and support reactive power to the network if needed [45]. Table 4 presents the inverter data utilized in this study, which were obtained based on local market studies.

3.8. System Economic

The technical feasibility of a hybrid system is analyzed based on minimizing the total annualized cost of the system. This cost includes the installation and operation costs of the system over the lifetime of the project. The total net present cost (NPC) is calculated using Equation (9) [43,45]:
C N P C , T = C a n n , t C R F ( i , n )
where C a n n , t is the total annual cost, i is the annual interest, and n is the project lifetime (year). The capital recovery factor (CRF) is defined as
C R F = i ( 1 + i ) n ( 1 + i ) n 1
The levelized cost of energy (LCOE) of a hybrid system is the ratio of total annual cost of the system to the total energy served by the system in a year, and it is computed by Equation (11) [42].
L C O E = C a n n , t E s e r v e d
where E s e r v e d is the total energy served to the load (kWh/yr). This study considers the annual interest rate 7.3% with a project lifetime 25 years.
The discounted payback period indicates the length of time to earn the initial investment cost considering the time value of money over the project lifetime. It is computed by the ratio of investment cost to discounted annual savings [14].

3.9. Dispatch Strategy and System Constraints

HOMER allows two types of dispatch strategies: the load following (LF) and the cycle charging (CC). The LF dispatch strategy is implemented in this study to ensure maximizing renewable power supply to the load. The optimization algorithm searches for minimizing the power differences (Equation (12)) between the generations and the load demand for each hour, which can ensure a cost-effective energy supply for the load.
Δ P = t = 1 8760 ( P G , t P L , t )
where P G , t and P L , t are the total generated power in the system (kW) and the total load demand in the network at every hour. The minimum renewable energy fraction is considered 20% of the total load demand, and the operating reserve as a percentage of hourly load is considered 10%. The maximum annual capacity shortage from renewable is allowed at 5% [39].

3.10. Environmental Factors

Several emission factors are used to assess greenhouse gas (GHG) emissions by the power generation units in the Al-Dhafrat network. Hence, the GHG emission reduction by the optimal energy mix hybrid system is evaluated. Table 5 presents GHG emission factors employed in this study [39,43].

3.11. Load Flow Analysis

The load flow analysis is performed to assess operation performances, bus voltage profile, and system real and reactive power losses of the optimal hybrid system for the Al-Dhafrat area. The hybrid system and Al-Dhafrat distribution network are modeled in ETAP software. The software uses the Newton–Raphson method to run the load flow with a maximum of 1000 iterations and a precision of 0.0001. The Newton–Raphson method uses the following current, active, and reactive powers relation for the ith bus [46]:
I i = j = 1 n | Y i j |   | V i | < θ i j + δ j
P i = j = 1 n | V i |   | V j | | Y i j |   cos ( θ i j δ i + δ j )
Q i = j = 1 n | V i |   | V j | | Y i j | sin ( θ i j δ i + δ j )
where Vi is the voltage at the ith bus (kV), Ii is the current in the ith bus (kA), Pi is the real power at the ith bus (kW), Qi is the reactive power at the ith bus (kVar), θ i j is the phase angle between the ith and jth buses in degree, δ i is the phase shift in the ith bus in degree, i and j represent the bus numbers, and k is the number of the iteration.

4. Results and Discussion

4.1. Optimal System Configurations

With the aim of designing a renewable mixed energy system, an existing diesel-based rural area system was modeled, simulated, and optimized using HOMER Pro Microgrid software. The simulation and optimization results produce and rank several feasible hybrid system configurations. All these economically feasible systems fall into three different combinations of hybrid systems that were obtained through the simulation. A base case system (diesel only) was also taken into account in the simulation. Table 6 presents four different system types: System-I: Diesel-only, System-II: Wind–diesel, System-III: PV–diesel, and System-IV: PV–wind–diesel.
Table 7 reveals the capacity of each generation unit in different hybrid system configurations for the Al-Dhafrat rural area network. In the diesel-only system (System-I), the capacity to meet the load is 10,500 kW. It is important to note that not all four diesel generators must supply the load demand. In this study, three diesel generators support the load at a different load ratios, while one remains as a backup. The diesel and wind microgrid system (System-II) requires a diesel capacity of 5600 kW; this shows a 46.67% reduction in diesel capacity compared to the base system. It is because this system configuration maximizes the use of wind power. System-III, a hybrid microgrid system that utilizes diesel and PV as power generators, requires a diesel capacity of 8400 kW. This hybrid system results in a 20% diesel capacity reduction. Finally, System-IV has a hybrid microgrid architecture that utilizes diesel, wind, and PV. This system uses 5600 kW diesel, 3200 kW wind, and 718 kW PV. The diesel capacity reduction in this system is the same as in System-II. However, the energy contribution by the diesel units from System-IV is lesser, as seen in Figure 9. The decrease in the diesel generator capacity is due to the addition of wind and PV.

4.2. Economic Assessment

Table 8 shows the economic evaluation for four different systems using financial values such as NPC, LCOE, diesel consumption, and the payback periods. For the first scenario (diesel-only), the NPC is USD 31.02 million (only fuel, operation and maintenance; the initial cost is zero since the diesel generators are already in the site), and the LCOE is USD 0.5663/kWh, with the highest diesel consumption that reaches 1,414,360 L per year (L/Year). In contrast, the wind–diesel microgrid (System-II) has an NPC of USD 14.59 million with an LCOE of USD 0.2663/kWh and diesel consumption of 471,999 L/Year, a noticeable decrease in indices. The NPC shows a reduction of 52.96% compared to the base system, while there is an approximately 66.66% reduction in diesel fuel consumption. Therefore, this system shows a considerable improvement. However, it is not the optimal case. System-III (PV–diesel) comes with an NPC of USD 22.87 million, USD 0.4175/kWh, and diesel consumption of 819,193 L/Year. This system requires higher NPC, more fuel consumption, and higher LCOE than System-II. However, this system configuration shows an improvement compared to the diesel-only system. Compared to System-I, there is a 26.28% difference in the NPC, USD 0.1488/kWh in LCOE, and 42% lower diesel fuel consumption. Finally, the diesel, wind, and PV hybrid system (System-IV) results in an NPC of USD 14.09 million, USD 0.2573/kWh of LCOE, and 418,204 L/year diesel consumption. This system shows a significant improvement compared to all other configurations. Additionally, this system configuration represents a 54.57% NPC reduction, a 54.56% decline in the LCOE, and a decrease in diesel consumption of 70.43% yearly. Considering all the presented criteria for the economic indicators, System-IV (PV–wind–diesel) reveals the most cost-effective optimal energy mix hybrid system. The optimal system with wind, PV, and diesel results in a simple payback period of 2.69 years and discounted payback period of 3.00 years. Therefore, System-IV can be considered the optimal energy mix system for the selected site.

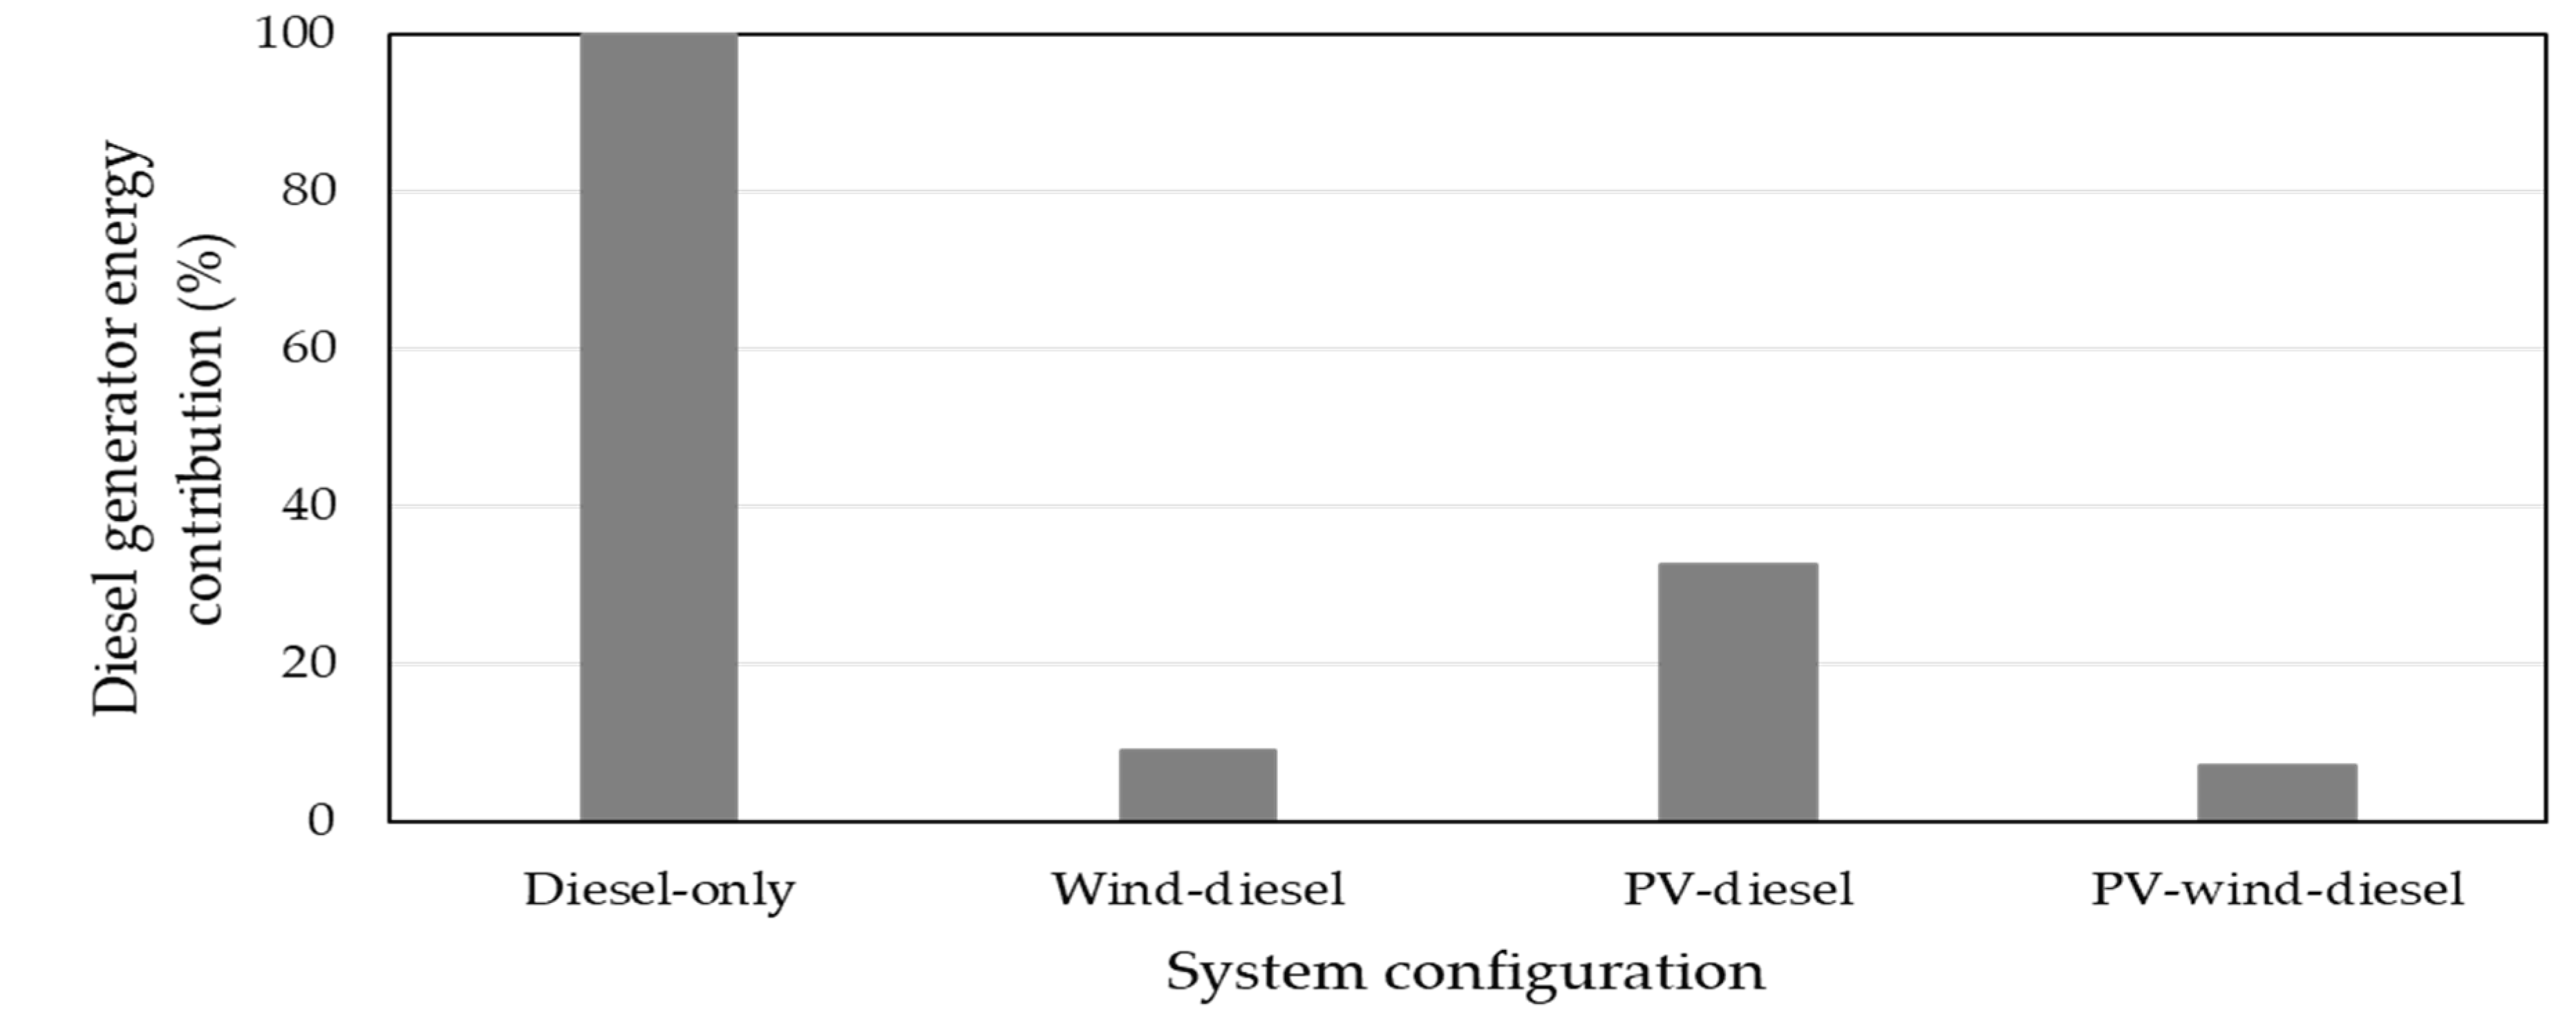
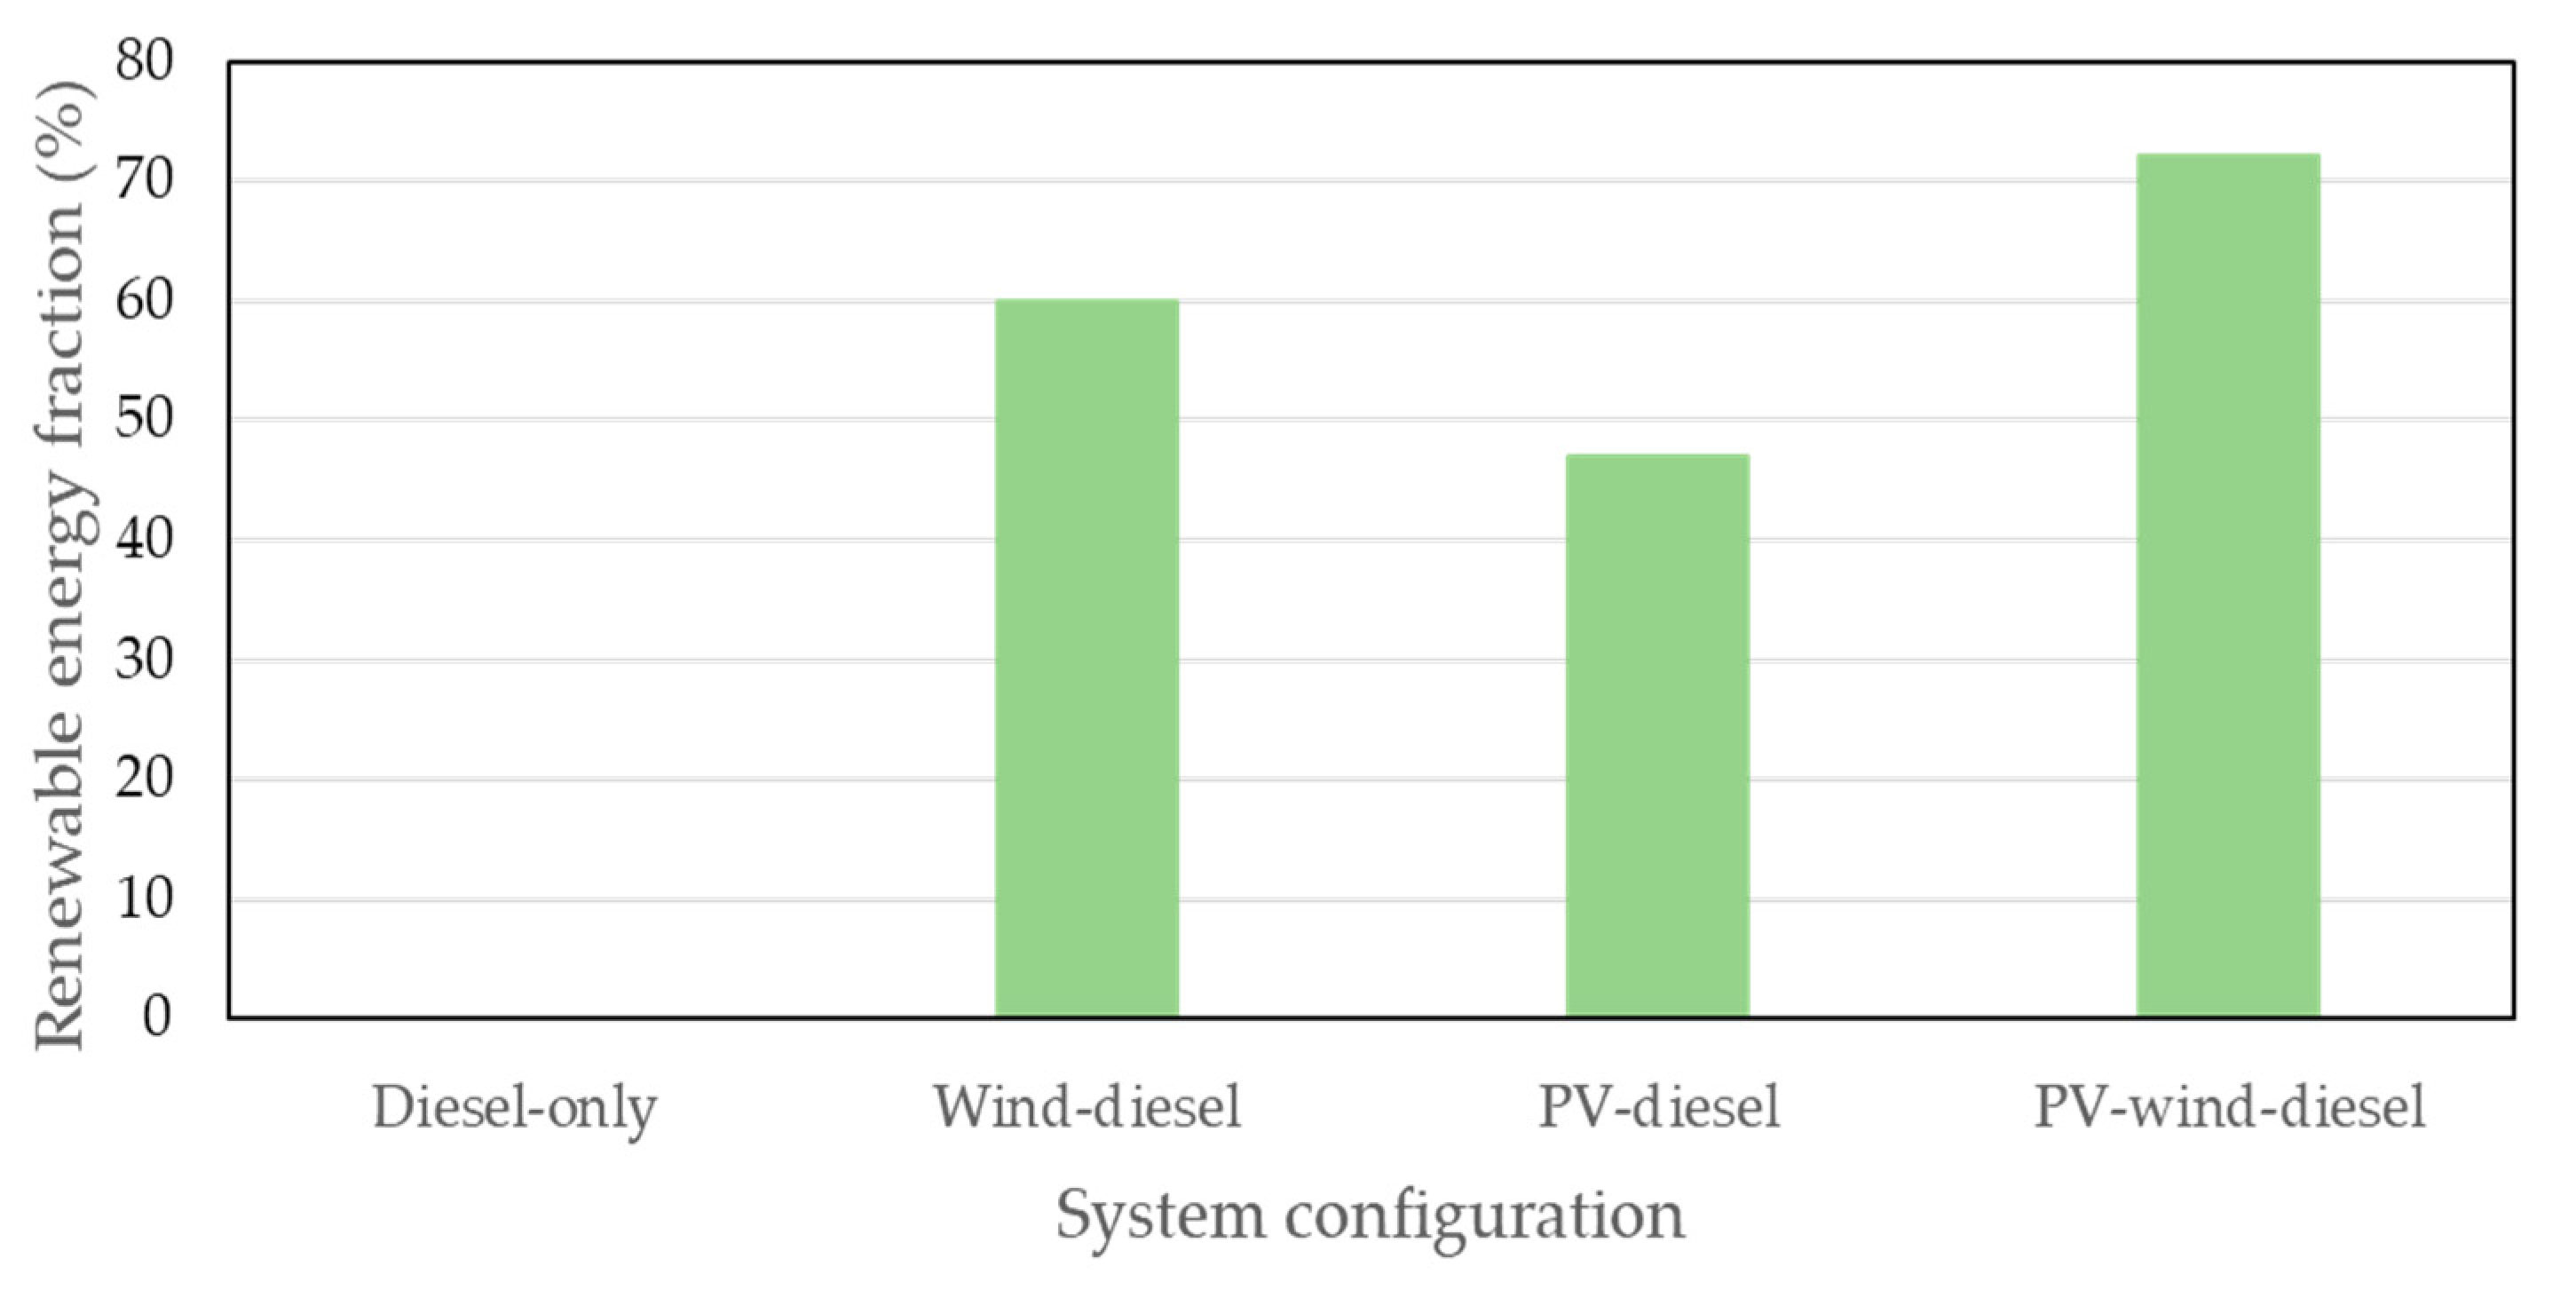
4.3. Environmental Assessment

Table 9 depicts yearly greenhouse gas emissions for each system. The amount of GHG is relative to the amount of fuel consumption. The highest pollutant emission comes from the base scenario (diesel-only), reaching 3,783,490.2 kg/year of gas emissions, including multiple gasses, with carbon dioxide occupying the most significant one. The second highest is the PV–diesel system, reaching 2,191,386 kg of gas emissions. The system wind–diesel reveals 1,262,622.2 kg/year of GHG emissions. Finally, the fourth system, PV–wind–diesel (the most optimal), has the lowest amount of greenhouse gas emissions, reaching only 1,118,720 kg/year, which is 3.38 times less than the base system (diesel-only).

4.4. Comparison between the Base System (System-I) and the Best Optimal Hybrid Configuration (System-IV)

Table 10 shows the total expenditures of the utilized components in the base case system. The total expenditure in this system is the combination of three operating diesel generators only, where the three generators’ capacities are sufficient to supply the load. The capital cost is zero since the diesel generators already exist in the system. The diesel generator’s lifetime is more than the projected lifetime of 25 years, which results in zero replacement cost. The diesel generator’s significant cost includes the requirement for the fuel, the price of which is very unpredictable. Therefore, the continuation of utilizing diesel fuel indicates a gradual increase in energy costs and operating costs of the diesel-only system. Cost details are shown in Table 10. Although the diesel generator cost is zero since they already exist, the total expenditure is high for this system because the cost of fuel and operation and maintenance costs are significant for the diesel-only system.
Table 11 shows the overall expenditure for each component for the best optimal system (PV–wind–diesel). The total expenditure of the system adds up to USD 14.09 million, which is represented as the NPC of the system. The total money spent on diesel generators reaches up to USD 9.43 million. At the same time, the paid amount on PV panels and wind turbines are USD 1.06 million and USD 4.02 million, respectively. The system converter expenditure reaches a number of USD 5,46,792.69. The converter’s lifetime is 10 years, which results in a replacement cost of the converter. Cost details are shown in Table 11. The total expenditure of the PV–wind–diesel system occurs due to the minimum fuel cost and low operation and maintenance costs.
A comparison of renewable fractions of the four systems is shown in Figure 10. The first scenario represents the base scenario that has no renewable fraction integrated. Compared to the third system with PV and diesel, the second system has a lower renewable fraction of about 13%. The best optimal system combining wind, PV, and diesel achieves a 70% renewable energy fraction and has the highest renewable energy fraction compared to other system configurations. Such a high renewable energy fraction requires meeting the peak load demand in the system, which results in producing excess energy in the system.

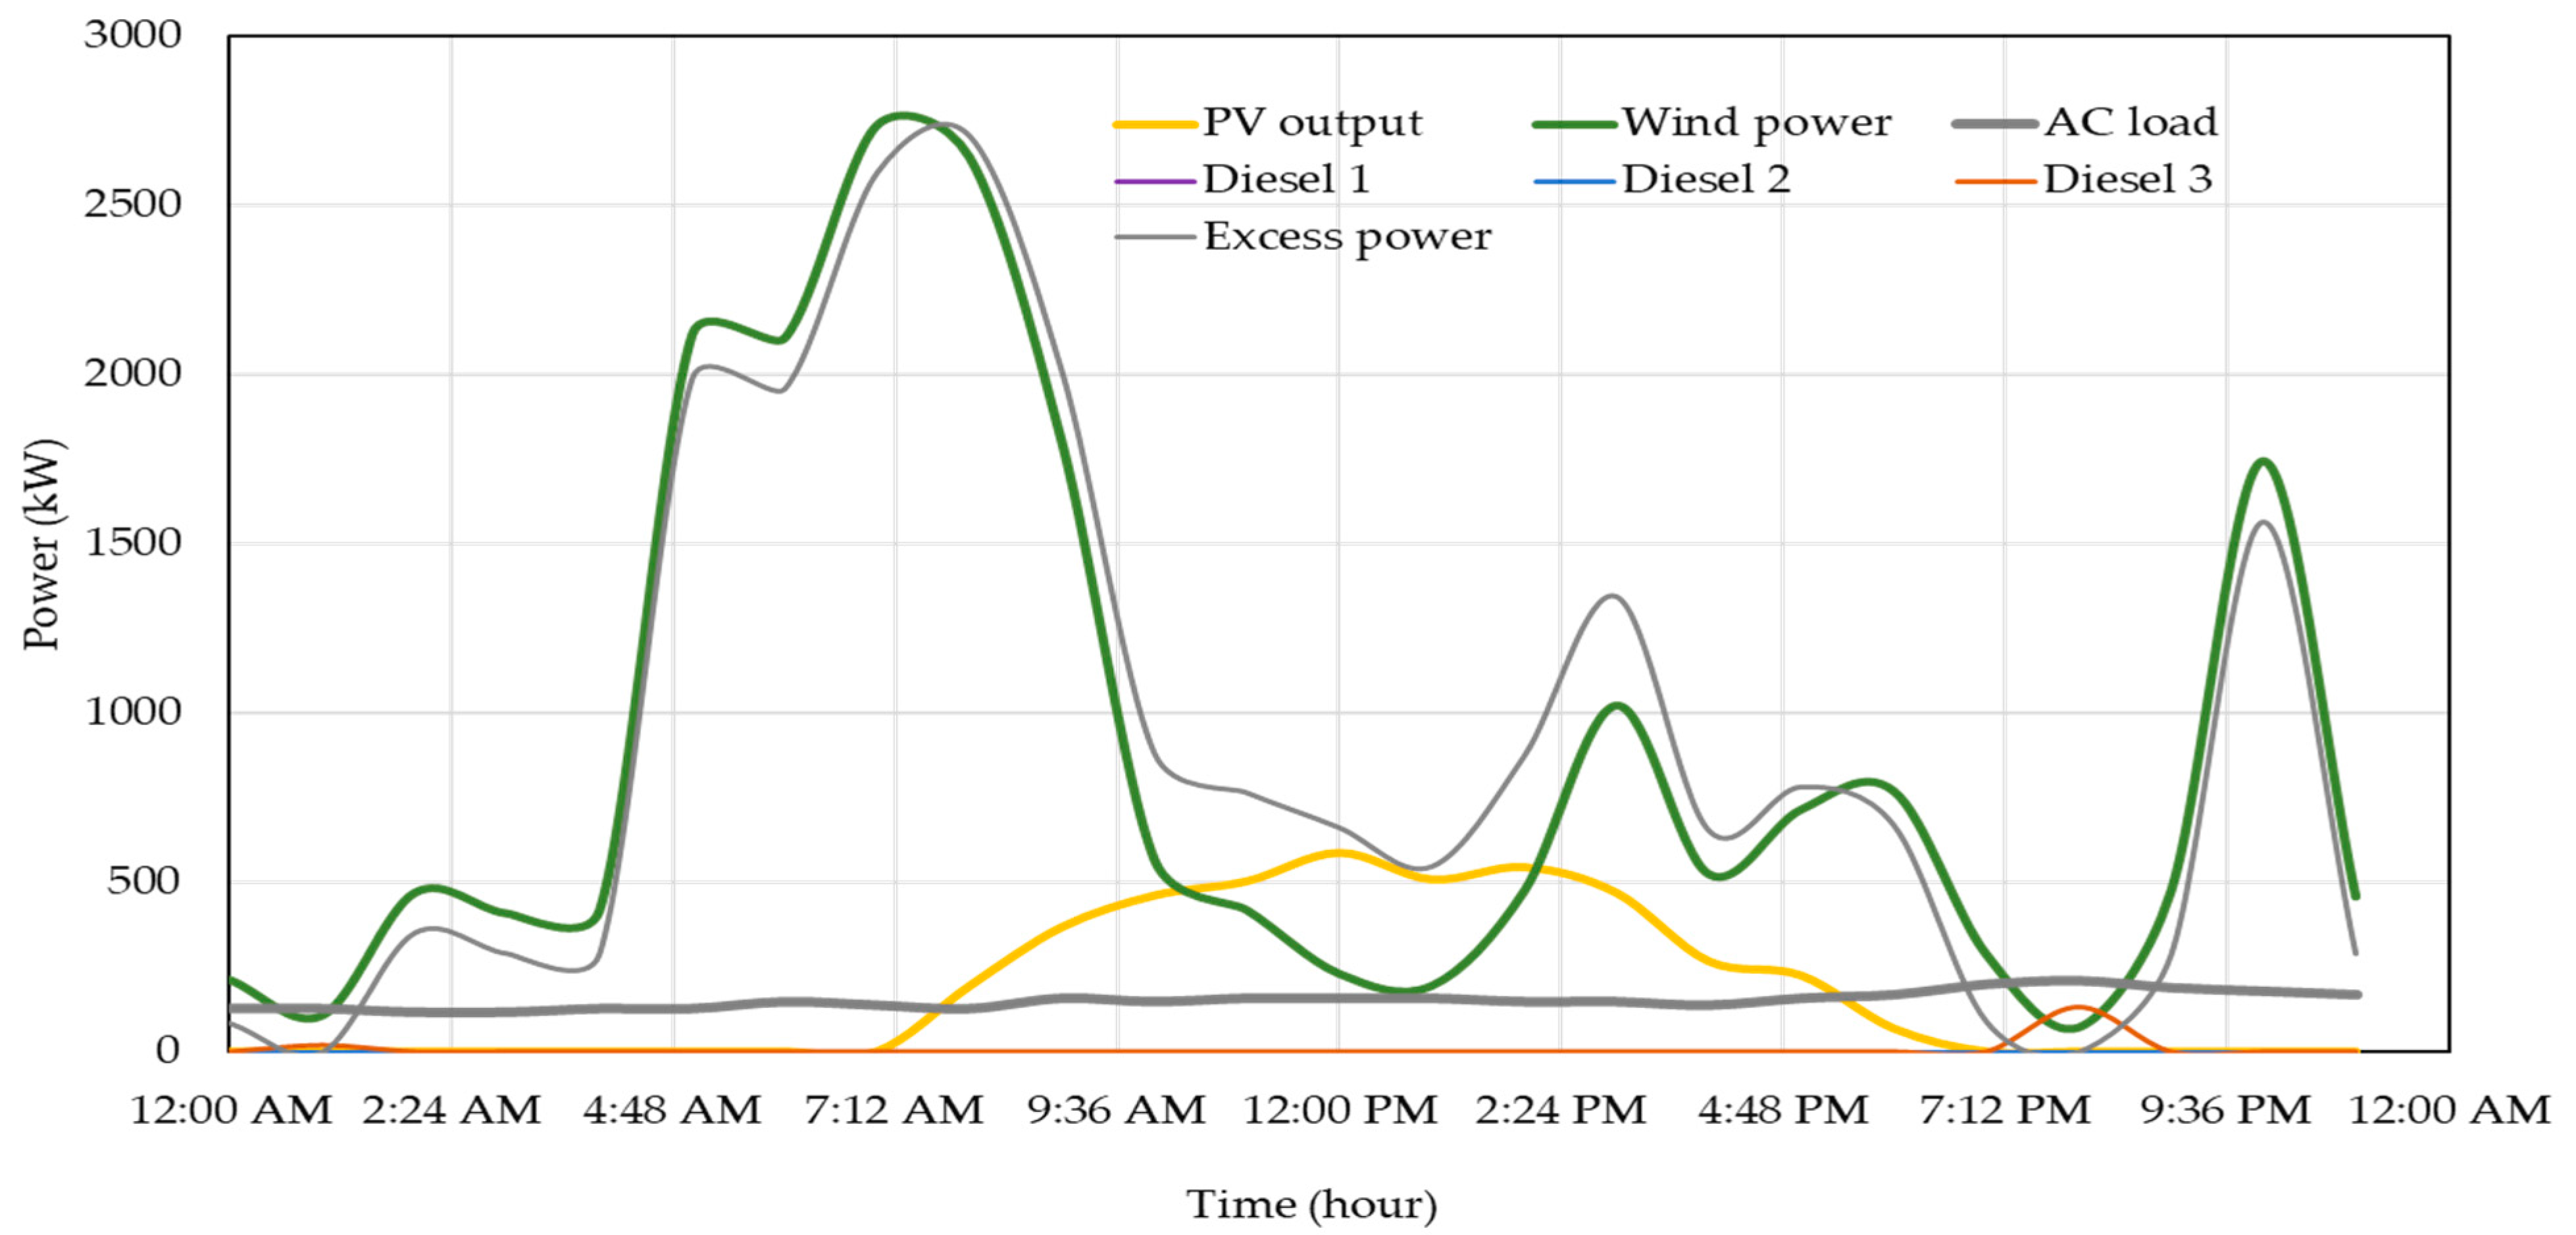
4.5. Power Balance Analysis in the Best Optimal Hybrid Configuration

Figure 11 illustrates the energy contribution by each generation unit in the optimal hybrid system to meet the load demand. It represents the one-day portion of the load (peak load) and how much each component produces power to meet that load. The PV starts its production with the sunrise at 6:00 AM with a gradual increase until the peak production at noon of 560 kW; then, the production decreases until sunset at 6:30 PM. Unlike the PV, wind turbine production is unpredictable, where its production depends on the wind speed at each hour of the day. If the wind speed exceeds the cut-in wind speed of the wind turbine, the wind generator starts the generation. The figure shows that the wind turbine production peak is at 9:00 PM with a production of 2065 kW. At 12:00 noon, the PV mainly supplies the load demand, and the wind and diesel generators supply the rest. At 9:00 PM, the wind generator mainly supplies the load demand, and the diesel generators supply the rest since there is no PV power production. The diesel generator supplies the entire load in the early morning (12:00–6:00 AM) since the system has small wind power and no PV power generation. From 11:00 AM to 11:00 PM, the system produces excess energy due to higher energy production by the wind. This excess energy can be stored to use later when there is no PV generation, especially between 12:00 AM and 6:00 AM.
Figure 12 shows a one-day portion of the power balance (minimum load) and how much each component produces power to meet that load. The PV starts power production at around 7:30 AM with a gradual increase until the peak production (589 kW) reaches 12:00 PM; then, the production decreases until sunset at 5:30 PM. The wind turbines show high power production in the early morning due to the higher speed availability. The wind turbine’s production peak is at 7:00 AM, with a generation amount of 2700 kW. The wind generator meets the load demand at this time with no generation from diesel and PV. It is also to be noted that diesel is not producing any power since the load demand is minimum and sufficient power is received from the wind. The PV system shows better efficiency during the winter because of the lesser effect of temperature derating the PV generation. On a similar day, the hybrid system produces excess energy, which can be stored in a battery or used for green hydrogen production.

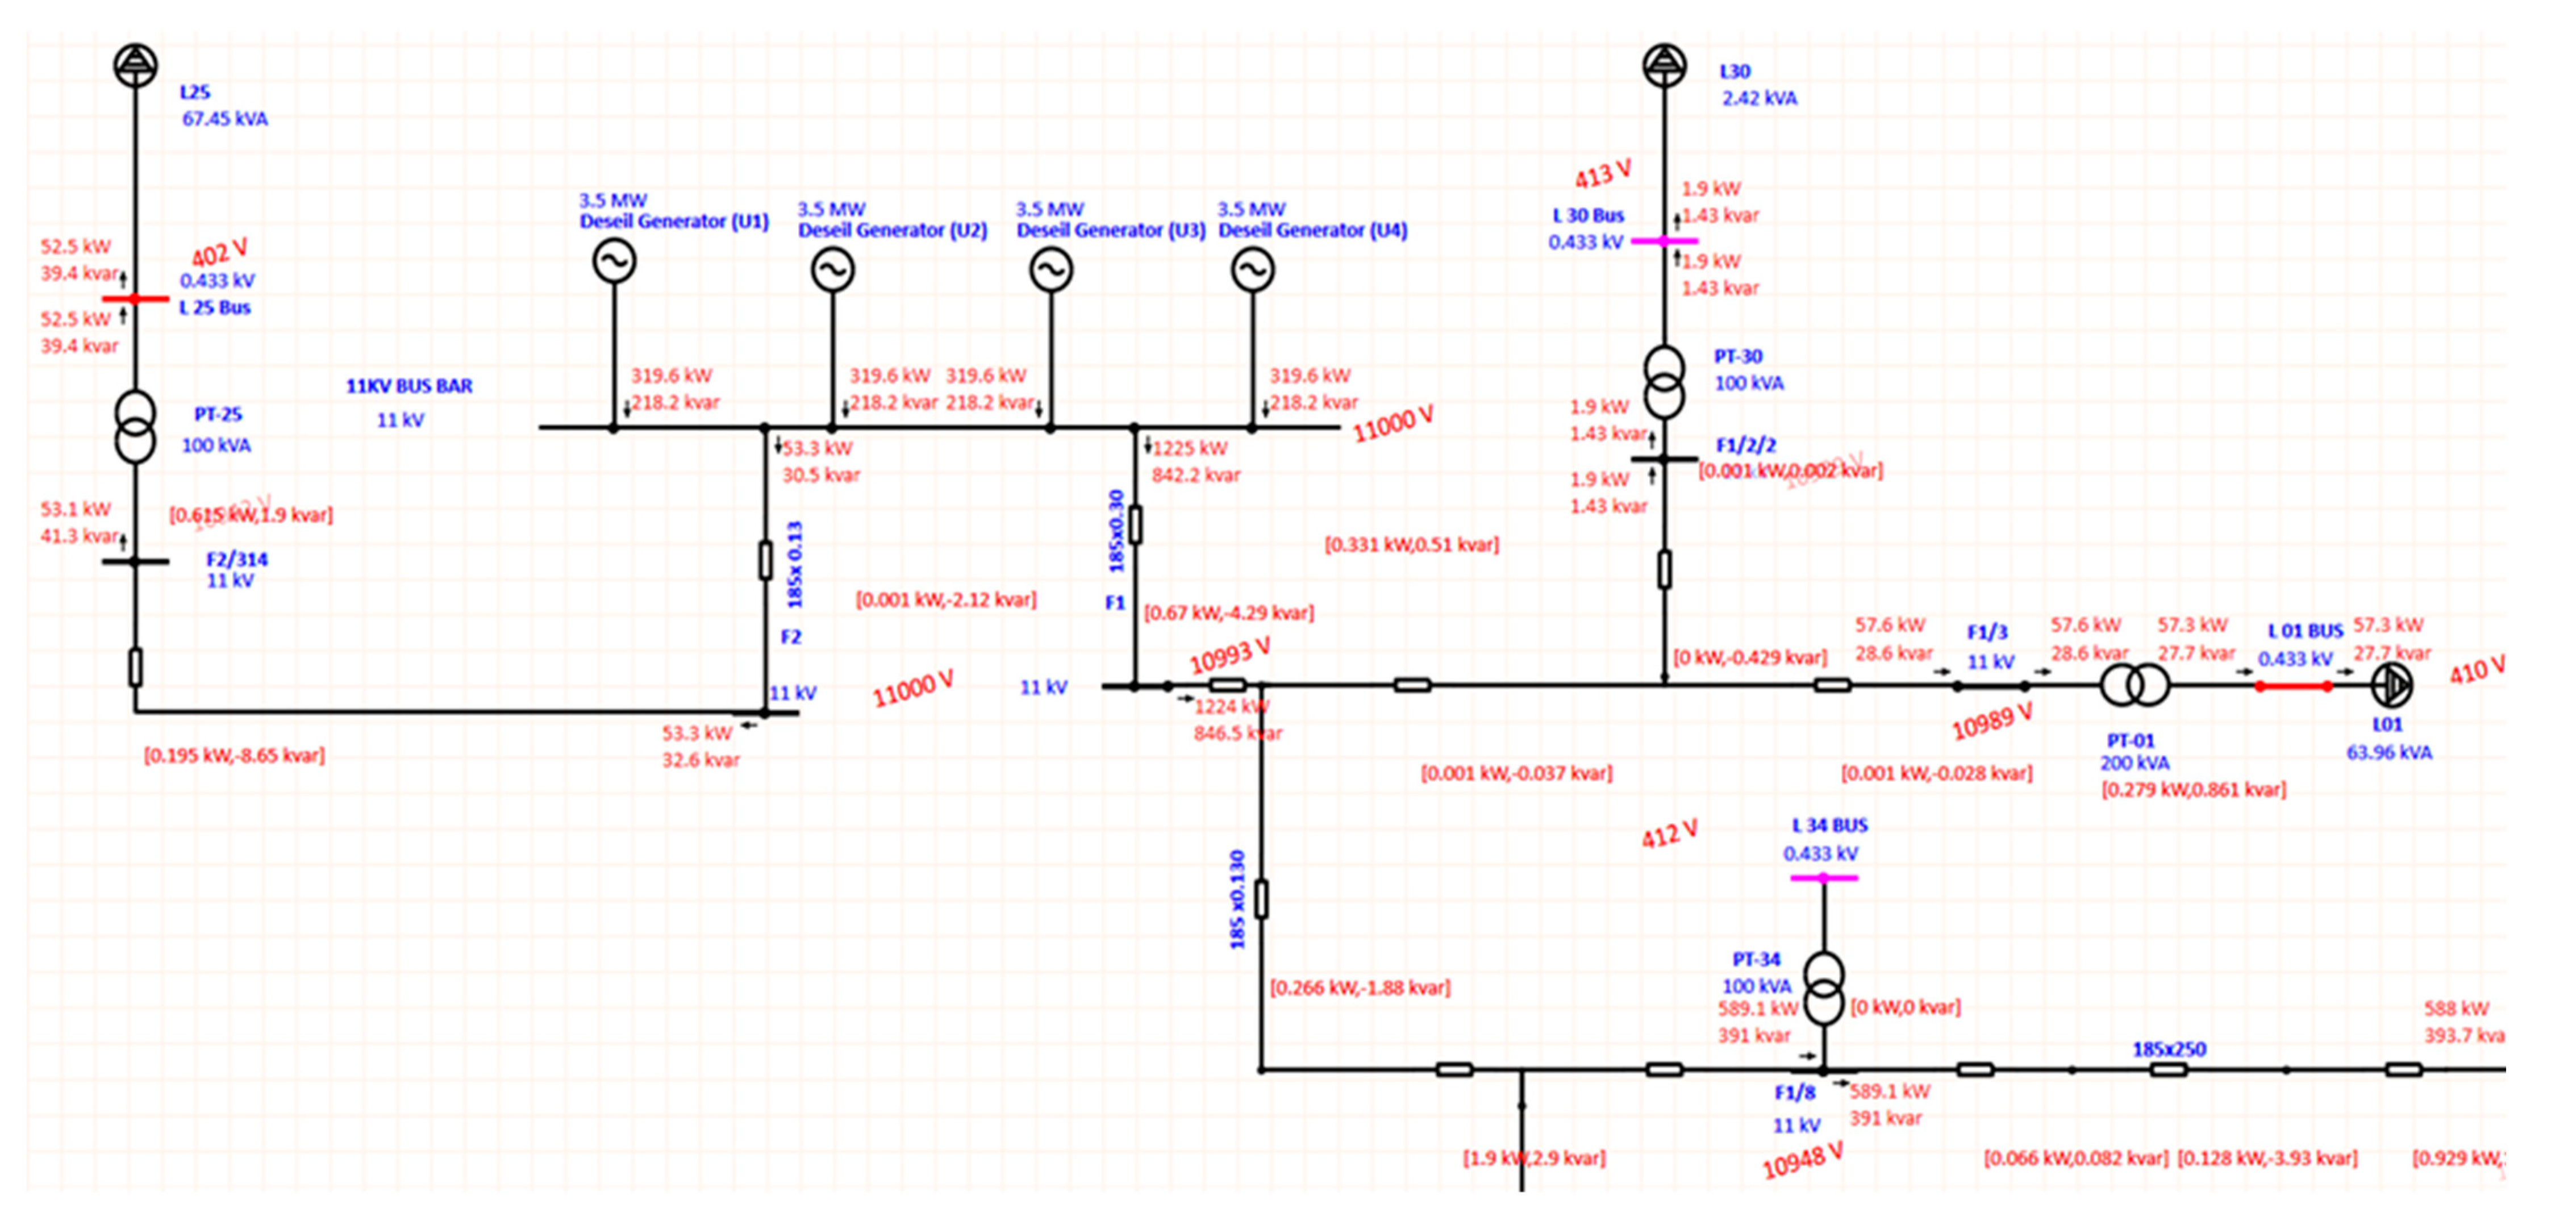
4.6. Operational Performance Assessment of the Best Optimal Hybrid Configuration (System-IV)

Figure 13 illustrates (partially) the developed model of the Al-Dhafrat distribution network simulated and conducted power flow analysis. Using two extreme load conditions, the simulation is conducted for System-I (diesel-only) and the best optimal system (System IV: PV–wind–diesel). The system performance results obtained through simulation are presented and discussed in terms of generated reactive and reactive powers, buses’ real and reactive power flow, and bus voltage profile. There are 37 load buses in the system.
Figure 14 shows voltages at different buses of the Al-Dhafrat distribution network for the summer load condition for the diesel-only system. The results reveal a wide range (386.7–413.4 V) of voltage variation at different buses. According to the standard, the maximum acceptable voltage is with a tolerance of ±6% of distribution voltage, which is 439.9 V, and the minimum value with tolerance is 390.1 V. All the bus voltages are within the standard limit except for buses 20 and 24, where there are voltage violations of 386.7 V and 389.5 V, respectively. This can be attributed to the higher voltage drop in the line that connects these buses and the generation units. However, all other bus voltages remain within the standard limit for winter load, as shown in Figure 15. Table 12 presents the system’s real and reactive power losses. The losses in summer are significant; however, winter losses are negligible since the load demand is relatively low. It also evidences from Figure 15 that the voltages in the buses remain within the limit.
Figure 16 illustrates voltages at different buses of the Al-Dhafrat distribution network for the summer load condition for PV–wind–diesel. The voltage variation at different buses of the network maintains within the acceptable limit, and hence, voltage violation issues are resolved. The voltages at buses 20 and 24 are now 392 V and 391.3 V, respectively. It is due to the addition of renewable sources to these buses. It is also observed that the bus voltages rise during the winter load; however, they all remain within the standard limit. Table 13 shows the system’s real and reactive power losses after adding renewable sources. The results illustrate a losses reduction of 17.36%, where the real power loss becomes 23.8 kW.
The outcomes of this study reveal that integrating a renewable mix hybrid system can reduce massive diesel fuel consumption, significant GHG emissions, and operation and maintenance costs. It also reduces the dependency on the volatile market price of diesel fuel. Integration of renewables also minimizes bus voltage violations during the heavy demand in summer. In addition, the results also indicate the potential of maximizing the use of renewable resources and enhancing the sustainable development process in Oman.

5. Conclusions

This paper has presented designing and analyzing a PV–wind–diesel hybrid renewable energy system for the Al-Dhafrat rural area application. HOMER Pro was utilized to conduct technical and economic analysis. In contrast, ETAP software was employed to examine the system’s operational performances, such as bus voltage profile and power losses. In this study, the focus was on the net present cost, greenhouse emissions, lowest levelized cost of energy, and renewable energy fraction as the criteria for selecting the best optimal hybrid system. The outcomes reveal that the isolated hybrid power system (PV–wind–diesel) consists of a 718 kW solar photovoltaic array, a 3200 kW wind plant, a 5600 kW diesel, and a 410 kW inverter that can provide 10.303 MWh energy per day with a peak power demand of 1310 kW for the selected site. The net present cost of the proposed hybrid system is USD 14.09 million for the project lifetime of 25 years and a 7.25% annual interest rate. The renewable energy fraction varies between 0 to 70%.
Further, the LCOE of the best optimal hybrid system was found to be USD 0.2573/kWh, with fuel consumption of 418,204 litters/year and greenhouse gas emissions of 1,118,720 kg/year. The proposed hybrid renewable energy system reduces the LCOE by 54.56%, diesel fuel consumption by 70.43%, and GHG emission by 3.38 times compared to the existing diesel-only system. It is also revealed that the integration of renewable power generation improves the voltage profile of the buses, especially during the summer peak load, and reduces the system power losses.
Therefore, considering the potential of renewable resources and the remote existence of the Al-Dhafrat diesel community in Oman, an isolated hybrid PV–wind–diesel system is not only viable but also a practical and sustainable solution for the studied rural area electrification.
The proposed design produces considerable excess electricity to meet the peak load demand. Thus, the proposed hybrid system integrated with suitable energy storage can be investigated further. In addition, some of the cost data are assumed that may involve uncertainties. However, this is unavoidable because of the nature of the study.

Author Contributions

All authors equally contributed to this work. All authors have read and agreed to the published version of the manuscript.

Funding

This research received no external funding.

Data Availability Statement

Not applicable.

Acknowledgments

The authors would like to thank Mazoon Electricity Company, Oman, for providing the data and required information about the study site.

Conflicts of Interest

The authors declare no conflict of interest.

Abbreviations

The following abbreviations are used in this manuscript:
HOMERHybrid Optimization of Multiple Energy Resources
MISmain interconnected system
ETAPElectrical Transient Analyzer Program
PVsolar photovoltaic
GHGgreenhouse gas emission
NPCnet present cost
LCOElevelized cost of energy
MZECMazoon Electricity Company
NASANational Aeronautics and Space Administration
STCstandard testing condition
CRFcapital recovery factor
LFload following
CCcycle charging

References

  1. International Renewable Energy Agency (IRENA). Renewable Capacity Statistics 2022. Available online: https://reglobal.co/irenas-renewable-capacity-statistics-2022/ (accessed on 9 October 2022).
  2. Alharthi, M.; Dogan, E.; Taskin, D. Analysis of CO2 emissions and energy consumption by sources in MENA countries: Evidence from quantile regressions. Environ. Sci. Pollut. Res. 2021, 28, 38901–38908. [Google Scholar] [CrossRef] [PubMed]
  3. Al-Badi, A.H.; Al Wahaibi, A.; Ahshan, R.; Malik, A. Techno-Economic Feasibility of a Solar-Wind-Fuel Cell Energy System in Duqm, Oman. Energies 2022, 15, 5379. [Google Scholar] [CrossRef]
  4. Tanweer. Annual Report 2021. Available online: https://tanweer.om/uploadsall/Pdfs/236dd4bc-1d9d-488c-b895-5ea328fc2e3a.pdf/ (accessed on 11 October 2022).
  5. Ahshan, R.; Saleh, S.A.; Al-Badi, A.H. Performance Analysis of a Dq Power Flow Based Energy Storage Control System for Microgrid Applications. IEEE Access 2020, 8, 178706–178721. [Google Scholar] [CrossRef]
  6. Ahshan, R.; Hosseinzadeh, N.; Al-Badi, A.H. Economic Evaluation of a Remote Microgrid System for an Omani Island. Int. J. Smart Grid Clean Energy 2020, 9, 495–510. [Google Scholar] [CrossRef]
  7. Masrur, H.; Howlader, H.O.R.; Elsayed Lotfy, M.; Khan, K.R.; Guerrero, J.M.; Senjyu, T. Analysis of Techno-Economic-Environmental Suitability of an Isolated Microgrid System Located in a Remote Island of Bangladesh. Sustainability 2020, 12, 2880. [Google Scholar] [CrossRef] [Green Version]
  8. Seedahmed, M.M.A.; Ramli, M.A.M.; Bouchekara, H.R.E.H.; Shahriar, M.S.; Milyani, A.H.; Rawa, M. A techno-economic analysis of a hybrid energy system for the electrification of a remote cluster in western Saudi Arabia. Alex. Eng. J. 2022, 61, 5183–5202. [Google Scholar] [CrossRef]
  9. Rad, M.A.V.; Ghasempour, R.; Rahdan, P.; Mousavi, S.; Arastounia, M. Techno-economic analysis of a hybrid power system based on the cost-effective hydrogen production method for rural electrification, a case study in Iran. Energy 2020, 190, 116421. [Google Scholar] [CrossRef]
  10. Kolhe, M.L.; Ranaweera, K.M.I.U.; Sisara Gunawardana, A.G.B. Techno-economic sizing of off-grid hybrid renewable energy system for rural electrification in Sri Lanka. Sustain. Energy Technol. Assess. 2015, 11, 53–64. [Google Scholar] [CrossRef]
  11. Chowdhury, T.; Hasan, S.; Chowdhury, H.; Hasnat, A.; Rashedi, A.; Asyraf, M.R.M.; Hassan, M.Z.; Sait, S.M. Sizing of an Island Standalone Hybrid System Considering Economic and Environmental Parameters: A Case Study. Energies 2022, 15, 5940. [Google Scholar] [CrossRef]
  12. Giallanza, A.; Porretto, M.; Li Puma, G.; Marannano, G. A sizing approach for stand-alone hybrid photovoltaic-wind-battery systems: A Sicilian case study. J. Clean. Prod. 2018, 199, 817–830. [Google Scholar] [CrossRef]
  13. Roy, D.; Hassan, R.; Das, B.K. A hybrid renewable-based solution to electricity and freshwater problems in the off-grid Sundarbans region of India: Optimum sizing and socio-enviro-economic evaluation. J. Clean. Prod. 2022, 372, 133761. [Google Scholar] [CrossRef]
  14. Amupolo, A.; Nambundunga, S.; Chowdhury, D.S.P.; Grün, G. Techno-Economic Feasibility of Off-Grid Renewable Energy Electrification Schemes: A Case Study of an Informal Settlement in Namibia. Energies 2022, 15, 4235. [Google Scholar] [CrossRef]
  15. Uddin, M.N.; Biswas, M.M.; Nuruddin, S. Techno-economic impacts of floating PV power generation for remote coastal regions. Sustain. Energy Technol. Assess. 2022, 51, 101930. [Google Scholar] [CrossRef]
  16. Ali, F.; Ahmar, M.; Jiang, Y.; AlAhmad, M. A techno-economic assessment of hybrid energy systems in rural Pakistan. Energy 2021, 215, 119103. [Google Scholar] [CrossRef]
  17. Zebra, E.I.C.; van der Windt, H.J.; Nhumaio, G.; Faaij, A.P.C. A review of hybrid renewable energy systems in mini-grids for off-grid electrification in developing countries. Renew. Sustain. Energy Rev. 2021, 144, 111036. [Google Scholar] [CrossRef]
  18. Odou, O.D.T.; Bhandari, R.; Adamou, R. Hybrid off-grid renewable power system for sustainable rural electrification in Benin. Renew. Energy 2020, 145, 1266–1279. [Google Scholar] [CrossRef]
  19. Javed, M.S.; Song, A.; Ma, T. Techno-economic assessment of a stand-alone hybrid solar-wind-battery system for a remote island using genetic algorithm. Energy 2019, 176, 704–717. [Google Scholar] [CrossRef]
  20. Krishan, O.; Suhag, S. Techno-economic analysis of a hybrid renewable energy system for an energy poor rural community. J. Energy Storage 2019, 23, 305–319. [Google Scholar] [CrossRef]
  21. Faridah, L.; Purwadi, A.; Ibrahim, M.H.; Rizqiawan, A. Study and design of hybrid off-grid power system for communal and administrative load at 3 regions in Maluku, Indonesia. In Proceedings of the 2018 Conference on Power Engineering and Renewable Energy (ICPERE), Solo, Indonesia, 29–31 October 2018. [Google Scholar]
  22. Manama, S.M.; Scipioni, A.; Davat, B.; el Ganaoui, M. The idea of feeding a rural area in Comoros zith a micro-grid system with renewable energy source with hydrogen storages. In Proceedings of the 6th International Renewable and Sustainable Energy Conference, IRSEC 2018, Rabat, Morocco, 5–8 December 2018. [Google Scholar]
  23. Li, C.; Ge, X.; Zheng, Y.; Xu, C.; Ren, Y.; Song, C.; Yang, C. Techno-economic feasibility study of autonomous hybrid wind/PV/battery power system for a household in Urumqi, China. Energy 2013, 55, 263–272. [Google Scholar] [CrossRef]
  24. Abdilahi, A.M.; Yatim, A.H.M.; Mustafa, M.W.; Khalaf, O.T.; Shumran, A.F.; Nor, F.M. Feasibility study of renewable energy-based microgrid system in Somaliland’s urban centers. Renew. Sustain. Energy Rev. 2014, 40, 1048–1059. [Google Scholar] [CrossRef]
  25. Olatomiwa, L. Optimal configuration assessments of hybrid renewable power supply for rural healthcare facilities. Energy Rep. 2016, 2, 141–146. [Google Scholar] [CrossRef] [Green Version]
  26. Tayyab, M.; Zubair, M. PV-solar/Wind Hybrid Energy System for GSM/CDMA Type Mobile Telephony Base Station. Int. J. Eng. Res. Appl. 2015, 5, 74–79. [Google Scholar]
  27. Maouedj, R.; Mammeri, A.; Draou, M.; Benyoucef, B. Performance evaluation of hybrid photovoltaic-wind power systems. Energy Procedia 2014, 50, 797–807. [Google Scholar] [CrossRef] [Green Version]
  28. Nkuriyingoma, O.; Özdemir, E.; Sezen, S. Techno-economic analysis of a PV system with a battery energy storage system for small households: A case study in Rwanda. Front. Energy Res. 2022, 10, 957564. [Google Scholar] [CrossRef]
  29. Dahiru, A.T.; Tan, C.W. Optimal sizing and techno-economic analysis of grid-connected nanogrid for tropical climates of the Savannah. Sustain. Cities Soc. 2020, 52, 101824. [Google Scholar] [CrossRef]
  30. Kumar, J.; Suryakiran, B.V.; Verma, A.; Bhatti, T.S. Analysis of techno-economic viability with demand response strategy of a grid-connected microgrid model for enhanced rural electrification in Uttar Pradesh state, India. Energy 2019, 178, 176–185. [Google Scholar] [CrossRef]
  31. Kasaeian, A.; Rahdan, P.; Rad, M.A.V.; Yan, W.M. Optimal design and technical analysis of a grid-connected hybrid photovoltaic/diesel/biogas under different economic conditions: A case study. Energy Convers. Manag. 2019, 198, 111810. [Google Scholar] [CrossRef]
  32. Li, C.; Zhou, D.; Zheng, Y. Techno-economic comparative study of grid-connected PV power systems in five climate zones, China. Energy 2018, 165, 1352–1369. [Google Scholar] [CrossRef]
  33. Islam, M.S. A techno-economic feasibility analysis of hybrid renewable energy supply options for a grid-connected large office building in southeastern part of France. Sustain. Cities Soc. 2018, 38, 492–508. [Google Scholar] [CrossRef]
  34. Alharthi, Y.Z.; Siddiki, M.K.; Chaudhry, G.M. Resource Assessment and Techno-Economic Analysis of a Grid-Connected Solar PV-Wind Hybrid System for Different Locations in Saudi Arabia. Sustainability 2018, 10, 3690. [Google Scholar] [CrossRef] [Green Version]
  35. Maleki, A.; Rosen, M.A.; Pourfayaz, F. Optimal Operation of a Grid-Connected Hybrid Renewable Energy System for Residential Applications. Sustainability 2017, 9, 1314. [Google Scholar] [CrossRef]
  36. Nacer, T.; Hamidat, A.; Nadjemi, O. Techno-economic Impacts Analysis of a Hybrid Grid Connected Energy System Applied for a Cattle Farm. Energy Procedia 2015, 75, 963–968. [Google Scholar] [CrossRef] [Green Version]
  37. Zahedi, R.; Seraji, M.A.N.; Borzuei, D.; Moosavian, S.F.; Ahmadi, A. Feasibility study for designing and building a zero-energy house in new cities. Sol. Energy 2022, 240, 168–175. [Google Scholar] [CrossRef]
  38. Nasa.gov. ArcGIS Web Application. 2018. Available online: https://power.larc.nasa.gov/data-access-viewer/ (accessed on 5 October 2022).
  39. HOMER Pro 3.14 Manual. Available online: https://www.homerenergy.com/products/pro/docs/latest/index.html (accessed on 27 October 2022).
  40. Ahshan, R. Potential and Economic Analysis of Solar-to-Hydrogen Production in the Sultanate of Oman. Sustainability 2021, 13, 9516. [Google Scholar] [CrossRef]
  41. Solaris Shop. Canadian Solar CS6U-340m. 2016. Available online: https://www.solaris-shop.com/content/CS6U-340M%20Specs.pdf (accessed on 21 April 2022).
  42. Ahshan, R.; Al-Abri, R.; Al-Zakwani, H.; Ambu-saidi, N.; Hossain, E. Design and Economic Analysis of a Solar PV System for a Campus Sports Complex. Int. J. Renew. Energy Res. 2020, 10, 67–68. [Google Scholar]
  43. Ahshan, R.; Onen, A.; Al-Badi, A.H. Assessment of Wind-to-Hydrogen (Wind-H2) Generation Prospects in the Sultanate of Oman. Renew. Energy 2022, 200, 271–282. [Google Scholar] [CrossRef]
  44. Norvento nED 100-24. Available online: https://en.wind-turbine-models.com/turbines/1804-norvento-ned-100-24 (accessed on 25 October 2022).
  45. Ramli, M.A.M.; Hiendro, A.; Twaha, S. Economic analysis of PV/diesel hybrid system with flywheel energy storage. Renew. Energy 2015, 78, 398–405. [Google Scholar] [CrossRef]
  46. Saadat, H. Power System Analysis, 3rd ed.; PSA Publishing: North York, NY, USA, 2010. [Google Scholar]
Figure 1. Renewable sources-based power generation capacity growth worldwide.
Energies 16 00288 g001
Figure 2. Location of Al-Dhafrat community in the Sultanate of Oman [4].
Energies 16 00288 g002
Figure 3. Monthly average electrical load power consumption in the Al-Dhafrat power distribution network.
Energies 16 00288 g003
Figure 4. Diesel fuel consumption by the Al-Dhafrat power station.
Energies 16 00288 g004
Figure 5. Techno-economic and operational performance analysis process for rural area hybrid microgrid system.
Energies 16 00288 g005
Figure 6. Load profile for a day in summer (maximum load) and winter (minimum load) in 2020.
Energies 16 00288 g006
Figure 7. Monthly average solar irradiation profile in the Al-Dhafrat area.
Energies 16 00288 g007
Figure 8. Monthly average wind speed profile at the Al-Dhafrat area.
Energies 16 00288 g008
Figure 9. Energy contribution of diesel generator in each system configuration.
Energies 16 00288 g009
Figure 10. Renewable energy fraction for each optimal system configuration.
Energies 16 00288 g010
Figure 11. Power balance between the generations and load on a day with peak load (during summer).
Energies 16 00288 g011
Figure 12. Power balance between the generations and load on a day with minimum load (during winter).
Energies 16 00288 g012
Figure 13. ETAP software model of the Al-Dhafrat distribution network (partial).
Energies 16 00288 g013
Figure 14. Diesel-only system operational voltages (red line: maximum acceptable value and green line: minimum acceptable value) at different load bus during the summer load.
Energies 16 00288 g014
Figure 15. Diesel-only system operational voltage (red line: maximum acceptable value and green line: minimum acceptable value) at different load bus during the winter load.
Energies 16 00288 g015
Figure 16. PV–wind–diesel system operational voltages at different load bus during the summer load.
Energies 16 00288 g016
Table 1. Diesel generator data.
Diesel Generator
Lifetime219,000 h
Minimum load ratio30%
Intercept coefficient0.0226 L/kWh
Fuel slope0.2293 L/kWh
Operation and maintenance costUSD 10.27/operational h
Diesel fuel costUSD 1.49/L
Table 2. Photovoltaic data.
PV Module
Cell typeMonocrystalline
Lifetime25 years
Derating factor78%
Initial costUSD 882/kW
Replacement costUSD 882/kW
Operation and maintenance costUSD 14/kW/year
Temperature coefficient of power−0.41%/°C
Table 3. Wind generator data.
Wind Turbine
Rated power100 kW
Lifetime25 years
Cut-in and cut-out wind speeds3 m/s and 20 m/s
Hub height36 m
Initial costUSD 1255/kW
Replacement costUSD 700/kW
Operation and maintenance costUSD 10/kW/year
Temperature coefficient of power−0.41%/°C
Table 4. Inverter data.
Inverter
Lifetime10 years
Efficiency95%
Initial costUSD 750/kW
Replacement costUSD 700/kW
Operation and maintenance costUSD 15/year
Table 5. Factors utilized for greenhouse gas emission calculation.
GHGFactor (g/L fuel)
Carbon dioxide, CO22640
Carbon monoxide, CO0.38
Particulate matter0.03
Sulphur dioxide, SO26.55
Nitrogen Oxides, NO23.15
Table 6. Different system types for possible hybrid microgrid development.
System TypeDescription
System-IDiesel-only (Base system)
System-IIDiesel and renewable source (Wind–diesel)
System-IIIDiesel and renewable source (PV–diesel)
System-IVDiesel and mixed renewable source (PV–wind–diesel)
Table 7. Capacity detailed of each components in different optimal system configurations.
Component, CapacitySystem-I
(Diesel-Only)
System-II
(Wind–Diesel)
System-III
(PV–Diesel)
System-IV
(PV–Wind–Diesel)
Diesel generator, kW10,500560084005600
Photovoltaic, kW002469718
Wind turbine, kW0390003200
Inverter, kW001208401
Table 8. Economic comparison for different optimal system configurations.
Economic OutputSystem-I
(Diesel-Only)
System-II
(Wind–Diesel)
System-III
(PV–Diesel)
System-IV
(PV–Wind–Diesel)
NPC (millions of USD)31.0214.5922.8714.09
LCOE, USD/kWh0.56630.26630.41750.2573
Diesel cost (millions of USD)30.7010.2517.789.08
Diesel consumption (L/year)1,414,360471,999819,193418,204
Operation and maintenance cost (millions of USD)1.310.572.330.95
Table 9. Emissions in GHG components for different optimal system configurations.
Pollutant (kg/year)System-I
(Diesel-Only)
System-II
(Wind–Diesel)
System-III
(PV–Diesel)
System-IV
(PV–Wind–Diesel)
Carbon dioxide 3,740,6801,248,3352,166,5901,106,061
Carbon monoxide537179311159
Unburned hydrocarbons2127112363
Particulate matter42.214.224.613
Sulphur dioxide9277309653732743
Nitrogen oxides32,74210,92718,9649681
Total emissions (kg/year)3,783,490.21,262,622.22,191,385.61,118,720
Table 10. Cost detailed of the base case (diesel-only) system.
ComponentsCapital CostReplacement CostOperation and Maintenance CostFuel CostSalvageTotal Expenditure
Diesel generator001,306,139.2130,697,386.56983,305.9531,020,219.81
Wind generator000000
PV000000
Converter000000
System001,306,139.2130,697,386.56983,305.9531,020,219.81
Table 11. Cost detailed of the best optimal (PV–wind–diesel) system.
ComponentsCapital CostReplacement CostOperation and Maintenance Cost Fuel CostSalvageTotal Expenditure
Diesel generator00518,207.119,076,741.141,132,856.149,432,138.15
Wind generator4,016,000.0004661.28004,020,661.28
PV634,160.890430,767.48001,064,928.37
Converter301,016.52290,614.210044,838.04546,792.69
System49,511,774.41290,614.21953,635.869,076,741.141,177,694.1814,094,474.45
Table 12. Generated power and total losses in the diesel-only system during the winter and summer.
Summer LoadWinter Load
Generated power(1278 + j873) kVA(252 + j101) kVA
Power losses(28.8 − j18.9) kVA(0.001 − j0.0813) kVA
Table 13. Generated power and total losses in the PV–wind–diesel system during summer.
Summer Load
Generated power (1278 + j873) kVA
Power losses(23.8 − j19.9) kVA
Disclaimer/Publisher’s Note: The statements, opinions and data contained in all publications are solely those of the individual author(s) and contributor(s) and not of MDPI and/or the editor(s). MDPI and/or the editor(s) disclaim responsibility for any injury to people or property resulting from any ideas, methods, instructions or products referred to in the content.

