Abstract
Low-carbon economic efficiency is an important indicator that can be used to measure the quality of regional economic development. In this study, an improved DEA model is introduced into the calculation of low-carbon economic efficiency in Zhejiang Province. Using the actual data of nine prefecture-level cities in Zhejiang Province from 2015 to 2020, the low-carbon economic efficiency of each prefecture-level city is calculated. The result is that the overall low-carbon economic efficiency of Zhejiang Province indicates a trend of first falling and then rising, and the low-carbon economic efficiencies of different prefecture-level cities largely differ. The causes of six inefficient DMUs (prefecture-level cities) are analyzed using projection. The improved DEA model is used to determine the “expansion coefficient” of the input and output of three DMUs (prefecture-level cities) with relatively low-carbon economic efficiency. The research results provide a strong basis and support for the development of a low-carbon economy for Zhejiang Province.
1. Introduction
The Paris Agreement in 2020 proposed the goals of (1) limiting the increase in global average temperatures to less than 2 °C compared with the preindustrial period and (2) striving to limit the increase to less than 1.5 °C. The European Union, the United States, and China are the three major economies, and their total greenhouse gas emissions account for half of the world’s total [1]. With the increase in global energy consumption and carbon dioxide emissions, the low-carbon economy and low-carbon development have become the focus of attention all over the world [2]. As a populous and manufacturing country, China should take corresponding responsibilities. All the provinces of China should pay close attention to and reform enterprises with a high energy consumption, heavy pollution, and high emissions. The 20th National Congress of the Communist Party of China pointed out that “from 2012 to 2022, China’s carbon dioxide emissions per unit of GDP decreased by 34.4%”, but China’s 2060 carbon neutral target remains a challenge. As a member of the Paris Agreement, China promises to reach a peak of carbon dioxide emissions by around 2030 or earlier; reduce the intensity of carbon dioxide emissions by 60–65% compared with the level in 2005; and increase the proportion of non-fossil energy in primary energy to 20% by 2030 [3]. Each province in China should formulate corresponding low-carbon economic development goals and paths based on its own economic situation, resource endowment, and energy consumption structure.
As a demonstration plot for promoting high-quality development and realizing common prosperity in China, Zhejiang Province should pay more attention to low-carbon development and the low-carbon economy. In 2021, the GDP of Zhejiang Province was CNY 7351.6 billion (fourth in China), representing an increase of 8.5% over the previous year. Economic growth mainly comes from the contribution of industrial growth, but it also has a close relationship with the ecological environment. Therefore, Zhejiang Province should pay more attention to the organic integration of economic and low-carbon development. That is, while focusing on economic development, we should integrate the idea of low-carbon development, reduce the consumption of high-carbon energy, such as coal and oil, as much as possible, reduce greenhouse gas emissions, and achieve the win–win development goal of economic development and ecological environment protection in Zhejiang Province. Thus, it is necessary to measure and evaluate the efficiency of low-carbon economic efficiency in Zhejiang Province, understand the overall level of low-carbon economic development in Zhejiang Province, determine the advantages and disadvantages of low-carbon economic development in various prefecture-level cities in Zhejiang Province, and finally, define the development direction of the low-carbon economy.
In previous studies, two common methods were used to determine the performance of low-carbon economy, namely the single related index and comprehensive index analysis. The single related index mainly refers to carbon intensity and footprint, which directly reflect the fluctuation of carbon emissions. However, a single related index cannot measure the systematic change in carbon emissions and has gradually been replaced by data envelopment analysis (DEA) [4]. At present, most scholars apply DEA, stochastic frontier analysis (SFA), superefficient DEA, cross DEA, SBM-DEA, the Malmquist index method, three-stage DEA, and integrated interval adjustment measures to evaluate the efficiency of low-carbon economic development in different regions [5]. Therefore, this study also employs the improved DEA model to calculate the development efficiency of a low-carbon economy in Zhejiang Province.
Zhejiang Province is short of resources: 95% of its electricity, coal, and oil need to be transferred from other provinces. It is well known that the economy of Zhejiang Province is developing rapidly, which has become the leading factor behind its increasing carbon emissions. Green and sustainable development require a low-carbon economic development mode with low emissions, low pollution, and low energy consumption. Currently, there is a scarcity of theoretical research, efficiency evaluation, and measurements of a low-carbon economy in Zhejiang Province. In this context, this study measures the low-carbon economic efficiency of prefecture-level cities in Zhejiang Province based on the improved DEA model; defines the key areas of carbon reduction; and provides an empirical basis for a differentiated low-carbon transformation strategy.
The remainder of this study is arranged into five sections. The second section presents the literature review. The third section details the methodology and describes the data. Section 4 presents the research findings. Section 5 is the discussion, followed by Section 6, which draws conclusions and policy implications.
2. Literature Review
In 2003, the UK first put forward the concept of a low-carbon economy in government documents, stating that the low-carbon economy is a means to achieve high output through low-carbon consumption and low pollution, and to promote economic development through the application of advanced technology. The low-carbon economy is defined as an economy whose activities generate products or services that deliver low-carbon outputs [6]. A low-carbon economy is an economic form that emerged in postindustrial society, and it was designed to reduce greenhouse gas emissions to a certain level in order to prevent various countries and their citizens from being adversely affected by climate change and ultimately secure a global sustainable environment for humans [7]. The low-carbon economy has always been a hot topic in global research. Scholars have conducted a series of studies on the evaluation of regional economic efficiency based on DEA and other methods.
An and Zhu (2022) analyzed the relationship between urban energy CE and economic efficiency, and they used the Tapio decoupling index model and K-means clustering algorithm to conduct decoupling state analysis and clustering analysis, respectively [8]. Sheng et al. (2021) studied the decoupling relationship between China’s economic growth efficiency and carbon emission reduction efficiency [9]. Yang et al. (2023) used a quasi-difference-in-differences strategy to examine the net impact of place-based carbon reduction targets on the economic growth of 285 cities in China [10]. Jin et al. used a two-stage data envelopment analysis (DEA) model to conduct a dynamic study on the efficiency of technological innovation, the low-carbon economy, and the comprehensive efficiency of technological innovation and the low-carbon economy of 35 items of sectoral panel data from 1996 to 2018 [11]. The above study explored the relationship between economic growth and carbon emissions, and it laid a theoretical foundation for the current study of low-carbon economic efficiency presented in this study.
Wang et al. (2022) proposed a new method that combines machine learning and radial directional distance function (DDF) to estimate carbon emission efficiency and reduction potential [12]. Shi et al. (2022) applied the super SBM model and Malmquist–Luenberger (ML) index to evaluate the carbon emission efficiency of the industries (CEEI) from 266 items of panel data of Chinese cities from 2006 to 2018 [13]. Wang et al. (2020) used the data of 13 Chinese airlines from 2009 to 2013 to study the static and dynamic efficiency of carbon emissions through a slacks-based measure (SBM) model and the Malmquist–Luenberger (ML) productivity index [14]. Ignatius et al. (2016) employed fuzzy DEA to evaluate the carbon efficiency of 23 EU member states [15]. Metmood et al. (2020) applied network DEA to study the temporal and spatial changes in the carbon dioxide emission efficiency of major economies in the world from 2001 to 2011 [16].
Zhou (2015) built a comprehensive evaluation index system for the operation of a provincial low-carbon economy under the framework of “pressure state response” [17]. Liu et al. (2021) [18], Wu et al. (2016) [19], and Wang et al. (2019) all studied the index system of provincial low-carbon economic development, analyzed the differences in low-carbon development in various provinces, and evaluated their development level of a low-carbon economy. Zheng et al. (2017) utilized the three-stage DEA model to empirically study the low-carbon efficiency of China’s eastern, central, and western regions in 2015 [20]. Meng (2018) applied a range of adjustment measures and DEA model to evaluate the low-carbon economic efficiency of China’s provinces from 2001 to 2014 and discussed the main influencing factors that had a negative effect [21]. Wang et al. (2022) applied the generalized method of moments (GMM) to analyze the dynamic panel data of 131 countries in order to investigate the impact of industrialization and renewable energy on carbon emission efficiency so as to improve carbon efficiency and achieve carbon neutrality [22]. Lan et al. (2019) applied traditional DEA and cross-DEA to evaluate the development efficiency of a low-carbon economy in Hubei Province [23]. Li et al. (2022) combined the three-stage SBM-DEA model of unexpected output and the Malmquist index to calculate the carbon emission efficiency of 11 provinces and cities in the Yangtze River Economic Zone from 2011 to 2019 [24].
The researchers discussed above mainly studied low-carbon economic efficiency and carbon emission efficiency, and their work provides a reference for the construction of the low-carbon economic efficiency evaluation system for this study. The above-mentioned DEA model, SBM model, and ML index provide a basis for the improvement of the evaluation method in this study. It was also found that Zhejiang Province has not been taken as a separate research object in the current literature to specifically calculate low-carbon economic efficiency. In view of the fact that traditional DEA cannot rank and analyze the advantages and disadvantages of DMUs with a comprehensive efficiency value of 1, in order to overcome the limitations of this method, this study applies an improved DEA model on the basis of previous experience.
3. Research Method and Data
3.1. Using the C2R Model to Determine the Value of DMU’s Low-Carbon Economic Efficiency
Data envelopment analysis is a method that is used to evaluate the performance of decision-making units of the same type. The same type refers to different decision-making units with inputs and outputs that have the same nature. In 1985, Charnes and Cooper et al. proposed the BCC model, which is used to compare and evaluate the technical efficiency of existing evaluation decision-making units. It belongs to the category of relative evaluation models [25,26]. However, traditional DEA models (the BCC and CCR models) often have multiple DMUs in efficiency at the same time. That is, there are many DMUs in efficient units where the efficiency value is 1, which makes it impossible to further distinguish the differences in efficiency [27]. In order to solve this problem, this study introduces the non-Archimedean infinitesimal ε to the C2R model [28]. The ε can be understood as a number less than any positive number but greater than zero. The C2R model with the non-Archimedean infinitesimal is as follows.
where T is the production possibility set, xj is the n-dimensional input vector of the jth prefecture-level city, yj is the s-dimensional output vector of the jth prefecture-level city, and x0 and y0 are the input and output vectors of the j0th prefecture-level city of the evaluated unit, respectively. If , , the evaluated unit DMUj0 is efficient. If , the evaluated unit DMUj0 is inefficient.
3.2. Adjustment of Low-Carbon Economic Efficiency with Inefficient DMU
For the inefficient DMUk, we compared it with the “projection” on the relatively efficient frontier of DEA in order to determine the reasons for the inefficiency and to adjust the low-carbon economic efficiency of prefecture-level cities with inefficient DMUs to be efficient. Let , , , be the optimal solutions of , and then is the projection of on the relatively efficient frontier; then
We can obtain , using Formula (4) for a decrease in inputs and an increase in outputs, respectively. We can determine the cause of inefficient DMUk so as to adjust the efficiency.
If the absolute values of , are very small, this indicates that the current inputs or outputs are relatively efficient, and no adjustment is required. Otherwise, it implies that the current inputs or outputs are inefficient. According to the values of , , we reduce the inputs or increase the outputs of the inefficient DMUk to make the low-carbon economic efficiency of prefecture-level cities reach, or become close to, efficiency.
3.3. Improving the Low-Carbon Economic Efficiency of Efficient DMUs by Using Improved DEA
When using the C2R model to determine the relative efficiency of the low-carbon economic efficiency of prefecture-level cities, if , , then the output of the evaluated prefecture-level cities under the current input level is relatively efficient. However, if the prefecture-level cities want to further increase input to increase low-carbon output under the premise of efficient energy conservation and carbon reduction, the C2R model cannot provide a basis. At this time, we need to apply the improved DEA model, which is shown in Formula (5) [28,29]:
where xj is the n-dimensional input vector of the jth prefecture-level city and yj is the s-dimensional output vector of the jth prefecture-level city. x0, y0 are the input and output vectors of the j0th prefecture-level city of the evaluated unit, respectively. The possible production set is
The production possibility set does not include the evaluated prefecture-level city j0. That is, when evaluating the prefecture-level city j0, we compare it with the linear combination of the other prefecture-level cities, excluding j0 itself. An efficient DMU is likely to increase its input proportionally while still maintaining its relative efficiency. That is, when the input of j0 increases proportionally, it still falls on the production frontier [26]. In the improved DEA model, a prefecture-level city in Zhejiang Province can increase its investment but still maintain a relatively efficient maximum proportion value, which is called the prefecture-level city’s proportional value of investment expansion (abbreviated to D here).
When the proportional value of investment expansion D=1, it means that the prefecture-level city cannot increase investment; otherwise, its low-carbon economic efficiency will become inefficient. When the proportional value of investment expansion D > 1, the prefecture-level city should increase the input of low-carbon economic resources, which can be increased to D times the original. At this time, the prefecture-level city’s low-carbon economic output also increases and can ensure that the output is still relatively efficient, enabling the prefecture-level city to improve its low-carbon economic efficiency.
3.4. Index Selection and Data Description
According to the connotation and characteristics of low-carbon economic efficiency, combined with the theory of the DEA analysis method, the authors of this paper built a low-carbon economic efficiency measurement system for Zhejiang Province, as shown in Figure 1.
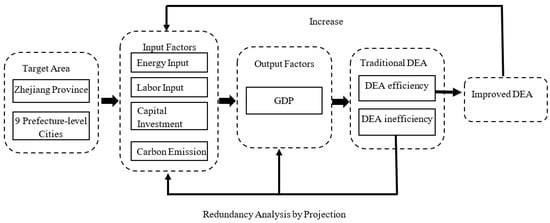
Figure 1.
Measurement system of low-carbon economic efficiency in Zhejiang Province.
The traditional goal of efficient economic development is to obtain the maximum economic output with the least input of production factors. The development efficiency of a low-carbon economy should not only consider traditional economic development efficiency but also environmental efficiency. That is, with full consideration of carbon emissions and energy consumption, the optimal economic benefits can be obtained with fewer input factors.
Therefore, the output indicator is the regional GDP. Input indicators specifically include energy input, labor input, capital investment, and carbon emission. Carbon emission is a special output indicator. Among all input indicators, the smaller the indicator value of the carbon emission, the more beneficial it is to the development of a low-carbon economy. As the DEA model usually takes unexpected special indicators as input indicators, the carbon emission indicator is included in the input indicators for calculation when analyzing the development efficiency of a low-carbon economy:
- (1)
- Gross domestic product (GDP). The GDP accounting data are from the Zhejiang Statistical Yearbook (2016–2021).
- (2)
- Labor input. The labor input indicator refers to the amount of labor input in the production process. It can be measured by the labor time of standard labor intensity or the amount of labor. In view of the availability of data, this study utilizes the year-end employment number for the whole society of prefecture-level cities in Zhejiang Province. The specific data are also from the Zhejiang Statistical Yearbook (2016–2021).
- (3)
- Capital investment. This study refers to the estimation method of capital stock developed by Zhang and Wang [30], and He and Li [27], and it takes the investment in fixed assets of prefecture-level cities in Zhejiang Province as a measure of capital investment. The data of fixed asset investment in each prefecture-level city of Zhejiang Province are also from the Zhejiang Statistical Yearbook (2016–2021).
- (4)
- Energy input. This study refers to the calculation caliber of energy input reported by Lan et al. [23] and Li [31], and it employs the total energy consumption of each prefecture-level city in Zhejiang Province to measure energy input. The relevant data come from the statistical yearbooks of nine prefecture-level cities in Zhejiang Province.
- (5)
- Carbon emission. This mainly refers to carbon dioxide emissions. This study estimates the carbon dioxide emissions of each prefecture-level city based on the conversion coefficient of various energies to standard coal given in the China Energy Statistics Yearbook in 2018 and the carbon emission coefficient given by the Intergovernmental Panel on Climate Change (IPCC) in 2006. The carbon dioxide emissions of each city in Zhejiang Province are mainly calculated based on the three primary energy sources with large consumption in each prefecture-level city. The total amount of carbon dioxide emissions can be obtained by adding the estimated amount of carbon dioxide emissions caused by various types of energy consumption [32]. The specific formula is as follows:
where CFE represents the carbon footprint of fossil energy (10,000 t), Ei represents the consumption of the ith energy (10,000 t), αi is the conversion factor of the ith energy, and βi represents the carbon dioxide emission coefficient of the ith energy. The specific values of these coefficients are shown in Table 1. This study calculates the energy consumption and corresponding carbon emission coefficient, which were proposed by the Intergovernmental Panel on Climate Change (IPCC) of the United Nations in 2006. That is, the carbon dioxide emission coefficient is calculated by using the “Sectoral Approach 2” developed by the IPCC. The specific formula is as follows:
Carbon Dioxide Emission Coefficient = Low Calorific Value × Carbon Content Factor × Carbon Oxidation Factor × (44/12)

Table 1.
Coal conversion coefficient and carbon dioxide emission coefficient of main energy sources.
4. Research Findings
4.1. Analysis of Relative Efficiency Results
The precise evaluation of the low-carbon economic efficiency of prefecture-level cities in Zhejiang Province is an important basis for energy conservation and emission reduction, and it is also an important basis for Zhejiang Province to implement the national dual-carbon strategy according to the four input factors determined in Section 3.4 of this study, namely, energy input, labor input, capital investment, and carbon emission, as well as an additional output factor, namely, gross regional product. The five indicators and the indicator data obtained were standardized. In view of the consistency of statistical indicators and the continuity of time, this study formed panel data based on the time series data of prefecture-level cities in Zhejiang Province from 2015 to 2020.
We take the development of a low-carbon economy in different years in prefecture-level cities in Zhejiang Province as the decision-making unit. Due to the lack of energy consumption data in the Statistical Yearbook for Shaoxing and Lishui, this study adopts the C2R model in Formula (1) to calculate the low-carbon economic efficiency of the remaining nine prefecture-level cities in Zhejiang Province. Due to the large amount of original data from 2015 to 2020, this study gives the calculation results, as shown in Table 2.
Table 2.
Calculation results of low-carbon economic efficiency of nine prefecture-level cities in Zhejiang Province.
Overall, the low-carbon efficiency of Zhejiang Province generally shows a trend of decreasing first and then increasing. The average low-carbon economic efficiency of Zhejiang province in 2020 is 0.8756, which still has much room for improvement. It can be seen from the mean value in Table 2 that the development efficiency of the low-carbon economy somewhat differs among the various prefecture-level cities of Zhejiang Province. The low-carbon economic efficiency of Hangzhou and Huzhou belongs to the first echelon among the nine prefecture-level cities in Zhejiang Province. The efficiency value of Hangzhou and Huzhou is 1.0000, which places them at the forefront of these prefecture-level cities, indicating that the quality of economic development and the level of carbon emissions are optimal. The low-carbon economic efficiency of Ningbo, Wenzhou, and Zhoushan belongs to the second echelon among the nine prefecture-level cities in Zhejiang Province, with efficiency values higher than 0.9. Among these, the value for Ningbo is the highest, with an average efficiency of 0.9999, close to 1, indicating that its levels of economic development and carbon emissions are relatively better. The low-carbon economic efficiency of Jiaxing, Taizhou, Jinhua, and Quzhou belongs to the third echelon among the nine prefecture-level cities in Zhejiang Province. The efficiency values are all lower than 0.9. The value for Quzhou is the lowest at 0.6431, indicating that its economic development and carbon emission are relatively poor.
From the mean value of low-carbon economic efficiency from 2015 to 2020, the calculation results of seven prefecture-level cities in Zhejiang Province, namely, Jiaxing, Taizhou, Jinhua, Quzhou, Ningbo, Wenzhou, and Zhoushan, did not reach 1. The results also show that there is still room to improve the efficiency of the low-carbon economy, especially in Jiaxing, Taizhou, Jinhua, and Quzhou, which are in the third echelon. The lower the calculation result, the lower the efficiency of low-carbon economic development in the prefecture-level city. In Section 4.2, the necessary projection analysis of redundancy is conducted, and we analyze the problem from input and output factors.
According to the horizontal data for 2020, the regions with a low-carbon economic efficiency of 1.0000 include Hangzhou, Ningbo, and Huzhou. This is mainly because Hangzhou is the political, economic, and cultural center of Zhejiang Province. Moreover, Ningbo is striving to develop a “new economy” and cultivate “new momentum”. Furthermore, Huzhou has a scientific economic structure and balanced development. The low-carbon economic efficiency of Jiaxing and Quzhou for 2020 is on the low side. Their efficiency value is lower than 0.74, because the values of the input factors, i.e., labor input, capital investment, energy input, and carbon emissions, are higher, while the value of the output factor, i.e., regional GDP, is lower. We take the development of a low-carbon economy in nine prefecture-level cities in 2020 as an example for projection analysis.
4.2. Projection Analysis
The 2020 DEA efficiency values of Wenzhou, Jiaxing, Taizhou, Jinhua, Quzhou, and Zhoushan are 0.9665, 0.7371, 0.8040, 0.8544, 0.6220, and 0.8967, respectively, which are less than 1. This indicates that the DEA efficiency is inefficient. According to Formulas (3) and (4) presented in Section 3.2, we can obtain the , values of Wenzhou, Jiaxing, Taizhou, Jinhua, Quzhou, and Zhoushan, as shown in Table 3. Then, the number of input factors can be controlled according to the adjustment proportion, thereby ensuring that the low-carbon economic efficiency of these six prefecture-level cities stays within a reasonable range.
Table 3.
Cause analysis of inefficient low-carbon economic efficiency in six prefecture-level cities.
We produced Figure 2 in order to intuitively reflect the reduction percentage of the actual value of each index in the above six prefecture-level cities in Zhejiang Province.
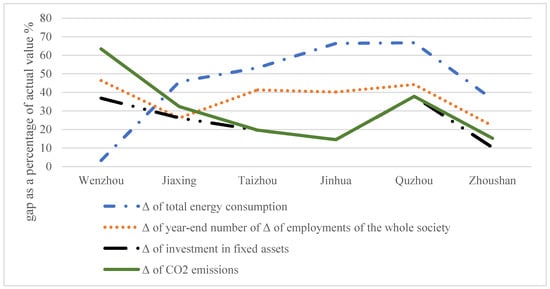
Figure 2.
The reduction percentage () of each prefecture-level city by projection.
From the calculation results in Table 3 and the comparison of the gap as a percentage of the actual value of each prefecture-level city in Figure 2, it can be seen that in order to make the low-carbon economic efficiency of these six prefecture-level cities reach 1, the total energy consumption, the year-end employment number of the whole society, the amount of investment in fixed assets, carbon dioxide emissions, and other input factors need to be reduced by different percentages. In the reduction percentage, the analysis can be started from the primary reduction percentage and the secondary reduction percentage.
The first reduction percentage is the primary reduction percentage. Jiaxing, Taizhou, Jinhua, Quzhou, and Zhoushan have a high total energy consumption of input factors in the measurement of low-carbon economic efficiency. These five prefecture-level cities should focus on controlling the total amount of energy consumption input, especially Quzhou, which is faced with the most difficult task. It is necessary to reduce the total amount of energy consumption by 66.76% for Quzhou. This can be achieved by increasing the control of the total amount of energy consumption of coal, oil and related products, natural gas, etc. Efforts will be made to adjust the low-carbon economic efficiency of these five prefecture-level cities to be efficient.
The second reduction percentage is the secondary reduction percentage. Taizhou, Jinhua, Quzhou, and Zhoushan pay minimal attention to the number of labor inputs. Similarly, the year-end employment number of the whole society in Quzhou needs to be reduced by 44.29%. Thus, it is possible to adjust Quzhou’s low-carbon economic efficiency to 1. Labor can be replaced by automated assembly lines, artificial intelligence, and other means. The laborers can be engaged in innovative work, thus improving the output efficiency.
The particularity of Wenzhou must also be noted. Wenzhou has a serious redundancy in carbon dioxide emissions. The Wenzhou Government should attach great importance to reducing carbon dioxide emissions by 63.44%. Attention should be paid to the development and use of alternative technologies for fossil energy. There should be efforts made to develop and utilize renewable energy, such as solar, wind, water, and other energies, to reduce carbon dioxide emissions to ensure that the actual output reaches optimal efficiency.
4.3. Utilizing the Improved DEA Model to Expand the Proportion of Input
The C2R model and the improved DEA model, namely, Formulas (4) and (5), are applied to calculate the DEA efficiency value and the input expansion ratio value D of the low-carbon economic development of nine prefecture-level cities in Zhejiang Province. The results are shown in Table 4.
Table 4.
The DEA efficiency value and investment expansion ratio value D of nine prefecture-level cities.
It can be seen from the calculation results in Table 4 that the low-carbon economic efficiency of Hangzhou, Ningbo, and Huzhou is relatively efficient. Their input expansion ratio value D (also referred to as the expansion coefficient.) is 1.6532, 1.0068, and 1.7045, respectively. Since the expansion coefficient of the three prefecture-level cities is greater than 1, if all the inputs of the three prefecture-level cities are increased up to 1.6532, 1.0068, and 1.7045, respectively, the low-carbon economic output of each prefecture-level city will also increase accordingly. Moreover, it is still relatively efficient to maintain the low-carbon economic efficiency value. According to the expansion coefficient in Table 4, it can also be judged that the improvement range of low-carbon economic efficiency in the three prefecture-level cities is different. Huzhou has the largest proportion of improvement, while Ningbo has the smallest proportion.
5. Discussion
We should integrate the concept of low-carbon economic development into the economic and social development planning of Zhejiang Province, especially in the regions with low-carbon economic efficiency, such as Jiaxing, Taizhou, Jinhua, and Quzhou. Preferential policies could stimulate the enthusiasm of enterprises to achieve low-carbon development. For enterprises that do not carry out technological transformation, seriously pollute the environment, and consume more energy, local governments in Zhejiang Province could adopt high fines or limit financing opportunities to reduce the high-carbon economic behavior of such enterprises.
Zhejiang Province could set Hangzhou, Ningbo, and Huzhou as model cities for low-carbon economy, as doing so should encourage other prefecture-level cities to actively carry out green economy management, environmental pollution control, and low-carbon industrial structure upgrading. It should also advocate the concept of green GDP and the national happiness index (NHP). Local governments should provide more policy and financial support for the development of a low-carbon economy. The prefecture-level cities in Zhejiang Province should also increase their support for low-carbon science, technology projects, and emerging industries in the form of incentives, loans, and other policies.
In particular, financial support should be provided to emerging low-carbon industries, and all sectors of society should be guided to support regional low-carbon economic development with funds. Enterprises should be encouraged to carry out energy conservation and emission reduction. This would promote cleaner production and aid in the development of a low-carbon and circular economy. It would also promote recycling and the efficient use of resources and energy. Each prefecture-level city in Zhejiang Province should also actively carry out publicity, education, and training on low-carbon economies and climate change. Doing so would result in the publicization of national and regional policies for the development of a low-carbon economy, as well as encouraging and advocating low-carbon production and lifestyles. Ensuring the awareness of the whole society about developing a low-carbon economy is recommended, because this, in turn, should result in a better allocation of resources and an improvement in the efficient use of these elements. Such efforts could promote the development of a low-carbon economy in Zhejiang Province.
6. Conclusions and Limitations
Through the analysis and discussion of the above results, we can draw the following conclusions. A large number of studies have proved that it is efficient and practical to use the DEA method to measure regional low-carbon economies. However, in view of the fact that the traditional DEA method cannot rank and analyze the advantages and disadvantages of DMUs with a comprehensive efficiency value of 1, this study adopts an improved DEA model, which can not only judge the efficiency of DMUs but also further rank the efficiency of units to determine the proportion of input and output growth. Projection analysis can also be used to identify the specific reasons for inefficient DMUs.
In general, the development efficiency of the low-carbon economy in nine prefecture-level cities in Zhejiang Province continued to improve from 2017 to 2020. However, according to the data analysis of the latest year in 2020, we found that there is still large room for improvement in regard to the efficiency of the low-carbon economy in Zhejiang Province. We should start with regions with high carbon dioxide emissions in Zhejiang Province, such as Jiaxing, Taizhou, and Wenzhou. We should learn from the low-carbon economic development concept of Hangzhou, Ningbo, and Huzhou, and then rely on the advantages of digital technology to harness new energy, new materials, intelligent networking, and other industries.
We should increase the use of clean energy and optimize the energy consumption structure of Jiaxing, Taizhou, Wenzhou, and other prefecture-level cities. Especially in regions with low low-carbon economic efficiency, we should accelerate the development of wind, solar, water, and other renewable energy sources to improve energy efficiency. Taking Jiaxing, Taizhou, Jinhua, and Quzhou as examples, which are characterized by high energy consumption and outputs, we should vigorously promote the use of clean energy.
This study argues that the means of determining the optimal proportion of labor input, capital input, and especially energy input, and reducing carbon dioxide emissions as much as possible is the key to the efficient development of a low-carbon economy and high-quality development of cities. The projection analysis method and improved DEA model proposed in this study can provide a methodological reference for other cities to analyze the causes of the low efficiency of their low-carbon economies and further enhance output.
Two limitations still exist in this study. Although this study estimates the low-carbon economic efficiency of nine prefecture-level cities in Zhejiang Province, it does not specifically analyze each industry in each prefecture level city. Due to the different characteristics and stages of industry development in each prefecture-level city, and as a result of the limited availability of data and space, this study does not analyze the low-carbon economic efficiency at the industry level. Moreover, this study identifies the prefecture-level cities with low low-carbon economic efficiency, but it preliminarily identifies the main factors of low low-carbon economic efficiency. Furthermore, it does not provide an in-depth investigation into these prefecture-level cities to understand the underlying causes of low low-carbon economic efficiency, and the solutions need further in-depth research. Further details could be discussed in future studies.
Author Contributions
Investigation and evaluation model, X.L.; Data analysis and writing, H.L. All authors have read and agreed to the published version of the manuscript.
Funding
This study was funded by Later support from National Social Science Foundation, grant No. 21FGLB022; Soft Science Project of Science department of Zhejiang Province, China, grant No. 2022C35015; Philosophy and Social Science Foundation of Heilongjiang Province, China, grant No. 20GLE394 and No. 21JYB152; Key scientific and technological projects of Quzhou, China, grant No. 2022K99; Liberal Arts Base Fund project of Northeast Petroleum University, Heilongjiang Province, China, grant No. WKJD202002.
Data Availability Statement
The data that support the findings of this study are available upon request to the corresponding author.
Conflicts of Interest
The authors declare no conflict of interest.
References
- Tagliapietra, S.; Wolff, G. Form a Climate Club: United States, European Union and China. Nature 2021, 591, 526–528. [Google Scholar] [CrossRef] [PubMed]
- Gutiérrez-López, C.; Castro, P.; Tascón, M. How Can Firms’ Transition to a Low-carbon Economy Affect the Distance to Default. Res. Int. Bus. Financ. 2022, 62, 382–385. [Google Scholar] [CrossRef]
- Guo, J.; Zhang, Y.; Zhang, K. The Key Sectors for Energy Conservation and Carbon Emissions Reduction in China: Evidence from the Input-output Method. J. Clean. Prod. 2018, 15, 179–184. [Google Scholar] [CrossRef]
- Wang, Y.; Huang, J. Pathway to Develop a Low-carbon Economy Through Energy-Substitution Technology in China. Energy 2022, 261, 124964. [Google Scholar] [CrossRef]
- Zhao, L.; Zha, Y.; Liang, N. Data envelopment analysis for unified efficiency evaluation: An assessment of regional industries in China. J. Clean. Prod. 2016, 113, 695–704. [Google Scholar] [CrossRef]
- Sengupta, P.; Choudhury, B.; Mitra, S.; Agrawal, K. Low-carbon Economy for Sustainable Development. In Encyclopedia of Renewable and Sustainable Materials; Elsevier: Amsterdam, The Netherlands, 2020; pp. 1–17. [Google Scholar]
- Pan, J.; Zhang, G.; Zheng, Y.; Zhu, S.; Xie, Q. Clarification of the Concept of a Low-carbon Economy and the Analysis of Its Core Elements. In Political Economy of China’s Climate Policy; Springer: Singapore, 2022; pp. 179–198. [Google Scholar]
- An, R.; Zhu, G. Clustering of Economic Efficiency of Urban Energy Carbon Emissions Based on Decoupling Theory. Energy Rep. 2022, 8, 9569–9575. [Google Scholar] [CrossRef]
- Sheng, P.; Li, J.; Zhai, M.; Majeed, M. Economic Growth Efficiency and Carbon Reduction Efficiency in China: Coupling or Decoupling. Energy Rep. 2021, 7, 289–299. [Google Scholar] [CrossRef]
- Yang, Z.; Lu, M.; Shao, S.; Fan, M.; Yang, L. Carbon Regulation and Economic Growth: City-level Evidence from China. Environ. Impact Assess. Rev. 2023, 99, 107020. [Google Scholar] [CrossRef]
- Jin, B.; Han, Y.; Kou, P. Dynamically Evaluating the Comprehensive Efficiency of Technological Innovation and Low-carbon Economy in China’s Industrial Sectors. Socio-Econ. Plan. Sci. 2022, 101480. [Google Scholar] [CrossRef]
- Wang, A.; Hu, S.; Li, J. Using Machine Learning to Model Technological Heterogeneity in Carbon Emission Efficiency Evaluation: The Case of China’s Cities. Energy Econ. 2022, 114, 106238. [Google Scholar] [CrossRef]
- Shi, X.; Xu, Y. Evaluation of China’s Pilot Low-carbon City Program: A Perspective of Industrial Carbon Emission Efficiency. Atmos. Pollut. Res. 2022, 13, 101446. [Google Scholar] [CrossRef]
- Wang, Z.; Xu, X.; Zhu, Y.; Gan, T. Evaluation of Carbon Emission Efficiency in China’s Airlines. J. Clean. Prod. 2020, 243, 118500. [Google Scholar] [CrossRef]
- Ignatius, J.; Ghasemi, M.; Zhang, F. Carbon Efficiency Evaluation: An Analytical Framework Using Fuzzy DEA. Eur. J. Oper. Res. 2016, 253, 428–440. [Google Scholar] [CrossRef]
- Mehmood, K.; Iftikhar, Y.; Chen, S. Analysis of Inter Temporal Change in the Energy and CO2 Emissions Efficiency of Economies: A Two Divisional Network DEA Approach. Energies 2020, 13, 3300. [Google Scholar] [CrossRef]
- Zhou, Y.; Guo, Y.; Yi, P. Comprehensive Evaluation Method and Application of China’s Provincial Low Carbon Economy. Tech. Econ. 2015, 8, 52–57. [Google Scholar]
- Liu, X.; Wang, B.; Chen, K.; Jiao, Y.; Li, G. Research on Low-carbon Economy Evaluation Based on Closeness Value Improved TOPSIS. Tech. Econ. 2021, 12, 74–84. [Google Scholar]
- Wu, X.; Chen, J.; Li, S. Construction of Carbon Economy Evaluation Index System. Enterp. Econ. 2016, 6, 11–14. [Google Scholar]
- Zheng, B.; Li, X.; Huang, L. Research on China’s Regional Low-carbon Economic Efficiency Based on Three Stage DEA Model. J. Anhui Univ. Technol. 2017, 6, 3–6. [Google Scholar]
- Meng, M.; Fu, Y.; Wang, L. Low-carbon Economy Efficiency Analysis of China’s Provinces Based on a Range-Adjusted Measure and Data Envelopment Analysis Model. J. Clean. Prod. 2018, 199, 643–650. [Google Scholar]
- Wang, Q.; Zhang, C.; Li, R. Towards Carbon Neutrality by Improving Carbon Efficiency-A System-GMM Dynamic Panel Analysis for 131 Countries’ Carbon Efficiency. Energy 2022, 258, 124880. [Google Scholar] [CrossRef]
- Lan, J.; Zhao, J.; Chen, F.; Zhang, S. Research on Evaluation of Low-carbon Economic Efficiency in Hubei Province Based on Cross DEA Model. J. Hubei Inst. Technol. 2019, 5, 35–43. [Google Scholar]
- Li, G.; Zhu, H. Study on the Carbon Emission Efficiency of the Yangtze River Economic Belt Based on the Three Stage SM-DEA Malmquist Index. Oper. Res. Manag. 2022, 6, 161–167. [Google Scholar]
- Banker, M.; Charnes, A.; Cooper, W. Some Models for Estimating Technical and Scale Inefficiencies in Data Envelopment Analysis. Manag. Sci. 1984, 30, 1078–1092. [Google Scholar] [CrossRef]
- Charnes, A.; Cooper, W.; Rhodes, E. Measuring the Efficiency of Decision-making Units. Eur. J. Oper. Res. 1978, 2, 429–444. [Google Scholar] [CrossRef]
- He, S.; Li, Q. Assessment and Spatial Differentiation of Regional Low-carbon Efficiency Based on Super-SBM Model: A Case Study of Sichuan Province. Ecol. Econ. 2021, 10, 40–46. [Google Scholar]
- Lin, X.; Zhang, Q.; Luo, H. Research on Evaluation and Improvement of Enterprise’s Independent Innovation Ability Based on DEA. Oper. Res. Manag. 2009, 4, 152–158. [Google Scholar]
- Guo, J.; Wu, Y.; Li, W. Improved DEA Model and Its Application in the Economic Evaluation of Regional Industries. Appl. Syst. Eng. Theory Method 2003, 2, 174–176. [Google Scholar]
- Zhang, J.; Wang, P. China’s Total Factor Productivity: Estimation Based on Provincial Capital Depreciation Rate. J. Manag. World 2012, 10, 18–30. [Google Scholar]
- Li, D.; Yu, Q.; Liang, Y. Research on China’s Provincial Low-carbon Economic Efficiency Based on Cross Evaluation DEA Model. J. Wuhan Univ. Technol. 2016, 5, 892–897. [Google Scholar]
- Chen, S. Energy Consumption, Carbon Dioxide Emission and Sustainable Development of China’s Industry. Econ. Res. 2009, 4, 41–55. [Google Scholar]


Disclaimer/Publisher’s Note: The statements, opinions and data contained in all publications are solely those of the individual author(s) and contributor(s) and not of MDPI and/or the editor(s). MDPI and/or the editor(s) disclaim responsibility for any injury to people or property resulting from any ideas, methods, instructions or products referred to in the content. |
© 2022 by the authors. Licensee MDPI, Basel, Switzerland. This article is an open access article distributed under the terms and conditions of the Creative Commons Attribution (CC BY) license (https://creativecommons.org/licenses/by/4.0/).