Article

Optimization Methods of Urban Green Space Layout on Tropical Islands to Control Heat Island Effects

1
China Academy of Building Research, Beijing 100029, China
2
School of Environmental Science and Engineering, Tianjin University, Tianjin 300072, China
*
Author to whom correspondence should be addressed.
Energies 2023, 16(1), 368; https://doi.org/10.3390/en16010368
Submission received: 17 November 2022 / Revised: 21 December 2022 / Accepted: 24 December 2022 / Published: 28 December 2022
(This article belongs to the Special Issue Low Carbon Energy Technology for Heating and Cooling of Buildings)

Abstract

:
With the rapid increase in demand for the construction and development of island cities in the South China Sea, the urban heat island phenomenon in such cities should become a key factor to be considered in future urban planning. This paper took Sanya, China as a typical case, and long-term field experiments were conducted in the Mangrove Bay Area in summer and winter. An innovative urban green space cooling model was proposed, using the “green space cooling index” to quantitatively characterize the green space cooling effect, and aiming to minimize the intensity of urban heat islands. This paper studied the optimization method of green space planning and layout under the constraint of a centralized green space total area. Moreover, a genetic algorithm was adopted to optimize the calculation and the layout of the urban green space. The experimental results showed that the urban heat island intensity was more significant at night and was less effective in the daytime during summer. In winter, the urban heat island intensity had a greater effect in the daytime and was less influential at night. Finally, optimization results indicated that the average urban heat island intensity in summer was reduced by 8.8% under the optimal layout urban green space of 0.025 km2. The maximum reduction in heat island intensity occurred at 7:00 am (0.48 °C). When 0.0625 km2 urban green space was planned, the average urban heat island intensity index in summer was reduced to 0.27 °C, with a decrease of 20.5%.

1. Introduction

As of 2021, China’s urbanization rate has reached 64.72% [1], and the proportion has been increasing with the development of society. Therefore, the supply of urban green space (UGS) has become the focus of planning research and policy formulation. At the same time, one of the important aims of sponge-city and low-carbon-city construction is to reasonably determine the number and layout of UGS. The fundamental measure of urban ecological environment governance is to maintain a certain number of UGS [2]. Evaluating the spatial supply and demand matching of urban green space and further optimizing the layout on this basis provide a direct reference for urban ecological planning. This is conducive to the improvement of urban ecological environment and livability, and promotes the fair allocation of green space resources.
The UGS has high ecological and socio-economic benefits, facilitating the rapid recovery of the city and ensuring the sustainable operation of the whole urban system [3]. Many studies have extensively discussed the ecological functions of UGS and confirmed that UGS is closely related to the health level and quality of life of residents [4,5]. It can not only significantly improve the local environment of cities, raise air quality, increase urban carbon sinks, reduce noise and urban floods, and protect biodiversity [6,7], but can also provide leisure and entertainment space, sports venues, daily communication space, and beautification functions [8]. In order to guarantee high-quality of human activities, urban areas must have good natural ecological conditions so as to reduce ecological interference caused by increasing urbanization [9].
Many studies have confirmed that UGS plays an important role in alleviating the urban heat island effect, which can reduce ambient temperature and improve the urban microclimate through transpiration and shading of vegetation [10,11]. It has been found that urban green space increases air humidity and effectively alleviates urban heat island effects through the transpiration of plants. Bowler et al. [12] found that through meta-analysis, the average cooling effect of the park in the daytime was 0.94 °C, and the cooling effect of large-area parks was more obvious. Additionally, Sun et al. [13] analyzed the temporal and spatial distribution of thermal comfort in Yuandadu Site Park in Beijing. The results showed that the thermal comfort of tall trees was the most stable, and hard pavement had a negative impact on thermal comfort. Cohen et al. found that the denser the canopy of the plant community in the park, the stronger were the cooling effects [14]. Moreover, other studies have shown that green space and water bodies have many functions, such as cooling and humidifying and regulating local microclimate, among various urban land uses [15]. The research results of other scholars on the cooling effect of different types of greening are summarized in Table 1. However, analysis and summary on the type, shape, structure, seasonal change, and cooling function of green space were scarce, which limits the guidance available for UGS planning and construction in the future.
In recent years, research on the cooling function of urban green space has always been the focus of many domestic scholars. Many scholars have confirmed the effectiveness of UGS in adjusting thermal environments using field observation, remote sensing technology, and numerical model simulation [36]. Tian et al. [37] investigated the green space dynamics and surface temperature in the metropolitan area of Beijing. Lei et al. [38] comprehensively applied the methods of remote sensing, geographic information system, landscape ecology, and statistical analysis to explore the space–time evolution relationship between Haikou’s urban thermal environment and landscape patterns. Apart from that, the influence of green space on the temperature of the surrounding environment was strongly related to the scale of green space, plant type, and other factors [39,40,41]. Liu [42] discussed the correlation between various factors of urban green space and urban surface temperature on the basis of the temporal and spatial evolution characteristics of urban thermal environments. Hu et al. [1] took the built-up area of Yangjiang City as an example to analyze the correlation between the average surface temperature and the green landscape. Wang [43] proposed a green space pattern optimization strategy to alleviate the heat island effect under the condition of tight land use in urban central areas. Although previous studies have studied the improvement measures of the heat island effect, in-depth research on the optimization method of urban green space layout on tropical islands were not conducted. At the same time, the model of the relationship between urban greening and the heat island effect has not been deeply studied and explained, and is therefore also one of the focuses of this study.
Under the current situation of tight urban land use, it is not realistic to further increase the green space area. Adjusting the existing green space layout and optimizing the green space structure make ecological benefits possible. While building a comfortable and pleasant outdoor environment, a suitable thermal environment should be created using radiation, transmission, organization of natural ventilation and other strategies, so as to improve the cooling capacity of the green space, which is also one of the effective ways to ameliorate the deterioration of the urban thermal environment at present [44]. Furthermore, the heat island effect mechanism and mitigation measures of coastal cities, tropical cities, island cities, and other cities with complex topography and landform need further research [45,46,47,48,49]. Tropical cities mainly comprise those cities located in the Tropic of Cancer and the Tropic of Capricorn. Their solar radiation intensity is higher than that of other regions. High-intensity direct solar radiation leads to a strong exchange of momentum, heat, and water vapor in the urban canopy atmosphere. The atmospheric movement of coastal cities will be affected by the interaction of heat island circulation and perennial sea land wind circulation [50,51,52]. The heat island intensity of tropical cities is greatly affected by long wave radiation and monsoon patterns [53]. For “island cities”, the influence of the monsoon on the heat island effect cannot be ignored [54]. Therefore, it is very important to reasonably plan the layout of UGS in tropical island cities.
In this study, a certain area of Sanya City—a typical tropical island city in China—was taken as the research object, and a long-term experimental study was carried out. An innovative cooling model of urban green space was proposed. With the goal of minimizing the intensity of urban heat island effect, an optimization method of green space planning and layout under the constraint of the total amount of centralized green space was developed. It realizes the effective prediction of the mitigation effect of green space on the heat island effect, and provides accurate methods and reasonable ideas for the optimal planning and layout of urban green space on tropical islands.

2. Materials and Methods
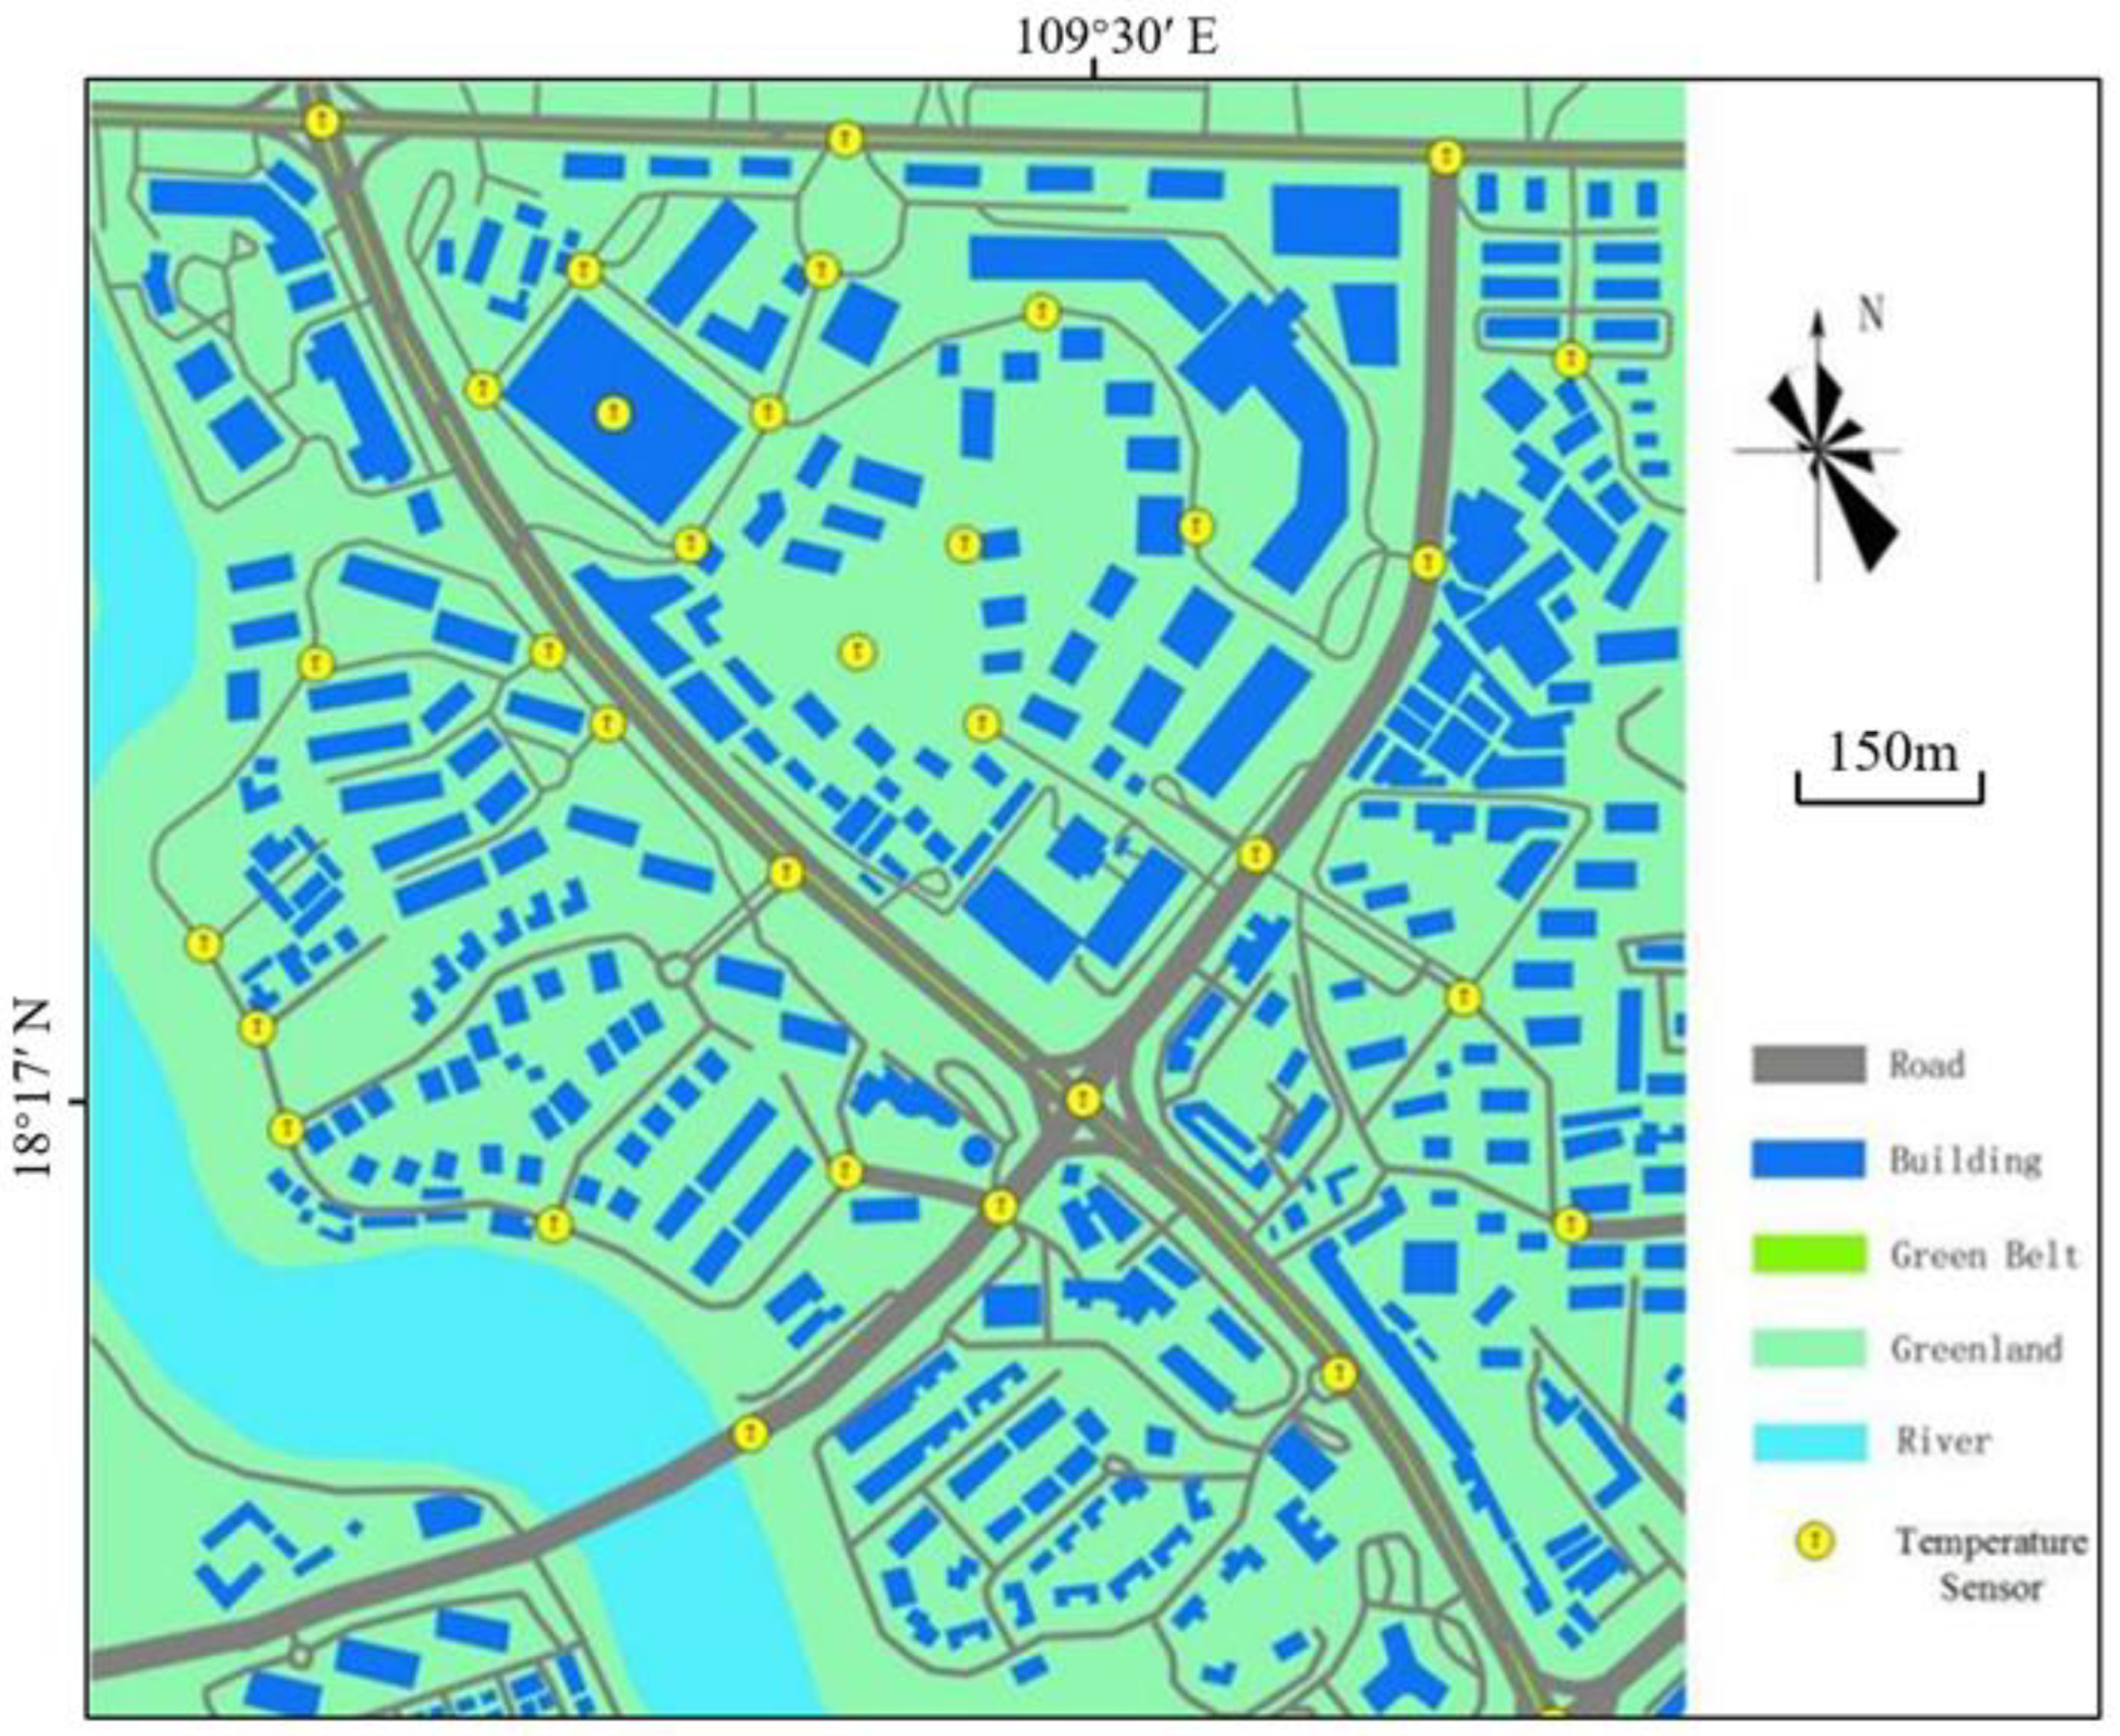
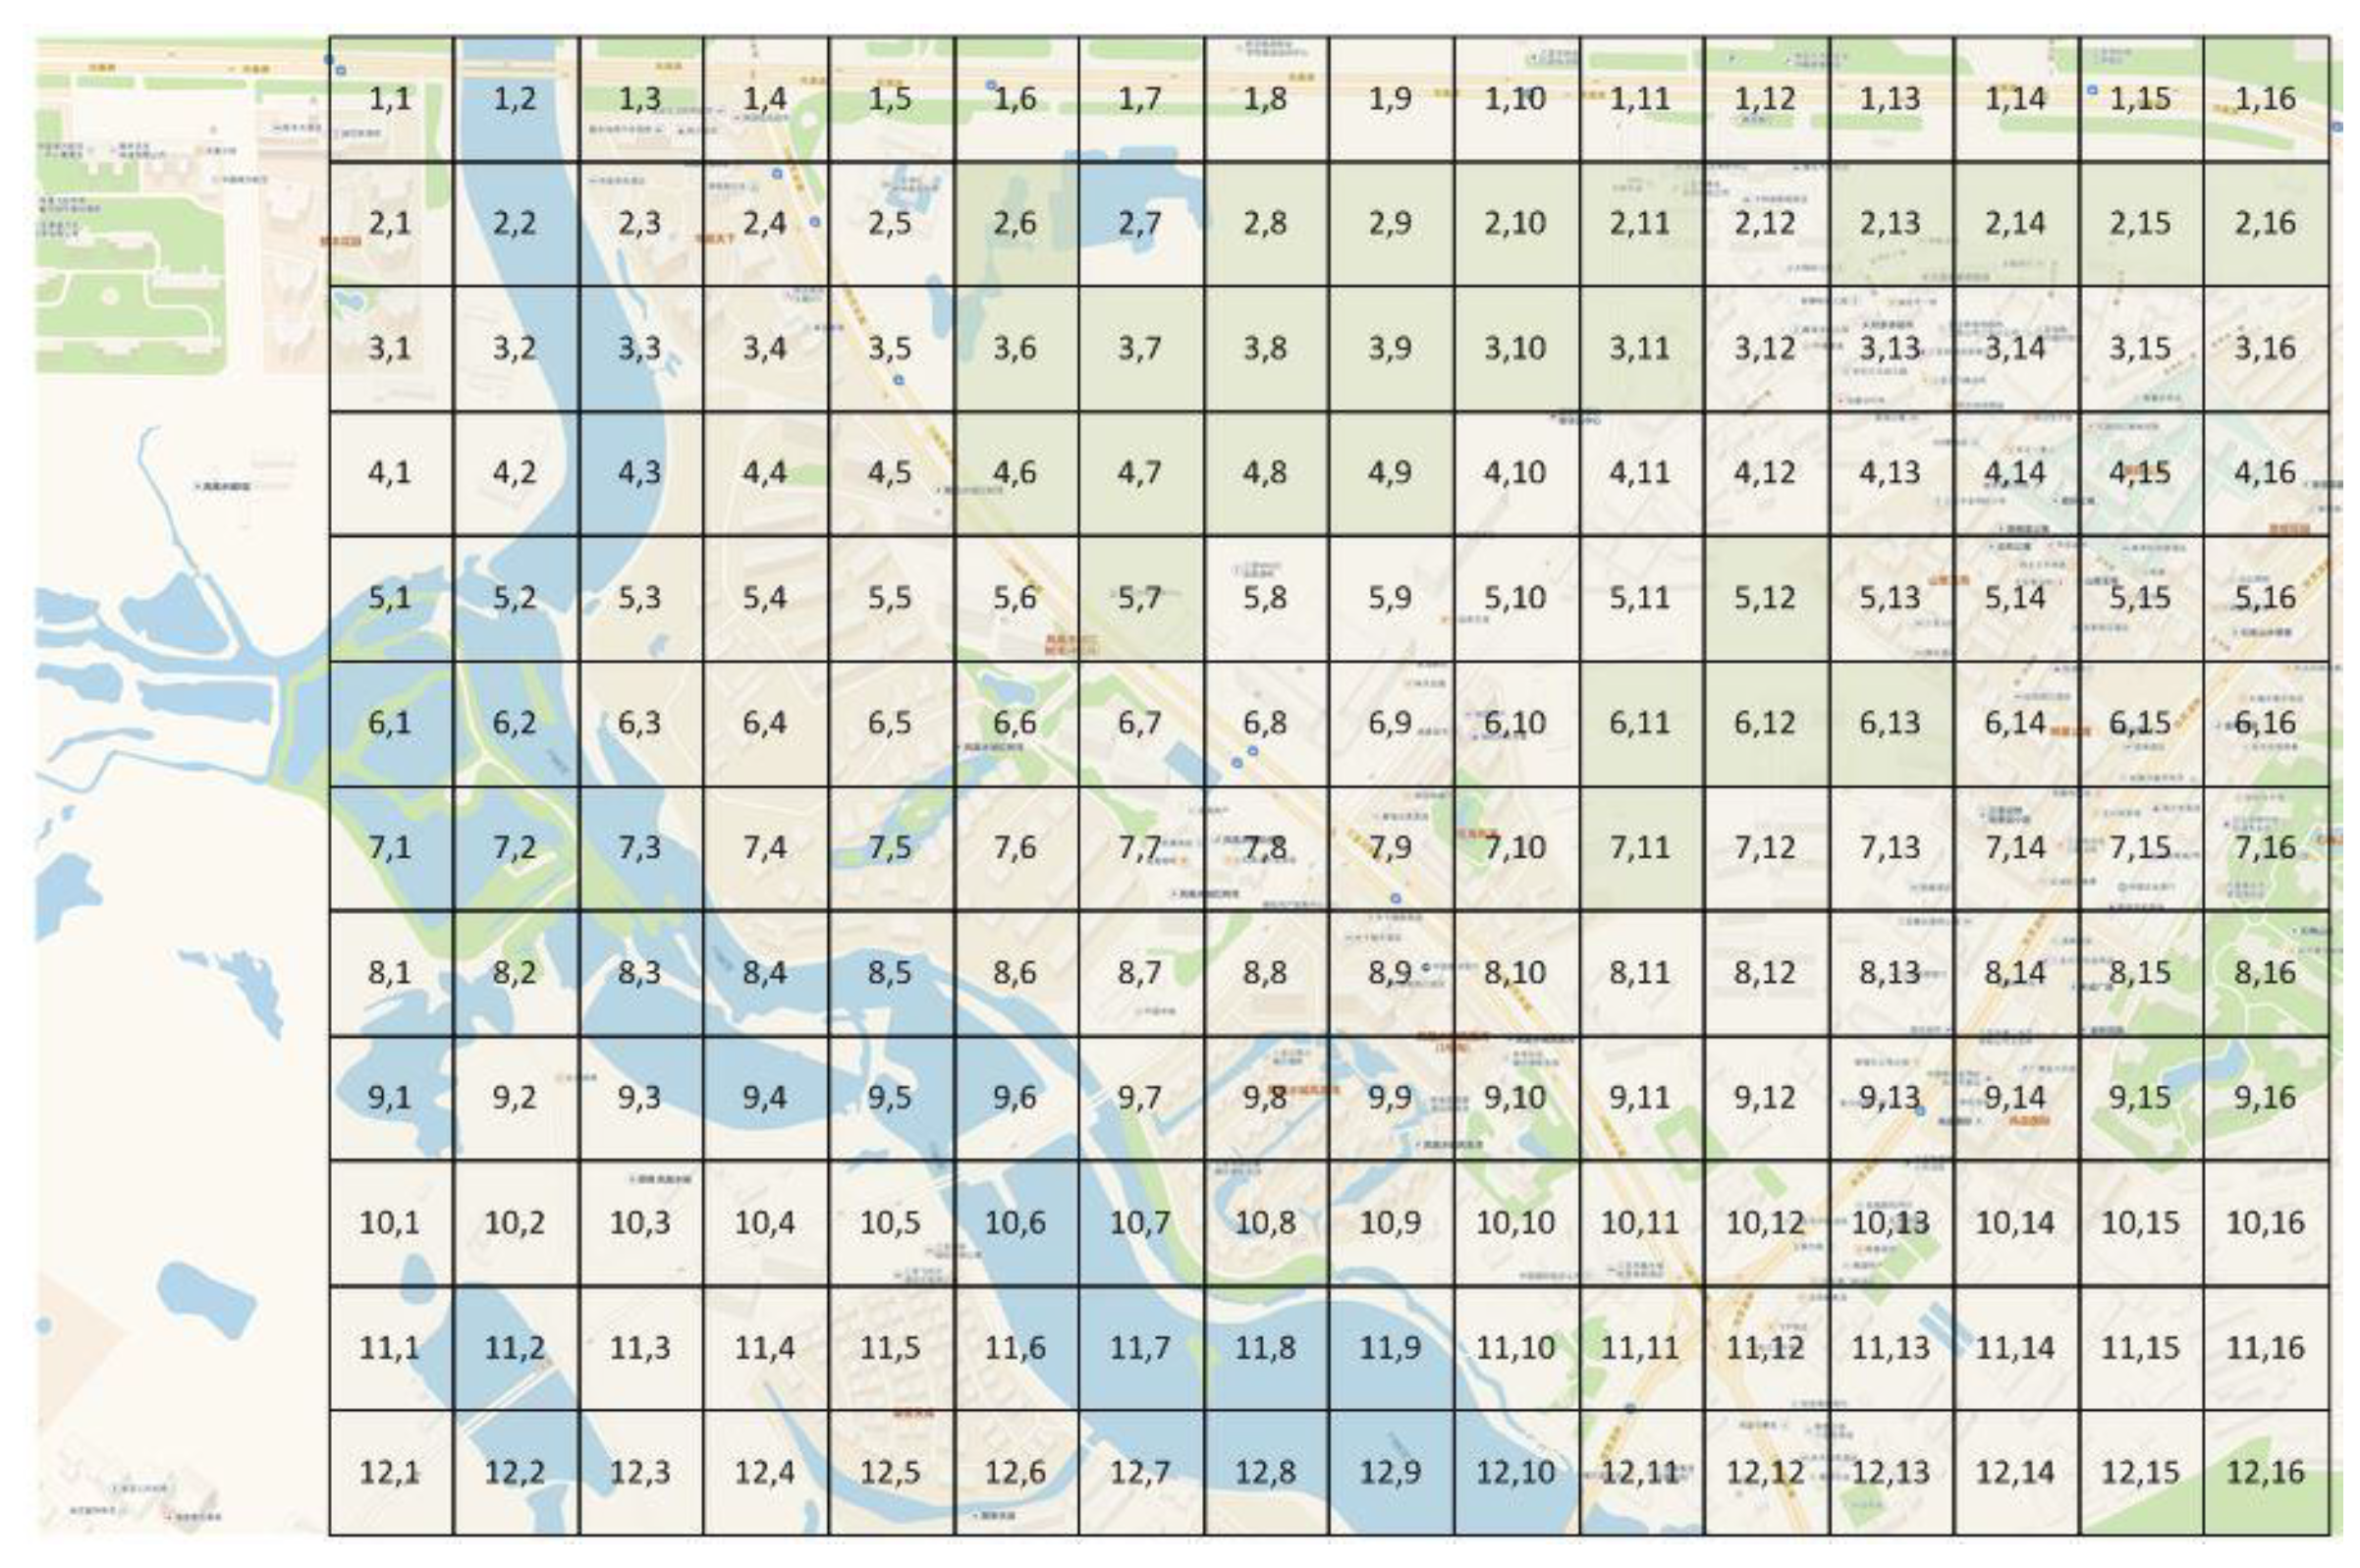
In this study, a green space cooling model and an optimization layout method of urban green space was put forward, as shown in Figure 1. The relationship between the green space cooling model and the green layout scheme was established, and the impact of the green layout scheme on the urban heat island effects was obtained through the urban canopy model [55]. The boundary conditions of street valleys were obtained from experiments.

2.1. Study Area

In this study, Sanya, a tropical island city, was selected to measure the air temperature and main parameters related to the heat island effect in urban and suburban areas. The optimization effect of UGS optimization layout model on heat island intensity was further verified. In the urban area, a typical urban central building community with the characteristics of main streets, residential buildings, commercial buildings, and public places was selected: Hongshuwan, Phoenix water city. Sanya Bay is 2 km to the southwest of this block. In the west, it is adjacent to a major urban inland river that passes through the urban area. In the east, it is 1.5 km away from Sanya East Bank Wetland Park, and in the southeast, it is 1.0 km away from Jinjiling Park. There are three main streets in the block, namely Shuicheng Road, Fenghuang West Road, and Sanya Hedong Road, which are triangular in the selected area. The reason for choosing this area is that there are a large number of buildings along the street in the block of this area, which has the typical geomorphic characteristics of Sanya. The field measurements in the suburbs were carried out around Tongxin Homeland Phase 11 in the northern suburbs and Jinjiling Park in the eastern suburbs.

2.2. Experimental Design

A total of 32 measuring points were arranged in the urban area, 12 of which were concentrated green space measuring points. The positions of all measuring points in the urban area are shown in Figure 2. One measuring point was arranged in each of the north and east suburbs. The experiment continuously monitored the air temperature and humidity, wind speed and direction, and total solar radiation of each measuring point.
To ensure the test requirements and objectives of the heat island effects experiment, the accuracy of the equipment was verified by a third party. The details of the experimental equipment are shown in Table 2.
The collection time interval of temperature, humidity, and wind speed data was 10 min. After the instrument was installed, it was measured continuously for 24 h. The experimental time in summer was from 17 July 2016 to 6 August 2016, a total of 21 days. The experimental time in winter was from 1 January 2017 to 18 January 2017, a total of 18 days. During this period, the climate of Sanya was generally sunny and cloudless.

2.3. Green Space Cooling Model

In order to facilitate the description of the layout of green space, the study area was simplified according to the geographical plan, and only the locations of green space, water bodies, and streets were marked. The locations of buildings, roads, and other places where green space could not be laid were marked with beige, the locations where green space could be laid were marked with light green, and rivers were marked with light blue.
In order to effectively describe the location of the green space, the study area was divided into grids, and the grids were numbered from top to bottom and from left to right; that is, the grids in the upper left corner were numbered as (1, 1), and so on. The optimal spatial resolution in the urban canopy model [55] proposed was less than 100 m, and a 50 × 50 m2 square grid was used for the grid division in this paper. The study area was divided into 256 grids, excluding rivers, existing buildings, roads, and other places where green space could not be paved, and there were 25 grids employed to choose whether to pave green space, as shown in Figure 2. These 25 grids are marked with light green in Figure 3.
In this paper, the cooling effects of green space on the air is called the green space cooling index (GSCI), and the unit of measurement is °C. According to reference [57], green space temperature is only related to plant coverage (that is, plant coverage and green space cooling index), and the green space cooling index of each grid green space can be considered to conform to the normal distribution law, as shown in Equation (1) [57].
f ( ϕ ) = 1 2 π σ e ( ϕ u ) 2 2 σ 2
where ϕ represents the parameter describing the GSLI, and its value is between 0 and 1. The GSCI of the soil surface completely without plant cover is defined as 0, which is the lowest value.
Based on the grid division, the GSCI proposed in this study mainly included two temperatures: (1) air temperature of grid green space; (2) air temperature around grid green space. The calculation method was as follows:
(1)
Air temperature of grid green space
The air temperature of the grid green space was almost independent of the shape of the green space. The air-cooling effect of the grid green space was mainly affected by solar radiation, air temperature, humidity, plant coverage area, and green space cooling index [57]. The air temperature of the grid green space was calculated by the following Equation (2) [57]:
T a , g l = T a , s o i l + Θ ( S M I , T , R H ) f ( φ , γ ) A
where T a , g l denotes the air temperature inside green space; T a , s o i l denotes the air temperature of ground surface without plant cover ( γ = 0) under the same area and shape; Θ ( S M I , T , R H ) is the correction factor for the influence of solar radiation (SMI), air temperature (T), and humidity (RH) on the cooling effect of green space; f ( φ , γ ) is the function of cooling effects of green space produced by plant coverage; φ denotes proportion of plant coverage area; γ denotes the cooling index of green space; A denotes the green area.
Θ ( S M I , T , R H ) can be expressed by polynomial, as shown in Equation (3) [57]:
Θ ( φ S M I , T a , R H ) = ( [ b 2 ( φ S M I ) 2 + b 1 φ S M I + b 0 ] ) + ( c 1 T a + c 0 ) + ( d 1 R H a + d 0 )
where c , b 1 , b 0 , c 1 , c 0 , d 1 , and d 0 are the regression coefficients.
f ( φ , γ ) can be regressed to polynomial, as shown in Equation (4) [57]:
f ( φ , γ ) = ( a 1 φ + a 0 ) γ
where a 1 and a 0 are the modification of the shape of the covered plant area on the green space.
(2)
Air temperature around grid green space
In this study, the convection transfer process related to air flow was mainly considered to calculate the ambient air temperature. The flow process can be described in a steady state on a two-dimensional plane by the law of conservation of mass and momentum. The temperature of the lattice at the boundary was obtained through experimental tests, and the air temperature distribution in the whole region can be obtained by using the finite volume method (FVM) for numerical calculation.

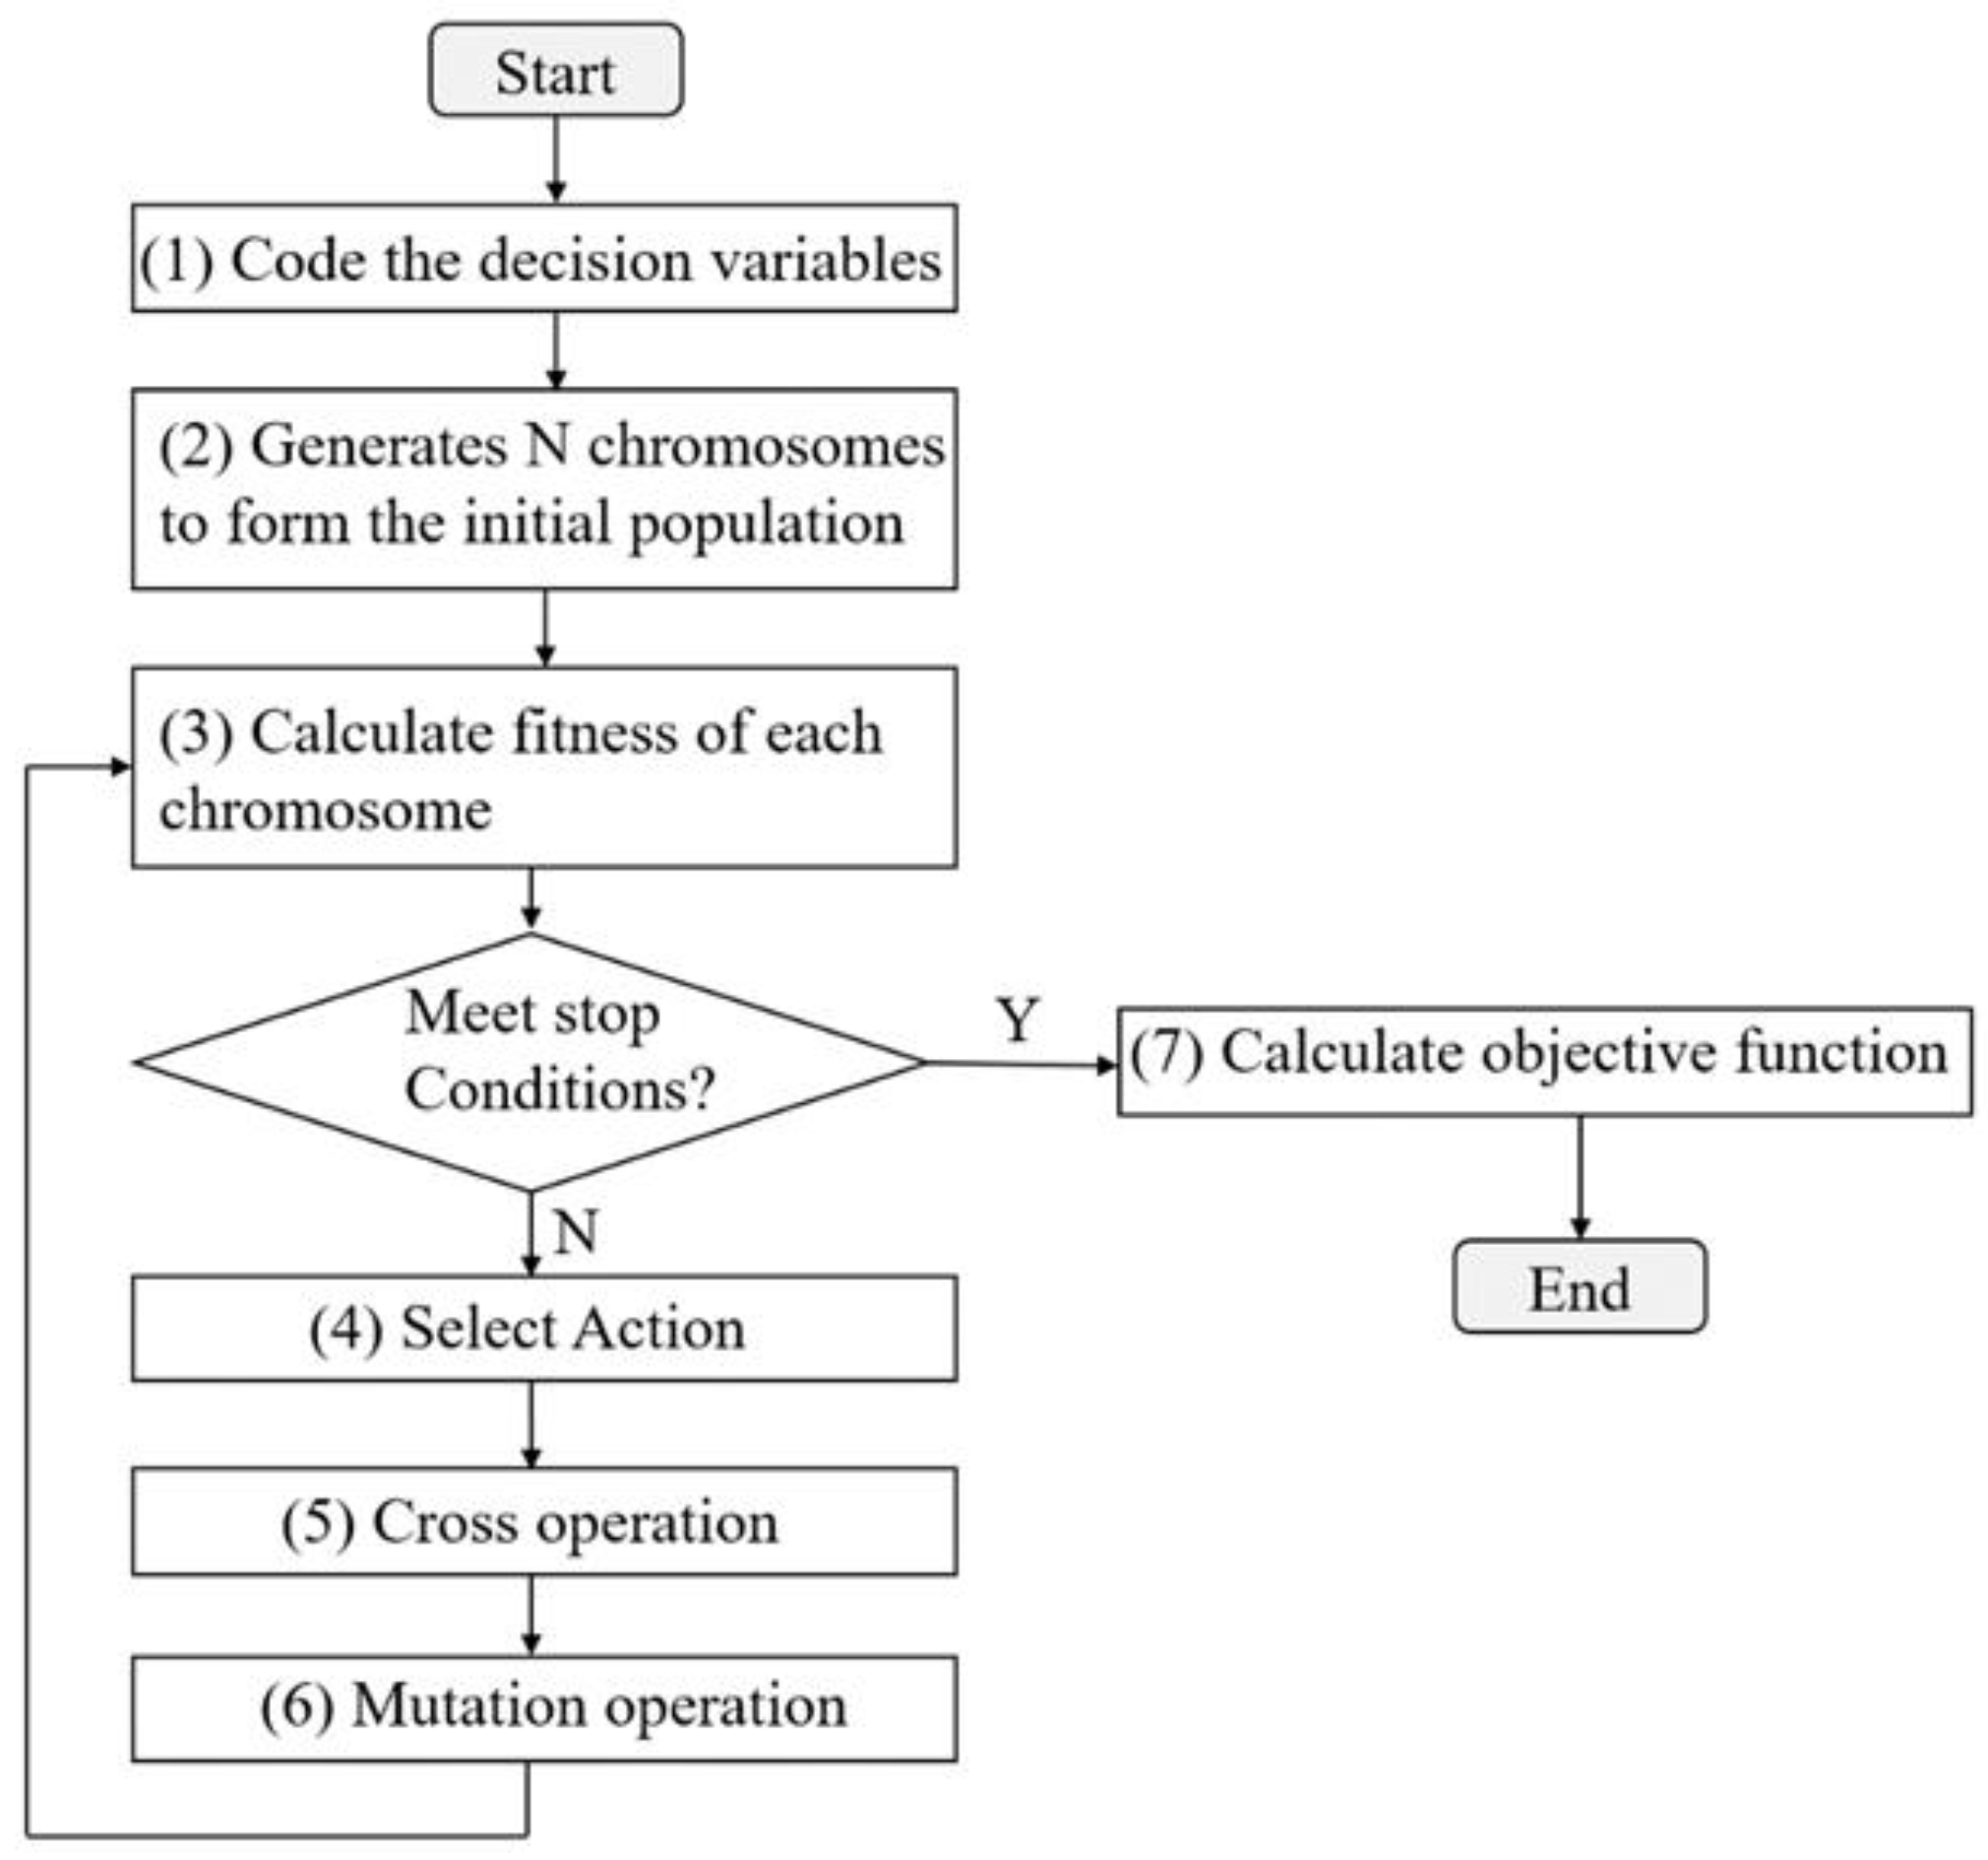
2.4. Objective Function

This paper was committed to finding the optimal layout of green space based on the total green space constraints to ensure the minimum intensity of urban heat island. Therefore, the objective function value of the optimization model was the comprehensive urban heat island intensity. Since the transpiration of plants and the blocking effect of sunlight were obviously strong in the daytime, the average value of the heat island intensity between 5 a.m. and 7 p.m. was used as the comprehensive heat island intensity ( I U H I ), as shown in Equation (5):
I U H I = 1 15 t = 5 19 Δ T U H I , t
where Δ T U H I , t denotes the intensity of urban heat island in each period, which is calculated by tropical islands urban canopy model [55].
This paper used a genetic algorithm (GA) to solve the objective function. The GA process is shown in Figure 4, and the steps are as follows:
Step 1: Code the decision variables, as shown in Equation (7). The decision variable is whether to arrange green space in the grid (i, j). The number is expressed in the binary system. The number 1 means to arrange green space, and 0 means to not arrange green space. The number 1 represents the number of grids for green space layout.
Step 2: Obtain multiple chromosomes by selecting either 0 or 1 on the lattice. In this paper, the initial population number of 100 chromosomes is selected, and the green space cooling index is determined by the normal distribution random function for each grid of green space.
Step 3: Calculate the fitness of all chromosomes in the population. The fitness mainly considers the objective function and constraints, as shown in Table 3 [58]. The objective function is shown as Equation (6). Equation (8) in the constraints defines the decision variable as a 0–1 integer variable. Equation (9) constrains the sum of the areas of all green spaces to be less than the area of lattice (i, j). Equation (11) restricts the distribution of the green space cooling index of the green space lattice, which conforms to the normal distribution as shown in Equation (10). Equation (11) restricts the green space cooling index of the green space lattice between regions, and there is no “particularly green” or almost “no plants” green space lattice.
Step 4: Generate new chromosomes by multiple iterations of selection, crossover, and mutation. Two-point crossover and simple mutation was adopted in this paper. The crossover operator used was intermediate recombination. Generally, after about 120–130 iterations, relatively stable results can be obtained.
In this paper, the maximum number of iterations was set as 200, and the optimal scheme was reached when I U H I ≤ 0.1.

3. Case Study

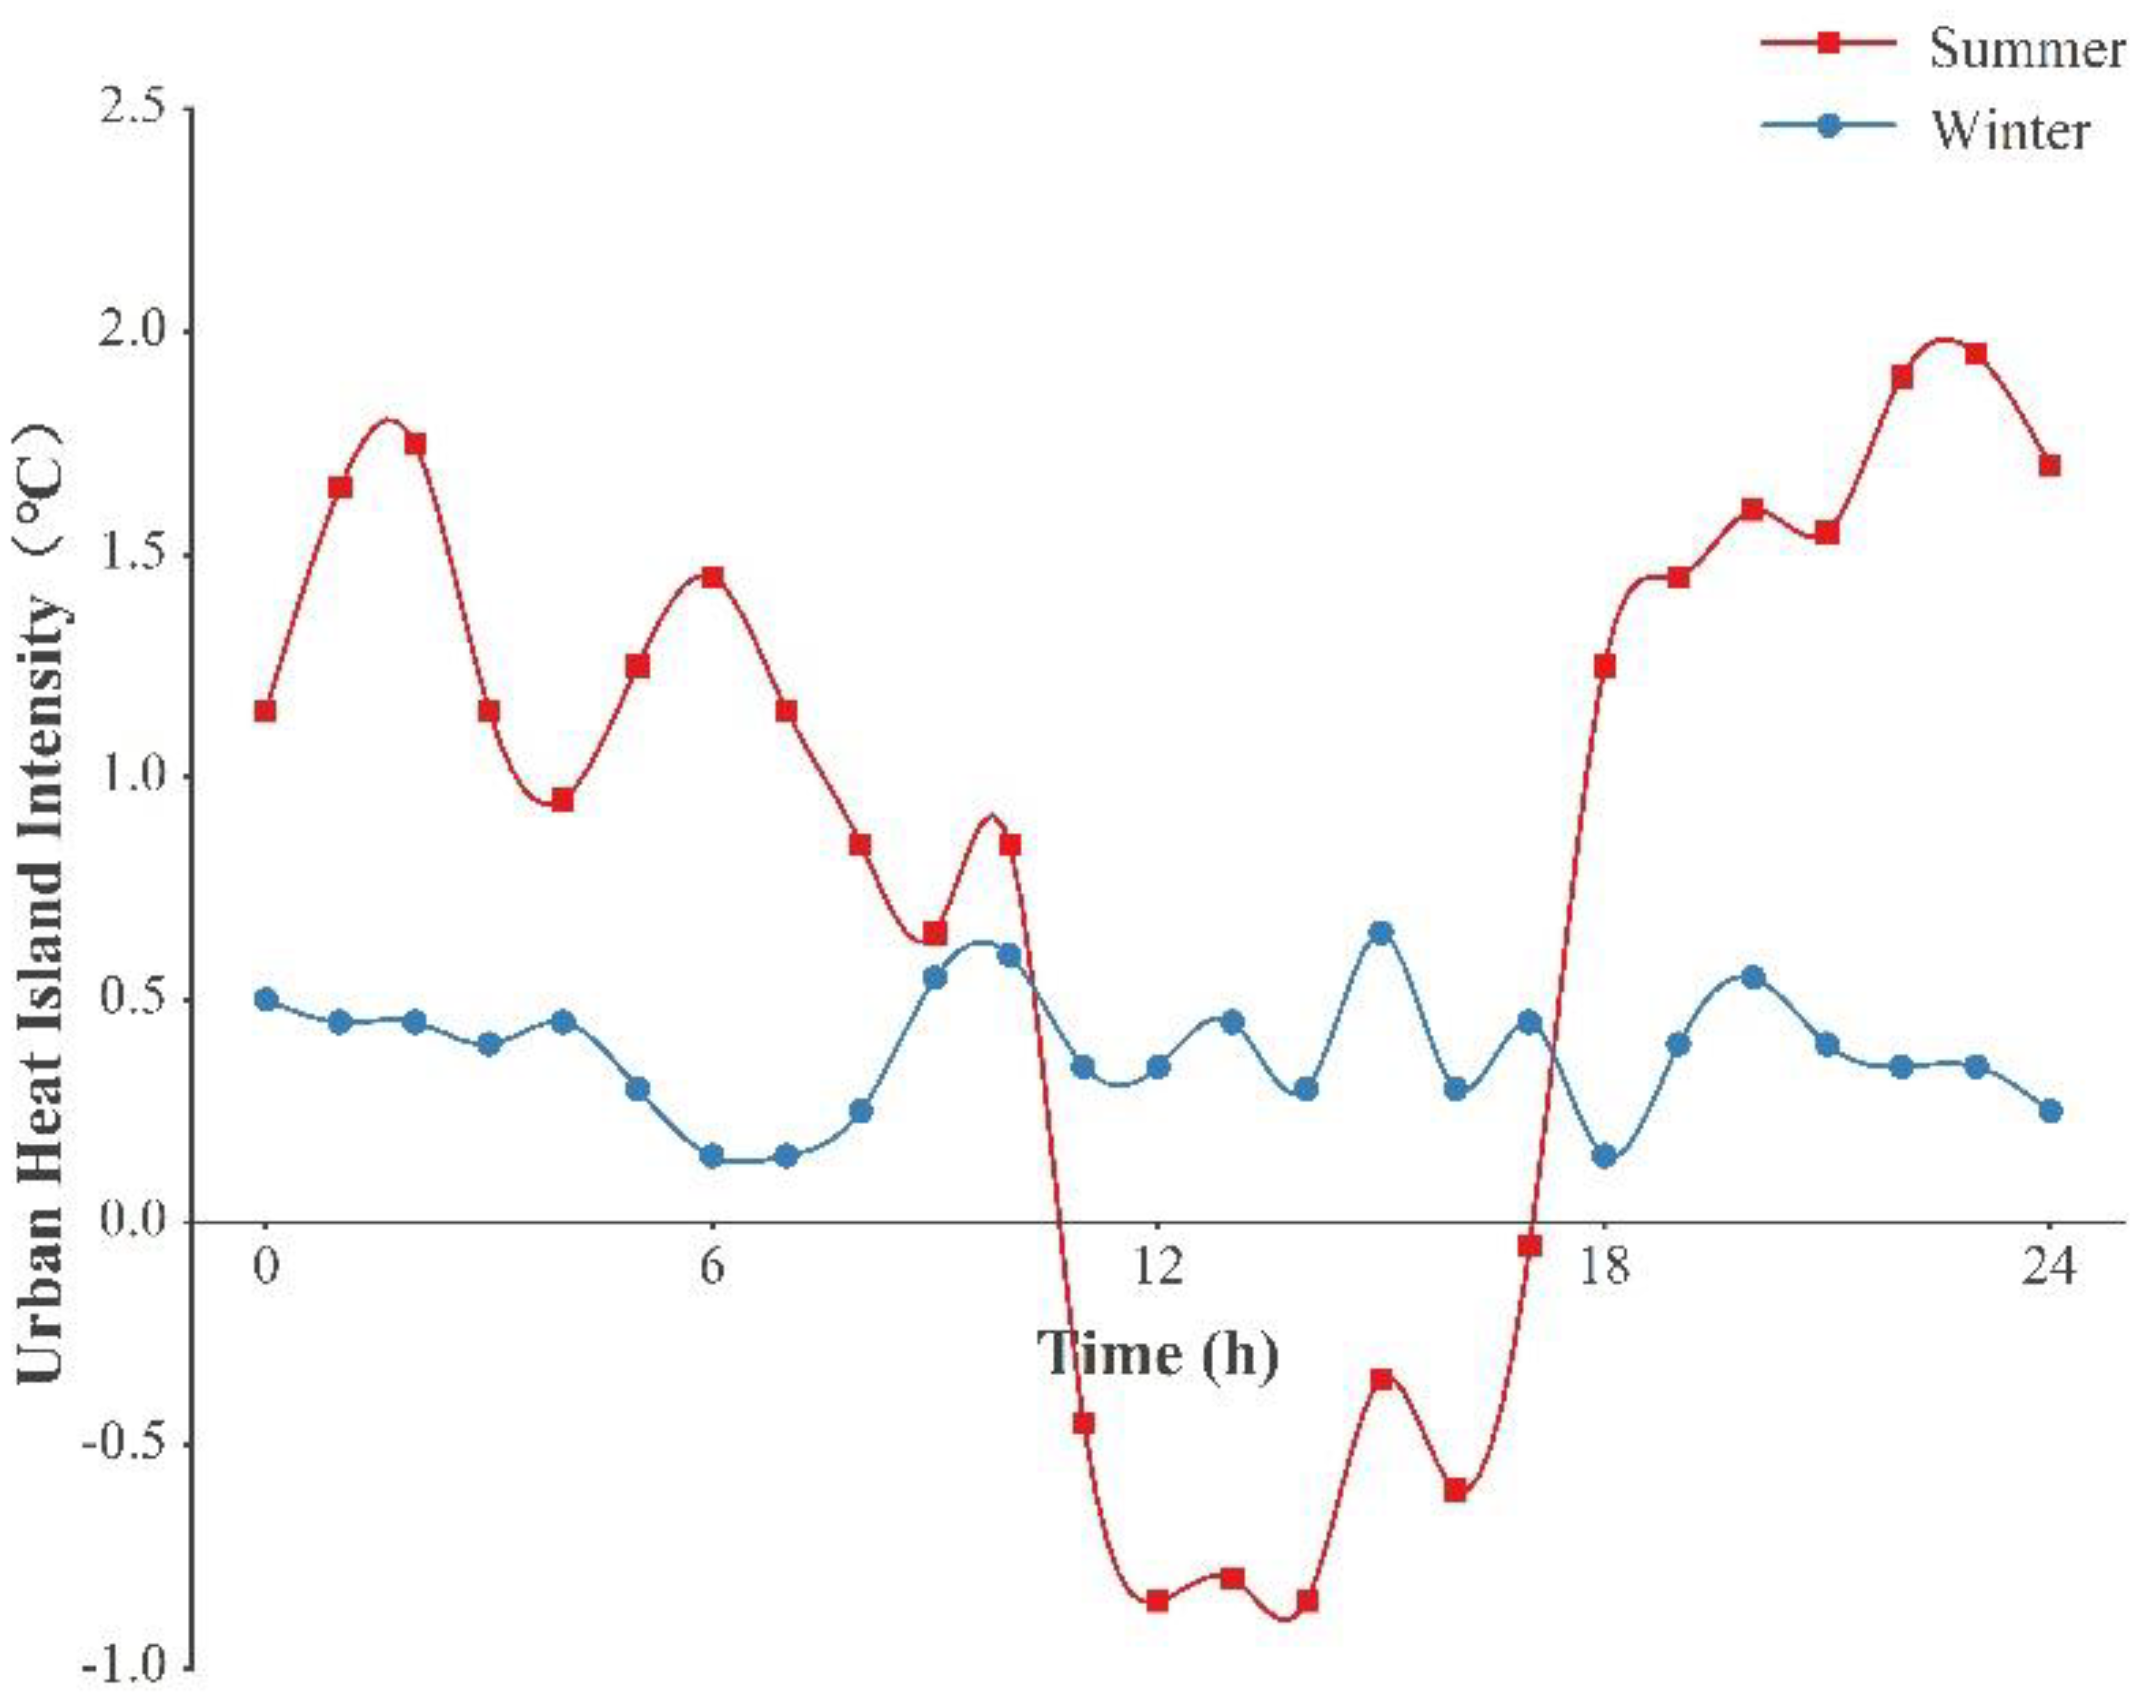
3.1. Experimental Result Analysis

In this paper, the average air temperature of 32 urban measuring points was taken as the urban temperature, the average air temperature of two suburban measuring points was taken as the suburban temperature, 24 July 2016 was taken as the typical summer day, and 14 January 2017 was taken as the typical winter day. The test results are shown in Figure 5.
It can be seen from Figure 5 that the maximum temperature in the urban area was 31.1 °C and the minimum temperature is 26.9 °C on typical days in summer. The maximum temperature in the suburb was 31.5 °C, and the minimum temperature was 25.6 °C. In winter, the maximum temperature in typical urban areas was 28.4 °C, while the minimum temperature was 22.8 °C. The maximum temperature in suburban areas was 27.9 °C, and the minimum temperature was 21.6 °C. It can be seen that in both summer and winter, the range of temperature change in urban areas was narrow, while that in suburban areas was wide.
Moreover, the temperature in the urban area was higher at night, mainly because the buildings in the urban area captured more solar radiation in the daytime and stored it in the buildings to slow down the temperature rise. At night, the buildings released heat and slowed down the temperature drop. In the suburbs, there was a lack of buildings to narrow the air temperature change range. This phenomenon was a very typical urban heat island effect. The heat island intensities in summer and winter are shown in Figure 6.
It can be seen from Figure 6 that the heat island intensity of typical summer days was more significant at night, with the maximum value of 1.95 °C, and that of daytime was 0.85 °C. The temperature in urban areas was lower than that in suburban areas, which is a very typical feature of tropical island cities. On the one hand, near noon, the solar radiation could reach at 1200 W/m2, and the exposed surface temperature in the suburbs rose rapidly, causing the temperature near the surface to rise rapidly. Buildings in the urban area had a shielding effect on the direct sunlight, and the transpiration of plants had a cooling effect. The buildings and roads would absorb a large amount of solar radiation heat, resulting in the air temperature near the surface rising less quickly than in the suburbs. On the other hand, Sanya has distinct monsoon weather. The air circulation between urban and suburban areas was rapid, which was conducive to narrowing the daytime temperature gap between urban and suburban areas.
The heat island intensity on typical days in winter was more significant in the daytime; the maximum temperature difference could reach at 0.65 °C. The heat island intensity at night was lower, with a minimum value of 0.15 °C. The main reason was that the sunshine duration in winter was shorter than that in summer, and the average solar radiation intensity was more than 30% less than that in summer. The heat storage of buildings was not as obvious as that in summer. For island cities, the impact of the winter monsoon was more obvious, and the warmer monsoon slowed down the temperature difference between urban and suburban areas. For the tropical island of Sanya, the intensity of the heat island in winter was not too significant, in contrast with the urban heat island intensity at night in winter that was often observed in northern mainland cities.

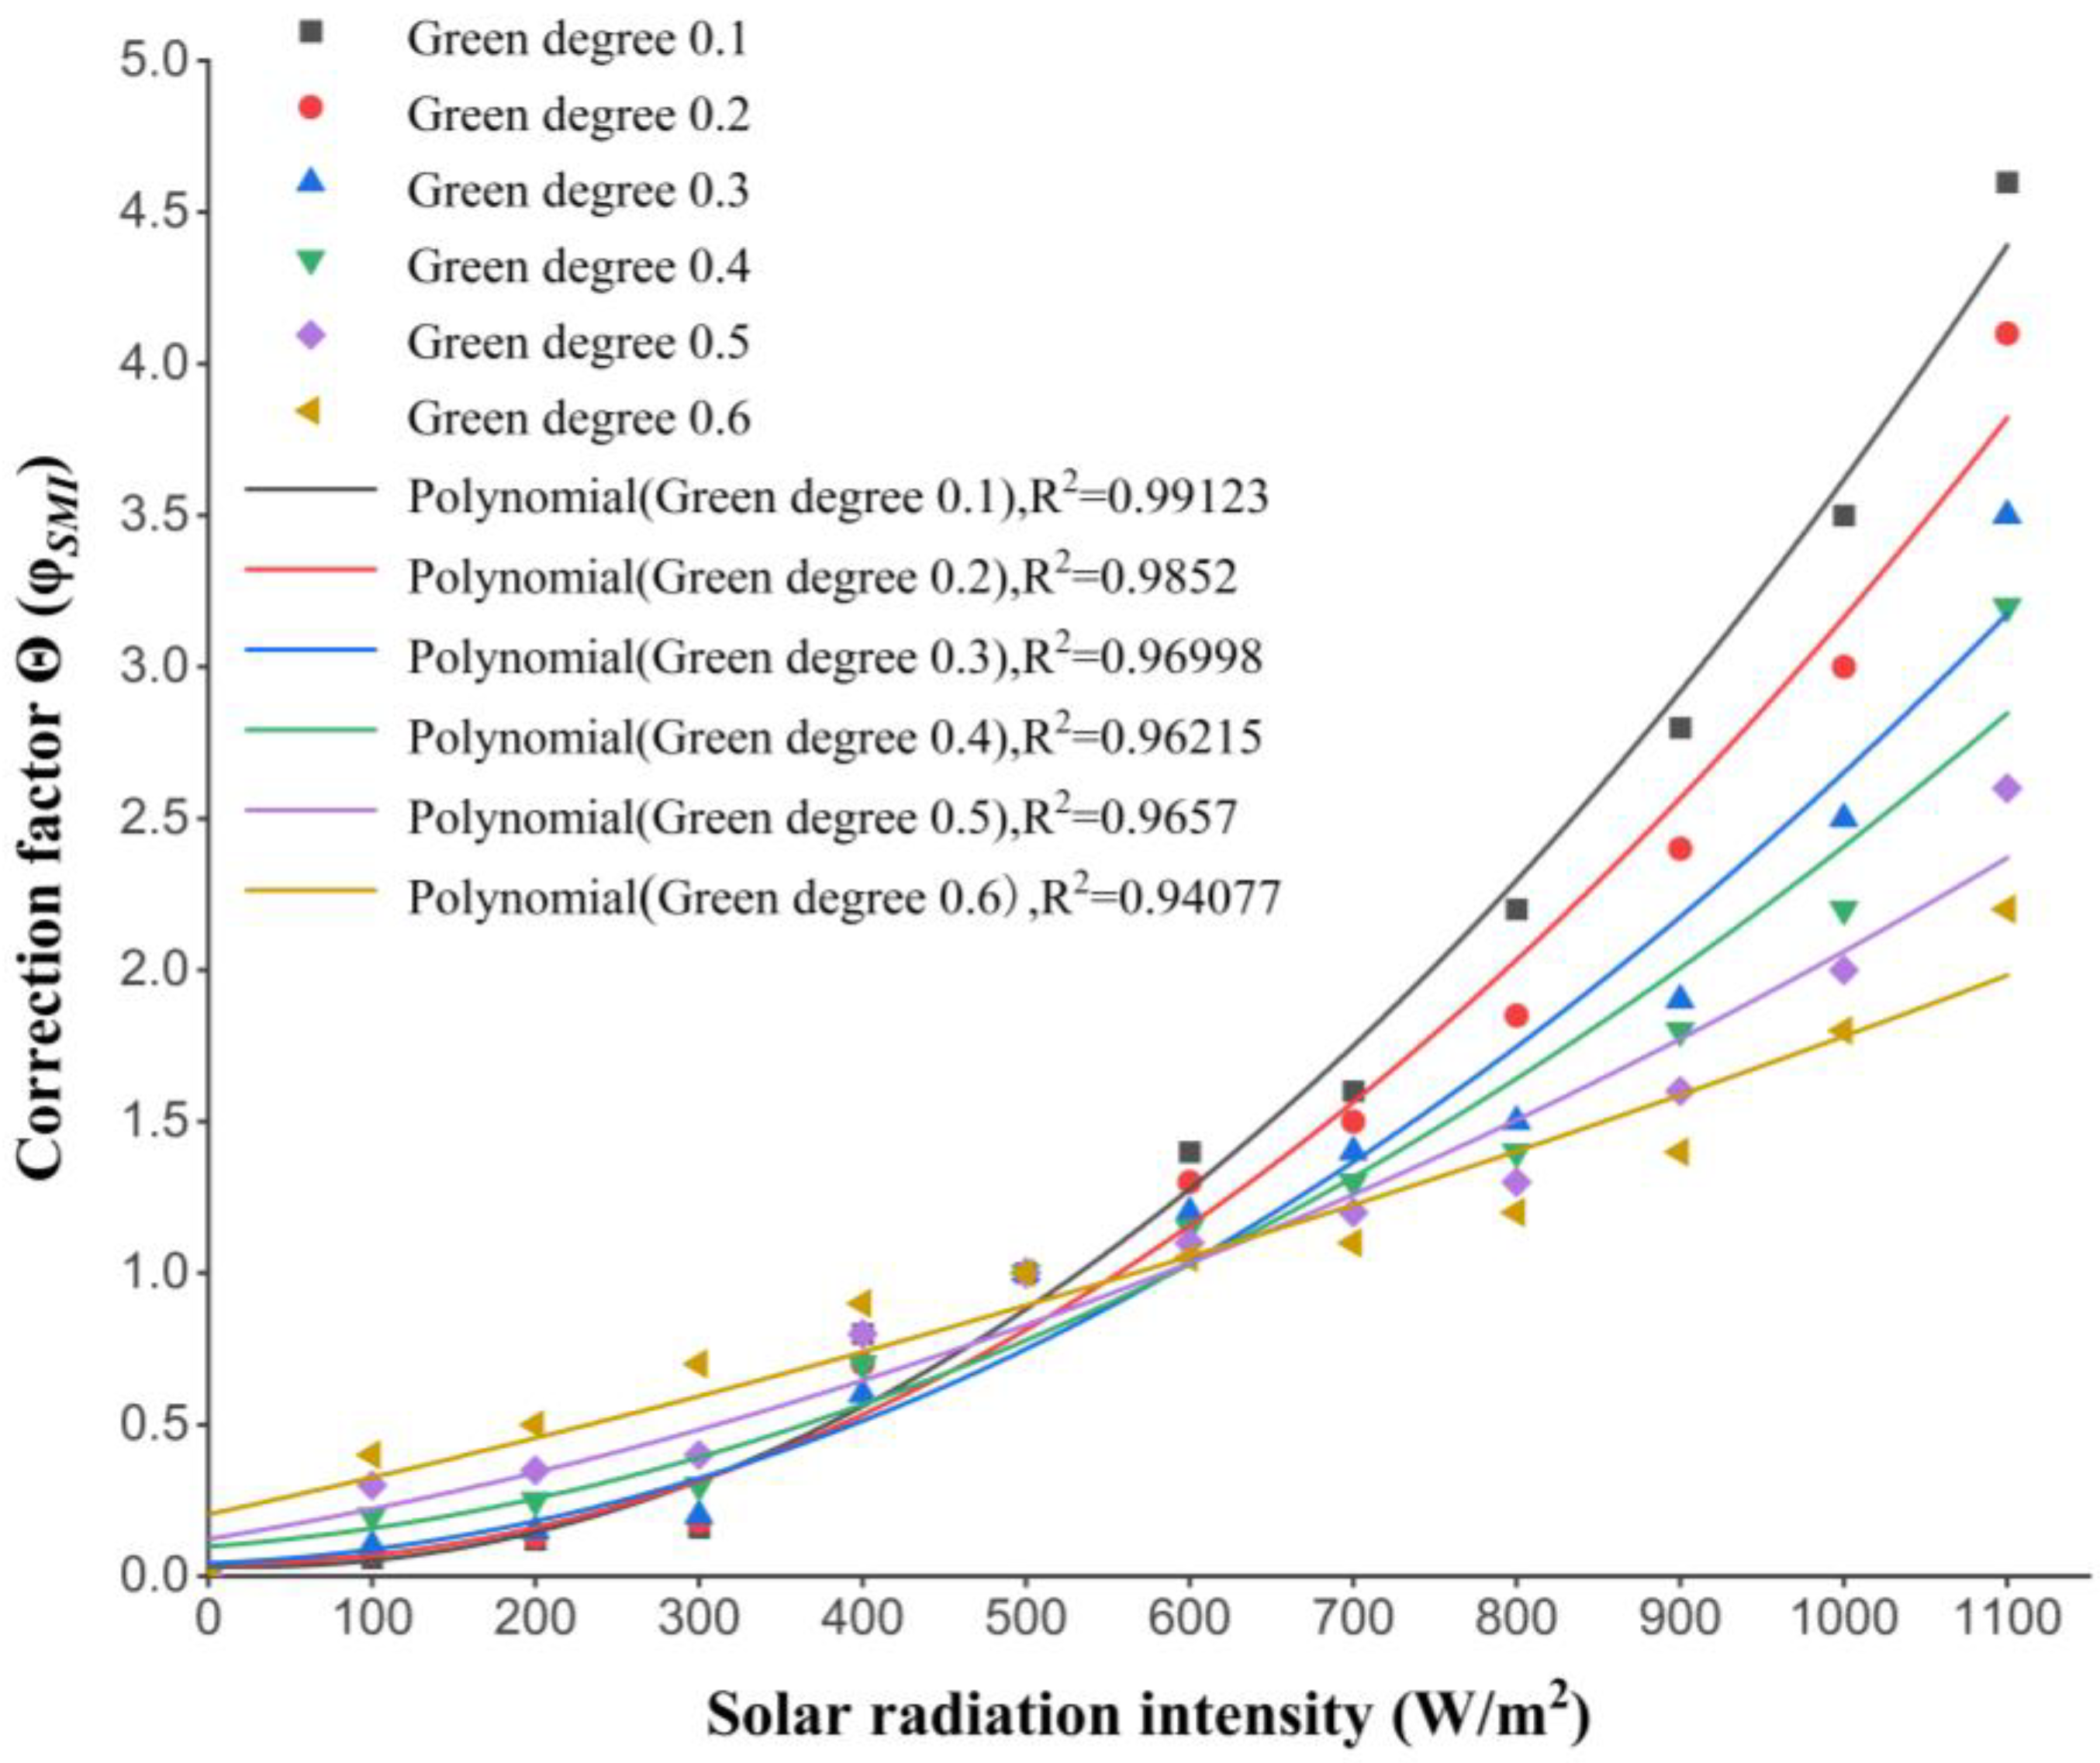
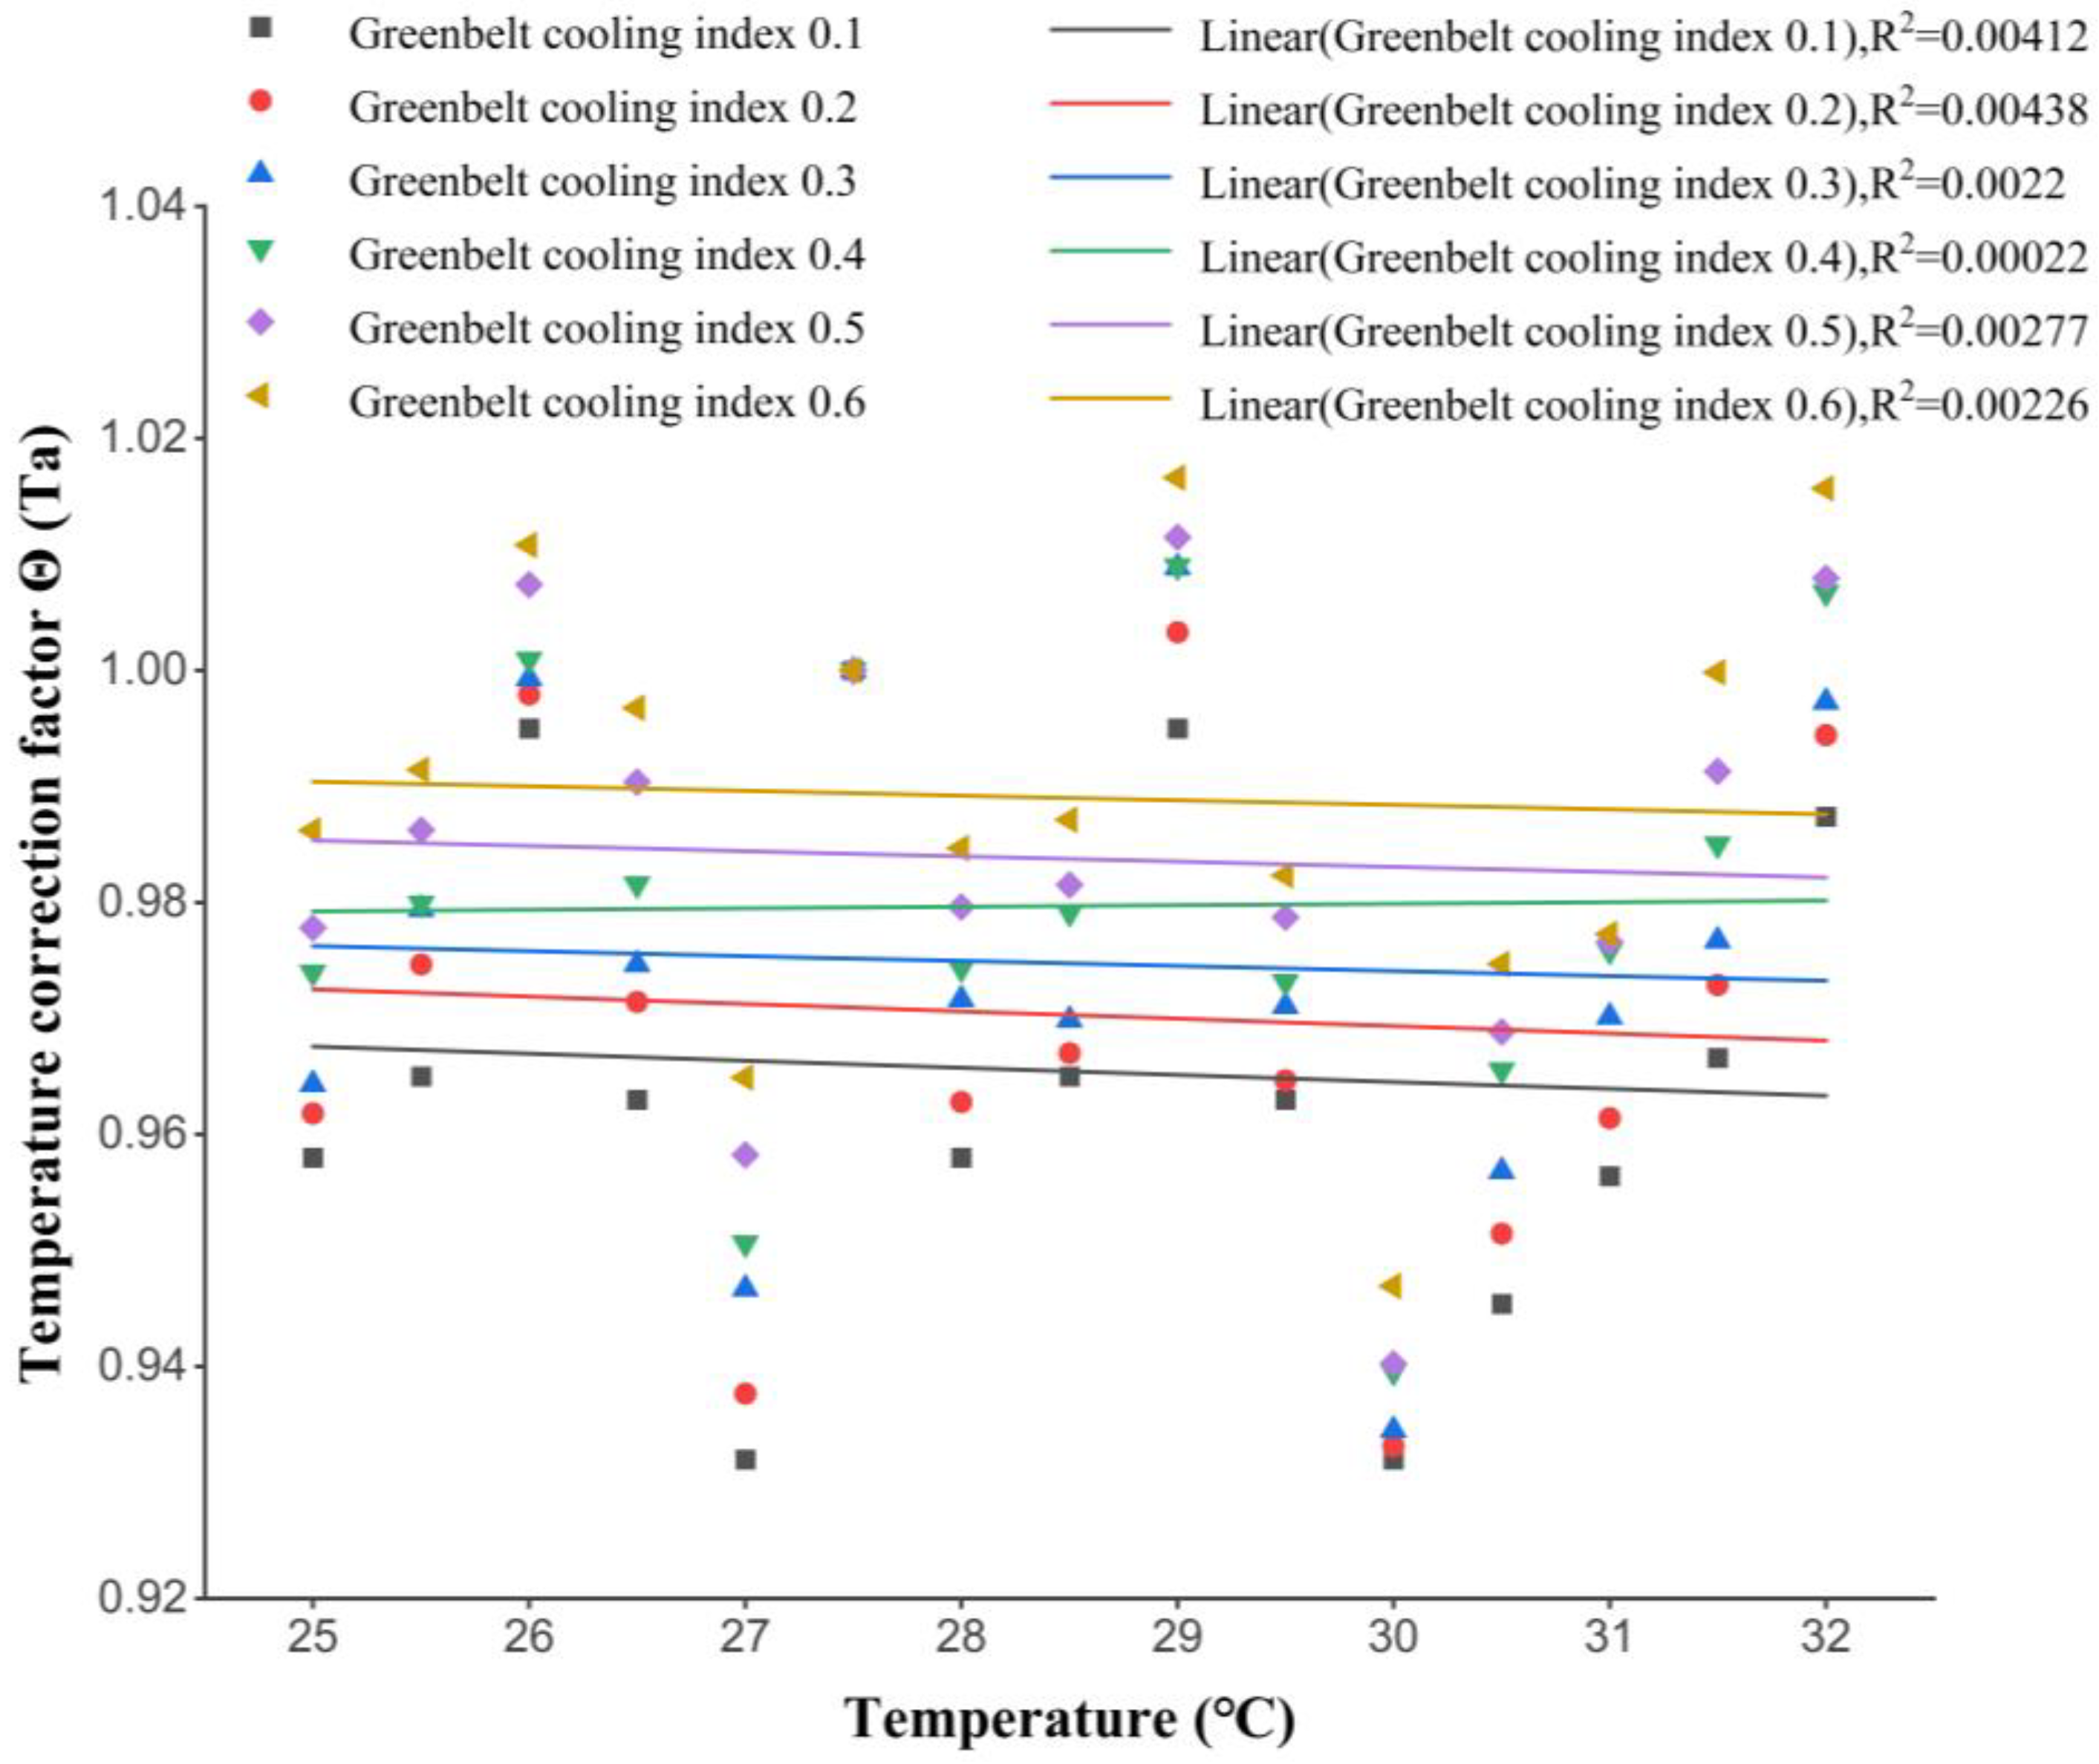
3.2. Establishment of Cooling Model for Green Space

In accordance with the experimental test data, the comprehensive cooling effects of urban centralized green space between 5:00 am and 19:00 pm on a typical summer day are shown in Figure 7. The cooling effect value was the difference between the green space air temperature and the bare ground temperature.
By selecting the value of each sample for 15 h in Figure 7, the average value of the cooling effects of the sample could be obtained. The GSCI in this case conformed to the expected value of normal distribution, μ = 0.356 °C, with no plant cover as μ − 3σ = 0. Thus, σ = 0.119.
The urban green space cooling model was established according to the experimental test data of urban centralized green space [55]. It can be regressed to show the effects of solar radiation intensity, air temperature, and humidity on the cooling effect Θ ( φ S M I , T a , R H ) of green space, as shown in Figure 8, Figure 9 and Figure 10.
It can be seen from the Figure 8, Figure 9 and Figure 10 that the cooling effect of green space was less affected by air temperature and humidity, which can be ignored in the regression polynomial. Therefore, green space with different GSCI can be regressed into a quadratic polynomial under the influence of solar radiation intensity, and Equation (3) can be simplified to Equation (12).
Θ ( φ S M I ) = { 4 × 10 6 ( φ S M I ) 2 0.0002 φ S M I + 0.0331 , γ = 0.1 3 × 10 6 ( φ S M I ) 2 0.0003 φ S M I + 0.045 , γ = 0.2 2 × 10 6 ( φ S M I ) 2 0.0002 φ S M I + 0.0424 , γ = 0.3 2 × 10 6 ( φ S M I ) 2 0.0004 φ S M I + 0.0975 , γ = 0.4 1 × 10 6 ( φ S M I ) 2 0.0009 φ S M I + 0.1227 , γ = 0.5 4 × 10 7 ( φ S M I ) 2 0.0012 φ S M I + 0.2040 , γ = 0.6
where φ S M I is solar radiation intensity.

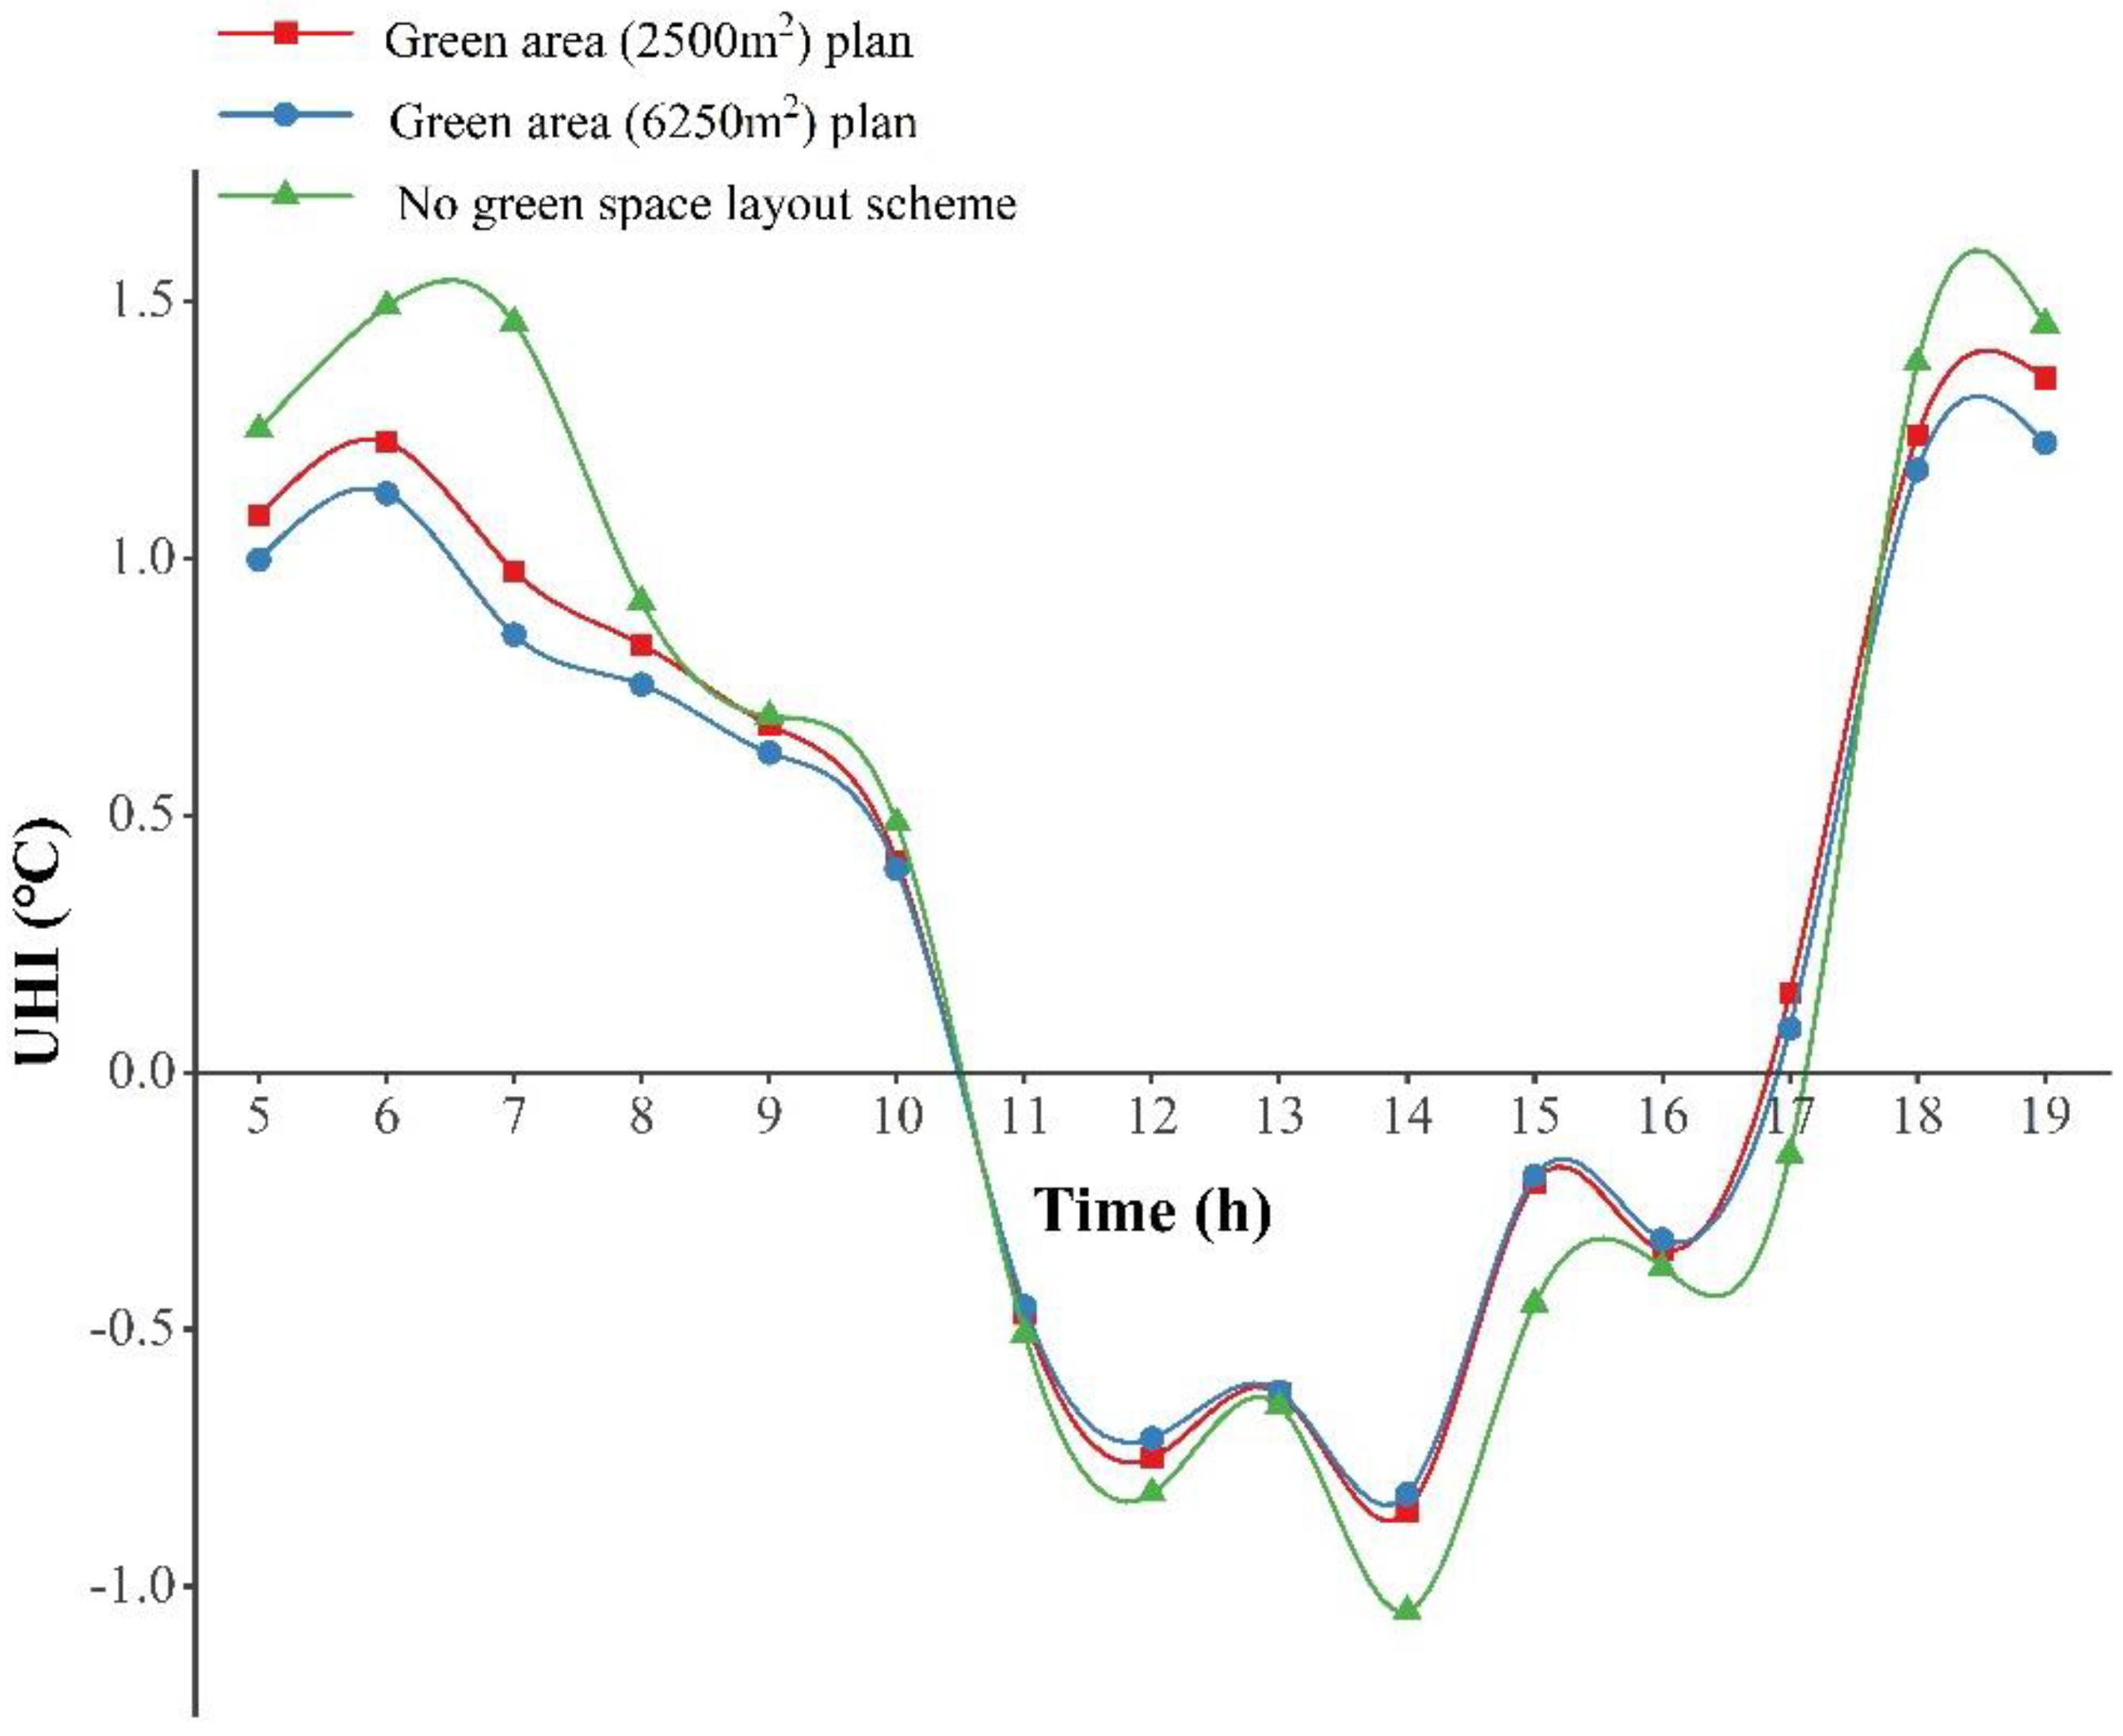
3.3. Analysis of Optimization Results

In this paper, 25 grids without green space were taken as the base case of non-optimization. For the convenience of calculation, 0.025 km2 urban green space was selected in this paper; that is, 10 grids with the best green space were selected from 25 grids. Under the typical daily climate conditions in summer and winter, the optimal layout scheme and the minimum heat island intensity were obtained through repeated iterative calculation of “survival of the fittest”. The optimization results were shown in Table 4.
It can be seen that the heat island intensity before optimization in summer was 0.34 °C. After optimization of green space layout, the intensity decreased to 0.31 °C, with an absolute decrease of 0.03 °C and a relative decrease of 8.8%. In winter, the corresponding heat island intensity decreased from 0.52 °C to 0.49 °C, with an absolute decrease of 0.03 °C and a relative decrease of 5.57%. Therefore, the optimal layout of green space can effectively reduce the urban heat island intensity.
In addition, the difference between the summer and winter green space layout optimization schemes was obvious. Apart from the fact that the grids numbered (2, 6) and (3, 6) were in the optimization scheme, the selected grid numbers were different. Considering that the heat island effects in summer were more sensitive to the impact of human thermal comfort, the optimal layout scheme of green space in summer was taken as the final scheme, and the grid selected for optimization green space layout was represented by green circles, as shown in Figure 11.
Furthermore, the area of green space was increased to 25 grids to compare the mitigation effect of heat island intensity in summer under the two schemes. The GSCI (°C) of 25 grids in the numbered order was randomly set as: 0.32, 0.26, 0.21, 0.32, 0.33, 0.33, 0.33, 0.25, 0.31, 0.33, 0.32, 0.21, 0.33, 0.33, 0.31, 0.33, 0.31, 0.31, 0.33, 0.33, 0.33. Through calculation, the IUHI of the optimized scheme in summer was 0.27 °C, the absolute decrease was 0.07 °C, and the relative decrease was 20.5% when the green space layout was not optimized (IUHI = 0.34 °C).
The distribution curve of urban heat island mitigation effects of the optimal green space layout scheme in summer was shown in Figure 12.
It can be seen that increasing the total area of green space had positive effects on alleviating the urban heat island, and the most significant effect appeared at 7 am in the morning, up to 0.61 °C. Moreover, the larger the green space layout area was, the smaller change of urban heat island intensity was.

4. Discussion

4.1. Planning and Design Method for Mitigating the Heat Island Effect

Urban landscape green space has an obvious mitigation effect on the urban heat island effect. The main mechanism of the mitigation effect of green space is that green space plants absorb solar radiation and release water vapor under transpiration. In this process, the heat lost by green space to the outside of the urban canopy is greater than the solar radiant heat obtained by green space surface. The local air temperature above the green space is lower than the air temperature of the surrounding non-green-space surface [59]. Therefore, the temperature gradient between the green space and the surrounding surface produces small-scale local air circulation, which has a good effect on reducing the ambient temperature. In addition, the crowns of tall trees can also effectively shield the pavement or building walls from direct solar radiation. During the site landscape planning, landscape factors such as greening, waterscapes, and the forms of underlying surfaces have a significant impact on the outdoor thermal environment [60,61].
Increasing humidity is conducive to reducing the intensity of heat islands. When planning the layout of urban areas and buildings, the buildings can be arranged near the sea, river, etc., and the waterscape can be reasonably planned in the construction site [62]. The urban albedo can be improved, and the intensity of the heat island can be alleviated by establishing three-dimensional greening, using light colored roofs and walls, improving the green coverage in the construction site, using permeable pavement for sidewalks, or using highly reflective materials or coatings for sandstone pavement and roofs [63,64,65]. An increase in the wind speed in the canopy is conducive to enhancing the airflow in the urban area, cooling the temperature of the urban area with cold air in the suburbs, and improving the ventilation effect in the block, and can be achieved by raising the overhead building floor and arranging urban ventilation corridors [66]. Furthermore, by shading buildings and strengthening the heat insulation of building envelope, the solar radiation heat gain of buildings can be reduced, and the intensity of the heat island can be reduced [67]. In addition, reducing the height–width ratio of the street valley is conducive to reducing the strength of the heat island. During planning and design, planners can reduce the building height, increase the building spacing, or increase the street width.

4.2. Limitations and Future Study

With the acceleration of urbanization, the urban thermal environment is becoming more and more severe. In the future, the urban thermal environment improvement methods based on urban areas can be studied, and the cooling mechanism research and mathematical models of different types of green plants can be improved. This paper focuses on the key factors of the heat island effect, and its research results can be used as a research basis for improving the outdoor thermal comfort environment. Subsequently, the improvement methods of the urban thermal environment of tropical islands can be further studied from the perspective of human comfort. Research into the cooling mechanisms of different kinds of green plants is very important, but the basic data of this paper cannot support such research [68]. This aspect should be the content of future special research. In addition, when conducting urban green space research, we can focus on other aspects of research while solving the problems of urban green space planning and layout. For example, in dense urban areas, future research can focus on optimizing building performance through multi-zone optimization, and optimizing the number of vertical farms in high-rise buildings to obtain adequate food supply. Moreover, we can further study the GSCI of different plants, and further introduce artificial intelligence algorithms, such as the ant colony algorithm, colony algorithm, artificial bee colony algorithm, frog jumping algorithm, etc. We can also address the complexity of the problem in subsequent research by presenting the deviation, minimum, and maximum of each optimization run of the GA, and optimize the iteration cycle of the algorithm. We can additionally improve the calculation accuracy and speed of optimization algorithms and provide landscape designers with fast and practical urban green space planning methods.

5. Conclusions

In view of the increasingly prominent problem of urban heat island intensity on tropical islands, this study proposed a green space layout optimization method based on the constraint of the total area of urban green space, aiming at urban heat island intensity reduction. This method took into consideration the influence of green space area, plant transpiration, solar radiation intensity, and other factors on the cooling effect. A green space cooling model was established, making it possible to predict the street heat island intensity under the joint action of multiple green spaces. Furthermore, the method can provide the optimal layout scheme for the green space planning of tropical island cities.
In this paper, Sanya was selected as a typical study case, and an experimental study on the urban heat island effect in summer and winter was carried out. The experimental results showed that the urban heat island intensity was more significant at night in summer, with a maximum value of 1.95 °C, while it was less significant in the daytime during summer, which was −0.85 °C at noon. In winter, the urban heat island intensity was more significant in the daytime, with a maximum value of 0.65 °C, while the nighttime heat island intensity was smaller, with the minimum value of 0.15 °C.
This paper optimized the green space layout of the case through a genetic algorithm and obtained the green space optimal layout scheme and the comprehensive heat island intensity under typical summer climate conditions. When 0.025 km2 green space was arranged, the summer comprehensive urban heat island intensity of the optimal layout scheme could be reduced from 0.34 °C to 0.31 °C, with a decrease of 8.8%. When 0.0625 km2 green space was arranged, the summer comprehensive urban heat island of the optimal layout scheme could be reduced from 0.34 °C to 0.27 °C, with a decrease of 20.5%.

Author Contributions

Data curation, H.Z. and Y.L.; funding acquisition, H.Z.; investigation, J.L. and S.Z.; methodology, H.Z. and Q.W.; project administration, Q.W. and N.Z.; resources, H.Z.; validation, Y.P.; writing—original draft, H.Z. and L.Z.; writing—review & editing, Q.W. and N.Z. All authors have read and agreed to the published version of the manuscript.

Funding

This study was supported by the National Natural Science Foundation of China (Project No. 52078475).

Data Availability Statement

The data that support the findings of this study are available from the author upon reasonable request.

Conflicts of Interest

The authors declare no conflict of interest.

References

  1. Hu, G.T.; Wang, G.; Yang, C.J. Analysis of green landscape distribution and thermal environment of Yangjiang City. Remote Sens. Inf. 2017, 6, 157–161. [Google Scholar]
  2. Yue, X.L.; Lin, J.; Yang, Y.C. Mitigation role of urban green space in reducing heat island effect—A case study of central urban area of Baoding City. Landsc. Archit. 2018, 10, 66–70. [Google Scholar]
  3. Aronson, M.; Lepczyk, C.A.; Evans, K.L.; Goddard, M.A.; Lerman, S.B.; MacIvor, J.S.; Nilon, C.H.; Vargo, T. Biodiversity in the city: Key challenges for urban green space management. Front. Ecol. Environ. 2017, 15, 189–196. [Google Scholar] [CrossRef] [Green Version]
  4. Wolch, J.; Byrne, J.; Newell, J. Urban green space, public health, and environmental justice: The challenge of making cities ‘just green enough’. Landsc. Urban Plan. 2014, 125, 234–244. [Google Scholar] [CrossRef] [Green Version]
  5. Su, Y.X.; Huang, G.Q.; Chen, X.Z.; Chen, S.; Li, Z. Research progress in the eco-environmental effects of urban green spaces. Acta Ecologica. Sin. 2011, 31, 7287–7300. [Google Scholar]
  6. Haq, S.M.A. Urban green spaces and an integrative approach to sustainable environment. J. Environ. Prot. 2011, 2, 601–608. [Google Scholar] [CrossRef] [Green Version]
  7. Georgi, J.; Dimitriou, D. The contribution of urban green spaces to the improvement of environment in cities: Case study of Chania, Greece. Build. Environ. 2010, 45, 1401–1414. [Google Scholar] [CrossRef] [Green Version]
  8. Kabisch, N.; Haase, D. Green justice or just green? Provision of urban green spaces in Berlin, Germany. Landsc. Urban Plan. 2014, 122, 129–139. [Google Scholar] [CrossRef]
  9. Aerts, J.; Heuvelink, G. Research Article Using simulated annealing for resource allocation. Int. J. Geogr. Inf. Sci. 2001, 16, 571–587. [Google Scholar] [CrossRef] [Green Version]
  10. Vujcic, M.; Tomicevic-Dubljevic, J.; Zivojinovic, I.; Toskovic, O. Connection between urban green areas and visitors’ physical and mental well-being. Urban For. Urban Green. 2019, 40, 299–307. [Google Scholar] [CrossRef]
  11. Kafy, A.A.; Saha, M.; Faisal, A.A.; Rahaman, Z.A.; Rahman, M.T.; Liu, D.; Fattah, M.A.; Al Rakib, A.; AlDousari, A.E.; Rahaman, S.N.; et al. Predicting the impacts of land use/land cover changes on seasonal urban thermal characteristics using machine learning algorithms. Build. Environ. 2022, 217, 109066. [Google Scholar] [CrossRef]
  12. Bowler, D.E.; Buyung-Ali, L.; Knight, T.M.; Pullin, A.S. Urban greening to cool towns and cities: A systematic review of the empirical evidence. Landsc. Urban Plan. 2010, 97, 147–155. [Google Scholar] [CrossRef]
  13. Sun, S.; Xu, X.; Lao, Z.; Liu, W.; Li, Z.; García, E.H.; He, L.; Zhu, J. Evaluating the impact of urban green space and landscape design parameters on thermal comfort in hot summer by numerical simulation. Build. Environ. 2017, 123, 277–288. [Google Scholar] [CrossRef]
  14. Cohen, P.; Potchter, O.; Matzarakis, A. Daily and seasonal climatic conditions of green urban open spaces in the Mediterranean climate and their impact on human comfort. Build. Environ. 2012, 51, 285–295. [Google Scholar] [CrossRef]
  15. Chow, W.T.L.; Brennan, D.; Brazel, A.J. Urban Heat Island research in Phoenix, Arizona: Theoretical contributions and policy applications. Bull. Am. Meteorol. Soc. 2012, 93, 517–530. [Google Scholar] [CrossRef] [Green Version]
  16. Matthews, T.; Lo, A.; Byrne, J. Reconceptualizing green infrastructure for climate change adaptation: Barriers to adoption and drivers for uptake by spatial planners. Landsc. Urban Plan. 2015, 138, 155–163. [Google Scholar] [CrossRef]
  17. Tzoulas, K.; Korpela, K.; Venn, S.; Yli-Pelkonen, V.; Kaźmierczak, A.; Niemela, J.; James, P. Promoting ecosystem and human health in urban areas using Green Infrastructure: A literature review. Landsc. Urban Plan. 2007, 81, 167–178. [Google Scholar] [CrossRef] [Green Version]
  18. Alexandri, E.; Jones, P. Temperature decreases in an urban canyon due to green walls and green roofs in diverse climates. Build. Environ. 2008, 43, 480–493. [Google Scholar] [CrossRef]
  19. Ghaffarian Hoseini, A.H.; Berardi, U.; GhaffarianHoseini, A.; Nastaran, M. Intelligent facades in low-energy buildings. Br. J. Environ. Clim. Chang. 2012, 4, 437–445. [Google Scholar]
  20. Berardi, U.; GhaffarianHoseini, A.H.; GhaffarianHoseini, A. State-of-the-art analysis of the environmental benefits of green roofs. Appl. Energy 2014, 115, 411–428. [Google Scholar] [CrossRef]
  21. Berardi, U. The outdoor microclimate benefits and energy saving resulting from green roofs retrofits. Energy Build. 2016, 121, 217–229. [Google Scholar] [CrossRef]
  22. Jim, C.Y. Assessing climate-adaptation effect of extensive tropical green roofs in cities. Landsc. Urban Plan. 2015, 138, 54–70. [Google Scholar] [CrossRef]
  23. Jim, C.; Peng, L. Weather effect on thermal and energy performance of an extensive tropical green roof. Urban For. Urban Green. 2012, 11, 73–85. [Google Scholar] [CrossRef]
  24. Wong, N.; Chen, Y.; Sia, A. Investigation of thermal benefits of rooftop garden in the tropical environment. Build. Environ. 2003, 38, 261–270. [Google Scholar] [CrossRef]
  25. Wong, N.; Cheong, D.; Yan, H.; Soh, J.; Ong, C.L.; Sia, A. The effects of rooftop garden on energy consumption of a commercial building in Singapore. Energy Build. 2003, 35, 353–364. [Google Scholar] [CrossRef]
  26. Li, X.X.; Norford, L.K. Evaluation of cool roof and vegetation in mitigating urban heat island in a tropical city, Singapore. Urban Clim. 2016, 16, 59–74. [Google Scholar] [CrossRef]
  27. Wong, N.H.; Yu, C. Study of green areas and urban heat island in a tropical city. Habitat Int. 2005, 29, 547–558. [Google Scholar] [CrossRef]
  28. Wong, N.; Tan, A.; Chen, Y.; Sekar, K.; Tan, P.Y.; Chan, D.; Chiang, K.; Wong, N.C. Thermal evaluation of vertical greenery systems for building walls. Build. Environ. 2010, 45, 663–672. [Google Scholar] [CrossRef]
  29. Charoenkit, S.; Yiemwattana, S. Living walls and their contribution to improved thermal comfort and carbon emission reduction: A review. Build. Environ. 2016, 105, 82–94. [Google Scholar] [CrossRef]
  30. Cheng, C.Y.; Cheung, K.K.; Chu, L.M. Thermal performance of a vegetated cladding system on facade walls. Build. Environ. 2010, 45, 1779–1787. [Google Scholar] [CrossRef]
  31. Wong, N.; Tan, A.; Tan, P.; Wong, N.C. Energy simulation of vertical greenery systems. Energy Build. 2009, 42, 1401–1408. [Google Scholar] [CrossRef]
  32. Ca, V.; Asaeda, T.; Abu, E. Reductions in air conditioning energy caused by a nearby park. Energy Build. 1998, 29, 83–92. [Google Scholar] [CrossRef]
  33. Abreu-Harbich, L.; Labaki, L.; Matzarakis, A. Effect of tree planting design and tree species on human thermal comfort in the tropics. Landsc. Urban Plan. 2015, 138, 99–109. [Google Scholar] [CrossRef]
  34. Chang, C.; Li, M.; Chang, S. A preliminary study on the local cool-island intensity of Taipei city parks. Landsc. Urban Plan. 2007, 80, 386–395. [Google Scholar] [CrossRef]
  35. Wong, N.H.; Jusuf, S.K.; La Win, A.A.; Thu, H.K.; Negara, T.S.; Wu, X. Environmental study of the impact of greenery in an institutional campus in the tropics. Build. Environ. 2007, 42, 2949–2970. [Google Scholar] [CrossRef]
  36. Yang, Y.; Zhou, D.; Gao, W.; Zhang, Z.; Chen, W.; Peng, W. Simulation on the impacts of the street tree pattern on built summer thermal comfort in cold region of China. Sustain. Cities Soc. 2018, 37, 563–580. [Google Scholar] [CrossRef]
  37. Tian, H. Study on the Temporal and Spatial Changes of Urban Green Space and Land Surface Temperature in Main Urban Areas of Beijing; China University of Geosciences: Beijing, China, 2018. [Google Scholar]
  38. Lei, J.R.; Chen, Z.Z.; Wu, T.T. Spatio-temporal evolution and interrelationship between thermal environment and landscape patterns of Haikou City, 1989~2015. China Environ. Sci. 2019, 4, 1734–1743. [Google Scholar]
  39. Tong, H.; Liu, H.Z.; Li, Y.M. Actuality of summer urban heat island and the impact of urban planning wedge shaped greenland to reducing the intensity of urban heat island in Beijing. J. Appl. Meteorol. Sci. 2005, 16, 357–366. [Google Scholar]
  40. Ren, J.; He, J.; Kong, X.; Xu, W.; Kang, Y.; Yu, Z.; Li, X. A field study of CO2 and particulate matter characteristics during the transition season in the subway system in Tianjin, China. Energy Build. 2022, 254, 111620. [Google Scholar] [CrossRef]
  41. Qiu, H. Study on Urban Heat Island Effect and Cooling Effect of Greenland in Beijing; Beijing Forestry University: Beijing, China, 2014. [Google Scholar]
  42. Liu, Y. Research on the Influence Mechanism and Optimization of Urban Green Space Landscape to Its Thermal Environment a Case Study of Taiyuan City; Shanxi Agricultural University: Taiyuan, China, 2017. [Google Scholar]
  43. Wang, L.H. Optimization Strategy Research of the Green Space Pattern in Harbin Urban Central Area in Response to Heat Island Effect; Harbin Institute of Technology: Harbin, China, 2016. [Google Scholar]
  44. Papangelisaaab, G. An urban “green planning” approach utilizing the Weather Research and Forecasting (WRF) modeling system. A case study of Athens, Greece. Landsc. Urban Plan. 2012, 105, 174–183. [Google Scholar] [CrossRef]
  45. Jamei, E.; Rajagopalan, P.; Seyedmahmoudian, M. Review on the impact of urban geometry and pedestrian level greening on outdoor thermal comfort. Renew. Sustain. Energy Rev. 2016, 54, 1002–1017. [Google Scholar] [CrossRef]
  46. Park, C.; Schade, G.W.; Werner, N.D.; Sailor, D.J.; Kim, C.H. Comparative estimates of anthropogenic heat emission in relation to surface energy balance of a subtropical urban neighborhood. Atmos. Environ. 2016, 126, 182–191. [Google Scholar] [CrossRef] [Green Version]
  47. Ferreira, M.J.; de Oliveira, A.P.; Soares, J. Diurnal variation in stored energy flux in São Paulo city, Brazil. Urban Clim. 2013, 5, 36–51. [Google Scholar] [CrossRef]
  48. Ganesan, S.; Lau, S.S.Y. Urban challenges in Hong Kong: Future directions for design. Urban Des. Int. 2000, 5, 3–12. [Google Scholar] [CrossRef]
  49. Giridharan, R.; Ganesan, S.; Lau, S. Nocturnal heat island effect in urban residential developments of Hong Kong. Energy Build. 2005, 9, 964–971. [Google Scholar] [CrossRef]
  50. Jonsson, P. Vegetation as an urban climate control in the subtropical city of Gaborone, Botswana. Int. J. Climatol. 2004, 24, 1307–1322. [Google Scholar] [CrossRef]
  51. Macedo, J. Maringá: A British Garden City in the tropics. Cities 2011, 28, 347–359. [Google Scholar] [CrossRef]
  52. Miller, W.; Crompton, G.; Bell, J. Analysis of cool roof coatings for residential demand side management in tropical Australia. Energies 2015, 8, 5303–5318. [Google Scholar] [CrossRef] [Green Version]
  53. Chakraborty, T.; Sarangi, C. Understanding diurnality and inter-seasonality of a sub-tropical urban heat island. Bound. -Layer Meteorol. 2016, 163, 287–309. [Google Scholar] [CrossRef]
  54. Griffiths, G.M.; Chambers, L.E.; Haylock. Change in mean temperature as a predictor of extreme temperature change in the Asia-Pacific region. Int. J. Climatol. 2005, 25, 1301–1330. [Google Scholar] [CrossRef]
  55. Zhou, H.Z.; Zhu, N.; Wang, Q.Q. Modeling and simulation of the urban heat island effect in a tropical seaside city considering multiple street canyons. Indoor Built Environ. 2021, 30, 1124–1141. [Google Scholar]
  56. Bueno, B.; Norford, L.; Hidalgo, J.; Pigeon, G. The urban weather generator. J. Build. Perform. Simul. 2013, 6, 269–281. [Google Scholar] [CrossRef]
  57. Jia, L. Research on the Spatial Characteristics of the Urban Green Space’s Function of Mitigating Urban Heat Island; Southwest Jiaotong University: Chengdu, China, 2009. [Google Scholar]
  58. Lu, L.; Cai, W.; Chai, Y.S.; Xie, L. Global optimization for overall HVAC systems—Part I problem formulation and analysis. Energy Convers. Manag. 2005, 46, 999–1014. [Google Scholar] [CrossRef]
  59. Morakinyo, T.E.; Kong, L.; Lau, K.; Yuan, C.; Ng, E. A study on the impact of shadow-cast and tree species on in-canyon and neighborhood’s thermal comfort. Build. Environ. 2017, 115, 1–17. [Google Scholar] [CrossRef]
  60. Wu, S.; Yang, H.; Luo, P.; Luo, C.; Li, H.; Liu, M.; Ruan, Y.; Zhang, S.; Xiang, P.; Jia, H.; et al. The Effects of the Cooling Efficiency of Urban Wetlands in an InlandMegacity: A Case Study of Chengdu, Southwest China. Build. Environ. 2021, 204, 108128. [Google Scholar] [CrossRef]
  61. Zhou, W.; Cao, W.; Wu, T.; Zhang, T. The win-win interaction between integrated blue and green space on urban cooling. Sci. Total Environ. 2022, 863, 160712. [Google Scholar] [CrossRef]
  62. Zhang, Q.; Zhou, D.; Xu, D.; Cheng, J.; Rogora, A. Influencing factors of the thermal environment of urban green space. Heliyon 2022, 8, e11559. [Google Scholar] [CrossRef]
  63. Deilami, K.; Kamruzzaman, M.; Liu, Y. Urban heat island effect: A systematic review of spatio-temporal factors, data, methods, and mitigation measures. Int. J. Appl. Earth Obs. Geoinf. 2018, 67, 30–42. [Google Scholar] [CrossRef]
  64. Koc, C.B.; Osmond, P.; Peters, A. Evaluating the cooling effects of green infrastructure: A systematic review of methods, indicators and data sources. Sol. Energy 2018, 166, 486–508. [Google Scholar]
  65. Peng, J.; Dan, Y.; Qiao, R.; Liu, Y.; Dong, J.; Wu, J. How to quantify the cooling effect of urban parks? Linking maximum and accumulation perspectives. Remote Sens. Environ. 2021, 252, 112135. [Google Scholar] [CrossRef]
  66. Wang, Q.; Fan, Y.; Hang, J.; Li, Y. Interacting urban heat island circulations as affected by weak background wind. Build. Environ. 2019, 160, 106224. [Google Scholar] [CrossRef]
  67. Lam, C.K.C.; Weng, J.; Liu, K.; Hang, J. The effects of shading devices on outdoor thermal and visual comfort in Southern China during summer. Build. Environ. 2022, 228, 109743. [Google Scholar] [CrossRef]
  68. Mazzeo, D.; Matera, N.; Peri, G.; Scaccianoce, G. Forecasting green roofs’ potential in improving building thermal performance and mitigating urban heat island in the Mediterranean area: An artificial intelligence-based approach. Appl. Therm. Eng. 2022, 119879. [Google Scholar] [CrossRef]
Figure 1. Model of optimal layout of urban green space. The schematic diagram of urban boundary layer model was from Ref. [56].
Energies 16 00368 g001
Figure 2. Air temperature and humidity measuring points in the urban study area.
Energies 16 00368 g002
Figure 3. Grid division of the Hongshuwan experimental area.
Energies 16 00368 g003
Figure 4. Genetic algorithm flow chart.
Energies 16 00368 g004
Figure 5. Air temperature changes in typical urban and suburban areas.
Energies 16 00368 g005
Figure 6. Typical daily heat island intensity.
Energies 16 00368 g006
Figure 7. Cooling effects of 12 greenbelts near tested location.
Energies 16 00368 g007
Figure 8. The influence of solar radiation intensity on the cooling effects. (Compared with the cooling range of reference standard (500 W/m2)).
Energies 16 00368 g008
Figure 9. Influence of air temperature on cooling effects of green space.
Energies 16 00368 g009
Figure 10. Influence of humidity on cooling effects of green space.
Energies 16 00368 g010
Figure 11. Final optimization scheme.
Energies 16 00368 g011
Figure 12. Mitigation effects curve of increasing green space layout area on heat island.
Energies 16 00368 g012
Table 1. Cooling effect of different types of greening.
MeasuresTypeEffects
Increase surface vegetation coverageUrban roof greeningReduce the near surface temperature by more than 1 °C [16,17]
Light roof greeningReduce the air temperature of pedestrian floor by 0.4–0.7 °C [18,19,20,21,22,23]
Heavy roof greeningReduce the air temperature of pedestrian floor by 0.5–1.7 °C [24,25,26]
Road GreeningReduce air temperature by 0–15 °C [27,28]
wall greeningReduce carbon emissions by 014–0.98 kg/m2 [29]
wall greeningReduce surface temperature by 6–10 °C [30,31]
Construction of urban parksAmbient temperature around the park: 1–1.3 °C [32,33]
The temperature inside the park decreased by 0.8 °C [34,35]
Table 2. Table of Experimental Equipment.
EquipmentParameter
Temperature and humidity recorderMeasuring range: −40~100 °C
Measurement accuracy: Wet ± 2%
Temperature: ±0.2 °C
Irradiation tableMeasuring range: 0~2000 W/m2
Sensitivity: 9.75 uV·W−1·m2
AnemometerMeasuring range: 0~30 m/s
Measurement accuracy: 0.5 m/s
Thermal resistanceMeasuring range: 0~100 °C
Measurement error: ±0.01 °C
Data acquisition instrumentMeasuring range: −50~150 °C
Measurement accuracy: ±0.2 °C
Table 3. Optimization model under the restriction of total green area.
Objective Function m i n { I U H I } (6)
Decision variables δ i j   ,   i , j = 1 , 2 , N (7)
Restrictions δ i , j = { 0 ; n o n g r e e n s p a c e 1 ; g r e e n s p a c e (8)
A i , j δ i , j S t o t (9)
f ( ϕ ) = 1 2 π σ e ( ϕ μ ) 2 2 σ 2 (10)
μ 3 σ ϕ μ + 3 σ (11)
Table 4. Optimization simulation results.
SeasonGrid of Optimization SchemeThe GSCI of Each Grid (°C)Optimization Index Value I UHINot Optimized Index Value I UHI
Summer(2, 6), (3, 6), (3, 7), (4, 6), (4, 7), (4, 8), (5, 7), (6, 11), (6, 12), (7, 11)0.26, 0.32, 0.31, 0.30, 0.33, 0.31, 0.33, 0.33, 0.33, 0.310.310.34
Winter(2, 6), (2, 8), (2, 9), (2, 10), (2, 11), (2, 12), (2, 14), (2, 15), (2, 16), (3, 6)0.32, 0.27, 0.31, 0.33, 0.33, 0.33, 0.25, 0.24, 0.32, 0.330.490.52
Disclaimer/Publisher’s Note: The statements, opinions and data contained in all publications are solely those of the individual author(s) and contributor(s) and not of MDPI and/or the editor(s). MDPI and/or the editor(s) disclaim responsibility for any injury to people or property resulting from any ideas, methods, instructions or products referred to in the content.

