Article

Modern Bitumen Oil Mixture Models in Ashalchinsky Field with Low-Viscosity Solvent at Various Temperatures and Solvent Concentrations

1
Department of Transport and Storage of Oil and Gas, Saint Petersburg Mining University, 199106 Saint Petersburg, Russia
2
Department of Transport and Storage of Oil and Gas, Ufa State Petroleum Technological University, 450064 Ufa, Russia
*
Author to whom correspondence should be addressed.
Energies 2023, 16(1), 395; https://doi.org/10.3390/en16010395
Submission received: 7 November 2022 / Revised: 19 December 2022 / Accepted: 21 December 2022 / Published: 29 December 2022

Abstract

:
The article analyzes the modern theory and practice of pipeline transport of bituminous oil together with low-viscosity solvent. In addition, a detailed analysis of the rheological models of non-Newtonian fluids is carried out, which establishes a number of assumptions on the rheology model selection algorithm currently in use (limited number of rheological models, variability in model coefficient assignment, etc.). Ways of their elimination are proposed. Dependencies for determination of the dynamic viscosity coefficient of binary oil mixtures are investigated. Calculation of the parameters of the bituminous oil mixture with solvent is considered. Complex experimental studies on rheology mixture models of bituminous oil and solvent on the example of the Ashalchinsky field (Russia, Tatarstan) in a wide range of temperatures and concentrations of the solvent are conducted. A two-dimensional field of rheological models of the oil mixture is constructed, which makes it possible to determine the rheological model of the pumped oil mixture depending on the solvent concentration and the temperature of the mixture. Formulas for forecasting the rheological properties of the oil mixture on the basis of statistical processing of the results of experimental studies are theoretically substantiated. It is proven that the viscosity of binary oil mixtures in the Newtonian fluid field should be determined by a modified Arrhenius equation. The proposed models with a high degree of accuracy describe the rheological properties of the oil mixture. It is shown that in the case of complex mixtures, not one rheological model should be applied, but their hierarchy should be established depending on the solvent concentration and temperature.

1. Introduction

Experts estimate the world’s reserves of heavy oil to be over 810 billion tons, but transportation is difficult and requires expensive technologies. One of the most efficient and low-cost ways of delivering such oil to the consumer is to mix it for joint transport. The joint transport of oils in mixtures is widely used in pipeline transport [1,2].
Canada’s proved oil reserves are now the second largest in the world. An amount of 95 percent of Canada’s oil reserves are in Alberta, and the majority are in the oil sands of Northern Alberta. Bituminous sand reserves range from 1.7 to 2500 billion barrels of bitumen, of which only 173 billion barrels can be obtained with modern technology [3,4,5,6]. It is necessary to take into account the tendency to increase the share of hard-to-recover reserves (super-viscous oil, natural bitumen, etc.) in the structure of the world mineral and raw material base of the oil complex, as well as the increase in production and transportation of hydrocarbons [7,8]. It is planned to increase oil production in these areas almost fivefold by 2030.
The increasing share of high-viscosity oil and natural bitumen in the volume of oil production, as well as the remoteness of developed fields from processing sites, increase the urgency of problems related to the transportation of such oil. One of the proven pipeline transport technologies is pre-heated and diluted oil extraction [9,10]. When using this technology, it is particularly important to determine the rheological properties of the oil mixture for different temperatures and concentrations of the solvent [11,12,13]. In this connection, the problem of studying rheological mixture models of bituminous and low-viscosity oil on the example of the Ashalchinsky field is relevant.
Studies [14,15,16] on the possibility of using various types of solvents in the extraction of bituminous oil have been considered, and insufficient attention has been paid to some issues of pipeline transportation of oil mixtures.
A study on rheology mixture models of bituminous oil and solvent in a wide range of temperatures and concentrations of the solvent will allow for obtaining equations of the dependencies of rheological parameters of the studied mixture from its temperature and concentration of the solvent. This will help to solve the problem of rational transportation parameters of bituminous oil in a mixture with a solvent, which takes into account the complex rheological properties of the transported product.

2. Materials and Methods

2.1. Rheological Properties of Bituminous Oil

The world’s main hydrocarbon reserves are concentrated in heavy oil. Canada has the world’s largest reserves of such oil. Major pipeline systems in Canada include Enbridge, TransCanada, Kinder Morgan Trans Mountain, and Kinder Morgan Express. The Canadian Enbridge pipeline system, connected to the Lakehead (US) system, is one of the world’s largest oil pipeline systems. Total oil production in the country by 2030 will increase by 39%, i.e., to 5.1 million barrels per day. Most of Alberta’s oil reserves (more than 95%) are oil sands, which are much more difficult to extract than ordinary oil. There are also plans to build a number of pipelines to transport low-viscosity oil intended for diluting Canadian oil sands.
Table 1 shows the data on type and volume of transported products by the North American pipeline system.
In Venezuela, where heavy-oil reserves are largely coincided with the Orinoco oil belt, the problem of transporting heavy oil is quite acute. The creation of a technology for pumping specially prepared oil emulsion was one of the technical solutions for the transportation of bituminous oil (Orimulsion®, Caracas, Venezuela).
The application of heavy-oil pipeline technology using solvents is widespread. From a technological point of view, the transport of heavy oil together with the solvents is sufficiently reliable and well predicted.
Russia ranks third in the world after Canada and Venezuela for assured heavy-oil reserves. The Ashalchinskoye oil field occupies a special place among the fields developed by «Tatneft» JSC. At the Ashal’chin field, bituminous oil pumping together with solvent takes place in a non-isothermal mode, using pre-heating technology.
Research and improvement of the pipeline transportation technology of bituminous oil mixed with solvent on the example of the Ashalchinsky field are current scientific and technical tasks, and experience will be useful on a global scale.
As the complex rheological properties of bituminous oil play a crucial role in the transport process, one of the main tasks of rheological research is to determine the relationship between forces acting on the studied environment and the deformations caused by these forces [18,19].
Liquids called Newtonian are described by the following equation [20]:
τ = μ · d ν dr   ,
where τ—shear stress; μ—coefficient of dynamic viscosity; dν/dr—velocity gradient.
The linear relationship of shear stresses and the velocity gradient hypothesis proposed by Newton is not valid for all liquids. Liquids, the rheological behavior of which differs from Equation (1), are called non-Newtonian. It is considered to divide non-Newtonian liquids into three groups [19]:
(1)
Nonlinear viscous liquids (shear stress is a nonlinear function of the shear rate);
(2)
Fluid with non-stationary rheological characteristics (the functional dependence between the shear stress and the shear rate depends on the time or history of the process);
(3)
Viscoelastic liquids (exhibit elastic recovery of shape after stress relief).
The samples of bituminous oil of the Ashalchinsky field studied in the work can be attributed to the first group of non-Newtonian liquids.
Table 2 provides an overview classification of rheological models of non-linear viscous media proposed by different researchers, and also provides recommendations for choosing a rheological model of the fluid under investigation [21].
Currently, there are many different approaches to the questions of choosing a rheological model of the studied system. The main approach is statistical processing of experimental data based on the least squares method, with a further selection among the proposed rheological models by the criterion of the minimum mean square of deviations [19]. However, while solving the problem of identifying the rheological model from experimental data with limited sample size, the problem of correctly associating the complexity of the identifiable model with the number and level of error of the available data becomes acute. At present, the choice of rheological model is uncertain.
In this paper, the following method of choosing a rheological model is proposed. The input data for this methodology are the results of the rheological experiments presented in sample form γ 1 ˙ τ 1 ,   γ 2 ˙ τ 2 ,   ,   γ l ˙ τ l , where τ i —value of shear stress at shear rate; γ i ˙   ( i = 1 ,   2 ,   , l ) —sample size. The dependence τ = τ ( γ ˙ ) is assumed to be described by a rheological model of the form τ = f ( γ ˙ ,   a 1 ,   , a k ) , where f—some given function containing unknown parameters a. Model selection is based on two criteria: mean square deviations and risk.
The mean square of deviations, also called the function of empirical risk, is calculated by the formula:
l 0 ( a ) = 1 l i = 1 l ( y i F ( x i ,   a ) ) 2   ,
where a—model parameters.
To identify the risk, the following estimate is applied:
I m ( a ) = [ I 0 ( a ) 1 n ( ln ( l ) + 1 ) lnr l ]   ,
where r—the probability that the risk will be less or equal to the estimated risk; n—model parameter count.
Here, [ z ] = { z ,   z 0 ,   z < 0 .
If the probability value r is too high (close to one), then the choice will be in favor of simple one-parameter models, but if it is small, the preference will be for complex models, which may not always be justified. The work adopts a medium variant with r = 0.51. Here, it should also be noted that the choice of r coefficient is also subjective and depends on which model the researcher wishes to give preference to.
As the choice of the model is based on two criteria, the final decision on the choice of rheological model in the method is proposed to take on the basis of the minimum additive criterion:
s = α 1 · I 0 ( a ) + α 2 · I m ( a ) ,
where α1, α2—coefficients; in the work [23], the coefficients are taken as α1 = 0.4 and α2 = 0.6 without explanation.
The article offers to apply the principle of the minimum additive criterion, in which the normalized value of the mean square of deviations (Sn) and the normalized value of risk (Rn) are used:
Sn j = I 0 ( a ) j i = 1 4 I 0 ( a ) i   ,
Rn j = I m ( a ) j i = 1 4 I m ( a ) i   ,
Y = min j ( Sn j + Rn j )   ,
where j—flow model number (based on model selection list).
Generally, for oil and petroleum products, the choice is made from the 4 most common rheological models (Table 3).
This choice of models is explained by the fact that it allows for the choice of the correct rheological model for most common oil mixtures. However, the Bingham–Shwedov and Herschel–Balkley models assume that the initial stress system has τ 0 shear, and in its absence, the Bingham–Shwedov model is reduced to the Newtonian fluid model, and the Herschel–Balkley model to the Ostwald–de Waele model. In case the initial stress τ 0 is negligible in the test sample, then [19,21] in the proposed list of 4 models, there are only two models: the Newtonian liquid model and the Ostwald de Waele model. Of the two models, only the Ostwald–de Waele model is non-linear, which deprives the algorithm of a variety of choices in the case of a non-Newtonian fluid. Special attention should also be paid to the fact that the Ostwald–de Waele model is not a «rheological law» but only a convenient form of regression processing of experimental data [22]. The proof of this has two positions: (1) the dimension of coefficients is devoid of physical sense; (2) at a gradient of the shear velocity tending to 0, effective viscosity should aim to infinity, which, in reality, is never observed in real liquids, and viscosity tends to some value μ 0 (in the case of a gradient of the shear velocity tending toward infinity, the effective viscosity should aspire to 0; in real liquids, it tends to some value μ inf ). Thus, the Ostwald–de Waele model, in light of the above-mentioned facts, should be used with great care and within a narrow range of parameters [24].
In this context, it is proposed to review (Table 3) the Carreau model:
μ eff ( γ ˙ ) = μ inf + ( μ 0 μ inf ) ( 1 + ( b γ ˙ ) 2 ) c 1 2   ,
where μ 0 , μ inf , b, and n are model coefficients: μ 0 —dynamic viscosity coefficient at a gradient of tending to zero shear rate (Pa·s); μ inf —dynamic viscosity coefficient at a gradient of tending to infinity shear rate (Pa·s); b—relaxation time (s); c—index.
The general graphical representation of the Carreau model in the axes «dynamic viscosity coefficient–shear rate» is presented in Figure 1.
The Carreau model is a generalized rheological model for non-Newtonian fluids and is used to describe complex nonlinear models [25,26]. The Carreau model is devoid of the disadvantages of the Ostwald–de Waele power model and has been widely used to describe the flow of polymer liquids, oil mixtures, emulsions, etc. In some cases, it is recommended to use the Carreau–Yasuda model, which is a more general case and contains 5 independent coefficients:
μ eff ( γ ˙ ) = μ inf + ( μ 0 μ inf ) ( 1 + ( b γ ˙ ) a ) c 1 a   ,
where a —Yasuda coefficient, which takes into account the curvature of «transition» regions on the graph in the axes «dynamic viscosity coefficient–shear rate». However, the Carreau–Yasuda model is complex, requires a lot of experimental data, and has not been widely applied yet [27]. In addition, it is proposed to supplement the list of rheological models with the Ellis fluid model:
μ = μ 0 1 + ( τ τ 1 2 ) α 1 ,
where μ 0 —viscosity at zero shear rate; α—index; τ 1 2 —shear stress at which the initial viscosity μ 0 is reduced by half.

2.2. Analysis of Foreign Experience in Calculating the Viscosity of Oil Mixtures

Among the large number of formulas for determining the viscosity of binary blends of petroleum with thinners, Shu’s formula (1984) [28] was obtained from the Cold Lake (Alberta, Canada) during an investigation of bitumen mixtures with solvents [29]. The main physical properties of Cold Lake bitumen oil are shown in Table 4 and Table 5.
It is noted that the equations obtained by Shu give more accurate results if the dynamic viscosity of the bitumen is greater than 10,000 mPa·s. This formula is derived from a modified Arrhenius equation in the form of the first proposed by Ledere (1933) [30]:
ln ( μ ) = χ B · ln ( μ B ) + χ S · ln ( μ S )   ,
where µ—dynamic viscosity coefficient of the mixture; μ B —dynamic viscosity coefficient of bitumen; μ S —dynamic viscosity coefficient of the solvent; χ B —volume ratio of bitumen in the mixture, taking into account the correction factor α; χ S —volume ratio of the solvent in the mixture, calculated as:
χ S = 1 χ B   .
The volume ratio of the bitumen content in the mixture with the correction coefficient α is calculated by the formula:
χ B = α · V B α · V B + V S   .
The correction factor α in Formula (13) should be determined from the results of experimental data processing taking into account the requirements of statistical analysis. For different mixtures of oil and bitumen, the values of the coefficient α will vary considerably. Despite this fact, Shu’s [28] studies noted that for a large number of different variants of bitumen mixtures with solvents, the correction factor α is allowed to be determined by the formula:
α = γ ln ( μ B μ S )   .
For the coefficient γ in Formula (14), a criterial equation of the following kind was proposed:
γ = 17.04 · Δ ρ 0.5237 Δ ρ B 3.2745 · ρ S 1.6316   ,
where ρ B —bitumen density; ρ C —solvent density; Δ ρ —difference between bitumen and solvent density, determined by formula:
Δ ρ = ρ B ρ S
Power coefficients in Formula (15) for determining the γ coefficient are the result of regression processing of experimental data. Formulas for α and γ coefficients are based on the common notion that there is a correlation between the viscosity of binary petroleum mixtures and the density (or specific weight) of components [31].
The dynamic viscosity coefficients of the components µB and µS are sufficiently determined by the exponential formula:
μ ( T ) = α · e b · T .
Table 6 provides an overview of formulas for determining the viscosity of binary oil mixtures used in foreign practice, based on work data [32]. Value designations in Table 6 are as follows: ν—kinematic viscosity coefficient; V—volume fraction of component; W—mass fraction of the component, where the indices «mix», «A», and «B» show the ratio of quantity to mixture, more viscous component, and less viscous component, respectively; API—API gravity [33].
All formulas presented in the above review for determining the viscosity of the oil mixture have their advantages and disadvantages [34].
First, it is important to note that there is no universal formula for determining the viscosity of petroleum mixtures, as the physics of the viscosity determination process of the mixture is highly dependent on the physical–chemical properties of the original components [34,35,36]. Formulas claiming to describe the physical essence of the process contain empirical coefficients that depend on the properties of the components of the studied mixture. Thus, the accuracy of a formula depends on how close the test sample of the oil mixture is to the test sample on which the formula was derived [37,38].
Second, many of the formulas cited in the review do not take into account the possible non-Newtonian character of a component [39]. The rheological characteristics and even the rheological model of the mixture itself can vary greatly depending on the solvent concentration. Therefore, the nature of the dependence of the mixture effective dynamic viscosity coefficient to the shear rate will also change. In this case, it will not be quite correct to determine the effective viscosity according to the formulas for mixtures [40,41,42].
As the rheological properties of bituminous oil and its mixture with solvent are the main initial data for solving design and operational problems of pipeline transport, the task of complex experimental studies of rheological models of a mixture of bituminous oil on the example of the Ashalchinsky field and solvent is relevant.

2.3. Experimental Apparatus and Procedure

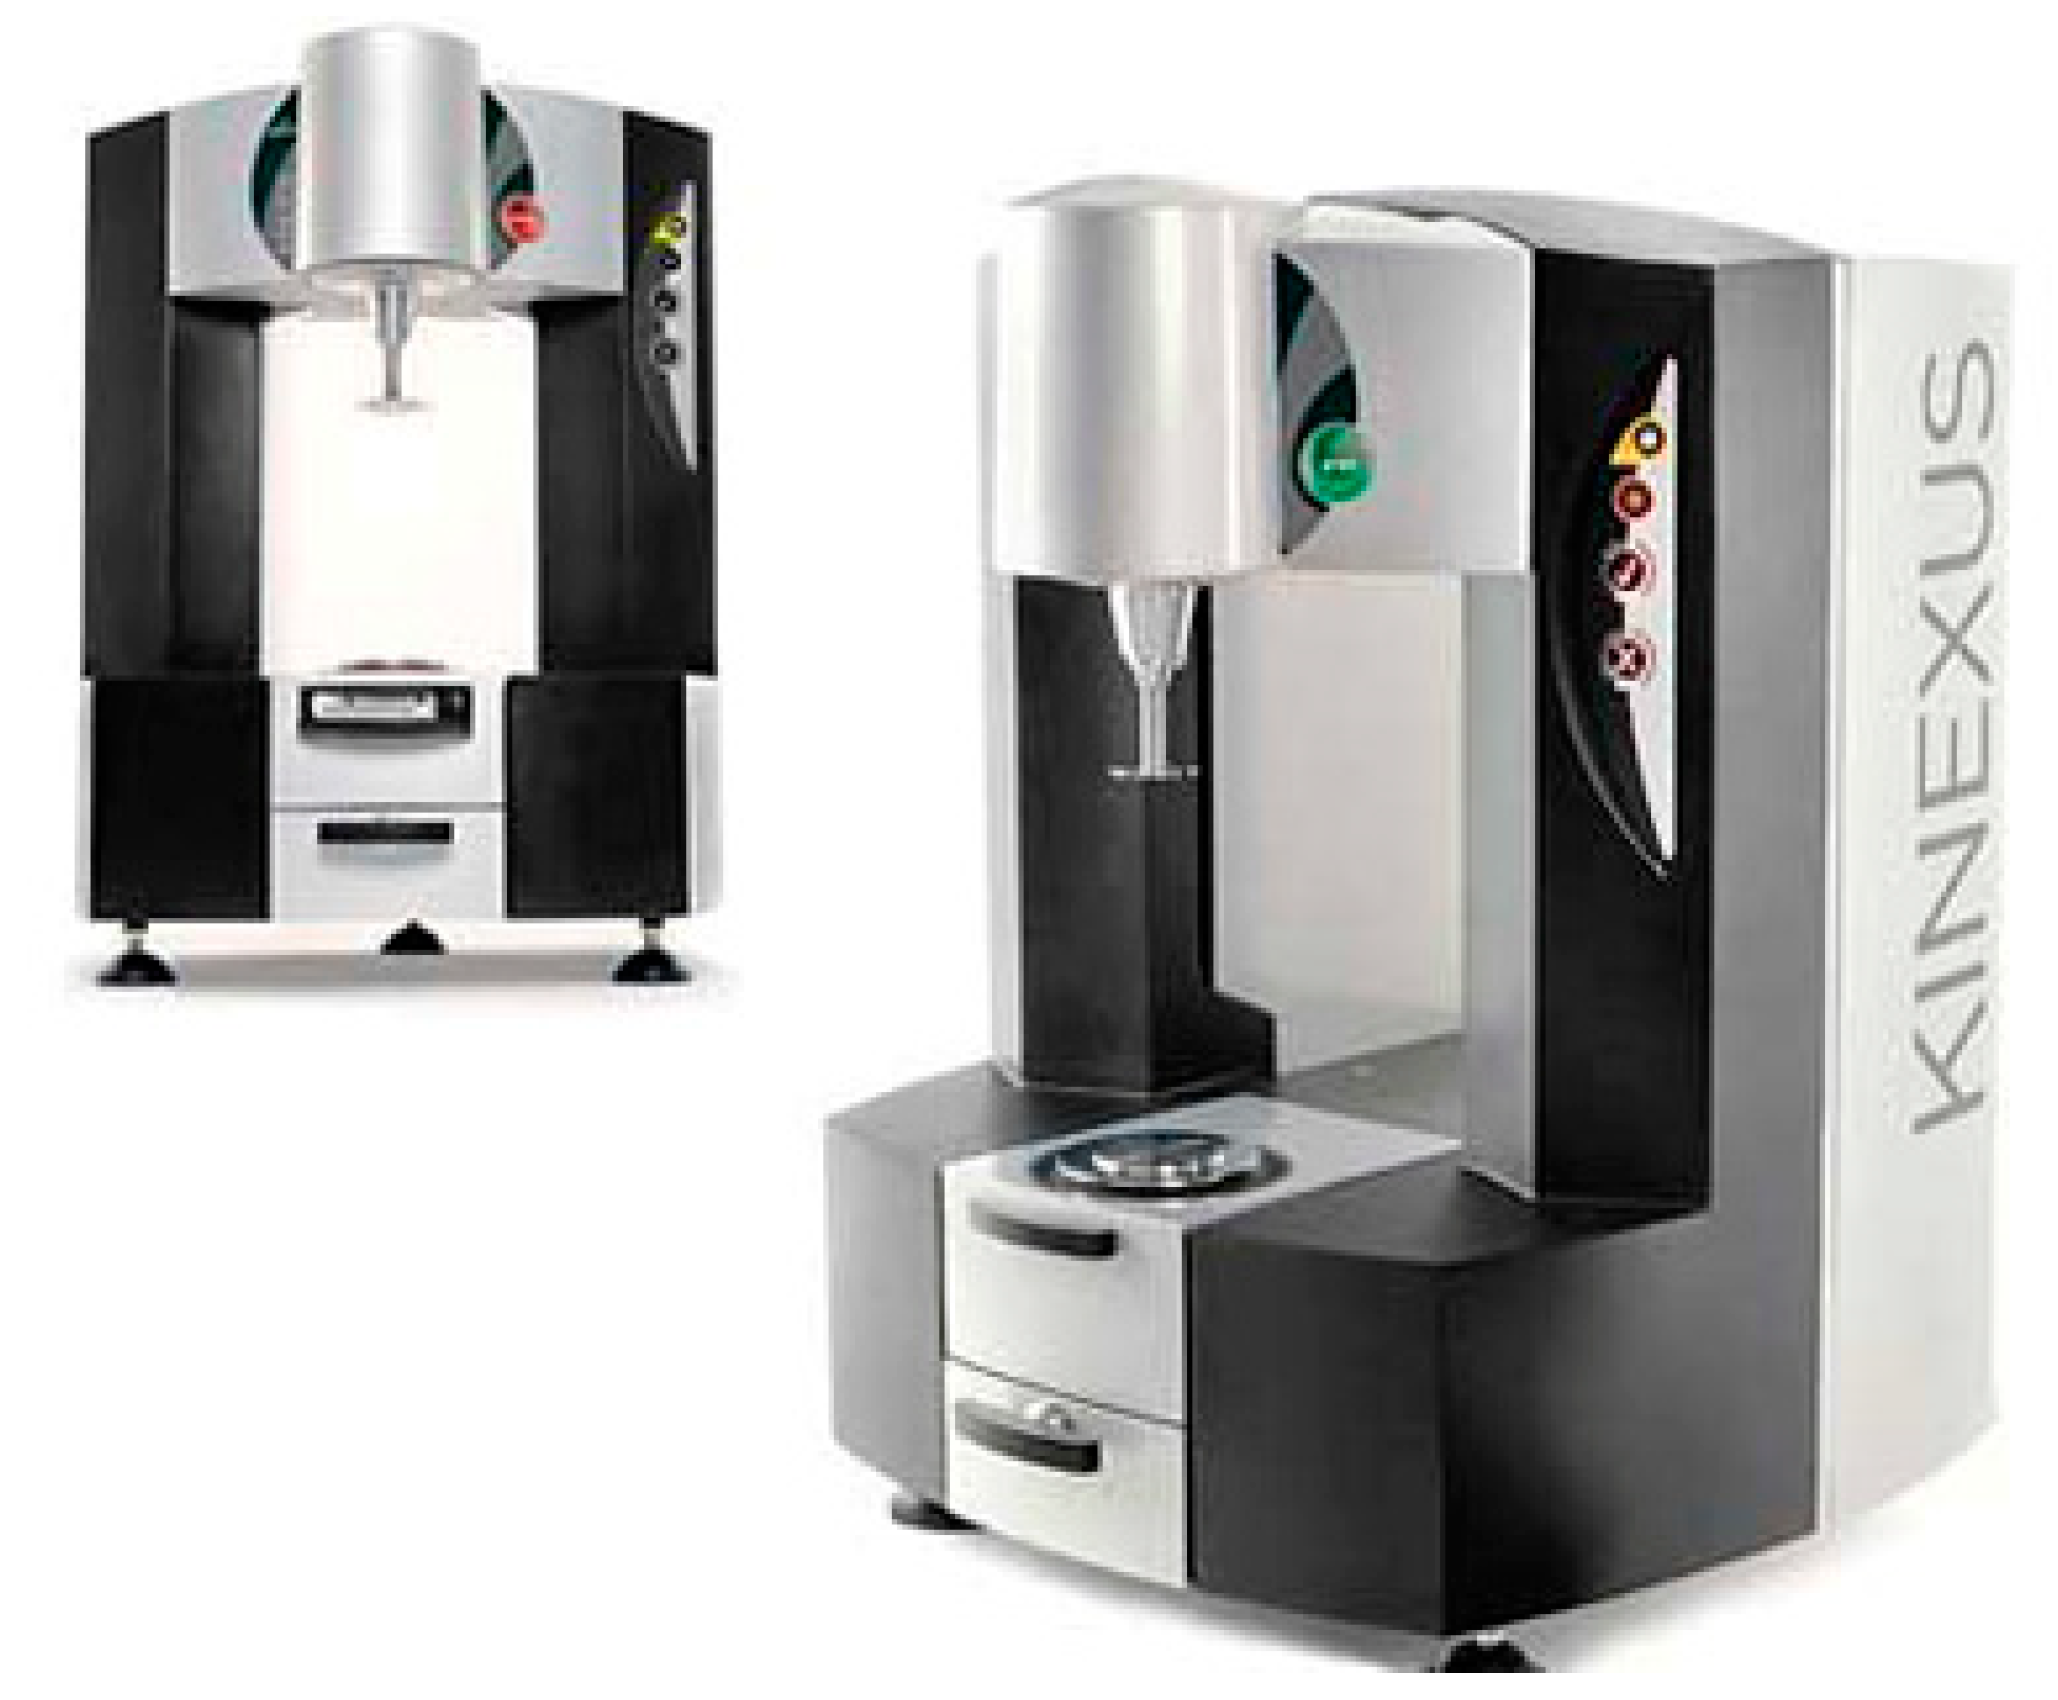
Experimental research was carried out on the rotary rheometer «Kinexus ultra+». The general view of the rotary rheometer «Kinexus ultra+» is presented in Figure 2.
The main technical characteristics of the rotary rheometer «Kinexus ultra+» are given in Table 7.
As a result of the analysis of experimental data, it was found that the oil mixture exhibits non-Newtonian properties at a temperature below 303.15 K. Thus, according to the research task, the following parameter ranges were adopted: the temperature of the mixture samples during the tests varied from 278.15 to 303.15 K; the characteristics of the flow of the oil blend have been investigated under conditions of a discrete increase in the shear rate from 0 to 300 s−1 [43,44].
Experimental data were processed statistically in Statistica 12. The nonlinear estimation method based on the least squares method was used for processing experimental data [45]. Experimental data were processed on the models for the flow of non-Newtonian fluids given in Table 8.
The rheological model was selected according to the algorithm given in the papers [5,46]. The parameters of the selected model were determined using the Hooke–Jeeves method. At each iteration, the method first determines the location of the parameters, optimizing the current function by moving each parameter separately. In this case, the whole combination of parameters shifts to a new place. This new position in the m-dimensional parameter space is determined by extrapolation along the line connecting the current base point to the new point. The step size of this process is constantly changing to reach the optimal point. This method is usually very effective and should be used if the quasi-Newtonian and simplex method does not yield satisfactory ratings [47,48,49].

3. Results

Results are collected and presented in Table 9.
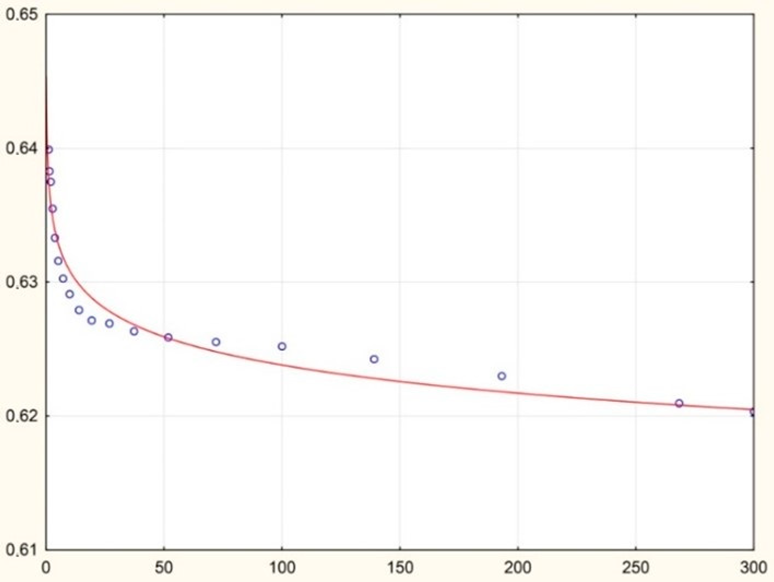
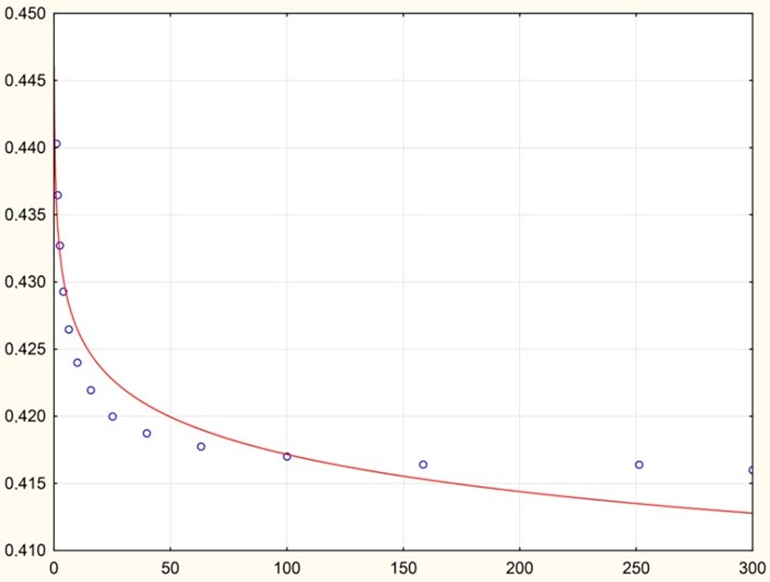
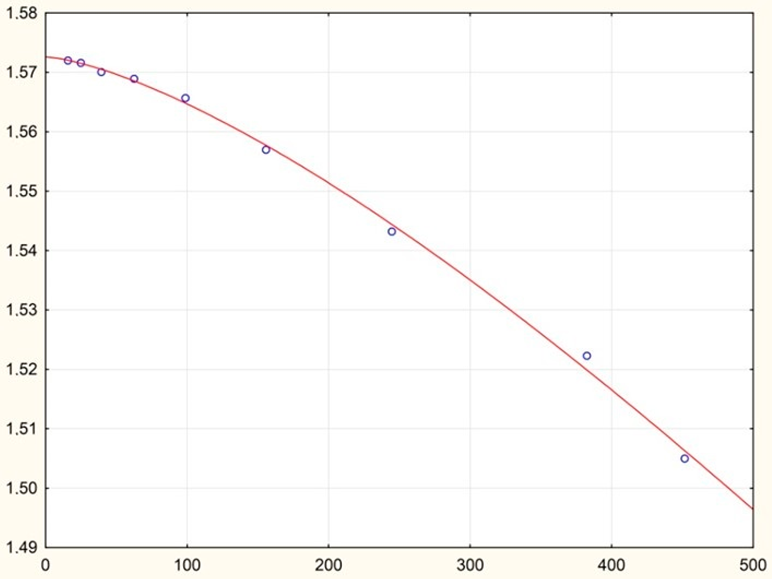
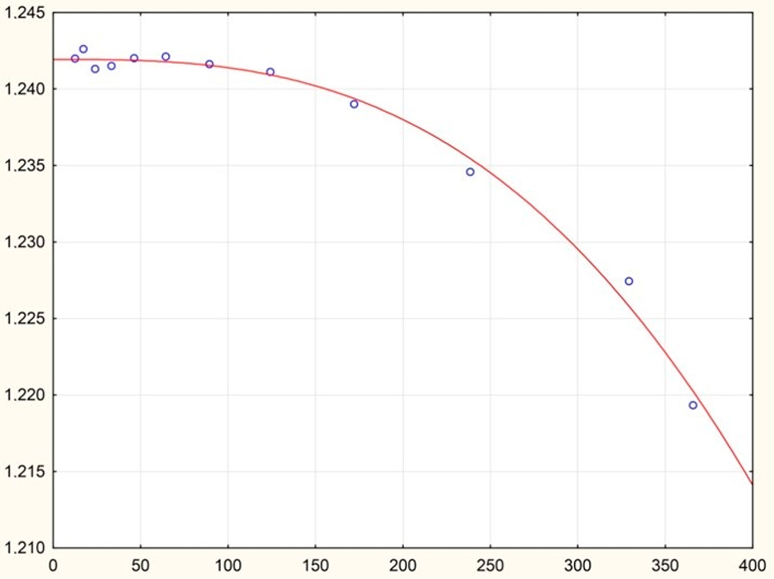
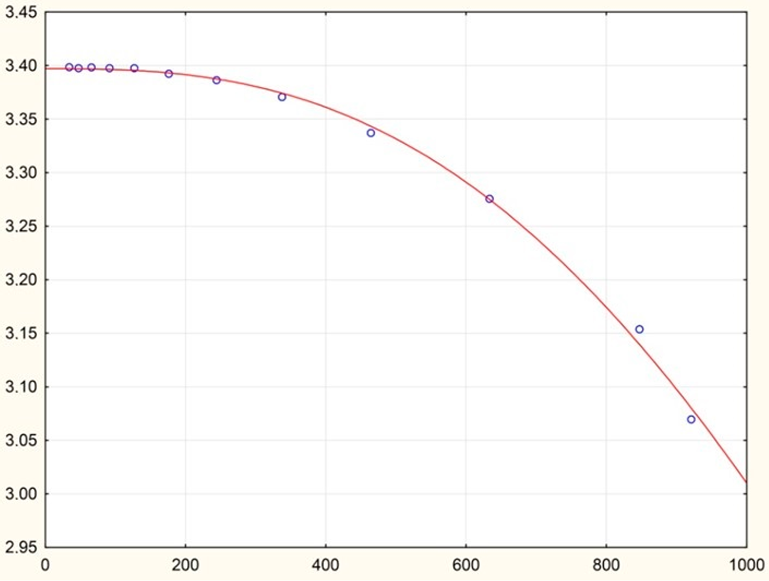
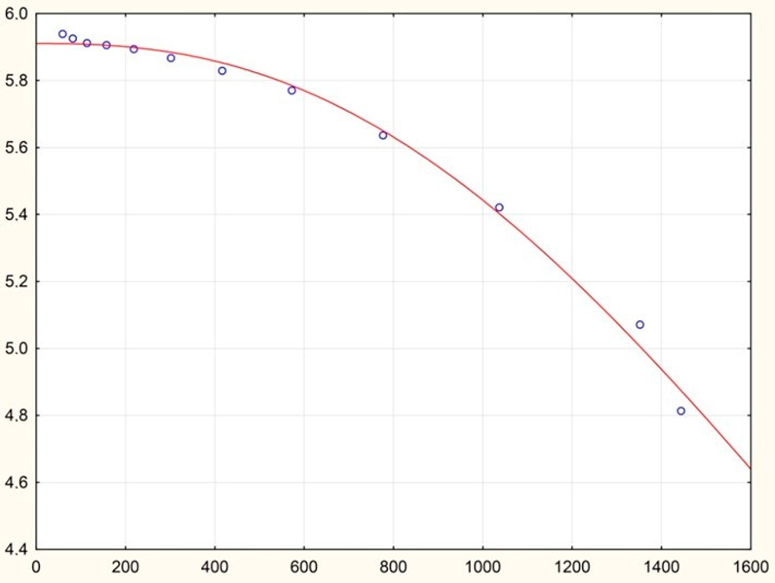
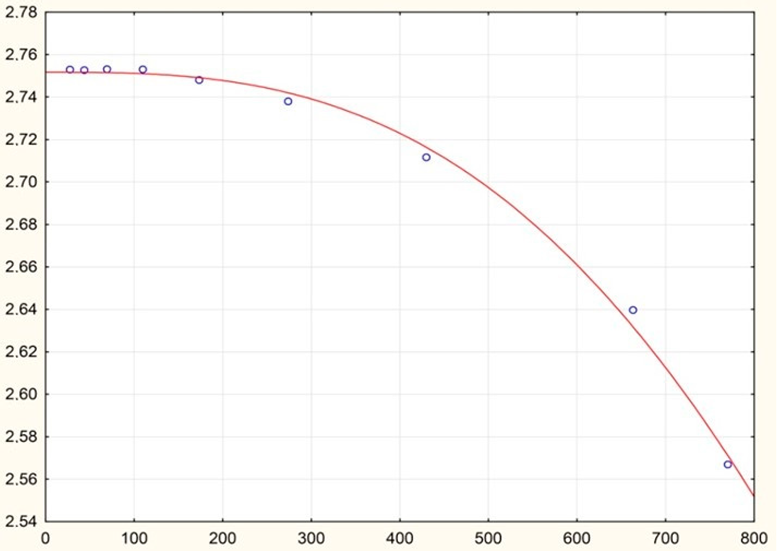
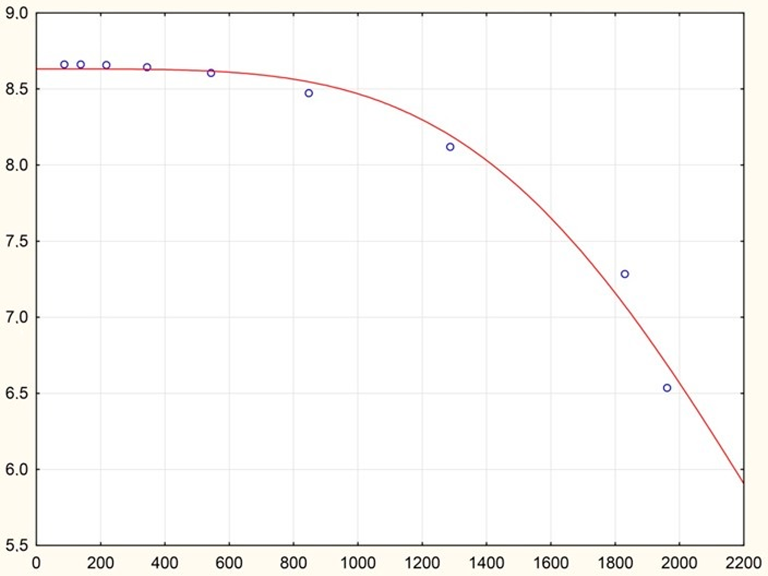
The graphical interpretation of the experimental data and dependencies derived from their statistical processing (Table 9) is presented in Table 10.
The article studies rheology models of the bitumen and low-viscosity oil mixture of the Ashalchinsky field in the temperature range from 278.15 to 333.15 K and solvent concentration from 0 to 100%. Special attention is paid to the field of parameters in which the oil mixture exhibits non-Newtonian properties (the temperature of the mixture is 303.15 K and lower) [50,51,52].
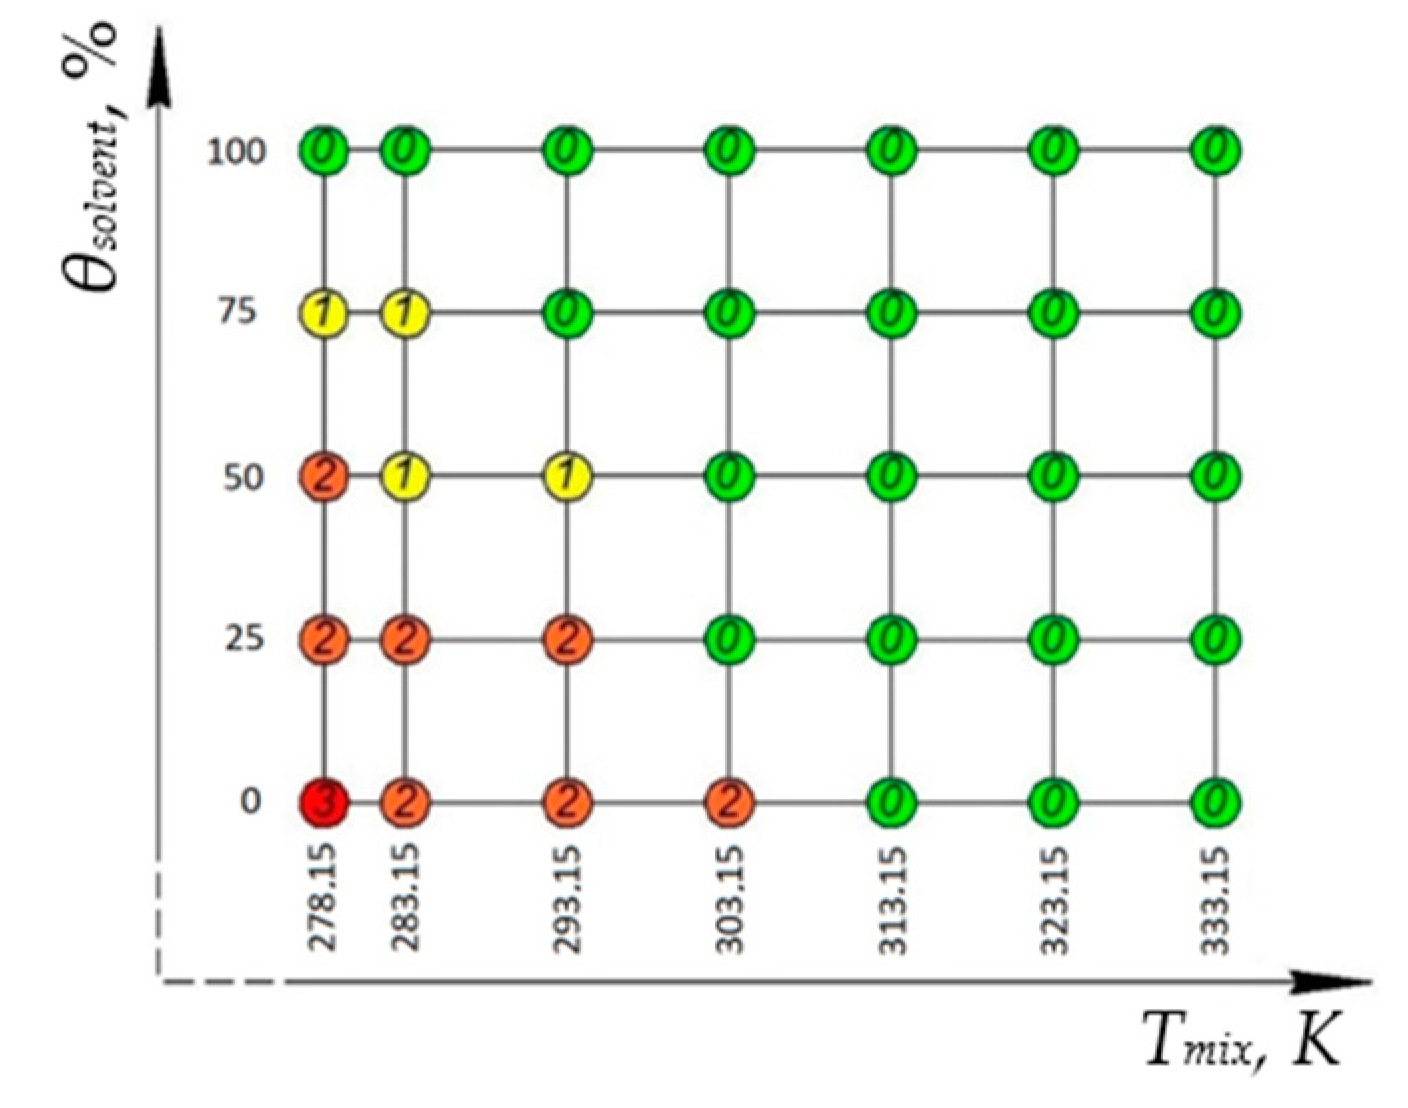
Based on the analysis of experimental data, it is determined that rheological models of oil mixtures with reducing temperature and solvent concentrations are replaced in the following sequence: Newton model–Ostwald de Waele model–Ellis model–Carreau model [53,54]. Thus, a hierarchy of rheological models for the investigated oil system is established: from the simplest one-parameter Newton model to the Carreau model, which includes four independent parameters. The proposed models with a high degree of accuracy describe the rheological properties of the oil mixture. Figure 3 presents a «map» of rheological models of investigated oil mixtures.
  • 0—Newton model;
  • 1—Ostwald de Waele model or power-law;
  • 2—Ellis fluid model;
  • 3—Carreau model.
In further works, it is supposed to apply the results of the study on rheological models to practical questions of pipeline transportation of a bituminous and small-viscosity oil mixture of the Ashalchinsky field.
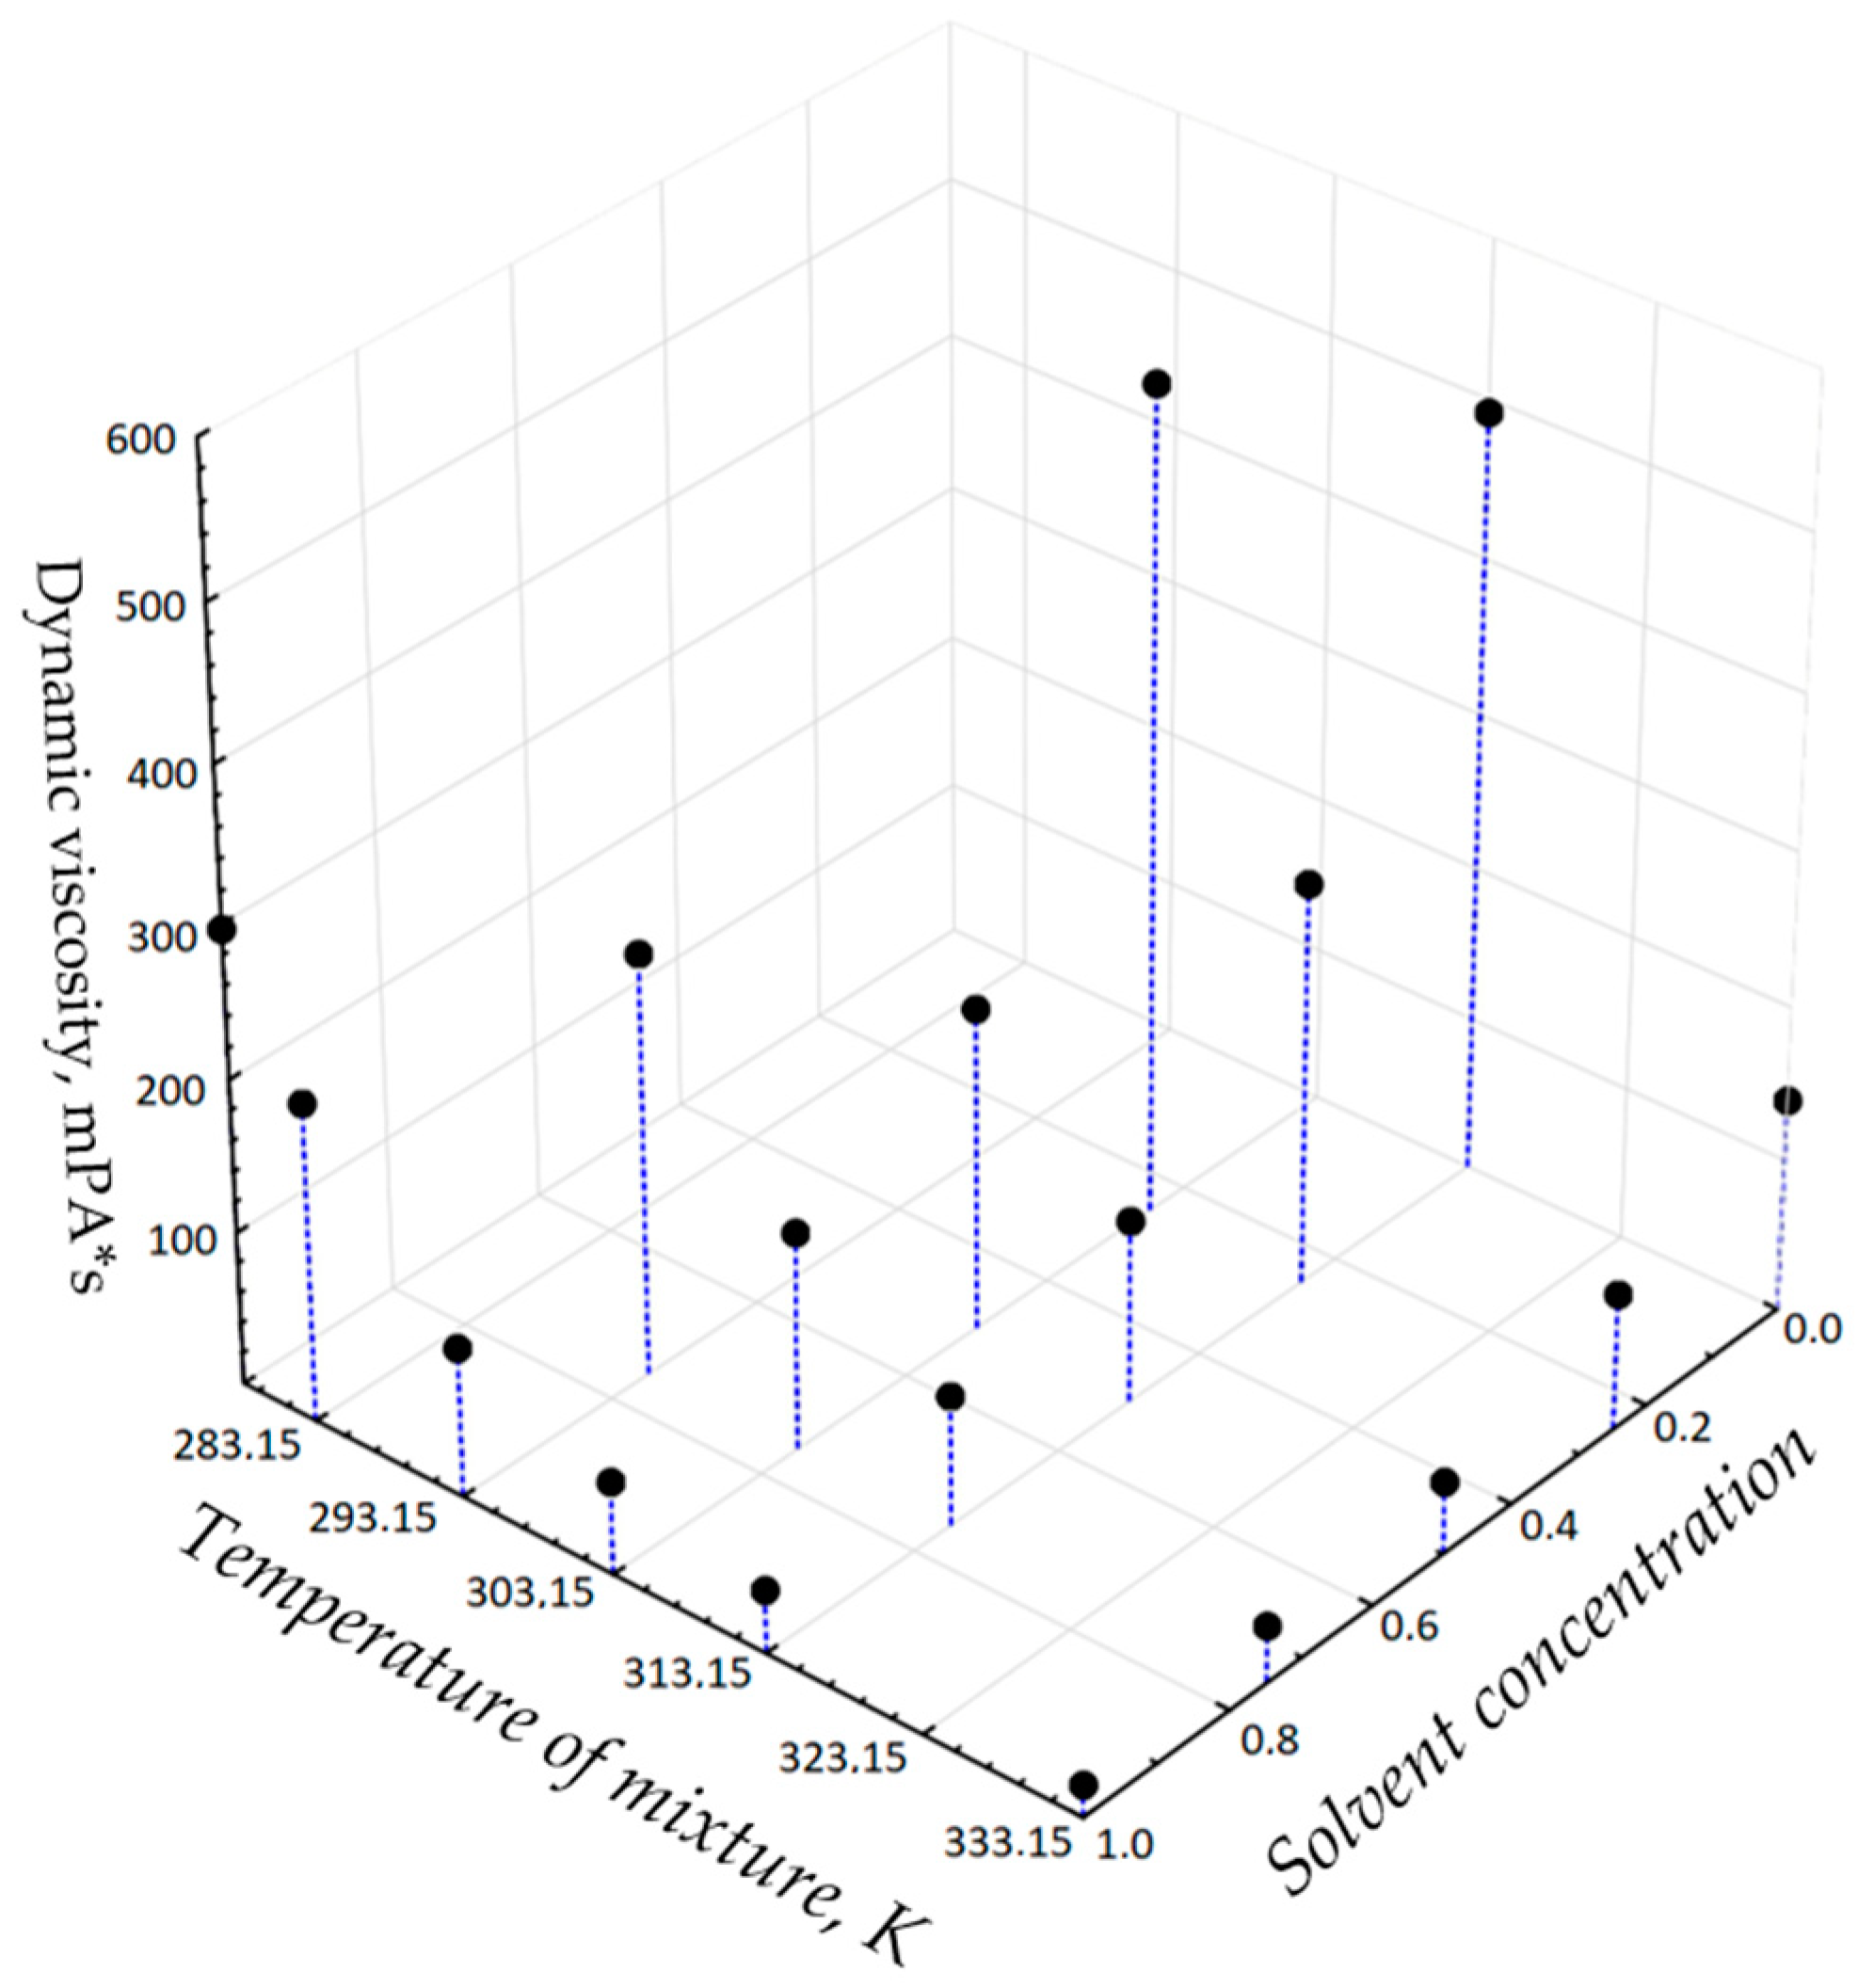
In order to obtain an equation allowing for the determination of the rheological properties of the binary oil mixture depending on the temperature of the mixture and the concentration of the solvent, the results of experiments in the field of Newtonian models are considered [55]. The distribution of values of the dynamic viscosity coefficient obtained for Newtonian models in the space «dynamic viscosity coefficient»–«temperature of mixture»–«concentration of solvent» is presented in Figure 4.
The dynamic viscosity coefficient of the bituminous oil mixture with solvent, depending on the temperature of the mixture and the concentration of the solvent, is suggested to be determined by the modified Arrhenius equation:
μ mix ( T , θ p ) = C 0 · e ( T ( C 1 · θ p + C 2 ) + ( C 3 · θ p ) + Ψ ( θ p ,   T ) ) ,
where μ mix —dynamic viscosity coefficient of the oil mixture; T—oil mixture temperature; θ p —solvent concentration; C 0 , C 1 , C 2 , C 3 —numerical coefficients; Ψ( θ p , T)—correction function determined by regression analysis based on residue analysis.
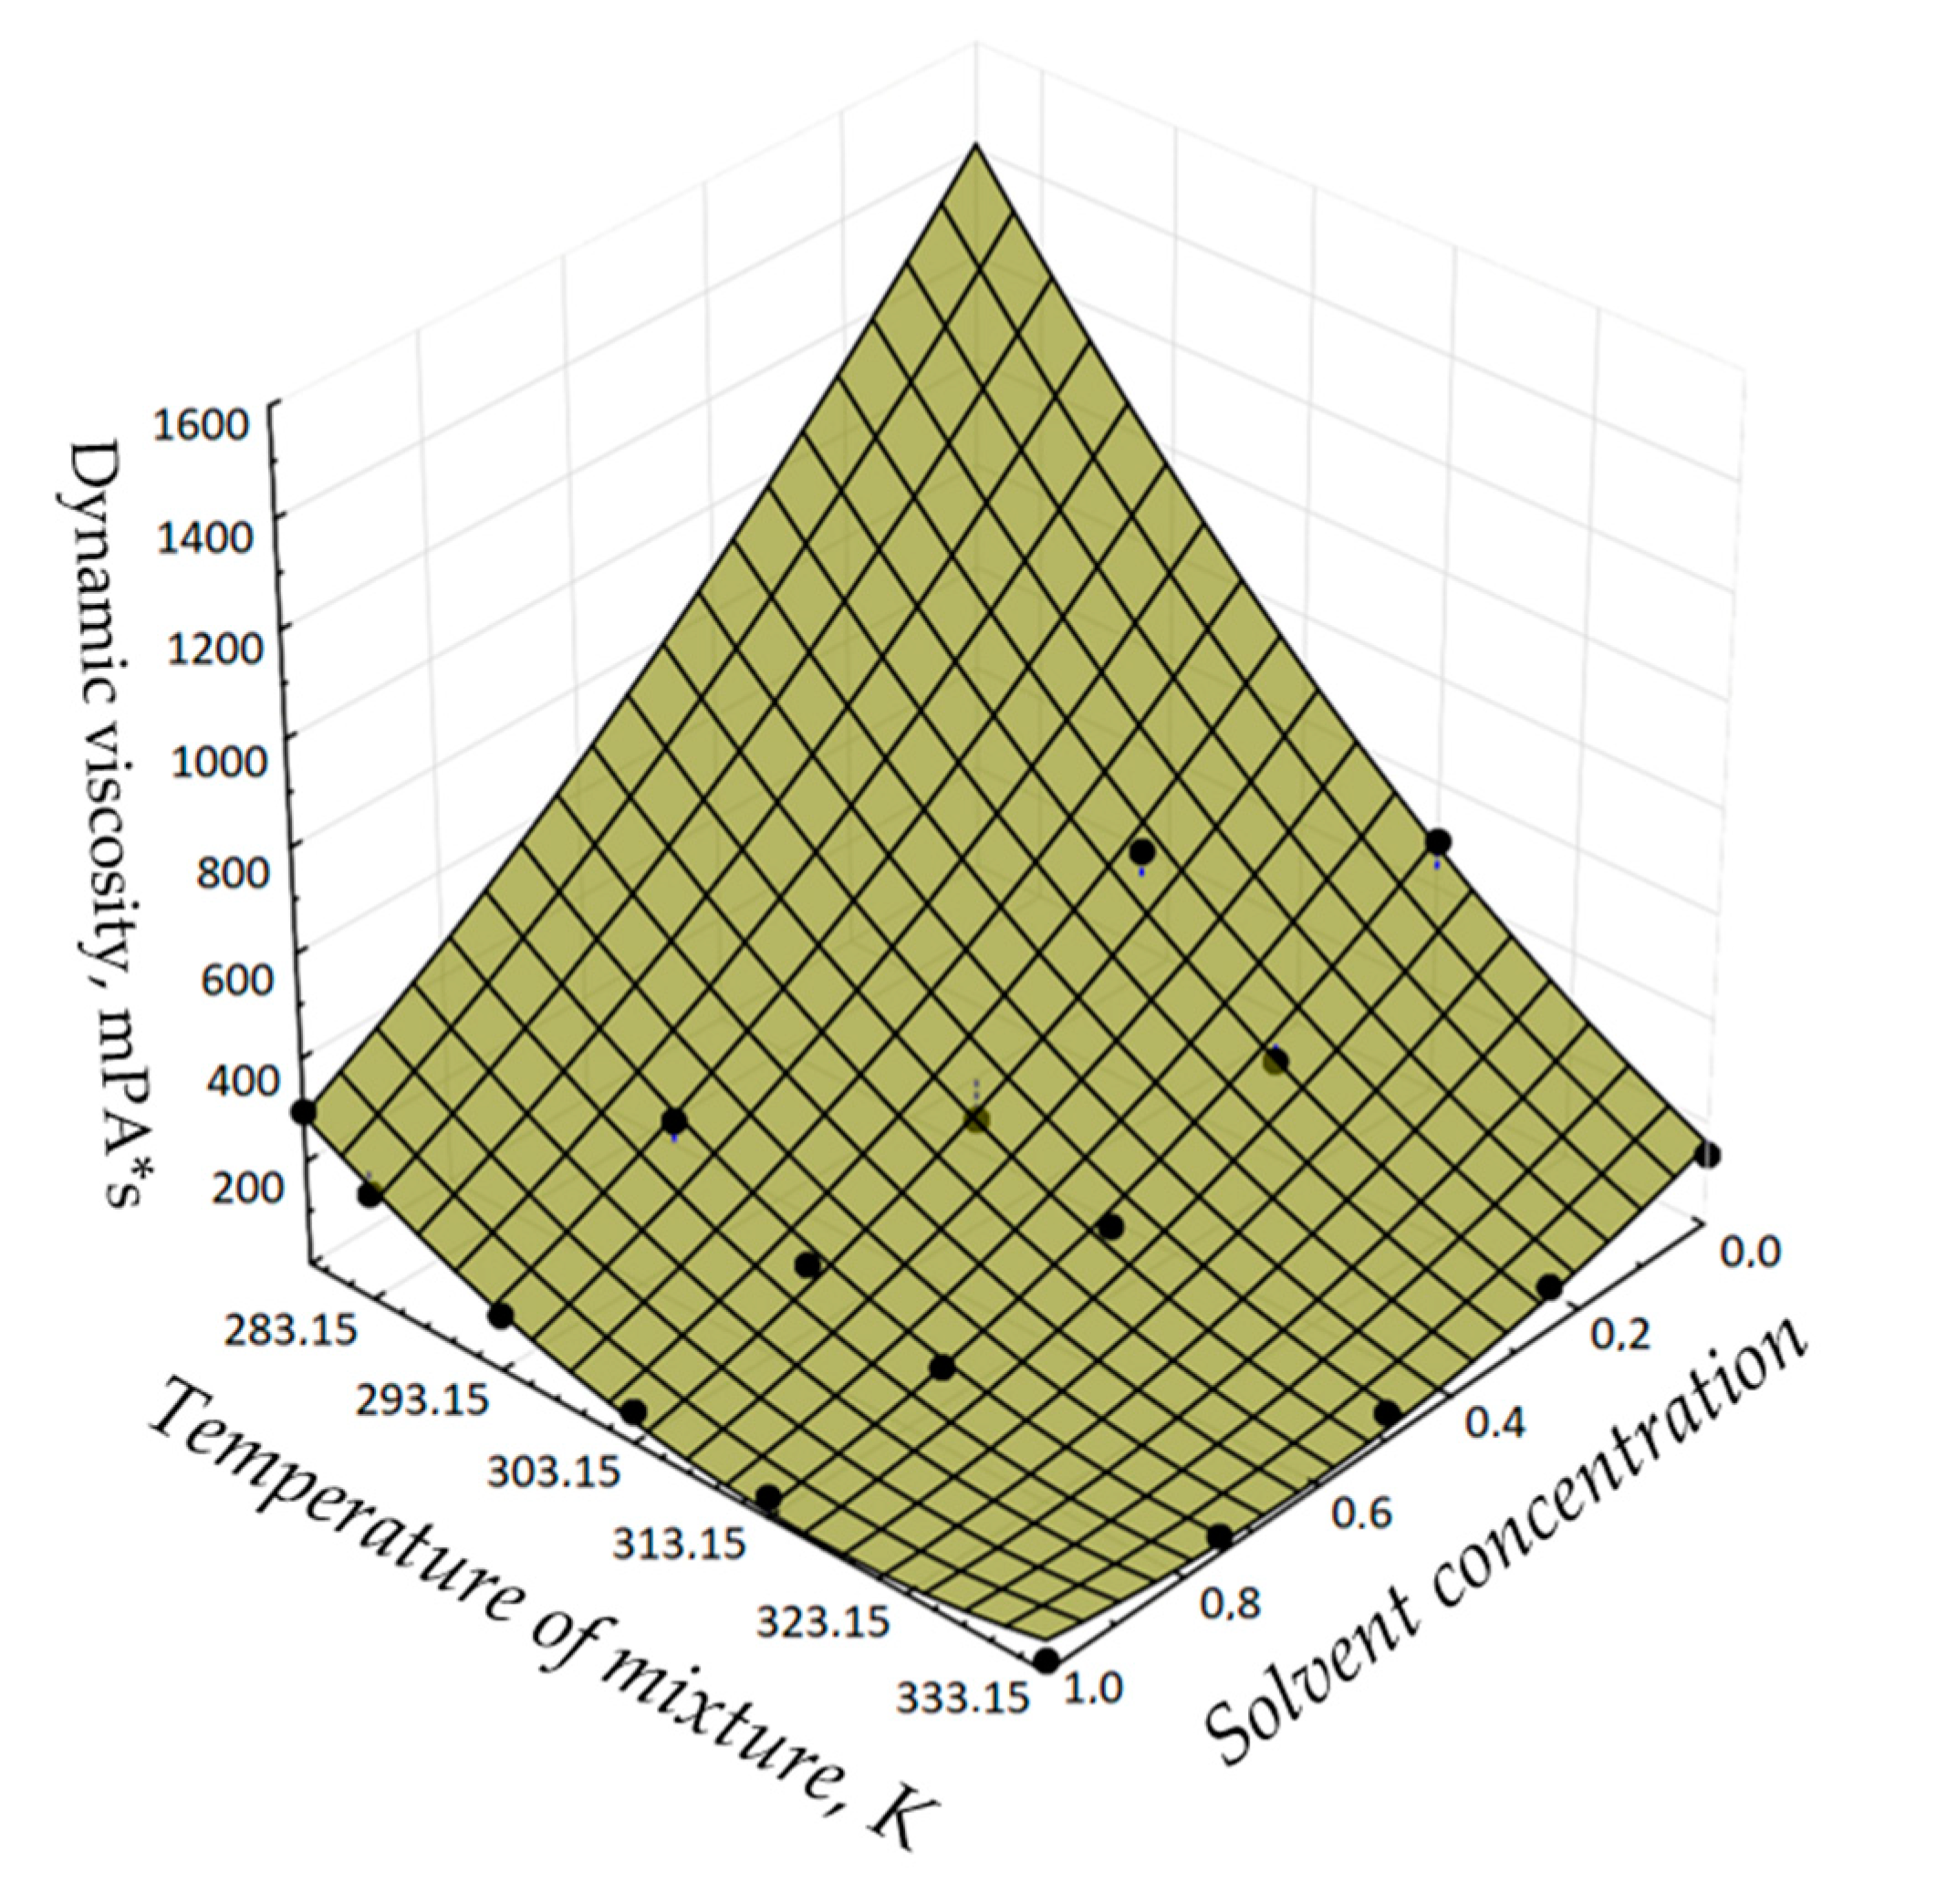
Figure 5 shows the dynamic viscosity coefficient values and the surface constructed according to the modified Arrhenius Equation (18) taking into account the regression coefficients obtained in the work.
Table 11 shows the experimental values of the dynamic viscosity coefficient and the values calculated by Equation (18), the corresponding difference between them, and the relative error.
From Table 11, it can be concluded that the relative error between the experimental data results and the values determined by Equation (18) does not exceed 6%. The average absolute error is 1.623 mPa·s.
The quality of the obtained dependencies is tested by methods of mathematical statistics. The results of the comparison with known dependencies for determining the dynamic viscosity coefficient show that the obtained solution has a sufficient high accuracy. It is proven that the viscosity of binary oil mixtures in the Newtonian fluid field should be determined by a modified Arrhenius equation. Thus, an equation is obtained, which allows for describing with sufficient precision the dependence of the dynamic viscosity coefficient of the bituminous oil mixture of the Ashalchinsky field with solvent on the temperature of the mixture and concentration of the solvent.

4. Conclusions

  • A detailed analysis of rheological models of non-Newtonian fluids is performed. Due to a number of assumptions in existing rheological models (a limited number of rheological models, variability in model coefficients, etc.), it is proposed to supplement the standard list of rheological models with the Carreau model and the Ellis fluid model.
  • Complex experimental studies on rheological models of bituminous oil and a solvent (which is a low-viscosity carbon oil) mixture are carried out on the example of the Ashalchinsky field. On the basis of the conducted studies, a two-dimensional field of rheological models of the oil mixture is built, which allows for determining the rheological model of the pumped oil mixture depending on the concentration of the solvent and the temperature of the mixture, as at the design stage, and during the operational phase of the facility. This approach can be used successfully in other fields to improve the efficiency of oil transportation.
  • Formulas for predicting the rheological properties of the oil mixture on the basis of statistical processing of the results of experimental studies are theoretically substantiated. It is proven that the viscosity of binary oil mixtures in the Newtonian fluid field should be determined by a modified Arrhenius equation.

Author Contributions

Conceptualization, G.Z.; methodology, R.T.; software, V.P.; validation, G.Z., V.P. and R.T.; formal analysis, G.Z.; investigation, R.T.; resources, V.P.; data curation, L.R.; writing-original draft preparation, V.P.; writing—review and editing, L.R.; visualization, R.T.; supervision, V.P.; project administration, G.Z. and R.T.; funding acquisition, G.Z. and R.T. All authors have read and agreed to the published version of the manuscript.

Funding

This research received no external funding.

Data Availability Statement

The data presented in this study are available on request from the corresponding author.

Acknowledgments

The authors gratefully acknowledge the support of the Department of Transport and Storage of Oil and Gas, Saint Petersburg Mining University, and of the Department of Transport and Storage of Oil and Gas, Ufa State Petroleum Technological University.

Conflicts of Interest

The authors declare that they have no conflict of interest.

Nomenclature

τshear stress (Pa)
μcoefficient of dynamic viscosity (Pa∙s)
Vvelocity (m/s)
γ ˙ shear rate (s−1)
Ρdensity (kg/m3)
Ttemperature (K)
Νkinematic viscosity coefficient (m2/s)

References

  1. Longley, H. Conflicting Interests: Development Politics and the Environmental Regulation of the Alberta Oil Sands Industry, 1970–1980. Environ. Hist. 2021, 27, 97–125. [Google Scholar] [CrossRef] [Green Version]
  2. Hart, A. A review of technologies for transporting heavy crude oil and bitumen via pipelines. J. Pet. Explor. Prod. Technol. 2013, 4, 327–336. [Google Scholar] [CrossRef] [Green Version]
  3. Bekibayev, T.T.; Zhapbasbayev, U.K.; Ramazanova, I.G. Optimization of oil-mixture “hot” pumping in main oil pipelines. J. Physics Conf. Ser. 2017, 894, 012127. [Google Scholar] [CrossRef]
  4. Yaseen, M.; Rawat, S.K.; Kumar, M. Cattaneo–Christov heat flux model in Darcy–Forchheimer radiative flow of MoS2–SiO2/kerosene oil between two parallel rotating disks. J. Therm. Anal. Calorim. 2022, 147, 10865–10887. [Google Scholar] [CrossRef]
  5. Bekibayev, T.; Zhapbasbayev, U.; Ramazanova, G. Optimal regimes of heavy oil transportation through a heated pipeline. J. Process Control 2022, 115, 27–35. [Google Scholar] [CrossRef]
  6. Muñoz, J.A.D.; Ancheyta, J.; Castañeda, L.C. Required Viscosity Values To Ensure Proper Transportation of Crude Oil by Pipeline. Energy Fuels 2016, 30, 8850–8854. [Google Scholar] [CrossRef]
  7. Litvinenko, V.S.; Tsvetkov, P.S.; Dvoynikov, M.V.; Buslaev, G.V. Barriers to implementation of hydrogen initiatives in the context of global energy sustainable development. J. Min. Inst. 2020, 244, 428–438. [Google Scholar] [CrossRef]
  8. Jameel, M.F.; Sharife, W.A. Transportation of Heavy Crude Oil: A Review. Int. Res. J. Eng. Technol. (IRJET) 2020, 7, 5817–5823. [Google Scholar]
  9. dos Santos, R.G.; Brinceño, M.I.; Loh, W. Laminar pipeline flow of heavy oil–in–water emulsions produced by continuous in-line emulsification. J. Pet. Sci. Eng. 2017, 156, 827–834. [Google Scholar] [CrossRef]
  10. Lyu, Y.; Huang, Q.; Li, R.; Zhang, F.; Liu, L.; Zhang, H.; Zhang, Y.; Cui, Y.; Wang, Q. Effect of temperature on wall sticking of heavy oil in low-temperature transportation. J. Pet. Sci. Eng. 2021, 206, 108944. [Google Scholar] [CrossRef]
  11. Nikolaev, A.K.; Zaripova, N. Substantiation of analytical dependences for hydraulic calculation of high-viscosity oil transportation. J. Min. Inst. 2021, 252, 885–895. [Google Scholar] [CrossRef]
  12. Coelho, N.M.D.A.; Taqueda, M.E.S.; Souza, N.M.O.; de Paiva, J.L.; Santos, A.R.; Lia, L.R.B.; de Moraes, M.S.; Júnior, D.D.M. Energy savings on heavy oil transportation through core annular flow pattern: An experimental approach. Int. J. Multiph. Flow 2019, 122, 103127. [Google Scholar] [CrossRef]
  13. Yaseen, M.; Rawat, S.K.; Shafiq, A.; Kumar, M.; Nonlaopon, K. Analysis of Heat Transfer of Mono and Hybrid Nanofluid Flow between Two Parallel Plates in a Darcy Porous Medium with Thermal Radiation and Heat Generation/Absorption. Symmetry 2022, 14, 1943. [Google Scholar] [CrossRef]
  14. Shishlyannikov, D.; Zverev, V.; Ivanchenko, A.; Zvonarev, I. Increasing the Time between Failures of Electric Submersible Pumps for Oil Production with High Content of Mechanical Impurities. Appl. Sci. 2021, 12, 64. [Google Scholar] [CrossRef]
  15. Boda, M.A.; Bhasagi, P.N.; Sawade, A.S.; Andodgi, R.A. Analysis of Kinematic Viscosity for Liquids by Varying Temperature. Int. J. Innov. Res. Sci. Eng. Technol. 2015, 4, 1951–1954. [Google Scholar] [CrossRef]
  16. Isaev, A.A.; Aliev, M.M.O.; Drozdov, A.N.; Gorbyleva, Y.A.; Nurgalieva, K.S. Improving the Efficiency of Curved Wells’ Operation by Means of Progressive Cavity Pumps. Energies 2022, 15, 4259. [Google Scholar] [CrossRef]
  17. Abdollahpour, P.; Moradi, S.S.T.; Leusheva, E.; Morenov, V. A Numerical Study on the Application of Stress Cage Technology. Energies 2022, 15, 5439. [Google Scholar] [CrossRef]
  18. Han, S.-P.; Jiang, W.-X.; Zhang, J.-J. Approaches to predict viscosities of crude oil blends. J. Central South Univ. Technol. 2007, 14, 466–470. [Google Scholar] [CrossRef]
  19. Eleyedath, A.; Swamy, A.K. Prediction of density and viscosity of bitumen. Pet. Sci. Technol. 2018, 36, 1779–1786. [Google Scholar] [CrossRef]
  20. Yaseen, M.; Rawat, S.K.; Kumar, M. Falkner–Skan Problem for a Stretching or Shrinking Wedge With Nanoparticle Aggregation. J. Heat Transf. 2022, 144, 102051. [Google Scholar] [CrossRef]
  21. Frauenfeld, T.W.J.; Kissel, G.A.; Zhou, W.S. PVT and viscosity measurements for lloydminster-aberfeldy and cold lake blended oil systems. In Proceedings of the SPE International Thermal Operations and Heavy Oil Symposium and International Horizontal Well Technology Conference, Calgary, AB, Canada, 4–7 November 2002. [Google Scholar]
  22. Mehrotra, A.K. Viscosity of cold lake bitumen and its fractions. Can. J. Chem. Eng. 1990, 68, 348. [Google Scholar] [CrossRef]
  23. Aginey, R.V.; Firstov, A.A. Improving the method for assessment of bending stresses in the wall of an underground pipeline. J. Min. Inst. 2022, 257, 744–754. [Google Scholar] [CrossRef]
  24. Miadonye, A.; Dan-Ali, F.; Onwude, R.; Osirim, O.O. Study of the influence of asphaltenes on modeling of viscosity of Nigerian crude mixtures. WIT Trans. Model. Simul. 2011, 51, 133–144. [Google Scholar] [CrossRef] [Green Version]
  25. MacDonald, B.A.; Miadonye, A. Improvement on the Viscosity Models for the Effects of Temperature and Pressure on the Viscosity of Heavy Crude Oils. J. Chem. Eng. Data 2017, 62, 924–930. [Google Scholar] [CrossRef]
  26. Raupov, I.; Burkhanov, R.; Lutfullin, A.; Maksyutin, A.; Lebedev, A.; Safiullina, E. Experience in the Application of Hydrocarbon Optical Studies in Oil Field Development. Energies 2022, 15, 3626. [Google Scholar] [CrossRef]
  27. Zhang, C.; Zhao, H.; Hu, M.; Xiao, Q.; Li, J.; Cai, C. A Simple Correlation for the Viscosity of Heavy Oils From Liaohe Basin, NE China. J. Can. Pet. Technol. 2007, 46, 8–11. [Google Scholar] [CrossRef]
  28. Shu, W.R. A Viscosity correlation for mixtures of heavy oil, bitumen, and petroleum fractions. Soc. Pet. Eng. J. Repr. Ser. 2008, 61, 277–282. [Google Scholar] [CrossRef]
  29. Dzhemilev, E.; Shammazov, I.; Sidorkin, D.; Mastobaev, B.; Gumerov, A.; Arctic, S.C. Developing technology and device for the main pipelines repair with cutting out their defective sections. Oil Ind. 2022, 10, 78–82. [Google Scholar] [CrossRef]
  30. Litvinenko, V.S. Digital Economy as a Factor in the Technological Development of the Mineral Sector. Nat. Resour. Res. 2020, 29, 1521–1541. [Google Scholar] [CrossRef]
  31. Severa, L.; Havlíček, M.; Kumbár, V. Temperature dependent kinematic viscosity of different types of engine oils. Acta Univ. Agric. Silvic. Mendel. Brun. 2014, 57, 95–102. [Google Scholar] [CrossRef] [Green Version]
  32. Yui, S. Producing Quality Synthetic Crude Oil from Canadian Oil Sands Bitumen. J. Jpn. Pet. Inst. 2008, 51, 1–13. [Google Scholar] [CrossRef]
  33. Al-Maamari, R.; Vakili-Nezhaada, G.; Vatani, M. Experimental and Modeling Investigations of the Viscosity of Crude Oil Binary Blends: New Models Based on the Genetic Algorithm Method. J. Eng. Res. [TJER] 2015, 12, 81–91. [Google Scholar] [CrossRef] [Green Version]
  34. Rahmes, M.H.; Nelson, W.L. Viscosity Blending Relationships of Heavy Petroleum Oils. Anal. Chem. 1948, 20, 912–915. [Google Scholar] [CrossRef]
  35. Leusheva, E.; Morenov, V. Effect of Temperature Conditions in Arctic Offshore Oil Fields on the Rheological Properties of Various Based Drilling Muds. Energies 2022, 15, 5750. [Google Scholar] [CrossRef]
  36. Utting, N. Long-term column leaching study of centrifuged oil sands fine tailings. Environ. Earth Sci. 2021, 80, 462. [Google Scholar] [CrossRef]
  37. Jagoda, K.; Lin, X.; Wojcik, P. Enabling Chinese FDI in Canadian oil sands: Process and structure. Transnatl. Corp. Rev. 2018, 10, 268–279. [Google Scholar] [CrossRef]
  38. Maksarov, V.V.; Keksin, A.I.; Filipenko, I.A. Influence of magnetic-abrasive processing on roughness of flat products made of AMts grade aluminum alloy. Tsvetnye Met. 2022, 7, 82–87. [Google Scholar] [CrossRef]
  39. Wang, K.; Vredenburg, H.; Wang, J.; Xiong, Y.; Feng, L. Energy Return on Investment of Canadian Oil Sands Extraction from 2009 to 2015. Energies 2017, 10, 614. [Google Scholar] [CrossRef] [Green Version]
  40. Hounjet, L.J.; Xin, Q.; McDonald, R. Bitumen processing reduces diluent content of pipeline-transportable products and can mitigate impacts of spills into various water types. Fuel 2023, 331, 125826. [Google Scholar] [CrossRef]
  41. Xing, R.; Chiappori, D.V.; Arbuckle, E.J.; Binsted, M.T.; Davies, E.G.R. Canadian Oil Sands Extraction and Upgrading: A Synthesis of the Data on Energy Consumption, CO2 Emissions, and Supply Costs. Energies 2021, 14, 6374. [Google Scholar] [CrossRef]
  42. Lin, R.; Zhang, J.; Li, X.; Wang, X.; Yang, Y.; Xu, D.; Zhang, J. Rules of paraffin deposit and comparative study on hot washing technology. J. China Univ. Pet. (Ed. Nat. Sci.) 2022, 46, 155–162. [Google Scholar] [CrossRef]
  43. Sultanbekov, R.R.; Schipachev, A.M. Manifestation of incompatibility of marine residual fuels: A method for determining compatibility, studying composition of fuels and sediment. J. Min. Inst. 2022, 257, 843–852. [Google Scholar] [CrossRef]
  44. Mardashov, D.V.; Bondarenko, V.; Raupov, I.R. Technique for calculating technological parameters of non-Newtonian liquids injection into oil well during workover. J. Min. Inst. 2022, 254, 1–14. [Google Scholar] [CrossRef]
  45. Xu, B. Influencing factors governing paraffin wax deposition of heavy oil and research on wellbore paraffin remover. Pet. Sci. Technol. 2018, 36, 1635–1641. [Google Scholar] [CrossRef]
  46. Haj-Shafiei, S.; Mehrotra, A.K. Achieving cold flow conditions for ‘waxy’ mixtures with minimum solid deposition. Fuel 2019, 235, 1092–1099. [Google Scholar] [CrossRef]
  47. Quan, Q.; Gong, J.; Wang, W.; Wang, P. The Influence of Operating Temperatures on Wax Deposition During Cold Flow and Hot Flow of Crude Oil. Pet. Sci. Technol. 2015, 33, 272–277. [Google Scholar] [CrossRef]
  48. Zhang, L.; Du, C.; Wang, H.; Zhao, J. Three-dimensional numerical simulation of heat transfer and flow of waxy crude oil in inclined pipe. Case Stud. Therm. Eng. 2022, 37, 102237. [Google Scholar] [CrossRef]
  49. Dmitrieva, D.; Cherepovitsyna, A.; Stroykov, G.; Solovyova, V. Strategic Sustainability of Offshore Arctic Oil and Gas Projects: Definition, Principles, and Conceptual Framework. J. Mar. Sci. Eng. 2021, 10, 23. [Google Scholar] [CrossRef]
  50. Melissianos, V.E. Onshore Buried Steel Fuel Pipelines at Fault Crossings: A Review of Critical Analysis and Design Aspects. J. Pipeline Syst. Eng. Prac. 2022, 13, 03122002. [Google Scholar] [CrossRef]
  51. Tikariha, L.; Sanyal, A.; Kumar, L. Numerical study of gelation and flow restart in a waxy crude oil riser. J. Pet. Sci. Eng. 2022, 217, 110871. [Google Scholar] [CrossRef]
  52. Kelbaliyev, G.I.; Salavatov, T.S.; Rasulov, S.R.; Mamedova, E.V. Rheology of Structured Non-Newtonian Oils in the Gas-Lift Recovery Method. J. Eng. Phys. 2021, 94, 143–150. [Google Scholar] [CrossRef]
  53. Palyanitsina, A.; Safiullina, E.; Byazrov, R.; Podoprigora, D.; Alekseenko, A. Environmentally Safe Technology to Increase Efficiency of High-Viscosity Oil Production for the Objects with Advanced Water Cut. Energies 2022, 15, 753. [Google Scholar] [CrossRef]
  54. Ghoneim, N.I.; Megahed, A.M. Numerical Analysis of the Mixed Flow of a Non-Newtonian Fluid over a Stretching Sheet with Thermal Radiation. Fluid Dyn. Mater. Process 2023, 19, 407–419. [Google Scholar] [CrossRef]
  55. Yang, C.; Wang, Z.; Yang, Z.; Hollebone, B.; Brown, C.E.; Landriault, M.; Fieldhouse, B. Chemical Fingerprints of Alberta Oil Sands and Related Petroleum Products. Environ. Forensics 2011, 12, 173–188. [Google Scholar] [CrossRef]
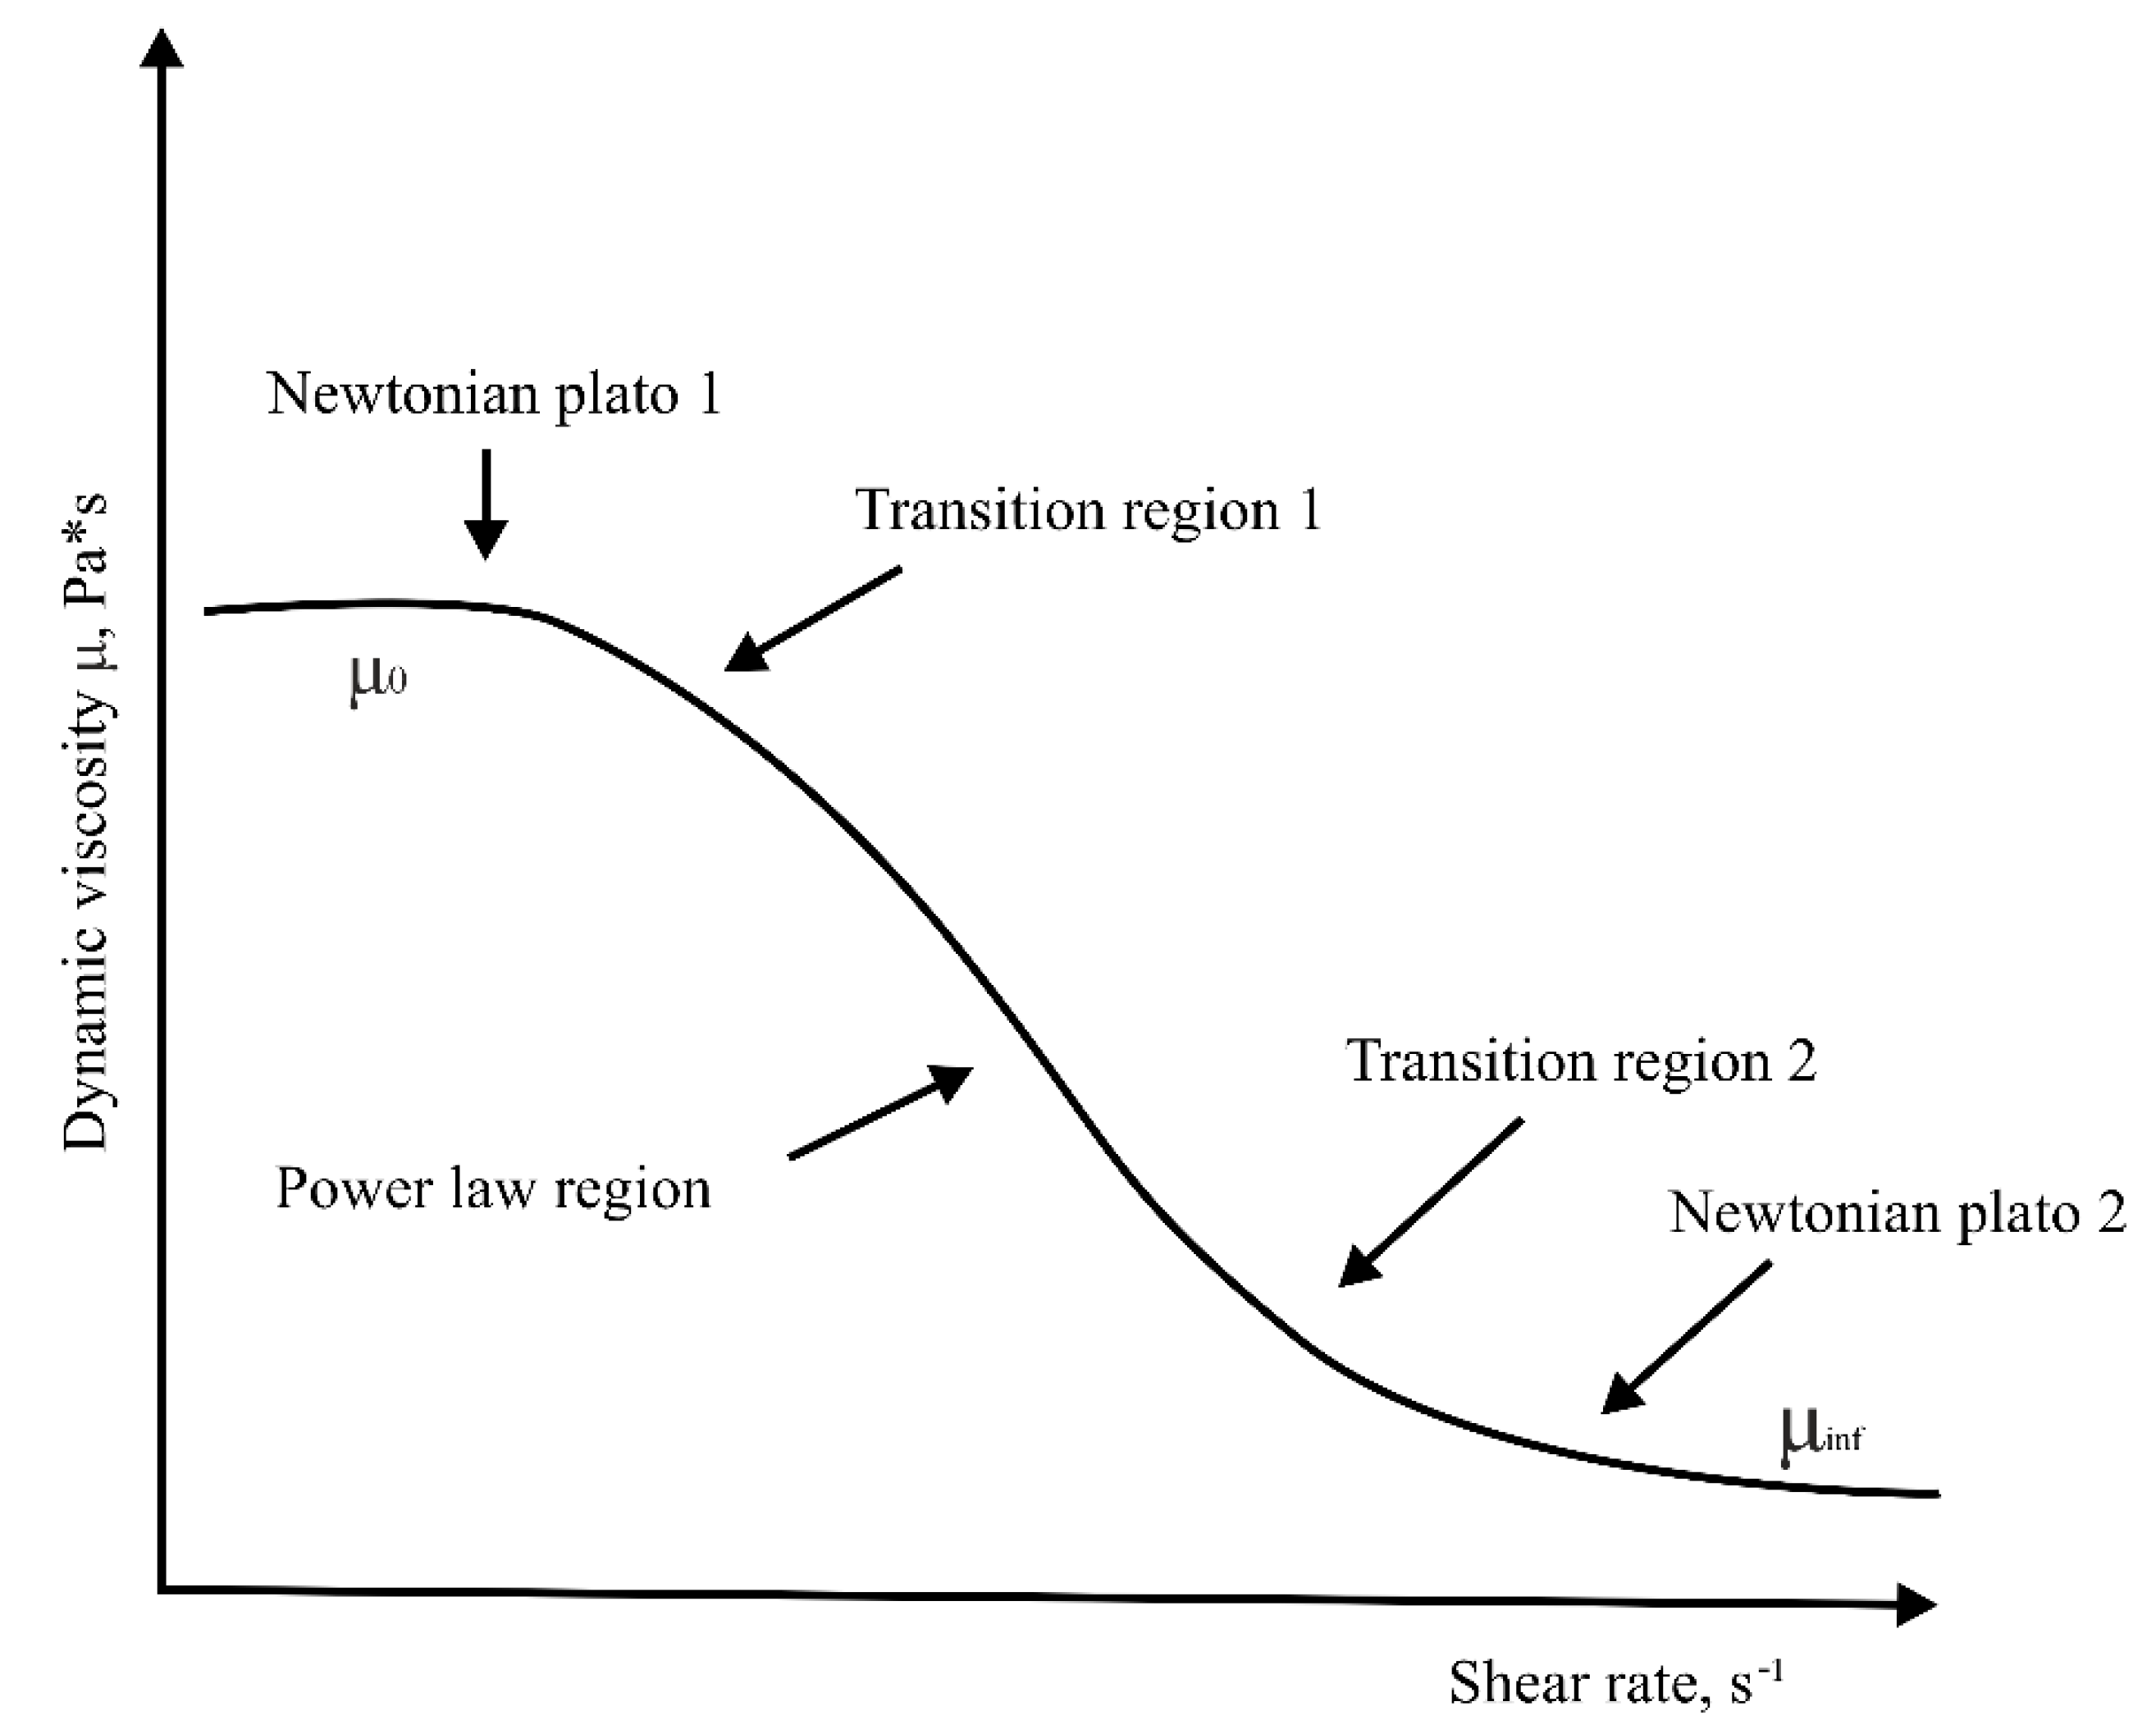
Figure 1. General graphical representation of the Carreau model in the axes «dynamic viscosity coefficient–shear rate».
Energies 16 00395 g001
Figure 2. The general view of the rotary rheometer «Kinexus ultra+».
Energies 16 00395 g002
Figure 3. «Map» of rheological models of bituminous and low-viscosity oil mixture from the Ashalchinsky field at different temperatures and concentrations of solvent.
Energies 16 00395 g003
Figure 4. The distribution of values of dynamic viscosity coefficient obtained for Newtonian models in the space «dynamic viscosity coefficient»–«temperature of mixture»–«concentration of solvent».
Energies 16 00395 g004
Figure 5. Experimental values of dynamic viscosity coefficient and surface constructed according to Equation (18) in the space «dynamic viscosity coefficient–temperature of mixture–concentration of solvent».
Energies 16 00395 g005
Table 1. Data on the type and volume of transported products by the North American pipeline system [17].
Name of Pipeline SystemType of Transported ProductVolume of Transported Product, mln. Barrels per Day
EnbridgeLight1.08
Heavy1.25
Trans CanadaMixture of light and heavy oil (25%/75%)0.59
Kinder Morgan
Trans Mountain
Mixture of light and heavy oil (80%/20%)0.30
Kinder Morgan ExpressMixture of light and heavy oil (35%/65%)0.28
Table 2. Rheological models of non-linear viscous media [22].
Model NameModel Equation
Newton’s τ = μ ·   γ ˙
Shwedov–Bingham τ = τ 0 + μ ·   γ ˙
Ostwald–de Waele’s τ = Κ ·   γ ˙ n
Herschel–Bulkley τ = τ 0 + Κ ·   γ ˙ n
Prandtl’ τ = arcsin (   γ ˙ / Β )
Powell–Eyring τ = A ·   γ ˙ + Β · arcsh ( C ·   γ ˙ )
Rabinovich’s τ = μ 0 1 + c · τ 2 ·   γ ˙
Siscoe’s τ = α ·   γ ˙ + b ·   γ ˙ c
De Haven’s τ = μ 0 1 + c · τ n ·   γ ˙
Reiner–Filippov τ = ( μ + μ 0 μ 1 + ( τ / A ) 2 ) ·   γ ˙
Kross’s τ = ( μ + μ 0 μ 1 + α · γ 2 / 3 ) ·   γ ˙
Meyer’s τ = ( μ + μ 0 μ 1 + ( τ τ m ) a 1 ) ·   γ ˙
Casson’s τ = ( k 0 + k 1 ·   γ   ˙ ) 2
Schulman’s τ = ( τ 0 n + μ ·   γ   ˙ m ) n
Reimer ‘s   γ ˙ = n = 0 a 2 n · τ 2 n + 1
Table 3. Rheological models of non-Newtonian fluid flow.
Model NameEquationNote
Newton’s
Shwedov–Bingham
τ = μ   γ ˙ Newtonian fluid model,
model complexity n = 1
τ = τ 0 + μ   γ ˙ Model complexity n = 2
Ostwald–de Waele’s τ = K γ n ˙ Power model,
model complexity n = 2
Herschel–Bulkley τ = τ 0 + K γ n ˙ Model complexity n = 3
Table 4. Temperature-dependent Cold Lake bitumen oil density.
Temperature, KDensity, kg/m3
288.151012
295.151001
313.15997
343.15978
Table 5. Temperature-dependent Cold Lake bitumen oil dynamic viscosity coefficient.
Temperature, KDynamic Viscosity Coefficient, mPa·s
284.051,850,000
293.35350,167
303.0581,006
312.6522,788
322.158625
331.753477
341.251568
350.75777.6
360.25420.7
Table 6. Models for determining the viscosity of binary oil mixtures [33].
Model Name
(Year of Appearance)
Model Equation
Arrhenius (1887) log ( υ mix ) = V mix · log ( υ A ) + V B · log ( υ B ) .
Bingham (1914) 1 υ mix = V A · 1 υ A + V B · 1 υ B .
Koval (1963) ν mix 0.25 = V A · ( ν A 0.25 ) + V B · ( ν B 0.25 ) .
Parkash (2003) υ mix = exp ( exp ( I P + 157.45 376.38 ) ) 0.93425 ,
I P = V A · I P A + V B · I P B ,
I P i = 157.43 + 379.38 · ln ln ( υ i + 0.93425 ) .
Refutas (1989) υ mix = exp ( exp ( I R 10.975 14.534 ) ) 0.8 ,
I R = W A · I R A + W B · I R B ,
I R i = 10.975 + 14.534 · ln ln ( υ i + 0.8 ) .
Maxwell (1950) υ mix = exp ( exp ( I M 50.58959 21.8373 ) ) 0.8 ,
I RM = V A · I M A + V B · I M B ,
I M i = 59.58959 21.8373 · ln ln ( υ i + 0.8 ) .
Wallace and Henry (1987) υ mix = 0.01 · exp ( 1 I WH ) ,
I WH = W A · I WH A + W B · I WH B ,
I WH i = 1 ln ( υ i 0.01 ) .
Chevron (2005) υ mix = 10 ( 3 · I C 1 I C ) ,
I C = V A · I C A + V B · I C B ,
I C i = log ( υ i ) 3 + log ( υ i ) .
Cragoe (1933) υ mix = 0.0005 · exp ( 1000 · ln ( 20 ) I C r ) ,
I Cr = W A · I Cr A + W B · I Cr B ,
I Cr i = 1000 · ln ( 20 ) ln ( υ i 0.0005 ) .
Latour/Miadonye (2000) υ mix = exp   ( exp ( a · ( 1 W B n ) + ln ( υ B ) 1 ) ) ,
a=ln(ln( υ A ) ln ( υ B ) +1)),
n= υ B 0.09029 · υ B + 0.1351
Shan-Peng №1 (2007) log ( log ( υ mix ) ) = V A · log ( log ( υ A ) ) +
+ V B · log ( log ( υ B ) ) + C AB · V A · V B ,
C AB = 0.0613 · ( log ( υ A ) + log ( υ B ) ) + 0.134 .
Shan-Peng №2 (2007) log ( log ( υ mix ) ) = V A · log ( log ( υ A ) ) +
+ V B · log ( log ( υ B ) ) + C AB · V A · V B ,
C AB = 0.0644 · ( log ( υ A ) + log ( υ B ) ) + 0.1706 .
Al-Besharah (1989) ln ( υ mix ) = V A · ln ( υ A ) + V B · ln ( υ B )
4.976 · 10 3 · V A · V B · ( API A API B ) 2 .
Table 7. The main technical characteristics of the rotary rheometer «Kinexus ultra+».
ParameterValue
Modes of operationDirect deformation control, shear rate control, shear stress control
Torque range5 nN·m–250 mN·m (viscosimetry–shear speed and stress monitoring)
Torque range0.5 nN·m–250 mN·m (oscillation–shear deformation and stress control)
Moment resolution0.05 nN·m
Position resolution<10 nrad
Table 8. The main technical characteristics of the rotary rheometer «Kinexus ultra+».
Model NameEquationModel Parameters
Ostwald de Waele model or power-law τ = K γ n ˙ τ—shear stress;
  γ ˙ n —shear rate;
K—consistency index;
n—flow index;
μ—Newtonian viscosity;
μ 0 , μ inf —dynamic viscosity coefficient for γ ˙ →0 and for γ ˙ →∞, respectively;
τ 1 2 —shear stress at μ = μ 0 2 ;
α —key parameter associated with flow index α = 1 n ;
b—relaxation time;
c—index.
Ellis fluid model μ = μ 0 1 + ( τ τ 1 2 ) α 1
Carreau model μ = μ inf + ( μ 0 μ inf ) 1 + ( 1 + ( b · γ ˙ ) 2 ) c 1 2
Table 9. Results of experimental studies on rheological properties of the bituminous and low-viscosity oil mixture of the Ashal’chin field.
θsolvent, %Tmix, KShear Rate Boundaries, 1/sRheological ModelModel
Parameters
Figure
(Table 3)
75283.151–300Ostwald de Waele model or power-lawK = 0.6381
n = 0.995
75278.151–300Ostwald de Waele model or power-lawK = 1.0062
n = 0.991
50293.151–300Ostwald de Waele model or power-lawK = 0.4363
n = 0.990
50283.151–300Ostwald de Waele model or power-lawK = 1.01544
n = 0.991
50278.1510–300Ellis fluid model μ 0 = 1.5735
τ 1 2 = 3984.220
α = 2.435
25293.1510–300Ellis fluid model μ 0 = 1.2426
τ 1 2 = 1503.811
α = 3.851
25283.1510–300Ellis fluid model μ 0 = 3.3977
τ 1 2 = 2131.171
α = 3.711
25278.1510–300Ellis fluid model μ 0 = 5.9118
τ 1 2 = 2706.125
α = 3.464
0303.1510–300Ellis fluid model μ 0 = 1.0709
τ 1 2 = 1411.198
α = 3.991
0293.1510–300Ellis fluid model μ 0 = 2.75210
τ 1 2 = 1930.464
α = 3.890
0283.1510–300Ellis fluid model μ 0 = 8.63211
τ 1 2 = 2665.803
α = 5.027
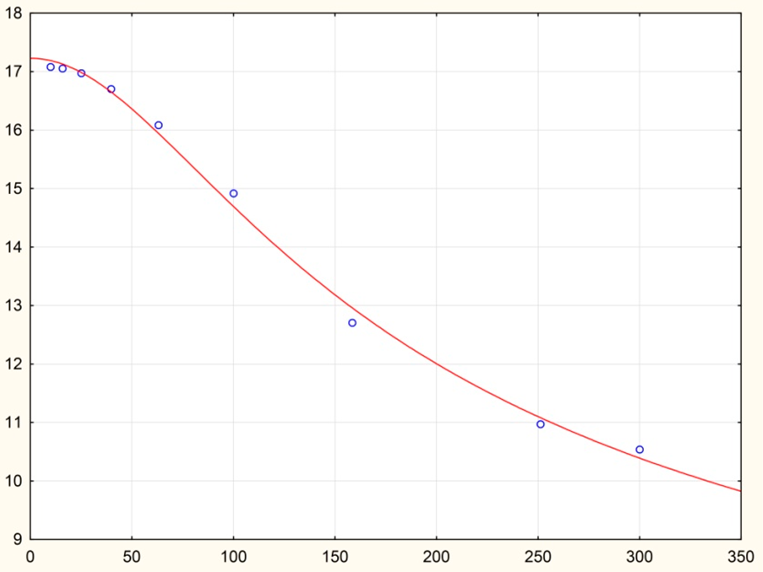
0278.1510–300Carreau model μ inf = 3.30912
μ 0 = 17.228
b   = 0.01
c = 0.405
Table 10. Graphical representation of the dynamic viscosity coefficient dependence on the shear rate gradient (*—dynamic viscosity coefficient dependence on shear stress).
12
Energies 16 00395 i001Energies 16 00395 i002
34
Energies 16 00395 i003Energies 16 00395 i004
5 *6 *
Energies 16 00395 i005Energies 16 00395 i006
7 *8 *
Energies 16 00395 i007Energies 16 00395 i008
9 *10 *
Energies 16 00395 i009Energies 16 00395 i010
11 *12
Energies 16 00395 i011Energies 16 00395 i012
Table 11. Comparison of experimental data on the dynamic viscosity coefficient of the oil mixture with the results obtained from Equation (18).
Solvent Concentration, Unit FractionsOil Mixture Temperature, KExperimental Values of Dynamic Viscosity Coefficient of Petroleum Mixture, mPa·sDynamic Viscosity Coefficient Values According to Equation (18), mPa·sThe Difference between the Experimental Values of the Dynamic Viscosity Coefficient and the Values Obtained by Equation (18), mPa·sRelative Error, %
0.5293.15274.9000274.22370.676260.246
0.75303.15142.2000143.4942−1.294250.910
0.75313.1585.000083.91681.083161.274
0.75333.1537.800040.0621−2.262125.984
0.5303.15211.0000213.8619−2.861861.356
0.5313.15119.7000114.89894.801094.011
0.5333.1547.600046.29531.304732.741
0.25303.15535.3000534.73290.567080.106
0.25313.15262.9000263.9292−1.029230.391
0.25333.1589.400089.7520−0.352010.394
Disclaimer/Publisher’s Note: The statements, opinions and data contained in all publications are solely those of the individual author(s) and contributor(s) and not of MDPI and/or the editor(s). MDPI and/or the editor(s) disclaim responsibility for any injury to people or property resulting from any ideas, methods, instructions or products referred to in the content.