Article

The Effect of Pore Structure on the Distribution of Wet Gases in Coal Seams of Enhong Syncline, SW China

1
Key Laboratory of Coalbed Methane Resources and Reservoir Formation Process, Ministry of Education, China University of Mining and Technology, Xuzhou 221008, China
2
School of Resources and Earth Science, China University of Mining and Technology, Xuzhou 221116, China
*
Author to whom correspondence should be addressed.
Energies 2023, 16(1), 432; https://doi.org/10.3390/en16010432
Submission received: 11 November 2022 / Revised: 4 December 2022 / Accepted: 16 December 2022 / Published: 30 December 2022
(This article belongs to the Special Issue Advances in Simultaneous Exploitation of Coal and Associated Energy)

Abstract

:
The origin of the high content of wet gases in coalbed seams is very important geologically, especially in the Enhong syncline in China. The present study focuses on the role of the material that generates the hydrocarbons. The effect of the pore structure on the generation of wet gases has not been thoroughly examined. The present paper characterizes the coal pore structure in the “wet gas area” and “dry gas area”. The pore structures in the two areas are shown to have different features, which affect the distribution of the wet gases. With respect to the pore structure parameters, coals in the wet gas area have a greater total specific surface area and pore volume in micropores. The pore structure types also differ between the two areas: the pore structures in the dry gas areas are mainly of the parallel type and reverse S type, which is favorable for the migration and dissipation of coalbed gases. The pore structure in the wet gas area is relatively closed, with poor connectivity and susceptibility to blockage. The micropore volume, total specific surface area, and the connectivity of the pore structure significantly affect the reserve of wet gases. The adsorption capacity of the micropores and the closed pore structure contribute to the preservation of wet gases.

1. Introduction

Coalbed methane (CBM) is gas stored in coal seams, with methane as the main component, which forms a significant part of natural gas reserves [1]. There are abundant CBM resources in China amounting to about 36.81 trillion m3 in coals within a depth of 2000 m [2]. Coals in the Enhong syncline are also rich in CBM resources, with 61.3 billion m3 of CBM in coalbeds of depth less than 2000 m, with good prospects for their exploitation and development [3,4]. The composition of CBM in Enhong syncline is characterized by a high content of wet gases, which, in some locations, represents more than 30% of total gases [5,6]. Coal seams containing a high concentration of wet gases are concentrated in four zones with a NW–SE direction distribution in the Enhong syncline, known as the “wet gas area” [6]. CBM outside these zones, known as the “dry gas area”, is almost dry and contains little wet gas. The dryness (C1/(C1 + C2 + C3)) is between 95.73% to 100% in the dry gas area [7] and is as low as 85.47% in the wet gas area [8].
The coal pore structure has an important effect on the generation and formation of the CBM reservoir [9,10]. The characteristics of pores include the specific surface area, the pore volume, the pore type, and the pore size distribution [11]. Porosity plays an important role in CBM extraction, gasification, and migration [12,13]. The coal structure deformation and pore-fracture distribution of coal affect the coal permeability and the exploitation of the CBM reservoir [14,15].
The coal pore structure can affect the coal gas content [16,17,18] and the coal hydrocarbon content [19,20]. Chen investigated the relationship between the abnormally high concentration of wet gases and the coal pore structures in anthracite from the Guizhou province and found that wet gases mainly occurred in closed holes [21]. The coals in the Enhong syncline have considerable potential for CBM extraction. To investigate the effect of the pore structure on the distribution of wet gases, the characteristics of the pore structure in the Enhong syncline are analyzed.
The coal-bearing strata in the Enhong syncline are the Xuanwei formation of the upper Permian (P2x) and are deposited in continental to marine-continental transitional facies. The coal-bearing area is 485 km2. The thicknesses of the strata are between 200 m to 300 m. Most of the buried depths of the strata are less than 1000 m. The lithology is dominated by mudstone, sandy mudstone, fine siltstone, argillaceous sandstone, and coal seams. There are 18 to 73 layers of the coal seam that have been developed in the coal-bearing strata, most of which are thin and unstable. Coal seams No. 9, No. 16, and No. 23 are thick and stable and are the main coal seams that have been used for early CBM exploration and development. Analysis of cores indicates that most of the coal in the Enhong area comprises bright coal and semi-bright and semi-dull coal, with some dull coal. Plant fossils can be seen in the coal. The maximum vitrinite reflectance Ro,max of the coal in the Enhong syncline is between 1.14% and 1.88%, corresponding to medium-rank coal, ranging from fat coal to lean coal. The ash content of the coal is generally less than 20% but is slightly higher in the upper and lower coal seams. The volatile content in coal accounts for about 25% of the total content. Generally, the moisture content does not exceed 1% [22].
The geological structure of the Enhong syncline is relatively complicated (Figure 1). The main structure is a large synclinorium, which is composed of the Enhong synclinorium and the Pingguan–Daping synclinorium. The overall axial direction of the Enhong syncline is NNE-SSW, but it has an SN direction in the north. The western boundary of the Enhong syncline is the Fuyuan-Mile fault. The other boundaries include the bottom of the Xuanwei formation and some boundary faults. The latest stratum is T1y-T2g in the syncline core, which changes to T1f, T1k, P2x, and P2β, P1 in the syncline wing. The stratigraphic dip angle is relatively gentle and the faults are widely developed. The fault strikes are mostly in the NNE, SN, and NE directions. The Fuyuan-Mile fault in the northwest controls the whole area. Affected by the boundary fault, the burial depth of the strata is deeper in the northeast and shallower in the southwest.
The structure of coal in the Enhong syncline is relatively complex because of the strong tectonism. The coal is mainly composed of primary structure coal and cataclastic coal and contains granulitic coal and mylonitic coal in some regions. The coal is loose and fragile, and developed a complex pore-fracture structure in it. Most of the fissures are filled with calcite. The structure of coal has an important effect on the exploration and production of CBM.

2. Samples and Methods

The composition of CBM is collected from 1208 boreholes drilled in the geological exploration stage, in which 224 coal samples have a relatively high content of wet gases. These wet gases concentrate in four zones which are called “wet gas area”. In order to study the pore structure of the coals, 32 coal samples have been collected from coalmines in the Enhong syncline. The 32 coal samples are from different part of the Enhong syncline. Some samples are from the wet gas area and dry gas area respectively, and some are from other places whose CBM composition is unknown.
The coals in the wet gas areas are from the Daping coalmine, Hetaochong coalmine, Laoshuzhuo coalmine, Xiangda coalmine, and Xinxin coalmine. The coals in the dry gas area are from the Enhong coalmine, Jieke coalmine, and Nazuo coalmine. The CBM composition of coals from the Alingde coalmine and Sipaier coalmine have not been tested. The microscopic characteristics of these samples are observed under the reflected light of a polarizing microscope (Figure 2). The Ro,max of coals are tested by the microscope Imager. M1m. The Ro,max of coals are from 0.99 to 1.81, corresponding to fat coal, coking coal, and lean coal. Coking coal is the main coal, accounting for the largest proportion.
The pore structure character is studied with the mercury intrusion porosimetry on the 32 coal samples. The mercury intrusion porosimetry determines the size and distribution of pores by making the mercury overcome the surface tension and enter into coal pores under external pressure. The mercury under greater pressure can enter into a smaller size hole. The pore volumes of different pore sizes are tested by measuring the volumes of mercury entering the coal under different pressures.
The mercury intrusion porosimetry is conducted in the Key Laboratory of Coalbed Methane Resources and Reservoir Formation Process under the AutoPore IV 9500 type Mercury Injection Apparatus (Figure 3). The maximum mercury injection pressure is 413 MPa while the terminational mercury withdrawal pressure is about 0.1 MPa. The testing pore size scope is between 3 nm and 0.18 mm. The pore size is classified into macropores (1000 to <100,000 nm), mesopores (100 to <1000 nm), transitional pores (10 to <100 nm), and micropores (<10 nm) according to the standard set by Hotot [23].

3. Results and Discussion

3.1. Pore Structure Parameters

Pore structure parameters include the pore volume, the pore-specific surface area, the median pore diameter, and the porosity (Table 1). They have important effects on the gas storage capability of coal and its permeability.
The total pore volume is the volume of all the pores contained in per unit weight coal. It is an important parameter to reflect the gas storage capacity of coal and the degree of damage to the coal seam. The total pore volume in the Enhong syncline is between 25.8 mm3/g and 92.5 mm3/g, an average of 46.5 mm3/g. The average value of the total pore volume in the wet gas area is 49.4 mm3/g, while it is 47.5 mm3/g in the dry gas area. The total pore volumes in the two areas are very close. There is not much difference between them.
The pore-specific surface area is the internal surface area of pores contained in per unit weight coal. It is closely related to the particle size, shape, surface defects, and pore structure of coal. Generally, coal with a larger pore-specific surface area has a stronger adsorption capacity. The total pore-specific surface area in the Enhong syncline is between 9.9 m2/g and 25.5 m2/g, an average of 15.7 m2/g. The total pore-specific surface area in the wet gas area is from 10.9 m2/g to 25.5 m2/g, an average of 17.9 m2/g. It is from 9.9 m2/g to 17.6 m2/g in dry gas area, an average of 14.2 m2/g, which is distinctly lower than that in the wet gas area (Figure 4). Coal with a more pore-specific surface area has better adsorption capacity, which is conducive to the storage of wet gases.
The median pore size is the average pore size corresponding to half of the total pore volume. It is an important parameter to reflect the distribution character of pore sizes. The median pore size in the Enhong syncline is between 8.9 nm and 1174.2 nm, an average of 96.8 nm. It is between 8.9 nm and 450.7 nm in the wet gas area, an average of 59.6 nm, while it is from 10.4 nm to 1174.2 nm in the dry gas area, an average of 170.0 nm. The median pore size is obviously smaller in the wet gas area (Figure 5). It reflects that pores of smaller size in the wet gas area account for a larger proportion.
Porosity is the percentage of the total pore volume to the total coal volume. Mercury injection test is used to study the porosity (pore size between 3 nm and 0.18 mm) of coal samples. Porosity in the dry gas area is between 3.5% and 9.3%, an average of 5.9%. It is between 3.9% and 10.7% in the wet gas area, an average of 5.9%. There is not much difference between the two areas.
According to the pore structure parameters above, there is no significant difference in the total pore volume and the porosity between the dry gas area and the wet gas area. However, the median pore diameter and the total pore-specific surface area in the two areas are distinctly different. Coals in the wet gas area have more total pore-specific surface area than coals in the dry gas area under the same pore volume (Figure 6). Coals in the wet gas area have smaller values of median pore diameter than those in the dry gas area under the same pore volume (Figure 7). It indicates that coals in the two areas contain a similar number of pore volumes, but have different distributions of pore size.
Under the same pore volume, coals with smaller median pore diameters have a larger proportion of smaller size pores such as micropores. Coals with a larger proportion of micropores and more pore-specific surface area have stronger adsorption capacity on coalbed gases. This adsorption capacity is beneficial to the conservation of coalbed gases. Coals in the wet gas area have a bigger total pore-specific surface area and smaller median pore diameter. It indicates that coals in this area have stronger adsorption capacity and conservation facility of wet gases.

3.2. Pore Structure

The pore structure is divided into macropore, mesopore, transitional pore, and micropore according to its size [23]. The pore structure of coal in the wet gas area is dominated by micropores, with an average proportion of 43.1% (Table 2), followed by transitional pores, with an average of 26.9%. The proportion of macropore and mesopore are 17.5% and 12.5% respectively. The pore structure of coal in the dry gas area is also dominated by micropores, with an average proportion of 39.0%, followed by macropores, with an average of 24.1%. The proportions of transitional pore and mesopore are 23.8% and 13.1%, respectively.
Though micropore is the main pore size in both areas (Table 2), the proportions of the pores are very different. Coals in the wet gas area have larger proportions of micropore and transitional pore. The adsorption pores composed of micropores and transition pores with pore sizes smaller than 100 nm account for 70.0%, which is conducive to the occurrence of coalbed gases. Coals in the dry gas area have a lot of macropores, which are beneficial to the migration of coalbed gases. The proportions of mesopore in both areas have little difference.
In the results of the mercury intrusion porosimetry, the shape of the mercury injection curve and mercury ejection curve can reflect the characteristics of pore size distribution, pore connectivity, and pore structure [19,24]. The relationship between the pore size and the phase pore volume can clearly show the proportion of pore volume in different pore size ranges (Figure 8 and Figure 9). According to the curve of mercury injection and ejection, the pore structure of coal in western Guizhou and eastern Yunnan province is divided into five types by Li [14]. The five types of pore structures have different pore characteristics. There are four types of pore structures in the Enhong syncline: parallel type, reverse S type, double S type, and double curvature type (Figure 8 and Figure 9).
The types of pore structures are classified by the characteristic of mercury injection and ejection curve, and the distribution of the stage pore volume (Figure 8 and Figure 9). In the parallel type, the mercury injection curve and the ejection curve are linear and nearly parallel to each other in most sections. Their volume difference at the same pressure point is very small. The change of stage pore volume with the increase in pore size is very uniform. In the reverse S type, the mercury injection curve shows an inverse S shape. The main sections of the mercury ejection curve decrease linearly. The stage pore volume decreases first and then increases with the increase of pore size, and reaches its minimum value at the transitional pores and mesopores stage (Figure 9). In the double S type, the mercury injection and the ejection curve are S shape and inverse S shape respectively. The stage pore volume increases first and then decreases with the increase of pore size, and reaches its maximum value at the mesopores stage (Figure 9). In the double curvature type, the mercury injection and the ejection curve are a downward convex arc shape. The stage pore volume decreases exponentially with the increase in pore size.
The pore structure in the Enhong syncline is mainly parallel type. Coals with parallel-type pore structures are mainly primary structural coal and cataclastic structural coal. Pores are mainly micropores, followed by transitional pores. The pore volume of mesopore and macropore is small, and the change of the stage pore volume with the pore size is relatively uniform. The mesopores and macropores with pore diameters greater than 100 nm are not developed. The stage pore volume from macropore to micropore grows similarly to a stepladder. The porosity and pore volume are very low. The mercury ejection curve is similar to the mercury injection curve. The mercury removal efficiency is very high, which indicates that the number of pore throat connected with pores is small.
Though the pore structure of coal in the wet gas area and dry gas area are both mainly the parallel type, the pore size distributions of the two areas are different in this type (Figure 10). The pore volume curves of micropores and transitional pores in the wet gas area are significantly higher than those in the dry gas area (Figure 10). The macropore in the dry gas area are relatively more developed.
The pore structure of reverse S type and double S type mainly appeared in the dry gas area (Figure 10). Coals with reverse S type are mainly primary structural coal and cataclastic structural coal. In this type, the macropore and micropore are well-developed, followed by the transitional pore (Figure 10). The volume of the mesopores is the least. The pore volume of this type decreases first and then increases with the increase of pore size, and reaches the lowest value at the transitional pole and macropore stages (Figure 10). In the reverse S type, the values of porosity and pore volume are relatively high. The mercury withdrawal efficiency is also high, which reflects that the pore connectivity of coal is good. The reverse S type in the wet gas area also has the characteristic of well-developed micropores and transitional pores.
Coals with pore structures of the double S type are mainly mylonitic structural coal and mortar structural coal. In this type, the pore size is dominated by mesopore, followed by macropore and transition pore. The proportion of micropore is the least (Figure 10). The stage pore volume increases first and then decreases with the increase of pore size, and reaches its maximum value at the mesopore stage (Figure 10). Due to the abnormal distribution of pore size, the values of porosity and pore volume are very high, but the mercury withdrawal efficiency is relatively low. It indicates that the pore connectivity of this type of coal is poor.
The double curvature type mainly appears in the wet gas area. Coals with this type of pore structure are mainly mylonitic structural coal, wrinkle structural coal, and squamate structural coal. The pore size is dominated by transition pores, followed by micropores. The development of mesopores and macropores is relatively poor. The stage pore volume tends to decrease with the increase in pore size. Mercury withdrawal efficiency of this type is relatively low. The pore of the coal is relatively closed. The connectivity of the pore is poor.

3.3. Effect of Pore Structure on the Concentration of Wet Gases

The effect of pore structure on the concentration of wet gases and gas outbursts has attracted extensive attention in coal geology and gas geology. The concentrations of wet gases in the structural coal of gas burst area are obviously higher than that in the primary structural coal of non-gas burst area [25,26]. Chen et al. found that wet gases can be preserved in the closed pores of coal by analyzing the pore structure of anthracite in Guizhou province of China [21]. A closed pressure system and lacking exchange with external materials make the closed pores protect the wet gases from being cracked by high temperatures. Just as inclusions can protect the organic matter in it. Thus, the thermal evolution degree of bitumen in the inclusions is lower than free bitumen in the same layer [27].
Pore structure plays an important role in the occurrence of wet gases. Compared with the coal in the dry gas area, the coal in the wet gas area has a larger pore-specific surface area, larger pore volume of micropore and transitional pore, and less pore volume of macropore. The coal can absorb organic hydrocarbons because of the active substance on the surface. Hydrocarbon gases with larger molecular weights are easier to be absorbed. The quantity of the gases absorbed by the coal is related to the pore-specific surface area and the distribution of pore size. The micropore which has the characteristic of chemisorption is the main absorption space in coal. It has great effects on the composition of hydrocarbon gases [26,28,29]. Therefore, more micropores and pore-specific surface areas in the coal of the wet gas area make the coals in this area have more adsorption capacity of wet gases. This will contribute to the preservation of wet gases.
The pore structure also plays a crucial part in the preservation of wet gases through pore connectivity. The mercury withdrawal efficiency could reflect the diameter ratio of the pore throat and the influent property of coal [30,31]. In the four pore types above, the efficiency of the mercury ejection decreases from parallel type, reverse S type, and double S type, to double curvature type. It indicates that the pore connectivity of coal becoming worse from parallel type to double curvature type. Coals of parallel type and reverse S type have high efficiency of mercury ejection and good pore connectivity. These characteristics are beneficial to the occurrence and permeability of CBM. Coals of double S type and double curvature type are usually badly broken and have bad pore connectivity. The pores are usually strongly closed, which are unfavorable to the migration and loss of coalbed gases. Therefore, these pore types are beneficial to the preservation of wet gases.
The coal of a parallel type in the Enhong syncline is mainly composed of primary structure coal with weak structural deformation. The pores in the coal are mainly primary pores or gas pores. This type of coal usually has fewer pore throats and better connectivity. However, the porosity and the pore volume of this type of coal are relatively low, and the seepage holes greater than 100 nm are relatively undeveloped. These features are not beneficial to the migration of coalbed gases and also increase the closure of pores in the coal of wet gas area, who has well-developed micropores and transition pores.
The coal of reverse S type has well-developed macropores and microcracks, which increase the porosity and pore volume of coals. Coal of this type has better pore connectivity, according to the relatively high efficiency of mercury ejection. The pore structure is conducive to the occurrence and seepage of CBM. This type of pore structure occurs mainly in the dry gas area.
Coals of double S type or double curvature type have a large number of microscopic exogenous pores, such as crushed pores and friction pores. The primary pores are also deformed and reformed by tectonic stress. Such pores have small pore volumes. The low efficiency of mercury ejection indicates the poor connectivity of pores. The seepage holes are not developed and the coals are easy to block. The well-developed micropores and transition pores are conducive to the adsorption and enrichment of coalbed gases. Therefore, these two types of pore structures are not conducive to the migration and dissipation of coalbed gases. They are liable to result in the enrichment and concentration of wet gases.
The pore structure types of coal in the dry gas area are mostly parallel type and reverse S type with good openness and connectivity. These pore structures with better connectivity are conducive to the evacuation and migration of wet gases, which makes the wet gases difficult to preserve very well. The pore structure of coal in the wet gas area is relatively closed. Though it is mainly the parallel type in the wet gas area, the volume of the micropore and the transitional pore is obviously larger than that in the dry gas area. Coals in the wet gas area also have the double S type and double curvature type pore structure, which is characterized by closed pores. Their bad connectivity and well-developed micropores and transition pores are beneficial to the preservation and enrichment of wet gases.

4. Conclusions

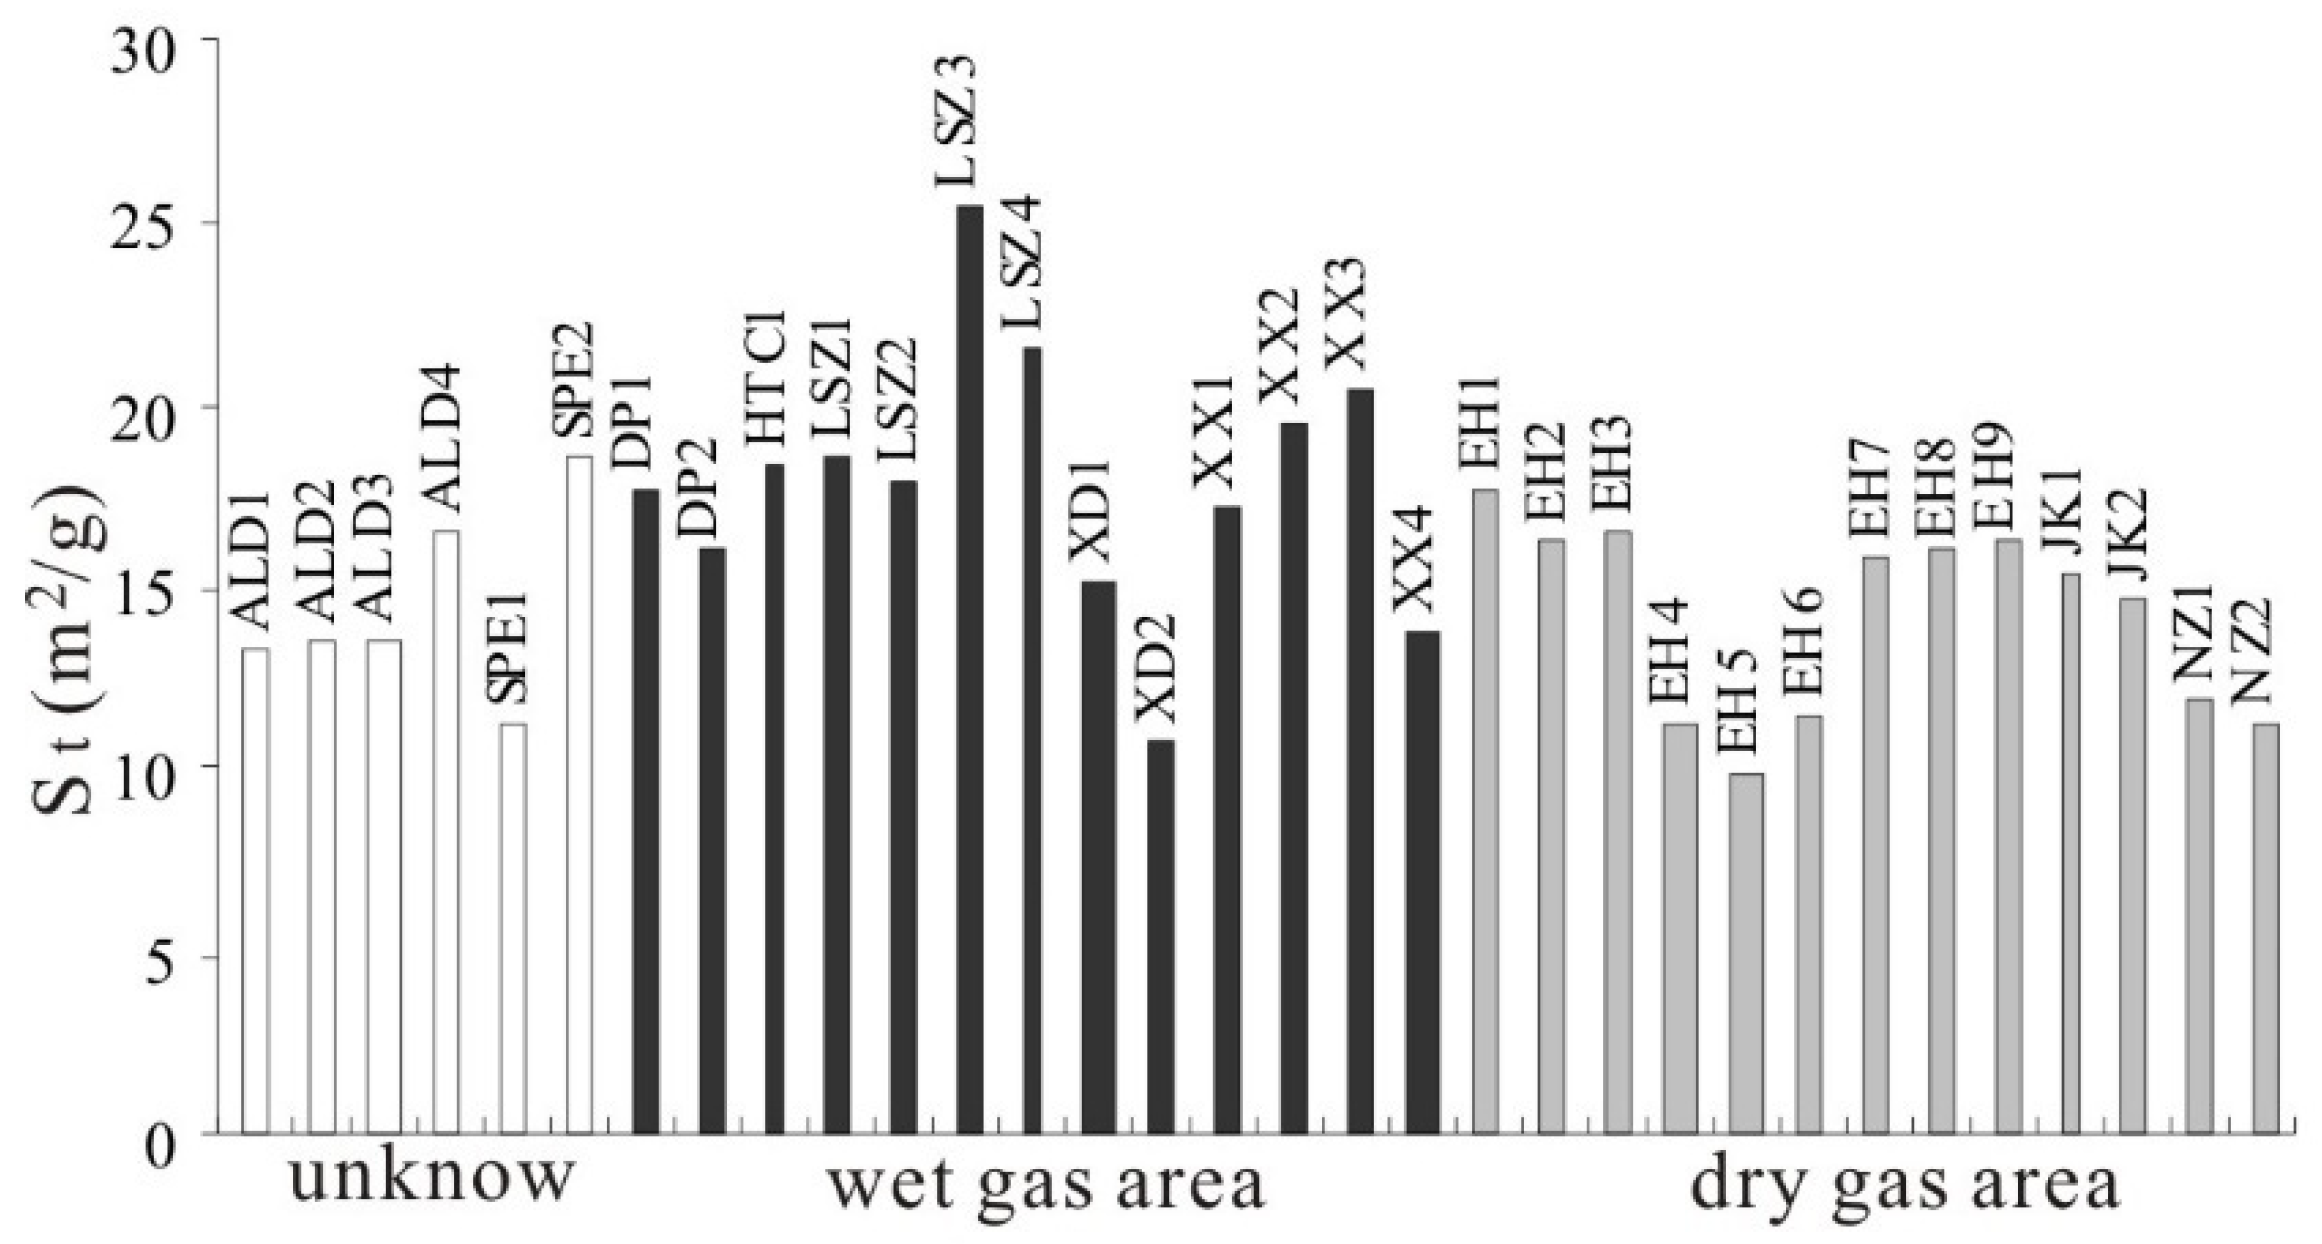
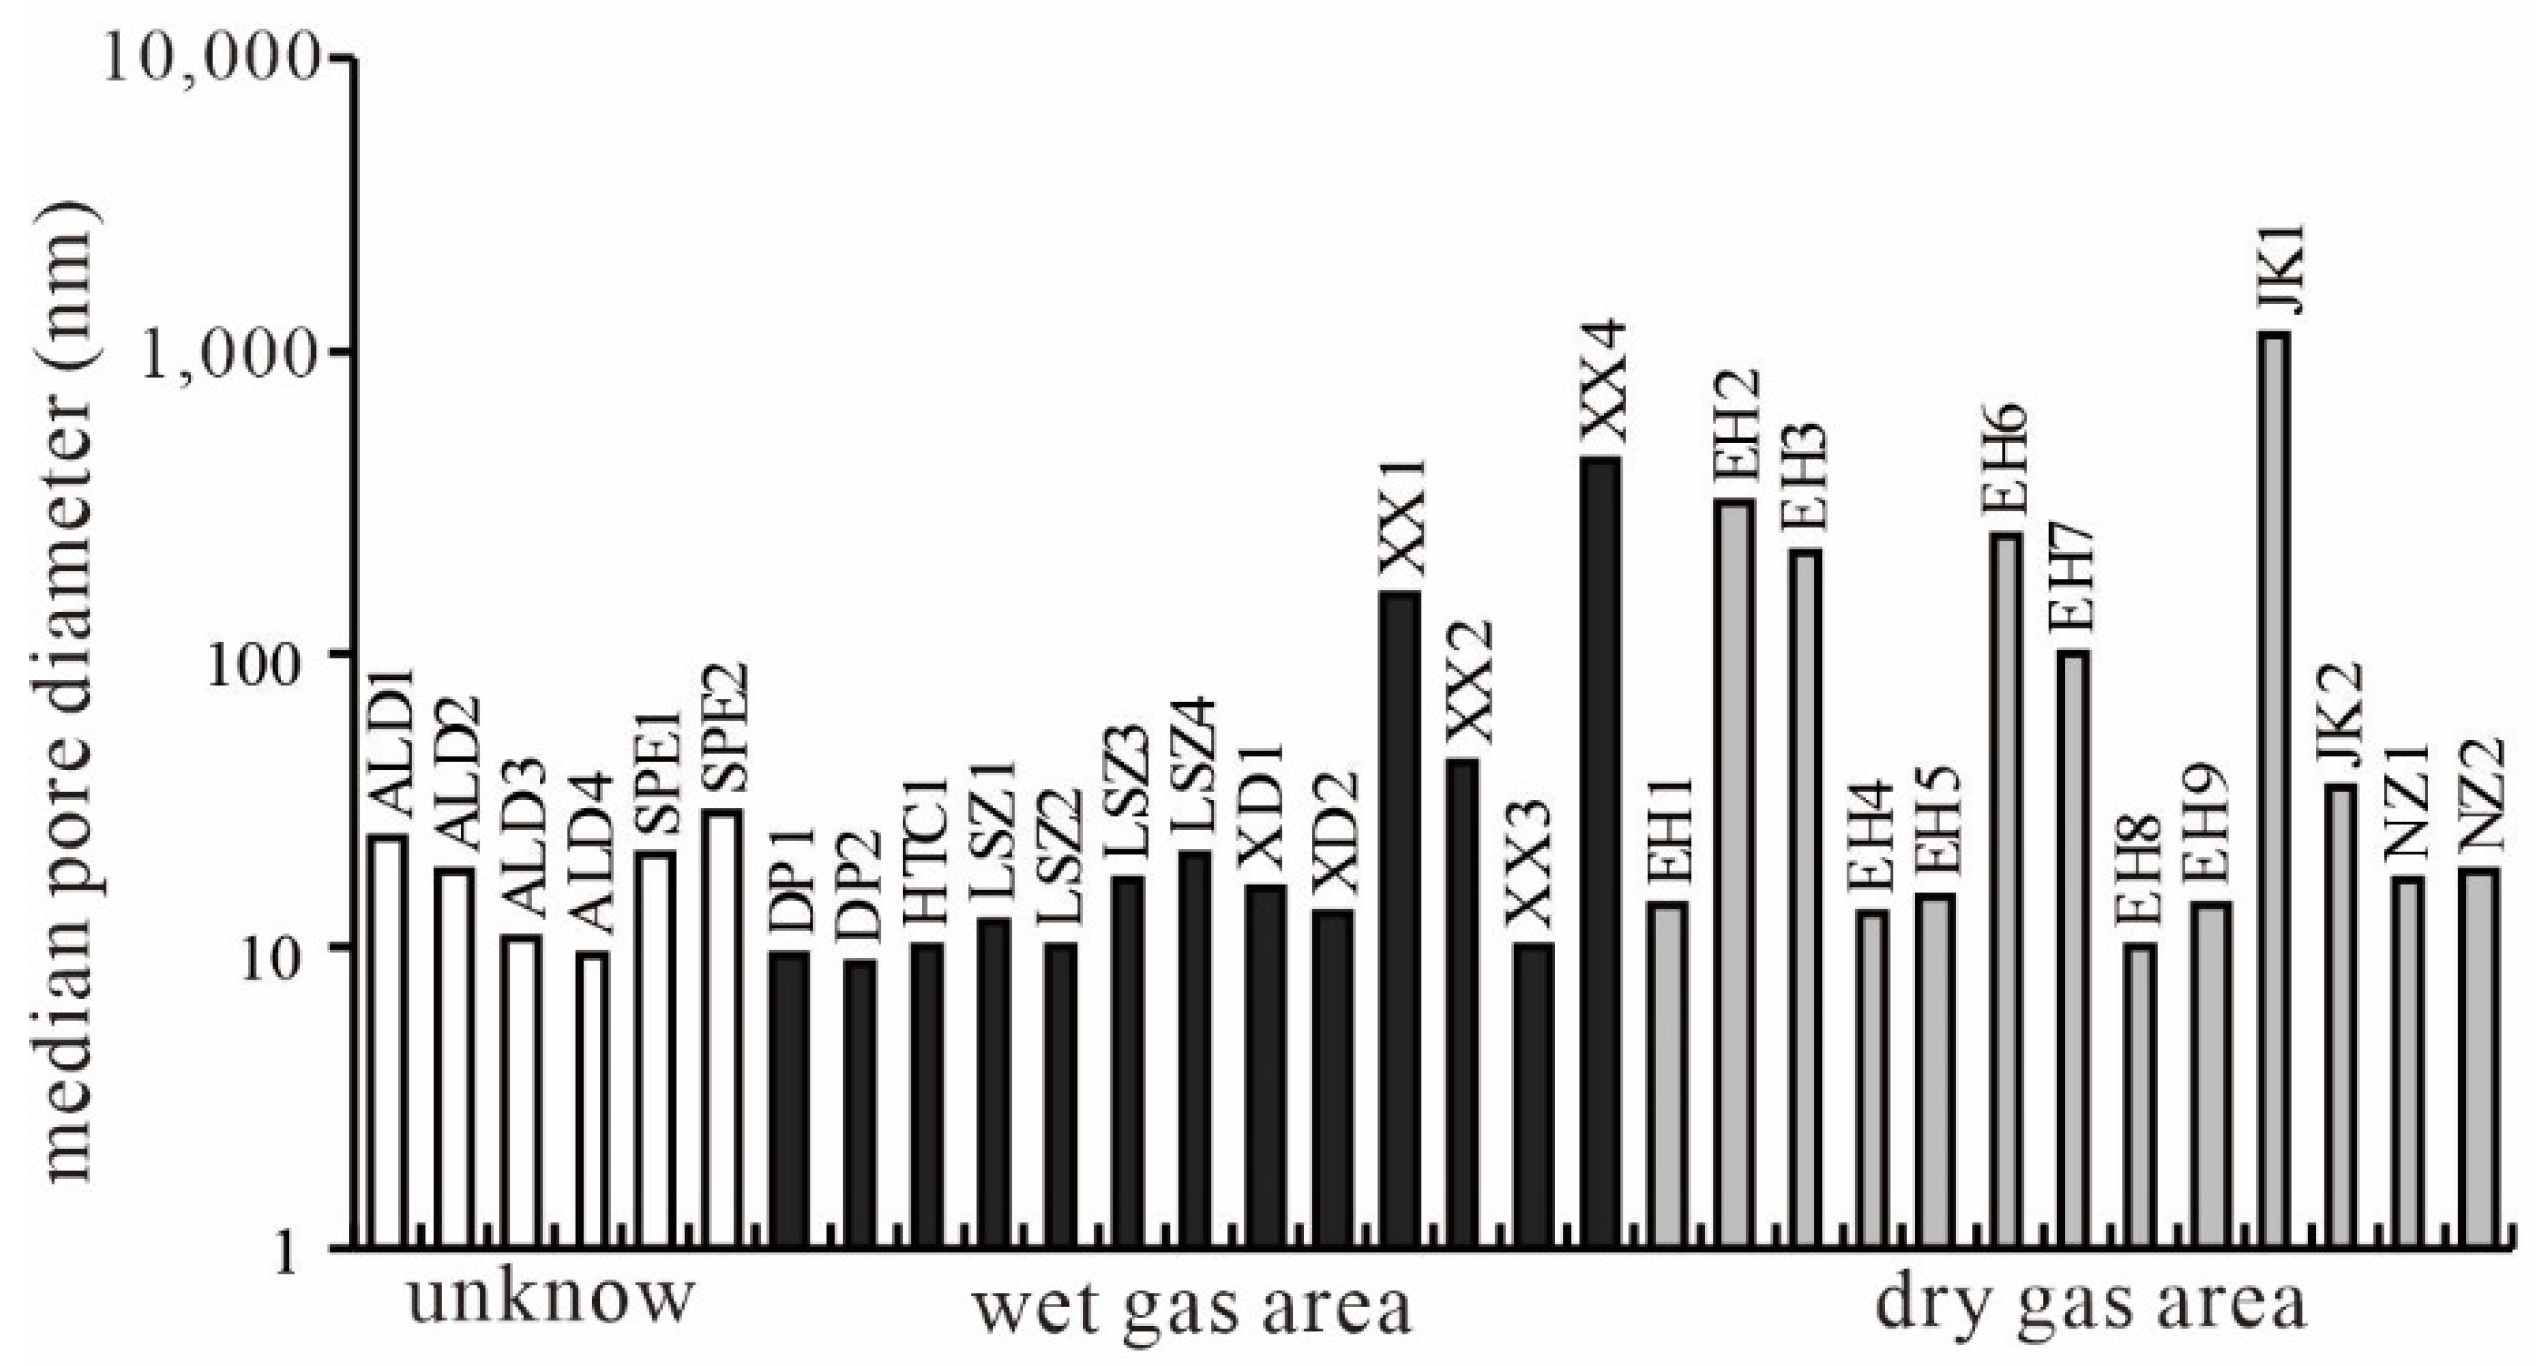
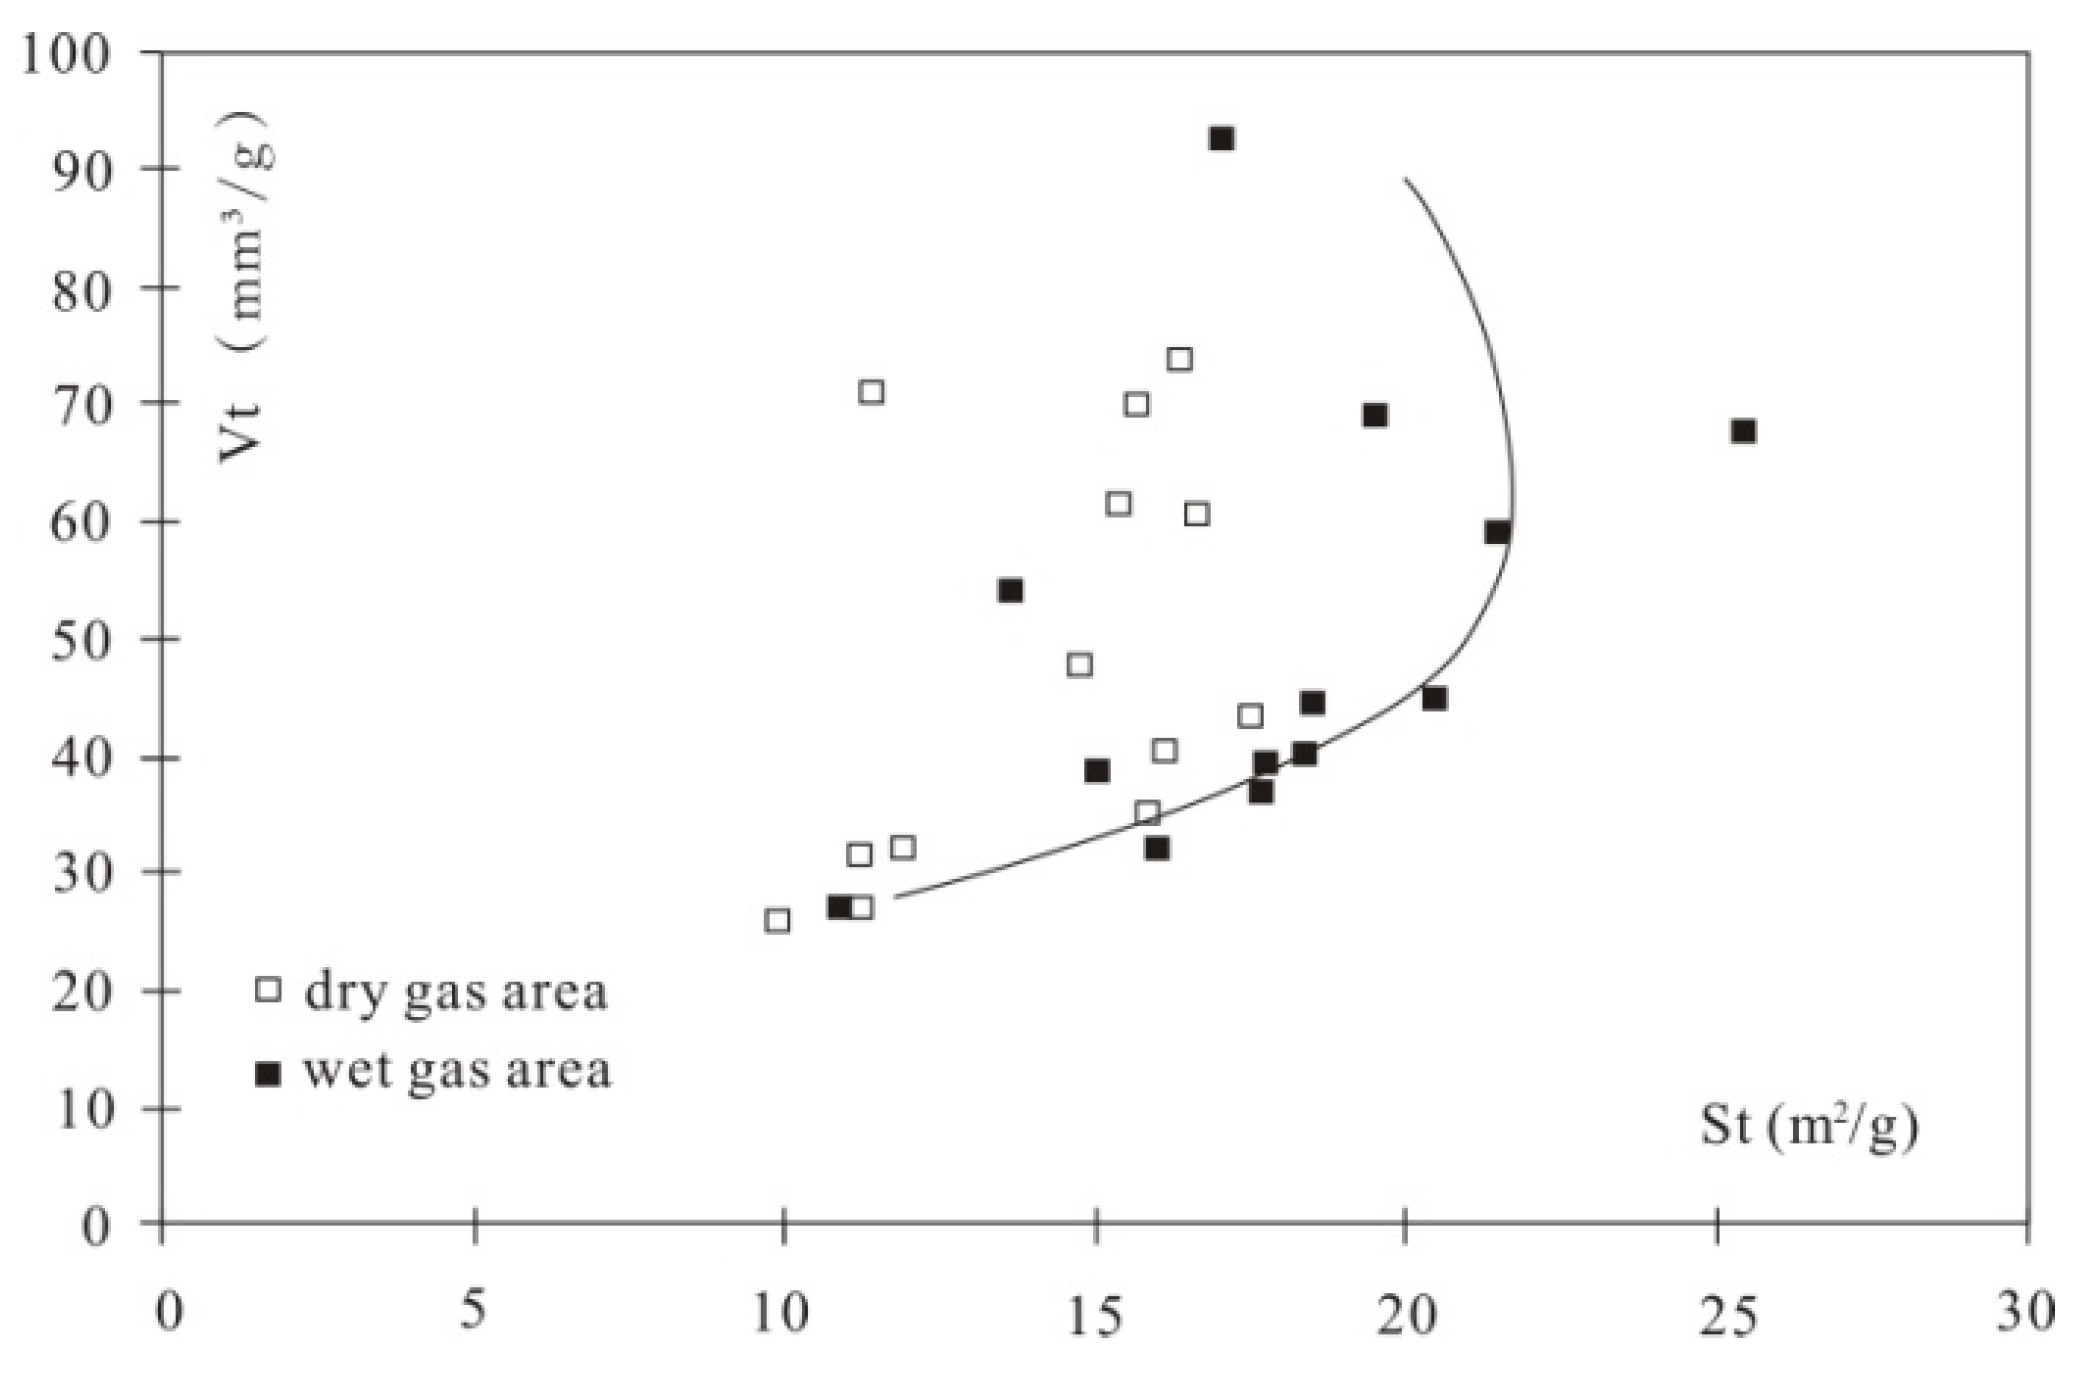
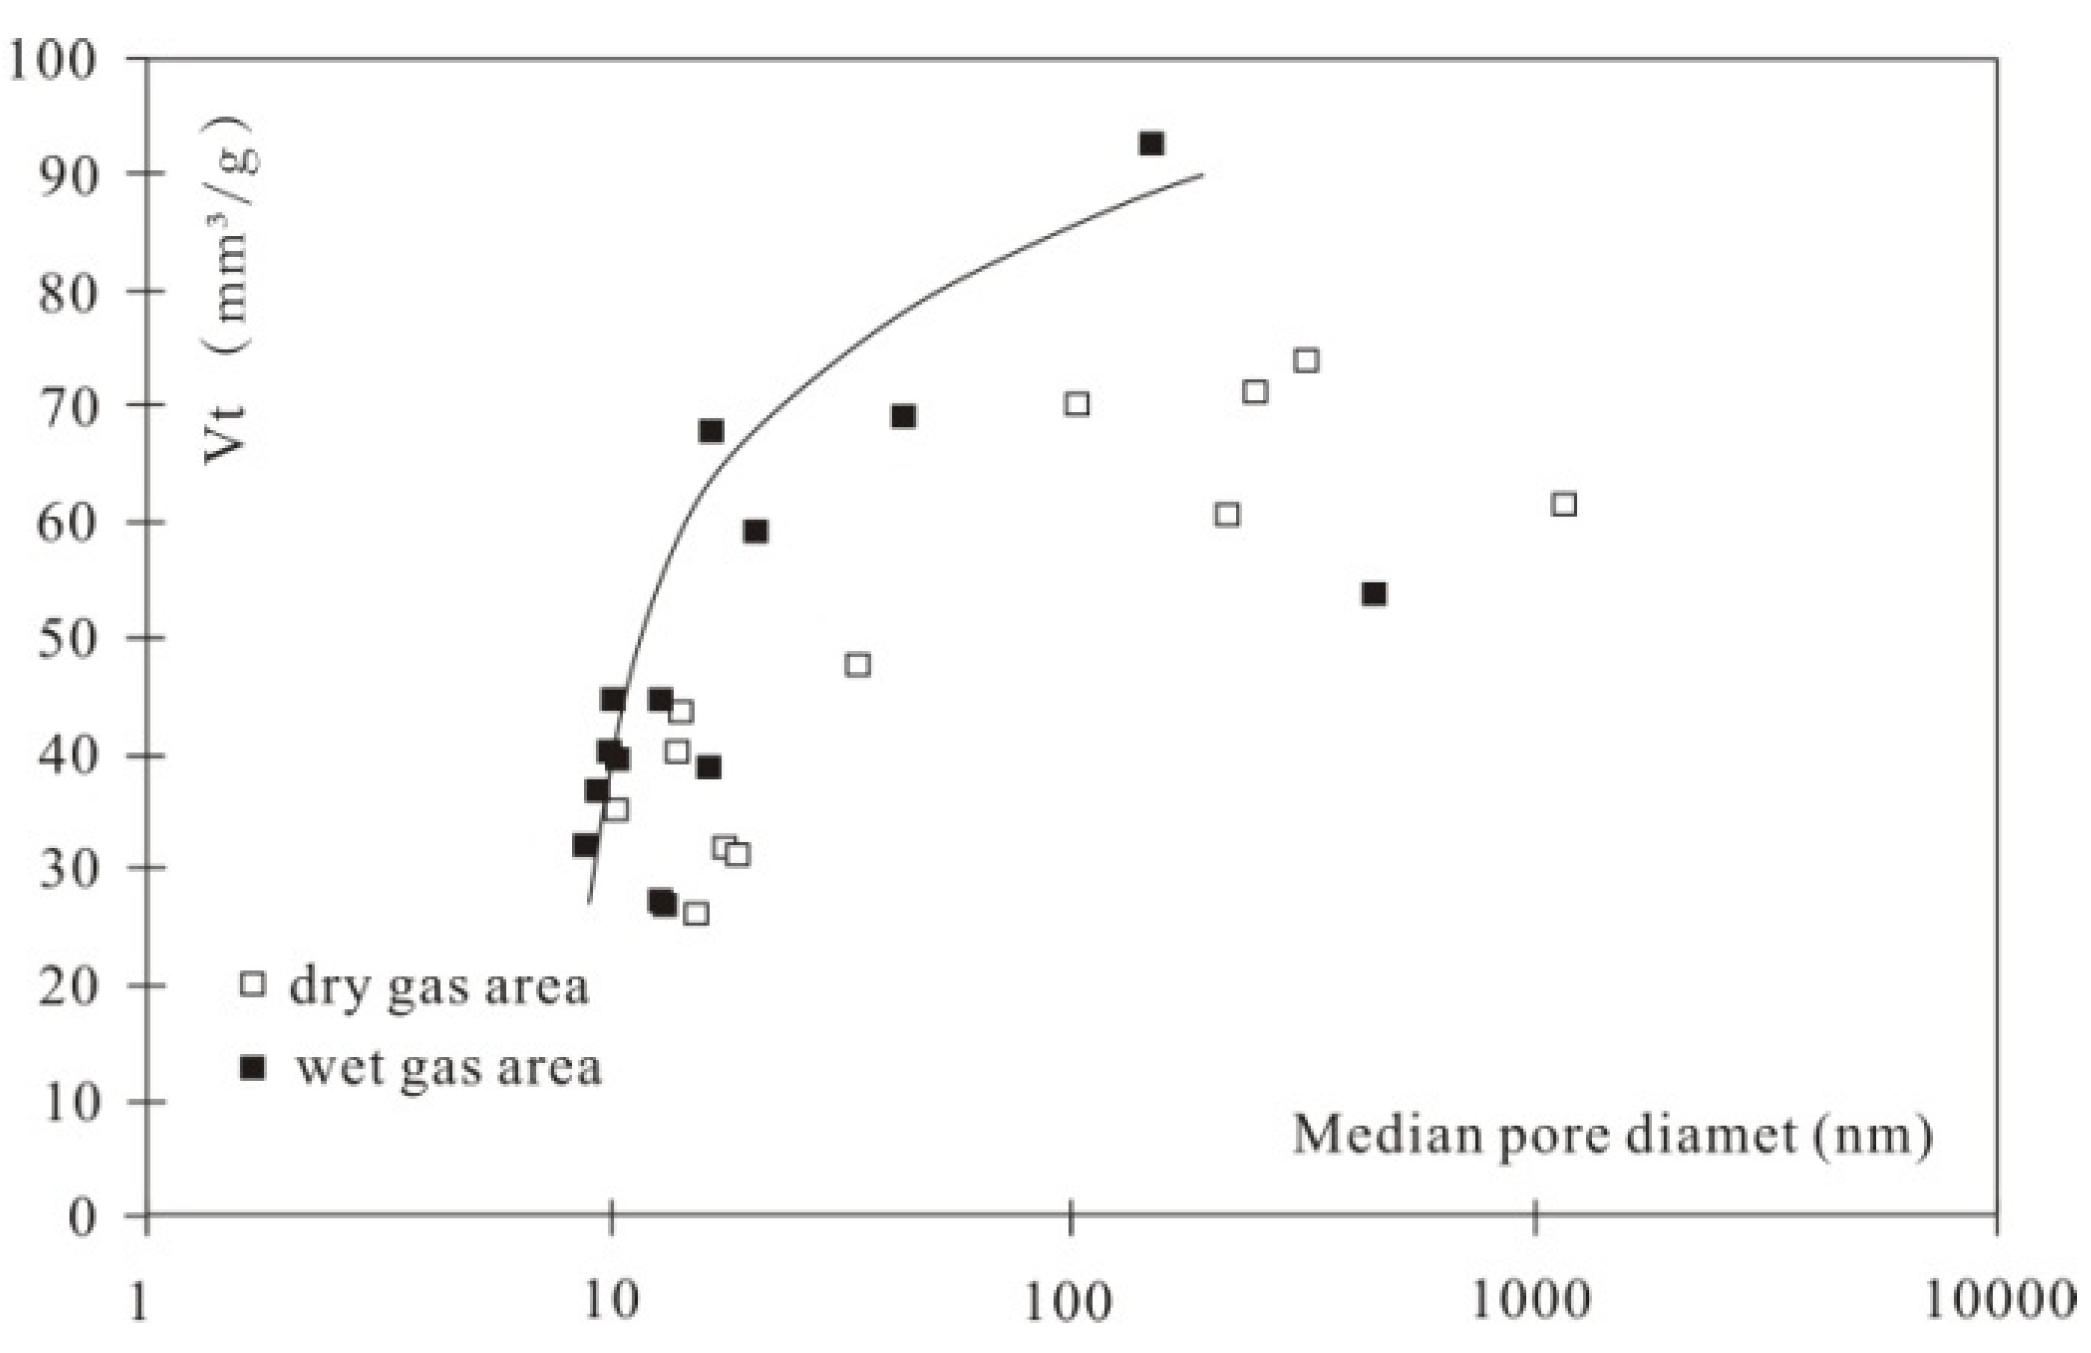
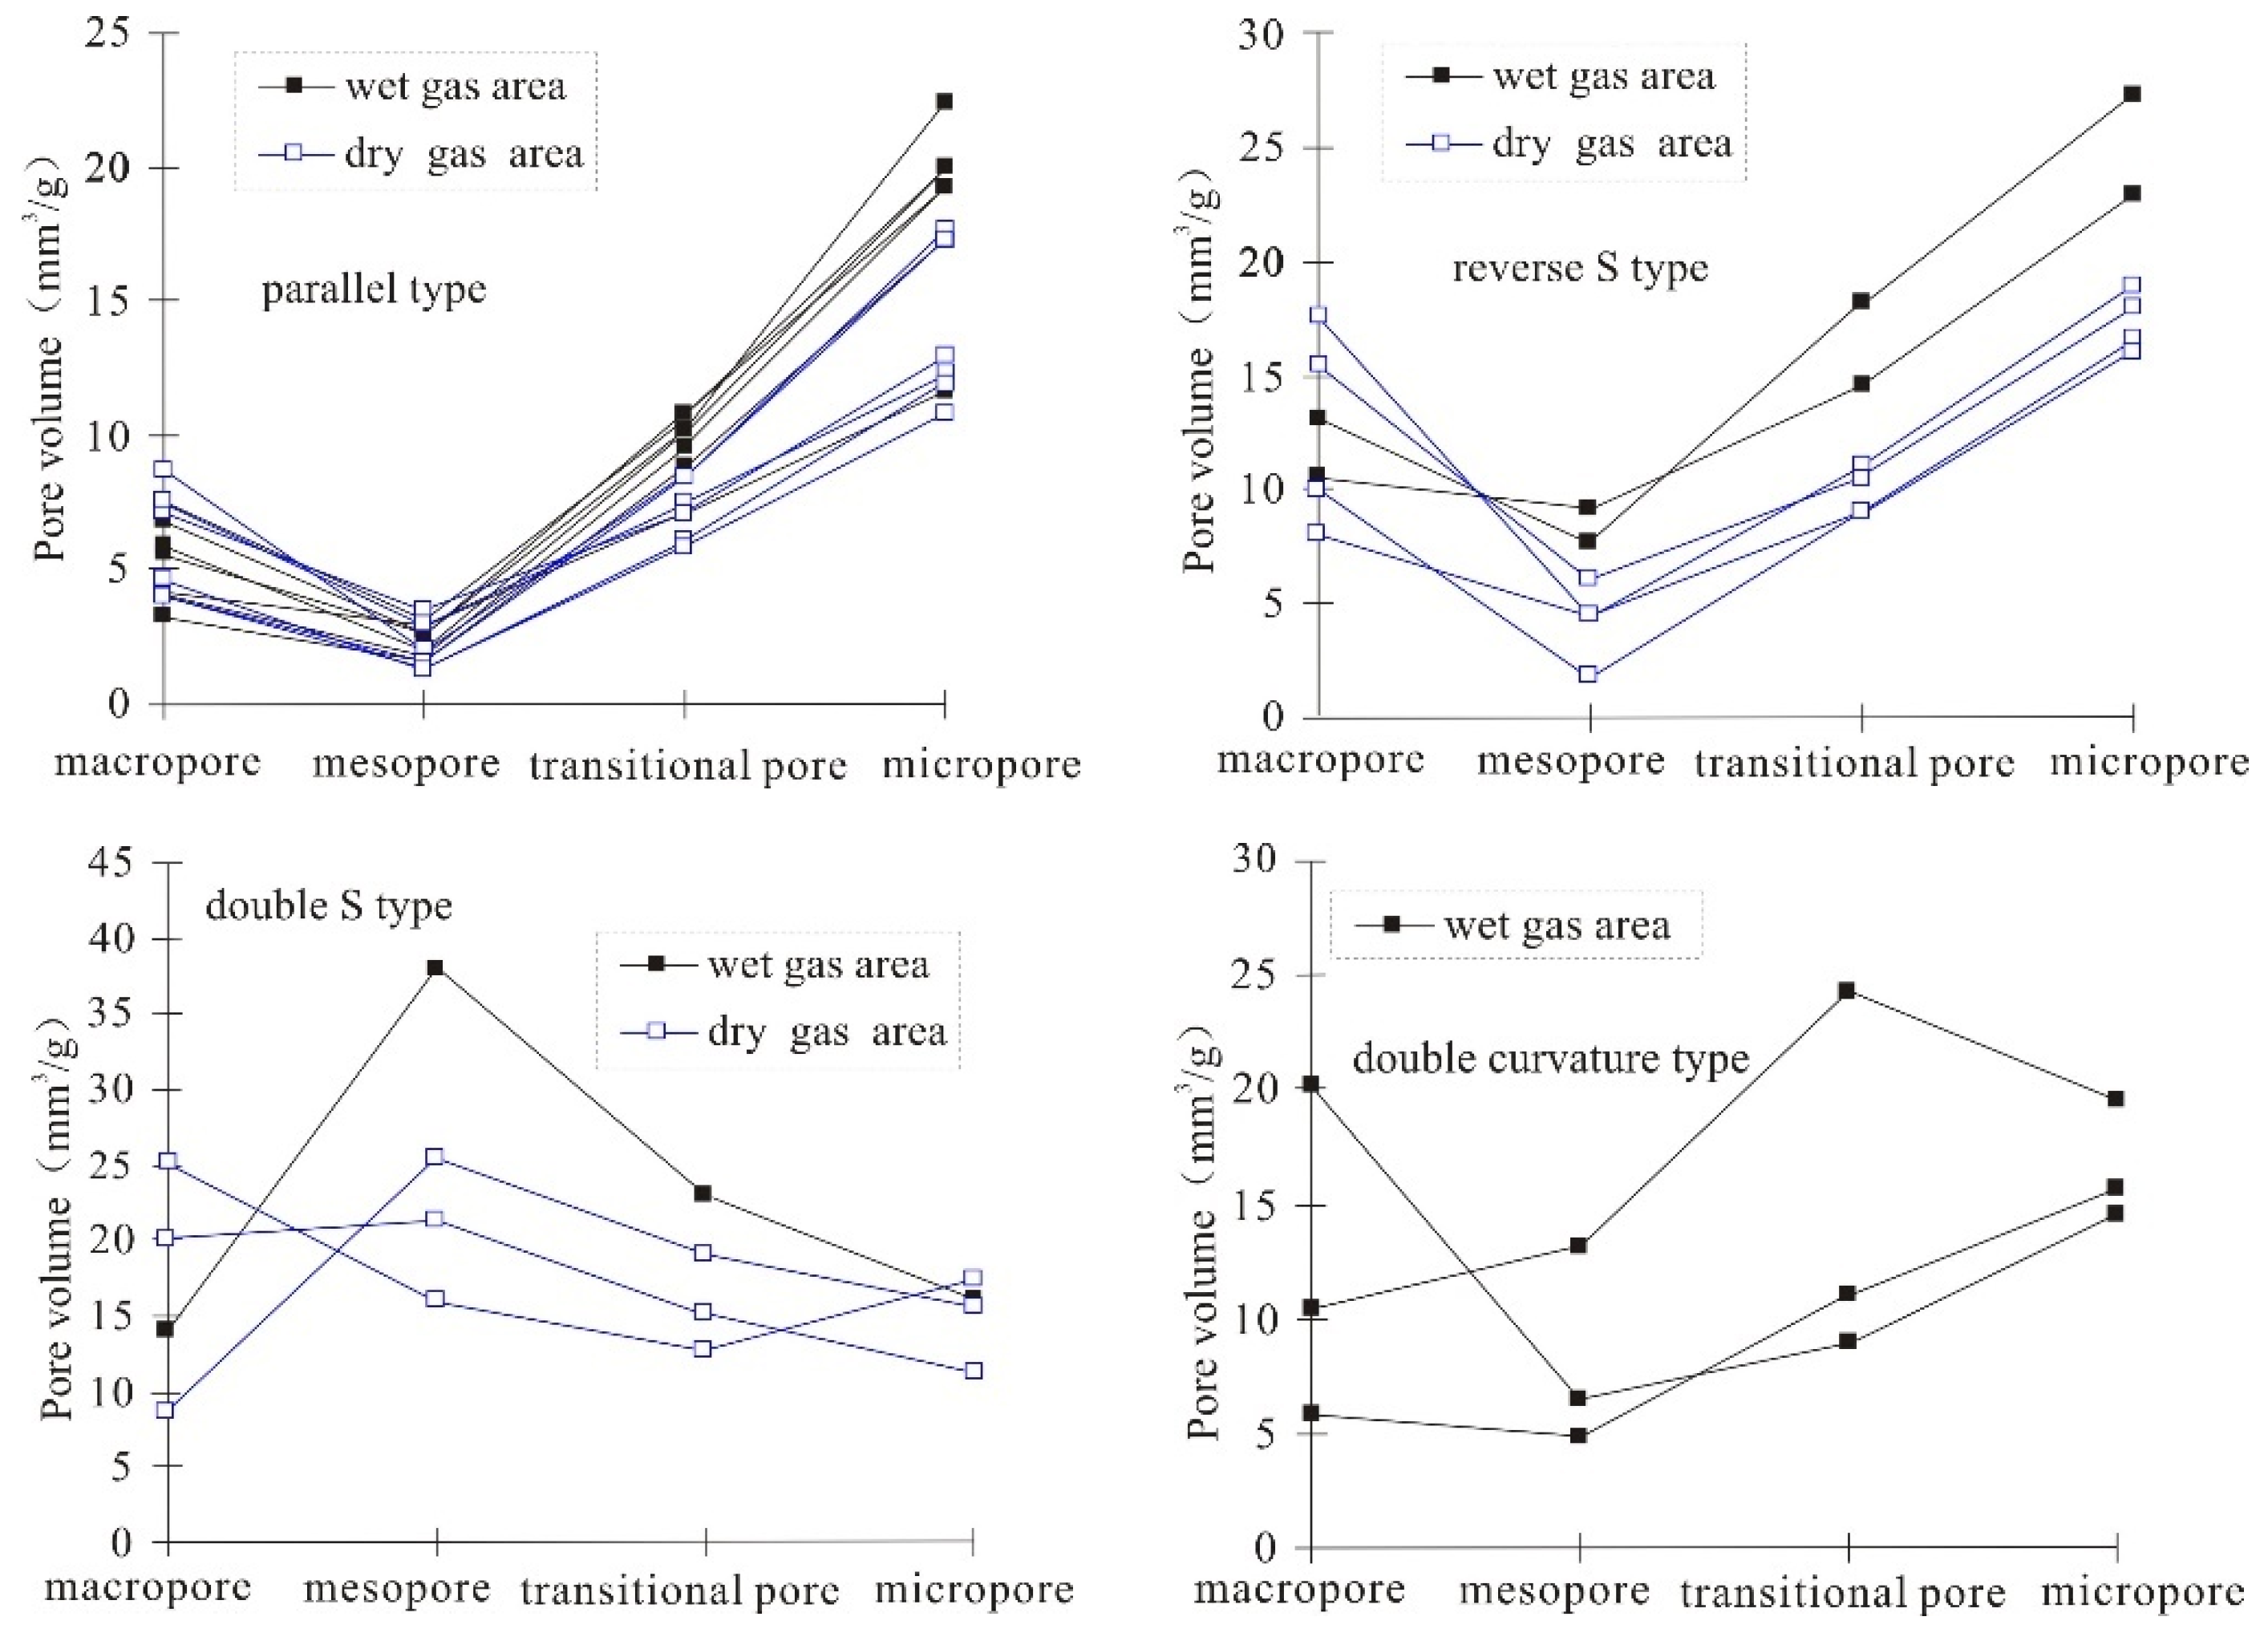
  • Coals with different concentrations of wet gases in the Enhong syncline have different pore structures. In the pore structure parameters, the total pore volume and porosity are not very different between the wet gas area and the dry gas area, but the total pore-specific surface area is more and the median pore size is lower in the coals of the wet gas area. The pore size distributions of coal also show the difference. Coals in the wet gas area have more volume of the micropore and transition pore, while coals in the dry gas area have more volume of macropore relatively.
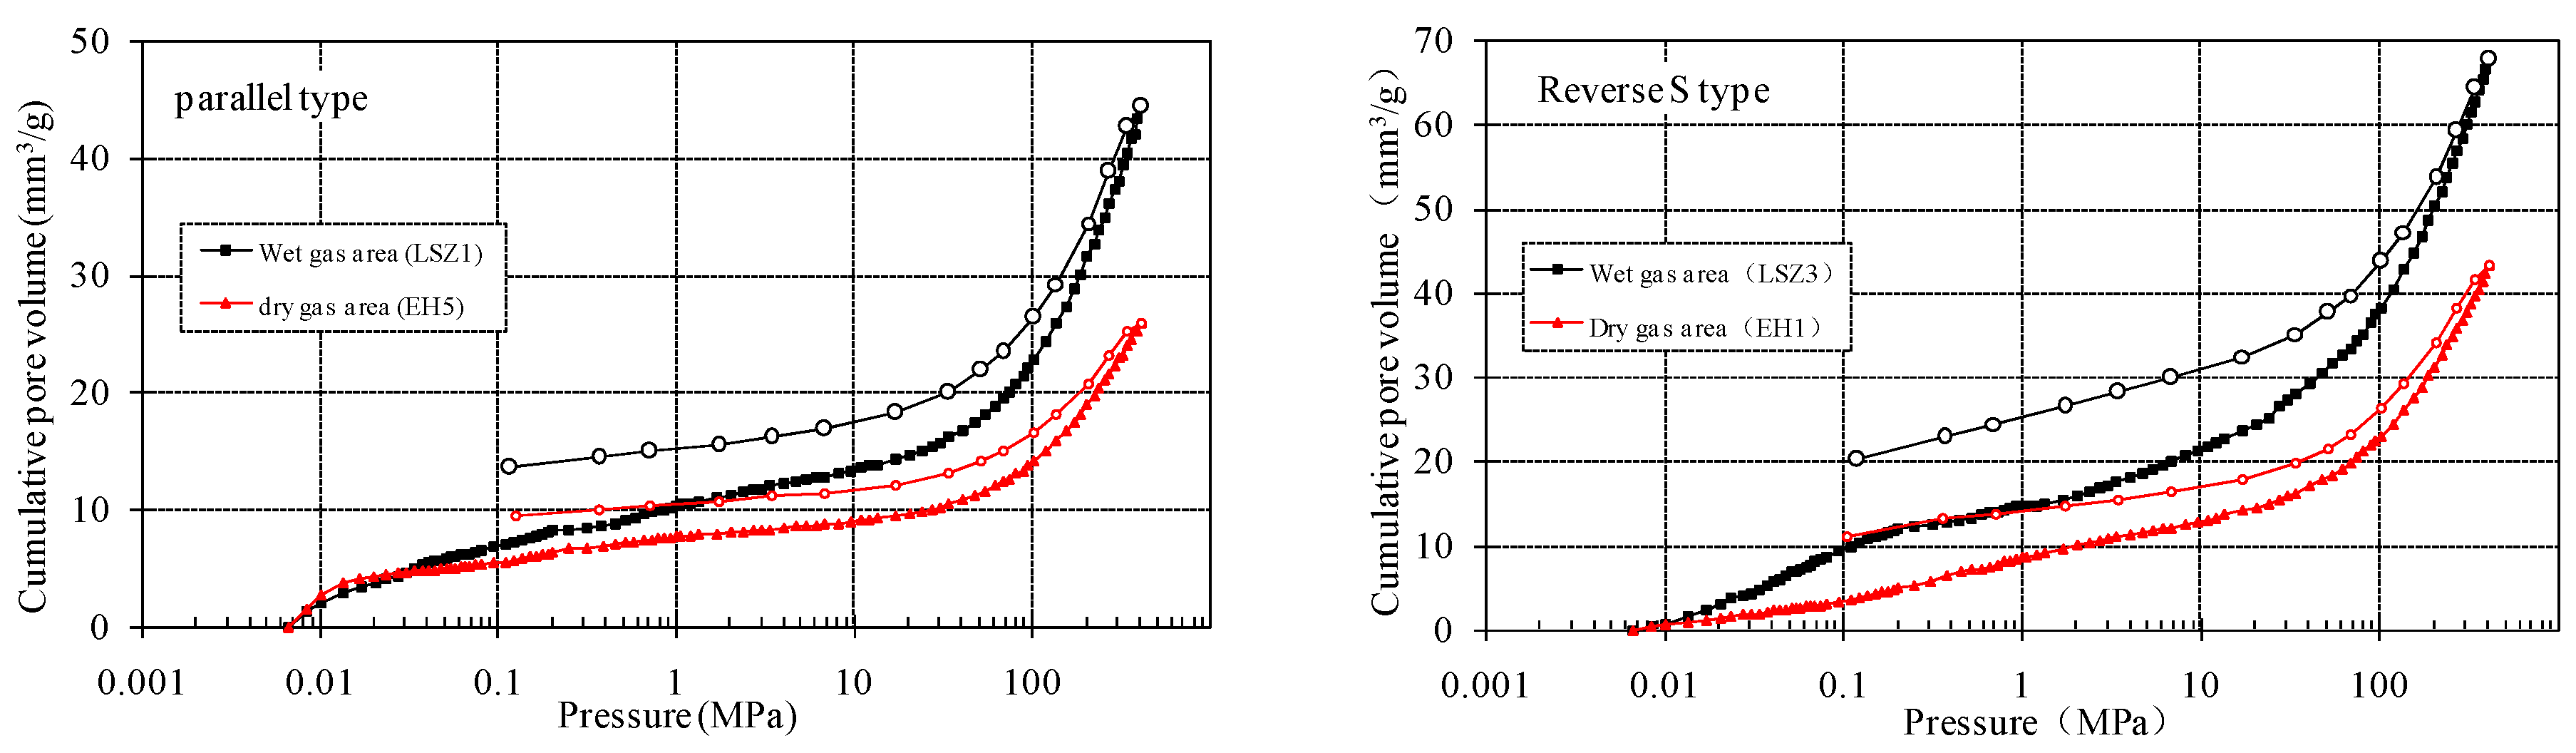
  • Pore structures are divided into four types: parallel type, reverse S type, double S type, and double curvature type according to the mercury injection and ejection curve. Pore structures in the dry gas area are mainly parallel-type and reverse S type, which is favorable for the migration and dissipation of coalbed gases. Pore structures in the wet gas area are relatively closed. Coals in the wet gas area have the double S type and double curvature type pore structure, which are characterized by closed pores and bad connectivity.
  • The quantity of the micropore and specific surface area and the connectivity of pore structure has important effects on the preservation of wet gases. The higher specific surface area of micropores and more pores make the coal have a stronger adsorption capacity of wet gases. The pore structure with better connectivity is conducive to the evacuation and migration of wet gases, which makes them difficult to preserve well. The pore structure with strong sealing is beneficial to the preservation of wet gases.

Author Contributions

Conceptualization, Y.Q. and M.L.; methodology, F.L.; software, Y.L.; validation, M.L. and Y.L.; formal analysis, F.L.; investigation, F.L.; resources, Y.Q.; data curation, F.L.; writing—original draft preparation, F.L.; writing—review and editing, Y.W.; visualization, Y.W.; supervision, M.L.; project administration, M.L.; funding acquisition, Y.Q. All authors have read and agreed to the published version of the manuscript.

Funding

This research was funded by [the National Natural Science Foundation of China] grant number [42130802, 41430317, 41702172] and Natural Resources Technology Project of Anhui Province (2021-K-8), and Guizhou Provincial Science and Technology Program: Qiankehe Strategic Mineral Search [2022] ZD001-01.

Conflicts of Interest

The authors declare no conflict of interest.

References

  1. Chen, Y.; Qin, Y.; Li, Z.; Shi, Q.; Wei, C.; Wu, C.; Cao, C.; Qua, Z. Differences in desorption rate and composition of desorbed gases between unde-formed and mylonitic coals in the Zhina Coalfield, Southwest China. Fuel 2019, 239, 905–916. [Google Scholar] [CrossRef]
  2. Chen, Y.; Qin, Y.; Wei, C.; Huang, L.; Shi, Q.; Wu, C.; Zhang, X. Porosity changes in progressively pulverized anthracite subsamples: Implications for the study of closed pore distribution in coals. Fuel 2018, 225, 612–622. [Google Scholar] [CrossRef]
  3. Clarkson, C.R.; Bustin, R.M. Binary gas adsorption/desorption isotherms: Effect of moisture and coal composition upon carbon dioxide selectivity over methane. Int. J. Coal Geol. 2000, 42, 241–271. [Google Scholar] [CrossRef]
  4. Hotot. Coal and Gas Outburst; China Industry Press: Beijing, China, 1966; p. 318. [Google Scholar]
  5. Jiang, B.; Qin, Y.; Ju, Y.W.; Hong, J.; Li, M. The Coupling Mechanism of the Evolution of Chemical Structure with the Characteristics of Gas of Tectonic Coals. Earth Sci. Front. 2009, 16, 262–271, (In Chinese with English Abstract). [Google Scholar]
  6. Jiang, B.; Qu, Z.; Wang, G.G.; Li, M. Effects of structural deformation on formation of coalbed methane reservoirs in Huaibei coalfield, China. Int. J. Coal Geol. 2010, 82, 175–183. [Google Scholar] [CrossRef]
  7. Juang, S.; Kang, Y.; Yang, T.; Wang, J.; Zhang, B.; Gu, J.; Sun, H. Combined CBM drainage of multiple seams by single well in Enhong block, Yunnan Province. Coal Geol. Explor. 2018, 46, 80–89. [Google Scholar]
  8. Lan, F.; Qin, Y.; Li, M.; Tang, Y.; Guo, C.; Zhang, F. Microbial degradation and its influence on components of coalbed gases in Enhong syncline, China. Int. J. Min. Sci. Technol. 2013, 23, 293–299. [Google Scholar] [CrossRef]
  9. Lan, F.; Qin, Y.; Wang, A.; Li, M.; Wang, G. The origin of high and variable concentrations of heavy hydrocarbon gases in coal from the Enhong syncline of Yunnan, China. J. Nat. Gas Sci. Eng. 2020, 76, 103217. [Google Scholar] [CrossRef]
  10. Li, M.; Jiang, B.; Lan, F.J.; Qu, Z.H.; Dou, X.Z. Pore structures and structural control of coals with different degrees of deformation from western Guizhou and eastern Yunnan. Geol. J. China Univ. 2012, 18, 533–538. [Google Scholar]
  11. Li, M.; Jiang, B.; Lin, S.; Lan, F.; Wang, J. Structural controls on coalbed methane reservoirs in Faer coal mine, Southwest China. J. Earth Sci. 2013, 24, 437–448. [Google Scholar] [CrossRef]
  12. Li, S.; Tang, D.; Pan, Z.; Xu, H.; Guo, L. Evaluation of coalbed methane potential of different reservoirs in western Guizhou and eastern Yunnan, China. Fuel 2015, 139, 257–267. [Google Scholar] [CrossRef]
  13. McIntosh, J.; Martini, A.; Petsch, S.; Huang, R.; Nüsslein, K. Biogeochemistry of the Forest City Basin coalbed methane play. Int. J. Coal Geol. 2008, 76, 111–118. [Google Scholar] [CrossRef]
  14. Melnichenko, Y.B.; He, L.; Sakurovs, R.; Kholodenko, A.L.; Blach, T.; Mastalerz, M.; Radliński, A.P.; Cheng, G.; Mildner, D.F. Accessibility of pores in coal to methane and carbon dioxide. Fuel 2012, 91, 200–208. [Google Scholar] [CrossRef]
  15. Meng, X. Study on the Pore Structure of Coals and Characteristics of Gases Adsorption on Coals; Shandong University of Science and Technology: Qingdao, China, 2007. [Google Scholar]
  16. Pashin, J.C.; Groshong, R.H. Structural control of coalbed methane production in Alabama. Int. J. Coal Geol. 1998, 38, 89–113. [Google Scholar] [CrossRef]
  17. Qin, Y. Micropetrology and Structural Evolution of High-Bank Coals in P. R. China; China University of Mining and Technology Press: Xuzhou, China, 1994; p. 48. [Google Scholar]
  18. Qin, Y.; Moore, T.A.; Shen, J.; Yang, Z.; Shen, Y.; Wang, G. Resources and geology of coalbed methane in China: A review. Int. Geol. Rev. 2017, 60, 777–812. [Google Scholar] [CrossRef]
  19. Rice, D.D.; Claypool, G.E. Generation, accumulation, and resource potential of biogenic Gas. AAPG Bull. 1981, 65, 5–25. [Google Scholar]
  20. Tang, R.; Zeng, Y. The study on the retro-mercurometric efficiency of rocks. Exp. Pet. Geol. 1994, 16, 84–93. [Google Scholar]
  21. Tao, M.; Wang, W.; Xie, G.; Li, J.; Wang, Y.; Zhang, X.; Zhang, H.; Shi, B.; Gao, B. Secondary biogenic coalbed gas in some coal fields of China. Sci. Bull. 2005, 50, 24–29. [Google Scholar] [CrossRef]
  22. Wu, G.; Lin, Y.; Li, Y. Resources and occurrence characteristics of coalbed methane in Enhong and Laochang mining areas. Jiangsu Coal 2003, 26–27. [Google Scholar]
  23. Wu, J.; Jin, K.; Tong, Y.; Qian, R. Theory of coal pores and its application in evaluation of gas outburst proneness and gas drainage. J. China Coal Soc. 1991, 16, 86–95. [Google Scholar]
  24. Wu, J. Studies on characteristics of micropore and its relation with the migration and concentration of oil and gas. Sci. China (Ser. B) 1993, 23, 77–84. [Google Scholar]
  25. Wu, J. The Theory and Practice of Coal-Generated Hydrocarbon in China; China Coal Industry Publishing House: Beijing, China, 1994. [Google Scholar]
  26. Xu, H.; Zhang, S.; Leng, X.; Tang, D.; Wang, M. Analysis of pore system model and physical property of coal reservoir in the Qinshui Basin. Chin. Sci. Bull. 2005, 50, 52–58. [Google Scholar] [CrossRef]
  27. Yang, S.; Qin, Y.; Shen, J.; Lan, F.J.; Wang, B.W. Characteristics and Geological controls of coal reservoirs in Enhong syncline. China Coalbed Methane 2010, 7, 18–20. [Google Scholar]
  28. Yao, S.; Jiao, K.; Zhang, K.; Hu, W.; Ding, H.; Li, M.; Pei, W. An atomic force microscopy study of coal nanopore structure. Chin. Sci. Bull. 2011, 56, 2706–2712. [Google Scholar] [CrossRef] [Green Version]
  29. Yu, L.C.; Li, W.F. Study on composition of hydrocarbons in coal seams liable to outbursts. J. China Coal Soc. 1981, 4, 3–10. [Google Scholar]
  30. Zhong, N.; Qin, Y. Carbonate Organic Petrology: Maceral Characteristics, Origin, Evolution and Its Relationship with Oil and Gas; Science Press: Beijing, China, 1995. [Google Scholar]
  31. Zhong, L.W.; Zhang, H.; Yun, Z.R.; Lei, C.L. Influence of specific pore area and pore volume of coal on adsorption capacity. Coal Geol. Explor. 2002, 30, 26–28. [Google Scholar]
Figure 1. Structure outline of Enhong syncline.
Energies 16 00432 g001
Figure 2. Microscopic pore and fracture features of coal samples.
Energies 16 00432 g002
Figure 3. The AutoPore IV 9500 type Mercury Injection Apparatus.
Energies 16 00432 g003
Figure 4. Histogram of total pore-specific surface area.
Energies 16 00432 g004
Figure 5. Histogram of median pore diameter.
Energies 16 00432 g005
Figure 6. Relationship between total pore volume and pore surface area (Lan et al., 2020).
Energies 16 00432 g006
Figure 7. Relationship between total pore volume and median pore diameter (Lan et al., 2020).
Energies 16 00432 g007
Figure 8. Intrusive mercury curves of four types pore structure.
Energies 16 00432 g008aEnergies 16 00432 g008b
Figure 9. The stage pore volume of the four types of pore structure.
Energies 16 00432 g009
Figure 10. Plots of pore volumes to pore structure of four types of pore structure coals.
Energies 16 00432 g010
Table 1. Parameter statistics of pore structure of coal sample, Enhong syncline.
Number of SamplesCoal Seam No.Ro,max/%Vt (mm3/g)St (m2/g)Medium Pore Diameter (nm)Porosity (%)Types of Pore StructuresMercury Withdrawal Efficiency (%)Area of Samples
DP1101.4536.517.7489.44.40I81.92wet gas area
DP2101.4231.816.0238.93.95I85.22wet gas area
HTC1101.4239.818.44210.14.72I74.37wet gas area
LSZ181.4044.318.53212.95.18I69.53wet gas area
LSZ281.4839.217.81110.54.93I86.73wet gas area
LSZ391.5967.625.46116.97.50II70.12wet gas area
LSZ491.7258.921.52420.96.83II72.67wet gas area
XD141.0638.415.09716.35.05V61.98wet gas area
XD240.9926.610.94113.33.93I92.11wet gas area
XX171.3692.517.127150.910.71IV60.54wet gas area
XX271.1468.819.56443.28.14V59.74wet gas area
XX381.4344.520.50910.25.31I62.25wet gas area
XX481.3853.713.692450.76.41V42.46wet gas area
EH181.4643.317.55614.25.06II74.36dry gas area
EH291.6573.716.439325.98.50IV47.22dry gas area
EH391.7860.416.664218.47.07IV50.83dry gas area
EH4141.7326.811.26313.13.60I65.30dry gas area
EH5141.6925.89.93915.53.54I63.57dry gas area
EH6151.6271.011.463249.89.25IV28.31dry gas area
EH7151.6969.915.708102.58.27IV60.09dry gas area
EH8161.7634.715.93610.44.23I73.49dry gas area
EH9161.8140.016.17814.14.83I70.75dry gas area
JK1111.2861.315.4021174.27.82II43.39dry gas area
JK2111.4147.614.79034.96.39II47.06dry gas area
NZ141.2431.911.97817.84.23I68.03dry gas area
NZ241.2831.111.24518.84.16I70.10dry gas area
ALD191.0737.913.31223.54.80II56.73unknown
ALD291.3136.013.43718.94.84II64.44unknown
ALD3111.2830.113.44111.13.75I72.09unknown
ALD4111.2833.916.5009.44.23I82.60unknown
SPE181.2132.111.26320.74.45III61.37unknown
SPE281.4458.118.58829.06.74III62.31unknown
Vt = the total pore volume; St = the total pore specific surface area; types of pore structures: I—parallel type, II—reverse S type, III—angular type; IV—double S type; V—double curvature type.
Table 2. Statistics of pore structure of coal in Enhong syncline.
AreaVolume of Macropore (mm3/g)Volume of Mesopore (mm3/g)Volume of Transitional Pore (mm3/g)Volume of Micropore (mm3/g)
MinMaxAvgMinMaxAvgMinMaxAvgMinMaxAvg
Wet gas area3.320.28.61.638.17.47.124.312.911.727.218.9
Dry gas area4.025.210.81.325.57.15.919.210.010.818.915.1
Disclaimer/Publisher’s Note: The statements, opinions and data contained in all publications are solely those of the individual author(s) and contributor(s) and not of MDPI and/or the editor(s). MDPI and/or the editor(s) disclaim responsibility for any injury to people or property resulting from any ideas, methods, instructions or products referred to in the content.

