Article

Research on the Effect of the Outlet Throttle Diameter Deviation on the Pressure Relief Rate of the Injector Control Valve

1
School of Mechanical Engineering, North University of China, Taiyuan 030051, China
2
School of Energy & Power Engineering, North University of China, Taiyuan 030051, China
3
School of Mechanical and Electrical Engineering, Shanxi Datong University, Datong 037009, China
4
China Northern Engine Research Institute, Tianjin 300400, China
*
Author to whom correspondence should be addressed.
Energies 2023, 16(1), 50; https://doi.org/10.3390/en16010050
Submission received: 17 November 2022 / Revised: 11 December 2022 / Accepted: 15 December 2022 / Published: 21 December 2022
(This article belongs to the Section C: Energy Economics and Policy)

Abstract

:
Common rail injector response characteristics depend on the control chamber pressure change rate, the outlet throttle diameter by manufacturing errors, or wear-induced deviations that affect the rate of pressure change in the control chamber, so the accuracy of the outlet throttle diameter directly affects the control valve response consistency. This paper presents a computational fluid dynamics (CFD) simulation of the effect of the deviation of the outlet throttle diameter on the average mass flow rate of the outlet throttle during the opening of the spherical valve in order to reduce this difference and ensure uniform injection characteristics. The results illustrate that with the increase in outlet throttle diameter deviation, the volume of gas phase in the control valve increases and the rate of pressure reduction in the control chamber accelerates, and the sensitivity coefficient of the average mass flow rate of the outlet throttle to the outlet throttle diameter deviation remains unchanged at 24.77. Cavitation occurs in the area of the outlet throttle when the spherical valve lift is 0.045 mm. The increase in rail pressure not only leads to an increase in the low-pressure area on the inner wall of the outlet throttle, an increase in the volume share of the gas phase, and an increase in the hydraulic impact on the sealing wall but also makes the average mass flow rate of the outlet throttle and the rate of change of the control chamber pressure during the opening of the spherical valve more sensitive to the deviation of the outlet throttle diameter.

1. Introduction

In the context of promoting the realization of the double-carbon goal and the development of energy conservation and emission reduction, high power density diesel engines are the inevitable trend for the development of power systems in the new era [1,2]. Compared with traditional diesel engines, high power density diesel engines have the characteristics of high compactness [3], high combustion pressure [4], high speed [5], and wide application range [6]. The emergence of high-pressure common rail injection systems realized the separation generation of injection pressure and the separation injection process and flexible injection timing and multiple injection [7,8], which greatly reduced the sensitivity of injection pressure to engine speed, greatly improved the power and cleanliness of diesel engines, reduced fuel consumption, and became the most important technical means in the history of diesel engines [9,10]. As the core component of the high-pressure common rail system, the injector has the highest precision, the most constituent parts, the worst working environment, and is prone to wear and tear. It represents the highest technical content and development difficulty of the high-pressure common rail system, and its performance directly affects the performance of the entire diesel engine [11].
The response characteristics of the injector directly affect the fuel injection characteristics, thus affecting the combustion and emissions of the diesel engine. The response characteristics and spray characteristics of the injector determine the performance of the diesel engine, where the response characteristics are a prerequisite for the high-pressure common rail injection system to achieve advanced injection laws. Effective suppression of pressure fluctuations, reasonable selection of high-pressure common rail injector structure parameters, and control parameters are the key to improve its response characteristics [12,13]. Therefore, further improving the response characteristics of the injector to improve the engine injection characteristics is an important way to improve the combustion quality in the cylinder. A lot of work has been performed by researchers to optimize the response characteristics of the injectors.
Numerical simulations and experimental studies have been important methods to study the response characteristics of injectors. R. Payri et al., studied the effect law of rail pressure on the injection volume and rate based on the injector simulation model of AMESim and verified the reliability of the simulation results through experiments [14]. B. Frédéric et al., found that fuel density has a large effect on the cyclic injection volume and pressure fluctuation characteristics of the common rail system, while the effect on mass flow rate is relatively weak [15]. F.J. Salvador et al., established the injector simulation model based on AMESim and studied the influence of injection pressure on the cycle injection quantity, injection rate, and needle valve lift [16]. J. Lee et al., reported that piezo-driven injectors have faster needle valve response, have higher injection flow rates, and can control the injection flow slope of piezo-driven injectors by varying the induction current [17]. Q. Lan et al., performed a correlation analysis of the structural parameters affecting the turn-on response time (ORT) and turn-off response time (CRT) of the pressure amplification piston (PAP) by means of an experimentally validated model. The results show that the variation of operating conditions has a significant effect on the PAP turn-on process but has little effect on the turn-off process [18]. E. Plamondon et al., established a mathematical model of high-pressure common rail injectors, which accurately predicts the on and off delay response times of injectors under multiple injection strategies, and then investigated the injection strategy of common rail systems for biodiesel fuels [19]. G. Chen et al., used the response surface method (RSM) to obtain the response surface functions of mass flow rate and cavity pressure, and the analysis results showed that increasing the orifice diameter could increase the mass flow rate, and decreasing the orifice diameter, spool top radius, and pressure chamber ball diameter could increase the cavity pressure and reduce the cavitation phenomenon [20]. Q. HU et al., established a high-pressure common rail injector simulation calculation model and analyzed the influence law of pressure fluctuation, flow loss, electromagnetic force, and spring reaction force on the dynamic response of injectors [21]. The one-dimensional numerical simulation calculation lacks the consideration of the control valve space and cannot reflect the influence of the hydraulic process on the flow characteristics (vapor phase, pressure, and velocity distribution) of the control chamber components.
The transient flow characteristics inside the control valve affect the response characteristics of the injector, which determines the overall working performance of the injector. Therefore, during the development of common rail injectors, a systematic study of the transient flow inside the control valve and an in-depth understanding of its hydraulic process are essential for the design and manufacture of common rail injectors.
The spherical control valve is widely used to control the opening and closing of high-pressure common rail injectors because of its good sealing performance and rapid response. The flow characteristics of the sealing area have the conditions to form cavitation, and the damage traces after the test are in line with the cavitation erosion, indicating that cavitation has an important impact on the control valve [22]. C. Wang et al., found that the change of the internal structure of the control valve is an important factor affecting the degree of cavitation by comparing the structural parameters of the control valve [23].
R.N. Ren et al., compared the pressure, velocity, and mass flow rate of fuel with and without cavitation in the high-pressure common rail control valve and found that cavitation had a significant effect on reducing the hydraulic shock to the spherical valve and sealing cone and stabilizing the fluctuation of fuel velocity in the control chamber; however, the existence of the cavitation vortex significantly reduces the fuel mass flow in the outlet orifice, thereby reducing the response rate of the control valve [24].
During the opening of the spherical valve, the mass flow rate of the outlet throttle is an important indicator for evaluating the transient flow performance of the control valve and is an important theoretical data point in the design and application of the common rail injector control valve. In this paper, the spherical control valve commonly used in high-pressure common rail system injector of high-power density diesel engines is the object of research according to the existing problems of the outlet throttle diameter deviation on the control valve pressure relief rate of the relationship in the study. By comparing the degree of influence of the outlet throttle diameter deviation on the control valve pressure relief rate with the change in rail pressure, a prediction model of the flow characteristics containing the outlet throttle geometry deviation parameters and rail pressure is established to provide a theoretical basis and reference for the control valve manufacturing tolerance design and error control.

2. Basic Mathematical Model

The process of hydrodynamic analysis in this paper follows the basic physical laws of conservation of mass, conservation of momentum, and conservation of energy. In the simulation of cavitation flow, the basic equation of two-phase flow is the mixture model; the turbulence model is the realizable model. Standard wall function is used for wall treatment, and the cavitation model is the Schnerr and Sauer model.

2.1. Cavitation Model

In the simulation of cavitation flow, the default continuous fluid contains large numbers of tiny bubbles. The concrete manifestation of cavitation is the growth, expansion, and bursting of these bubbles. Therefore, describing the dynamic process of the bubbles is the main part of cavitation simulation. The bubble dynamics equation used in the Fluent is the Rayleigh–Plesset equation, and its expression is:
B D 2 B D t 2 + 3 2 ( D B D t ) 2 = ( P B P ρ l ) 4 v t B B 2 S ρ l B
B is the bubble radius; S is the surface tension coefficient; v t is the kinematic viscosity of the liquid; P B is the bubble surface pressure; P is the local pressure; ρ l is fluid density.
The vapor–liquid two-phase flow formed by cavitation is mainly represented by the volume fraction of vapor phase to indicate the region and range of cavitation. The vapor volume fraction can be calculated by the vapor transport equation. The Schnerr and Sauer cavitation model can be expressed as:
t ( α ρ v ) + ( α ρ v V v ) = R e R c
α is the vapor phase volume fraction; ρ v is the vapor phase density; V v is the vapor phase velocity; R e is the liquid to vapor phase transition velocity; R c is the vapor to liquid phase transition velocity.
When P v P , there is
R e = ρ v ρ l ρ α ( 1 α ) 3 B 2 3 ( P v P ) ρ l
When P v < P , there is
R c = ρ v ρ l ρ α ( 1 α ) 3 B 2 3 ( P v P ) ρ l
ρ is vapor phase and liquid phase mixing density, P v is the value of the critical pressure at the transition from the liquid phase to the vapor phase, and the effect of turbulence on the saturated vapor pressure is taken into account in its expression.
P v = P s a t + 1 2 ( c o e f f ) ρ l k l
P s a t is the saturated vapor pressure of liquid; c o e f f is the empirical parameter; k l is liquid turbulent kinetic energy.

2.2. Mass Flow Model

Due to the short injection pulse width time, it can be assumed that there is no heat exchange with the outside during the process and that the fluid temperature remains constant and incompressible. Ignoring the effect of gravity, the inlet velocity of the control valve is V 1 = 0 . According to the non-constant Bernoulli equation for a non-viscous incompressible fluid.
V 1 2 2 + P 1 ρ l = V 2 2 2 + P 2 ρ l
where P 1 is the rail pressure, P 2 is the back pressure, ρ l is the diesel density, V 1 is the inlet velocity, and V 2 is the outlet velocity.
Mass flow rate calculation equation:
m = C d ρ Q ( t ) = C d ρ V 2 A
where m is the actual mass flow, C d is the flow coefficient, Q ( t ) is the instantaneous volume flow, and A is the flow cross-sectional area of the outlet throttle.
The control valve response rate equation is obtained by the association of Equations (6) and (7) as follows.
m = C d A 2 ρ ( P 1 P 2 )
According to the force analysis of the injector needle valve body, the motion equation of the needle valve is expressed as:
M d 2 x d t 2 = P r A N e P c A N k ( x + x 0 ) G f d x d t
In the Equation (9), M is the mass of the needle valve assembly, P r is the rail pressure, P c is the control chamber pressure, A N e is the effective pressure-bearing area of the needle valve in the pressure storage chamber, A N is the effective pressure-bearing area of the needle valve in the control chamber, k is the elastic coefficient of the needle valve spring, x is the needle valve lift, x 0 is the initial displacement of the needle valve spring, G is the weight of the needle valve assembly, and f is the friction coefficient of the needle valve. According to the motion equation of the needle valve, it can be seen the pressure change inside the control chamber determines the movement of the needle valve, so the injector is adjusted by the pressure change inside the control chamber to achieve control of the movement of the needle valve.
Without considering the temperature effect of the fuel compression process, the control chamber continuity equation expressed by the elastic modulus E is:
d p c d t = E u c x ( m i n m o u t π 4 d 2 2 d x d t )
m i n = C b π d i n 2 4 2 ( P r P c ) / ρ
m o u t = C d π d o u t 2 4 2 ( P c P 0 ) / ρ
m i n is the inlet throttle mass flow rate, m o u t is the outlet throttle mass flow rate, d i n is the inlet throttle diameter, d o u t is the outlet throttle diameter, C b is the inlet throttle flow coefficient, C d is the outlet throttle flow coefficient, and P 0 is back pressure.
According to the continuity equation, it can be seen the pressure of the control chamber is determined by the flow characteristics of the inlet throttle and outlet throttle. As can be seen from Equation (10), the inlet throttle and outlet throttle are important structures of the injector control valve, the aperture directly affects the change of the fuel pressure in the control chamber, thereby affecting the response speed of the injector. As the minimum orifice between the control chamber and the low-pressure chamber, the outlet throttle orifice plays a major role in throttling the fuel pressure relief, and its diameter has an important influence on the discharge rate of high-pressure fuel in the control chamber.

3. Numerical Modeling and Validation

Spherical control valves are widely used in common rail injectors because they can be opened and closed quickly. However, in the process of lifting the spherical valve, the high-pressure fuel in the control chamber rapidly passes through the flow section between the spherical valve and the valve seat, and the difference in flow characteristics inevitably results from the high-pressure difference between the import and export of the control valve, causing a sharp change in pressure and flow rate and leading to a serious cavitation effect at the spherical valve and valve seat. Based on the above calculation model, this section conducts a detailed study on the internal flow characteristics of the spherical control valve.

3.1. Geometry Structure and Boundary Condition Settings of Spherical Control Valve

In this paper, the simulation study focuses on the cavitation effect inside the injector control valve. The geometric model of the control valve is established and meshed, the structure schematic and calculation mesh are shown in Figure 1a,b, respectively, and its geometric dimensions are shown in Table 1. Transient simulations were carried out using Fluent software for the inner flow channel model of the control valve, with boundary conditions obtained from a one-dimensional model and an operating speed of 3800 r/min. In order to make the simulation results fit better to the actual effect, the motion setting of the spherical valve is implemented by user-defined function (UDF) compilation.
The detailed parameters of the boundary conditions are set as follows: (1) The standard k-ε turbulence model is used. (2) Diesel is selected as the flow medium, with the density of diesel is 835 kg/m3, the dynamic viscosity is 0.0025 kg/m−1, and a surface tension of 0.02 N. The vapor diesel density is 0.029 kg/m3 with a viscosity of 3.1 × 10⁻⁶ Pas, the initial bubble diameter is 1 × 10⁻⁶ m, and the saturation vapor pressure is 380 Pa. (3) The inlet and outlet conditions of the control valve are pressure boundaries, with an inlet pressure of 180 MPa and an outlet pressure of 0.2 MPa.

3.2. Mesh Independence Verification

In general, the higher the mesh density of the calculation model, the more accurate the calculation results. However, when the mesh density increases to a certain extent, the impact on the simulation results becomes very small, while the computational time required for an encrypted mesh is increased exponentially. In order to save computing resources, the mesh-independent solution of the model is analyzed to obtain the optimal mesh density for simulation. The numbers of nodes in the encrypted mesh are 85 million, 115 million, 187 million, 225 million, and 282 million. The results in Figure 2 and Figure 3 show that as the total number of mesh increases from 1.86 million to 2.82 million, the mass flow rate at the outlet throttle and the average volume fraction of vapor in the control valve are essentially the same, but the calculation time increases significantly. Therefore, the total number of mesh is set to 1.86 million to meet the requirement of computational accuracy in less time.

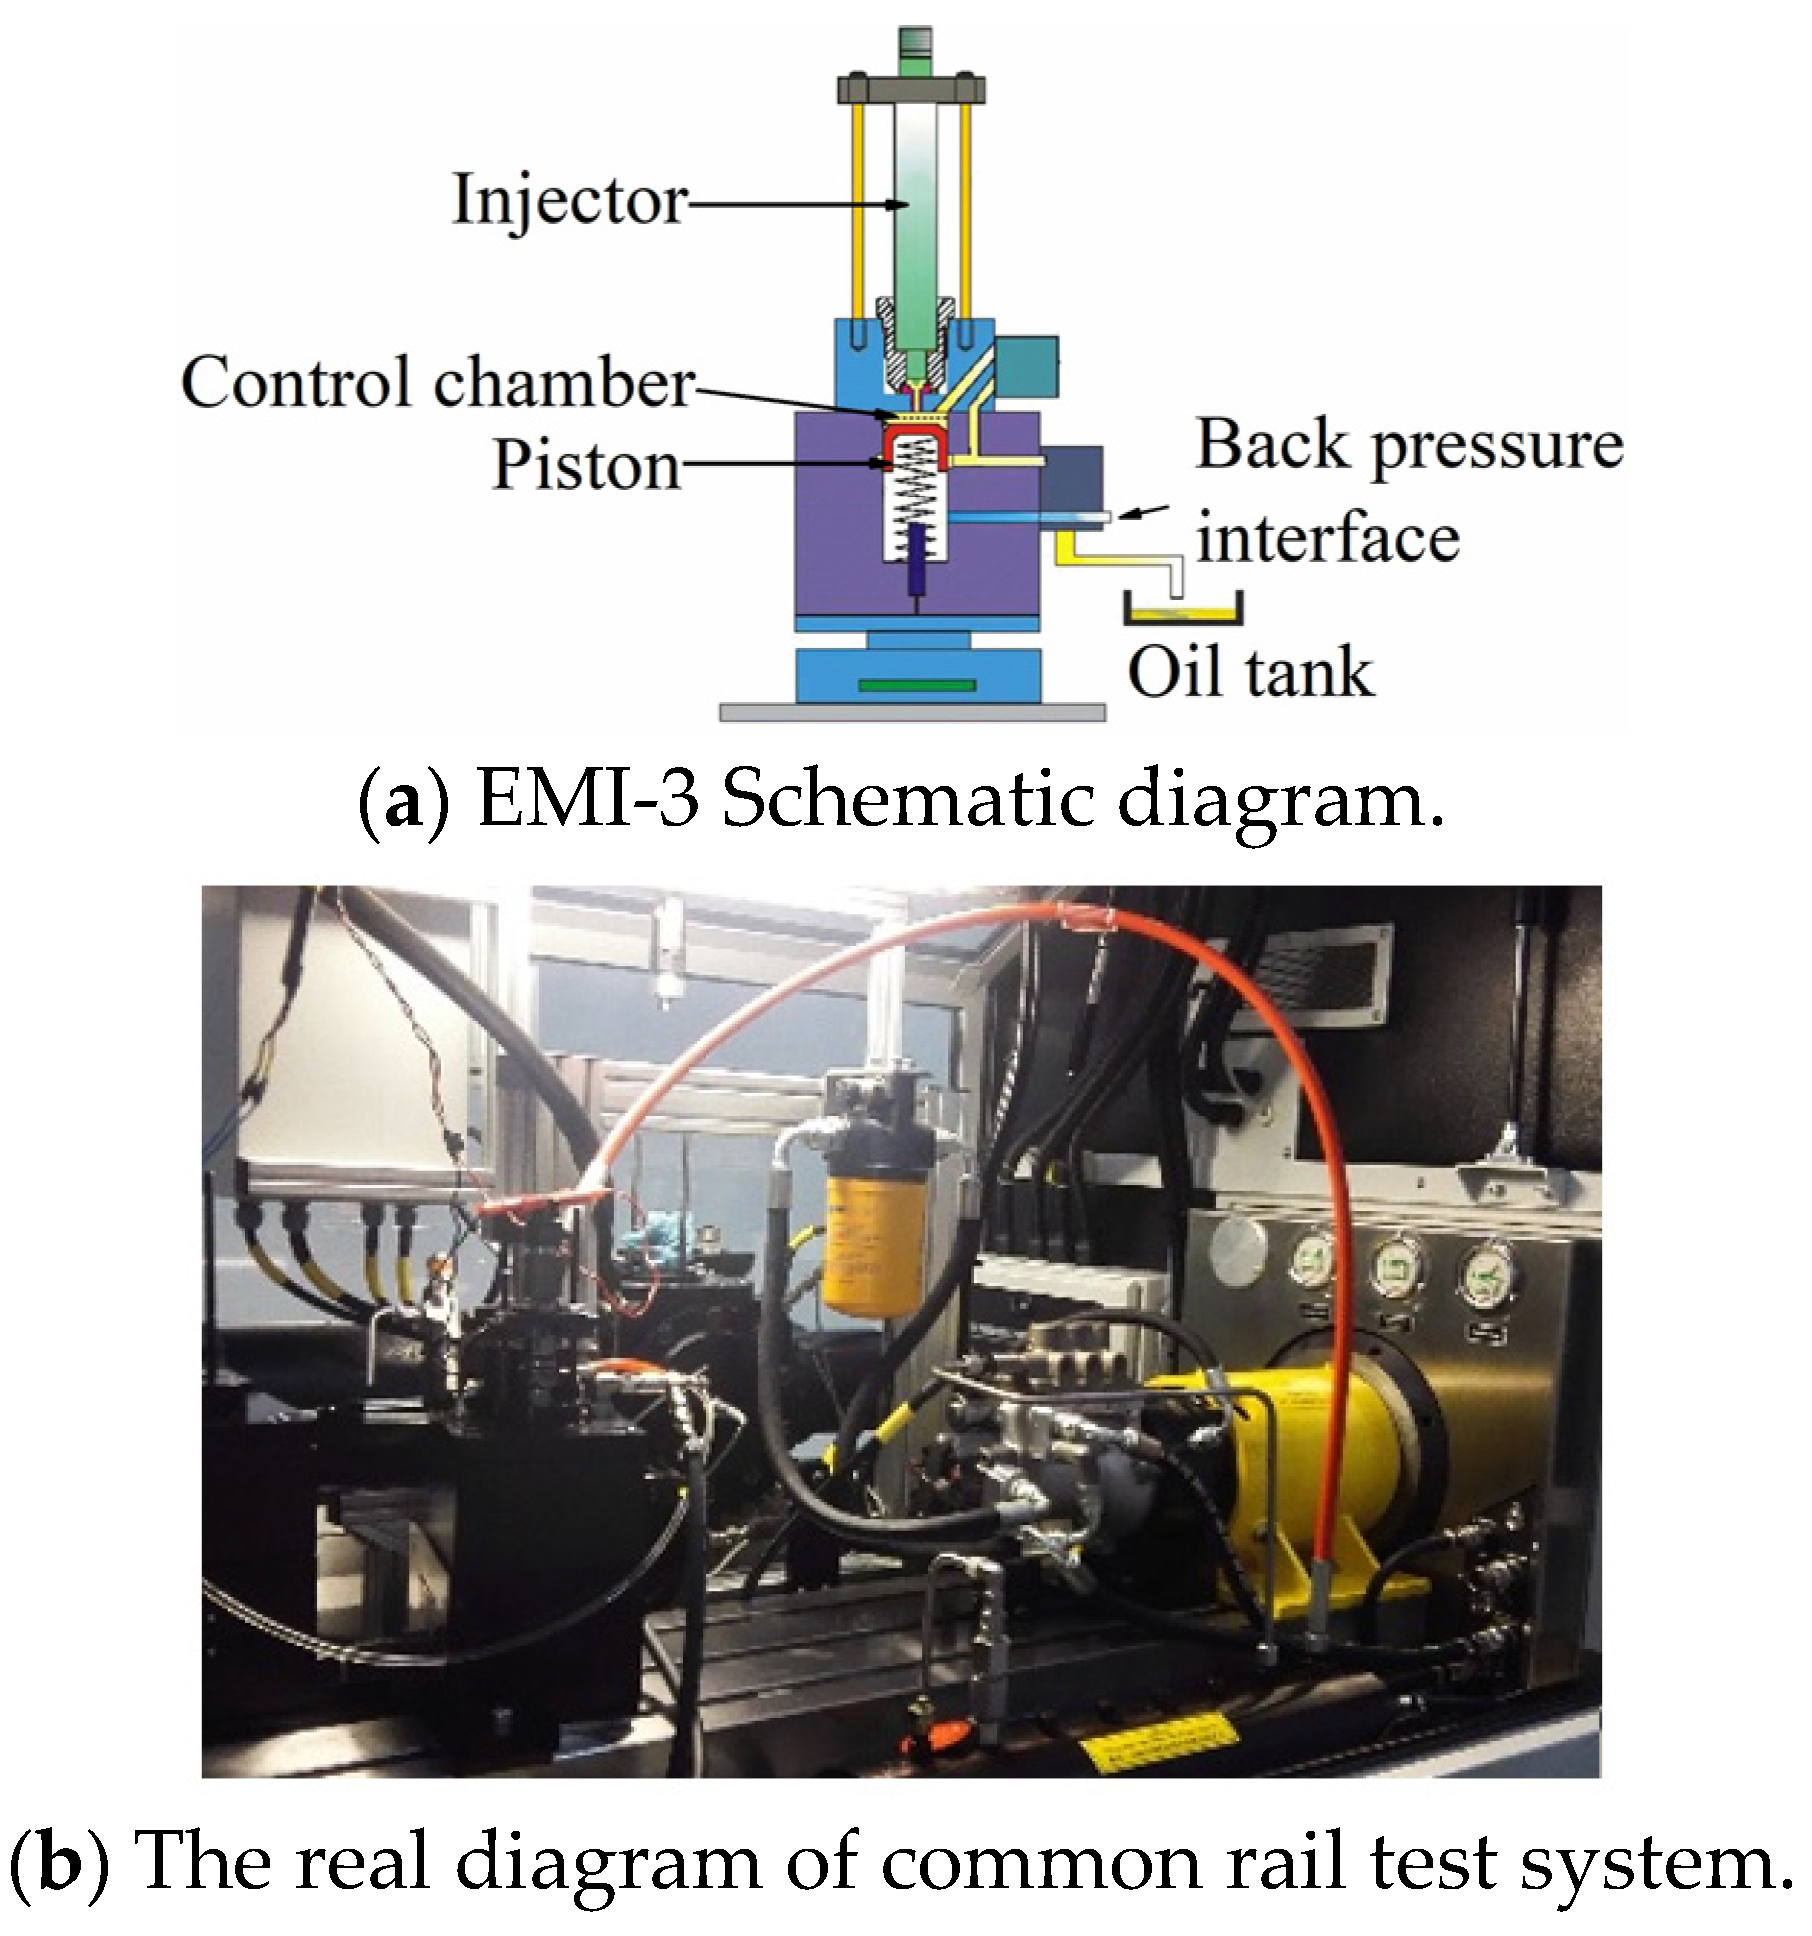
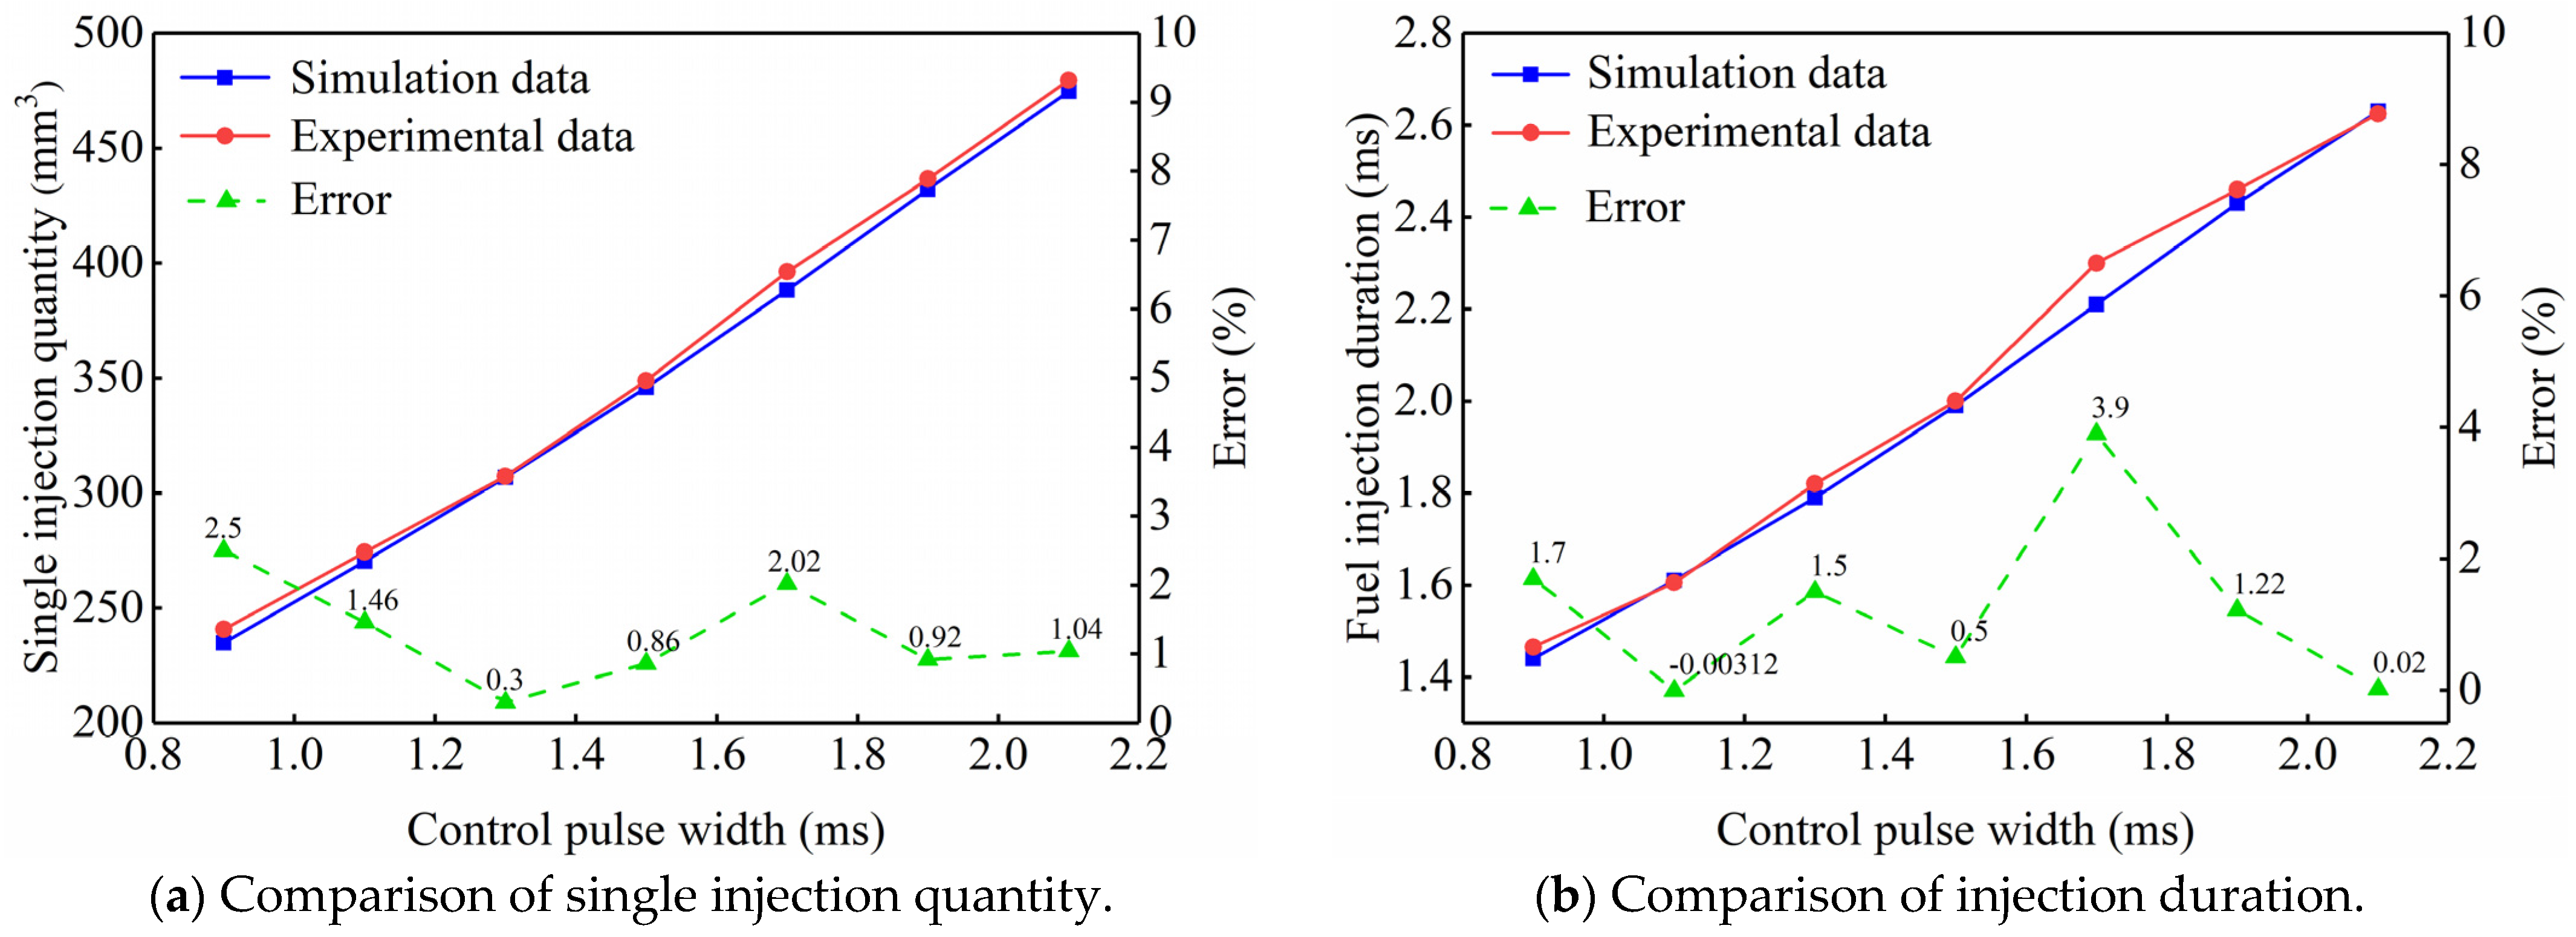
3.3. Model Validation

Due to the limitation of measurement methods and test equipment, the internal flow and cavitation of the control valve cannot be measured directly. Therefore, a 1D numerical model of the injector was established based on AMESim to verify the accuracy of the 3D model. Figure 4 gives the comparison of the mass flow rate of the outlet throttle between the 1D model and the non-cavitation 3D model. It can be seen from Figure 4 that the mass flow rate of the outlet throttle calculated by the 1D model and the 3D model has the same trend, and the maximum error is about 9.5%, which proves the accuracy of the 3D model. The error between the two computational models is due to the exclusion of the effect of the spatial structure of the control valve on the fuel flow in the 1D model and the fact that the spherical valve lift curve used in the simulation is a simplified curve. Secondly, the correctness of the 3D model was verified by comparing the images of the cavitation site obtained from the test and simulation. As shown in Figure 5a, the analysis of the calculated results of the cavitation phenomenon inside the control valve shows that the cavitation phenomenon mainly occurs at the surface of the spherical valve, the sealing cone surface and the outlet throttle orifice. Consistent with the results obtained from the control valve fatigue test [22] in Figure 5b, the cavitation ring is larger than the sealing ring because the area where strong cavitation occurs on the surface of the ball is up against the spherical valve drop seat impact area.
To verify and validate the numerical fluid model, a 10-cylinder high-speed high-power V diesel engine high-pressure common rail system was studied and an experimental bench for a high-pressure common rail system was built with five injectors on one side of the cylinder row. The common rail injector injection performance was tested using EMI-3 with a test range of 0–600 mm3, and the experimental equipment is shown in Figure 6. Table 2 shows the experimental test instruments and accuracy.
In order to verify the numerical model of the high-pressure common rail system developed in this paper, single-injection volume and injection duration tests were conducted on the common rail fuel system test bench shown in Figure 6, and the results are shown in Figure 7a,b. The maximum relative errors of single-injection volume and injection duration between the control valve 1D model and the experiment are 2.5% and 3.9%, respectively, for different pulse widths, and the validation results show that this computational model has good flow simulation accuracy.

4. Results and Discussion

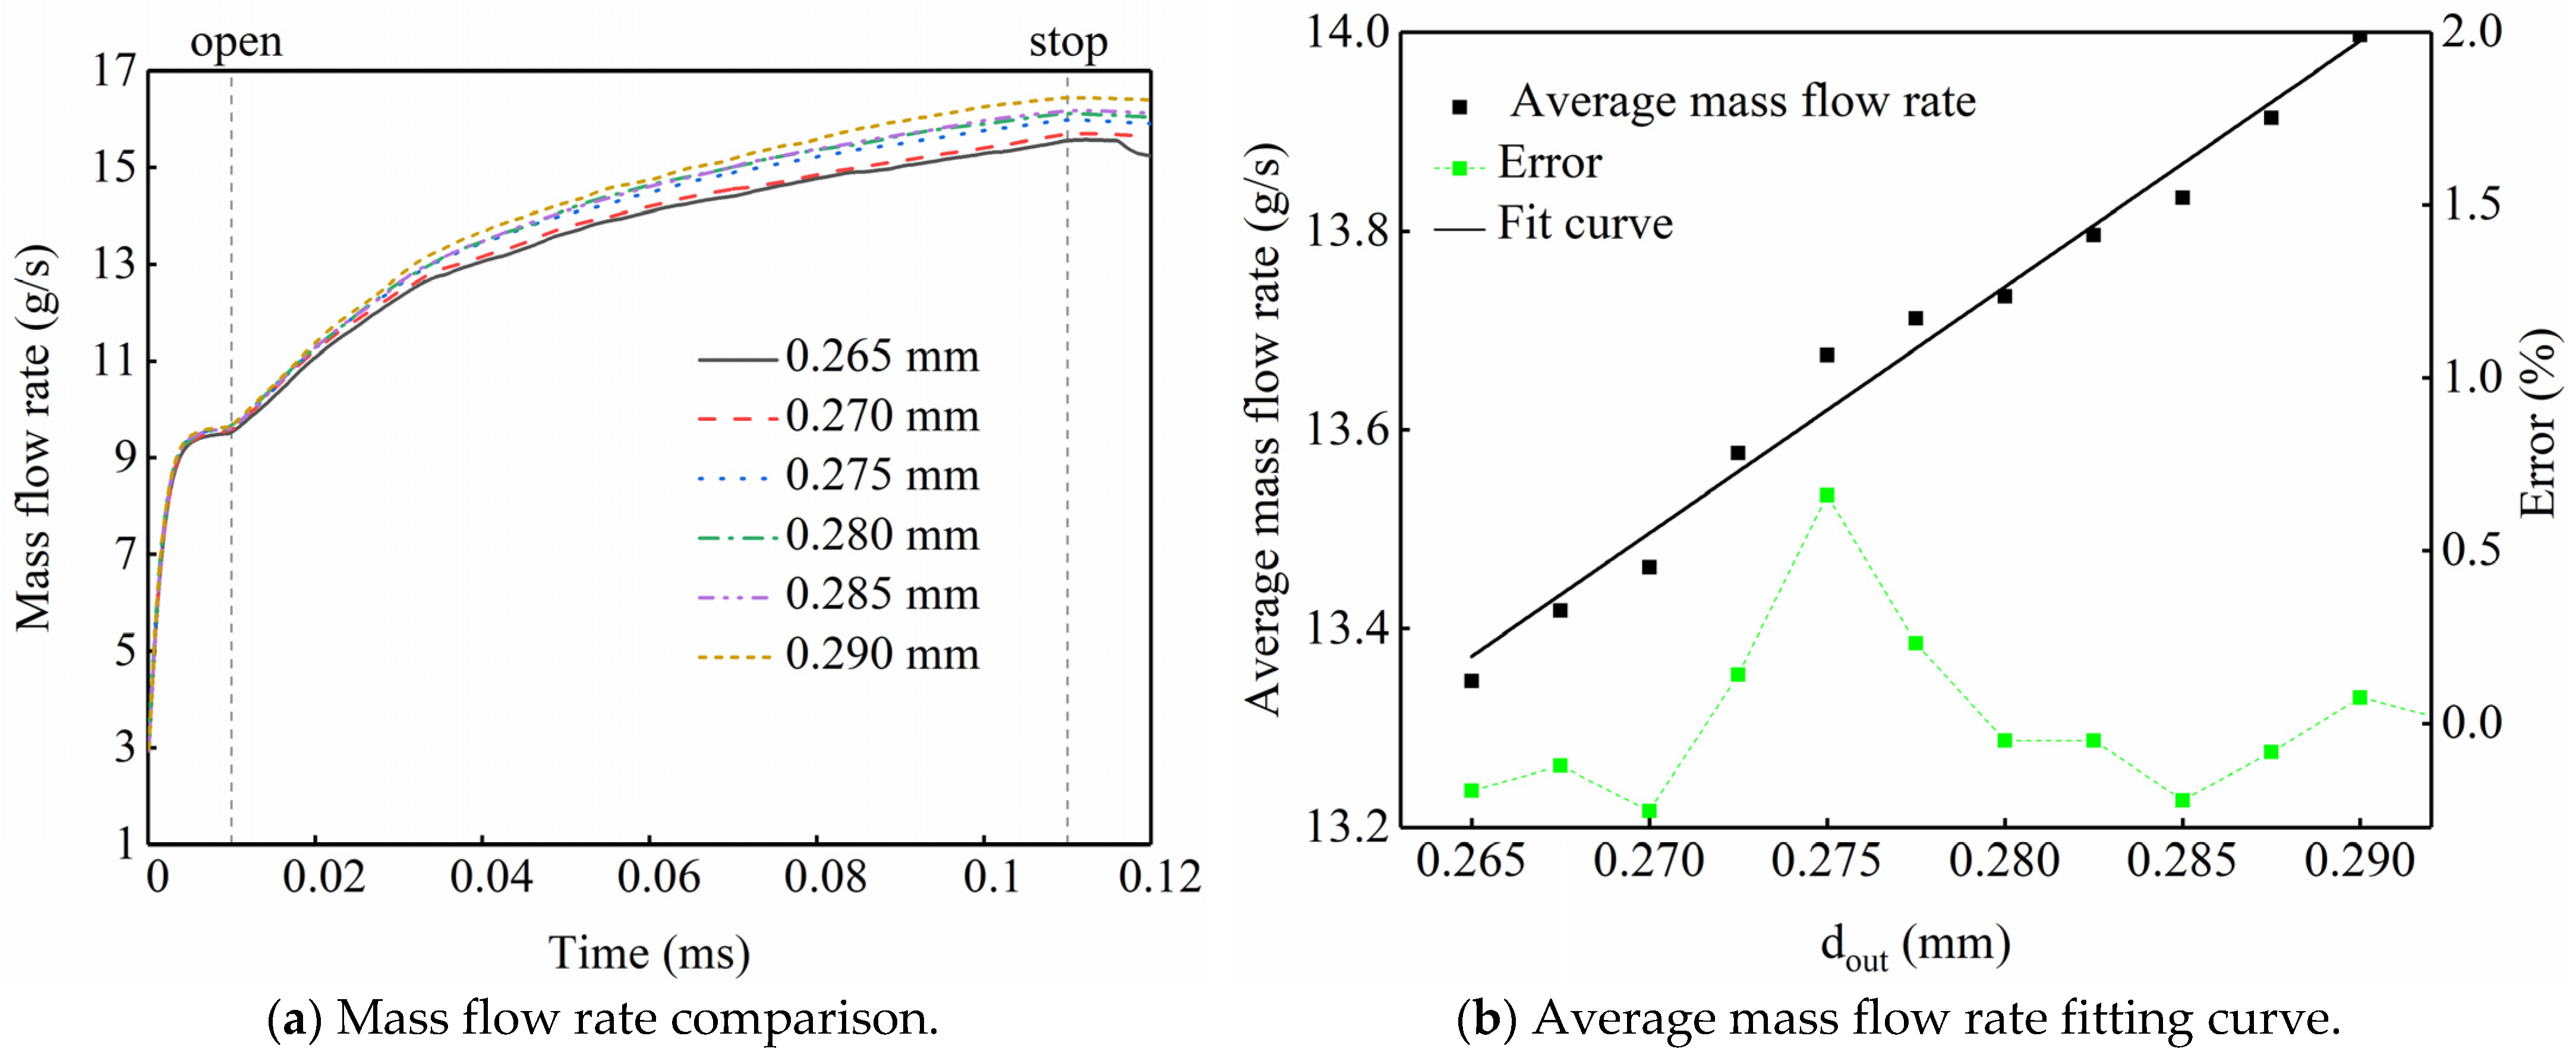
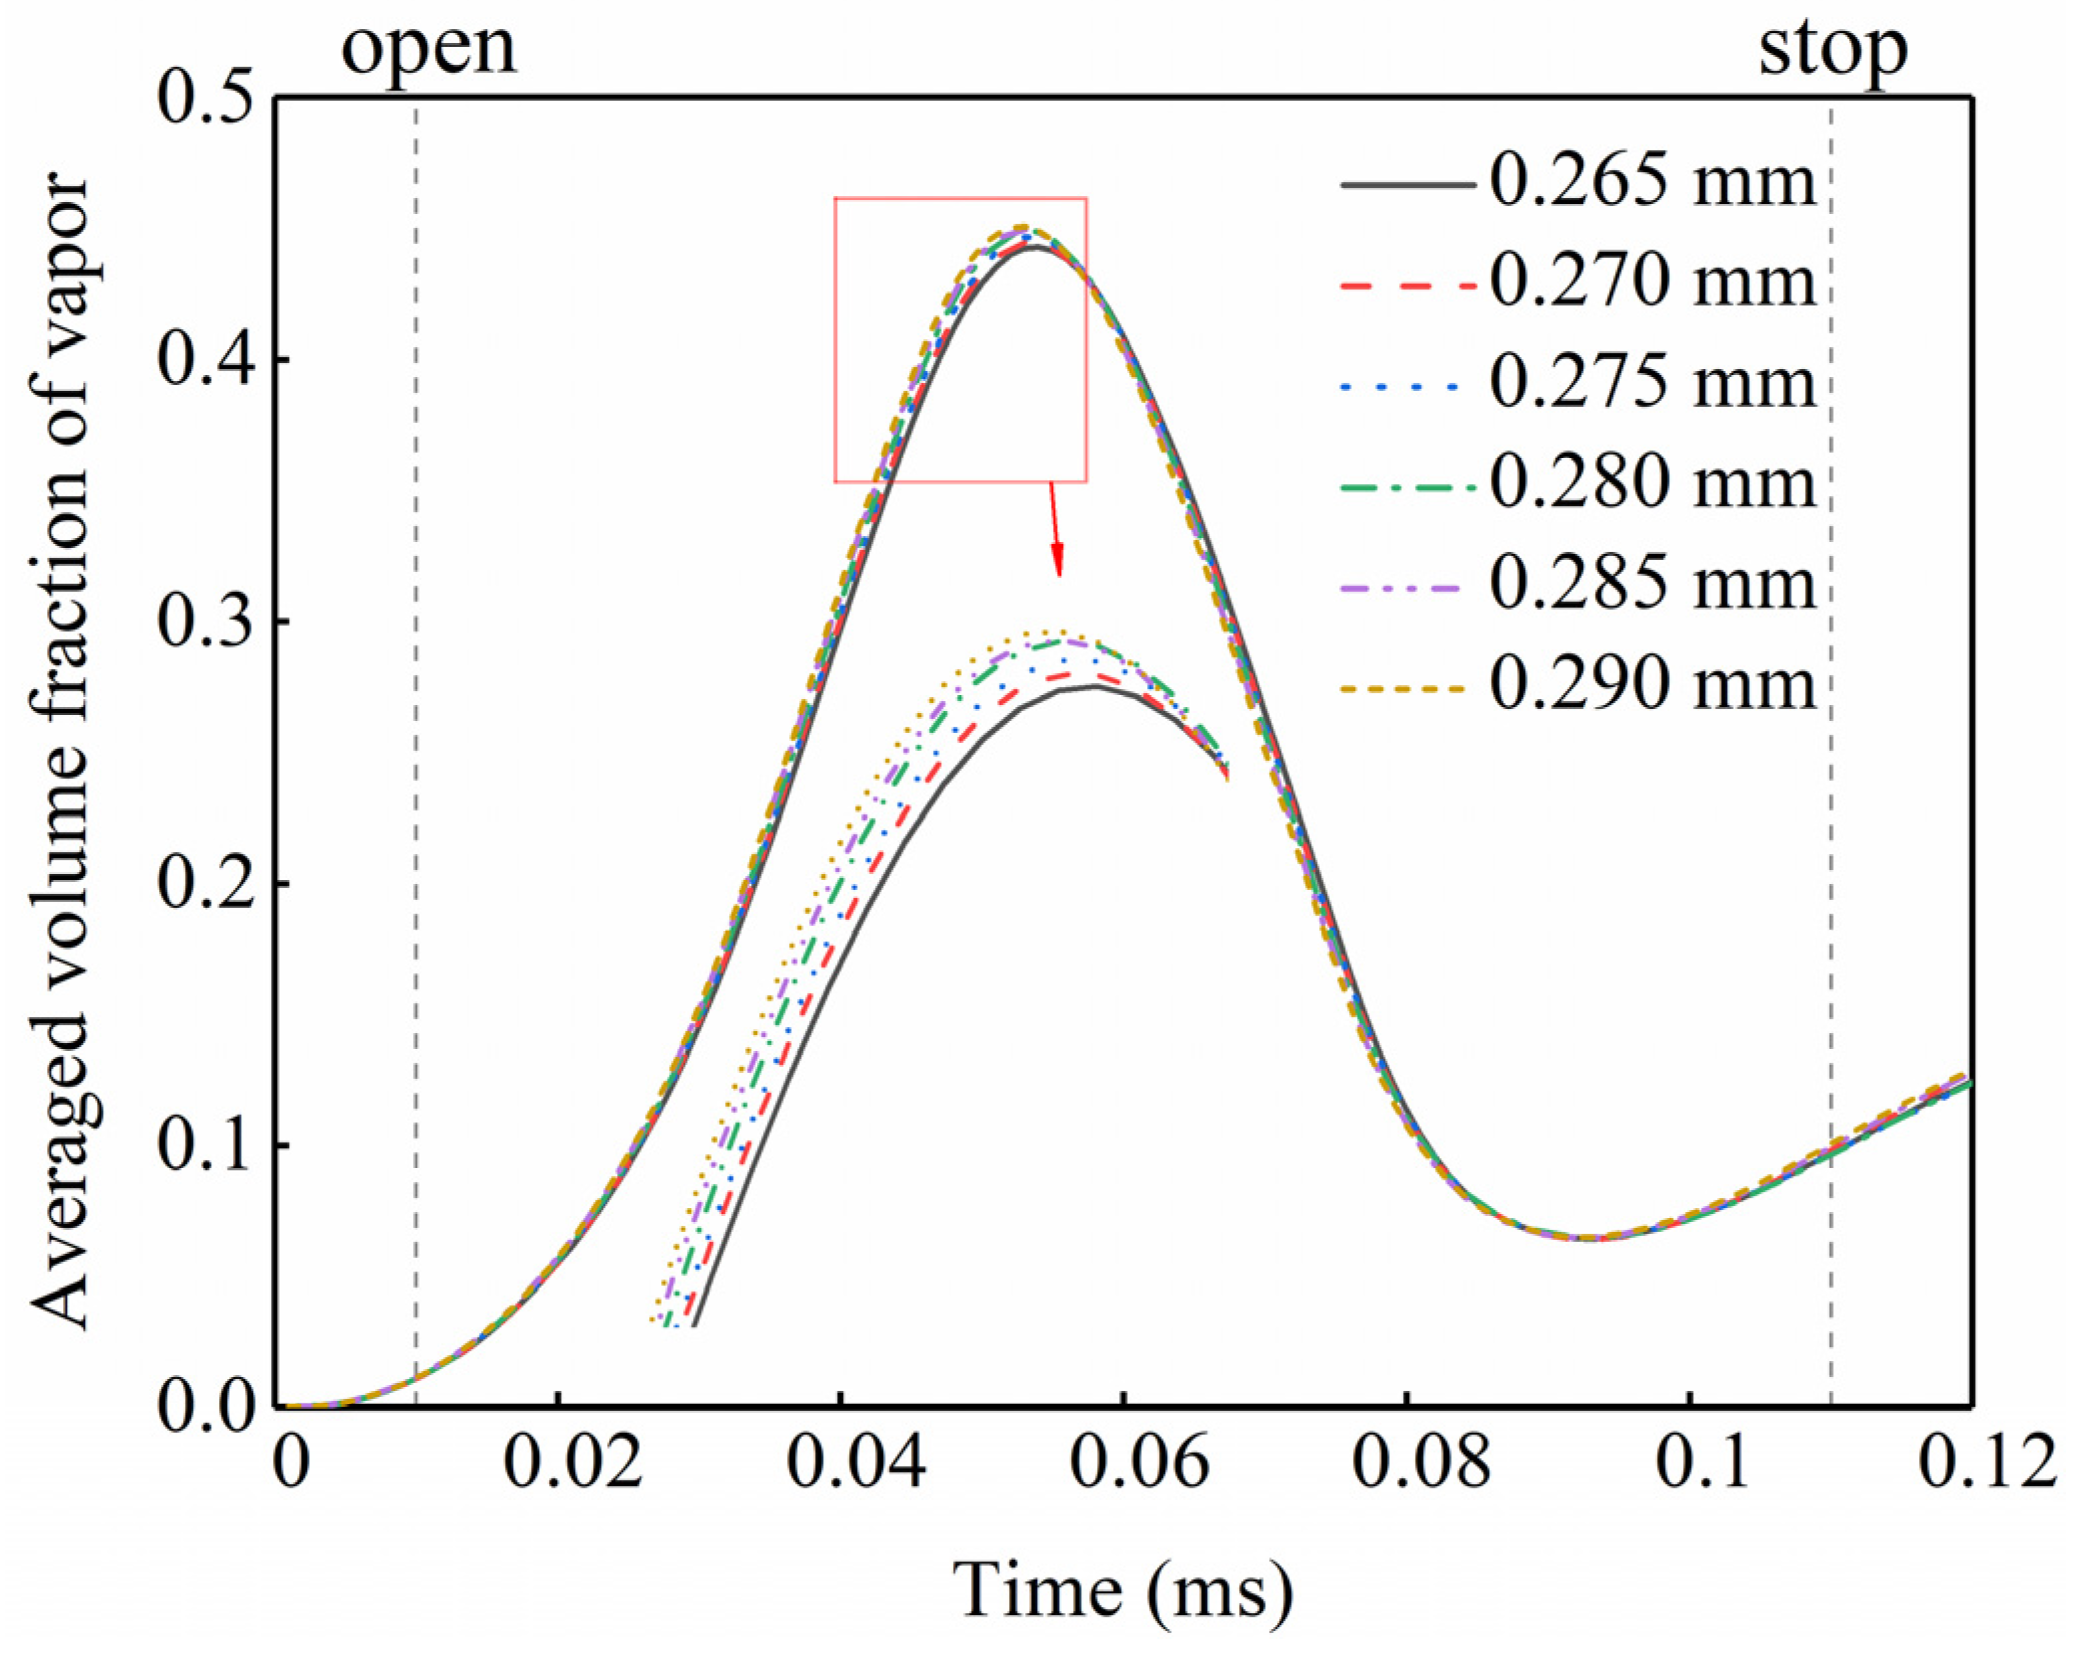
4.1. Sensitivity Analysis of Pressure Relief Rate under the Same Rail Pressure

The diameter of the reference outlet throttle of the control valve is 0.27 mm, and as the high-pressure common rail injector control valve controls the opening and closing of the injector, the structure is complex and precise, so the machining accuracy of the injector control valve is higher than that of other valves. Accordingly, the deviation of the outlet throttle diameter is set to ±0.005. Due to the limitation of the inlet throttle diameter, the specific geometric structure parameters of the outlet throttle diameter of each control valve used in the calculation are shown in Table 3. The schematic diagram of the control valve structure is shown in Figure 8.
In order to analyze the variation of the pressure relief rate of the control valve caused by the diameter deviation of the outlet throttle during the opening of the injector control valve, the sensitivity coefficient S r is used to analyze the influence intensity, and the expression is:
S r = Δ m Δ d o u t
where Δ d o u t represents the independent variable of the diameter deviation of the outlet throttle diameter, and Δ m is the dependent variable of the change of the average mass flow rate of the outlet throttle.
Under the current control valve structure, with the increase in outlet throttle diameter, the fuel drainage area in the outlet throttle increases, the drainage rate per unit time increases, the amount of fuel through the outlet throttle increases, and the time for the needle valve to reach the maximum lift time is shortened.
According to the mass conservation equation:
m o u t = C d ρ Q ( t ) = C d ρ V 2 A
where A is the cross-flow cross-sectional area of the outlet throttle and remains constant.
Equations (6) and (14) are combined to obtain:
P r P 0 ρ = V 2 2 ( 1 ( d 2 π 4 A ) 2 )
Figure 9a shows the curves of the effect of the deviation of the outlet throttle diameter on the mass flow rate of the outlet throttle at a rail pressure of 180 MPa and a back pressure of 0.2 MPa. As can be seen from Figure 10, the larger the outlet throttle diameter is for a certain rail pressure, the faster the fuel mass flow rate from the outlet throttle increases. Before 0.02 ms, the deviation of the outlet throttle diameter has a small effect on the fuel mass flow rate of the outlet throttle. As the spherical valve gradually opens, the larger the diameter of the outlet throttle, the fuel mass flow rate of the outlet throttle increases. Therefore, the pressure relief rate of the control valve accelerates with the increase in the outlet throttle diameter. According to Equation (12), the fuel flow from the outlet throttle during the opening of the spherical valve should be quadratically related to the diameter of the outlet throttle, but because the diameter of the outlet throttle varies in a small range, the fuel flow rate through the outlet throttle increases with the diameter of the outlet throttle and can be approximated as a linear change. Therefore, the fuel flow rate from the outlet throttle at an injection pressure of 180 MPa has a constant sensitivity coefficient to the diameter of the outlet throttle.
In order to better characterize the effect of the deviation of the outlet throttle diameter on the pressure relief rate of the control valve during the opening of the spherical valve, introduce the average mass flow rate, whose expression is:
m = Q o u t t
Q o u t is the fuel flow rate through the outlet throttle during the opening of the spherical valve, and t = 0.12 ms is the spherical valve opening time.
Based on the above analysis, the influence of outlet throttle diameter deviation on the average mass flow rate of the outlet throttle is obtained. Further increase the simulation sample size to establish the relationship of the influence of diameter deviation on the average mass flow rate of the outlet throttle, and the expression of the influence function of the diameter deviation of the outlet throttle can be obtained; the fitted curve is shown in Figure 9b. In order to describe the variation of the average mass flow rate of the outlet throttle with the diameter of the outlet throttle, the linear function is:
m = 24.77 d o u t + 6.81
Figure 10 shows the influence curve of the outlet throttle diameter deviation during the opening of the spherical valve on the value of the average vapor volume fraction inside the control valve. With the increase in the outlet throttle diameter, the control valve unloading rate increases, the fuel flow rate increases, the negative pressure region increases, and the cavitation phenomenon intensifies, which leads to the accelerated development of cavitation to the control valve outlet, the average volume of the internal vapor phase increases, and the vapor phase volume reaches its maximum speed faster.
Whether the pressure of the control chamber is stable or not can be used to judge whether the needle valve is fully opened. The opening and closing of the needle valve is directly related to the rail pressure, and the higher the rail pressure, the shorter the opening process. As shown in Figure 11, the basic law curve of pressure drop in the control chamber when the rail pressure is 180 MPa and the outlet throttle diameter changes from 0.265 mm to 0.29 mm. As can be seen from Figure 11a, the control chamber pressure decreases as the diameter of the outlet throttle increases, and the maximum drop in control chamber pressure remains constant after the spherical valve is fully opened. With the outlet throttle diameter of 0.265 mm and 0.29 mm, the pressure in the control chamber after the spherical valve is opened drops about 71.69 MP and 83.69 MPa, which is about 60.17% and 53.42% of the rail pressure, respectively, as shown in Figure 11b.

4.2. Sensitivity Study of Pressure Relief Rate under Different Rail Pressures

4.2.1. Analysis of The Influence Law of Rail Pressure on Hydraulic Characteristics

Figure 11 shows the injector control valve response law curves under different rail pressures. It can be seen from Figure 12a that with the opening of the spherical valve, the fuel rate in the outlet throttle hole increases rapidly, which is due to the opening of the spherical valve and the increase in the flow section between the spherical valve and the sealing seat surface, resulting in a rapid increase in the fuel rate in the outlet throttle hole. During the opening process of the spherical valve, the increase in the fuel rate in the outlet throttle increases with the increase in the rail pressure. According to the mass flow calculation formula m = C d A 2 ρ ( P 1 P 2 ) , the increase in the response rate is proportional to the square ( P 1 P 2 ) of the pressure difference.
Figure 12b shows the average mass flow rate of the outlet throttle during the opening of the control valve and the variation of the outlet velocity of the outlet throttle with the rail pressure at 0.059 ms. The average mass flow rate of the outlet throttle and the average velocity of the outlet show the same variation pattern, both increase with the increase in the rail pressure, and the increasing trend is convergent.
Figure 13 displays the average vapor volume fraction, vapor–liquid, and pressure distribution clouds in the outlet throttle at different rail pressures with the spherical valve fully open. It can be seen from Figure 13 that cavitation occurs in the outlet throttle 0.08 ms after the spherical valve is opened for 0.08 ms (spherical valve lift is 0.045 mm), and the proportion of vapor phase volume in the outlet throttle increases with the increase in rail pressure. Therefore, the flow coefficient and the circulation area in the mass flow rate calculation Equation m = C d A 2 ρ ( P 1 P 2 ) changes due to the increase in the rail pressure. With the increase in rail pressure, the low-pressure area on the inner wall of the outlet throttle increases, cavitation is enhanced, the volume of the gas phase increases, and the effective fuel flow cross-sectional area decreases. When the rail pressure is 240 MPa, the vapor phase volume fraction in the outlet throttle is about 0.049 when the spherical valve is fully open. Comparison analysis of Figure 12a shows that with the increase in rail pressure outlet throttle mass flow rate increase becomes smaller, by 0.11 ms moment pressure field and cavitation development process to see that the control valve inlet and outlet pressure difference increases, which makes the flow velocity of the vapor phase and the liquid phase in the outlet throttle increase, and the response rate is faster to stabilize.
The pressure distribution curves at points a, b, c, d, and e of the control valve sealing wall at rail pressure Pr = 120 MPa, 150 MPa, 180 MPa, 210 MPa, and 240 MPa are given in Figure 14 to explore the pressure distribution at the sealing wall under the impact of fuel jet during the opening of the spherical valve. High-pressure fuel impacts the sealing wall instantly at the entrance of the seating surface to produce very high pressure, and at the moment the spherical valve begins to move to the maximum (see Figure 14a–d), this is due to the high-pressure fuel impact on the wall when the speed decreases sharply. The fuel pressure builds up so that the resulting surge wavefront surface after the liquid compressibility cannot be ignored so that the density pressure suddenly increases, followed by pressure release. The fuel pressure builds up in the form of lateral jets, and the pressure is reduced to a relatively stable state, as in Figure 14e. Figure 14 clearly shows that the pressure on the sealing wall surface increases with the increase in rail pressure, and the wall pressure is basically a symmetrical distribution and the maximum pressure appears at the edge of the entrance of the seating surface, as shown in Figure 14a, and the pressure along the sealing wall surface gradually decreases, as shown in Figure 14b–e, which is caused by the sudden turn of the high-pressure fuel at the entrance of the sealing wall surface and the gradual spread to both sides.

4.2.2. Coupling Effect of Rail Pressure and Outlet Throttle on Pressure Relief Rate

Figure 15 illustrates the curves of the effect of the deviation of rail pressure and outlet throttle diameter on the coupling of the mass flow rate of the outlet throttle during the opening of the spherical valve. Figure 15a demonstrates the variation of the average mass flow rate with the deviation of diameter at different rail pressure, which shows that the average mass flow rate increases with the increase in rail pressure at the same outlet throttle diameter. The average mass flow rate of the outlet throttle increases approximately linearly with the increasing diameter of the outlet throttle at different rail pressures. In order to investigate the effect of rail pressure on the sensitivity coefficient of the diameter deviation of the outlet throttle, the sensitivity coefficient corresponding to the diameter deviation of the outlet throttle under different rail pressures is obtained according to the definition of the sensitivity coefficient in Equation (13), and the relationship between the coupling of rail pressure and diameter deviation on the response rate of the control valve is established; the fitted curve is shown in Figure 15b. The sensitivity coefficient corresponding to the outlet throttle diameter increases nonlinearly with increasing rail pressure, indicating that the increase in rail pressure leads to an increase in the sensitivity of the average mass flow rate of the outlet throttle to the outlet throttle diameter.
Showing that in order to be able to express the average mass flow rate in the outlet throttle with the diameter deviation and rail pressure coupling effect relationship and to obtain the rail pressure to increase the outlet throttle diameter deviation on the control valve pressure relief rate of the function expression, Figure 15b presents the slope (sensitivity factor) of the average mass flow rate of the outlet throttle at different rail pressures and the average mass flow rate of the outlet throttle at dout = 0.265. The initial value and slope increase approximately exponentially with increasing rail pressure, so let the initial value fitting function be:
m d = 0.265 = f ( P r ) = f 0 + A e R 0 * P r
Then f 0 = 27.50696, A = −22.86864, R 0 = −0.00266, and the fitted residual sum of squares RSS = 1.85089 × 10⁻⁶; the coefficient of determination R-square = 0.99997.
b = m a d o u t = m d = 0.265 0.265 a
Let the fitted function of the average mass flow rate of the outlet throttle with the deviation of the outlet throttle diameter with the variation of the rail pressure during the opening of the spherical valve be:
a = y ( P r ) = y 0 + A 1 e R 1 * P r
Then y 0 = 57.43755, A1 = −48.03459, R1 = −0.00219, fitted sum variance SSE = 0.02395; the coefficient of determination R-square = 0.99895.
Combining Equations (17)–(19) yields:
m = a d + b = a d + m d = 0.265 0.265 a = y ( P r ) ( d 0.265 ) + f ( P r )
Figure 16 suggests the curves of the effect of different rail pressure coupled with the deviation of the outlet throttle diameter on the control chamber pressure. The opening and closing of the needle valve is directly related to the rail pressure. The higher the rail pressure, the shorter the time required for the opening process, that is, the faster the opening. Figure 16a shows the influence curve of the deviation of outlet throttle diameter on the control chamber pressure change rate when the rail pressure is 120 MPa, 150 MPa, 180 MPa, 210 MPa and 240 MPa, then the higher the rail pressure, the larger the control chamber pressure difference under different outlet throttle diameters. This means that the higher the rail pressure, the greater the influence of the deviation of outlet throttle diameter on the control chamber pressure change rate. Figure 16b is the change of control chamber pressure drop with outlet throttle diameter deviation after the spherical valve is opened at different rail pressures. The figure shows that the control chamber pressure drop increases with the increase in rail pressure, and the increase in rail pressure improves the sensitivity of the control chamber pressure change rate to the outlet throttle diameter deviation.

5. Conclusions

Based on the influence of the outlet throttle diameter deviation on the pressure relief rate of the control valve, the preferred region of the outlet throttle structure parameters in the control valve design stage is clarified, and the fitting formula for the difference in the pressure relief rate of the control valve caused by the outlet throttle diameter deviation under different rail pressures is proposed, which provides theoretical guidance for the optimal design of the outlet throttle structure. The conclusions of this paper are as follows:
(1) The increase in outlet throttle diameter increases the mass flow rate within the control valve, resulting in faster cavitation development toward the control valve outlet and an increase in vapor phase volume. During the opening of the spherical valve, the average mass flow rate of fuel through the outlet throttle orifice increases linearly with the increase in the outlet throttle orifice diameter.
(2) The rate of pressure change in the control chamber increases with the increase in the outlet throttle diameter, which accelerates the stabilization of the control chamber pressure. When the outlet throttle diameter is 0.29 mm, the pressure in the control chamber after the spherical valve is opened drops about 83.69 MPa, which is about 53.42% of the rail pressure.
(3) The average mass flow rate and the average exit velocity of the outlet throttle both increase with the increase in rail pressure. The increase in rail pressure increases the low-pressure area on the inner wall of the outlet throttle, increases the proportion of gas phase, decreases the effective fuel flow cross-sectional area, and decreases the increase in fuel mass flow rate.
(4) High-pressure fuel impacts the sealing wall instantly at the entrance of the wall to produce a very high pressure, and the moment the spherical valve begins to move to reach the maximum, the pressure on the sealing wall increases with the increase in rail pressure. The wall pressure is basically a symmetrical distribution and the maximum pressure appears at the edge of the entrance to the seat, and along the sealing seat the pressure gradually decreases.
(5) The sensitivity of the average mass flow rate of the outlet throttle and the rate of pressure drop in the control chamber to the diameter of the outlet throttle increases with the increase in the rail pressure. Based on this, a fitting function is proposed to calculate the effect of the diameter of the outlet throttle and the rail pressure on the average mass flow rate through the outlet throttle during the opening of the spherical valve, which provides a theoretical basis and reference for the design of the manufacturing tolerance and error control of the outlet throttle diameter.
To further extend the influence of the outlet throttle structure, factors such as the inlet chamfer of the outlet throttle, the roughness of the inner wall of the outlet throttle, the temperature of the fuel, and other parameters should be considered to establish a more complete theoretical model.

Author Contributions

R.R., T.S. and F.M. completed the flow characteristics of the injector control valve overview; X.Z., C.X. and W.Y. analyzed the research status about flow characteristics of the injector; R.R. performed research and analysis and wrote the manuscript. All authors have read and agreed to the published version of the manuscript.

Funding

This research was supported by the Fundamental Research Program of Shanxi Province (grant No. 202103021224216).

Acknowledgments

The authors are grateful to the Fundamental Research Program of Shanxi Province (grant No. 202103021224216) for provision of funding.

Conflicts of Interest

The authors declare no conflict of interest.

References

  1. Agarwal, A.K.; Kumar, V.; Kalwar, A.A. Fuel injection strategy optimisation and experimental performance and emissions evaluation of diesel displacement by port fuel injected methanol in a retrofitted mid-size genset engine prototype. Energy 2022, 248, 123593. [Google Scholar] [CrossRef]
  2. Zacherl, F.; Wopper, C.; Schwanzer, P.; Rabl, H. Potential of the Synthetic Fuel Oxymethylene Ether (OME) for the Usage in a Single-Cylinder Non-Road Diesel Engine: Thermodynamics and Emissions. Energies 2022, 15, 7932. [Google Scholar] [CrossRef]
  3. Li, H.D.; Xing, Y.L.; Ge, Q.S. The influence of lubricating oil on deposits formation in a diesel engine under the operation condition of high power density. Lubr. Sci. 2013, 25, 441–451. [Google Scholar]
  4. Leng, L.; Qiu, H.J.; Li, X.N.; Zhong, J.; Shi, L.; Deng, K.Y. Effects on the transient energy distribution of turbocharging mode switching for marine diesel engines. Energy 2022, 249, 123746. [Google Scholar] [CrossRef]
  5. Carlo, B.; Gabriele, D.B.; Giacomo, B. Experimental analysis of functional requirements to exceed the 100kw/l in high-speed light-duty diesel engines. Fuel 2017, 207, 591–601. [Google Scholar]
  6. Ranjeet, K.R.; Rashmi, R.S. Effective power and effective power density analysis for water in diesel emulsion as fuel in diesel engine performance. Energy 2019, 180, 893–902. [Google Scholar]
  7. Gao, Z.G.; Li, H.M.; Xu, C.L.; Li, G.X.; Wang, M. Control Strategy Based on Flow Conservation Equation for High-pressure Common Rail System. Int. J. Automot. Technol. 2022, 23, 793–803. [Google Scholar] [CrossRef]
  8. Catania, A.E.; Ferrari, A. Development and performance assessment of the new-generation CF fuel injection system for diesel passenger cars. Appl. Energy 2011, 91, 483–495. [Google Scholar] [CrossRef]
  9. Hu, Y.; Yang, J.G.; Hu, N. Experimental study and optimization in the layouts and the structure of the high-pressure common-rail fuel injection system for a marine diesel engine. Int. J. Engine Res. 2020, 22, 1850–1871. [Google Scholar] [CrossRef]
  10. Seoyeon, A.; Jungkwon, P.; Jongphil, W.; Hyunsoo, K.; Insan, K.; Yongseok, C.; Sukshin, S. An analytical FEM-based study of the drawing process of an ultra-high-pressure common-rail fuel tube. J. Mech. Sci. Technol. 2017, 31, 3389–3396. [Google Scholar]
  11. Wang, L.; Li, G.X.; Xu, C.L.; Xi, X.; Wu, X.J.; Sun, S.P. The Investigation of Geometric Parameters on the Injection Characteristic of the High Pressure Common-Rail Injector. J. Eng. Gas Turbines Power 2019, 141, 022801. [Google Scholar] [CrossRef]
  12. MA, F.K.; ZHAO, C.L.; ZHANG, F.J. Study of Hydraulic Response Characteristics of Common Rail Injector. In Proceedings of the 2013 International Conference on Frontiers of Environment, Energy and Bioscience (ICFEEB 2013), Beijing, China, 24–25 October 2013; pp. 687–692. [Google Scholar]
  13. Khandal, S.V.; Banapurmath, N.R.; Gaitonde, V.N. Effect of exhaust gas recirculation, fuel injection pressure and injection timing on the performance of common rail direct injection engine powered with honge biodiesel (BHO). Energy 2017, 139, 828–841. [Google Scholar] [CrossRef]
  14. Payri, R.; Salvador, F.J.; Gimeno, J.; Venegas, O. Study of cavitation phenomenon using different fuels in a transparent nozzle by hydraulic characterization and visualization. Exp. Therm. Fluid Sci. 2013, 44, 235–244. [Google Scholar] [CrossRef] [Green Version]
  15. Frédéric, B.; Patrice, S. Impact of physical properties of biodiesel on the injection process in a common-rail direct injection system. Energy Convers. Manag. 2009, 50, 2905–2912. [Google Scholar]
  16. Salvador, F.J.; Gimeno, J.; De la Morena, J.; Carreres, M. Using one-dimensional modeling to analyze the influence of the use of biodiesels on the dynamic behavior of solenoid-operated injectors in common rail systems: Results of the simulations and discussion. Energy Convers. Manag. 2011, 54, 122–132. [Google Scholar] [CrossRef]
  17. Jinwook, L.; Kyoungdoug, M. Effects of Needle Response on Spray Characteristics in High Pressure Injector Driven by Piezo Actuator for Common-Rail Injection System. J. Mech. Sci. Technol. 2005, 19, 1194–1205. [Google Scholar]
  18. Lan, Q.; Fan, L.Y.; Bai, Y.; Gu, Y.Q.; Wen, L.M. Correlation analysis upon the influential factors related to the dynamic response characteristics of pressure amplification piston in the fuel system for a low-speed diesel engine. Fuel 2020, 276, 118052. [Google Scholar] [CrossRef]
  19. Plamondon, E.; Seers, P. Parametric study of pilot–main injection strategies on the performance of a light-duty diesel engine fueled with diesel or a WCO biodiesel–diesel blend. Fuel 2019, 236, 1273–1281. [Google Scholar] [CrossRef]
  20. Chen, G.J.; Chen, C.; Yuan, Y.M.; Zhu, L.J.; Lou, X. The Effect of the Structure and Parameters of Diesel Injector on Atomization Characteristics. Integr. Ferroelectr. 2021, 219, 145–159. [Google Scholar] [CrossRef]
  21. Hu, Q.; Wu, S.F.; Stottler, S.; Raghupathi, R. Modelling of Dynamic Responses of an Automotive Fuel Rail System, PART I: Injector. J. Sound Vib. 2001, 245, 801–814. [Google Scholar] [CrossRef]
  22. Duan, L.; Yuan, S.Q.; Hu, L.F.; Yang, W.M.; Yu, J.D.; Xia, X.L. Injection performance and cavitation analysis of an advanced 250 MPa common rail diesel injector. Int. J. Heat Mass Transf. 2016, 93, 388–397. [Google Scholar] [CrossRef]
  23. Wang, C.; Li, G.X.; Sun, Z.Y.; Wang, L.; Sun, S.P.; Gu, J.J.; Wu, X.J. Effects of structure parameters on flow and cavitation characteristics within control valve of fuel injector for modern diesel engine. Energy Convers. Manag. 2016, 124, 104–115. [Google Scholar] [CrossRef]
  24. Ren, R.N.; Su, T.X.; Ma, F.K.; Wu, X.J.; Xu, C.L.; Zhao, X. Study of the influence laws of the flow and cavitation characteristics in an injector control valve. Energy Sci. Eng. 2022, 10, 932–950. [Google Scholar] [CrossRef]
Figure 1. Model of control valve.
Energies 16 00050 g001
Figure 2. Comparison of average volume fraction values of vapor.
Energies 16 00050 g002
Figure 3. Comparison of the mass flow rate of the outlet throttle.
Energies 16 00050 g003
Figure 4. Comparison of mass flow rates for outflowing control orifice between 1D and 3D.
Energies 16 00050 g004
Figure 5. Comparison of fatigue test cavitation damage of control valve seat with simulation observed by scanning electron microscope.
Energies 16 00050 g005
Figure 6. The diagram of common rail test system.
Energies 16 00050 g006
Figure 7. Comparison of 1D model and experiment.
Energies 16 00050 g007
Figure 8. The schematic diagram of the control valve structure.
Energies 16 00050 g008
Figure 9. Flow characteristic curve of control valve with outlet throttle diameter deviation.
Energies 16 00050 g009
Figure 10. Effect of the outlet throttle diameter deviation on the average vapor volume fraction.
Energies 16 00050 g010
Figure 11. Control chamber pressure variation with outlet throttle diameter.
Energies 16 00050 g011
Figure 12. The effect of rail pressure on the flow characteristics of control valves.
Energies 16 00050 g012
Figure 13. Pressure and gas phase volume distribution in the outlet throttle when the spherical valve is fully open.
Energies 16 00050 g013
Figure 14. Time history curve of wall pressure at five points (ae) on the sealing surface of the control valve.
Energies 16 00050 g014
Figure 15. The influence law of rail pressure and outlet throttle diameter deviation on the coupling of mass flow rate of outlet throttle.
Energies 16 00050 g015
Figure 16. The influence law of the deviation of rail pressure and outlet throttle diameter on the control chamber pressure coupling.
Energies 16 00050 g016
Table 1. Structural parameters of the control valve.
Structure NameParameter Setting
Quality of spherical valve2.5 g
Diameter of spherical valve1.3 mm
Lift of spherical valve0.06 mm
Spherical valve seat angle120 deg
Aperture of OZ0.25 mm
Aperture of OA0.27 mm
Diameter of seat orifice0.35 mm
Table 2. Test instruments and accuracy.
NameRangeAccuracy
Experimental system test pressure300 MPa±0.6 MPa
EMI3-1500600 mm3±0.5 mm3
Special fuel rail200,000
Siemens flowmeter1321 mL/min0.1% mL/min
Table 3. Simulative geometric dimensions of outlet throttle hole.
Numberdout/mm
10.265
20.270
30.275
40.280
50.285
60.290
Disclaimer/Publisher’s Note: The statements, opinions and data contained in all publications are solely those of the individual author(s) and contributor(s) and not of MDPI and/or the editor(s). MDPI and/or the editor(s) disclaim responsibility for any injury to people or property resulting from any ideas, methods, instructions or products referred to in the content.

