Abstract
The sources and sinks of dissolved CH4 in offshore waters are becoming diversified with the rapid increase in human activities. The concentration and air–sea exchange flux of dissolved CH4 present new characteristics of more intense spatiotemporal evolution, and the contribution to atmospheric CH4 continues to increase. Herein, a new model based on navigable air–sea exchange flux observations was proposed, which replaced the traditional station-based sampling analysis and testing method, realizing the synchronous measurement of methane in the atmosphere and surface seawater carried by ships. Based on the Marine Geological Survey project of the China Geological Survey, comprehensive environmental surveys were conducted in April 2018, September 2018, and June 2019 in the Qiongdongnan area in the northern part of the South China Sea, and the dissolved methane content in the sea surface atmosphere and surface seawaters in 2019 were simultaneously obtained. The methane exchange flux ranges of the southeastern sea area were calculated as −0.001~−0.0023 μmol·m−2·d−1 and −0.00164~−0.00395 μmol·m−2·d−1 by using the Liss and Merlivat formula (LM86), the Wanninkhof formula (W92), and the field-measured wind speed. The feasibility of the navigational air–sea methane exchange flux observation system was proven in a sea trial, and the measurement accuracy and observation efficiency of air-sea flux were improved with the designed system, providing a new technical means for further research on multiscale air–sea interactions and global climate change.
1. Introduction
The atmospheric boundary layer (1~1.5 km) with the ocean as the underlying surface is known as the ocean–atmospheric boundary layer, which is the bridge of material and energy exchange between the ocean and the atmosphere. Due to the sharp intensification of human activities (such as land-source river input, oil and gas exploitation, sea reclamation, and land building) in recent years, offshore dissolved CH4 shows the diversification of sources and sinks. The concentration and sea–gas exchange flux of CH4 are characterized by more drastic spatiotemporal evolution [1], and the contribution to atmospheric CH4 also continues to increase [2,3,4]. The coupling effect of human activities and natural processes on the spatiotemporal evolution of ocean CH4 source and sink processes and the air–sea exchange flux has attracted increasing attention from countries [5,6,7,8,9]. Therefore, it is important to study the carbon exchange between the ocean and the atmosphere and organically combine the distribution characteristics of dissolved methane content in the ocean, atmosphere, and seawater. More systematic and targeted observational research on the ocean–air exchange flux is urgently needed, which promotes a more precise investigation of the ocean–atmosphere cycle of CH4 and evaluates the impact on climate and environmental changes.
The earliest observations of dissolved CH4 in seawater began in the 1950s with purge and trap-gas chromatography [10]. Subsequently, based on Dalton’s gas partial pressure law and Henry’s law, marine scientists successively developed observation technologies for dissolved CH4 in seawater, such as headspace equilibrium-gas chromatography [11], vacuum degassing-gas chromatography [12], the membrane method [13], and water vapor balancing-optical cavity ring-down spectroscopy [14,15]. At present, headspace equilibrium gas chromatography is employed to measure the content of atmospheric methane on the sea surface [11], and purge and trap-gas chromatography is used to determine the content of dissolved methane in surface water [10]. However, these traditional gas chromatography and other optical methods have the disadvantages of poor stability, high operating cost, and poor linearity [16,17]. In addition, field discrete sampling and land laboratory measurements must be conducted by traditional methods, and sample loss is inevitable in the process of collection and transportation, which reduces the measurement accuracy of the air–sea exchange flux to a certain extent.
Previous data showed that the distribution characteristics of methane concentration in the marine atmosphere presented distinct spatial and temporal heterogeneity [18,19], and the combination of the observation method of methane dissolved in the marine atmosphere and seawater was insufficient [20]. The atmospheric background and historical data [21,22] or the annual average value of global atmospheric methane concentration [23] were adopted when calculating the methane exchange flux at the air–sea interface, which led to certain errors in the calculation results of the methane exchange flux [24]. Therefore, it is necessary to carry out on-site synchronous observations of marine atmospheric methane and dissolved methane in surface seawater to obtain more accurate data on dissolved methane in the sea surface atmosphere and surface seawater at the same space-time scale, further improving the observation efficiency and accuracy of methane exchange flux estimation results.
The Qiongdongnan Basin in the north of the South China Sea is one of the areas with the most potential natural gas hydrate resources in the world, and there have been cold seeps of natural gas and natural leakage of methane gas by marine geological and geophysical exploration in recent years [25,26,27]. The methane bubbles enter seawater layers to form plumes and migrate upward [28], which possibly diffuses from seawater into the atmosphere. Methane serves as an important greenhouse gas in the atmosphere, contributing approximately 20% to global warming [29]. In addition, methane has strong photochemical activity, which affects the concentrations of carbon monoxide, ozone, and stratospheric water vapor components in the troposphere, thus indirectly affecting the global climate and environment [30].
In this paper, automatic measurement technology of air and sea flux was employed to accurately measure the environmental parameters of the air and sea interface in the Qiongdongnan Basin area in the north of the South China Sea. The methane exchange flux ranges of the southeastern sea area were calculated by using the Liss and Merlivat formula (LM86), the Wanninkhof formula (W92), and the field-measured wind speed.
2. Materials and Methods
2.1. System Composition
Aiming to solve the problems raised in the introduction, a new model for methane flux observation of sea gas was proposed, mainly including a collection system, central control system, and auxiliary system, as shown in Figure 1.
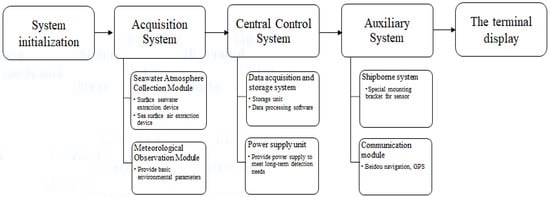
Figure 1.
System architecture diagram.
The collection system is composed of the seawater atmosphere collection module and the meteorological observation module. Among them, the seawater atmosphere collection module is the front core part, including the seawater collection part and atmospheric collection part. In the seawater collection part, the surface seawater was delivered from the trench to the gas separation device through the peristaltic pump, and the dissolved CH4 content in seawater was measured by the surface seawater sampling and analysis device. In the atmospheric collection part, the gas was pumped into the gas analyzer through the gas pump to determine the gas content (mainly CH4) and the carbon isotope ratio. The meteorological observation module mainly analyzed horizontal wind speed, wind direction, air temperature, relative humidity, net radiation, sea surface temperature, precipitation, and other observation elements.
The central control system consists of two parts, in which the data collection and storage unit is responsible for controlling the data collection sequence and storing data, while the power supply unit provides power for the whole device in the long term.
The auxiliary system is composed of two parts. The shipboard system includes special mounting brackets and accessories for the sensors to be installed and fixed. The communication module queries and transmits data through a network cable, Beidou, and other communication methods, which easily accesses various research-oriented networks. The technology roadmap of main research content is shown in Figure 2.
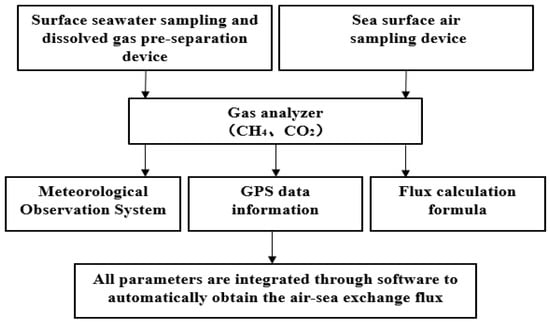
Figure 2.
Technology roadmap of main research content.
2.2. Calculation Method
The saturation R (%) of dissolved CH4 in seawater and the sea–air exchange flux F were calculated by Equations (1) and (2).
where k represents the gas exchange rate (cm/h), refers to the concentration of dissolved gas in surface seawater (nmol/L), and is the equilibrium concentration of gas and atmosphere in surface seawater. The gas at the interface obeys Henry’s law [31] (Wiesenburg D A, 1979), and k is defined as the function of wind speed and number in this model, where number is the ratio of the dynamic viscosity of water to the molecular diffusion rate of the gas to be measured. The number is related to physical parameters for a specific gas, such as water temperature and salinity. Wanninkhof et al. [32] presented the relationship between the methane gas number in seawater and water temperature, as shown in Equation (3):
Generally, k was calculated by the Liss and Merlivat formula [33] (Liss et al., 1986) and the Wannikhof formula [34] (Wanninkhof, 1992) (referred to as LM86 and W92), which represent the lower value and the higher value of the estimation of the sea–air exchange flux, respectively. Calculation formula related to the K value is listed in Table 1.

Table 1.
Calculation formula related to the K value.
The original wind speed obtained from sea level can be converted to the wind speed at 10 m by the power law [35], as shown in Equation (4):
where H1 and H2 represent the height above sea level, and U1 and U2 are wind speeds at corresponding heights.
3. Observation Methods and Data
3.1. Fixed-Point Time Series Observation
The survey area and stations (Q1~Q19) are shown in Figure 3. CTD seawater extraction was carried out in April and September 2018 in the Qiongdongnan waters off the northern slope of the South China Sea. In the early stage, a Franatech METs methane sensor was used in combination with an SBE 917plus thermosalt-depth measurement instrument (CTD) to obtain the methane content of surface seawater with a single point sample, and the CTD system provided power supply and data collection to METs. The CTD system and METs are shown in Figure 4.
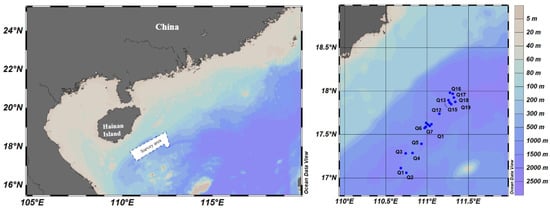
Figure 3.
Distribution map of water depth and station position in the Qiongdongnan Sea in the South China Sea.
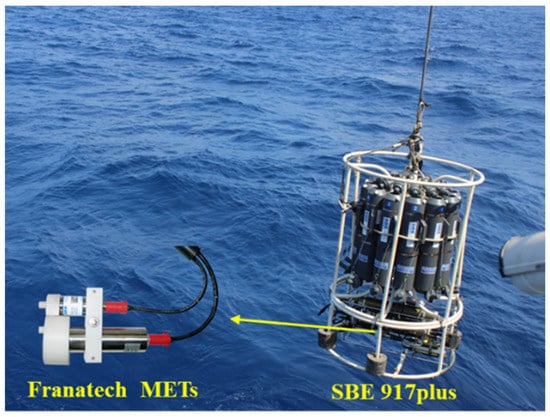
Figure 4.
CTD system and METs.
The concentration range of dissolved methane in surface seawater in the study area was 1.84~2.43 nmol/L, with an average content of 2.15 nmol/L. According to the annual average concentration of global atmospheric methane (1.83 PPM) [21], the Wiesenburg formula was used to preliminarily estimate the concentration when the gas in surface seawater reached equilibrium with the atmosphere. The methane saturation of surface seawater in the study area is shown in Figure 5. The methane in the surface seawater of the survey area was unsaturated in April 2018, leading to atmospheric methane entering the surface seawater through the air–sea exchange, which was the source of methane in the surface seawater. In September 2018, part of the methane in the surface seawater of the survey area was saturated, and some methane in the seawater was released into the atmosphere through the air–sea exchange, which was not a single sink or source relationship. There were sink–source conversions in the air–sea methane exchange depending on the different seasons.
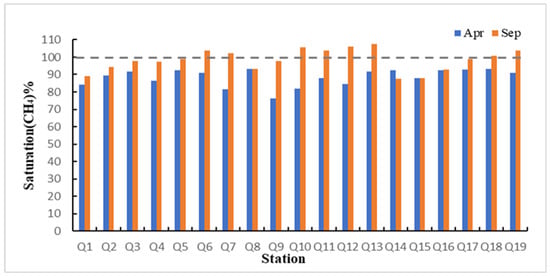
Figure 5.
The saturation of methane in the surface water of each station in different seasons in the Qiongdongnan area.
3.2. Ship-Based Simultaneous Observation
Relying on the National Gas hydrate special project of the China Geological Survey, the observation system was carried by the “Marine Geology No. 6” survey ship in June 2019 to conduct environmental baseline surveys in the Qiongdongnan area of the South China Sea. The survey ship and survey area are shown in Figure 6 and Figure 7. A PIcarro G2201 methane analyzer was used in the SST sampling device, and the atmospheric air intakes were fixed to the fore mast of the survey ship (approximately 15 m above sea level) to avoid the impact of the stack exhaust gas and deck operation of the survey ship. Rainwise’s PortLog weather sensor was equipped with a GPS system, which realized the ship-based navigation and positioning function.
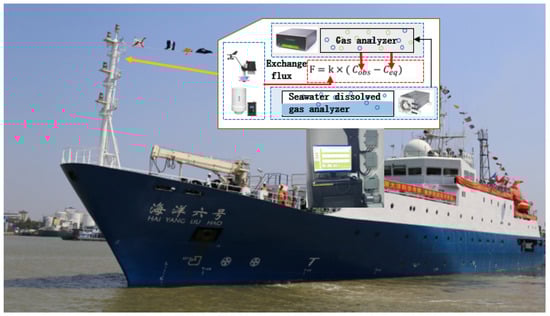
Figure 6.
Schematic diagram of the survey ship and air–sea exchange flux measurement system.
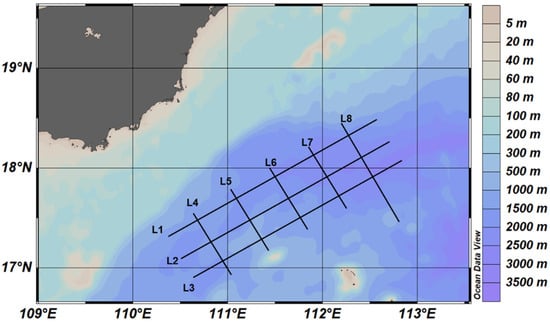
Figure 7.
Water depth and line distribution map of the survey area.
Figure 8 shows the distribution of methane content. The concentration of dissolved methane in the surface seawater of the survey area ranged from 0.56 to 2.26 nmol·L−1 with an average value of 1.45 nmol·L−1, which was slightly lower than the surface seawater concentration (1.81 nmol·L−1) corresponding to atmospheric and seawater equilibrium. The concentration of dissolved methane in the surface seawater of the study area was slightly lower than that in a previous report [36]. The atmospheric methane concentration of the sea surface in the investigated sea area ranged from 1.82 to 1.96 PPM, with an average of 1.88 PPM. The dissolved methane saturation in the surface seawater in the investigated sea area was from 20.6% to 89.3%, all of which were not saturated.
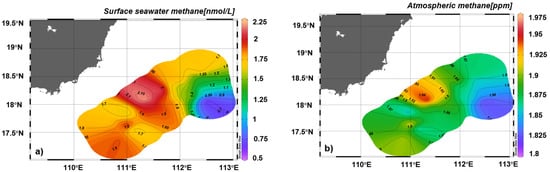
Figure 8.
(a) Methane content in surface waters of the Qiongdongnan area, and (b) methane content at the surface atmosphere of the Qiongdongnan area.
Figure 9 displays the distribution map of the average wind speed and sea–air methane exchange flux in the Qiongdongnan area in June 2019. The impact of the ocean on the atmosphere includes both material and energy aspects [37]. The methane air–sea exchange studied in this paper belongs to the impact of the ocean on the atmosphere. Based on data of dissolved methane in the surface atmosphere and surface seawater obtained by ship navigation and combined with on-site water temperature and meteorological data, the range of air–sea methane exchange flux calculated by the W-92 equation was approximately −0.00164~−0.00395 μmol·m−2·d−1, while that calculated by the LM-86 equation was −0.001~−0.0023 μmol·m−2·d−1. The sea–air exchange flux calculated by using the W-92 equation was approximately 1.7 times that calculated by the LM-86 method, which was consistent with the results of the air–sea exchange flux in the North Yellow Sea estimated by predecessors [24]. Compared with the results of previous studies, this survey had a large amount of data and wide coverage, and the measurement results were more accurate than those of previous studies. The air–sea methane exchange flux in the Qiongdongnan area was less than 0 during the survey in June 2019, which was a sink of atmospheric methane.
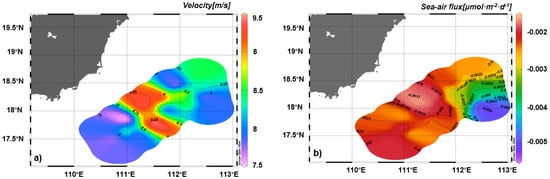
Figure 9.
(a) Distribution map of average wind speed, and (b) sea–air methane exchange flux in the Qiongdongnan area in June 2019.
The hydrological and chemical data of the Qiongdongnan area in the north of the South China Sea were obtained as follows: the surface seawater temperature varied from 25.93 °C to 27.95 °C, with an average of 27.15 °C; the surface salinity ranged from 33.49 PSU to 33.92 PSU, with an average of 33.68 PSU; the dissolved oxygen content of surface seawater changed from 6.20 mg/L to 6.98 mg/L, with an average of 6.65 mg/L; and the pH value of surface seawater varied from 8.15 to 8.32, with an average of 8.19. As shown in Table 2, Figure 10 and Figure 11.
Table 2.
The hydrological and chemical data of the Qiongdongnan basin.
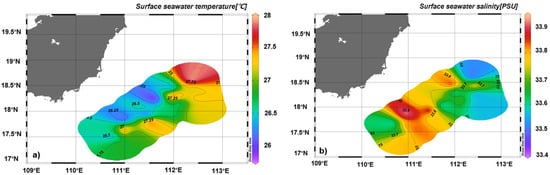
Figure 10.
(a) Distribution map of surface seawater temperature and (b) surface seawater salinity in the Qiongdongnan area in June 2019.
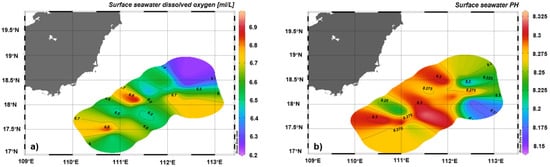
Figure 11.
(a) Distribution map of surface seawater dissolved oxygen and (b) surface seawater pH in the Qiongdongnan area in June 2019.
Table 3 summarizes the values of air–sea methane exchange fluxes in different sea areas around the world. Combined with the distribution of methane concentration in the surface water of the survey area, there was a certain corresponding relationship between the air–sea flux of methane and the spatial distribution of wind speed. Factors such as geographical location and meteorological conditions led to significant differences in the exchange flux of methane in various sea areas, which affected the estimated global methane budget. It is of great significance to investigate, in-depth, the distribution of methane and the seasonal variation in air–sea exchange flux in the South China Sea, which provides a scientific basis for a more accurate estimation of the annual methane released by the global oceans to the atmosphere.
Table 3.
Exchange fluxes of methane in different sea areas.
4. Conclusions and Prospects
Based on the empirical formula of Liss, Merlivat, and Wannikhof, the air–sea methane exchange flux measurement system was integrated, which simultaneously and continuously collected the data of sea surface atmosphere and surface seawater, separated the methane content in the atmosphere and seawater, obtained the meteorological parameters and sea surface hydrological parameters at the sea air interface, and automatically calculated the sea–air flux. By comparing the fixed-point time series and the ship-based navigation synchronous measurement data, the former obtained a single data source and a small number, and there were inevitably errors in the system calculation. The latter had a large data coverage and space-time continuity, which made the combination of the sea surface atmosphere and the surface seawater observation closer and provided a new observation method for the multiscale sea–air interaction observation.
The feasibility of the system was verified by sea trials, and the on-site synchronous observation of atmospheric methane and dissolved methane in the sea surface of the surveyed sea area was realized. There was no need for an indoor analysis of collected samples, which effectively avoided the loss of samples during collection and transportation, improved the measurement accuracy of the system, and greatly enhanced the observation ability of air–sea flux. This system was used to obtain the temporal and spatial distribution characteristics of air–sea methane fluxes in the study area and explore the environmental regulatory factors of air–sea methane fluxes and the relationship between carbon source and sink cycle processes and global climate change by combining the available environmental physicochemical factors.
In the later stage, research on the adaptability of the ship-borne environment will be continued, high-quality real-time observation data of the sea–air interface will be provided for marine environmental monitoring and research on sea–air interface interactions, and the early warning and reporting capabilities for emergency mobile observation, on-site support, and disaster prevention and mitigation of the marine environment will be further improved.
Author Contributions
Formal analysis and investigation, C.Z. and J.L.; writing—review and editing, C.Z.; methodology, J.L.; writing—original draft preparation, D.K.; chart proofread, Q.L. All authors have read and agreed to the published version of the manuscript.
Funding
This research was jointly funded by the Key-Area Research and Development Program of Guangdong Province (Grant: 2020B1111030003) and the Geological Survey Projects of China Geological Survey (Grant: DD20221700, DD20221706).
Data Availability Statement
The data that support the findings of this paper are available upon request.
Acknowledgments
Thanks to the staff of Marine Geology 6 and Marine Geology 4 for their help on all voyages.
Conflicts of Interest
The authors declare no conflict of interest.
References
- De la Paz, M.; Huertas, I.E.; Flecha, S.; Ríos, A.F.; Pérez, F.F. Nitrous oxide and methane in Atlantic and Mediterranean waters in the Strait of Gibraltar: Air-sea fluxes and interbasin exchange. Prog. Oceanogr. 2015, 138, 18–31. [Google Scholar] [CrossRef]
- Lelandais, L.; Xueref-Remy, I.; Riandet, A.; Blanc, P.E.; Armengaud, A.; Oppo, S.; Yohia, C.; Ramonet, M.; Delmotte, M. Analysis of 5.5 years of atmospheric CO2, CH4, CO continuous observations (2014–2020) and their correlations, at the Observatoire de Haute Provence, a station of the ICOS-France national greenhouse gases observation network. Atmos. Environ. 2022, 277, 119020. [Google Scholar] [CrossRef]
- Baharudin, L.; Rahmat, N.; Othman, N.H. Formation, control, and elimination of carbon on Ni-based catalyst during CO2 and CH4 conversion via dry reforming process: A review. J. CO2 Util. 2022, 61, 102050. [Google Scholar] [CrossRef]
- Wang, S.; Xu, J.; Fan, S.; Wang, Y.; Lang, X.; Yu, C. Atmospheric preservation of CH4 hydrate above ice point: A potential application for high-density natural gas storage under moderate conditions. Fuel 2021, 293, 120482. [Google Scholar] [CrossRef]
- Zhang, Y.; Zhao, H.D.; Zhai, W.D. Enhanced methane emissions from oil and gas exploration areas to the atmosphere. The central Bohai Sea. Mar. Pollut. Bull. 2014, 81, 157–165. [Google Scholar] [CrossRef] [PubMed]
- Zhang, B.; Chen, G.Q. Methane emissions by Chinese economy: Inventory and embodiment analysis. Energy Policy 2010, 38, 4304–4316. [Google Scholar] [CrossRef]
- Schmale, O.; Schneider, J.D.; Gülzow, W.; Nausch, G.; Waniek, J.J.; Rehder, G. The distribution of methane in the water column of the Baltic Sea. Geophysic Research Letter. 2010, 37, L12604. [Google Scholar] [CrossRef]
- Bange, H.W.; Bergmann, K.; Hansen, H.P. Dissolved methane during hypoxia events at the Boknis Eck time series station (Eclernförde Bay, SW Baltic Sea). Biogeosciences 2010, 7, 1279–1284. [Google Scholar] [CrossRef]
- Breitburg, D.; Ievin, L.A.; Oschlies, A.; Grégoire, M.; Chavez, F.P.; Conley, D.J.; Garcon, V.; Gilbert, D.; Gutiérrez, D.; Isensee, K.; et al. Declining oxygen in the global ocean and coastal waters. Science 2018, 359, 1–11. [Google Scholar] [CrossRef]
- Yu, X.K.; He, Q.; Li, Y.B.; He, H.; Zhang, J. Atomic fluorescence spectrometric detection of methylmercury in seawater at sub ng L-1 level by UV-induced atomization of gaseous methylethylmercury after NaBEt 4 derivatization with purge and trap preconcentration and gas chromatography separation. Spectrochim. Acta Part B At. Spectrosc. 2019, 152, 1–5. [Google Scholar] [CrossRef]
- Fan, Z.Y.; Zhao, J.M.; Liu, X.Y.; Luo, B.; Zhou, L.; Nie, D.-P.; Wu, Y.-Y.; Kang, Z.-H.; Tao, W.-L. Determination of barium sulfate in barite ore by phase conversion–partial pressure-corrected headspace gas chromatography. J. Chromatogr. A 2022, 1683, 463547. [Google Scholar] [CrossRef] [PubMed]
- Wei, Y.B.; Lu, S.F.; Li, J.Q.; Yu, R.; Li, W.; Cheng, F.; Fu, C.; Zhao, T.; Feng, W.; Song, Z. Impacts of gas pressure on carbon isotope fractionation during methane degassing—An experimental study on shales from Wufeng and Longmaxi Formations in southeast Sichuan, China. Mar. Pet. Geol. 2021, 128, 105001. [Google Scholar] [CrossRef]
- Yu, X.S.; Li, I.L.; Hu, Y.L. The development of in situ sensors for dissolved methane measurement in the sea. Adv. Earth Sci. 2011, 26, 1030–1037. [Google Scholar]
- Armando, S.J.; Martinez, C.K.; Amy, S. A new method for field measurement of dissolved methane in water using infrared tunable diode laser absorption spectroscopy. Limnol. Oceanogr. Methods 2012, 10, 560–567. [Google Scholar]
- Gülzow, W.; Rehder, G.; Schneider, J. One year of continuous measurements constraining methane emissions from the Baltic Sea to the atmosphere using a ship of opportunity. Biogeosciences 2013, 10, 81–99. [Google Scholar] [CrossRef]
- Crosson, E.R. A cavity ring-down analyzer for measuring atmospheric levels of methane, carbon dioxide, and water vapor. Appl. Phys. 2018, 92B, 403–408. [Google Scholar] [CrossRef]
- Fang, S.X.; Zhou, L.X.; Masarie, K.A. Study of atmospheric CH4 mole fractions at three WMO/GAW stations in China. J. Geophys. Res. Atmos. 2013, 118, 1–13. [Google Scholar] [CrossRef]
- Liu, M.; Meng, Z.Q.; She, Q.N.; Zhu, X.; Wei, N.; Peng, X.; Xu, Q. Spatial variability and determinants of atmospheric methane concentrations in the metropolitan city of Shanghai, China. Atmos. Environ. 2019, 214, 116834. [Google Scholar] [CrossRef]
- Seyfferth, A.L.; Bothfeld, F.; Vargas, R.; Stuckey, J.W.; Wang, J.; Kearns, K.; Michael, H.A.; Guimond, J.; Yu, X.; Sparks, D.L. Spatial and temporal heterogeneity of geochemical controls on carbon cycling in a tidal salt marsh. Geochim. Et Cosmochim. Acta 2020, 282, 1–18. [Google Scholar] [CrossRef]
- Zang, K.; Zhang, G.; Zhao, H.; Xu, X.; Zheng, N.; Wang, J.; Zhang, G. Multiple factors dominate the distribution of methane and its sea-to-air flux in the Bohai Sea in summer and autumn of 2014. Mar. Pollut. Bull. 2020, 154, 111049. [Google Scholar] [CrossRef]
- Ye, W.W.; Zhang, G.L.; Zhu, Z.Y. Methane distribution and sea-to-air flux in the East China Sea during the summer of 2013: Impact of hypoxia. Deep Sea Res. II 2016, 124, 74–83. [Google Scholar] [CrossRef]
- Ye, W.; Zhang, G.; Zheng, W.; Zhang, H.; Wu, Y. Methane distributions and sea-to-air fluxes in the Pearl River Estuary and the northern South China sea. Deep Sea Res. 2019, 167, 34–45. [Google Scholar] [CrossRef]
- Intergovernmental Panel on Climate Change. Physical Science Basis: Contribution of Working Group I to the Fifth Assessment Report; Cambridge University Press: Cambridge, UK, 2014. [Google Scholar]
- Yang, J.; Zhang, G.L.; Zheng, L.X. Seasonal variation of fluxes and distributions of dissolved methane in the North Yellow Sea. Cont. Shelf Res. 2010, 30, 187–192. [Google Scholar] [CrossRef]
- Bai, Y.; Song, H.B.; Guan, Y.X. Structural characteristics and genesis of pockmarks in the northwestern South China Sea derived from reflective seismic and multibean data. Chin. J. Geophys. 2014, 57, 2208–2222. (In Chinese) [Google Scholar]
- Chen, J.X.; Guan, Y.X.; Song, H.B. Distribution characteristics and geological implications of pockmarks and mud volcanoes in the northern and western continental margins of the South China Sea. Chin. J. Geophys. 2015, 58, 919–938. (In Chinese) [Google Scholar]
- Chen, J.X.; Bai, Y.; Guan, Y.X. Geophysical analysis of abnormal seismic(oceanography) reflection characteristics of oceanic bottom boundary layer. Chin. J. Geophys. 2016, 59, 2148–2161. (In Chinese) [Google Scholar]
- Trehu, A.M.; Flemings, P.B.; Bangs, N.L. Feeding methane vents and gas hydrate deposits at south Hydrate Ridge. Geophys. Res. Lett. 2004, 31, 845–862. [Google Scholar] [CrossRef]
- ICPP. Climate Change 2013: The Physical Science Basis: Working Group I Contribution to the Fifth Assessment Report of the Intergovernmental Panel on Climate Change; Cambridge University Press: Cambridge, UK, 2013. [Google Scholar]
- WMO Greenhouse Gas Bulletin: The State of Greenhouse Gases in the Atmosphere Based on Global Observations through 2016. Available online: http://www.wmo.int/pages/prog/arep/gaw/ghg/ghgbull06_en.html (accessed on 30 October 2017).
- Wiesenburg, D.A.; Guinasso, N.L. Equilibrium solubilities of methane, carbon monoxide, and hydrogen in water and seawater. J. Chem. Eng. Data 1979, 24, 356–360. [Google Scholar] [CrossRef]
- Wanninkhof, R. Relationship between wind speed and gas exchange over the ocean revisited. Limnol. Oceanogr. Methods 2014, 12, 351–362. [Google Scholar] [CrossRef]
- Liss, P.S.; Merlivat, L.G. Air-sea gas exchange rates: Introduction and synthesis. In The Role of Air-Sea Exchange in Geochemical Cycling; Springer: Dordrecht, The Netherlands, 1986; pp. 113–127. [Google Scholar]
- Wanninkhof, R. Relationship between wind speed and gas exchange over the ocean. J. Geophys. Res. Ocean. 1992, 97, 7373–7382. [Google Scholar] [CrossRef]
- Hsu, S.A.; Meindl, E.A.; Gilhousen, D.B. Determining the Power-Law Wind-Profile Exponent under Near-Neutral Stability Conditions at Sea. J. Appl. Meteorol. 2010, 33, 757–765. [Google Scholar] [CrossRef]
- Borges, A.V.; Royer, C.; Martin, J.L.; Champenois, W.; Gypens, N. Response of marine methane dissolved concentrations and emissions in the Southern North Sea to the European 2018 heatwave. Cont. Shelf Res. 2019, 190, 104004. [Google Scholar] [CrossRef]
- Feng, B.X.; Liu, H.L.; Lin, P.F.; Wang, Q. Estimation of the surface heat budget over the South China Sea. Atmos. Ocean. Sci. Lett. 2016, 9, 191–197. [Google Scholar] [CrossRef]
- Zhang, G.L.; Zhang, J.; Kang, Y.B. Distributions and fluxes of dissolved methane in the East China Sea and the Yellow Sea in spring. J. Geophys. Res. 2004, 109, C07011. [Google Scholar] [CrossRef]
- Li, P.P. Methane and Nitrous oxide in the Yellow River Estuary, the Yellow Sea and the Bohai Sea. Master’s Thesis, Ocean University of China, Qingdao, China, 2010; pp. 55–58. [Google Scholar]
- Yu, H.; Zhang, G.L.; Zhao, Y.C.; Liu, S.-M. Distributions and sea-to-air fluxes of nitrous oxide in the coastal and shelf waters of the northwestern South China Sea. Estuar. Coast. Shelf Sci. 2013, 133, 32–44. [Google Scholar]
- Tseng, H.-C.; Chen, C.-T.; Borges, A.V.; DelValls, T.A.; Lai, C.-M.; Chen, T.-Y. Distributions and Sea-to-air Fluxes of Nitrous Oxide in the South China Sea and the West Philippines Sea. Deep Sea Res. Part I Oceanogr. Res. Pap. 2016, 115, 131–144. [Google Scholar] [CrossRef]
- Rhee, T.S.; Kettle, A.J.; Andreae, M.O. Methane and nitrous oxide emissions from the ocean: A reassessment using basin-wide observations in the Atlantic. J. Geophys. Res. 2009, 114, 1192. [Google Scholar] [CrossRef]
Disclaimer/Publisher’s Note: The statements, opinions and data contained in all publications are solely those of the individual author(s) and contributor(s) and not of MDPI and/or the editor(s). MDPI and/or the editor(s) disclaim responsibility for any injury to people or property resulting from any ideas, methods, instructions or products referred to in the content. |
© 2023 by the authors. Licensee MDPI, Basel, Switzerland. This article is an open access article distributed under the terms and conditions of the Creative Commons Attribution (CC BY) license (https://creativecommons.org/licenses/by/4.0/).