Article

An Experimental Approach for Secondary Consensus Control Tuning for Inverter-Based Islanded Microgrids

by
Gabriel Nasser Doyle de Doile
1,2,*,
Pedro Paulo Balestrassi
2,
Miguel Castilla
1,
Antonio Carlos Zambroni de Souza
2 and
Jaume Miret
1
1
Higher Polytechnic School of Engineering of Vilanova i La Geltrú, Polytechnic University of Catalonia (EPSEVG–UPC), 08034 Barcelona, Spain
2
Electrical Systems and Energy Institute, Federal University of Itajuba (Unifei), Itajubá 37500-903, Brazil
*
Author to whom correspondence should be addressed.
Energies 2023, 16(1), 517; https://doi.org/10.3390/en16010517
Submission received: 11 November 2022 / Revised: 23 December 2022 / Accepted: 26 December 2022 / Published: 3 January 2023

Abstract

:
A microgrid is a group of interconnected loads and distributed energy resources that can fill the gap between the dependence on a bulk power grid and the transition to renewable energies. The islanded mode presents itself as the most interesting scenario, when local controllers should maintain the power quality standards based on several parameters. A tool specifically focused on the process of parameter tuning of the secondary consensus-based control for inverter-based islanded microgrids was proposed in this paper. One often-quoted drawback in this process is the great number of parameters that must be tuned, even for a very simple microgrid structure. To manage such a large number of parameters, the design of experiments was used in this study. The main motivation for this work was to present an optimized way to define the correct parameters for the secondary consensus control for inverter-based islanded microgrids. The study shows how experimental design methodology can be an efficient tool to tune microgrid parameters, which are typically multi-objective-based experiments. From the results, it is correct to state that the design of experiments is able to reach the optimal setting with a minimal number of experiments, which would be almost impossible to obtain with the trial-and-error method.

1. Introduction

A microgrid is defined as “a group of interconnected loads and distributed energy resources with clearly defined electrical boundaries that act as a single controllable entity with respect to the grid and can connect and disconnect from the grid to enable it to operate in both grid-connected or island modes.” [1]. In other words, it is a power grid with multiple distributed generators (DG), energy storage systems (ESS), and local loads that can be connected or disconnected from the main utility grid [2]. The most challenging scenario is when the microgrid starts working in a stand-alone mode. In such cases, local controllers should maintain the power quality standards regarding different parameters such as voltage amplitude, frequency, voltage unbalance, harmonic distortion, etc. [3].
The droop control methodology is the most common method to connect several voltage sources, sharing the load cooperatively and maintaining the voltage quality in a microgrid’s stand-alone operation [4]. A three-level hierarchical control drives the droop controlled microgrids: (i) the primary control is the lower level, ensuring the share of load among the grid-forming inverters by drooping the reference voltage amplitude and frequency; (ii) the secondary control restores the voltage amplitude and frequency to nominal values; and (iii) the tertiary level performs energy management considering different cost functions as economic and environmental, among others.
The primary and secondary control parameters mainly determine the microgrid dynamic behavior. First-level control parameter determination is a well-established technique based on steady-state characteristics as the maximum allowed voltage amplitude and frequency deviation [5]. However, recent studies have mainly focused on the distributed secondary level schemes, where the voltage amplitude and frequency restoration are guaranteed using a low-bandwidth communication channel, which avoids the one to all communication algorithm, commonly used in centralized secondary controllers [6].
Nevertheless, due to its inherent complexity, the tuning of the different control parameters of the distributed secondary level schemes has yet to be analyzed in deep in systems with multiple inverters. One usual approach is setting the same parameters in all of the controllers of the microgrid nodes. However, it is known that each node in a DG scheme is connected to the grid through different equivalent impedances, and thus they will work slightly differently.
A tool specifically focused on the process of parameter tuning of the secondary consensus-based control (SCC) for inverter-based islanded microgrids was proposed in this paper. One often-quoted drawback in this process is the great number of parameters that must be tuned, even for a very simple microgrid structure. To manage such a large number of parameters, the design of experiments (DOE), one of the most important methodologies for researchers who deal with experiments in practical applications, was used in this study. The study aimed to show how experimental design methodology could be an efficient tool to tune microgrid parameters, which are typically multi-objective-based experiments. The main motivation for this work is to define the correct parameters for the SCC for an inverter-based islanded microgrid in an optimized way. The applicability of the proposal assumes that the control designers of microgrid inverters have full access to adjust the control parameters.
The rest of this paper is organized as follows. In Section 2, the literature background and the used methodologies are presented including the fundamental concepts of the SCC for inverter-based islanded microgrids. Section 3 is dedicated to showing the experimental results and discussion, and finally, Section 4 presents the conclusions and recommendations.

2. Background and Methodology

When the microgrid starts working in stand-alone mode, the distributed generators assume the voltage source functions like those the utility-scale power plants assume in the main grid. The DG prime movers are renewable sources such as wind power and solar photovoltaics as well as conventional power sources using gas or diesel turbines for power generation. Renewable sources are inherently intermittent and non-dispatchable. Thus, all the power generated must be consumed by local loads or stored locally. Usually, intermittent power plants act as controlled current sources following the voltage at its output terminals, the so-called grid-feeding systems [7]. However, the correct operation of grid-feeding sources requires a well-regulated voltage, set by one or more voltage sources. In this way, conventional power sources are dispatchable and thus can act as voltage sources, named grid-forming, to maintain the voltage quality and provide the power demanded by the loads.
In addition to being widely used to embody sustainability, the electrical microgrid is one of the decentralized, dynamic, and bidirectional technologies used to fill the gap between the reliability of large centralized and inflexible generation systems and the delivery of energy. Therefore, it is possible to verify in the literature several successful studies that use the microgrid approach to energy sustainability as Phurailatpama, Rajpurohita, and Wang [8], who studied an autonomous DC microgrid in India and assessed the technical and economic feasibility for rural and urban areas. Wolsink [9] analyzed the socio-political acceptance of distributed energy resources (DER) for smart-grids, stating that the benefits from distributed and decentralized resources are superior to the ones from bulk centralized power plants, whereas de Doile et al. [10] more recently assessed the feasibility of combined wind, solar, and energy storage facing legal and regulatory issues.
Recent works related to droop-based controllers have mainly focused on distributed secondary level schemes that restore voltage amplitude and frequency without using a centralized controller. Sharma et al. [11] proposed a control strategy for an inverted-based island microgrid by simulating the results in MATLAB/Simulink, whereas Kaviri et al. [12] went further and proposed a droop-based supervisory control for nano-grid operating in island mode. Lv et al. [13] presented a scheme for economic dispatch using a hierarchical control that started with voltage and frequency controls, and Rosero et al. [14] analyzed the performance of a droop-free control in a microgrid that consisted in substituting secondary- and primary-level control by a cooperative distributed control strategy. With these schemes, the voltage amplitude and frequency restoration are guaranteed using a low-bandwidth communication channel that avoids the one-to-tall communication algorithm, common in centralized secondary controllers, thus providing high robustness, reliability, and redundancy [15].
Two questions were addressed in this work: (i) How do we address multi-parameter tuning problems in a SCC for inverter-based islanded microgrids? (ii) How many factors really need to be set correctly?

2.1. Problem Formulation

In experimental or simulation designs, research processes, in very few cases, end with a prototype development or an analytical design study. However, extensive tests are often carried out to explore the performance of the simulation models or prototypes. Often, changes and new tests are conducted so that, through simulations and experiments, the analytically started research process is refined. This also happens with the tuning for the parameters of a SCC for an inverter-based islanded microgrid, where several responses and factors are considered in a multivariate problem for its analytical model. One often-quoted drawback in this process is the many parameters to be tuned, even for a straightforward microgrid structure. These numerous parameters make the trial-and-error procedure quite long and somewhat delicate. The microgrid dynamics are determined mainly by the primary- and secondary-level control parameters. Thus, only these two hierarchical levels were considered and will be described in this study.

2.1.1. Microgrid Description

The microgrid under study was graphically modeled, as shown in Figure 1. It comprised three three-phase inverters, C1, C2, and C3, working as grid-forming converters. Each converter was fed by a DC source emulating the prime energy movers. The communication link between the three nodes was used to share the data for the SCC purposes. A computer was used for supervisory tasks to acquire and display the grid state. The global load, Lbus, must be fed cooperatively by the three nodes, independent of its topological location. Table 1 lists the grid parameter values for this typical microgrid. Four impedances, Z1, Z2, Z3, and Z4, emulate the wiring connections between nodes.
It is worth noting that this is a real microgrid setup located at the Polytechnic University of Catalonia, consisting of three-phase IGBT full-bridge inverters controlled by a digital signal processor (DSP). For interested readers, a full description of this microgrid setup can be found in [16]. To summarize some practical issues, each inverter is made up of a 2.3 kVA Guasch MTLCBI0060F12IXHF full-bridge converter with an LCL harmonic filter and uses a dual-core DSP from Texas Instruments (F28M36P63C). This DSP is formed by a C28 control processor and a M3 communication processor. The primary power source is emulated by an AMREL SPS800-12-D013 DC.

2.1.2. Controller and Tuning Methodology Description

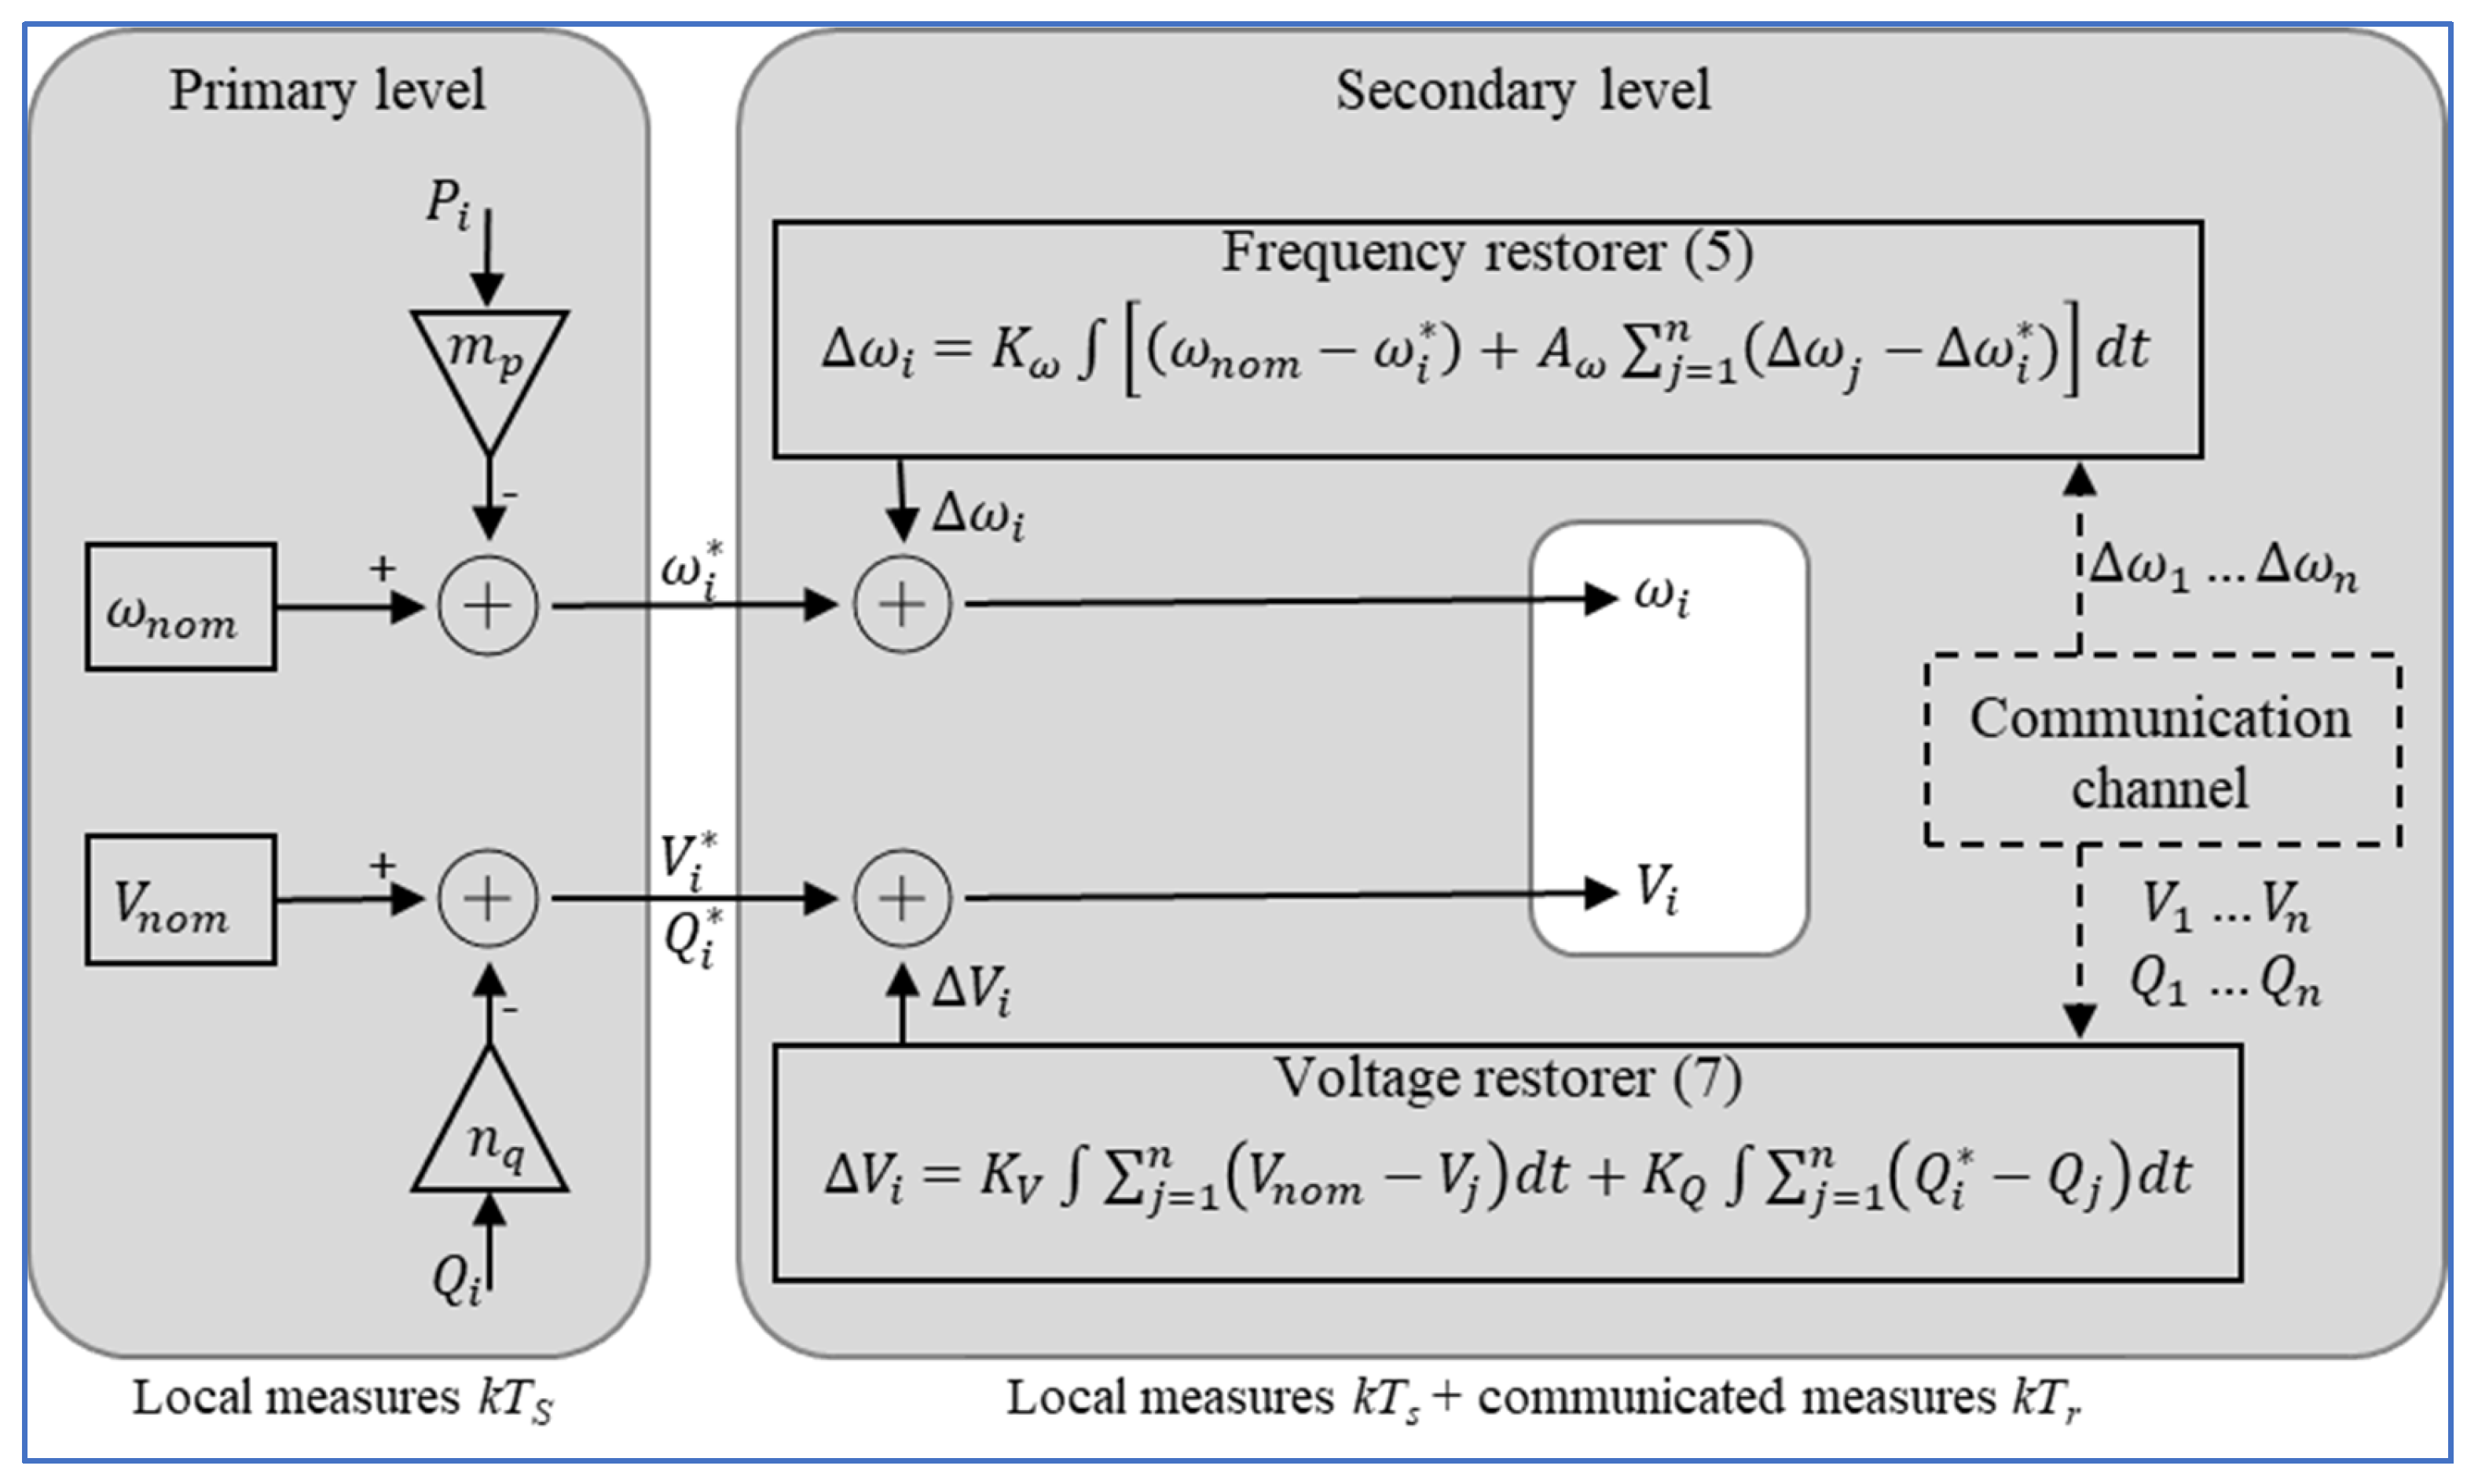
A simplified diagram of the two-level controller for the microgrid under study is presented in Figure 2. The outputs are the reference amplitude Vi and the reference frequency ωi used to implement the reference voltage that each grid-forming DG should operate, vi, given by Equation (1), where i varies from 1 up to 3.
v i = V i s i n ω i t
The objective of the primary control loop, the droop controller itself, is to ensure the share of power among all DG in the grid using only local variables. Thus, a communication channel is not necessary, providing the system functionalities with robustness.
The desired active power sharing is ensured by drooping the nominal frequency proportionally to the average value of the local active power Pi, given by Equation (2).
ω i * = ω n o m m p P i
where ωnom is the nominal frequency value and mp is the droop slope assumed to be equal in all DG units (i.e., assuming equal power rating DG). Although in real applications the inverters may have different nominal power, in this work, they were considered to have the same power rating in order to focus the study on the design of the consensus control. The primary active power controller ensures power sharing between the microgrid nodes. Regarding the grid frequency ω in the steady state, it is a global variable and will be the same in all nodes. This controller perfectly achieves the objective of sharing active power but introduces the disadvantage of frequency deviation to a value lower than the nominal one.
On the other hand, with the voltage drooping by Equation (3), the power-sharing is not perfectly achieved, as the voltage amplitude will differ in each node output. Then, only a slight equalization of reactive power is ensured by such a controller.
V i * = V n o m n q Q i
The secondary controller will then overcome the frequency deviation and the non-perfect reactive power sharing. In this case, a channel for communication should be used to interchange the DG local measures to guarantee the frequency restoration to its nominal value, sharing equally the reactive power demanded by the load. Generally, in centralized secondary level schemes, one node acts as a centralized controller and receives data from all the other nodes using a dedicated communication channel at a rate Tr seconds. The lower the Tr, the better the control results [18]. Normally Tr is higher than the local measurement sampling rate, Ts. Then, the centralized controller calculates the correction terms and sends these results to all the slave nodes. However, in a consensus-based SCC scheme, there is no master and the controller is distributed cooperatively. Most importantly, only neighboring nodes exchange information in an “all-to-all” way, so receiving data from all other nodes is not necessary. This way, information about the local status flows, “gossiping” through the communication channel. Thus, one specific node i receives data only from its n neighbors, in a microgrid with x nodes. The following equations describe the complete primary plus consensus-based secondary controllers, according to Lu et al. [17].
ω i = ω i * + Δ ω i = ω n o m m p P i + Δ ω i
Δ ω i = K ω [ ω n o m ω i * + A ω j = 1 n ( Δ ω j Δ ω i ) ] d t
V i = V i * + Δ V i = V n o m n q Q i + Δ V i
Δ V i = K V j = 1 n V n o m V j d t + K Q j = 1 n Q i Q j d t
The integral on the controller, Equation (5), will try to accomplish objectives in a steady state. The secondary controller receives correction terms from its n neighbors to obtain the frequency correction term Δωi to equalize all microgrid correction terms to ensure all ωi are equal to ωnom.
Similarly, the reactive power sharing correction term ΔVi in (7) can be calculated using the output voltage amplitude Vj and reactive power Qj values from n nodes. The main goal here is the equalization of sharing reactive power. However, accomplishing this objective presents a new deviation of the output voltages. Thus, it is necessary to control the output voltage amplitudes to meet the regulation objectives through a complementary objective: to fix the mean voltage among the x nodes to the nominal value.
V i = j = 1 x V j x = V n o m
These two objectives are accomplished by the two integral terms in (7). Four secondary control parameters for each microgrid node should be designed to determine the dynamic behavior of the complete system: Kω, Aω, KV, and KQ, and the transmission ratio Tr, equal for all nodes. Choosing the same values for parameters of the secondary controller for all microgrid nodes is the most straightforward approach. However, there is no guarantee to optimize the merit responses describing the dynamic behavior.

2.1.3. Merit Responses

As stated above, sharing active and reactive powers equally among all converters is the main goal of the controller. Deviations between active and reactive powers generated and measured in each microgrid node from the nominal values will be the first two merit responses to be assessed. Then, the maximum power deviation among converters will be chosen as the merit response value. Furthermore, the network voltage quality should be evaluated in terms of frequency and amplitude. The microgrid frequency and output voltage deviations from their respective nominal values will be the third and fourth merit answers. These merit responses are only related to steady-state objectives, and thus some dynamic merit responses should be defined. Measuring the overshot and time delay when reaching the steady state after a step change in any of the main variables (active power, reactive power, voltage amplitude and the microgrid frequency) allows for defining eight other merit responses. In Table 2, the twelve merit responses are listed.
The time required for dynamic variations, which occur after a system state change, to reach a value equal to or less than 5% of the steady-state response is defined as the settling time. The highest value of the settling time, measured among all converters in the microgrid, will be chosen as the merit response. The optimization problem for the analytical model needs to consider the set of equations from (1) to (8) and several of the response variables defined in Table 2.

2.2. Design of Experiments for Parameters Tuning

Many successful results make DOE a critical methodology in research with practical experimental applications. For example, several computer programs performing statistical calculations have DOE as a basic tool due to the ease of results interpretation. Aside from the many parameters involved in tuning a SCC, several statistical approaches should be considered in these experimental tests, making DOE an adequate tool [19].
The adjustment of parameters has been widely studied in the literature and applied to several types of processes, for example, Amorim et al. [20] presented a multi-objective optimization algorithm applied to hardened steel turning processes, and Atabaki, Mohammadi, and Aryanpur [21] used multi-criteria decision-making methods to select the more impactful variables to forecast the energy production in Iran by 2050. However, although several studies on microgrids have considered experimental or simulated procedures, few studies have used DOE strategies for empirical applications. Xiang et al. [22] used the Taguchi orthogonal design to perform the planning and analysis of test scenarios in energy management. Still applying a DOE based on the Taguchi method, Wang et al. [23] analyzed the influence of parameter adjustments on integrated scheduling for an intelligent regional grid. No studies were found related to the SCC for an inverter-based island microgrid using experiments and/or simulations based on DOE tools.
The DOE strategy consists in ordering experimental conditions to obtain accurate information in a reduced number of experiments by varying the factor levels for each experiment, thus optimizing the experimental procedure. Considering several parameters, this minimization in the number of experiments allows for the verification of possible interactions among the analyzed factors aside from the optimal solution. Factorial analysis is one of the most widely used DOE tools in experiments involving several factors. Therefore, it is worth highlighting the arrangement for k factors, an experimental design of k factors in two levels (2k).
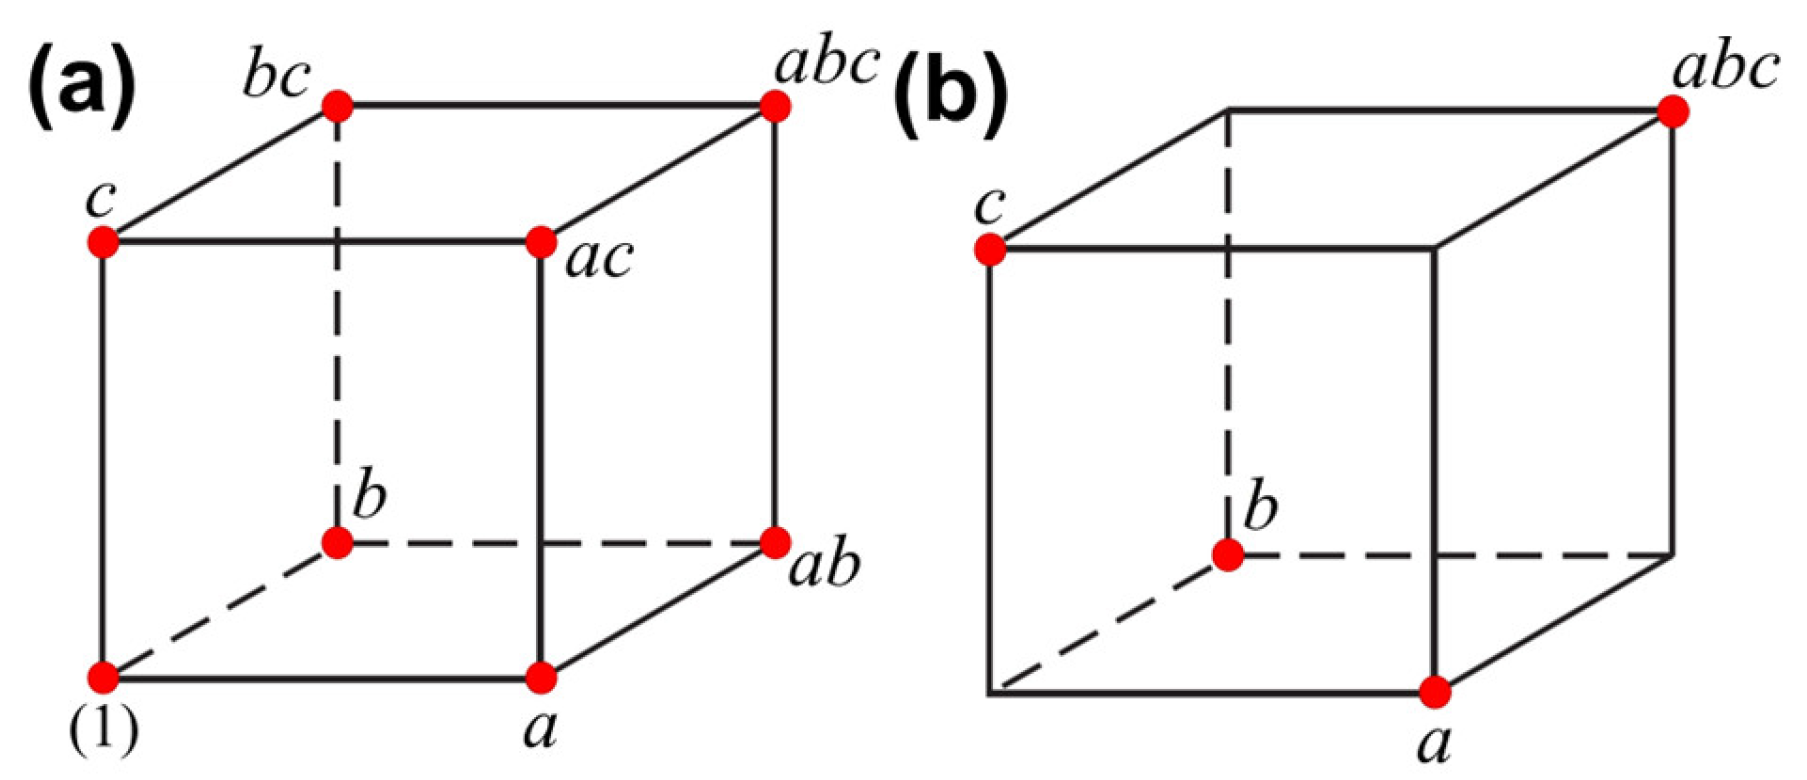
According to Montgomery [19], a strategy as a fractional factorial design will require a smaller portion of experiments, performing only a certain subset of the complete factorial experiment. This type of design is necessary for procedures that have limited resources or a large number of factors. The geometric representation of the full and fractional factorial designs is illustrated in Figure 3.
Since 13 factors is the usual number for SCC inverter-based islanded microgrids, it is interesting to analyze the complexity of the execution of all the combinatorial possibilities. At the same time, the simulation of the tuning of the parameters occurs. Such a simulation would require a lot of computational time, incurring a high operational cost. Finding the best combination considering all variables is unlikely. However, using DOE strategies, one can drastically reduce the number of experiments required, finding a suitable combination for factor levels, thus minimizing the computational costs.

3. Experimental Results and Discussion

The experimental results based on the previous guidelines are described and discussed in two parts: (i) as planning made before any experiment and (ii) the final designs and results.

3.1. Planning before Experiments

In this subsection, the statement of the problem, the selection of the response variables, and the choice of factors, levels, and ranges will be discussed. Trial-and-error is a time-consuming methodology often used to predict the parameters’ values and tolerances for the SCC for inverter-based islanded microgrids. In this work, a well-structured method to estimate the parameters of such tuning is proposed.
The process characterization of the SCC for inverter-based islanded microgrids is presented in Figure 4. First, the factors and levels were defined considering the problem formulation presented in Section 2. The process of selecting the factor levels was considered in two steps: first, the nominal values for the factors were defined using agreement analysis by some practitioners. After that, an initial estimate of the standard deviations was obtained by dividing the range values by 4. This rule, used in cases of scarce information, does not compromise the experimental deployment once several designs are supposed to check the validity of the factor levels. The Chebyshev rule for standard deviation determined the final factor levels, which states that at least 3/4 of the data lie within two standard deviations of the mean. This is a multiple and multivariate Y = f (X) complex problem, where several responses should be jointly optimized.

3.2. Designs and Results

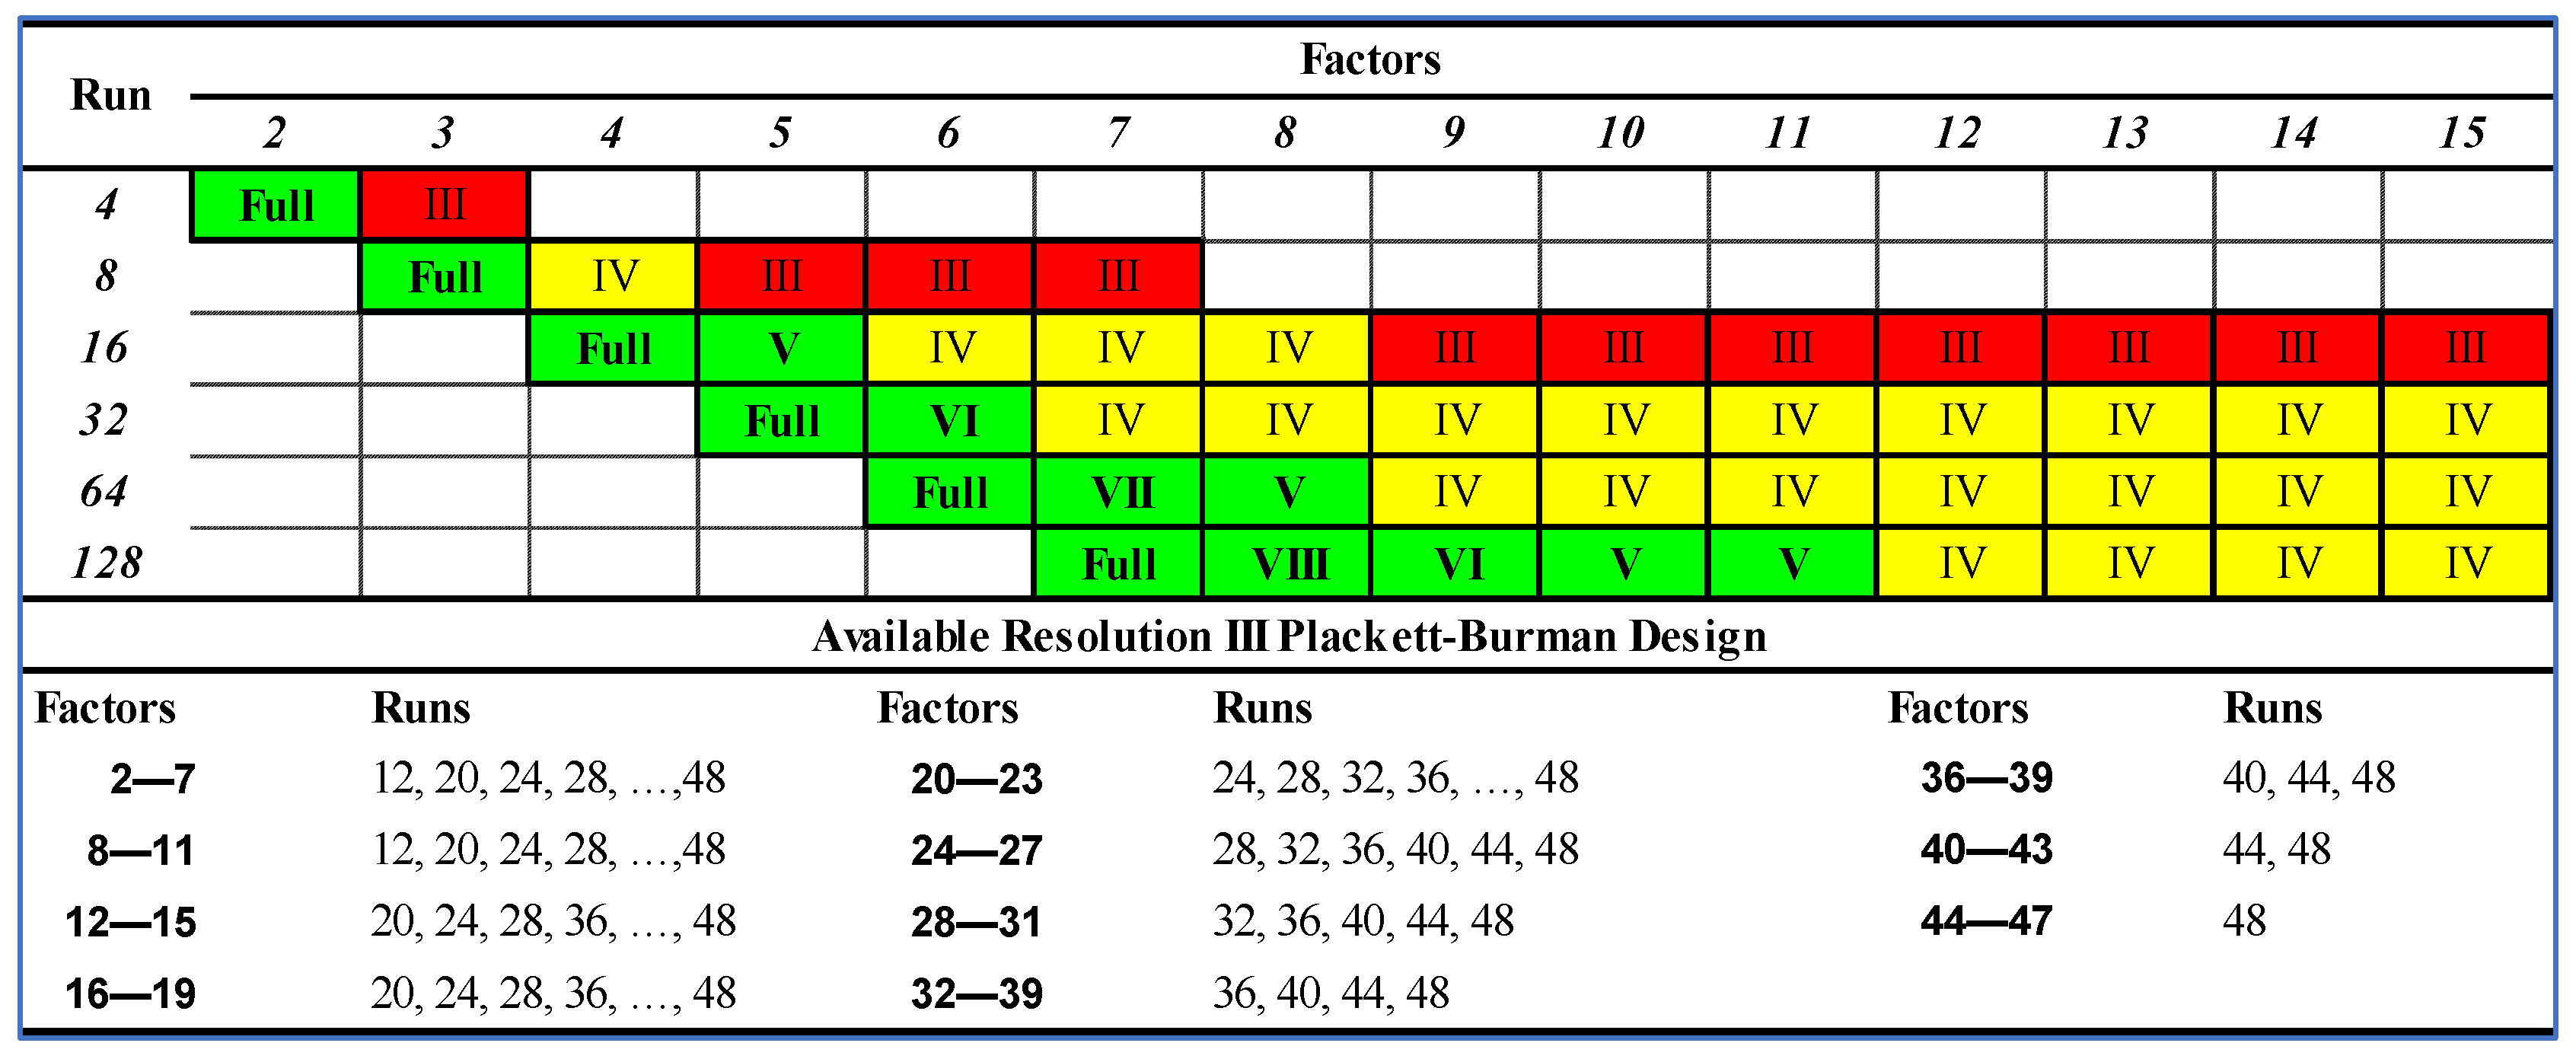
As above-mentioned, the number of tests to explore all the combinatorial possibilities for 13 factors is very large and can expend a large computational time. However, a great number of designs are available to deal with screening procedures. In the Minitab software, for example, the scheme in Figure 5 helps the practitioner to choose an appropriate 2-level or Plackett–Burman design [24] based on the number of factors that are of interest, the number of runs one can perform, and the desired resolution of the design. The design resolution describes the extent to which effects in a fractional factorial design are aliased with other effects. When a fractional factorial design is executed, one or more of the effects are confounded, meaning that they cannot be estimated separately from each other. A fractional factorial design with the highest possible resolution for fractionation required is frequently used. Therefore, it will be better to choose a design where the main effects are compounded with 3-way interactions (Resolution IV) over a design where the main effects are confounded with 2-way interactions (Resolution III).

3.2.1. Strategies for Choosing Parameters in a Factorial Design

Some potential designs and strategies are suitable for the first screening phase where the goals are to identify the factors that may affect the performance the most, take out the irrelevant factors, and establish the cause-and-effect relationships. The screening method depends on the number of factors that need to be removed. Resolution III fractional factorial and Taguchi designs are among the industry’s most widely used types of design. These methods are generally useful and much better than the traditional trial-and-error strategy.
The factorial design experimental plan for the parameter tuning considering 13 factors is shown in Table 3. For each row corresponding to an experimental scenario, 12 response variables were computed.
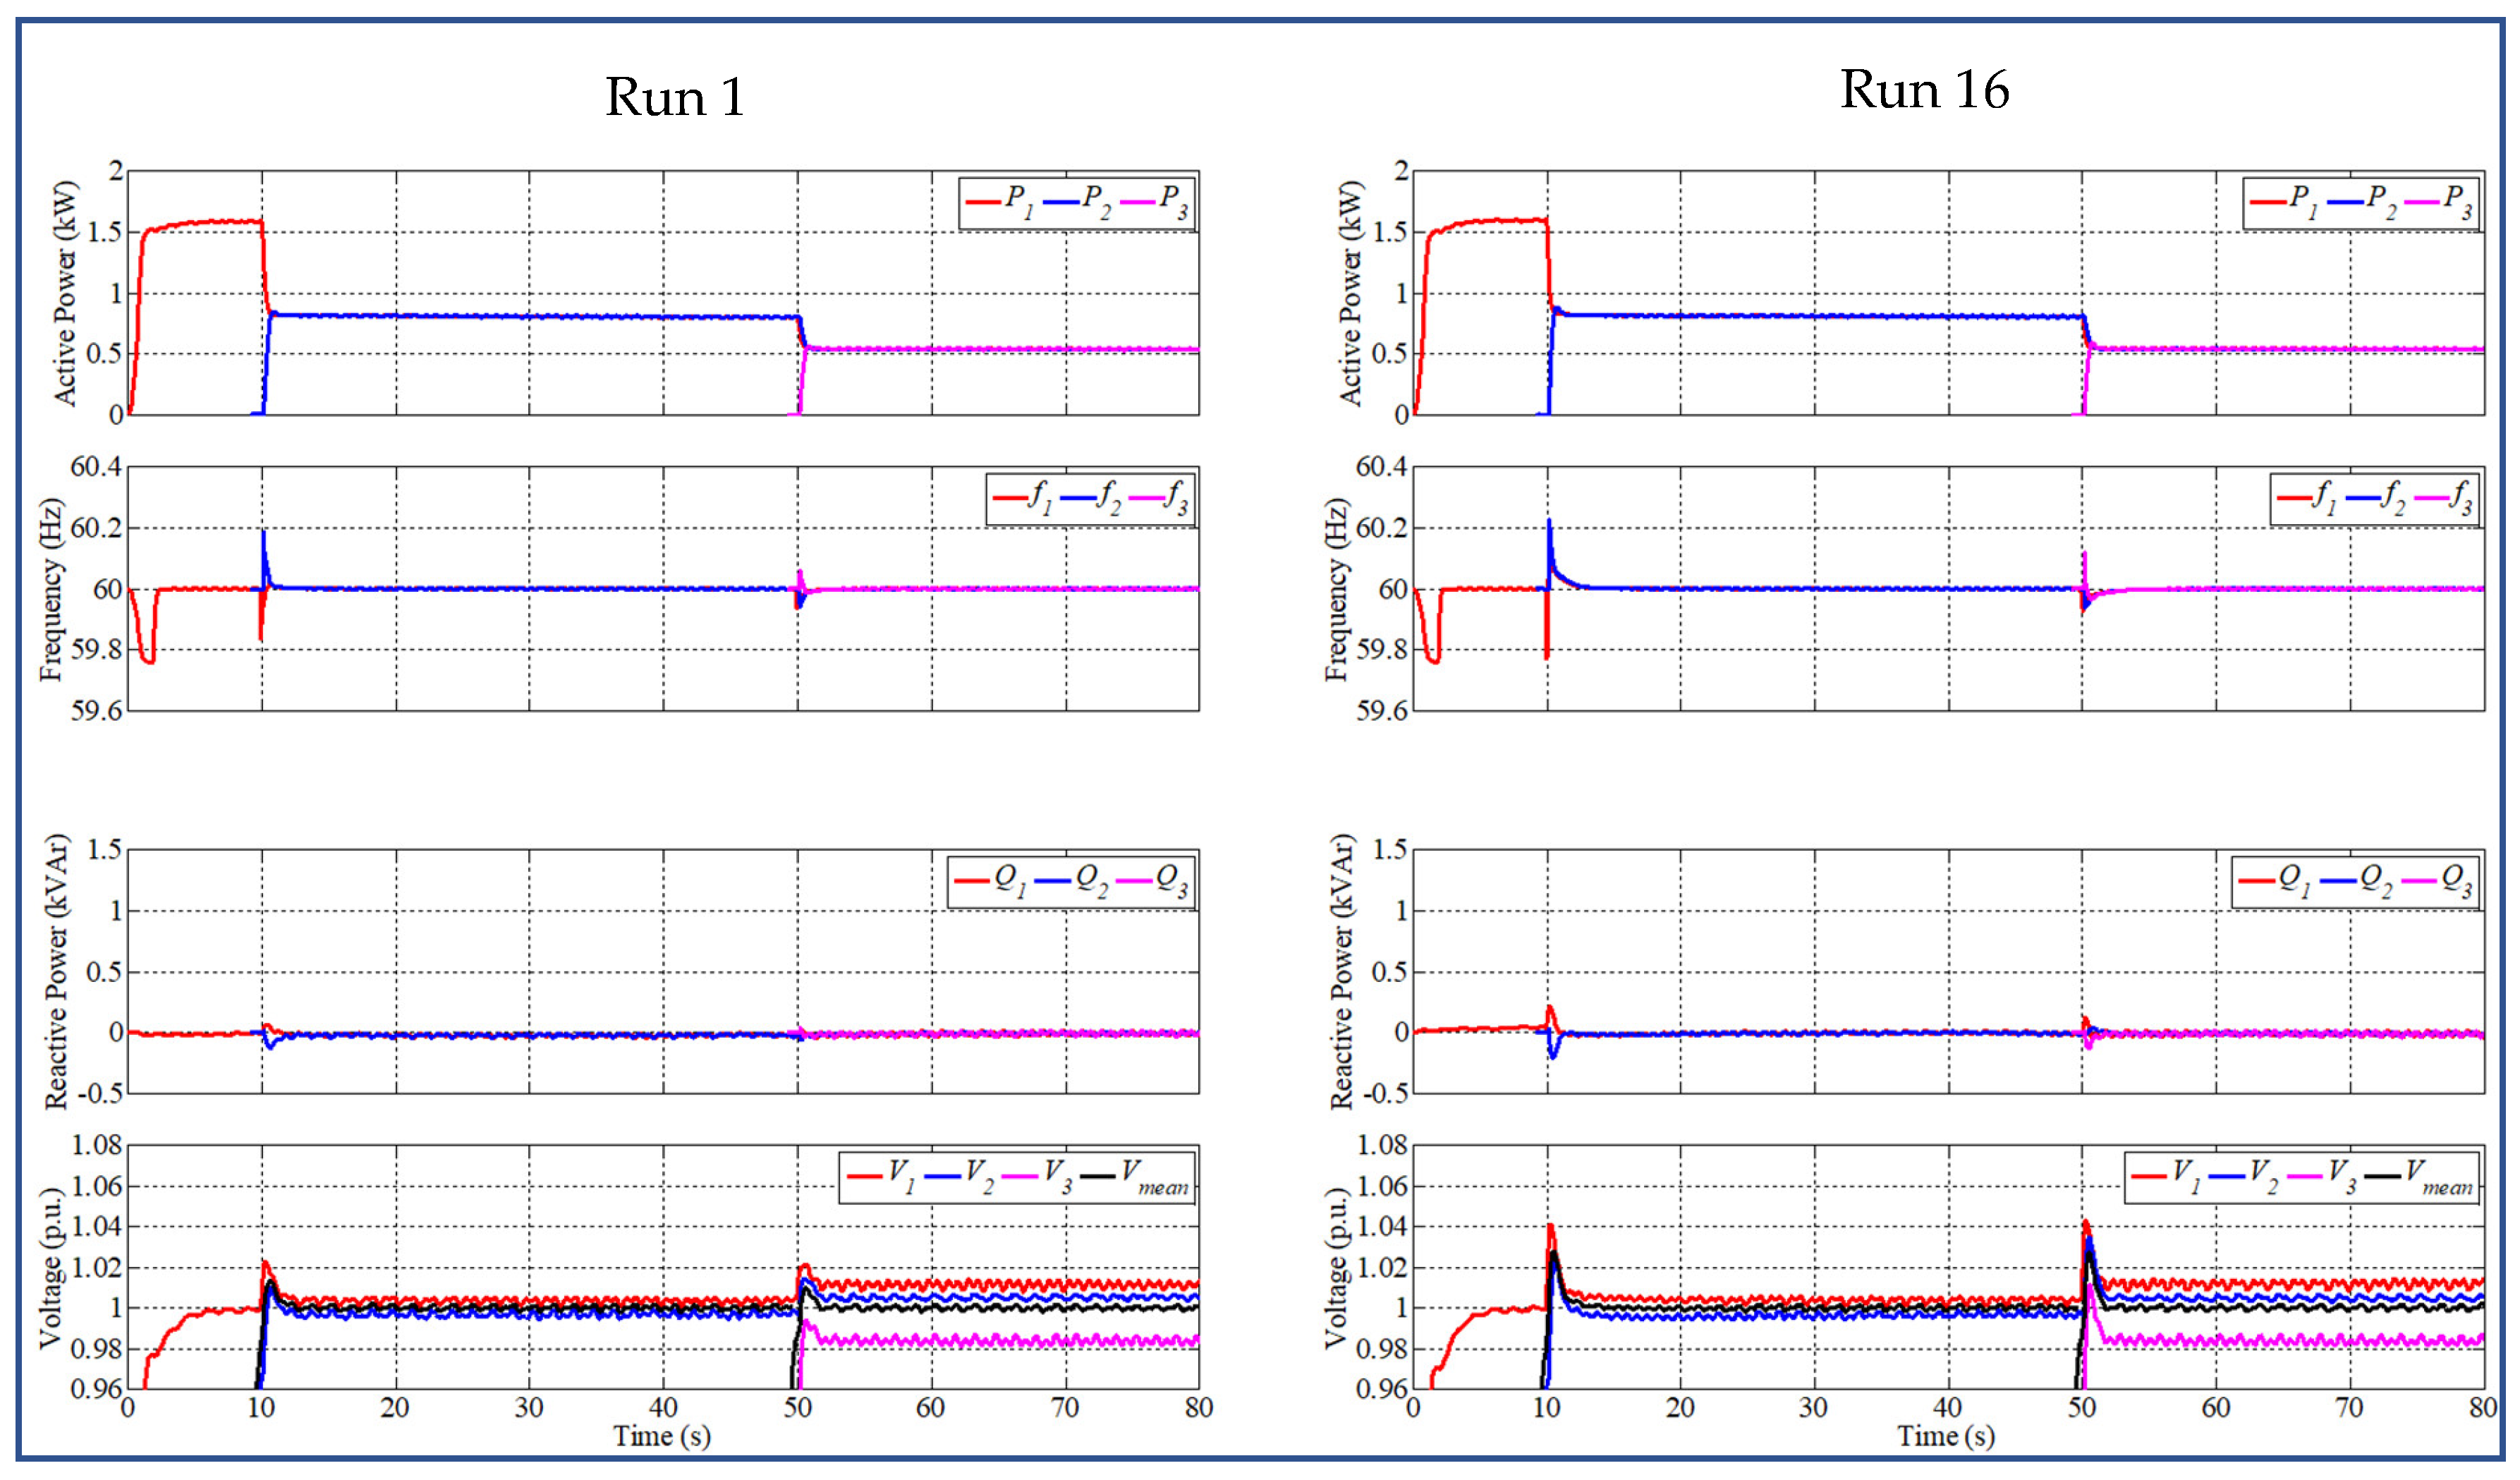
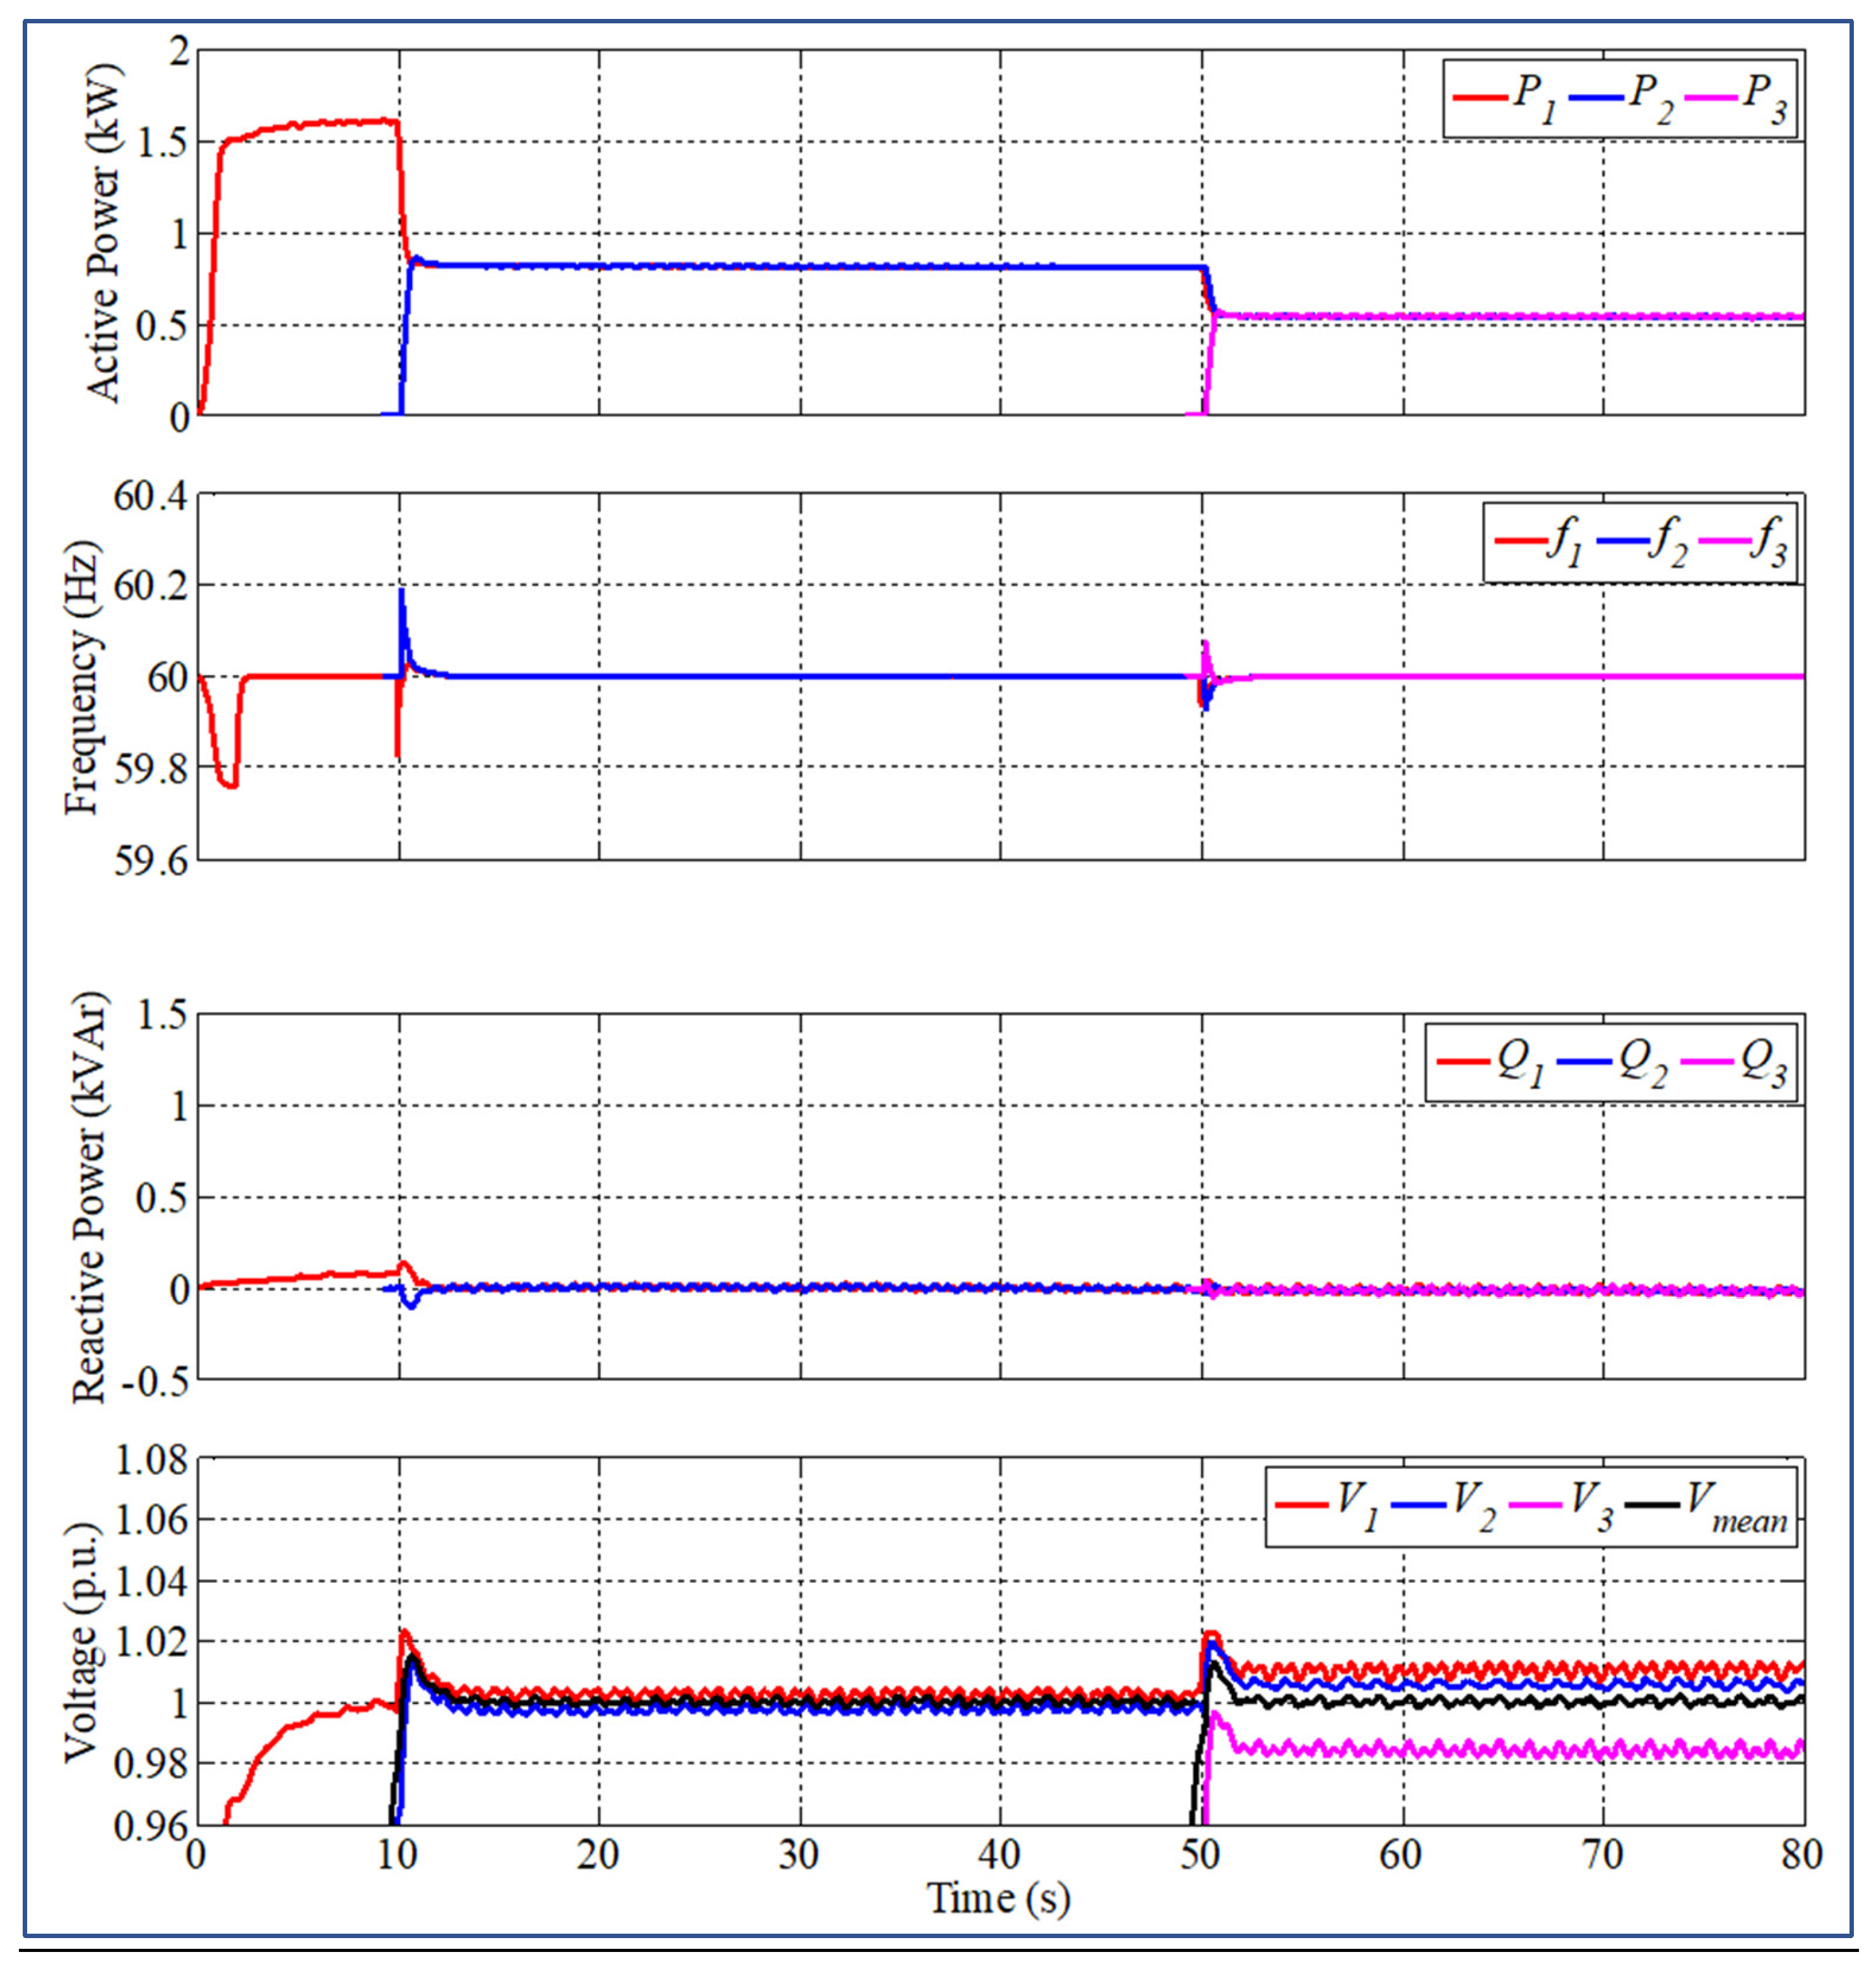
Results for the two different scenarios are presented in Figure 6 (scenario 1 on the left and scenario 16 on the right), which depicts the converters’ active power supply, frequency, reactive power, and voltage amplitude. In the voltage results, a fourth trace represents the average voltage amplitude measured among the three converters, Vmean. Each test followed the same time protocol, where the three converters were started sequentially to produce step changes that facilitate the merit response measurements. At t = 0 s, converter C1 started energizing the grid to supply the microgrid loads, Lbus, alone. The second converter C2 started at t = 10 s, thus at this time load, sharing began between C1 and C2. At t = 50 s, the third converter C3 was started. An almost perfect active power sharing in a steady state could be appreciated in the respective figures. All twelve merit response measurements were conducted after t = 50 s, when the three converters supplied the load. As can be seen in the figure, when a new converter is started, there is a system frequency drop (ideally 60 Hz) due to the primary level control actuation given by Equation (2). A perfect frequency restoration can be accomplished thanks to the secondary controller, according to Equation (5). Additionally, the reactive-power and voltage secondary controller objectives, reactive power sharing, and Vmean = 1 p.u. at the steady state were accomplished. Due to the different sets of secondary controller constants used in each test, the dynamic behavior was slightly different in each experiment, as seen in the frequency behavior. When test 16 (right column) was executed, a large frequency overshot and settling time were observed in comparison with the results of test 1 (left column). The measured merit responses for each of the 16 runs are listed in Table 4.
The 16 experiments shown in Table 4 were statistically assessed on Minitab software with the help of the following tools: ANOVA, Pareto chart, regression table, and desirability. From this screening analysis, some results were obtained considering all 12 responses and the 13 factors, as shown in Table 5.
Factors Kω2, Kω3, KV2, and KQ3 presented themselves as not significant when changing the factor levels in all responses. These could be considered as noise factors in further works. The levels of these factors were established according to the best desirability value as follows: Kω2 = 7.05, Kω3 = 9.95, KV2 = 0.425, and KQ3 = 0.02525. These can be fixed in future experimental projects.
The level of factor Tr was considered for future projects as it showed itself to be significant for all responses. The lower limit of Tr was considered for later projects, as its value is better when lower.
Factors Kω1, Aω1, Aω2, Aω3, KV1, KV3, KQ1, and KQ2 require future studies as they were established as borderlines due to the unclear results for eliminating or selecting their levels.

3.2.2. Optimization Design

The factorial design experimental plan for the second-round parameter tuning is presented in Table 6.
All 12 responses considering all 16 experiments from the previous experimental design are presented in Table 7.
After this second phase of DOE analyses, the final tuning for the variables was obtained, and the main findings were as follows: Factors KV1, KQ1, and KQ2 were considered not significant when changing their levels in all of the responses, while factors Kω1, Aω1, Aω2, Aω3, and KV3 were considered significant for the composite desirability of all responses.

3.2.3. Verification

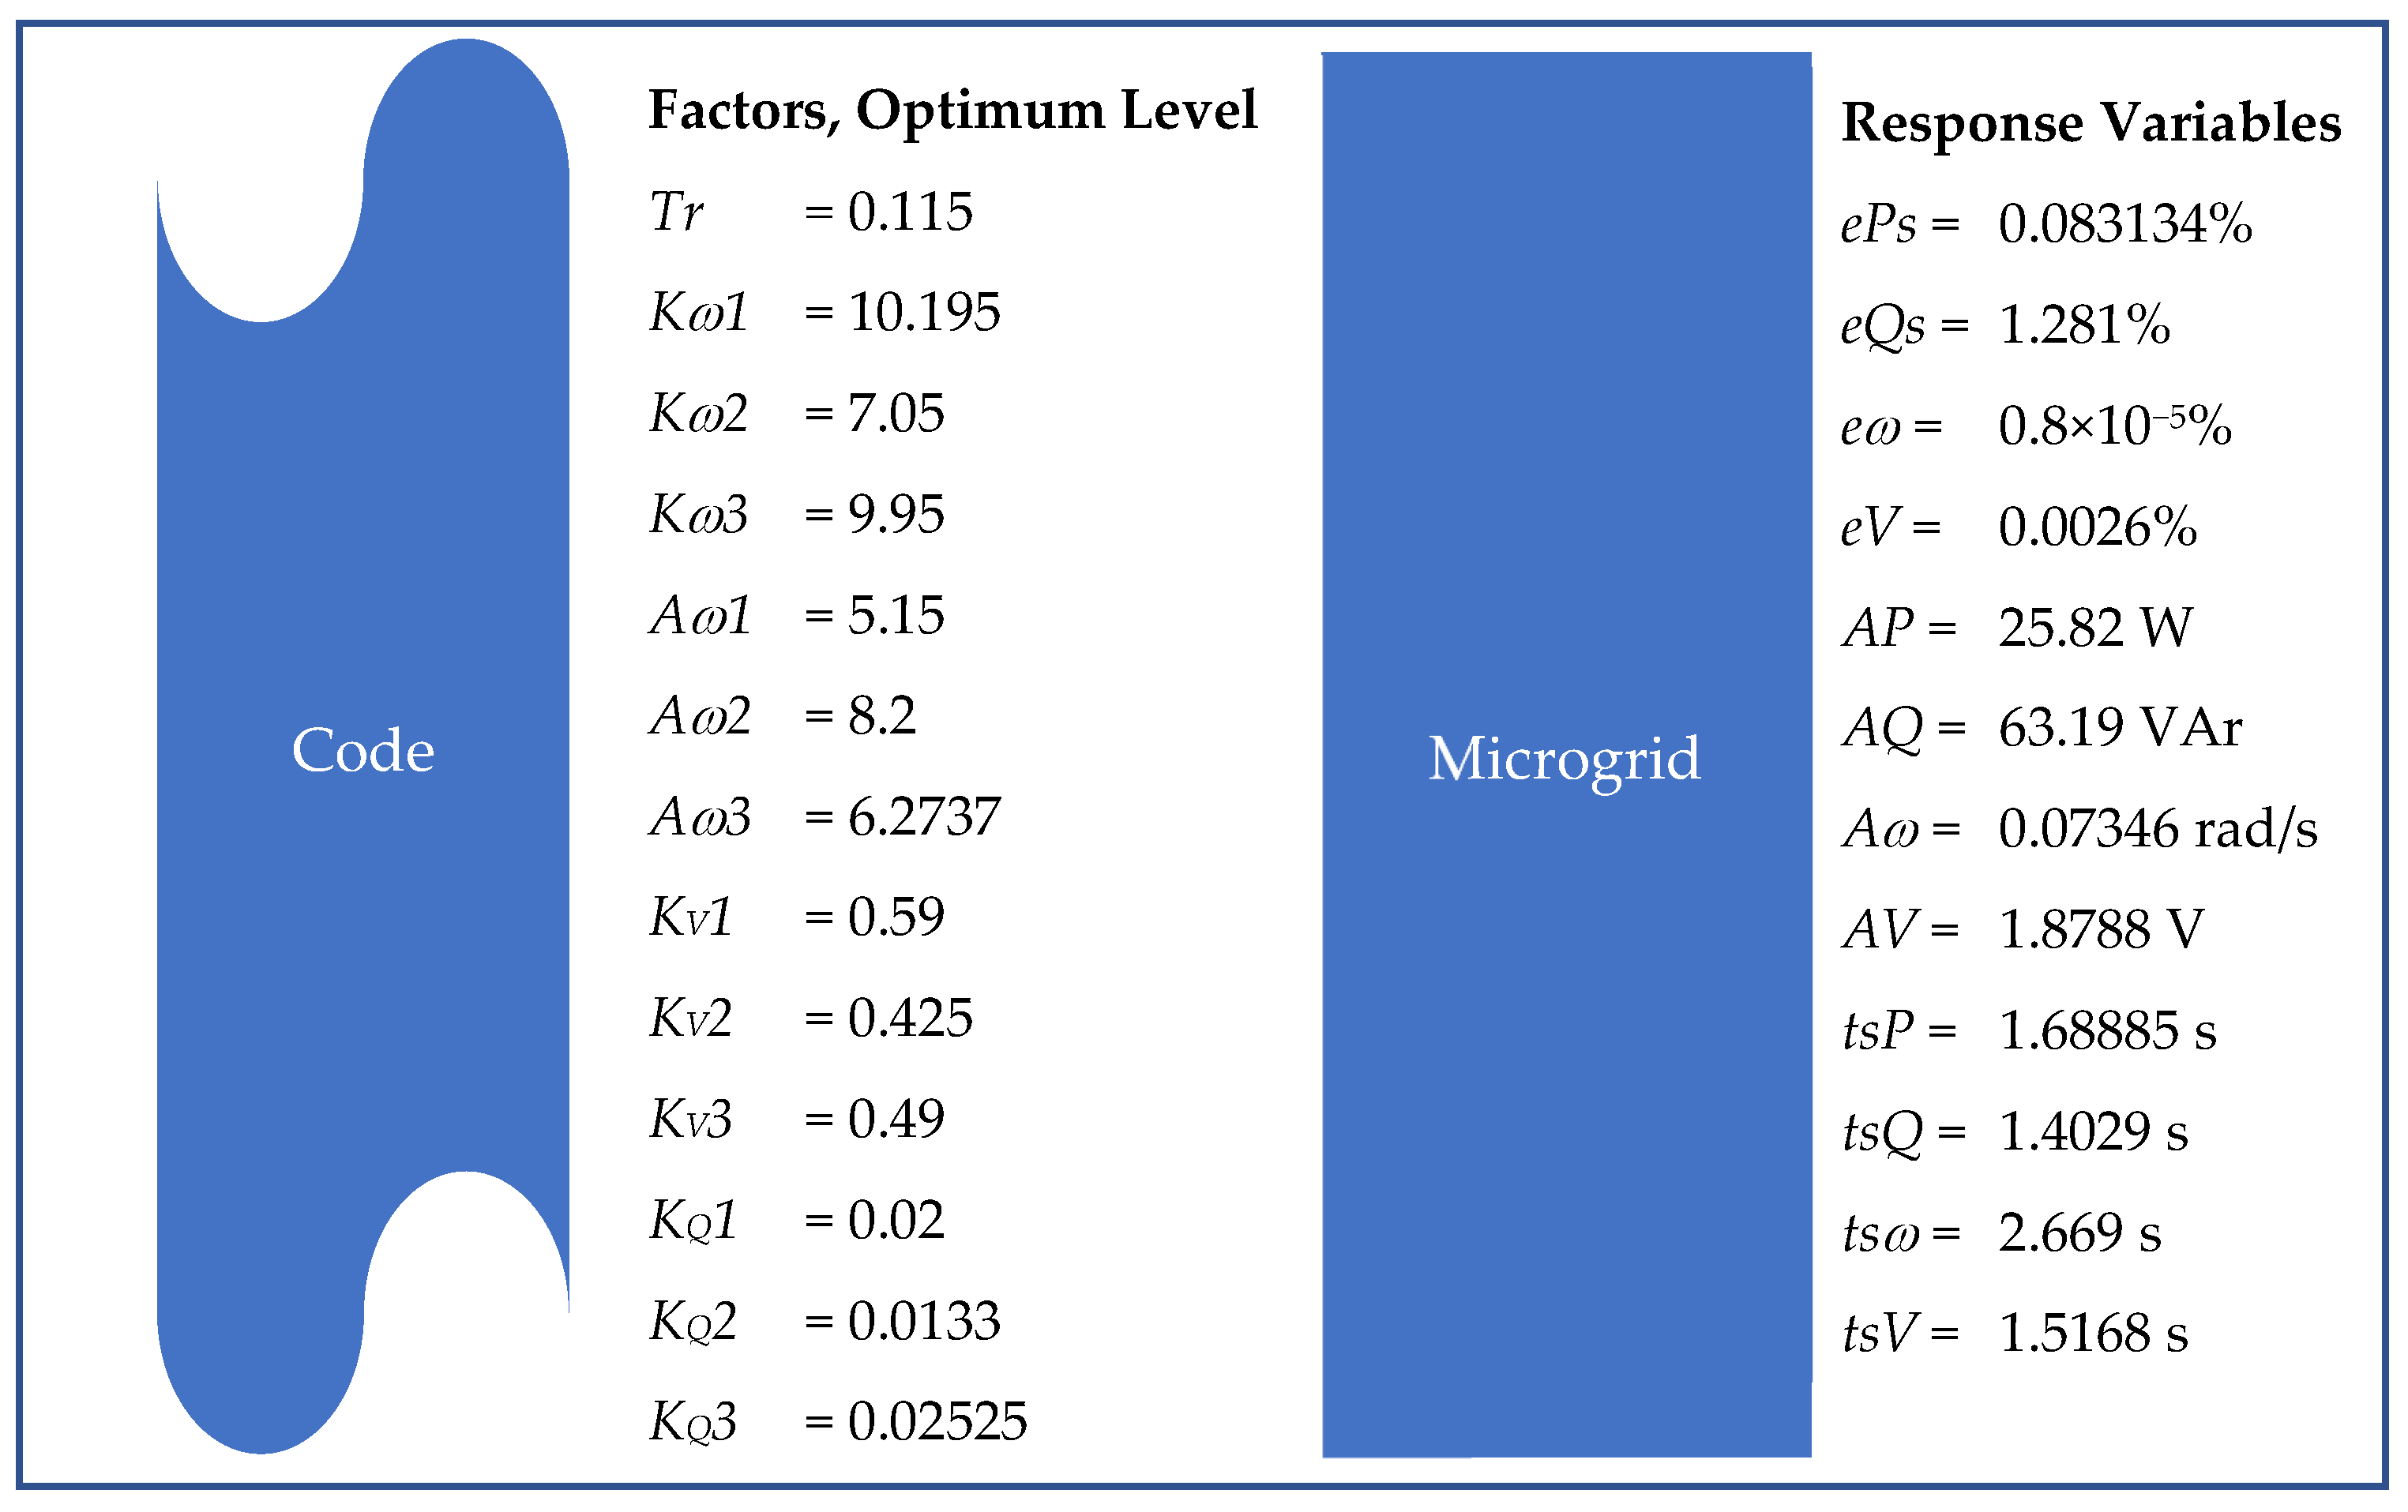
The confirmatory experiments for the parameter tuning are presented in Figure 7 and Figure 8. The 12 responses were obtained by setting up the factors in the optimal settings. It is worth mentioning that the optimal gains of , , KV, and KQ were different in the three grid-forming inverters.
This result was statistically significant compared to several best guess scenarios defined a priori by the practitioners. As in the paired t-test, the p-value presented itself as always less than 0.05. Additionally, the inadequacy of the analytical model was partly the cause of the difference between the experiment and the results for the problem formulation. Even when using more sophisticated analysis tools in complex design projects, the differences between the analysis and the experiment were similar to the ones produced in this study. It can be stated that the true optimum was close to the analytical design based on the approximate model, as the difference in the results was very small. Nevertheless, the size of the difference was enough to permit substantial additional gains to be performed by an experimental optimization in the analytical design point neighborhood.

4. Conclusions and Recommendations

A DOE tool was presented in this study to optimize the SCC methodology parameters of inverter-based islanded microgrids, motivated by the need for more evidence that such parameters can be easily parameterized. An approach based on factorial DOE using screening and fractional factorial designs was described in this paper. Such an approach uses classical factorial designs and the desirability function for a multivariate problem of 13 factors and 12 responses. An easy-to-follow procedure was pursued in order to reach the optimal settings for the parameter tuning. This approach was used to identify the main factors and interactions, where confirmatory results were significant in affirming that the parameter tuning had improved best guess scenarios and literature findings. Several designs in the neighborhood of the analytical optimum, defined by specialists, and selected using the DOE methodology, were built and tested to enhance the experimental design procedure. Later, an approximation was fitted to the values of the objective functions at the test points using desirability functions.
The following benefits of using the experimental approach when dealing with parameter tuning for the secondary consensus control of inverter-based islanded microgrids can be listed as follows. First, the number of experiments to reach the optimal settings was drastically reduced. For example, in only two consecutive DOE and one confirmatory experiment, only 33 tests were necessary. From this result, we are able to affirm that the DOE was able to reach the optimal setting with a minimal number of experiments, which would be almost impossible to obtain with the trial-and-error method. Second, the number of rules of thumbs, assumed constants, and empirical values were kept to a minimum in this experimental approach. Finally, the practitioner’s knowledge was essential in defining the DOE factors and levels.
For future research, we suggest using response surface methodology that, at the cost of increasing the number of tests in the experimental design, uses linear or quadratic polynomials to evaluate the statistical differences of possible new optimums. Equal inverter power output was assumed in this study, however, this is not a constraint of the methodology and could be stochastically analyzed in future works. The proposed DOE methodology was experimentally validated in a laboratory microgrid with fully satisfactory results. It would be interesting, however, to explore the benefits of the proposed solution in microgrids outside the laboratory, for example, in neighborhoods or even in a city. This is a long and complex study that is left for future work.

Author Contributions

Conceptualization, G.N.D.d.D., J.M. and P.P.B.; Methodology, G.N.D.d.D. and P.P.B.; Software, J.M. and P.P.B.; Validation, G.N.D.d.D., M.C., J.M., A.C.Z.d.S. and P.P.B.; Formal analysis, G.N.D.d.D. and P.P.B.; Investigation, P.P.B.; Resources, G.N.D.d.D., M.C., J.M., A.C.Z.d.S. and P.P.B.; Data curation, G.N.D.d.D., M.C., J.M., A.C.Z.d.S. and P.P.B.; Writing—original draft preparation, G.N.D.d.D. and P.P.B.; Writing—review and editing, G.N.D.d.D., A.C.Z.d.S. and P.P.B.; Visualization, G.N.D.d.D., M.C., J.M., A.C.Z.d.S. and P.P.B.; Supervision, M.C. and A.C.Z.d.S.; Project administration, M.C. and P.P.B.; Funding acquisition, A.C.Z.d.S. and P.P.B. All authors have read and agreed to the published version of the manuscript.

Funding

This research received no external funding.

Data Availability Statement

Not applicable.

Acknowledgments

This work was supported by the Brazilian agencies of the Council for Scientific and Technological Development (CNPq), Coordination for the Improvement of Higher Education Personnel (CAPES), and Research Support Foundation of the Minas Gerais State (FAPEMIG). This publication is part of the R&D project PID2021-122835OB-C21, financed by MCIN/AEI/10.13039/501000011033 and FEDER “Una manera de hacer Europa”.

Conflicts of Interest

The authors declare no conflict of interest.

References

  1. U.S. Department of Energy (DOE). Combined Heat and Power Technology. 2016. Available online: https://www.energy.gov (accessed on 13 December 2022).
  2. Kroposki, B.; Lasseter, R.; Ise, T.; Morozumi, S.; Papathanassiou, S.; Hatziargyriou, N. Making Microgrids Work. IEEE Power Energy Mag. 2008, 6, 40–53. [Google Scholar] [CrossRef]
  3. Neukirchner, L.; Görbe, P.; Magyar, A. Voltage Unbalance Reduction in the Domestic Distribution Area Using Asymmetric Inverters. J. Clean. Prod. 2017, 142, 1710–1720. [Google Scholar] [CrossRef]
  4. Shahgholian, G. A Brief Review on Microgrids: Operation, Applications, Modeling, and Control. Int. Trans. Electr. Energy Syst. 2021, 31, e12885. [Google Scholar] [CrossRef]
  5. Tayab, U.B.; Bin Roslan, M.A.; Hwai, L.J.; Kashif, M. A Review of Droop Control Techniques for Microgrid. Renew. Sustain. Energy Rev. 2017, 76, 717–727. [Google Scholar] [CrossRef]
  6. Zhang, Y.; Mohammadpour Shotorbani, A.; Wang, L.; Mohammadi-Ivatloo, B. Enhanced PI Control and Adaptive Gain Tuning Schemes for Distributed Secondary Control of an Islanded Microgrid. IET Renew. Power Gener. 2021, 15, 854–864. [Google Scholar] [CrossRef]
  7. Rey, J.M.; Castilla, M.; Miret, J.; Velasco, M.; Martí, P.; Mojica-Nava, E. Negative-Sequence Voltage Elimination for Distributed Generators in Grid-Feeding Operation Mode. IET Power Electron. 2020, 13, 1764–1774. [Google Scholar] [CrossRef]
  8. Phurailatpam, C.; Rajpurohit, B.S.; Wang, L. Planning and Optimization of Autonomous DC Microgrids for Rural and Urban Applications in India. Renew. Sustain. Energy Rev. 2018, 82, 194–204. [Google Scholar] [CrossRef]
  9. Wolsink, M. Distributed Energy Systems as Common Goods: Socio-Political Acceptance of Renewables in Intelligent Microgrids. Renew. Sustain. Energy Rev. 2020, 127, 109841. [Google Scholar] [CrossRef]
  10. de Doile, G.N.D.; Rotella Junior, P.; Rocha, L.C.S.; Janda, K.; Aquila, G.; Peruchi, R.S.; Balestrassi, P.P. Feasibility of Hybrid Wind and Photovoltaic Distributed Generation and Battery Energy Storage Systems under Techno-Economic Regulation. Renew. Energy 2022, 195, 1310–1323. [Google Scholar] [CrossRef]
  11. Sharma, B.; Shrestha, A.; Terriche, Y.; Lashab, A.; Guerrero, J.M. Sharing Sequence Components of Reactive Power in a Three-Phase Four-Wire Islanded Microgrid. Electr. Power Syst. Res. 2022, 213, 108675. [Google Scholar] [CrossRef]
  12. Kaviri, S.M.; Hajebrahimi, H.; Poorali, B.; Pahlevani, M.; Jain, P.K.; Bakhshai, A. A Supervisory Control System for Nanogrids Operating in the Stand-Alone Mode. IEEE Trans. Power Electron. 2021, 36, 2914–2931. [Google Scholar] [CrossRef]
  13. Lv, Z.; Wu, Z.; Dou, X.; Zhou, M.; Hu, W. Distributed Economic Dispatch Scheme for Droop-Based Autonomous DC Microgrid. Energies 2020, 13, 404. [Google Scholar] [CrossRef] [Green Version]
  14. Rosero, C.X.; Velasco, M.; Martí, P.; Camacho, A.; Miret, J.; Castilla, M. Active Power Sharing and Frequency Regulation in Droop-Free Control for Islanded Microgrids under Electrical and Communication Failures. IEEE Trans. Ind. Electron. 2020, 67, 6461–6472. [Google Scholar] [CrossRef]
  15. Guerrero, J.M.; Vasquez, J.C.; Matas, J.; De Vicuña, L.G.; Castilla, M. Hierarchical Control of Droop-Controlled AC and DC Microgrids—A General Approach toward Standardization. IEEE Trans. Ind. Electron. 2011, 58, 158–172. [Google Scholar] [CrossRef]
  16. Miret, J.; De Vicuña, J.L.G.; Guzmán, R.; Camacho, A.; Ghahderijani, M.M. A Flexible Experimental Laboratory for Distributed Generation Networks Based on Power Inverters. Energies 2017, 10, 1589. [Google Scholar] [CrossRef] [Green Version]
  17. Lu, L.Y.; Chu, C.C. Consensus-Based Droop Control Synthesis for Multiple DICs in Isolated Micro-Grids. IEEE Trans. Power Syst. 2015, 30, 2243–2256. [Google Scholar] [CrossRef]
  18. Miret, J.; Balestrassi, P.P.; Camacho, A.; Guzmán, R.; Castilla, M. Optimal Tuning of the Control Parameters of an Inverter-based Microgrid Using the Methodology of Design of Experiments. IET Power Electron. 2020, 13, 3651–3660. [Google Scholar] [CrossRef]
  19. Montgomery, D.C. Design and Analysis of Experiments, 8th ed.; John Wiley & Sons: Hoboken, NJ, USA, 2013; ISBN 9781118146927. [Google Scholar]
  20. Amorim, L.F.; de Paiva, A.P.; Balestrassi, P.P.; Ferreira, J.R. Multi-Objective Optimization Algorithm for Analysis of Hardened Steel Turning Manufacturing Process. Appl. Math. Model. 2022, 106, 822–843. [Google Scholar] [CrossRef]
  21. Saeid Atabaki, M.; Mohammadi, M.; Aryanpur, V. An Integrated Simulation-Optimization Modelling Approach for Sustainability Assessment of Electricity Generation System. Sustain. Energy Technol. Assess. 2022, 52, 102010. [Google Scholar] [CrossRef]
  22. Xiang, Y.; Liu, J.; Liu, Y. Robust Energy Management of Microgrid with Uncertain Renewable Generation and Load. IEEE Trans. Smart Grid 2016, 7, 1034–1043. [Google Scholar] [CrossRef]
  23. Wang, L.; Xu, W.; Zou, K.; Lv, X.; Gao, F.; Yin, W. Integrated Scheduling for Intelligent Regional Grid Based on Differential Evolution. In Proceedings of the 2014 IEEE Innovative Smart Grid Technologies—Asia (ISGT ASIA), Kuala Lumpur, Malaysia, 20–23 May 2014; pp. 312–317. [Google Scholar] [CrossRef]
  24. Mauro, C.A.; Smith, D.E. Factor Screening in Simulation: Evaluation of Two Strategies Based on Random Balance Sampling. Manag. Sci. 1984, 30, 209–221. [Google Scholar] [CrossRef]
Figure 1. Diagram of the microgrid under study.
Energies 16 00517 g001
Figure 2. Primary and secondary controllers in each microgrid node, based on [17].
Energies 16 00517 g002
Figure 3. Geometric representation for k = 3 of the (a) full factorial designs and (b) fractional factorial designs. Adapted from Montgomery [19].
Energies 16 00517 g003
Figure 4. Process characterization of the system description.
Energies 16 00517 g004
Figure 5. Software scheme to help select appropriate designs.
Energies 16 00517 g005
Figure 6. The results of two experiments using different value sets of the secondary control parameters. Note that the merit factors were measured at t = 50 s, clearly showing different overshoots in frequency, voltage, and reactive power.
Energies 16 00517 g006
Figure 7. Optimal settings for the parameter tuning.
Energies 16 00517 g007
Figure 8. Experimental tests under the optimal set of the secondary control parameter values.
Energies 16 00517 g008
Table 1. Hardware parameters.
Nominal voltage (line to neutral)Vnom110 V rms
Nominal frequencyfnom60 Hz
Nominal rated power (base power)Sb2.5 kVA
Line impedance Z1LZ14 mH
RZ10.5 Ω
Line impedance Z2LZ21 mH
RZ20.5 Ω
Line impedance Z3LZ30.6 mH
RZ31.13 Ω
Line impedance Z4LZ40.8 mH
RZ40 Ω
Table 2. Merit responses for the studied microgrid.
Symbol (Unit)ResponseEquation
ePsActive power sharing error e P s = A b s Max P i 1 3 j = 1 3 P j 1 3 j = 1 3 P j (9)
eQsReactive power sharing error e Q s = A b s Max Q i 1 3 j = 1 3 Q j 1 3 j = 1 3 Q j (10)
Frequency deviation from nominal value e w = A b s ( Max ω n o m ω i ω n o m (11)
eVMean voltage deviation from the nominal value e V = A b s Max V n o m 1 3 j = 1 3 V j 1 3 j = 1 3 V j (12)
AP (W)Active power overshootAP = Max (PiPi_steady-state)(13)
AQ (Var)Reactive power overshootAQ = Max (QiQi_steady-state)(14)
(rad/s)Frequency overshoot = Max (ωiωi_steady-state)(15)
AV (V)Voltage overshootAV = Max (ViVi_steady-state)(16)
tsP (s)Maximum step active-power change settling time
tsQ (s)Maximum step reactive-power change settling time
tsω (s)Maximum step frequency change settling time
tsV (s)Maximum step-voltage change settling time
Table 3. Resolution III fractional factorial design *.
RunTrKω1Kω2Kω3Aω1Aω2Aω3KV1KV2KV3KQ1KQ2KQ3
10.1155.155.155.1515.0515.0515.050.25750.25750.25750.012880.012880.03763
20.3255.155.155.155.155.155.150.25750.75250.75250.037630.037630.03763
30.11515.055.155.155.155.1515.050.75250.75250.75250.012880.012880.01288
40.32515.055.155.1515.0515.055.150.75250.25750.25750.037630.037630.01288
50.1155.1515.055.155.1515.055.150.75250.75250.25750.037630.012880.01288
60.3255.1515.055.1515.055.1515.050.75250.25750.75250.012880.037630.01288
70.11515.0515.055.1515.055.155.150.25750.25750.75250.037630.012880.03763
80.32515.0515.055.155.1515.0515.050.25750.75250.25750.012880.037630.03763
90.1155.155.1515.0515.055.155.150.75250.75250.25750.012880.037630.03763
100.3255.155.1515.055.1515.0515.050.75250.25750.75250.037630.012880.03763
110.11515.055.1515.055.1515.055.150.25750.25750.75250.012880.037630.01288
120.32515.055.1515.0515.055.1515.050.25750.75250.25750.037630.012880.01288
130.1155.1515.0515.055.155.1515.050.25750.25750.25750.037630.037630.01288
140.3255.1515.0515.0515.0515.055.150.25750.75250.75250.012880.012880.01288
150.11515.0515.0515.0515.0515.0515.050.75250.75250.75250.037630.037630.03763
160.32515.0515.0515.055.155.155.150.75250.25750.25750.012880.012880.03763
* In a resolution III fractional design, there is no confusion among the main effects. However, all main effects were aliased to 2-factor interactions.
Table 4. Response variables for each previous experimental run *.
RunepseVeQstsωtsptsVtsQAPAVAQ
[%][%][%][%][s][s][s][s][rad/s][W][V][Var]
13.31 × 10−56.76 × 10−23.57 × 10−31.10174.1600.4905.3300.6900.1200.0001.33871.900
23.63 × 10−56.80 × 10−21.60 × 10−27.77352.9903.2305.3800.8800.10063.2005.445125.600
31.43 × 10−57.30 × 10−23.60 × 10−40.92440.8800.4901.3201.3000.12027.0001.96038.100
45.55 × 10−55.98 × 10−27.57 × 10−30.22187.6302.2003.3302.3500.090135.30010.423510.900
51.09 × 10−57.80 × 10−24.96 × 10−31.39992.6900.5401.3700.3400.0900.0001.40071.600
64.04 × 10−56.15 × 10−21.57 × 10−31.66147.8302.9902.5002.8400.120117.80011.045573.100
73.10 × 10−56.01 × 10−27.36 × 10−33.56842.2000.5901.3700.7900.0900.0000.96488.900
82.19 × 10−56.39 × 10−21.32 × 10−21.69368.5102.4503.8202.1500.120148.60011.978472.600
96.17 × 10−57.69 × 10−21.71 × 10−30.46991.5701.1301.5201.8600.11083.5007.311193.500
104.15 × 10−55.08 × 10−29.53 × 10−46.9779.6800.8801.9602.2000.12021.8002.707102.300
114.60 × 10−68.14 × 10−24.81 × 10−31.51351.9100.5901.4200.8300.1100.0001.26098.100
126.36 × 10−56.08 × 10−27.01 × 10−41.39268.6801.6701.9603.5700.12037.8003.42296.700
131.90 × 10−59.17 × 10−23.37 × 10−39.79430.7800.5902.9400.0000.1200.0001.60277.400
146.44 × 10−54.20 × 10−23.27 × 10−329.347.9701.7102.4502.9900.110122.60011.511560.300
151.49 × 10−57.36 × 10−23.09 × 10−31.24654.5500.9801.3200.0000.11082.4007.156206.100
162.99 × 10−57.07 × 10−21.21 × 10−32.27123.5701.7602.1503.6200.110181.90014.001537.000
* Each response was obtained for three independent specialists so that the measurement system could be validated.
Table 5. Main findings from the screening DOE.
Composite Desirability Interval
FactorLowerUpperSettingObservation
Tr0.1150.3250.115The lower the better
Kω19.6515.05 To the next DOE
Kω25.1513.457.05Not significant (with desirability peak)
Kω35.1515.059.95Not significant (with desirability peak)
Aω15.159.85 To the next DOE
Aω28.215.05 To the next DOE
Aω35.159.6 To the next DOE
KV10.590.7525 To the next DOE
KV20.25750.75250.425Not significant (with desirability peak)
KV30.490.7525 To the next DOE
KQ10.020.0376 To the next DOE
KQ20.01290.019 To the next DOE
KQ30.01290.03760.02525Not significant (with desirability peak)
Table 6. Fractional factorial design with resolution IV.
RunKω1Aω1Aω2Aω3KV1KV3KQ1KQ2
19.655.158.25.150.590.490.020.0129
215.055.158.25.150.590.75250.03760.019
39.659.858.25.150.75250.490.03760.019
415.059.858.25.150.75250.75250.020.0129
59.655.1515.055.150.75250.75250.03760.0129
615.055.1515.055.150.75250.490.020.019
79.659.8515.055.150.590.75250.020.019
815.059.8515.055.150.590.490.03760.0129
99.655.158.29.60.75250.75250.020.019
1015.055.158.29.60.75250.490.03760.0129
119.659.858.29.60.590.75250.03760.0129
1215.059.858.29.60.590.490.020.019
139.655.1515.059.60.590.490.03760.019
1415.055.1515.059.60.590.75250.020.0129
159.659.8515.059.60.75250.490.020.0129
1615.059.8515.059.60.75250.75250.03760.019
Table 7. Response variables for each experimental run in Table 6 *.
RunepseVeQstsωtsptsVtsQAPAVAQ
[%][%][%][%][s][s][s][s][rad/s][W][V][Var]
11.27 × 10−58.40 × 10−22.31 × 10−30.6582.5921.6631.4181.4900.06522.8551.59152.920
21.25 × 10−58.80 × 10−22.60 × 10−34.89822.6901.8091.6141.5400.11037.4694.172101.629
34.91 × 10−58.42 × 10−21.50 × 10−30.74623.2761.8581.7601.5900.10950.2104.774136.320
44.45 × 10−59.68 × 10−24.10 × 10−31.38673.4231.7601.4181.2500.08125.7492.12575.430
51.07 × 10−58.87 × 10−24.80 × 10−34.37782.9341.8091.6141.8800.10945.3524.957133.294
62.03 × 10−58.35 × 10−25.00 × 10−34.72212.9341.8581.7601.3300.10853.7484.925147.597
75.94 × 10−59.02 × 10−23.90 × 10−31.54352.4451.7601.6141.8800.10727.0073.58562.612
82.80 × 10−56.06 × 10−26.10 × 10−39.67123.6191.9071.8090.9000.10740.9963.57487.401
95.38 × 10−68.68 × 10−23.60 × 10−32.26093.0321.7601.5651.4400.11841.6474.813140.314
103.11 × 10−68.87 × 10−22.60 × 10−38.31530.9781.8091.7600.9000.11750.6114.355157.833
112.32 × 10−58.72 × 10−23.60 × 10−30.65664.0101.7601.7121.6400.11842.9143.895103.365
129.41 × 10−68.82 × 10−24.60 × 10−38.33333.2761.7121.5650.6600.07426.2921.84352.678
139.83 × 10−68.56 × 10−23.90 × 10−30.60133.4231.8091.8581.3900.12039.6843.924106.555
149.25 × 10−68.09 × 10−26.10 × 10−31.67423.4721.8091.7122.1300.11839.5873.980105.772
152.70 × 10−58.26 × 10−22.00 × 10−30.48314.4991.8581.8091.6400.11859.2584.792157.127
163.25 × 10−59.29 × 10−23.80 × 10−31.00014.7431.7601.5161.6900.11748.7294.813130.817
* Each response was obtained by three independent specialists so that the measurement system could be validated.
Disclaimer/Publisher’s Note: The statements, opinions and data contained in all publications are solely those of the individual author(s) and contributor(s) and not of MDPI and/or the editor(s). MDPI and/or the editor(s) disclaim responsibility for any injury to people or property resulting from any ideas, methods, instructions or products referred to in the content.