Article

Reliability Improvement of a Hybrid Electric Vehicle Integrated Distribution System

by
Ramalingam Sripriya
1,
Chandrasekaran Kumar
2,
Felix Joseph Xavier
3,
Jeyaraj Senthil Kumar
4,
Panos Kotsampopoulos
5,* and
Hady H. Fayek
6
1
Department of Electrical Engineering, Annamalai University, Chidambaram 08002, India
2
Electrical and Electronics Engineering, M.Kumarasamy College of Engineering, Karur 639113, India
3
Electronics and Communication Engineering, Rohini College of Engineering and Technology, Kanyakumari 629401, India
4
Electrical and Electronics Engineering, Bannari Amman Institute of Technology, Erode 638401, India
5
School of Electrical and Computer Engineering, National Technical University of Athens, 15773 Athens, Greece
6
Electromechanics Engineering Department, Faculty of Engineering, Heliopolis University, Cairo 11785, Egypt
*
Author to whom correspondence should be addressed.
Energies 2023, 16(10), 3984; https://doi.org/10.3390/en16103984
Submission received: 22 March 2023 / Revised: 1 May 2023 / Accepted: 5 May 2023 / Published: 9 May 2023
(This article belongs to the Special Issue Modeling and Analysis of Active Distribution Networks and Smart Grids)

Abstract

:
The recent trend in hybrid electric vehicles (HEV) has increased the need for vehicle charging stations (VCS) in the distribution system. In this condition, the additional load in the system leads to an increase in power loss, reduction in voltage and reliability of the system. The drawbacks of introducing this additional load can be rectified by integrating distributed generation (DG) into the distribution system. In this paper, the ideal location for placing DG is identified through the voltage stability index. The power loss minimization objective function is formulated with all the required constraints to estimate the size of DG required for the distribution system. Moreover, loss of load probability is used as a reliability assessment technique, through which the system reliability is analyzed after assessing the impact of integrating VCS and DG. Simulations are carried out to compare the following cases: a system without VCS and DG, a system that has only VCS and a system that has both VCS and DG. The IEEE 12-bus and 33-bus test systems are considered. In the 12-bus system with both VCS and DG, the power loss is reduced by 56% when compared with the system with only VCS, while the net reliability is also improved. The reliability of the system is evaluated for a 24 h load variation. The proposed work provides an efficient tool to improve the reliability of the system with support from DG.

1. Introduction

The recent trend in electric vehicle integration is expected to have a major impact on the distribution system. On the other side, the integration of renewable energy sources is constantly increasing [1]. Apart from fully electric vehicles, hybrid electric vehicles (HEV) combine conventional fuel and battery sources. The design and operation of an HEV are mainly focused on the factors related to the charging of the battery and scheduling the charging time [2,3]. HEV should be charged from vehicle charging stations (VCS), leading to an increase in distribution system load. Therefore, the effect of HEV in the distribution system must be analyzed by a power flow study.
The unbalanced distribution of load and the higher resistance to impedance ratio (R/X) in the distribution branches makes the conventional transmission load flow techniques not suitable for the distribution system. Hence, a backward/forward sweep distribution load flow study is followed for the distribution system. The distribution load flow technique identifies the power flow, power loss, voltage profile and current in the feeder. The reliability of the distribution system implies that it should provide an uninterruptable supply for all the connected loads. This can be enhanced by integrating distributed generation into the distribution system. Distributed generation is typically located near the load; therefore, it can decrease the amount of energy flowing through the transmission system. Moreover, the power from distributed generation can be utilized to support the distribution system.
Nowadays, the use of HEV is increasing, which leads to the installation of vehicle charging stations. Therefore, it is essential to balance the power load in the distribution system to compensate for this new load. In this paper, the distribution system after the installation of charging stations as additional load is analyzed while leveraging on distributed generation to improve system performance. The performance of the system is analyzed through distribution line losses, distribution system reliability and voltage profiles at the load buses.

2. Literature Survey

The rise in reactance per resistance ratio in distribution system leads to reactive power consumption and hence the voltage profile is reduced [4,5]. Thus it adversely influences the power quality of the system. The decrease in reactance per resistance ratio, higher the step of voltage varies as a wind power function. The voltage regulation via reactive power control depends on the X of line when the R of the line is neglected. Thus, these solutions are suited, where X/R ratio is larger in the transmission network.
In [6], a methodology was developed to identify the influence of HEV on the reliability of the distribution network. The loss of load probability was evaluated. The author proposed a reliability assessment in power systems for various HEV penetration rates. The reliability indices were represented as a cost of penalty for the decrease in energy and intermission. The minimum generation effectiveness of generation units was calculated.
A method for the controlled charging and discharging of HEV batteries on a real-time basis was developed in [7]. This control technique uses an improvement of the steady-state voltage stability index for easy computation of the index in the distribution system. This leads to the reliable operation of the system for any change in the size and location of HEVs.
The integration of DG into the distribution system during normal operating conditions can enhance reliability [8]. During/after a natural disaster, the system aims to supply the critical load. This can be facilitated by distributed generation. The author uses the particle swarm optimization method using the objective function, calculating the optimal size and allocation of distributed generation.
The voltage level variation due to inserting DG was analyzed in [9]. The authors proposed a method for placing generators of various sizes and technologies in the distribution system. The small-scale consumer percentage was evaluated in the given system for various configurations of DG. Moreover, the different effects of PV and wind generation were analyzed.
In [10], the charging and discharging impacts of HEV and reliability were evaluated for two different areas. The system reliability was enhanced when the system included HEV and DG.
An analytical method for the evaluation of reliability and distribution system enhancement was derived, and a cost-effective index was developed [11].
The impact of power quality for integrating large-scale HEV in the distribution systems was studied in [12]. Issues such as voltage profile, line loading and power losses were investigated by conducting time series simulations. HEV was designed as a current harmonics source that introduces harmonics to different buses.
In [13], the benefits of renewable DG integration were investigated, namely reduction in line losses and improvement of reliability, among others. If all renewable DG units were optimally located, sized and configured, these benefits were optimized. This work also addressed the current situation of renewable DG technology by highlighting various characteristics and issues of DG integration.
In [14], an analytical method for optimally installing DG in order to reduce the power losses in the network was proposed. For the reduction of losses, various parameters of DG were considered, such as location, number, power factor and capacity of distributed generation units.
In [15], renewable-based DG was proposed for annual energy loss reduction in the distribution system by applying evolutionary algorithms. A literature survey was performed in [16], as well as a comparative analysis for network reconfiguration, enhancement of reliability and minimization of losses in the distribution network. Network reconfiguration helps to improve the performance of the distribution network by modifying its structure and can result in monetary benefits for the distribution company.
The importance of the reliability evaluation using analytical techniques for an electrical power distribution network was explained in [17]. This method notices the failure mode of the procedure, and by its ranking, it decreases the impact. Reliability system indices were also considered for the evaluation of reliability.
A new method for the reliability assessment of power systems by meeting its capacity limit was proposed in [18]. The upper limit is the probability of overconsumption. The system is at risk, i.e., unable to serve a demand, if the load is higher than the generation capacity. The main issue of the reliability assessment is the capacity of the power system to meet the expected demand. In [19], a reliability assessment was performed for a microgrid comprising renewable sources.
In [20], a DG allocation method was proposed for enhancing the reliability of the distribution system. The authors applied an optimization technique based on genetic algorithms for decision-making on strategic points. Moreover, in [21], energy storage technology was introduced in the distribution system to improve the network loss and voltage deviation. The objectives and summary of Literature survey is shown in Table 1.

Research Gap

Nowadays, many research works are proposed for the efficient integration of VCS into the distribution system. In [22], reliability analysis was performed for the distribution system with the integration of EV based on customer interruptions, while in [23], reliability improvement for the distribution system with EV was achieved through demand side management. Reliability enhancement in the distribution system with EV was also performed using an optimization algorithm [24]. Moreover, EV integration in a residential region was analyzed through the whale optimization technique for energy management [25]. Optimal scheduling for EV charging was developed by the dynamic programming method [26] and the Markov decision process [27] to perform energy management. Moreover, coordinated control techniques and energy management strategies of EVs were analyzed in [28]. Additional energy source integration in the distribution system was performed under different conditions, microgrid optimization and cost minimization [29,30].
In the literature survey, most of the research works show the performance analysis of EV-integrated distribution systems and DG integration for system performance enhancement. The simultaneous integration of both EV and DG with the objective of minimizing distribution loss and improving the reliability of the system has rarely been considered.
In this paper, the combined operation of HEV and DG is analyzed in order to improve the reliability, minimize the power losses and improve voltage profiles. The size of the VCS is determined by considering the battery capacity of the Hyundai Kona electric car battery rating. The optimal location for DG is identified through the voltage stability index, and reliability analysis is performed through loss of load probability (LOLP). It is shown that by integrating DG into distribution systems with VCS, power losses are reduced, while reliability and voltage profiles are improved. The major work carried out in this paper is
  • The VCS integration in the distribution system is considered an additional load to charge the EVs.
  • The impact of the increased load (VCS) in the distribution system is rectified by the optimal integration of DG.
  • Reliability analysis is performed to study the effectiveness of the system.

3. System Description

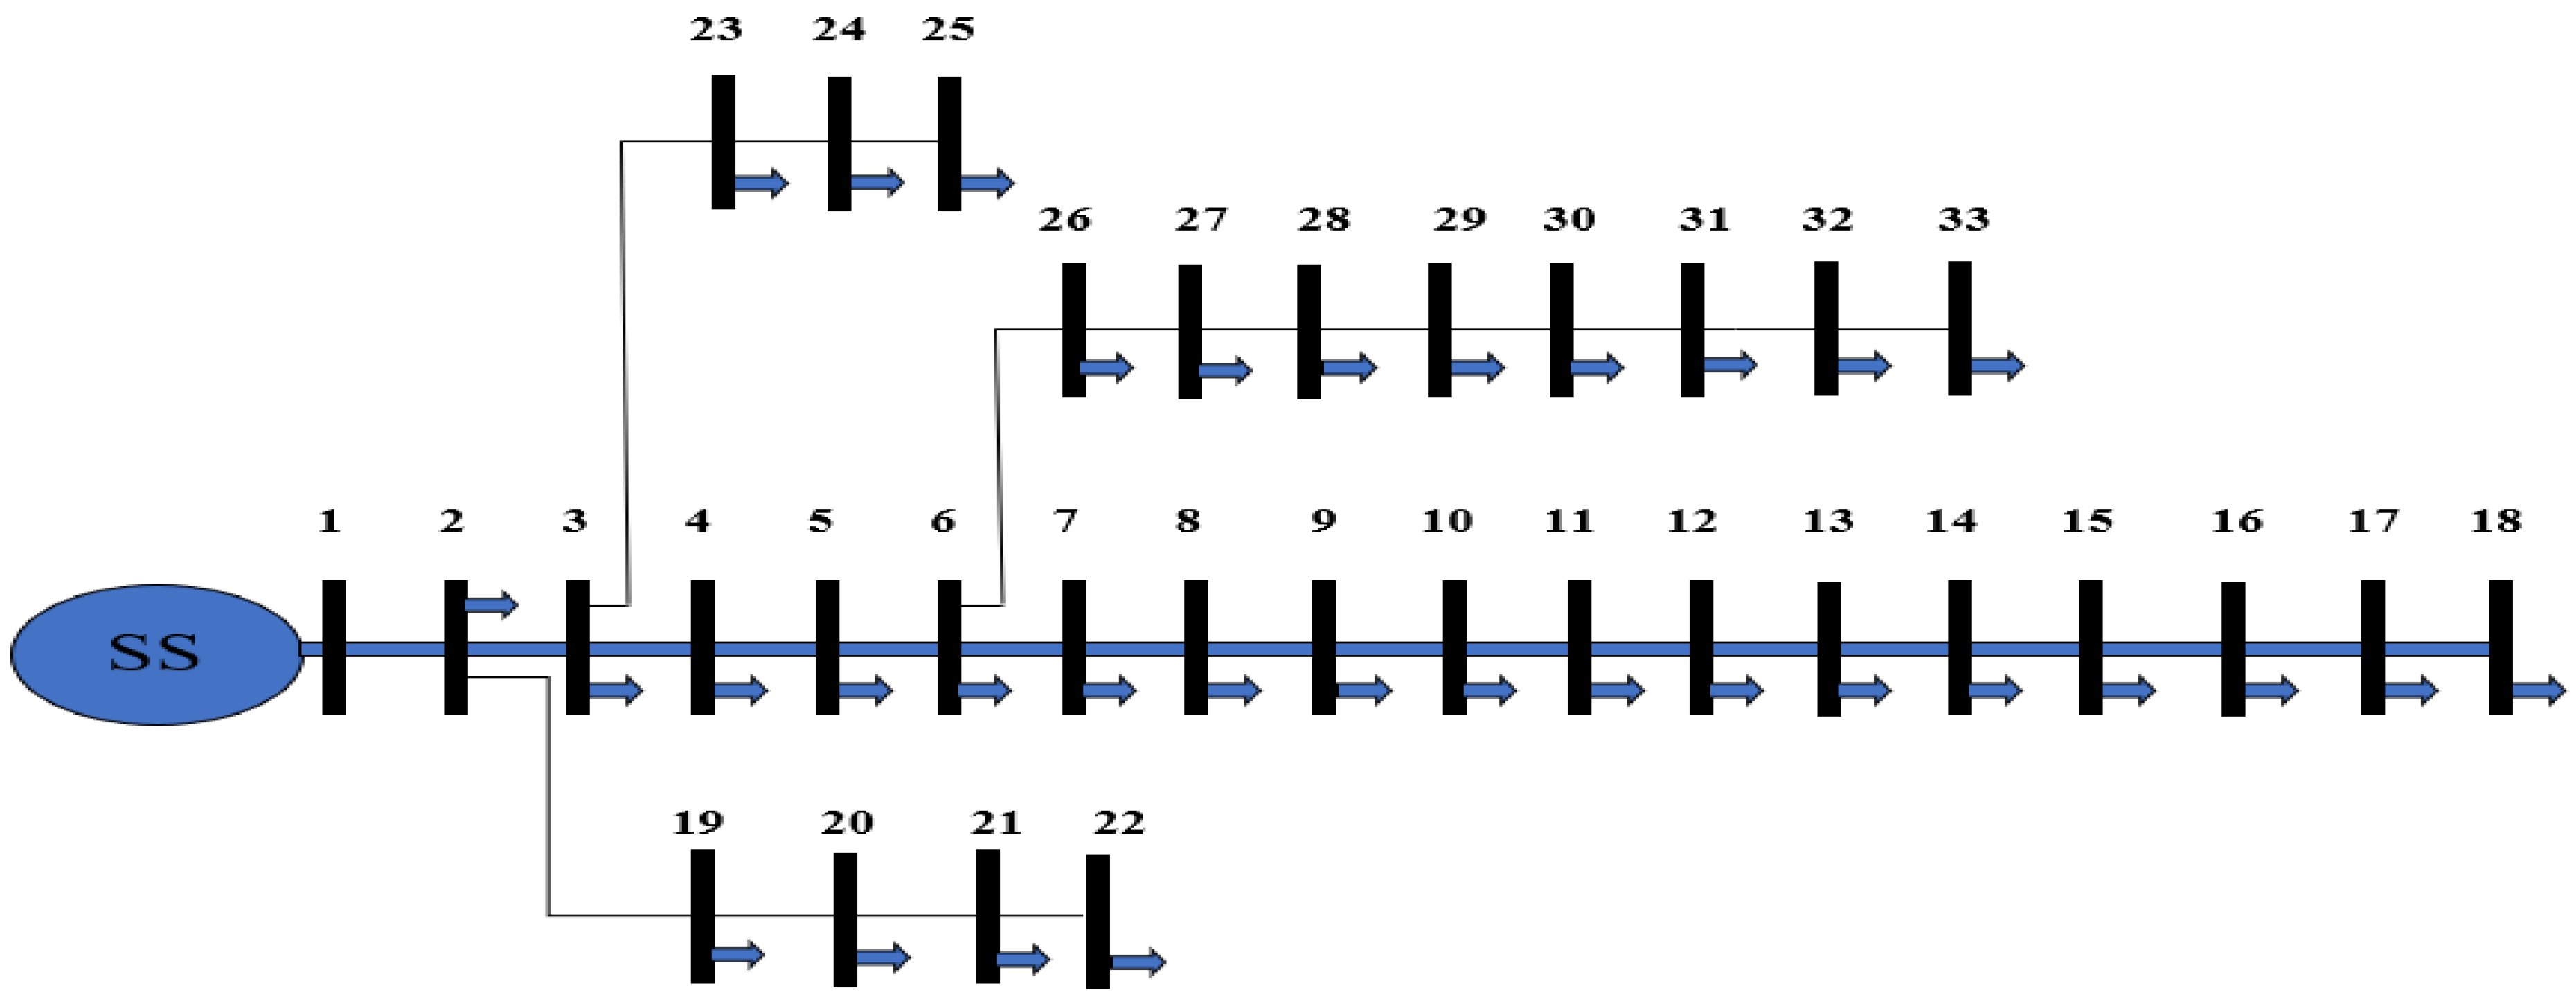
In this work, radial distribution systems are considered. Specifically, the established IEEE 12-bus and 33-bus distribution systems are simulated. The 12-bus distribution system has 1 substation, 11 load buses and 11 distribution lines connected through a single main feeder. The 33-bus system has 1 substation, 32 load buses and 32 branches connected through main and lateral feeders. In this paper, the VCS is introduced in a bus to promote the usage of HEV and, therefore, VCS is considered the additional load in the system. The impact on the distribution system due to VCS integration is mitigated by integrating DG.

Hybrid Electric Vehicle

The HEV considered in our study is the Hyundai Kona electric car which operates with a lithium-ion battery. The conventional liquid electrolyte is replaced with a polymer electrolyte in this model. Lithium metal batteries and lithium-ion batteries are known as lithium polymer cells. These batteries work by de-intercalation and intercalation. The battery model in this study has a capacity of 39.2 kWh. The power rating of the VCS is 156.8 kW.

4. Problem Formulation

The VCS is located at the end of the distribution system to study the possible worst-case scenario. The optimal location for integrating DG is selected through the voltage stability index, and the DG size is selected by considering power loss minimization as the objective function. The reliability analysis in the distribution system is performed by evaluating the loss of load probability, which measures the system reliability by considering the probability of load shedding.

4.1. Voltage Stability Index (VSI)

In a general distribution system, a branch connecting two buses is shown in Figure 1. The voltage stability index (VSI) at bus j is computed as follows [7].
The current flow between buses i and j is calculated as follows:
I i 2 = P i 2 + Q i 2 V i ,
I j 2 = P j 2 + Q j 2 V j 2 .
Here, the real and reactive power injected at bus i is represented as P i and Q i , respectively. Similarly, the real and reactive power injected at bus j is represented as P j and Q j , respectively; voltage magnitude at bus i and j is V i and V j , respectively. The real and reactive power loss of the given line is represented as P l o s s and Q l o s s ; they are given as:
P l o s s = P j 2 + Q j 2 V j 2 R ,
Q l o s s = P j 2 + Q j 2 V j 2 X ,
P j = P i P j 2 + Q j 2 V j 2 R ,
Q j = Q i P j 2 + Q j 2 V j 2 X .
Here, R and X represent the resistance and reactance of the line connecting the buses i and j.
Substitute (1), (5) and (6) in (2),
P i 2 + Q i 2 V i = 1 V j 2 P j + P j 2 + Q j 2 V j 2 R 2 + Q j + P j 2 + Q j 2 V j 2 X 2 .
Rearranging (7) gives the power flow equation at bus j,
a V j 4 + b V j 2 + c = 0 ,
where
a = 1 ,
b = 2 P j R + Q j X V i 2 ,
c = P j 2 + Q j 2 R 2 + X 2 .
The second-order equation of (8) can be written as
V j 2 = b ± b 2 4 a c 2 a .
By applying the below condition, the terminal voltage at node j is obtained.
b 2 4 a c 0 , 2 P j R + Q j X V i 2 2 4 P j 2 + Q j 2 R 2 + X 2 0 ,
1 V i 4 V i 2 P j R + Q j X + P j X Q j R 2 1 .
The steady-state VSI at the jth bus is defined by,
L j = 1 V i 4 P i X Q i R 2 + V i 2 P j R Q j X .
The VSI (L) is defined by,
L = m a x L 1 , L 2 , L 3 , , L N 1 .

4.2. Reliability Index

A distribution system should be able to supply uninterrupted power to satisfy the load. The probability that there is insufficient power to satisfy the load is measured by the loss of load probability (LOLP) index. In our paper, the LOLP is formulated to estimate the chances of disconnection of load for a day, and it is calculated as follows [6],
L O L P = t = 1 N T t N T ,
where
t = { 0   D G   s i z e + P i n L o s s e s E V   L o a d + S t d   l o a d 0 1   D G   s i z e + P i n L o s s e s E V   L o a d + S t d   l o a d < 0
NT—total time duration;
Pin = Input power from the substation.
In a distribution system, the load and generation vary for each hour. The power source from the substation needs to supply the load and losses in the distribution lines. In our case, if DG is introduced to the system, then it acts as an additional source to the system. Hence the generation capacity of the system at a particular time is measured as follows:
G(t): generation capacity limit at a time t;
G(t) = DG size + PinLosses.
The total load requirement in a system is the sum of all the loads connected to each bus. In our case, VCS is introduced, leading to the inclusion of EV load in the location of the VCS. Hence, the load consumption of a system at a particular time is measured as follows:
L(t): total load of a system at a time t;
L(t) = EV Load + Std load.
In the ideal case, the difference between generation capacity and load consumed must be zero. If the value is greater than 0, there is no need for load shedding; hence, LOLP is 0. If the value is less than 0, there is a need for load shedding; therefore, LOLP is 1. By measuring the average LOLP for a day, the reliability level of the distribution system is determined.
If LOLP is low in the distribution system, the reliability of the system is adequate. If the generation capacity of a system is not increased with the increase in the demand, then the LOLP is increased. The LOLP flow chart is shown Figure 2.

4.3. Objective Function

The objective of power loss minimization is developed as a non-linear function including the power supplied from DG and the load consumption in VCS. The objective function in Equation (15) is solved by considering the constraints from Equations (16)–(18).
M i n P l o s s P D G = k = 1 L P r + j Q r P D G + P V C S V r 2 R k .
Here, the total number of branches in the system is represented by L, the real power supplied through DG is represented as PDG and the real power consumed by HEV through VCS is PVCS.
  • Power Balance Constraint
    P S S = i = 2 B P D , i + k = 1 L P l o s s , k P D G + P C S .
Here, real power supplied through the substation is represented as P S S , and the total number of buses in the system is represented as B.
  • Voltage Constraint
    V i , m i n V i V i , m a x .
Here, the minimum and maximum voltage allowed in each bus is represented as V i , m i n and V i , m a x .
  • DG Penetration Constraint
    P D G i = 2 B P D , i + P V C S .
Here, the total power demand of the system is represented as PD,i.

4.4. Forward and Backward Sweep Algorithm

The general transmission line load flow analysis is not suitable for calculating power flow in the distribution system. Hence, the forward and backward sweep algorithm is used in this work to perform load flow analysis. This method calculates the voltage and current in the distribution line, through which the power flow in the line is calculated. In the backward sweep, Kirchoff’s current law is applied to calculate the current from the end bus to the substation. In forward sweep, voltage is computed from the substation to the end bus. When considering a distribution system with multiple feeders, at the junction bus, all the feeders connected to the bus should be considered for both forward and backward sweep.
Steps to perform distribution load flow are given below:
STEP 1: Start the process with the initial voltage at each bus as 1 p.u.
STEP 2: Calculate the current at each bus based on the load connected using Equation (19).
I i = P i + j Q i V i * .
STEP 3: Backward sweep is performed to calculate the current flow from the ending bus to the starting bus, i.e., (i + 1)th bus to ith bus, using Equation (20).
I i , i + 1 = I i + 1 + b r a n c h   c u r r e n t   f l o w i n g   f r o m   i t h   b u s .
STEP 4: The current from step 3 is used in the forward sweep to calculate the voltage at each bus using Equation (21)
V i = V i + 1 + I i , i + 1 Z i , i + 1 .
STEP 5: Steps 3 and 4 are repeated until the voltage value is converged to 10−6.

5. Methodology

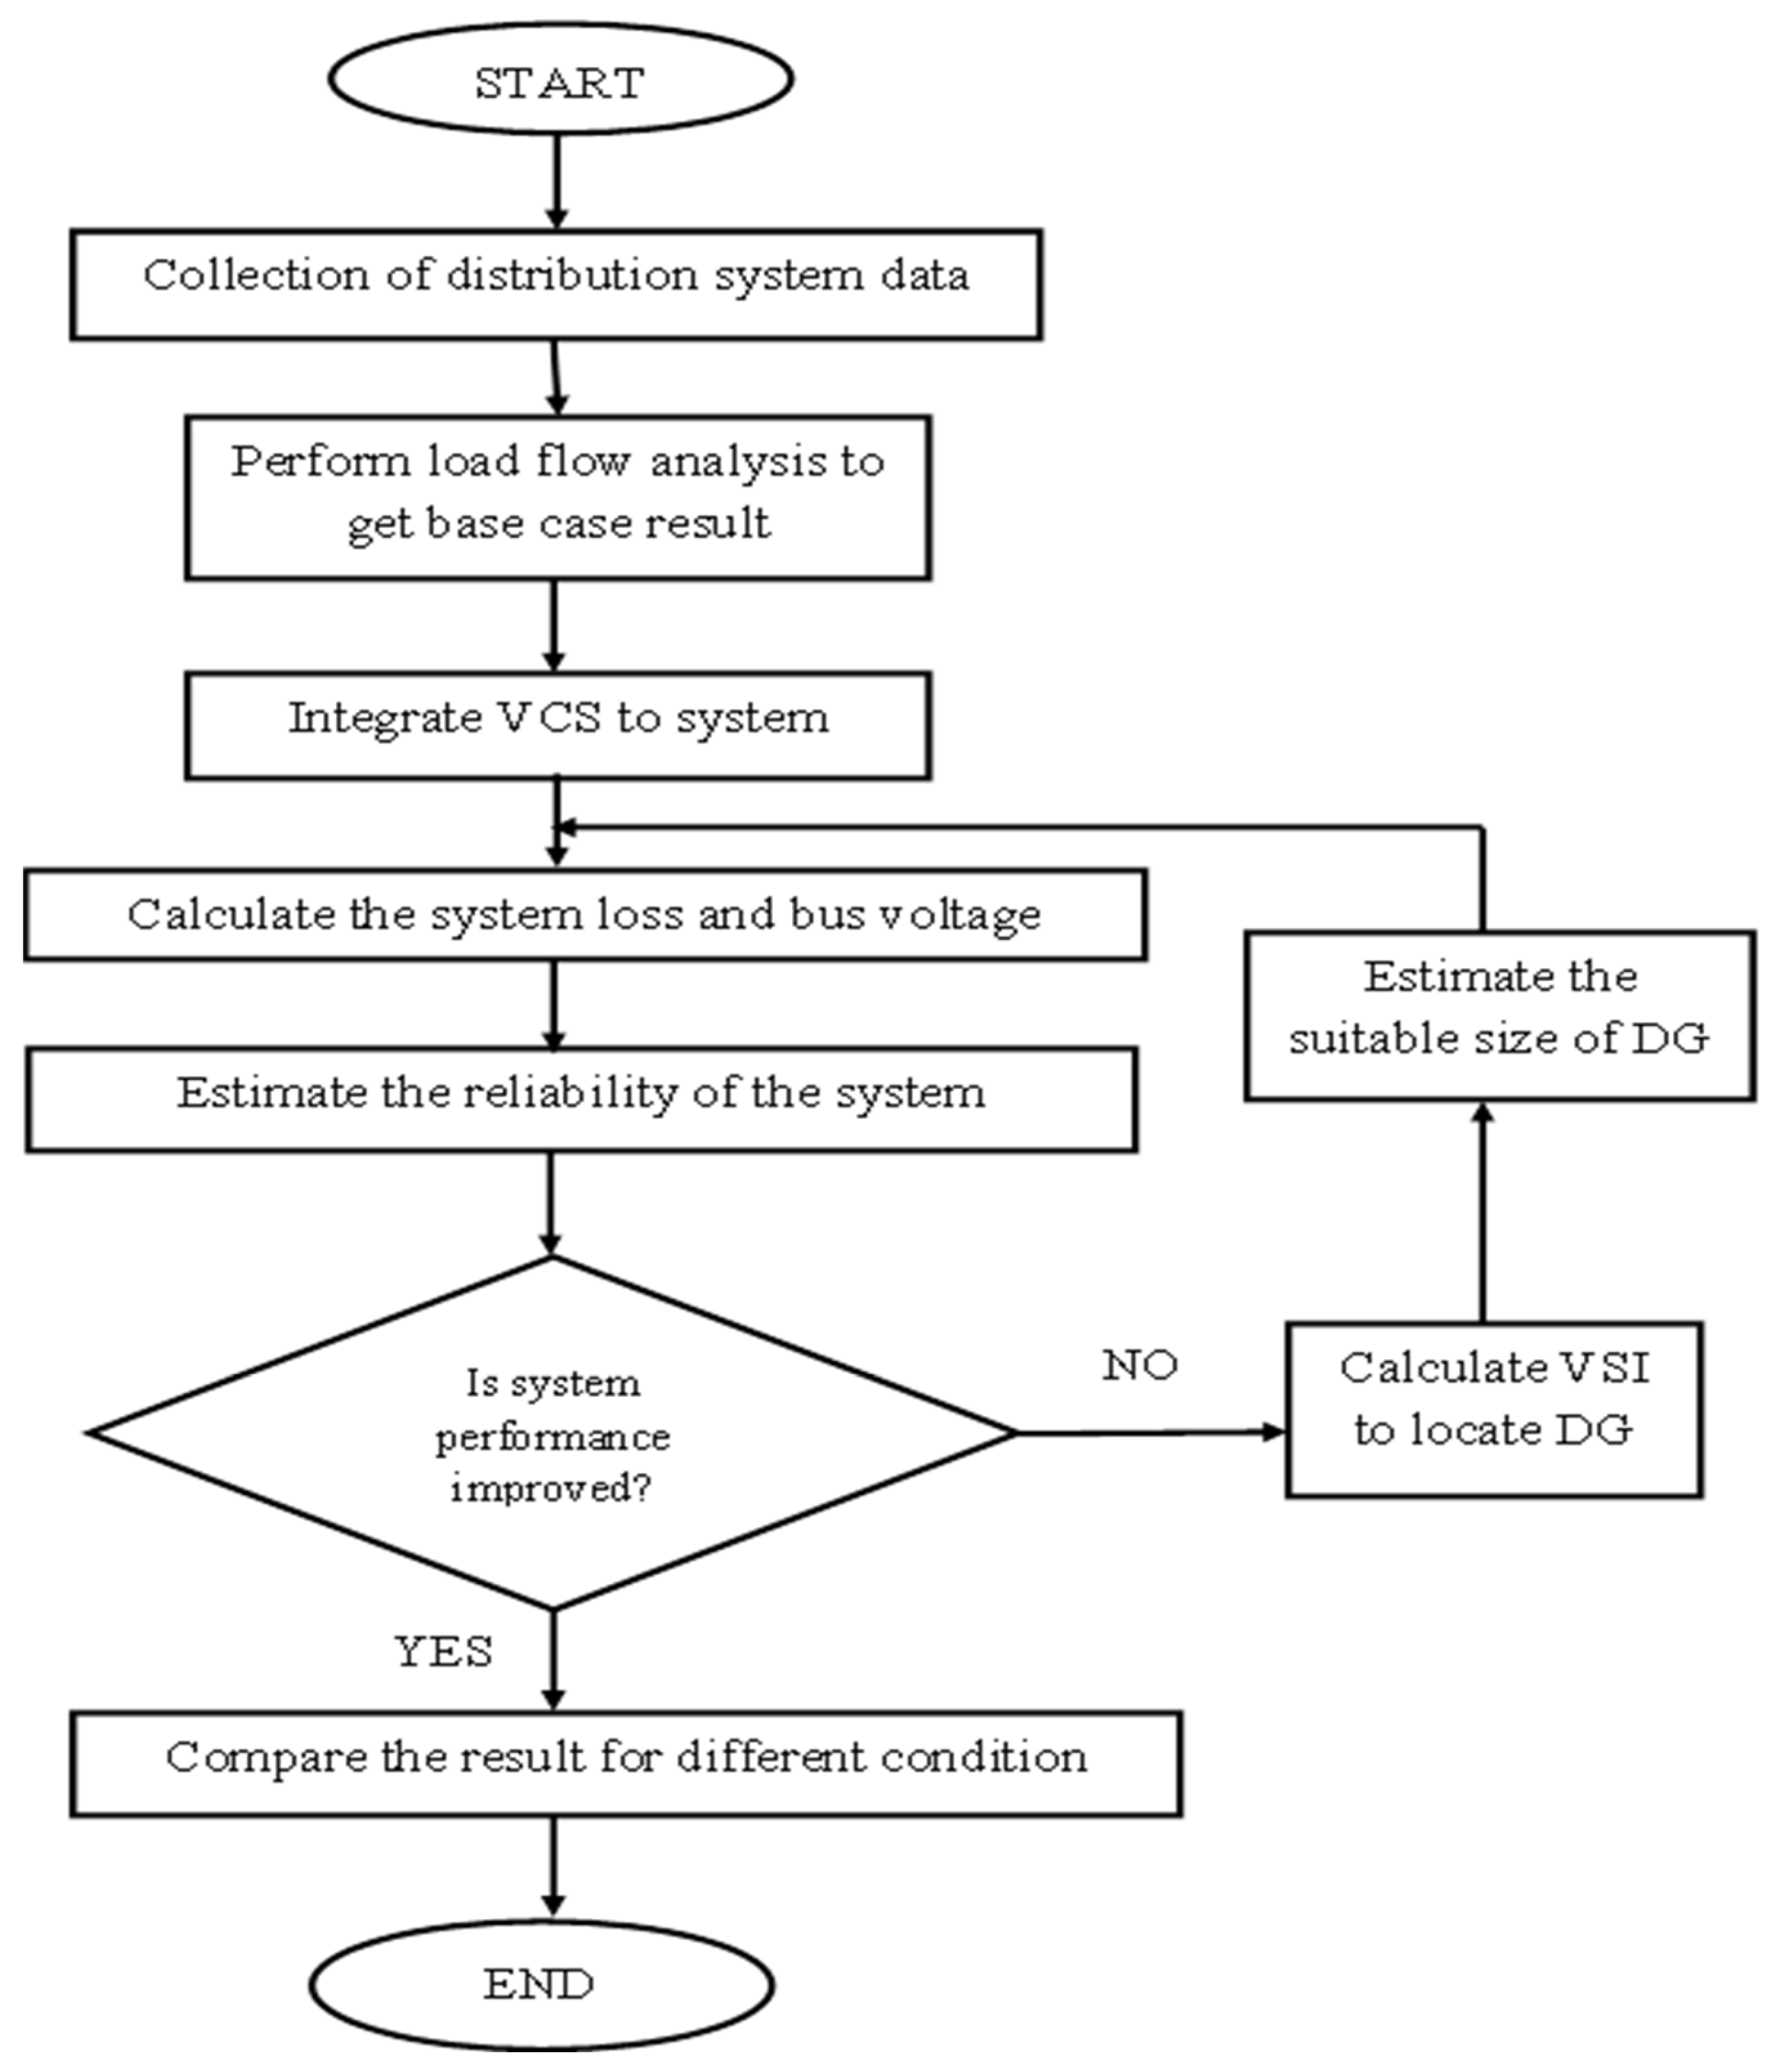
The reliability enhancement in the distribution system becomes a major concern with varying loads. While considering VCS as an additional load, it is also required to monitor the reliability of the distribution system. The proposed methodology to perform this objective is shown as a flow chart in Figure 3. Moreover, the algorithm developed to study the system without VCS and DG, only with VCS and with both VCS and DG, is given in Algorithm 1.
Algorithm 1. Proposed methodology to analyze system performance.
STEP 1: The location of the substation, number of feeders and their interconnected branches with main and lateral feeders are noted from the IEEE radial distribution system.
STEP 2: The power demand in each load bus is noted for the IEEE system.
STEP 3: The impedance values of the distribution lines between the buses are noted for the IEEE system.
STEP 4: Forward and backward sweep load flow analysis is performed with the collected data.
STEP 5: The voltage at each bus and the current through each branch is calculated through the forward and backward sweep, respectively.
STEP 6: Power flow, voltage, current and losses are obtained through load flow analysis.
STEP 7: VCS is placed arbitrarily in the last bus of the selected distribution system. The power demand in the VCS location is changed from P to (P + PVCS).
STEP 8: Along with VCS in the system, VSI is calculated to place the DG in an optimal location. In this case, PVCS is included in calculating the current and voltage for load flow using Equations (19)–(21).
STEP 9: The optimal location for DG is selected by VSI using Equations (12) and (13).
STEP 10: The DG size is determined by analytical method with the objective of power loss minimization using Equation (15).
STEP 11: The DG size should satisfy all the power system constraints Equations (16)–(18). Here, PDG and PVCS are included in calculating the current and voltage for load flow using Equations (19)–(21).
STEP 12: LOLP is calculated to estimate the system reliability Equation (14).
STEP 13: The system reliability is analyzed for one complete day by considering only VCS and both VCS and DG. Here, for only VCS, G(t) includes the power source (Pin) and losses, whereas L(t) includes the load connected (standard load and EV load). In the case of both VCS and DG, G(t) includes the power sources (PDG and Pin) and losses, whereas L(t) includes the load connected (standard load and EV load).
STEP 14: A comparative study is performed to identify the system which has higher reliability.
STEP 15: Further, all the power flow parameters are compared between the two systems.
STEP 16: The system, which has both VCS and DG, has improved voltage, improved reliability and reduced loss.

6. Results and Discussion

The proposed work is tested on IEEE 12-bus and 33-bus distribution systems [31]. The system comprises one substation and multiple load buses, as in Figure 4 and Figure 5. The selected systems are the advanced benchmark system used for analyzing the power system network. The feeder rating is 11 kV for the 12-bus system and 12.66 kV for the 33-bus system. In this system, it is assumed that the load in each bus represents the total load of the number of consumers connected to that particular bus.

6.1. System Analysis

The forward/backward sweep load flow analysis is performed for the selected IEEE test systems. The real power load and loss in the 12-bus system are 435 kW and 20.7138 kW, whereas in the 33-bus system, they are 3715 kW and 169.5135 kW. The reactive power load and loss in the 12-bus system are 405 kVAr and 8.0411 kVAr, respectively; in the 33-bus system, they are 2300 kVAr and 114.8382 kVAr, respectively. The power supplied from the substation in the 12-bus system is 455.7138 kW and 413.0411 kVAr, and in the 33-bus system, they are 3884.5 kW and 2414.8 kVAr.

6.1.1. Integration of VCS and DG

VCS is located arbitrarily at bus 12 and bus 33 for the 12-bus and 33-bus systems, respectively. Figure 6 shows the calculated VSI for 12-bus and 33-bus distribution systems with VCS. In Figure 6a (12-bus system), the VSI is maximum at bus 9, and in Figure 6b (33-bus system), the VSI is maximum at bus 6. The bus with maximum VSI has a greater impact on all the other buses, and hence it is selected as the optimal location for placing DG. The DG mitigates the voltage drop due to VCS integration. Thus, the DG is located at bus 9, while VCS is at bus 12 for the 12-bus system, and DG is at bus 6, while VCS is at bus 33 for the 33-bus system.
The size of DG located in the bus selected by the VSI is estimated by an analytical method, as shown in Figure 7. Figure 7a,b show that the increase in DG size reduces the power loss in the distribution system, and when the DG size is increased above a certain value, it leads to an increase in power loss. The point at which the minimum power losses occur is the optimal size required for the distribution system. In Figure 7a, the optimal DG size for the 12-bus system is 400 kW, whereas, in Figure 7b, the optimal DG size for the 33-bus system is 2750 kW.

6.1.2. Performance Evaluation

The results obtained through the proposed method are shown in Table 2 and Table 3 for the 12-bus and 33-bus systems, respectively. In the 12-bus system, with the integration of VCS with 156.8 kW, the real power loss is increased from 20.71 kW to 43.12 kW. Obviously, this is because the VCS is introduced as an additional load in the system and with this additional load, the power flow in the distribution lines is also increased. These adverse effects can be avoided by integrating DG in bus 6 with the size of 400 kW. After the integration of DG, the power loss is reduced to 18.92 kW.
In the 33-bus system, the power utilized from the substation under standard conditions is 3884.5 kW and with VCS is 4058.2 kW, which shows a 4.47% increase in power requirement. This increase will lead to additional power flow from the transmission system, increasing the overall power losses. Under this condition, DG is introduced to the system, which leads to a reduction of 69.9% of the real power requirement from the substation in comparison with the distribution system with VCS alone. Moreover, real power loss in the distribution system is increased by 9.95% after the placement of VCS, and it is reduced to 48.45% when DG is introduced to the VCS existing system.
The results obtained for the proposed work are compared with simulation results obtained in [7,14], which are shown in Table 4. In [7], the EV integration is considered alone for the existing distribution network, and it allows charging in locations 14 and 18 with only a charging capacity of 4 kW, for which the power loss is increased to 212.29 kW. In [14], the DG integration is considered alone for power loss minimization and reduces the losses to 67.75 kW. In our proposed method, the power loss is smaller than [7], as DG integration is also considered, and greater than [14], as VCS integration is also considered.
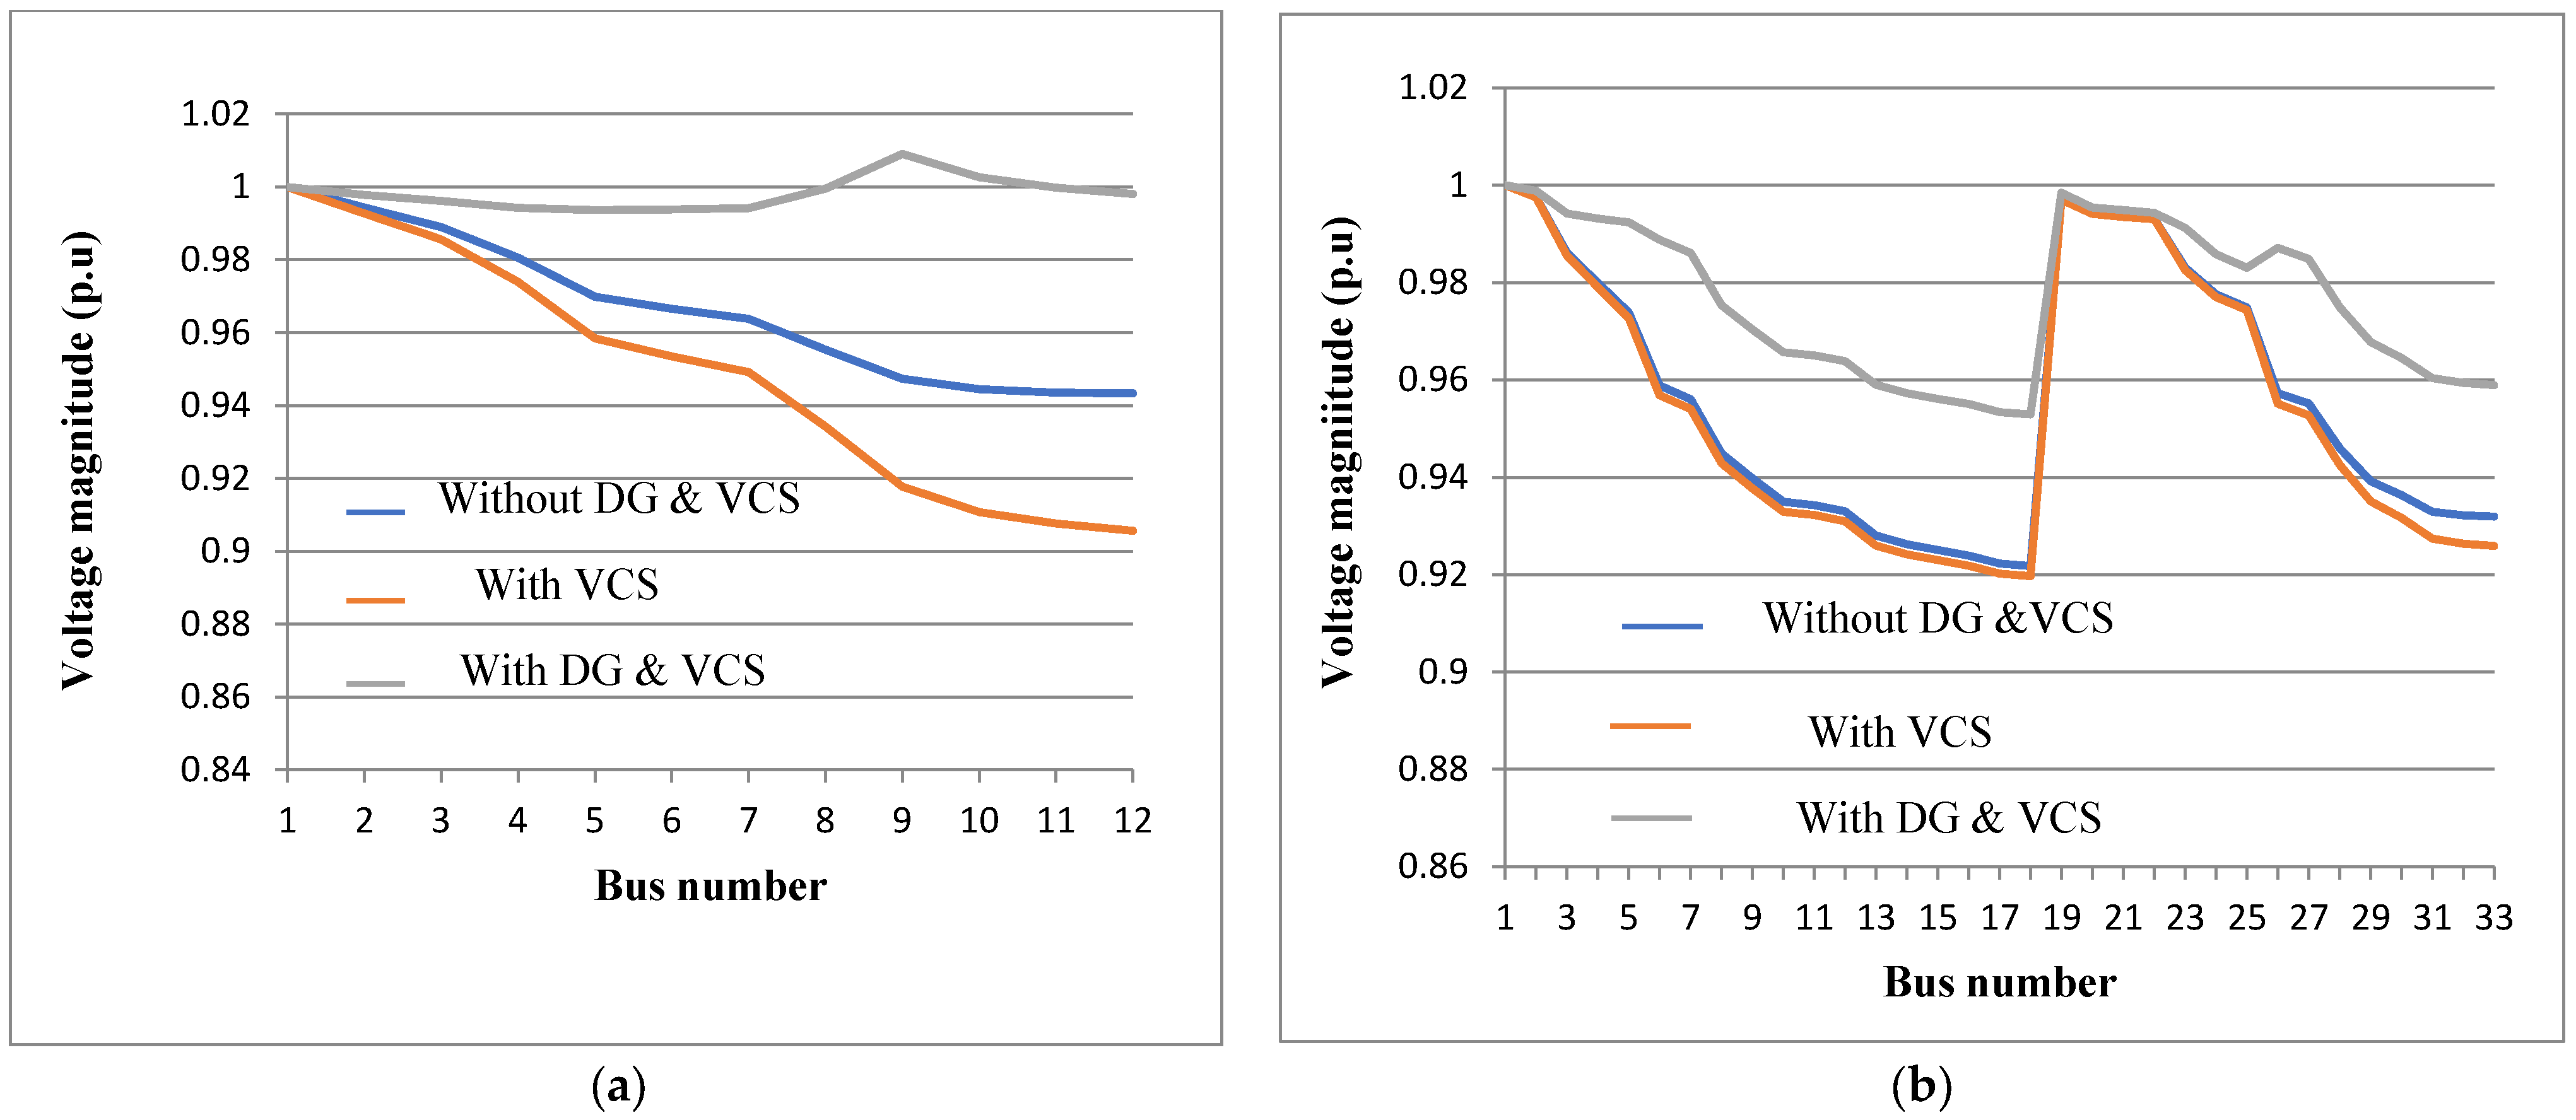
The voltage profile of all the buses in the 12 and 33-bus distribution systems is shown in Figure 8a,b, respectively. The graph shows the voltage profile variation in the distribution network under standard conditions, with VCS only and with both VCS and DG. The voltage of each bus in the case of VCS-only is very low compared to other conditions as the current flow is increased. With the addition of DG in bus 9 of the 12-bus distribution system, the voltage level is increased for all the load buses. In 33-bus systems, the maximum voltage under standard conditions is 0.997133 p.u, VCS is 0.997048 p.u and both VCS and DG are 0.998412 p.u.
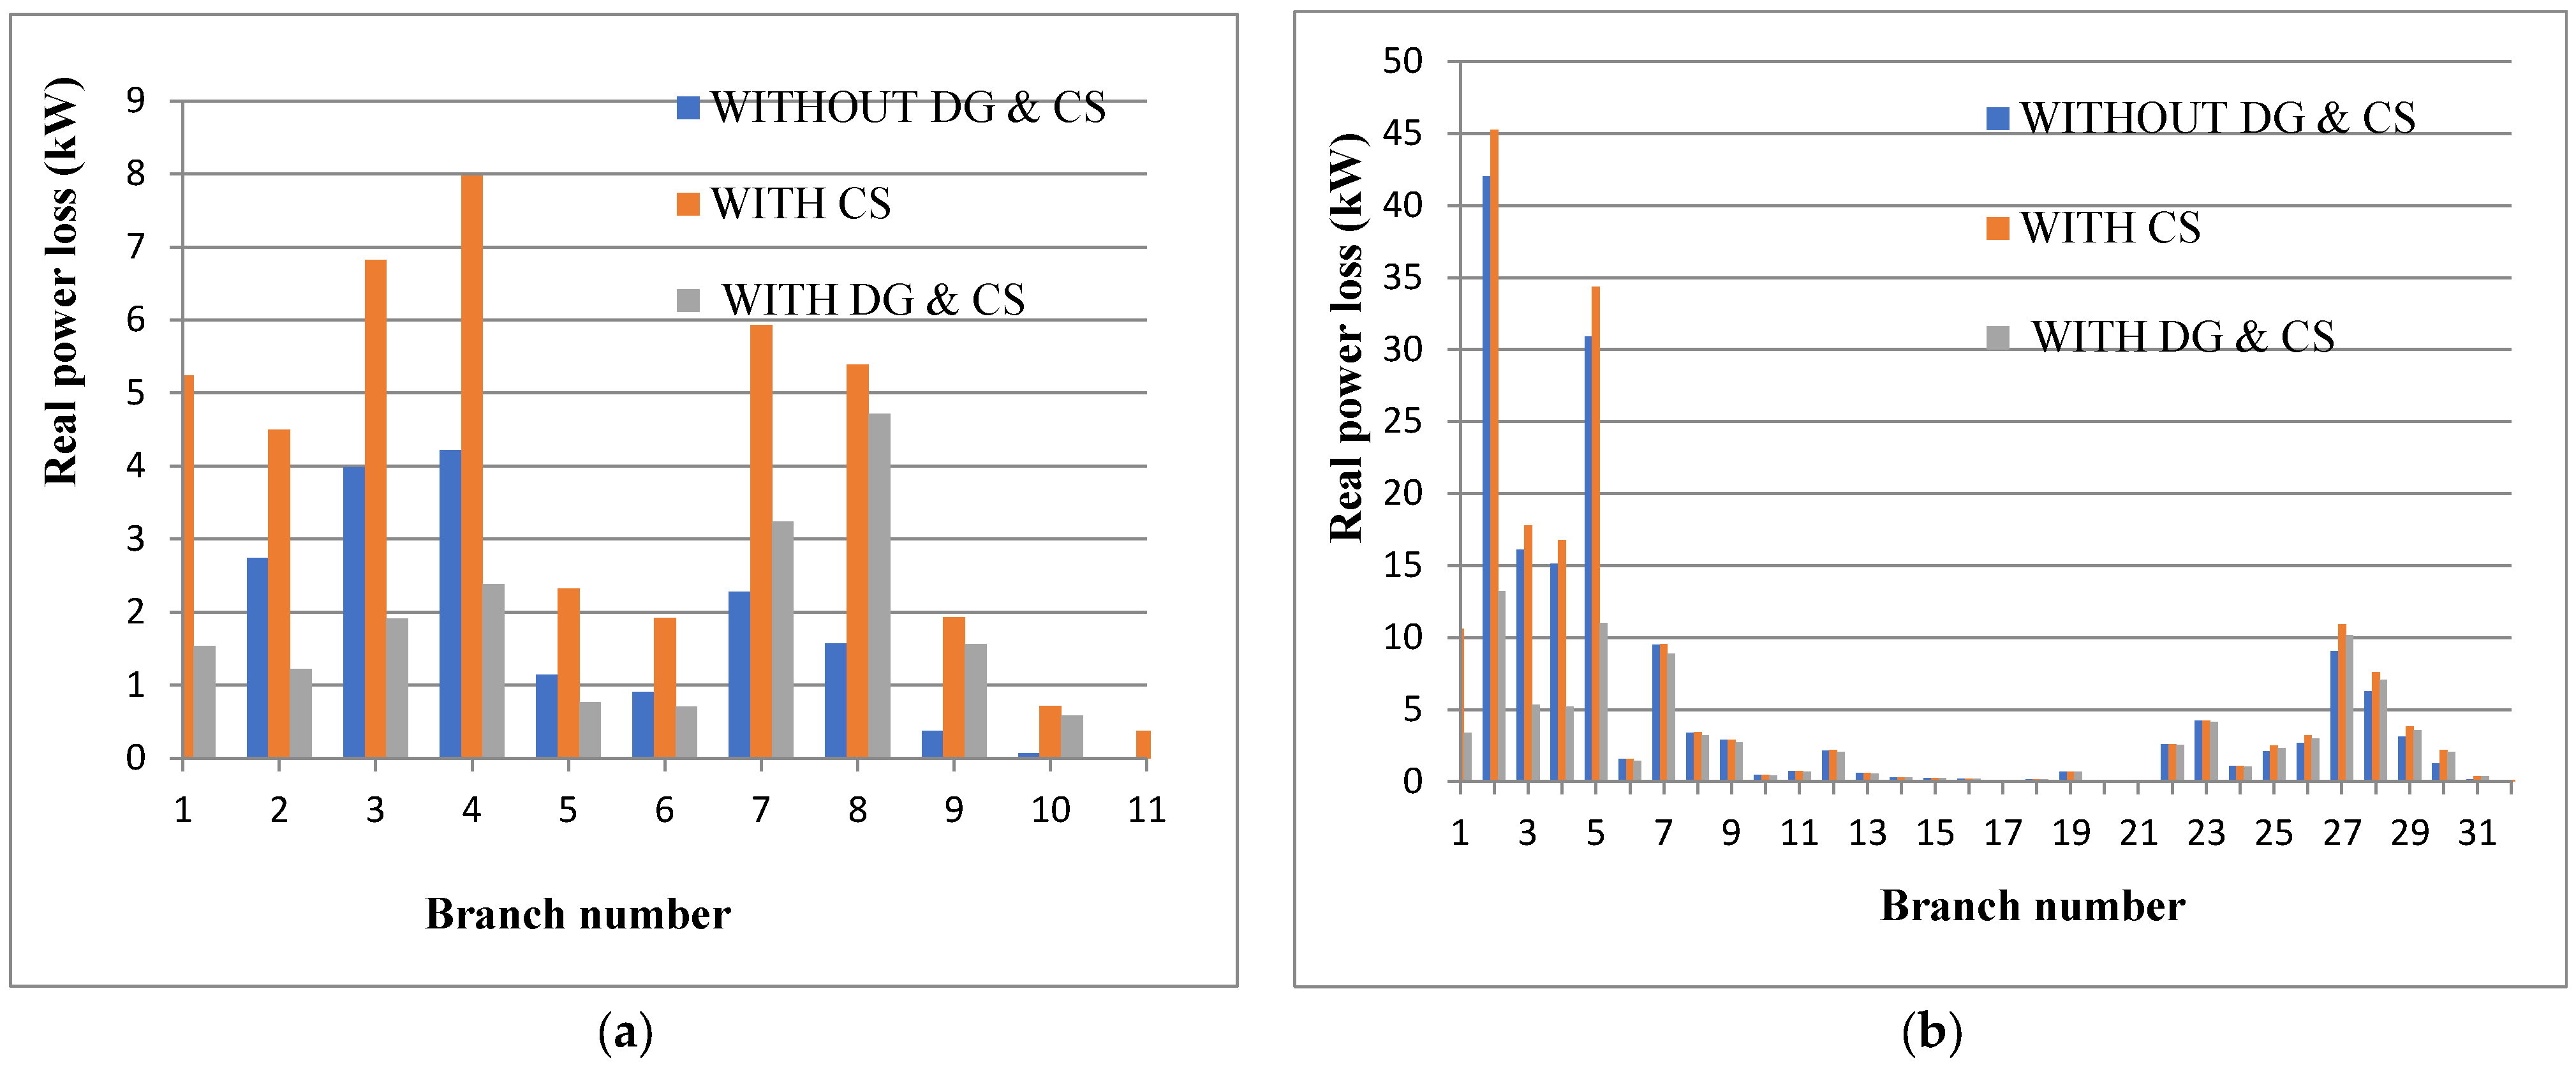
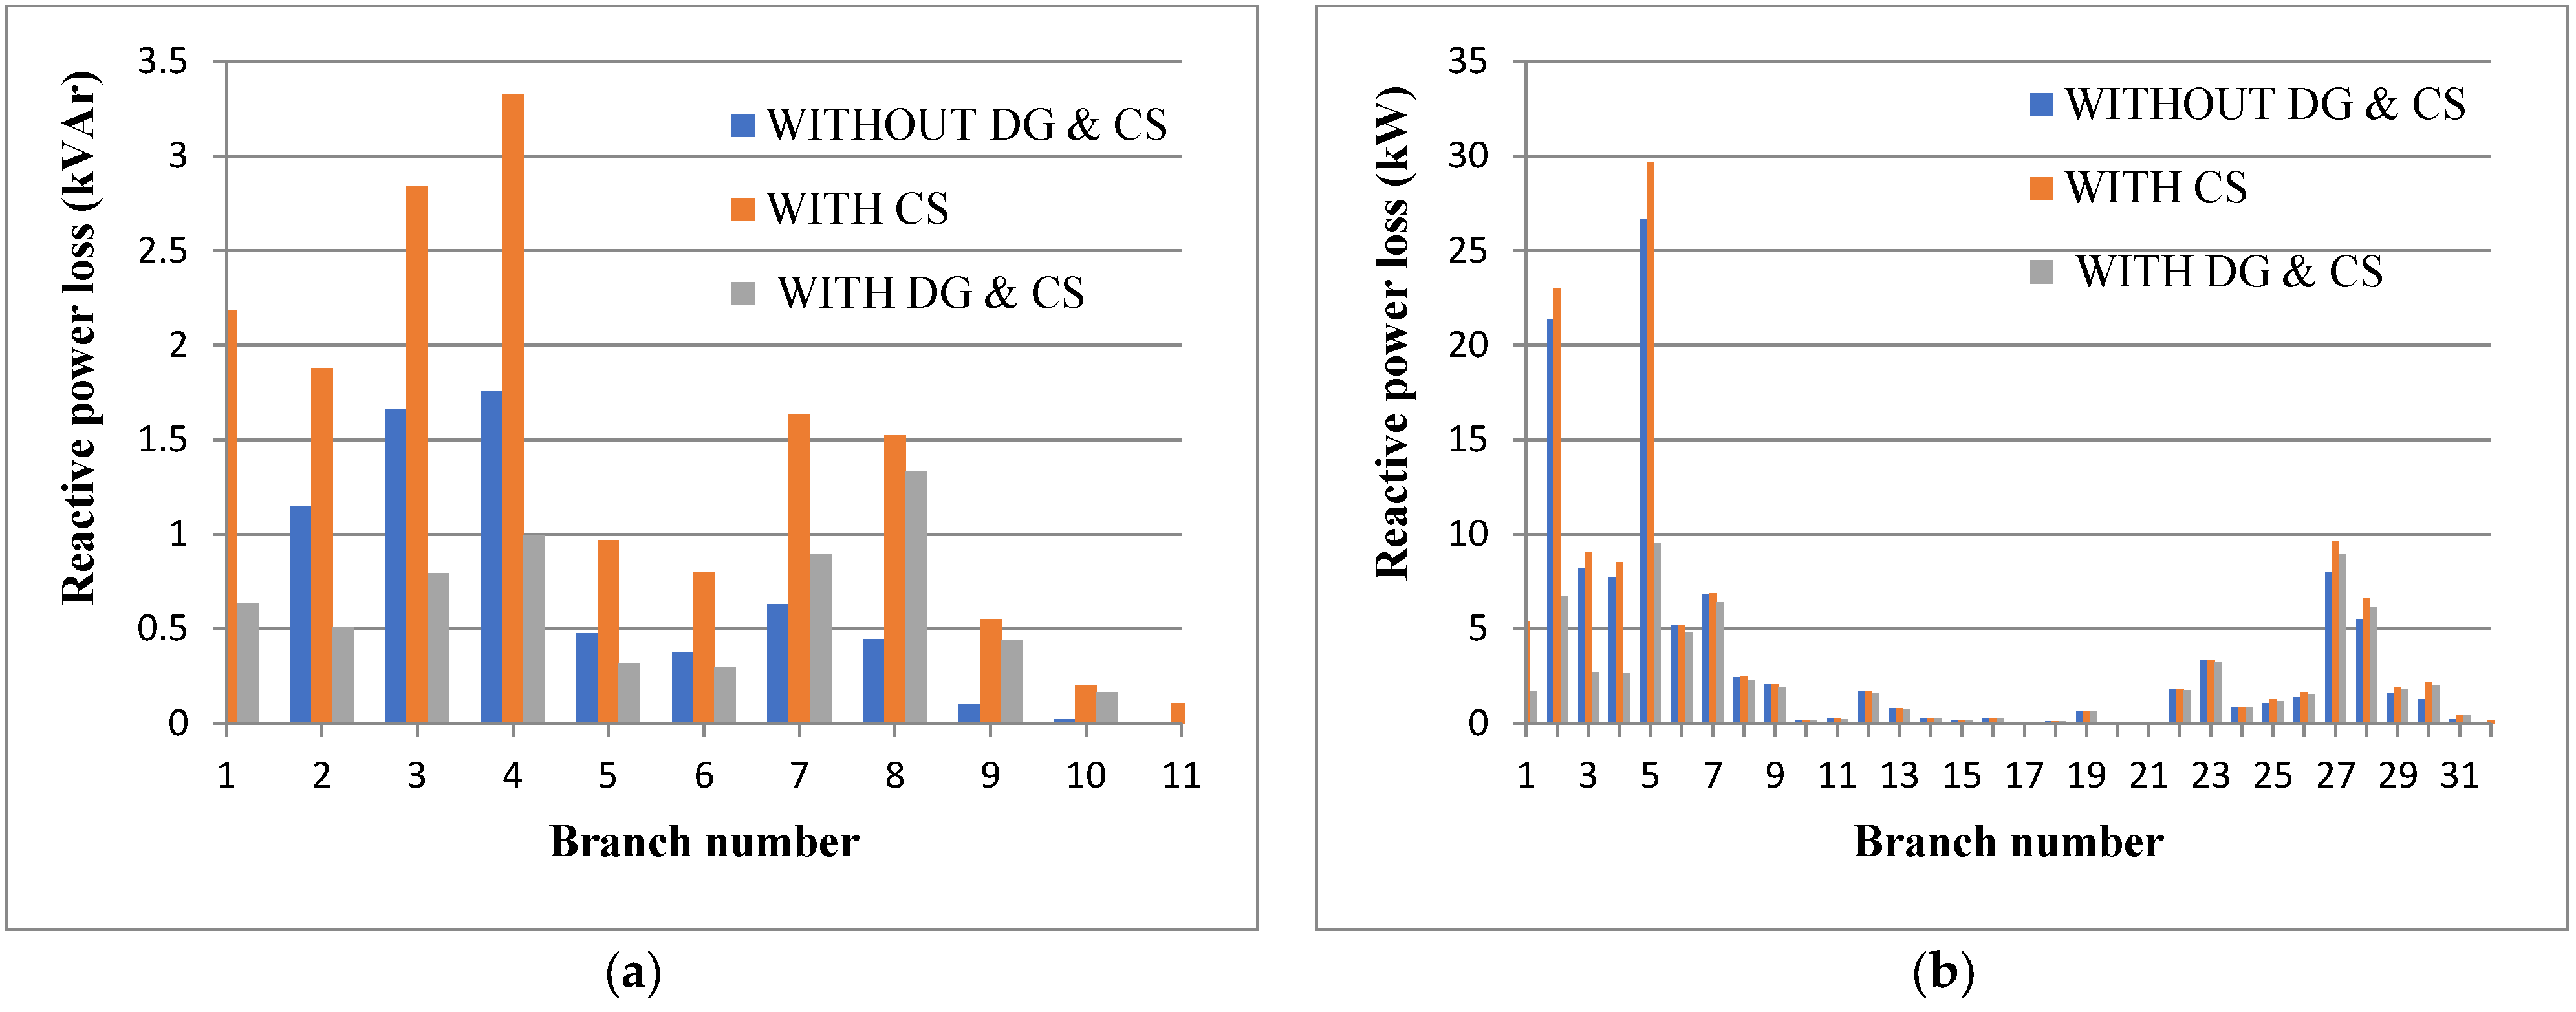
Moreover, the real power loss in each branch is shown in Figure 9, while the reactive power loss of each branch is shown in Figure 10. The graph shows that when VCS is introduced to the system, losses in each branch of the distribution system increase. These losses are minimized by locating DG in the distribution system with optimal size. A considerable decrease in power loss is noticed in the distribution system when both VCS and DG are introduced.
The results of the reactive power losses are very similar to the results of the real power losses. The total reactive power losses in both systems are reduced in the system with both DG and VCS when compared with the system with only VCS.
In both the 12 and 33-bus test systems, the power loss is reduced, and the voltage profile is improved when both VCS and DG are integrated. This is due to the additional power source from DG, which also further reduces the power requirement from the substation. Both real and reactive power losses are reduced in the distribution line.

6.1.3. Reliability Evaluation

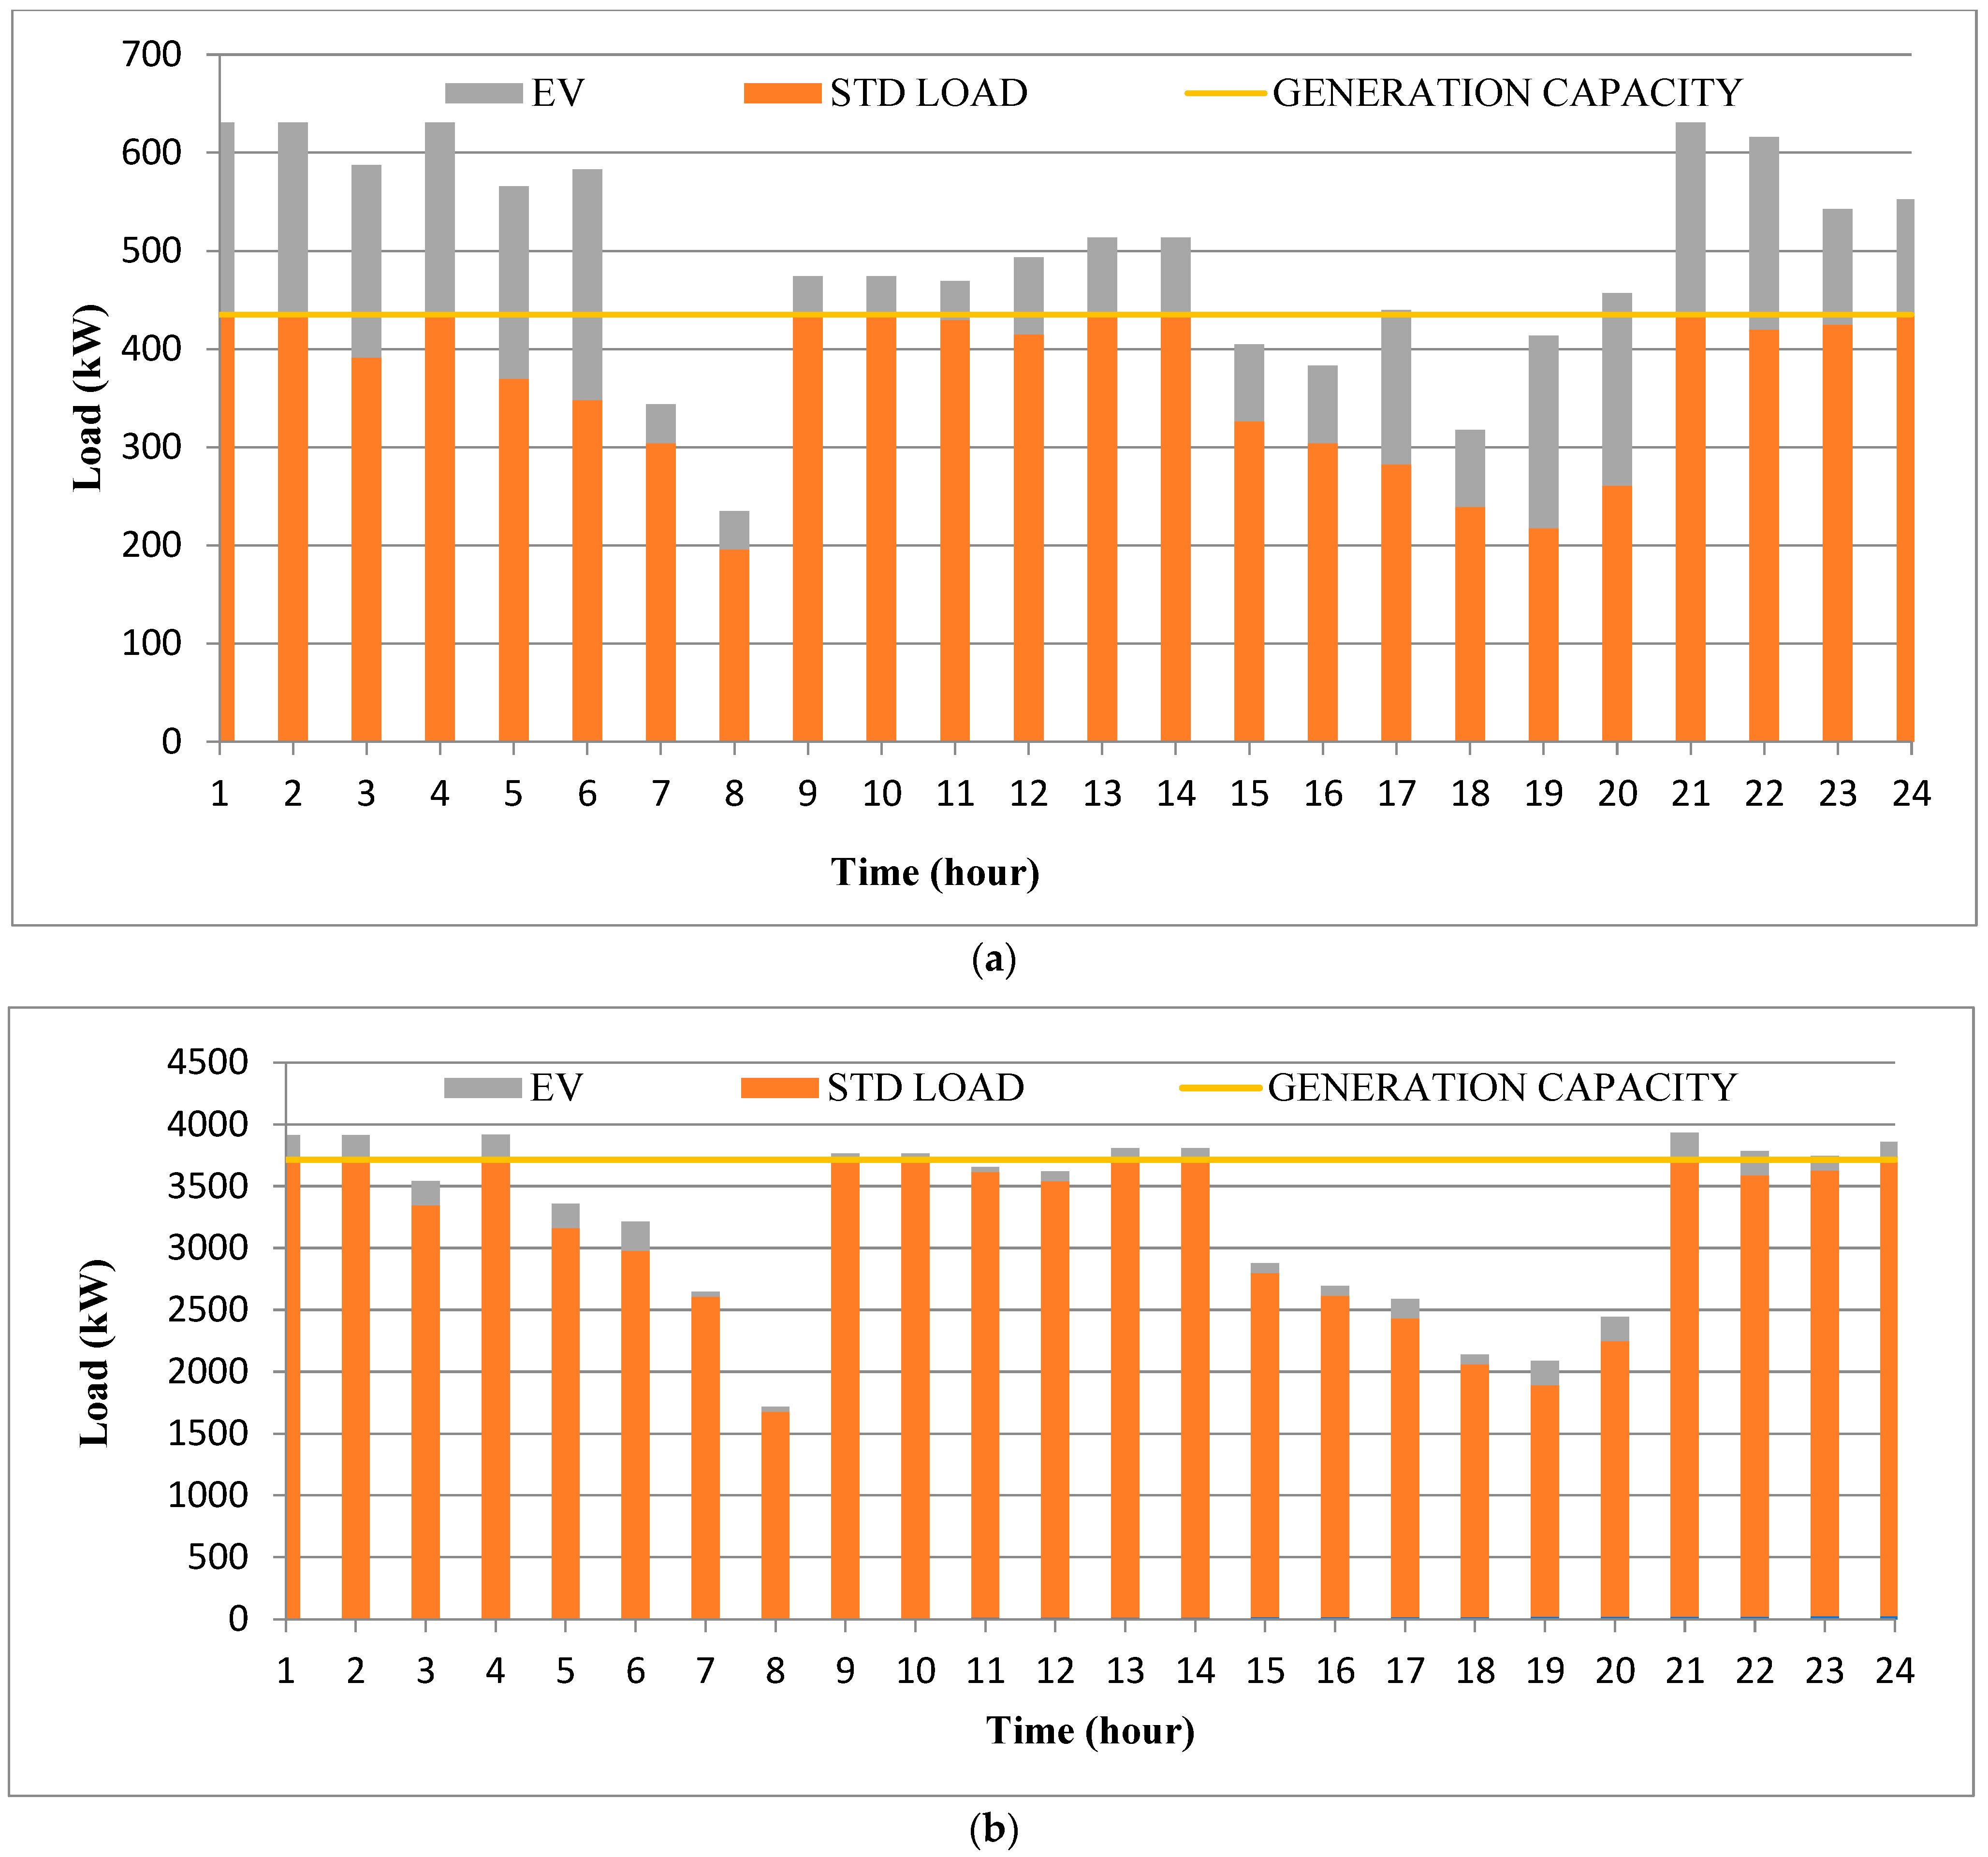
The load profile graph in Figure 11 shows the variation of load (in bus and Electric Vehicle) for 24 h in 12-bus and 33-bus distribution systems. The generation capacity in the graph represents the power source given to the distribution system. The generation capacity of the 12 and 33-bus systems is identified as 435 kW and 3714.9 kW, respectively. The EV load variation is given based on the charging of vehicles in the selected distribution system. Here, the number of EV loads charging in the VCS is considered to be higher during the night-time to early morning and reduced during the day time. The dynamic variation in standard load for 12 h is defined by considering the peak time, usage of domestic load and commercial load. When the load graph comprising the sum of EV and standard load reaches the generation capacity line, the LOLP is 1; otherwise, LOLP will be 0.
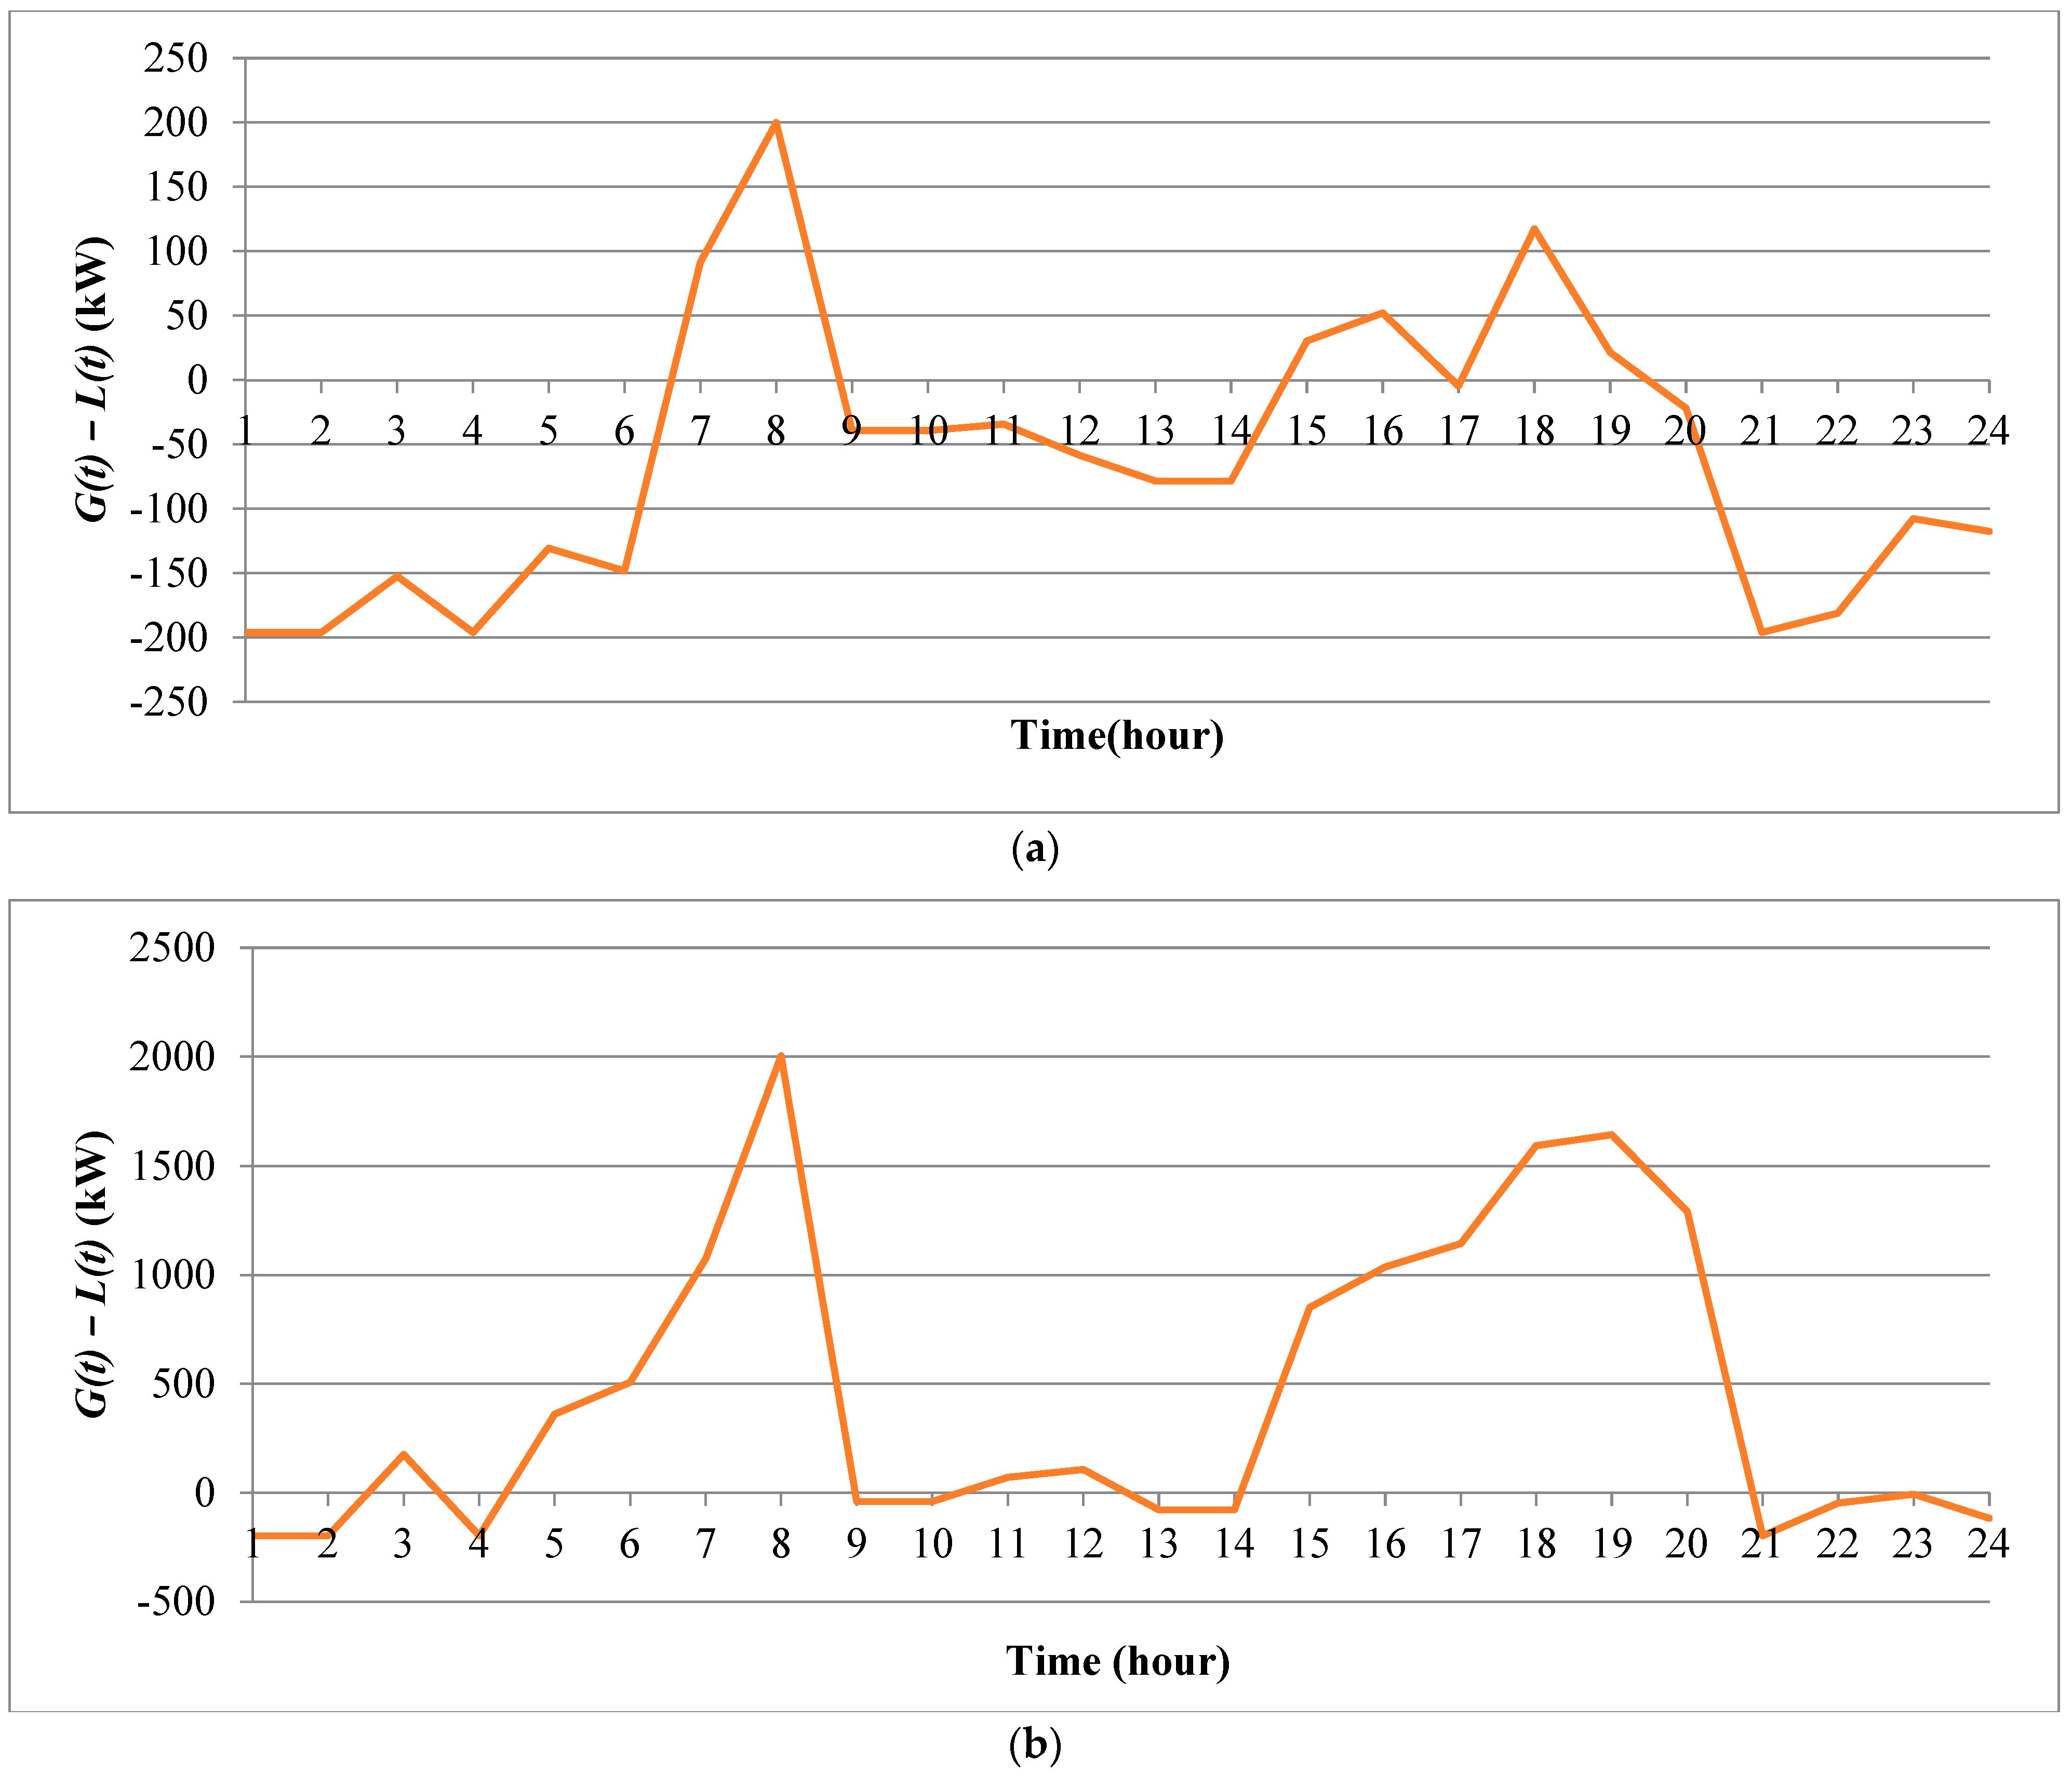
Figure 12 shows the reliability analysis of the distribution system with only VCS for 24 h. If the value of G(t) − L(t) is greater than or equal to 0, LOLP at that time will be 0. Suppose G(t) − L(t) is less than 0; then, LOLP at that time will be 1. Here, G(t) represents the power from the substation and L(t) represents the sum of standard load, EV load and line losses. Thus, the LOLP value depends on generation capacity, losses and total load. The LOLP of 12-bus and 33-bus distribution systems is 0.75 and 0.46, respectively, for a distribution system consisting of VCS.
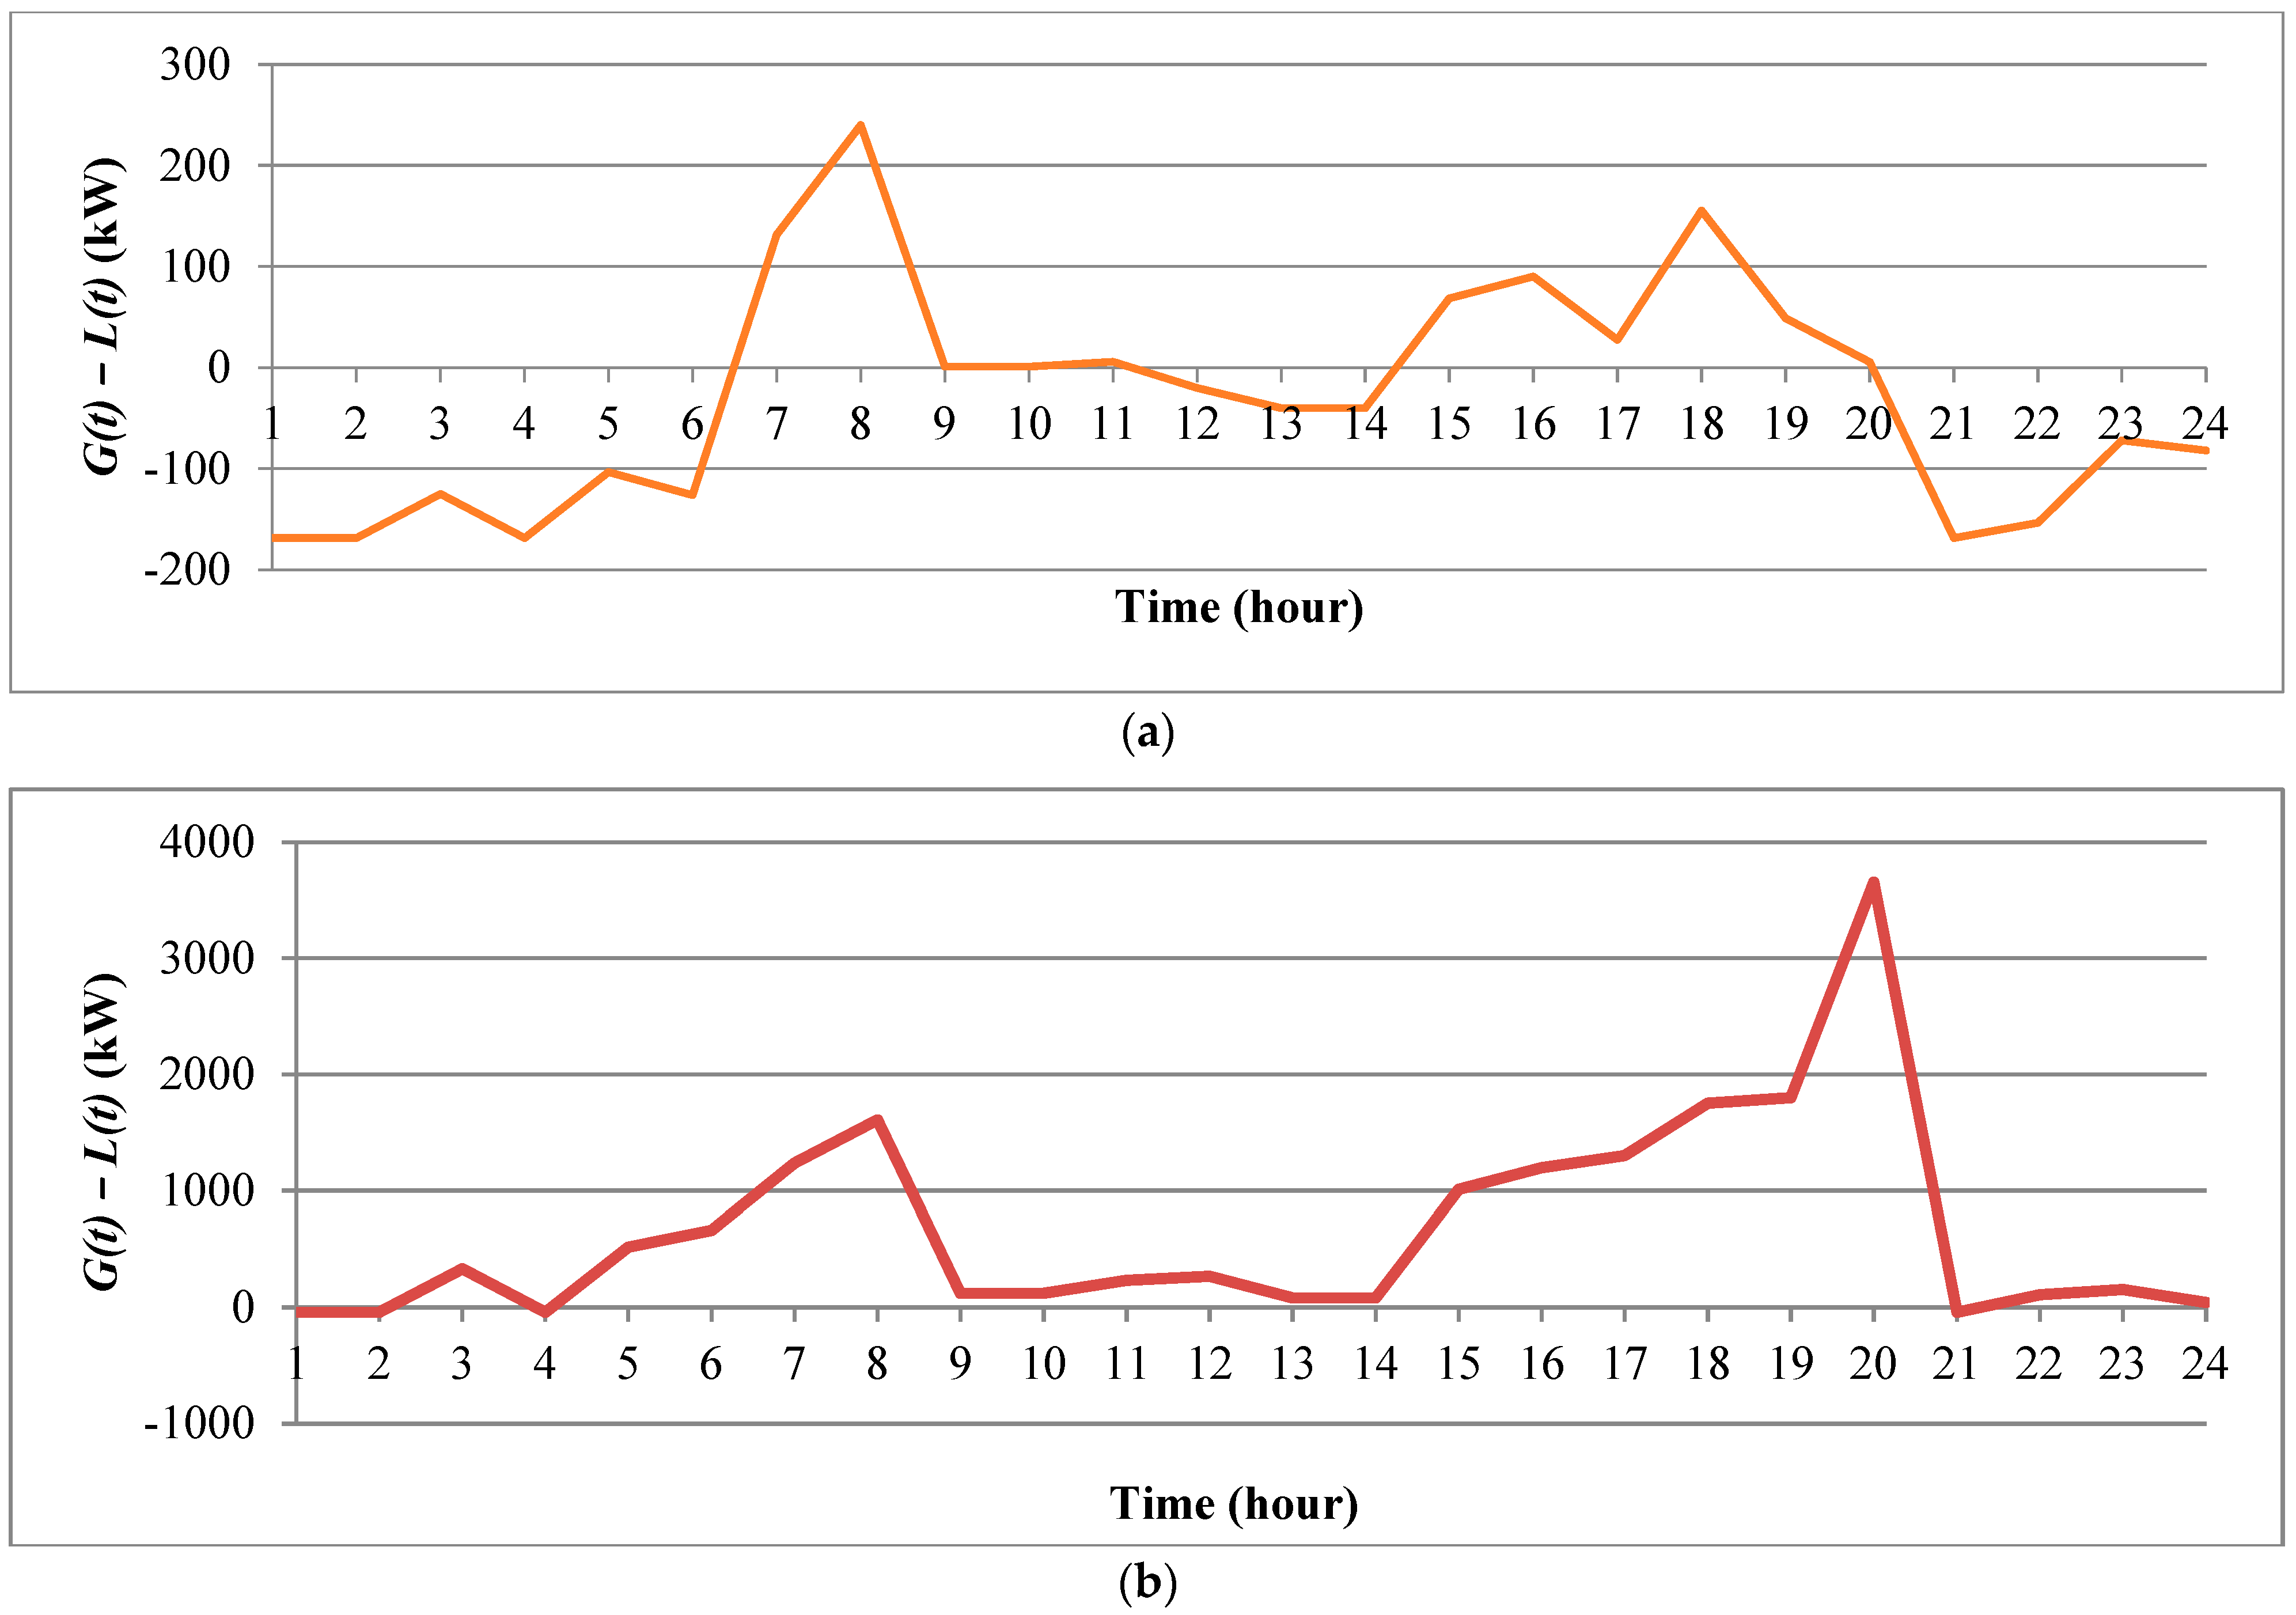
Figure 13 shows the reliability assessment of the distribution system with both VCS and DG. The graph shows that the G(t) − L(t) value is greater than 1 for most of the hours. Here, G(t) represents the power from the substation, and DG and L(t) represent the EV load, standard load and line losses. The LOLP of 12-bus systems with only VCS and with both VCS and DG are 0.75 and 0.54, respectively, and in 33-bus systems, it is reduced from 0.46 to 0.17. This shows that the integration of DG in the system having VCS reduces the probability of loss of load. In both systems, the reliability is improved with both VCS and DG compared to the system with only VCS.
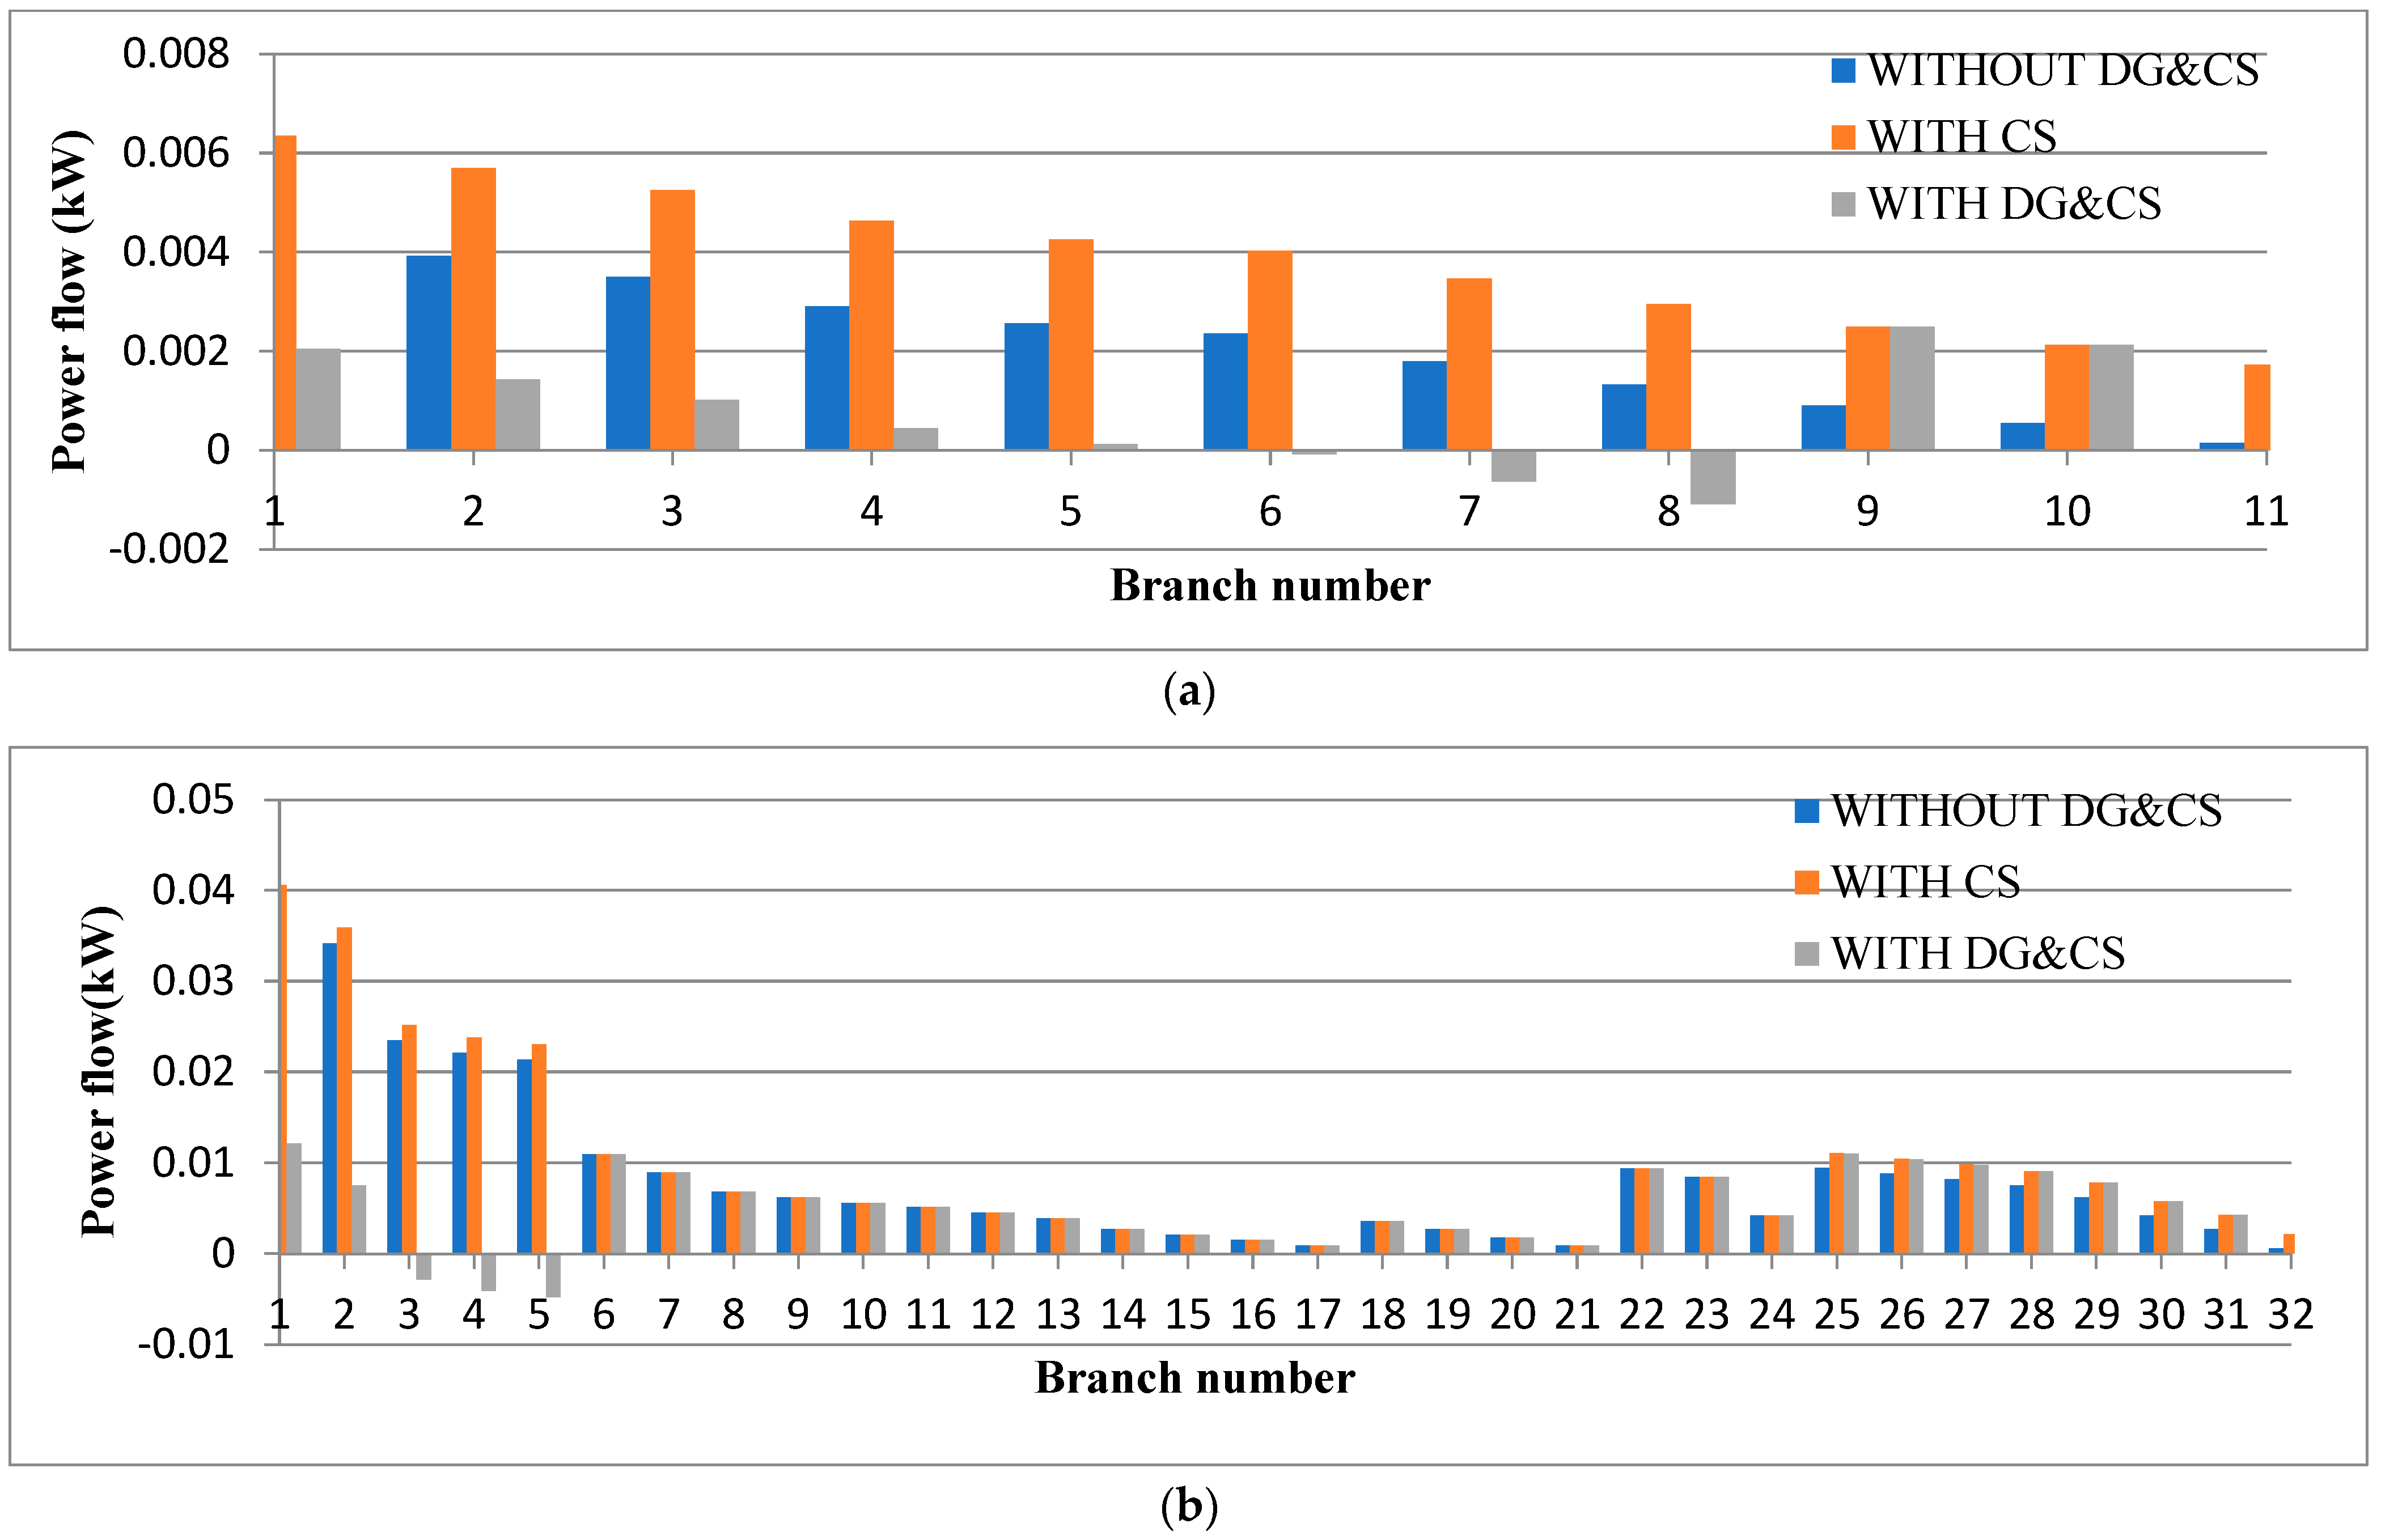
Figure 14a,b show the power flow in the branches of the 12-bus and 33-bus distribution systems. In the 12-bus system, negative power flow is shown in buses 7 and 8, and in the 33-bus system, it is shown in buses 3, 4 and 5. This is because DG is connected at the 9th bus of the 12-bus system and at the 6th bus of the 33-bus system; therefore, the power flows towards the substation. In both the 12 and 33-bus distribution systems, the power flow is very much reduced in the system with both DG and VCS, which leads to a reduction of the power losses of the system.

7. Conclusions

The proposed work provides an effective methodology to improve the reliability of the distribution system with VCS by integrating DG into the system. Integrating VCS alone leads to an increase in distribution line losses, reduces the reliability of the system and increases the stress in the substation. On the other hand, VCS combined with DG improves the losses and reliability while reducing substation stress. DG is located at the optimal location using the VSI technique to improve the voltage level in the IEEE 12-bus and 33-bus distribution systems. The optimal size of DG is identified by solving the objective of power loss minimization and considering the power system constraints. Introducing VCS into the 33-bus distribution system increases the power losses to 186.38 kW, whereas by introducing also DG, the power losses are reduced to 96.06 kW. The voltage at each bus of the distribution system is also improved by DG integration. The dynamic load variation for 24 h, comprising of EV load and consumer load, is considered for evaluating the reliability of the system. The EV load and consumer load variation are selected based on the number of vehicles charging at that time and the load consumption by consumers at that time. The LOLP obtained for 33-bus distribution systems with both VCS and DG is 0.17, which means that the probability of load shedding is only 17%; in the case of the system with only VCS, it is 46%. The comparative results show that system performance and reliability are improved when DG is connected to the system that has VCS. In the future, the method can be further improved by applying an optimization algorithm for DG sizing with power losses and reliability as a multi-objective function. The results shown in the proposed work focus mainly on the flow of real power in the distribution system. In the future, reactive power will also be considered in the optimization. Moreover, the system can be analyzed for various types of DG alongside their cost factor, which includes charging cost, DG utilization, installation, maintenance cost, etc.

Author Contributions

Conceptualization, R.S. and C.K.; methodology, R.S. and C.K.; software, F.J.X. and J.S.K.; validation, P.K. and H.H.F.; formal analysis, P.K. and H.H.F.; investigation, P.K. and H.H.F.; resources, P.K. and H.H.F.; data curation, F.J.X. and J.S.K.; writing—original draft preparation, R.S. and C.K.; writing—review and editing, P.K. and H.H.F.; visualization, P.K. and H.H.F.; supervision, P.K. and H.H.F.; project administration, R.S. and C.K. All authors have read and agreed to the published version of the manuscript.

Funding

This research received no external funding.

Data Availability Statement

Not applicable.

Conflicts of Interest

The authors declare no conflict of interest.

Nomenclature

HEVHybrid Electric Vehicle
DGDistributed Generation
VCSVehicle Charging Station
VSIVoltage Stability Index
LOLPLoss Of Load Probability
PiReal power injected at bus i
QiReactive power injected at bus i
RiResistance between the buses in branch i
XiReactance between the buses in branch i
PDGReal power supplied through DG
PVCSReal power absorbed through VCS
PinReal power injected in the substation

References

  1. Atwa, Y.M.; El-Saadany, E.F.; Salama, M.M.A.; Seethapathy, R. Optimal Renewable Resources Mix for Distribution System Energy Loss Minimization. IEEE Trans. Power Syst. 2010, 25, 360–370. [Google Scholar] [CrossRef]
  2. Wang, X.; Karki, R. Exploiting PHEV to Augment Power System Reliability. IEEE Trans. Smart Grid 2017, 8, 2100–2108. [Google Scholar] [CrossRef]
  3. Gao, Y.; Ehsani, M. Design and Control Methodology of Plug-in Hybrid Electric Vehicles. IEEE Trans. Ind. Electron. 2010, 57, 633–640. [Google Scholar] [CrossRef]
  4. Alizadeh, S.M.; Ozansoy, C.; Alpcan, T. The impact of X/R ratio on voltage stability in a distribution network penetrated by wind farms. In Proceedings of the 2016 Australasian Universities Power Engineering Conference, Brisbane, Australia, 25–28 September 2016. [Google Scholar] [CrossRef]
  5. Jha, B.K.; Kumar, A.; Singh, D.; Misra, R.K. Coordinated effect of PHEVs with DGs on distribution network. Int. Trans. Electr. Energy Syst. 2018, 29, e2800. [Google Scholar] [CrossRef]
  6. Falahati, B.; Shahverdi, M.; Fajri, P.; Kargarian, A. Loss of Load Probability of Power Systems Considering the High PHEV Penetration Rates. In Proceedings of the 2018 IEEE Conference on Technologies for Sustainability, Long Beach, CA, USA, 11–13 November 2018; pp. 1–5. [Google Scholar] [CrossRef]
  7. Abdel-Akher, M.; Eid, A.; Ali, A. Effective Demand Side Scheme for PHEVs Operation Considering Voltage Stability of Power Distribution Systems. Int. J. Emerg. Electr. Power Syst. 2017, 18, 114268588. [Google Scholar] [CrossRef]
  8. Reddy, G.H.; Chakrapani, P.; Goswami, A.K.; Choudhury, N.B.D. Optimal distributed generation placement in distribution system to improve reliability and critical loads pick up after natural disasters. Int. J. Eng. Sci. Technol. 2017, 20, 825–832. [Google Scholar] [CrossRef]
  9. Quiroga, G.A.; Kagan, H.; Amasifen, J.C.C.; Almeida, C.F.M.; Kagan, N.; Vicentini, E. Study of the Distributed Generation impact on distributed networks, focused on quality of power. In Proceedings of the 2016 17th International Conference on Harmonics and Quality of Power (ICHQP), Belo Horizonte, Brazil, 16–19 October 2016; pp. 855–860. [Google Scholar] [CrossRef]
  10. Reddy, G.H.; Goswami, A.K.; Choudhury, N.B.D. Impact of plug-in electric vehicles and distributed generation on reliability of distribution systems. Int. J. Eng. Sci. Technol. 2018, 21, 50–59. [Google Scholar] [CrossRef]
  11. Sarma, S.S.; Madhusudhan, V.; Ganesh, V. Evaluation and enhancement of reliability of electrical distribution system in the presence of dispersed generation. In Proceedings of the 2016 International Conference on Signal Processing, Communication, Power and Embedded System, Paralakhemundi, India, 3–5 October 2016; pp. 357–362. [Google Scholar] [CrossRef]
  12. Aljanad, A.; Mohamed, A. Power quality impacts of plug-in hybrid electric vehicles on distribution network. In Proceedings of the 2016 International Conference on Advances in Electrical, Electronic and Systems Engineering, Putrajaya, Malaysia, 14–16 November 2016; pp. 616–620. [Google Scholar] [CrossRef]
  13. Adefarati, T.; Bansal, R. Integration of renewable distributed generators into the distribution system: A review. IET Renew. Power Gener. 2016, 10, 873–884. [Google Scholar] [CrossRef]
  14. Sa’ed, J.A.; Amer, M.; Bodair, A.; Baransi, A.; Favuzza, S.; Zizzo, G. A Simplified Analytical Approach for Optimal Planning of Distributed Generation in Electrical Distribution Networks. Appl. Sci. 2019, 9, 5446. [Google Scholar] [CrossRef]
  15. Purlu, M.; Turkay, B.E. Optimal Allocation of Renewable Distributed Generations Using Heuristic Methods to Minimize Annual Energy Losses and Voltage Deviation Index. IEEE Access 2022, 10, 21455–21474. [Google Scholar] [CrossRef]
  16. Sultana, B.; Mustafa, M.W.; Sultana, U.; Bhatti, A.R. Review on reliability improvement and power loss reduction in distribution system via network reconfiguration. Renew. Sustain. Energy Rev. 2016, 66, 297–310. [Google Scholar] [CrossRef]
  17. de Sousa, R.S.; Martins, C.C.; Sperandio, M. Distribution System Reliability Assessment Using Sequential Monte Carlo Simulation. In Proceedings of the 2019 IEEE PES Innovative Smart Grid Technologies Conference, Gramado, Brazil, 15–18 September 2019. [Google Scholar] [CrossRef]
  18. Li, Z.; Wu, W.; Zhang, B.; Tai, X. Analytical Reliability Assessment Method for Complex Distribution Networks Considering Post-Fault Network Reconfiguration. IEEE Trans. Power Syst. 2020, 35, 1457–1467. [Google Scholar] [CrossRef]
  19. López-Prado, J.L.; González-Sánchez, J.W.; Vélez, J.I.; Garcia-Llinás, G.A. Reliability Assessment in Rural Distribution Systems with Microgrids: A Computational-Based Approach. IEEE Access 2022, 10, 43327–43340. [Google Scholar] [CrossRef]
  20. Tur, M.R. Reliability Assessment of Distribution Power System When Considering Energy Storage Configuration Technique. IEEE Access 2020, 8, 77962–77971. [Google Scholar] [CrossRef]
  21. Li, X.; Wang, L.; Yan, N.; Ma, R. Cooperative Dispatch of Distributed Energy Storage in Distribution Network with PV Generation Systems. IEEE Trans. Appl. Supercond. 2021, 31, 0604304. [Google Scholar] [CrossRef]
  22. Talukdar, B.K.; Deka, B.C.; Bhuyan, M.P. Reliability Analysis of Electric Vehicle integrated Distribution Network. In Proceedings of the 2021 International Conference on Computational Performance Evaluation, Shillong, India, 1–3 December 2021; pp. 858–862. [Google Scholar] [CrossRef]
  23. Sadeghian, O.; Nazari-Heris, M.; Abapour, M.; Taheri, S.S.; Zare, K. Improving reliability of distribution networks using plug-in electric vehicles and demand response. J. Mod. Power Syst. Clean Energy 2019, 7, 1189–1199. [Google Scholar] [CrossRef]
  24. Khan, R.; Mehmood, K.K.; Bukhari, S.B.A.; Imran, K.; Wadood, A.; Rhee, S.B.; Park, S. An Optimization-Based Reliability Enhancement Scheme for Active Distribution Systems Utilizing Electric Vehicles. IEEE Access 2021, 9, 157247–157258. [Google Scholar] [CrossRef]
  25. Zanjani, S.M.H.; Shahinzadeh, H.; Pourmirza, Z.; Kabalci, E.; Muyeen, S.M.; Benbouzid, M. Optimal Operation of a Residential Energy Hub in the Presence of an Electric Vehicle using Whale Optimization Algorithm. In Proceedings of the 2022 26th International Electrical Power Distribution Conference (EPDC), Tehran, Iran, 11–12 May 2022; pp. 84–89. [Google Scholar] [CrossRef]
  26. Wu, Y.; Ravey, A.; Chrenko, D.; Miraoui, A. Demand side energy management of EV charging stations by approximate dynamic programming. Energy Convers. Manag. 2019, 196, 878–890. [Google Scholar] [CrossRef]
  27. Wu, Y.; Zhang, J.; Ravey, A.; Chrenko, D.; Miraoui, A. Real-time energy management of photovoltaic-assisted electric vehicle charging station by markov decision process. J. Power Sources 2020, 476, 228504. [Google Scholar] [CrossRef]
  28. Wu, Y.; Wang, Z.; Huangfu, Y.; Ravey, A.; Chrenko, D.; Gao, F. Hierarchical Operation of Electric Vehicle Charging Station in Smart Grid Integration Applications—An Overview. Int. J. Electr. Power Energy Syst. 2022, 139, 108005. [Google Scholar] [CrossRef]
  29. Aslani, M.; Imanloozadeh, A.; Hashemi-Dezaki, H.; Hejazi, M.A.; Nazififard, M.; Ketabi, A. Optimal probabilistic reliability-oriented planning of islanded microgrids considering hydrogen-based storage systems, hydrogen vehicles, and electric vehicles under various climatic conditions. J. Power Sources 2022, 525, 231100. [Google Scholar] [CrossRef]
  30. Bagherzadeh, L.; Shahinzadeh, H.; Gharehpetian, G.B. Scheduling of Distributed Energy Resources in Active Distribution Networks Considering Combination of Techno-Economic and Environmental Objectives. In Proceedings of the International Power System Conference (PSC), Tehran, Iran, 9–11 December 2019; pp. 687–695. [Google Scholar] [CrossRef]
  31. Senthil Kumar, J.; Raja, S.C.; Srinivasan, D.; Venkatesh, P. Hybrid renewable energy-based distribution system for seasonal load variations. Int. J. Energy Res. 2018, 42, 1066–1087. [Google Scholar] [CrossRef]
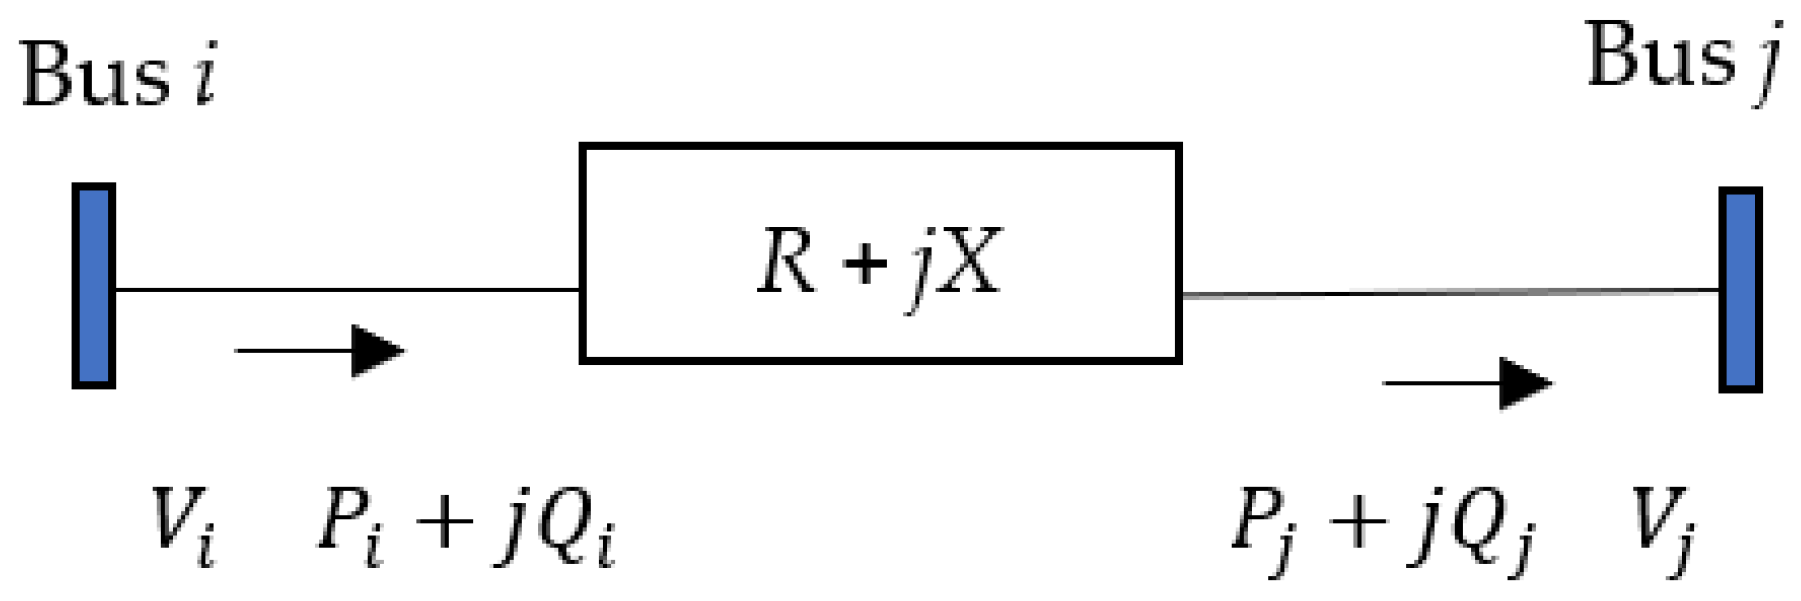
Figure 1. Model of distribution line.
Energies 16 03984 g001
Figure 2. LOLP flow chart.
Energies 16 03984 g002
Figure 3. Flow chart of proposed methodology.
Energies 16 03984 g003
Figure 4. IEEE 12-bus test system.
Energies 16 03984 g004
Figure 5. IEEE 33-bus test system.
Energies 16 03984 g005
Figure 6. Optimal location for DG: (a) 12-bus system; (b) 33-bus system.
Energies 16 03984 g006
Figure 7. Optimal size of DG: (a) 12-bus system; (b) 33-bus system.
Energies 16 03984 g007
Figure 8. Voltage profile in each bus: (a) 12-bus system; (b) 33-bus system.
Energies 16 03984 g008
Figure 9. Real power loss in each branch: (a) 12-bus system; (b) 33-bus system.
Energies 16 03984 g009
Figure 10. Reactive power loss in each branch: (a) 12-bus system; (b) 33-bus system.
Energies 16 03984 g010
Figure 11. Load profile graph: (a) 12-bus system; (b) 33-bus system.
Energies 16 03984 g011
Figure 12. Reliability analysis with VCS: (a) 12-bus system; (b) 33-bus system.
Energies 16 03984 g012
Figure 13. Reliability analysis with VCS and DG: (a) 12-bus system; (b) 33-bus system.
Energies 16 03984 g013
Figure 14. Power flow graph: (a) 12-bus system; (b) 33-bus system.
Energies 16 03984 g014
Table 1. Literature survey.
Reference NumberObjectiveSummary
[6,8,10,11,16,17,18,19,20]Reliability analysis
  • HEV integration with penetration rate
  • Reliability improvement with DG integration
  • Controlled charging and discharging of HEV
  • Analytical method to improve system reliability by cost index
  • Reliability improvement by distribution system reconfiguration
  • Ranking method to reduce failure mode operation in the distribution system
  • Reliability assessment through verifying capacity limit.
  • Reliability improvement through renewable DG in Microgrid
[7,9]Voltage profile improvement
  • Controlled charging and discharging of HEV
  • Voltage improvement with DG integration
[12]Power quality analysis
  • Analyze the harmonic distortion in the distribution system due to HEV
[13,14,15,21]Power loss minimization
  • DG integration into the distribution system
  • DG with energy storage devices integrated into the distribution system
Table 2. Performance of 12-bus distribution system.
ParametersStandard System (without VCS/DG)VCS ConnectedVCS and DG Connected
Location of DG--9
Size of DG (kW)--400
Location of VCS-1212
Size of VCS (kW)-156.8156.8
Substation real power (kW)455.7138634.922385.6682
Substation Reactive Power (kVAr)413.0411421.0105413.1343
Real power loss (kW)20.713843.122318.922
Reactive power loss (kVAr)8.041116.01056.4721
Table 3. Performance of 33-bus distribution system.
ParametersStandard SystemVCS ConnectedVCS and DG Connected
Location of DG--6
Size of DG (kW)--2750
Location of VCS-3333
Size of VCS (kW)-156.8156.8
Substation real power (kW)3884.54058.21217.9
Substation Reactive Power (kVAr)2414.82426.52371.1
Real power loss (kW)169.5135186.383996.0627
Reactive power loss (kVAr)114.8382126.54171.0985
Table 4. Comparison with existing work.
Parameters[7][14]Proposed Method
Location of DG-66
Size of DG (kW)-2616.992750
Location of VCS14, 18-33
Size of VCS (kW)4-156.8
Real power loss (kW)212.2967.7596.06
Disclaimer/Publisher’s Note: The statements, opinions and data contained in all publications are solely those of the individual author(s) and contributor(s) and not of MDPI and/or the editor(s). MDPI and/or the editor(s) disclaim responsibility for any injury to people or property resulting from any ideas, methods, instructions or products referred to in the content.