Article

PSO-Based Identification of the Li-Ion Battery Cell Parameters

by
Tadeusz Białoń
1,2,*,
Roman Niestrój
1,2 and
Wojciech Korski
2
1
Department of Electrical Engineering and Computer Science, Faculty of Electrical Engineering, Silesian University of Technology, 44-100 Gliwice, Poland
2
Łukasiewicz Research Network—Institute of Innovative Technologies EMAG, 40-189 Katowice, Poland
*
Author to whom correspondence should be addressed.
Energies 2023, 16(10), 3995; https://doi.org/10.3390/en16103995
Submission received: 29 March 2023 / Revised: 26 April 2023 / Accepted: 29 April 2023 / Published: 9 May 2023
(This article belongs to the Special Issue Data Mining Applications for Charging of Electric Vehicles II)

Abstract

:
The article describes the results of research aimed at identifying the parameters of the equivalent circuit of a lithium-ion battery cell, based on the results of HPPC (hybrid pulse power characterization) tests. The OCV (open circuit voltage) characteristic was determined, which was approximated using functions of various types, while making their comparison. The internal impedance of the cell was also identified in the form of a Thevenin RC circuit with one or two time constants. For this purpose, the HPPC pulse transients were approximated with a multi-exponential function. All of the mentioned approximations were carried out using an original method developed for this purpose, based on the PSO (particle swarm optimization) algorithm. As a result of the optimization experiments, the optimal configuration of the PSO algorithm was found. Three different cognition methods have been analyzed here: GB (global best), LB (local best), and FIPS (fully informed particle swarm). Three different swarm topologies were used: ring lattice, von Neumann, and FDR (fitness distance ratio). The choice of the cognition factor value was also analyzed, in order to provide a proper PSO convergence. The identified parameters of the cell model were used to build simulation models. Finally, the simulation results were compared with the results of the laboratory CDC (charge depleting cycle) test.

1. Introduction

Battery modeling is a broad and complex field of study, covering many issues in the fields of chemistry, physics, and electrical engineering. The electrical, chemical, and thermodynamic phenomena taking place in a battery cell are interconnected and have a strongly non-linear character. Among various battery models, equivalent circuits are extensively applied because of simple structure, high precision, and the ability to characterize properties of batteries such as open circuit voltage, ohmic internal resistance, and battery polarization effects [1]. The models typically consist of a voltage source, resistors, capacitors in parallel to form RC pairs [1], and sometimes, inductance [2].
For the calculation of energy consumption, simplified circuit models [3,4,5,6] are used, which represent the battery as a charge-dependent voltage source with internal impedance modeled as a single resistor (Rint model) [7,8,9,10,11]. In the case of more complex models, representing dynamic properties of the cell, the structure of the model is related to the identification method of its parameters. In the research presented here, the identification was made on the basis of the HPPC test [12], which allows for the identification of the parameters of the model in the form of a Thevenin RC circuit [9,13,14,15,16].
The voltage source in the Thevenin model, representing the OCV of the cell, has a value that is a non-linear function of the battery SOC (state of charge). Three zones [3,10,17] can be distinguished in its characteristics. In the first zone, starting from full charge, there is an initial rapid voltage drop [18]. Then, in the second zone, the voltage stabilizes, dropping slowly—and almost, linearly. Finally, in zone three, for a heavily discharged battery, the voltage drop accelerates again [18].
In practice, the OCV characteristic is identified by measurement. The charging and discharging characteristics measured at a constant current and then averaged are most often used here [19,20,21]. However, this method has some disadvantages. Firstly, the measured cell voltage, in addition to the OCV, also includes the voltage drop at the internal impedance, which is strongly non-linear and may change differently during charging than during discharging. Secondly, the cell capacitance measured during charging is different from that during discharge, due to the presence of power loss. It makes it difficult to reconcile the two characteristics before the required averaging. To avoid these problems, this article proposes a method for determining the OCV characteristics based on the results of HPPC tests, consisting in averaging the voltage recorded in the no-current state before each pulse.
Independently to the method of how they have been acquired, OCV values obtained directly from measurements contain irregularities, which makes them not suitable for creating simulation models directly, so these require approximation. The approximation can be carried out using functions of various forms [3,22,23,24,25,26,27]. Some of them are reviewed and compared in this article. The function parameters can be identified analytically, usually based on manually selected points corresponding to the three OCV characteristic zones mentioned above [3]. The disadvantage of this method is that it is often difficult to define the boundaries between the three characteristic zones. Another method is to use optimization [9,15,27,28].
Another problem is the identification of time constants and RC parameters of the Thevenin model. It is most often carried out based on HPPC [21,29,30,31] test results, as it is done here. Another method is an application of the pulse charge or discharge test [6,32,33]. In both cases it is also necessary to approximate the measurement waveforms using a function, in this case a multi-exponential one. The number of exponential terms in the function equals the number of RC pairs in the Thevenin circuit. In many cases, it is a single pair [19,20,32,34], and only one corresponding time constant is identified. In this case RC parameters may be simply calculated, based on identified characteristic points of voltage transient corresponding to current test pulse [32]. Two-time-constant case is more complex and difficult to identify [18,19,31] because it requires application of curve-fitting techniques discussed below.
The above-mentioned approximation tasks, both for OCV and RC pairs of the Thevenin model, can be performed by optimization. In practice, deterministic optimization methods may be used [21,35,36]. Deterministic methods, however, have one major disadvantage: the optimization result depends on the starting point of the algorithm, which is not always easy to choose. This problem does not occur in population-based various metaheuristic algorithms such as genetic algorithm, PSO, and others [9,28,35,36,37,38,39,40,41]. These algorithms process multiple points distributed over the entire search space simultaneously [42], therefore they are characterized by high efficiency in finding the global extremum. However, the quality of the obtained optimization result depends on the one hand on the complexity of the problem, i.e., on the number of optimized variables, and on the other hand, on the algorithm structure used, the appropriate selection of which remains an important practical problem [43]. In the first place, the appropriate cognition method should be selected, among which the most popular are GB (global best), LB (local best), and FIPS (fully informed particle swarm) [37,43,44]. A swarm topology should also be selected according to the optimization task being analyzed. Static topologies, ring lattice and von Neumann grid [45,46], and dynamic topology FDR (fitness distance ratio) [45,47] are most commonly used. Equally important is the choice of numerical values of parameters controlling the learning process, such as cognition factor, constriction coefficient, and inertia weight, whose values must be adapted to the selected learning method, to the swarm topology, and to the complexity of the optimization problem [43,45,48].
The mentioned specificity of PSO makes the selection of an algorithm configuration suitable for the considered problem of approximation of battery cell characteristics one of the main goals of the research presented here.
The motivation for the research described here is the energy storage design project for the fully electrical load-hull-dump (LHD) vehicle. The methods developed here will be used to identify different types of cell models. Then, the created cell simulation models will be used in the process of designing the traction battery of the vehicle, in accordance with MBD (model-based design) methodology.
Numerical models of batteries and other components of electrical systems are intensively used in the design of power supply systems using the MBD method [49,50], creating a more or less complete numerical model of a part or the whole of the vehicle. These models are especially used in the design of vehicles in the aviation industry for the design and analysis of aircrafts [51], UAV (unmanned aerial vehicles) [52,53], in the automotive industry and mobile robotics [54].
Novelties:
  • Proposed method for OCV characteristic determination based on HPPC tests.
  • Developed universal, PSO-based optimization method, suitable both for OCV characteristic and HPPC pulses approximation.
Other contribution:
  • Comparison and evaluation of various OCV approximation functions.
  • Comparison and evaluation of a one-time-constant and a two-time-constant Thevenin model of the same battery cell.

2. Methods

Data acquisition was initiated with laboratory tests of a lithium-ion battery cell with the nominal parameters given in Table 1.
Acquired data were analyzed using a PSO to determine the parameters of the cell equivalent circuit. This circuit then became the basis for the created simulation model. Finally, the simulation results were compared with the measurement results. The research methodology is outlined in Figure 1.
A series of HPPC tests and a charge depleting cycle (CDC) test were performed. The tests were performed with a test setup shown in Figure 2. The cell is fed with an active power supply with load function, operating in constant current (CC) and constant voltage (CV) modes. The ITECH IT6522C power supply was used, equipped with an additional active load module IT-E502 with a maximum dissipated power of 3000 W.
The measurement feedback of the power supply is connected directly to the cell terminals in order to avoid voltage drops on the power cables (marked in bold in Figure 2b). The measurement of the cell current was carried out using a shunt with a rated current of 60 A and a voltage of 60 mV. The voltage at the cell terminals and at the shunt was recorded using a National Instruments NI 6251 M Series data acquisition device equipped with a 16-bit analog-to-digital converter. The sampling rate was 135 Hz during HPPC tests and 100 Hz during CDC test.
The battery cell was operated in constant current (CC) mode in accordance with the given reference current Iref test profile. When the cell voltage reached the allowable minimum or maximum value, the power supply was switched into constant voltage (CV) mode, limiting the current to keep the voltage within the allowable range.
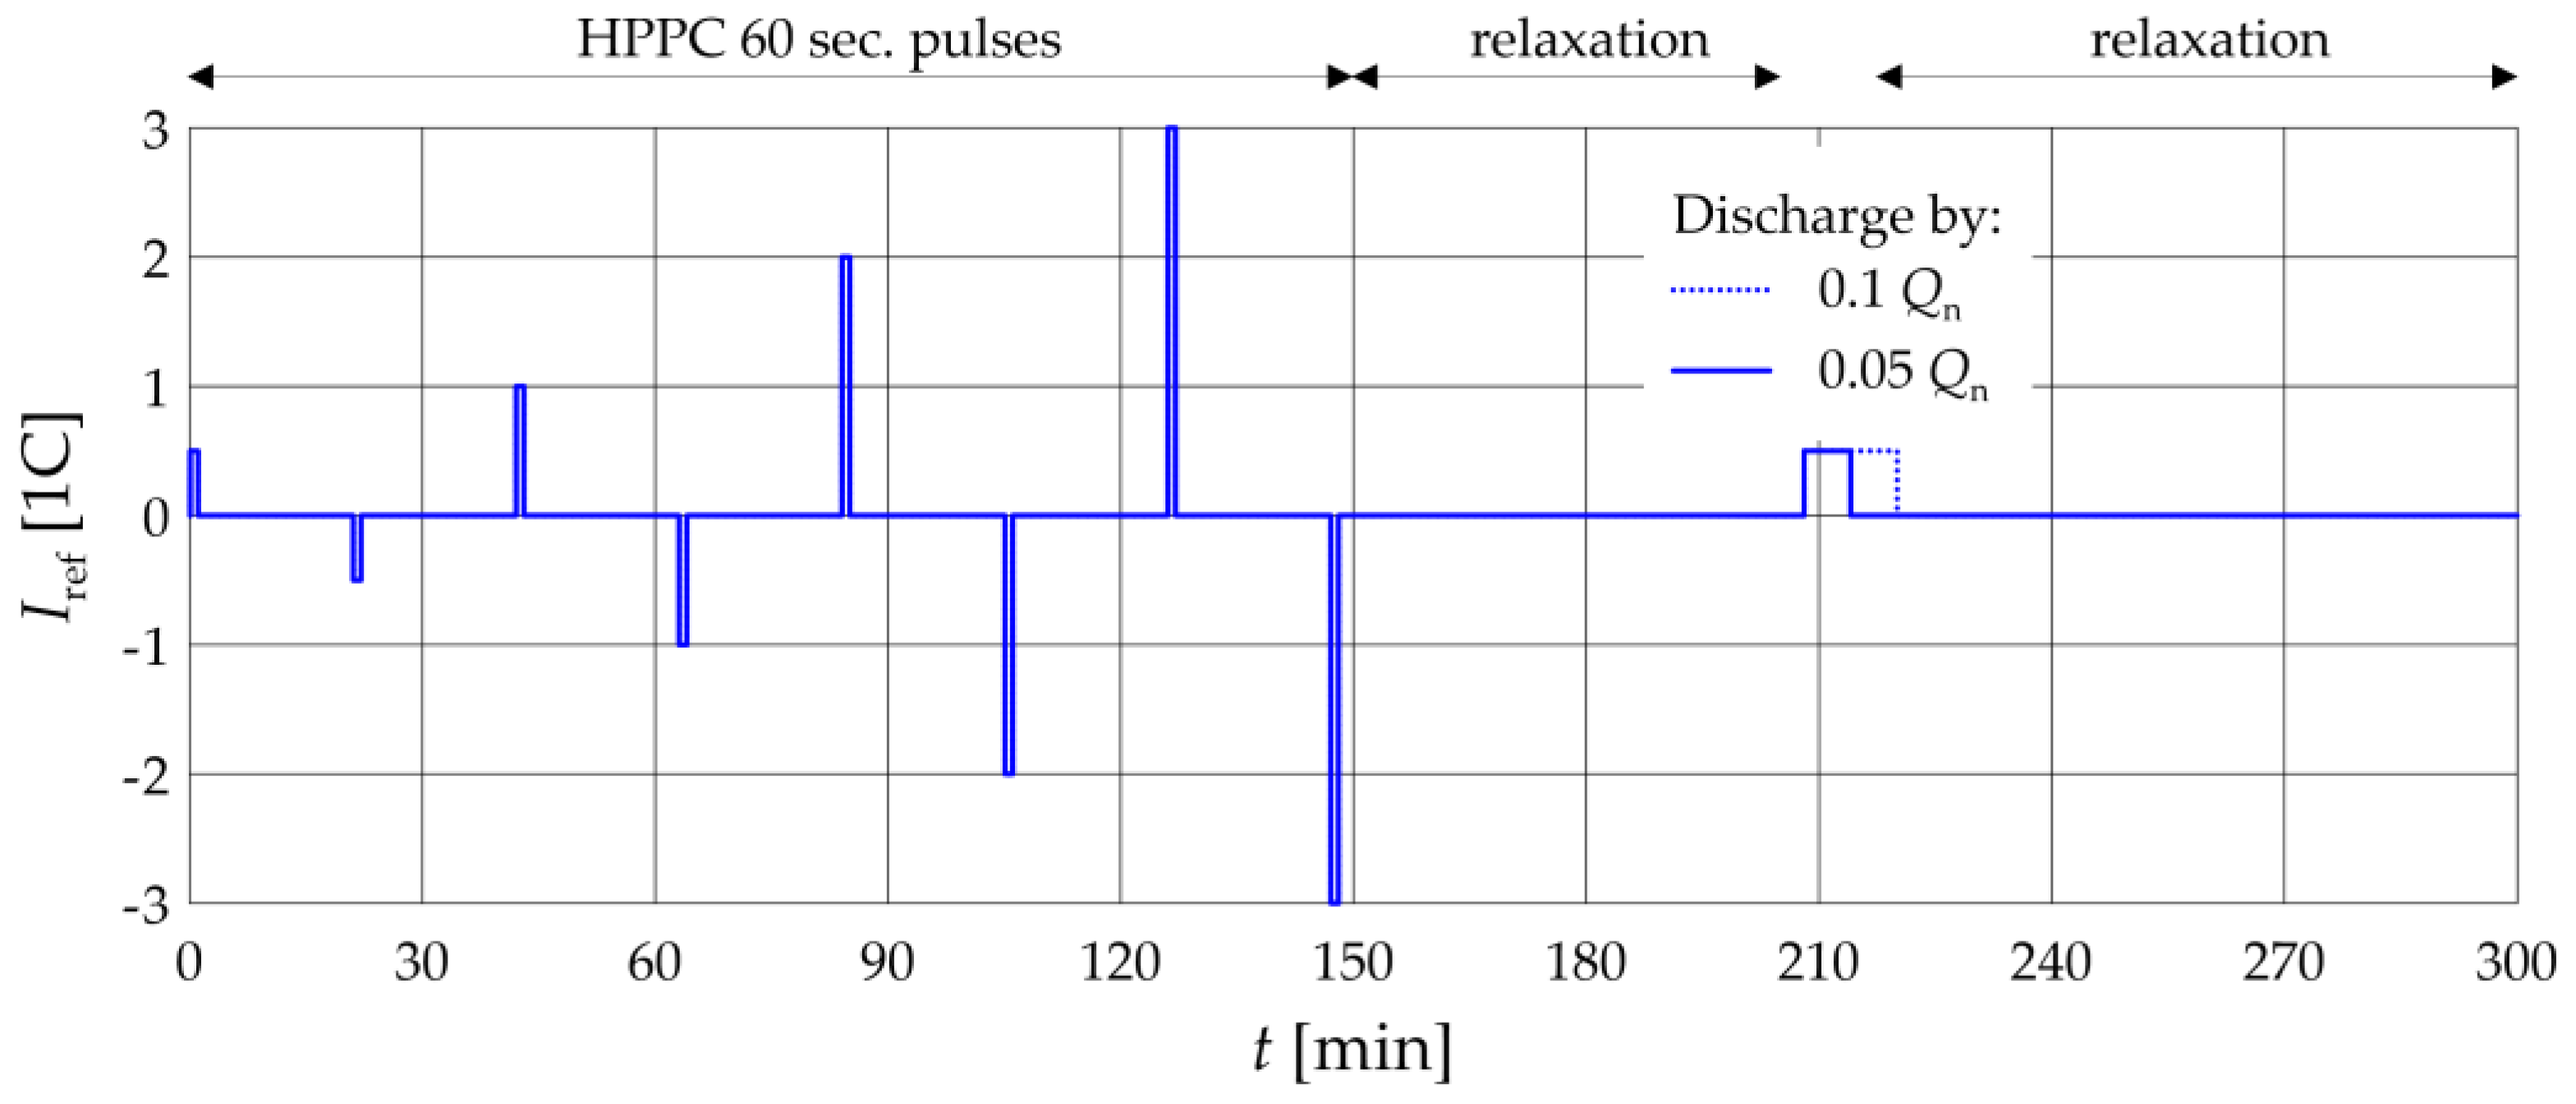
HPPC tests were started after the cell was fully charged (up to maximum voltage). Subsequently, 15 tests were performed with an exemplary profile shown in Figure 3.
The profile consists of a series of eight 60 s test pulses of different values [2], alternately discharging (positive current) and charging (negative current). Then, the cell was discharged by 0.05 Qn, or 0.1 Qn in the middle, flat part of the characteristic (SOC ≈ 0.5). The next test was performed after several hours of resting the battery.
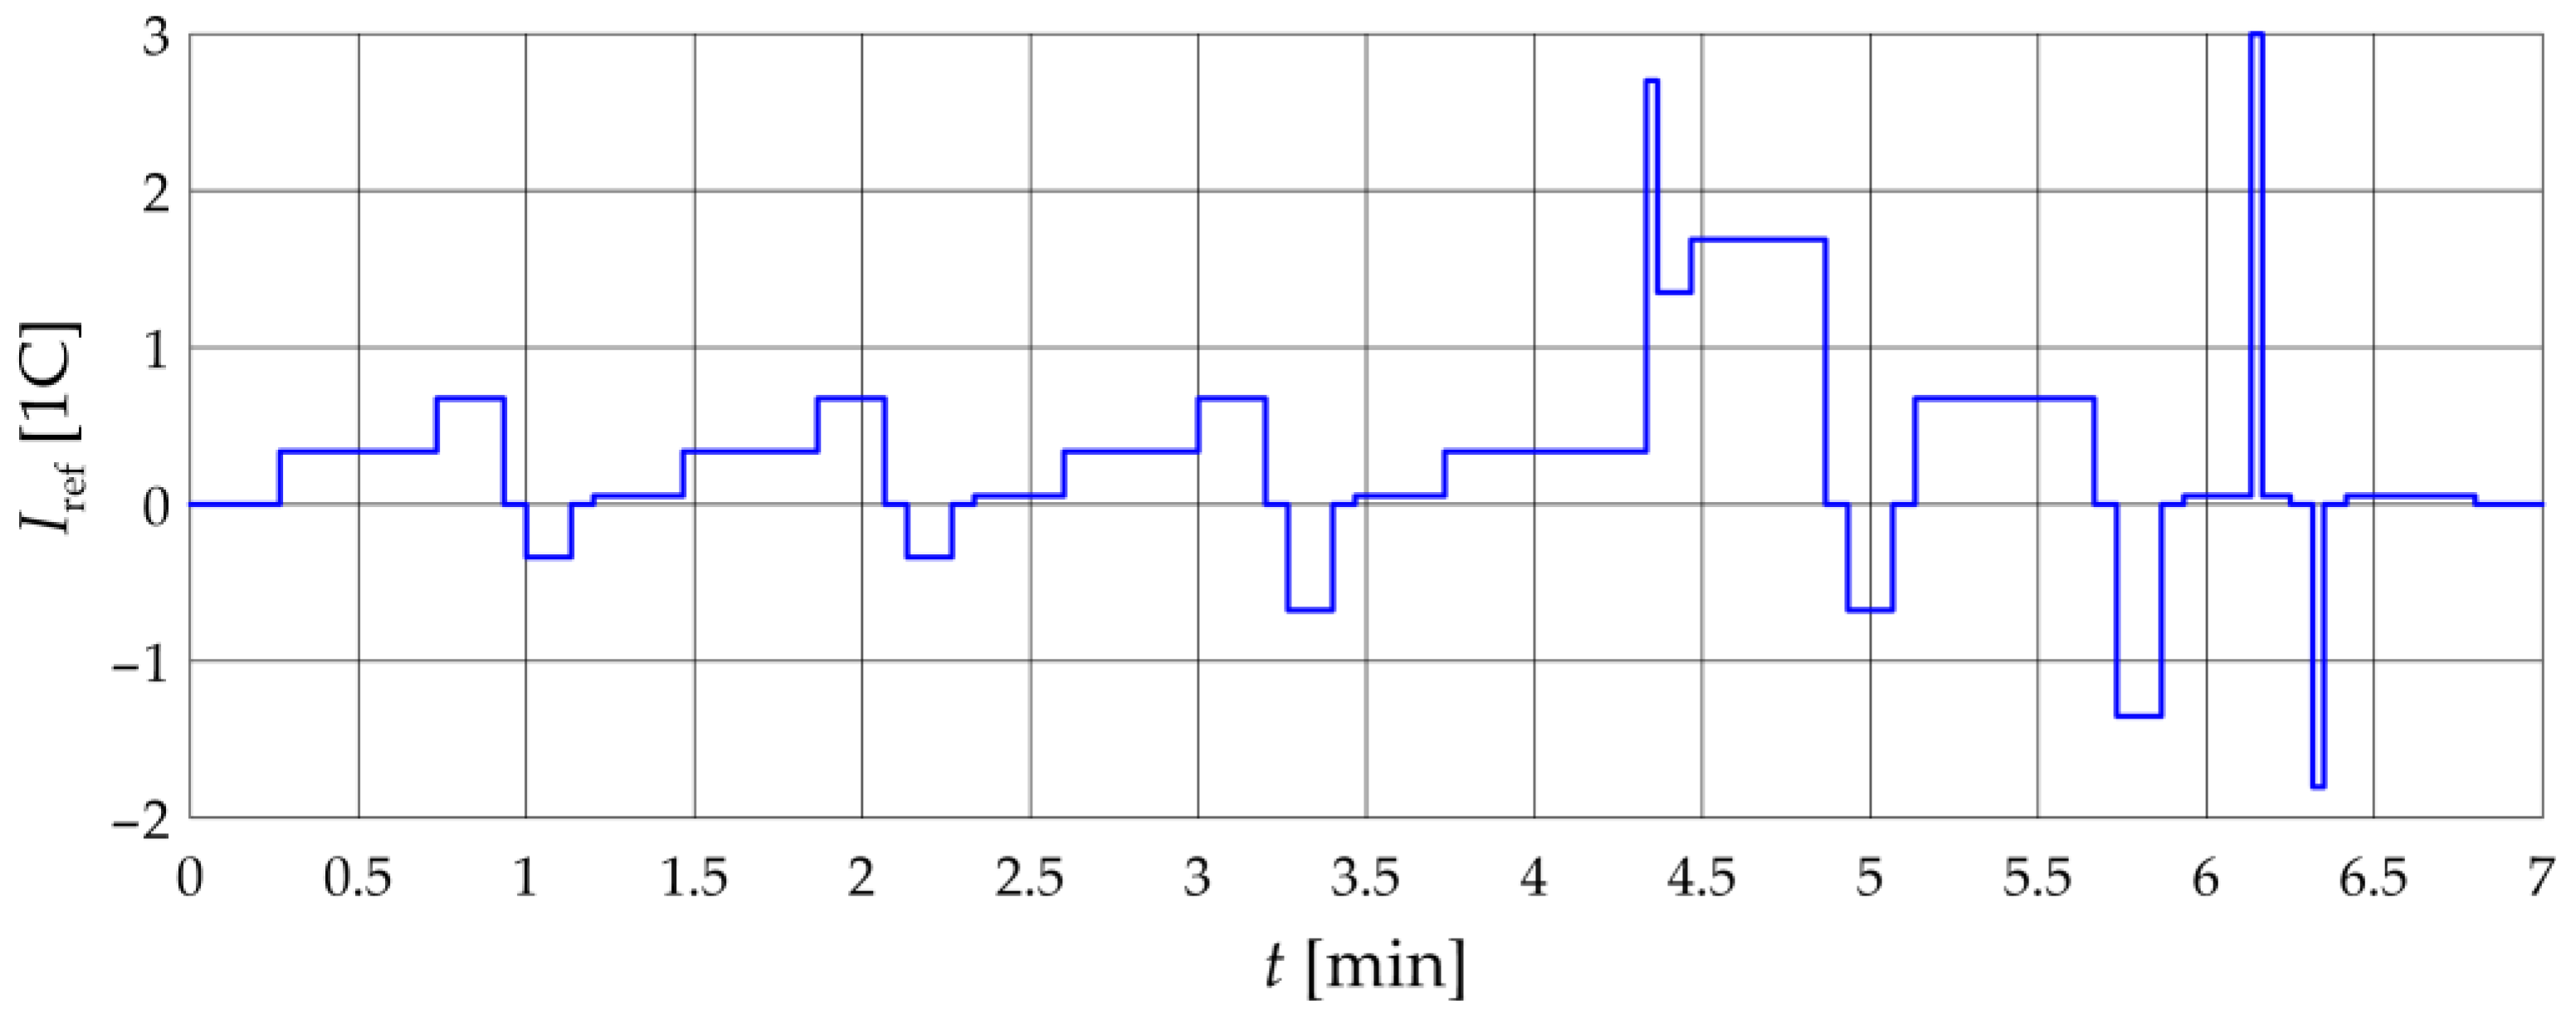
The CDC test simulates cell operating conditions like those in a real electric vehicle. It consists of a series of discharge pulses of relatively small value and long duration (driving at a fixed speed), short discharge pulses of high value (acceleration) and charging pulses (braking with energy recovery). The profile used was developed based on the test profile for plug-in hybrid electric vehicles, given in the manual [55]. Compared to the original profile given in [55], the applied profile current values have been reduced. This is due to the fact that in a fully electric vehicle the relative battery current values are lower than in a hybrid one. The applied CDC profile is shown in Figure 4.
A single cycle reduces the battery charge by 0.033 Qn; therefore, a full discharge requires about 30 cycles. Other similar cycle-based test profiles used for battery model verification are DST (dynamic stress test) [1,30,34,56], ARTEMIS [38,40], and others [2,9,26,39,57,58,59].
Laboratory HPPC tests provided data for the next step, which was the identification of battery cell model parameters. Two sets of data were extracted from these test results. The first 1 contained cell OCV UOC values (the voltage at current Ibatt = 0) and the corresponding state of charge (SOC) values. OCV was calculated as a mean value of recorded Ubatt voltage over 10 s. period before each HPPC impulse. A similar strategy of OCV measurement, but based on pulse charge and discharge tests, is presented in [15,26]. This set of data was used for OCV vs. SOC characteristic approximation function parameter identification.
The second data set contained HPPC impulse voltage transients and the corresponding initial SOC values. Every impulse was approximated with an exponential function that determined resistances and capacitances that comprised the SOC-dependent internal impedance of the cell.
OCV characteristic function and impulse exponential function parameters were optimized with a particle swarm (PSO) algorithm developed by the authors.
Finally, a Matlab–Simulink model was created based on the identified parameters of the battery cell mathematical model, and a CDC cycle test was simulated, identical to the one recorded in the laboratory.

3. Results

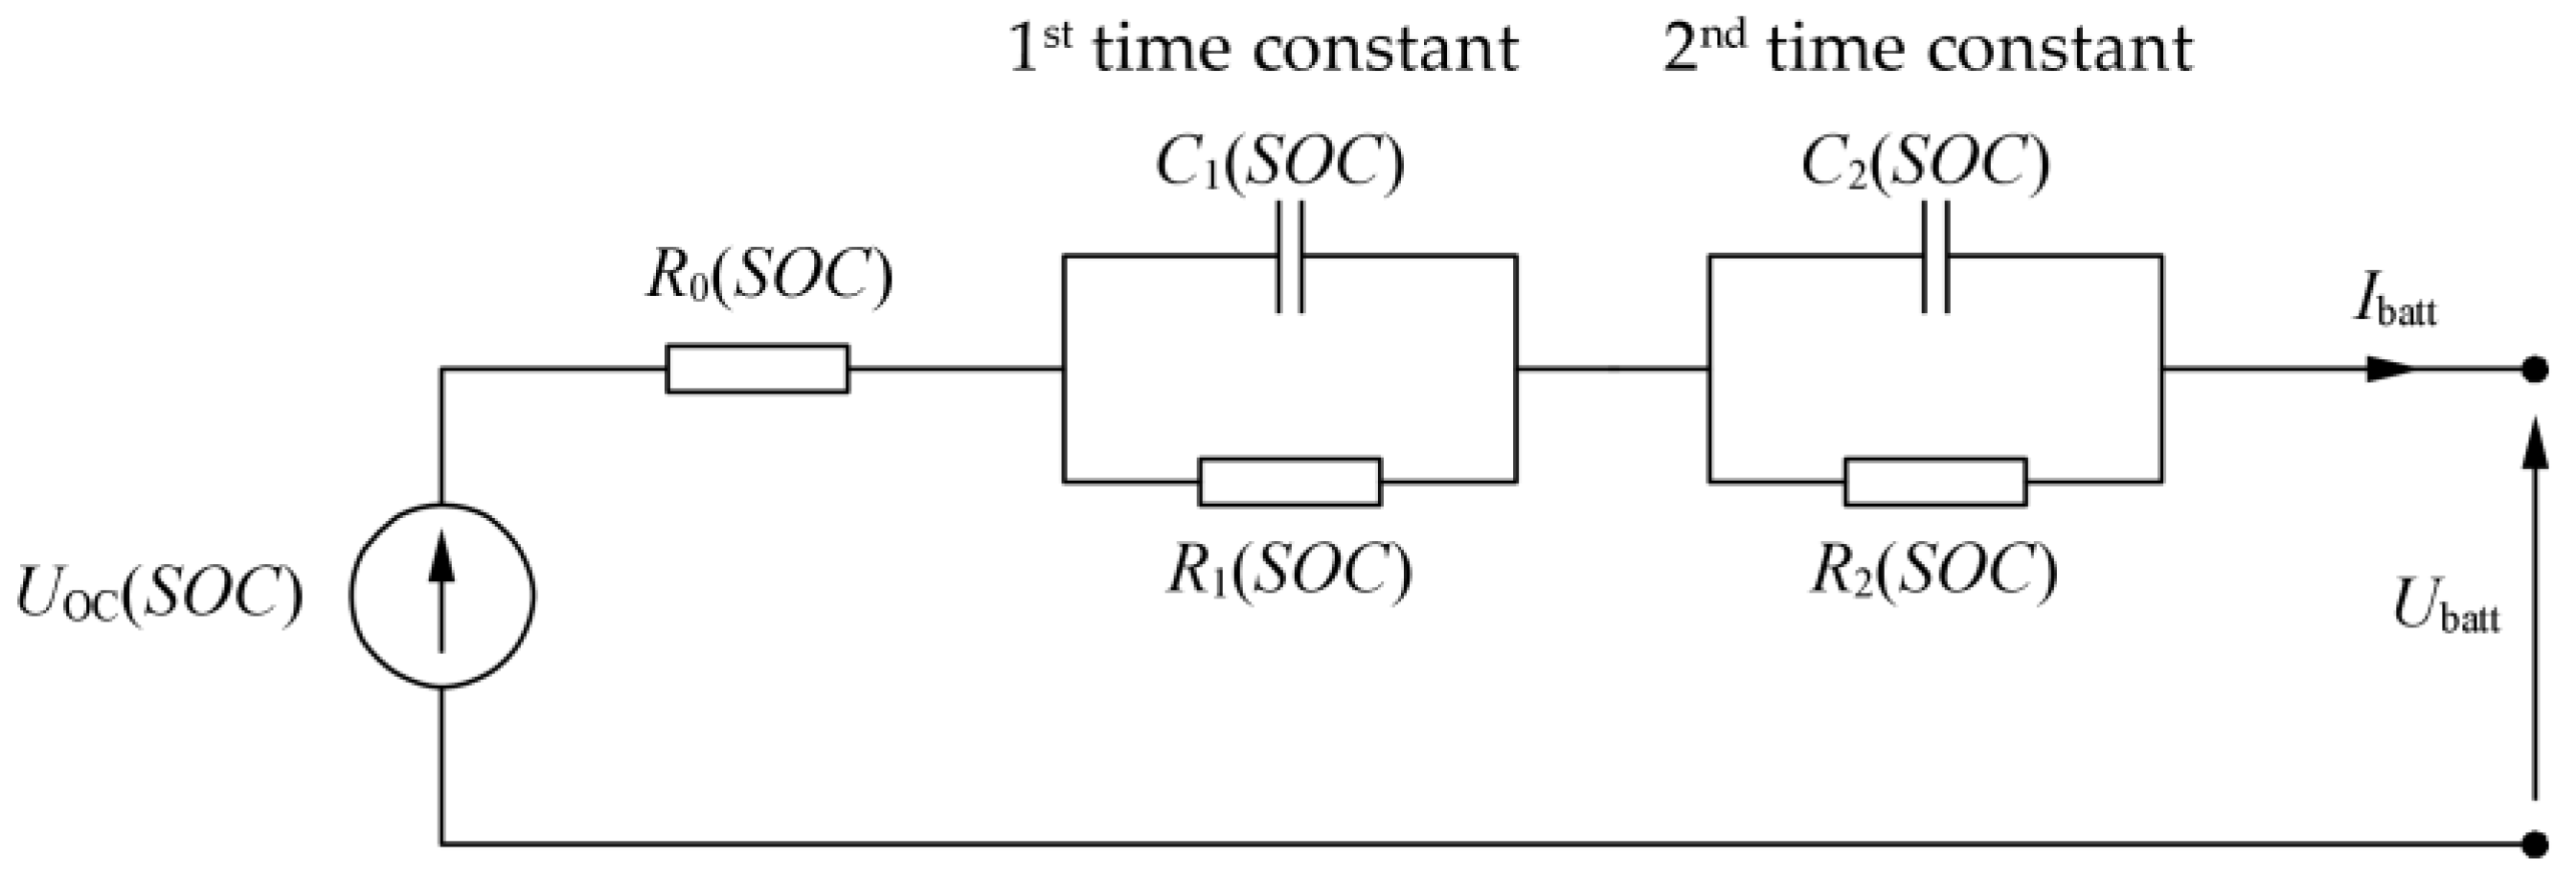
The battery cell mathematical model is represented by the Thevenin (series) equivalent circuit (Figure 5) consisting of a voltage source UOC(SOC), representing the open-circuit voltage OCV, depending on the state of charge SOC of the battery. The internal impedance of the cell is represented by a series resistor R0 related to the ohmic effects of the materials, while the time-dependent overvoltages are modeled by the RC circuits [15,16,30,36,56,57,60].
The number of RC circuits determines the number of mathematical model time constants [1,56,57]:
τk = Rk·Ck,
where k ∈ [1, 2]. All the resistances and capacities depend on the SOC of the cell, which is estimated based on the cell current [1,15,25,34,40,60]:
S O C = S O C 0 1 Q b a t t 0 t I b a t t d τ .
where SOC0 is the initial SOC of the cell and Qbatt is the cell capacity. Real cell capacity usually differs from the nominal one Qn and depends on ambient temperature, the state of health (SOH) of the cell, etc. Here it was estimated as a total charge given off by the cell in all 15 HPPC tests:
Q b a t t = 15 0 t I b a t t d τ .
The resulting value was Qbatt = 17.103 Ah and was greater than the nominal one given in Table 1. The number of 15 HPPC tests comes from the fact that subsequent tests were carried out until the cell voltage reached the minimum value (Table 1), and the discharging current pulses were cut off by the CC/CV mechanism.
It should be mentioned that the cell model used does not take into account the phenomenon of self-discharge. Taking this phenomenon into account would require adding an additional resistor to the equivalent circuit in parallel with the UOC voltage source [61]. The value of this resistor, however, is not identifiable from the HPPC tests underlying the analysis performed here. Moreover, the self-discharge process is usually not taken into account when designing a vehicle traction battery using the MBD method, which will be the main application of the methods developed here. Therefore, the self-discharge process was omitted.

3.1. Battery Cell OCV Characteristic

The voltage characteristic UOC(SOC) can be approximated by a continuous function, various forms of which can be found in the literature. The first of the analyzed functions was used in the simulation model available in the Matlab–Simulink environment (Toolbox Simscape Electrical):
U O C S O C = a S O C 1 b · 1 S O C .
For simplicity, this function will hereinafter be referred to as the “Beta function”, after the coefficient marking found in its original form in the Matlab program. This function requires the identification of only two parameters describing its shape, a and b. The simplicity of the model, however, made it impossible to match it satisfactorily to the actual voltage characteristics of the cell. In particular, the Beta function is not able to depict the cell voltage rise near SOC = 1. Significant discrepancies also occurred near SOC = 0, because the function (4) has a value of 0 at this point, while in practice, the actual cell voltage cannot drop below the minimal one, and for a fully discharged cell is still greater than 0.
A better representation of the shape of the characteristic is provided by the Tremblay function [3,62], named after the originator [5]. A similar function was used in [17,63]. This function included an exponential term to represent the voltage rise near SOC = 1:
U O C S O C = a + b · e c · 1 S O C d S O C .
The curve of the characteristic at low SOC values is mapped using the inverse function, which is a problem—this component has an asymptote for SOC = 0, which prevents a good fit of the function to the shape of the measurement characteristic. The Tremblay function has four parameters, a, b, c, and d.
To improve the mapping of the characteristics in the range of low SOC values, an additional fifth e parameter has been added to the Tremblay function:
U O C S O C = a + b · e c · 1 S O C d S O C + e .
When e > 0, then the asymptote of the function (6) is in the range of negative SOC values, i.e., outside the operating area 0 < SOC < 1, and the value UOC(SOC = 0) is greater than zero, as in the real characteristic. The function described by the Equation (6) will hereinafter be called Tremblay2.
Another function analyzed is the log-linear-exponential (LLE) model [3,26]:
U O C S O C = a + b · ln S O C + c + d · S O C + e e · S O C f .
This is a complex function, and its shape is determined by six parameters, af. It contains 3 SOC dependent terms, logarithmic (coefficients b, c), mapping the shape of the characteristic for SOC ≈ 0, linear (d) defining the slope of the middle part of the characteristic and exponential (e, f), describing its shape for SOC ≈ 1.
In the original version described in [3], the function (7) contains one more parameter in the exponential term. From a mathematical point of view, it is redundant, and its value depends on the parameters e and f. In this study, it has been omitted to simplify the optimization process. However, the presence of this parameter in the original function described in [3] is justified and results from the analytical parameter identification procedure.
In addition to the functions listed above, there are also other variations in the literature combining linear, exponential, and logarithmic terms in various ways [18,22,26,34,38].
The literature [1,3,11,23,24,25] also mentions the approximation of the OCV characteristic of the cell with a polynomial (even of the 17th order [15]), or a polynomial extended with an exponential term [64]:
U O C S O C = a + b · e c · 1 S O C + d · S O C + e · S O C 2 + f · S O C 3 + ···
This function will be referred to as PolyEXP. In [3,23,24,25], it is noted that the polynomial function does not bring good results. For a polynomial 3 degrees and smaller, the fit is not very accurate [20]. For higher degrees of these polynomial, the function oscillates around the reference characteristic [11,65], which is typical for polynomial approximation, but significantly worsens the properties of the obtained battery cell model, especially in the middle, flat part of the characteristic UOC(SOC). Regardless, the authors decided to include function (8) in the program of the research presented here.
In [17,27], a possibility to use a rational function can also be found. However, the authors rejected this due to a large number of coefficients, the problem of function oscillations around the reference characteristic (similar to the polynomial function), and the difficulty avoiding the possible occurrence of asymptotes in the operating range 0 < SOC < 1.
It should be noted that the functions described here describe the OCV characteristics in the full SOC range from 0 to 1. In [22], a different approach was proposed, consisting in the division of the characteristics into three partially overlapping intervals, approximation of the OCV characteristics in each interval separately (with different function), and finally, combining the three obtained functions with appropriate weighting functions.

3.2. Battery Cell Thevenin Impedance

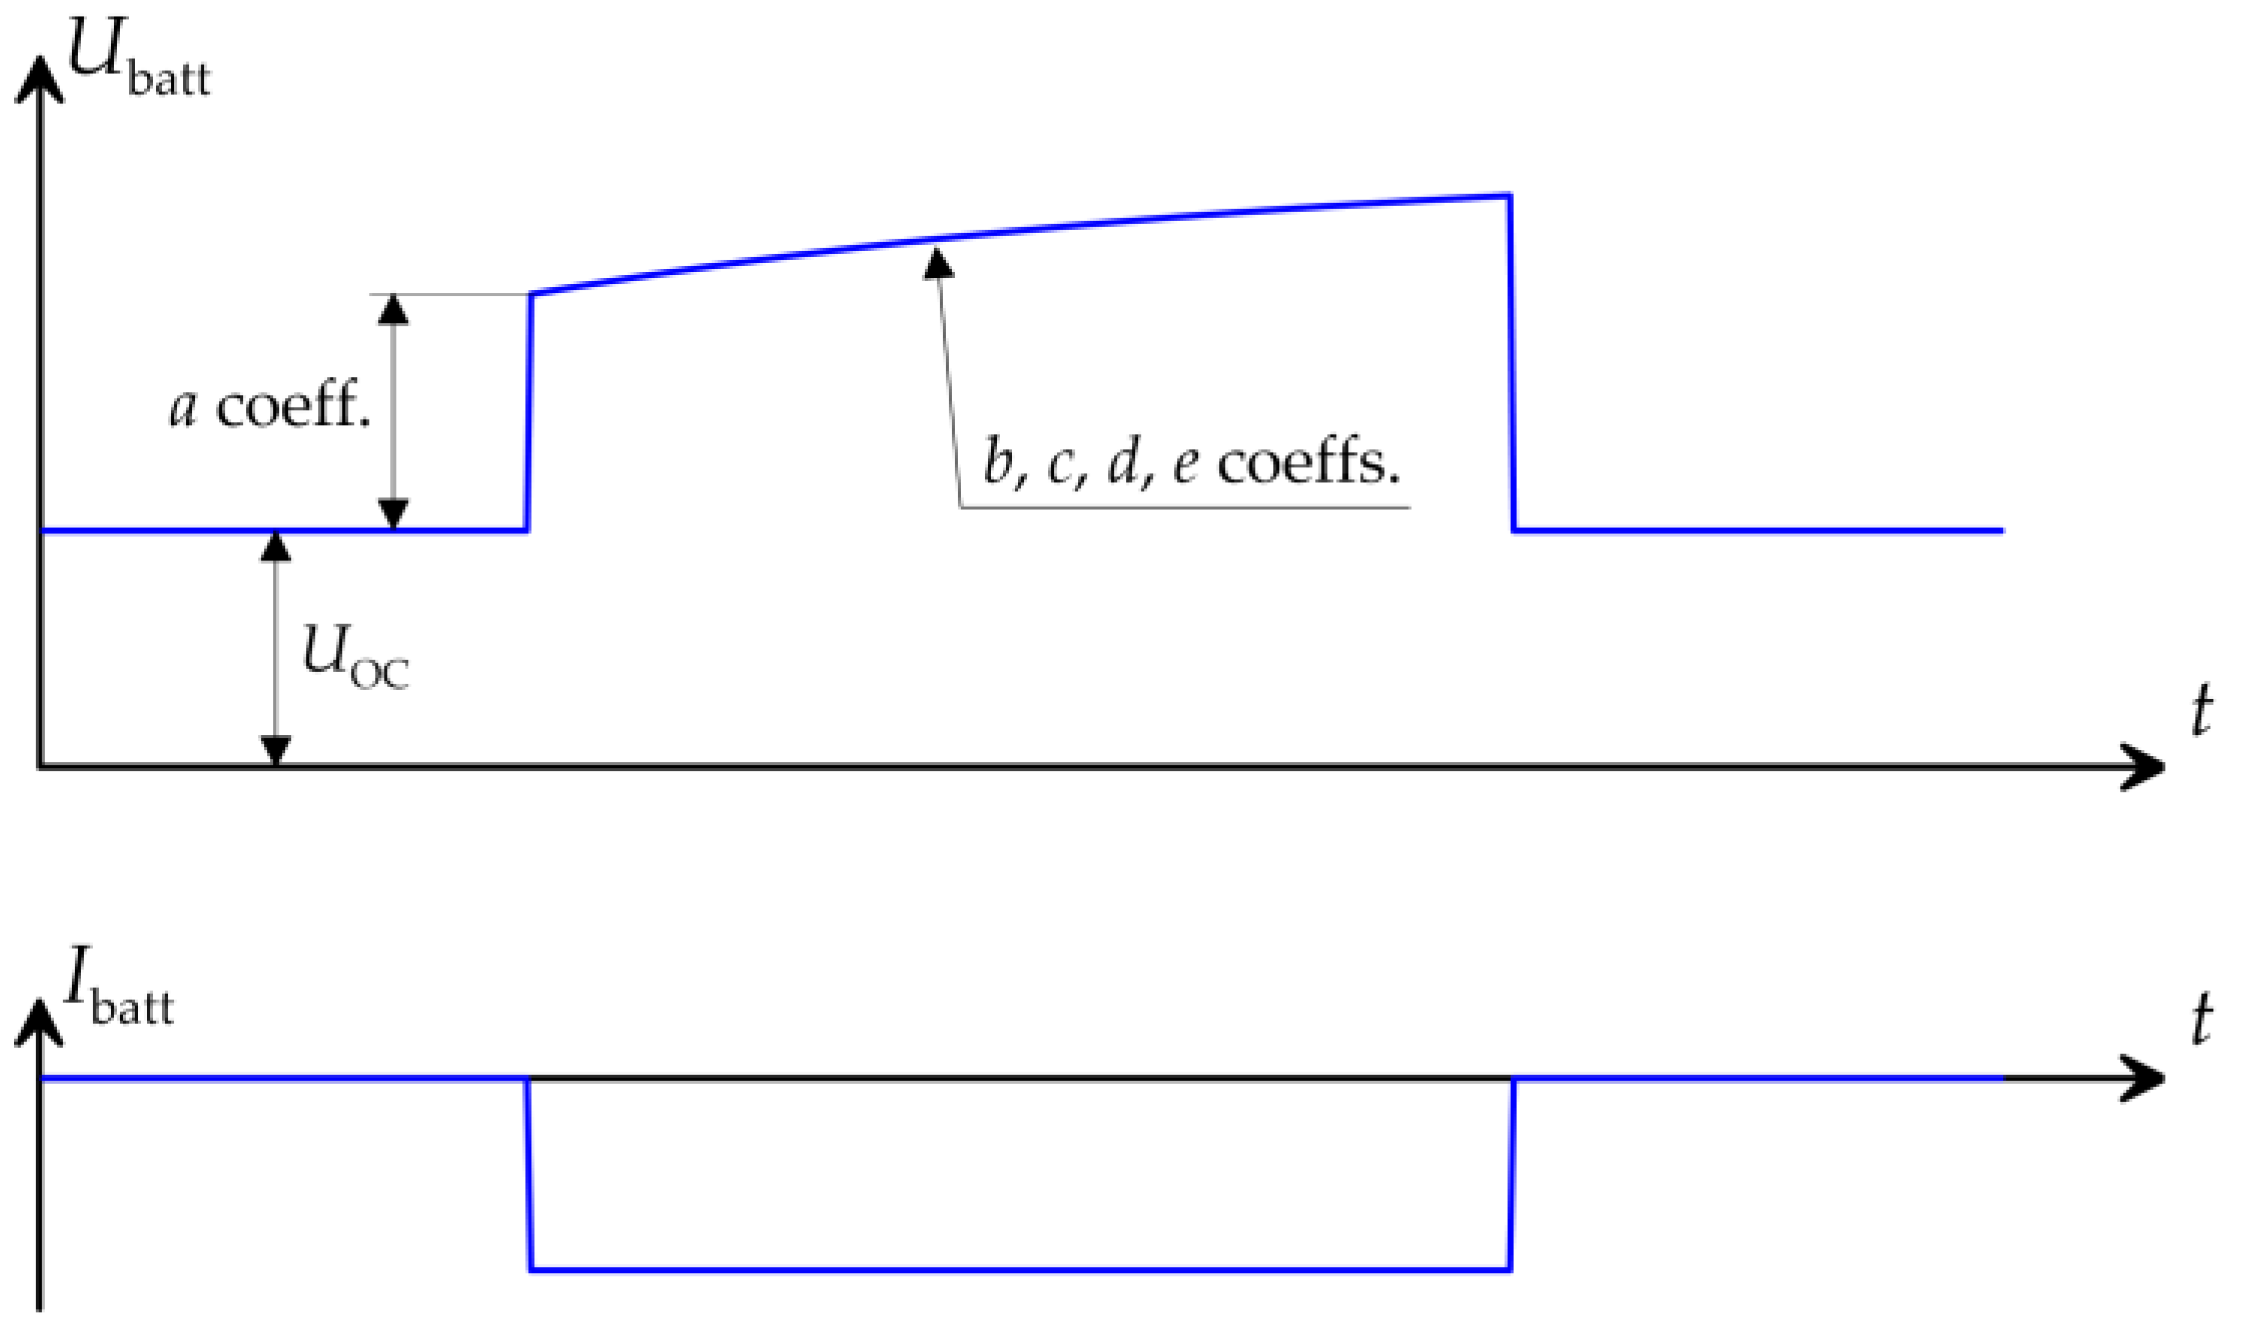
Transient cell voltage during the course of an HPPC impulse may be described with a multi-exponential function:
U b a t t t = U O C ± a ± b · 1 e t c ± d · 1 e t e ,
where positive signs (+) are for charging impulses, while negative (−) are for discharging ones. UOC is a measured OCV (for battery cell current I = 0), in the time instant proceeding the impulse. Coefficients ae define the impulse shape (Figure 6). Equation (9) corresponds to the Thevenin circuit with 2 time constants τ1 and τ2 in (9) denoted as c and e, correspondingly. When only one time constant is taken into consideration, then the last term (d and e) is omitted [9,19]. Based on a parameter Thevenin resistance R0 may be calculated. Resistances R1 and R2 may be calculated based on b and d, correspondingly, and finally, capacitances C1 and C2 based on b, c and d, e pairs and Equation (1).

3.3. Particle Swarm Optimization

The a, b, c… parameters of the approximating functions (4)–(9) were optimized to fit the measured data. For the purposes of optimization, a fitness function was proposed in the form of the square root of the variance, i.e., the mean of the sum of squared deviations from the measured characteristic UOC(SOC) or HPPC impulse voltage transient Ubatt(t):
F = 1 K k = 1 K U r e f ( S O C k ) U O C ( S O C k ) 2 ,
F = 1 K k = 1 K U r e f ( t k ) U b a t t ( t k ) 2 ,
where k is numerical input from the measured or recorded data samples. In the optimization process, the minimum of the function F is sought. The function has the value of the square root of the variance, the value of which is a standard statistical tool used, among others, to assess goodness of fit. The same method, referred to as root mean square error (RMSE), was used, among others, in [1,20,24,56], and in a similar form in [40,42] (variance without root).
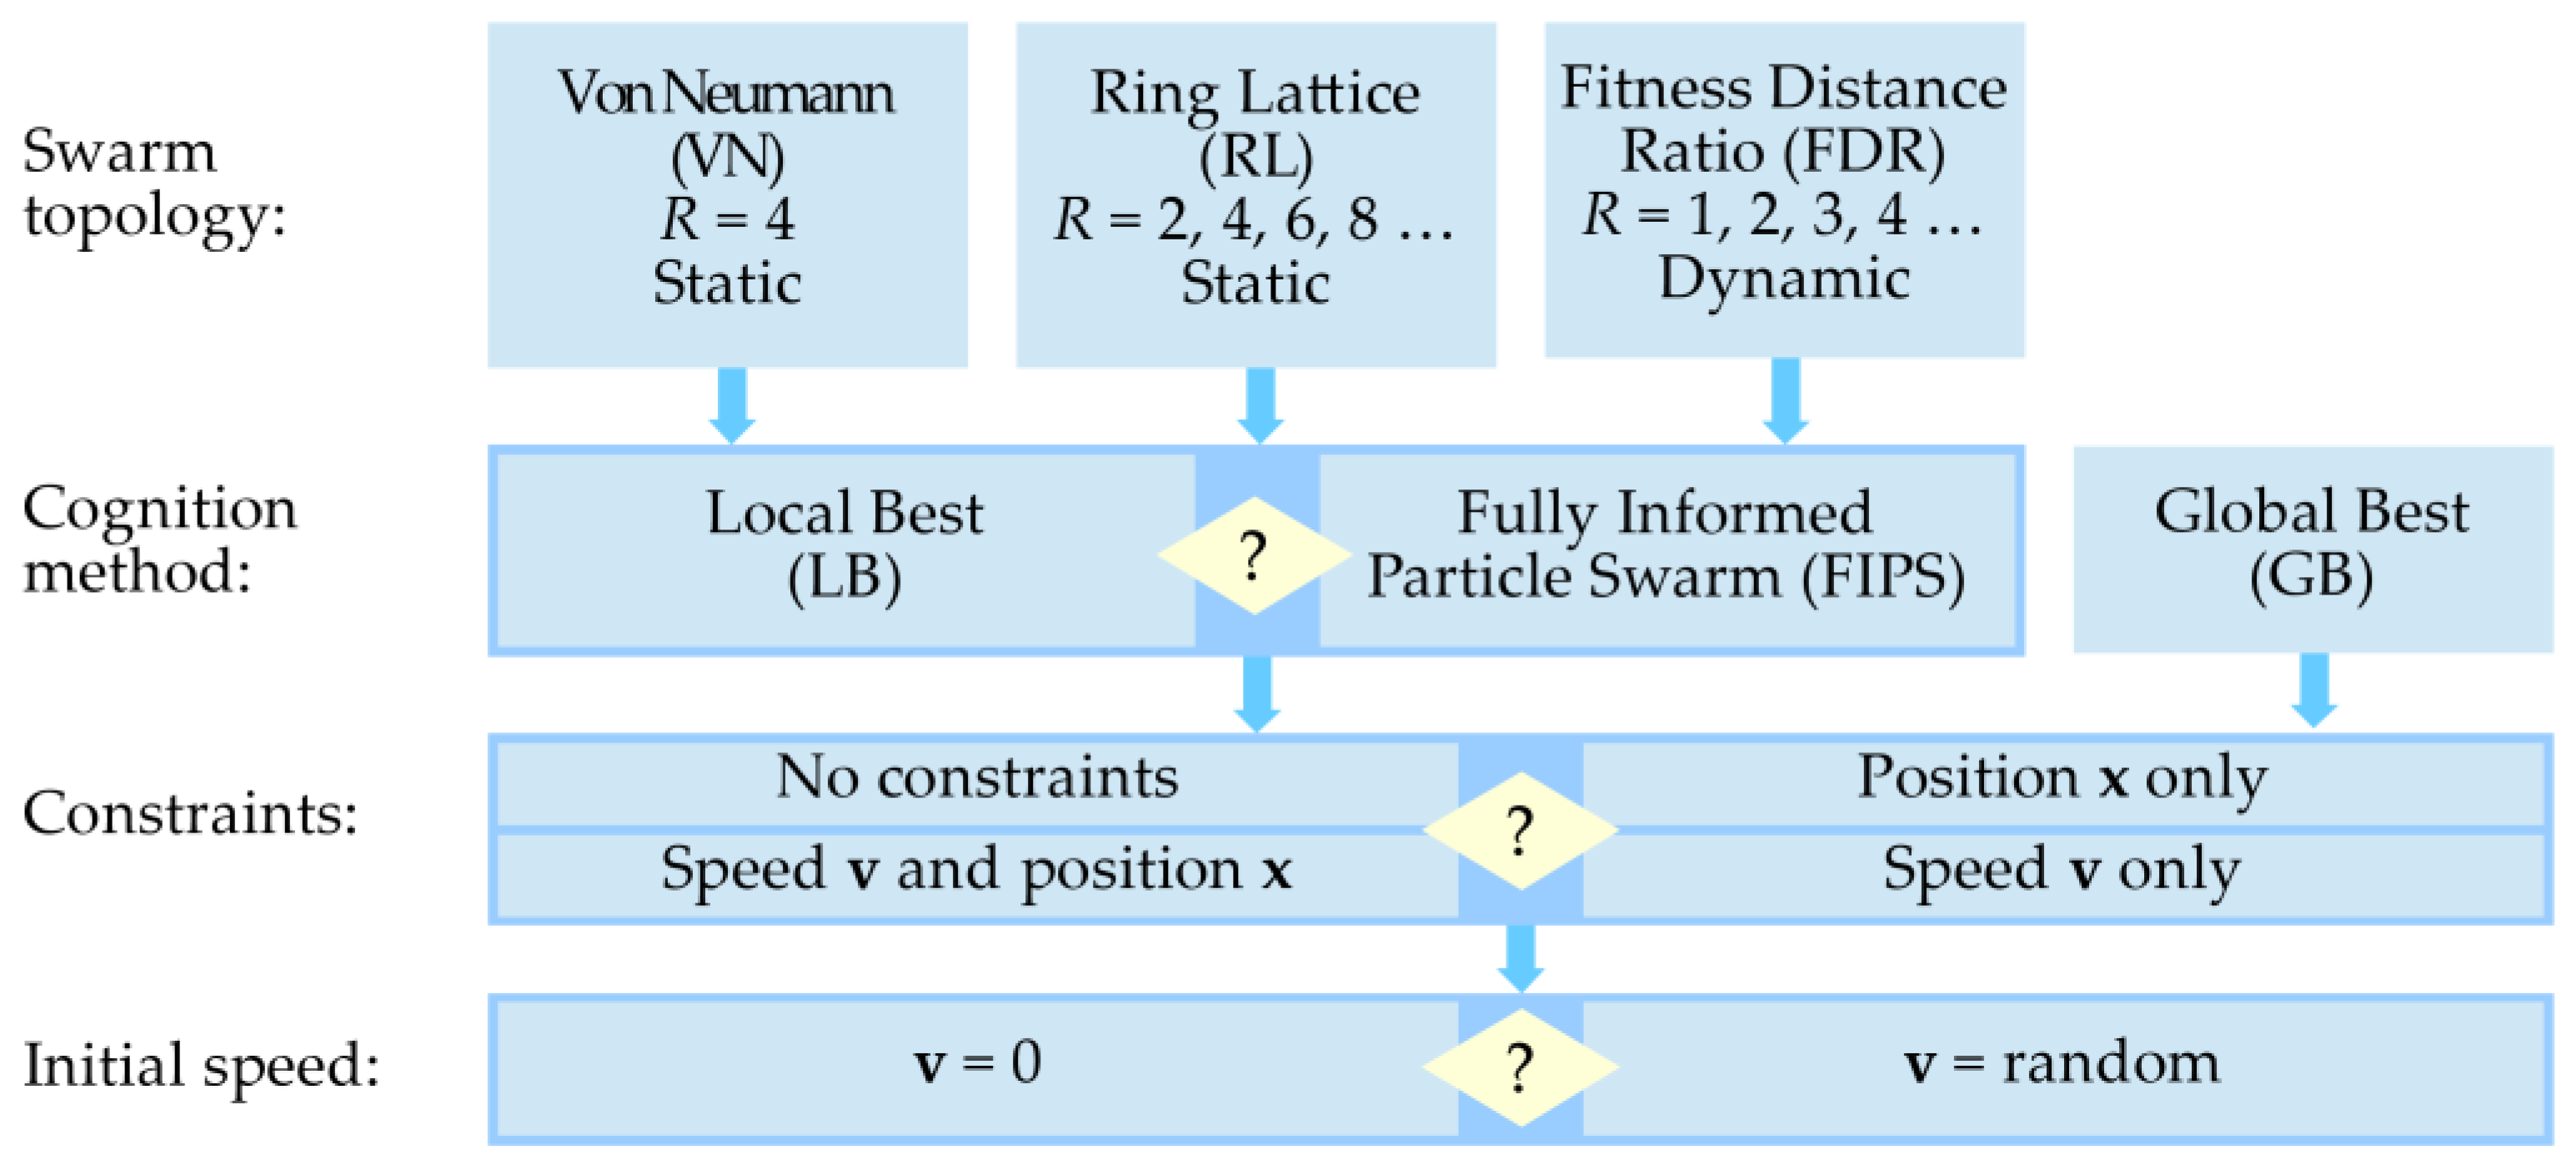
The particle swarm optimization (PSO) algorithm was used for optimization. This algorithm was chosen due to its high efficiency in finding the global extreme and wide configuration options, enabling the optimization process to be easily adapted. For the needs of this research, the original software was created implementing the chosen PSO techniques known from the literature. Possible PSO configurations are shown in Figure 7. PSO was used to identify the battery model parameters also in [42].

3.3.1. Particle Swarm Dynamics

Let us consider a swarm of N particles randomly distributed in the search space. Each particle is described by two vectors, the position vector x and the speed vector v. The number of search space dimensions M (element number of v and x) equals the number of optimized coefficients a, b, c…, and varies from 2 for the function (4) to (6) for the function (7). In each i-th step of the algorithm, the position x of each particle is updated based on its position in the previous step and the speed vector whose value corresponds to the displacement of the particle [42]:
x x + v .
The particle speed v is determined in the cognition process.

3.3.2. Cognition Process

The particle speed v is calculated in each iteration of the algorithm, based on information about the values of the fitness function of other particles and remembered the best of its own previous positions. There are three main cognition methods [43]: global best (GB), local best (LB) and fully informed particle swarm (FIPS).
The GB method, historically the first and simplest one [37,43,44], is described by the equation:
v χ · v + φ 2 · r n d · x p b x + φ 2 · r n d · x g b x .
The course of the cognition process described by the Equation (13) is affected by two coefficients, the cognition factor φ and the constriction coefficient χ. The constriction coefficient is also the inertia weight [45,48]. This is because the new value of the speed v (on the left side of the equation) depends on the product χ·v (on the right side of the equation). In turn, the cognition factor determines how much the speed of a given particle is influenced by other particles in the swarm with better values of the fitness function and the remembered previous best position of this particle. The relationship between the cognition factor and the constriction coefficient determines, among others, the stability of the algorithm and the number of iterations required to achieve convergence. The values of the coefficients φ and χ can be set independently of each other. However, it may cause problems, because with an inappropriate combination of their values, the algorithm may lose stability [45]. In the algorithm described here, the method proposed in [43,48] was used, consisting of interconnecting both coefficients according to the relation:
χ = 2 φ 2 + φ 2 4 φ .
In Equation (13), rnd denotes a diagonal matrix of M-th order with random element values, additionally dependent on the comparison of the values of the objective function:
r n d = d i a g ( ρ 1 , ρ 2 ,   ,   ρ M ) i f F x r e f < F x 0 M × M i f F x r e f F x .
When the value of the objective function corresponding to the position x of the considered particle is better than the value of the objective function corresponding to the reference position xref, then rnd is a diagonal matrix with random values ρ in the range from 0 to 1. When the value of the objective function for the reference position is worse, then rnd is a zero matrix. This means that the components of equation (13) containing the rnd matrix affect the calculated speed of the particle only when the value of the objective function corresponding to the current position x is worse than for the best remembered or, respectively, worse than the value of the fitness function for the best particle in the swarm. The xref in (14) corresponds in (13) to xpb (previous best), the best remembered position of the particle from all previous positions, and xgb (global best), the position of the particle with the best value of the fitness function in the entire swarm.
Studies have shown [43] that the algorithm based on the GB cognition method has a tendency toward premature convergence, and thus, a relatively low efficiency of finding the extremum of the fitness function. Better properties in this respect are demonstrated by the LB method, described by the equation:
v χ · v + φ 2 · r n d · x p b x + φ 2 · r n d · x l b x .
The only difference in comparison to equation (13) is the reference used in the second random term, xlb (local best) instead of xgb (global best). It is the position of the particle with the best value of the fitness function, not in the entire swarm but in its specific fragment, called the neighborhood S of the considered particle. How the neighborhood is defined, and what its order R is, i.e., the number of particles it contains, is determined by the topology of the swarm, described in Section 3.3.3.
Another development of the cognition method is the fully informed particle swarm (FIPS) method described by the formula [43]:
v χ · v + φ R + 1 · r n d · x p b x + φ R + 1 · r n d · r S x r x .
As in the case of LB, the learning process is based not on the entire swarm but on the neighborhood S of a given particle. The difference is that in the case of FIPS, all R particles in the neighborhood are used in the learning process, not just the one with the best value for the fitness function.

3.3.3. Swarm Topology

The swarm topology determines the interconnections between the particles, i.e., how the neighborhood is defined. In the historical first versions of PSO algorithms, the distance between particles in the search space was decisive for belonging to a neighborhood. However, this approach turned out to be ineffective [43] and, at the same time, costly in terms of calculation effort, so it is no longer used. There are currently two basic types of neighborhoods, static and dynamic.
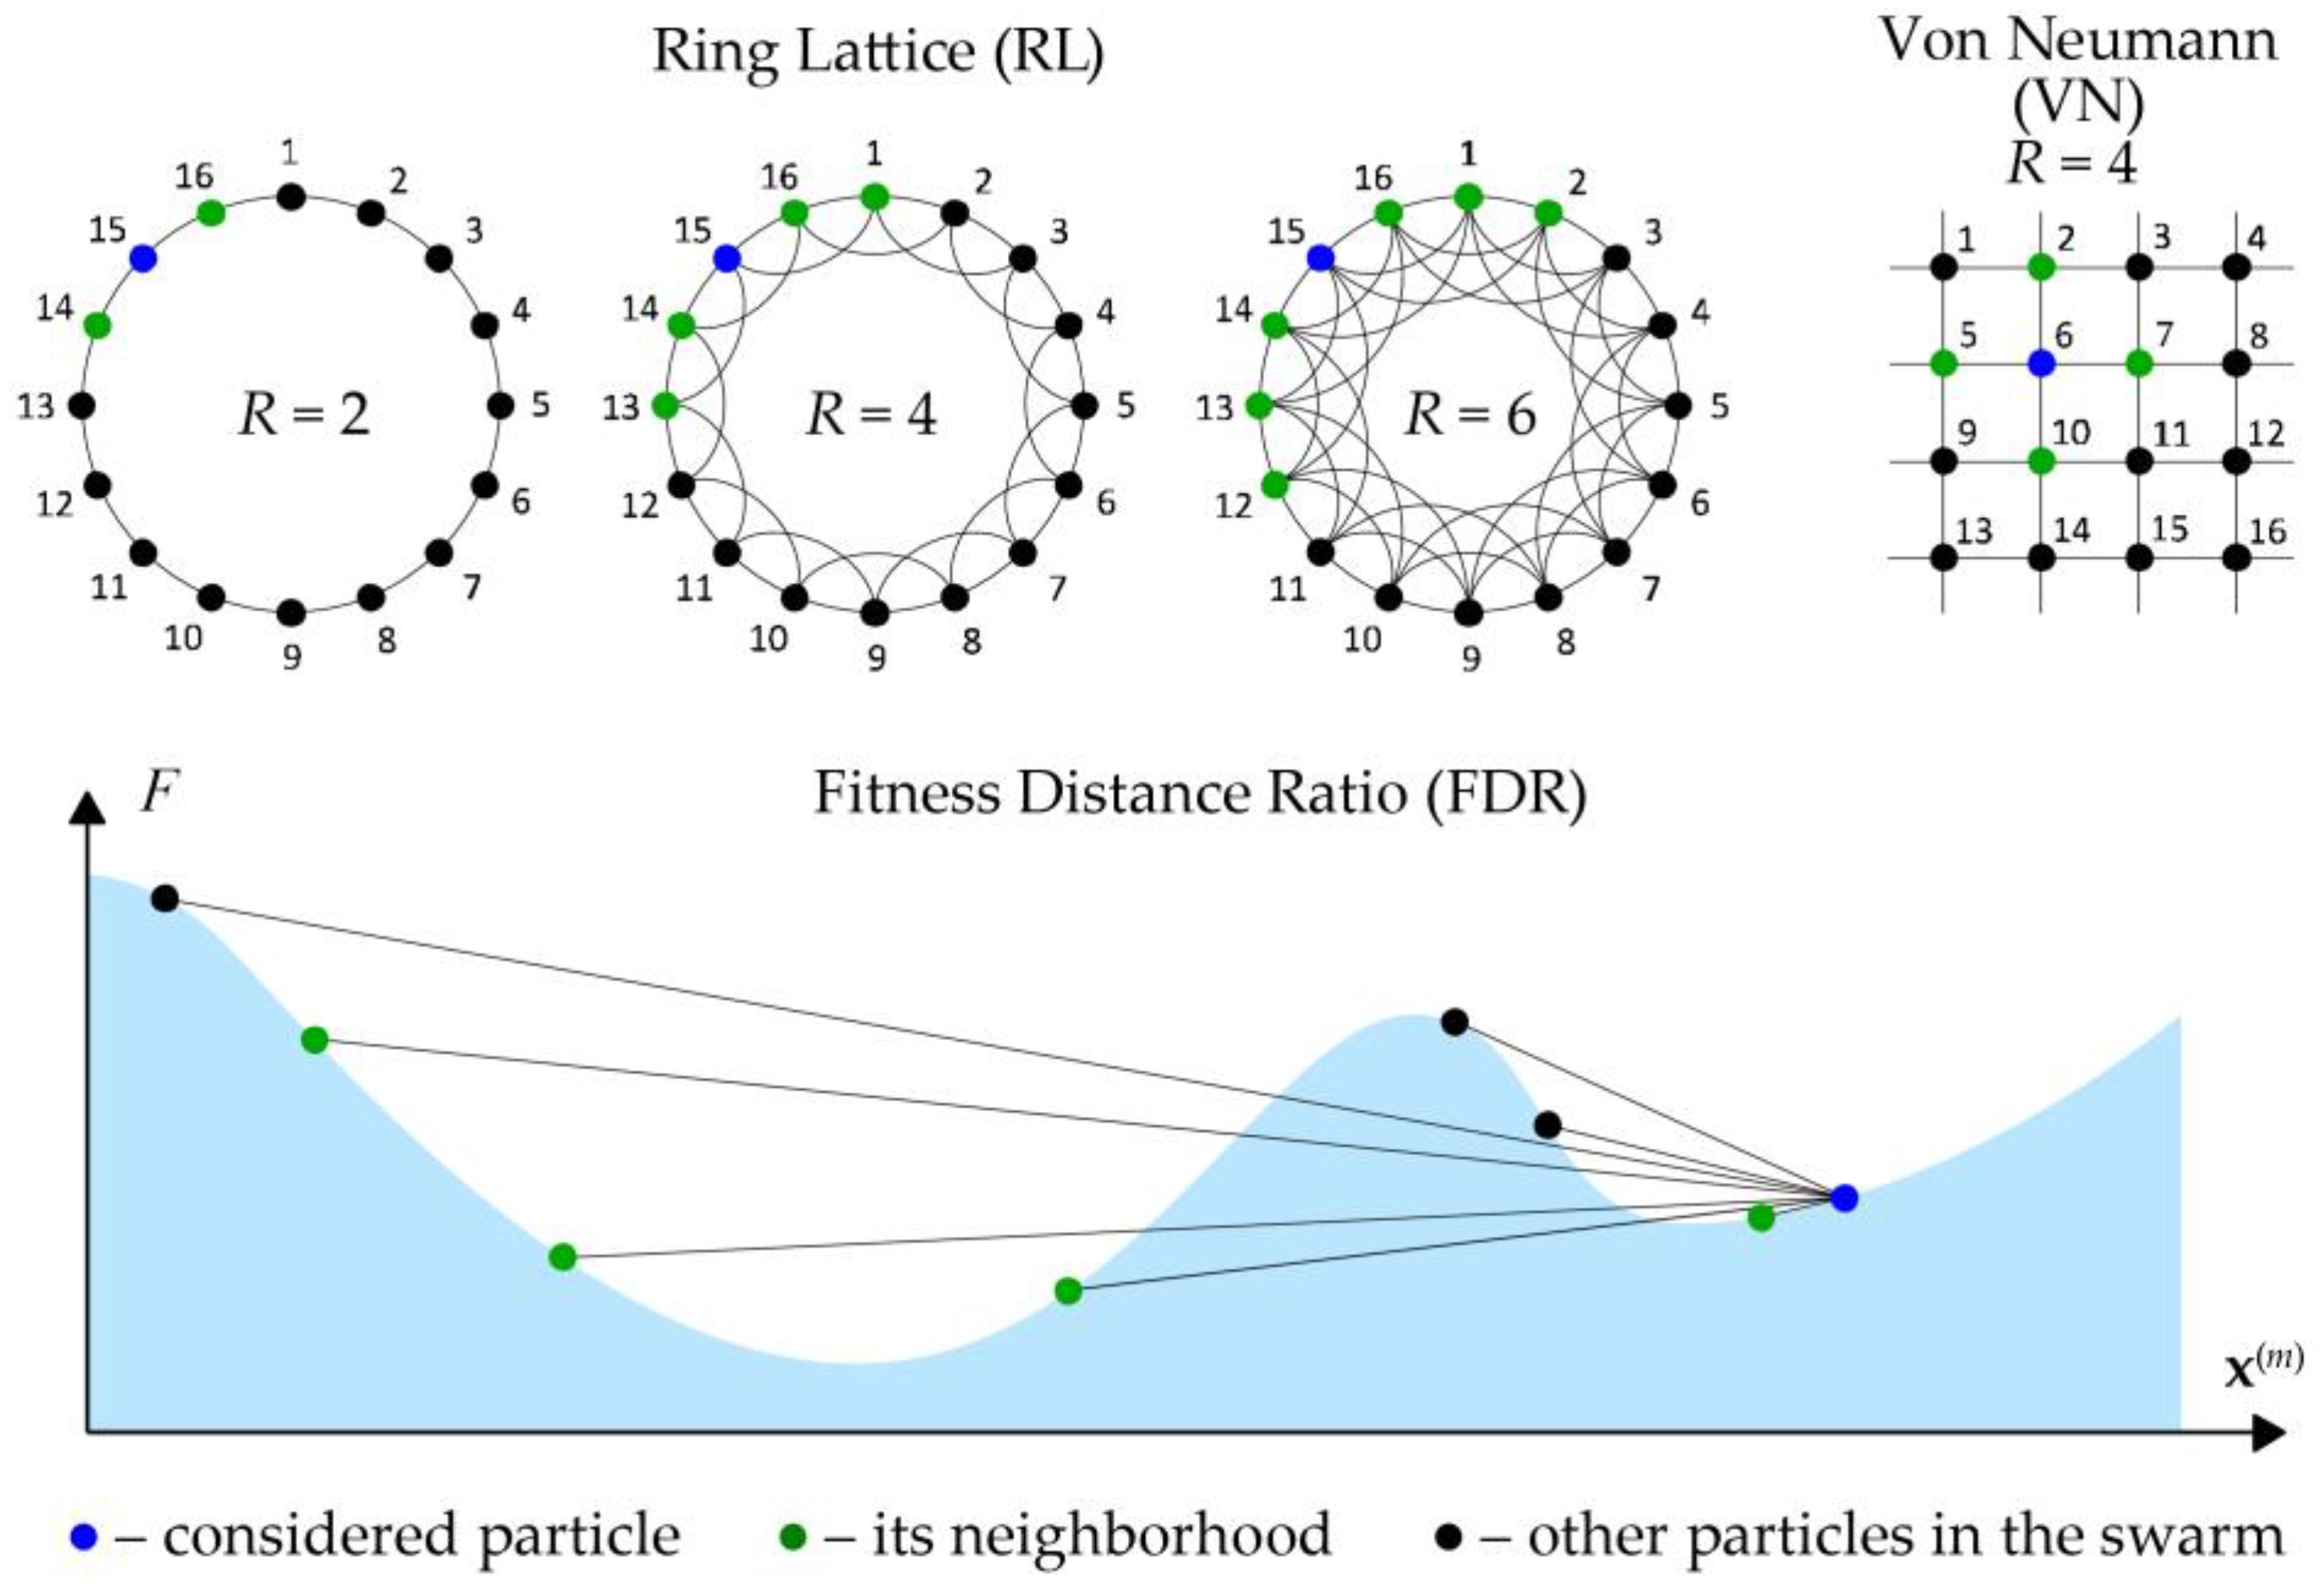
A static neighborhood is defined once, before starting the algorithm. For each particle in the swarm, we define a set S containing R other particles, and during the operation of the algorithm this set does not change. In the considered algorithm, static neighborhoods with a ring lattice topology of various orders and a two-dimensional von Neumann grid were used (Figure 8) [45,46]. It should be noted that only arbitrarily assigned particle numbers determine inclusion in the neighborhood. Therefore, particles located at opposite ends of the search space may be neighbors, while two other particles located close to each other will not be neighbors.
Unlike a static neighborhood, a dynamic neighborhood is re-established with each iteration of the algorithm. Algorithms based on this type of neighborhood require more computational effort. Currently, the most common type of dynamic neighborhood is the fitness distance ratio (FDR) [45,47]. When selecting the neighborhood of a given particle with position x, it is necessary first to determine the value of the coefficient w for all other particles in the swarm (with positions xn), separately for each m-th dimension of the search space:
w n ( m ) = F x ( m ) F x n ( m ) x ( m ) x n ( m ) .
where x(m) is the m-th element of the vector x, and n is the number of the particle in the swarm, different from the number of the particle for which the neighborhood is determined. Then, R particles with the greatest values of the coefficient w should be included in the neighborhood. The neighborhood is determined for each dimension of the search space separately, so if the neighborhood dimension R equals, for example, 4 and 3 variables are optimized, then each particle has 12 neighbors. Therefore, if the FIPS learning method is used, the R value in the Equation (17) should be additionally multiplied by the number of dimensions of the search space.

3.3.4. Initial Conditions and Constraints

For each of the optimized coefficients a, b, c…, an individual range of values is set within in which a solution is sought. This range is then normalized from 0 to 1, so the search space is a multi-dimensional hypercube with side length 1. The initial swarm of particles, for iteration of the algorithm i = 0, is randomly generated inside this cube. During subsequent iterations of the algorithm, when the particle positions are updated in accordance with the Equation (12), it may happen that some particles leave the assumed search space, i.e., that one or more elements of the vector x reach a value less than 0 or greater than 1. In the considered algorithm this can be avoided by including a rigid position constraint in the search space. Similarly, the maximum speed can be limited by setting the maximum value of the speed vector modulus v. In the case of the initial swarm (for i = 0), it is possible to choose whether the initial speed is to be zero (v = 04×1) or random.

3.3.5. Convergence and Stability

Each particle has a position and velocity that are dependent on each other. Accordingly, each particle is a dynamic system. Thus, a swarm composed of interrelated particles is also a dynamic system. Thus, the problem of stability arises [43,45]. The dynamic properties of the particle, and indirectly of the swarm, are determined by the value of the cognition factor φ and the constriction coefficient χ. In [43], it is stated that for the constriction coefficient χ associated with the cognition factor φ with Equation (14), the swarm loses stability for φ less than about 4, and the exact stability limit value depends on the applied cognition method, swarm topology and applied speed and position constraints. When the swarm is unstable, then with subsequent iterations of the algorithm, its particles move away from each other at an exponential rate, and their speeds increase in a similar way. Therefore, the algorithm is not able to converge. When the algorithm converges, then with subsequent iterations, the particle speeds, and the distances between them asymptotically decrease to zero.

3.4. Optimization and Simulation Results

During the research, many numerical and laboratory experiments were carried out, selected results of which are presented below.

3.4.1. OCV Characteristic Approximation

PSO optimization was performed for 7 OCV approximation functions, Beta function (4), Tremblay function (5), Tremblay2 function (6), LEE function (7) and PolyEXP function (8), and for 3 different polynomial degrees: 3, 5, and 7.
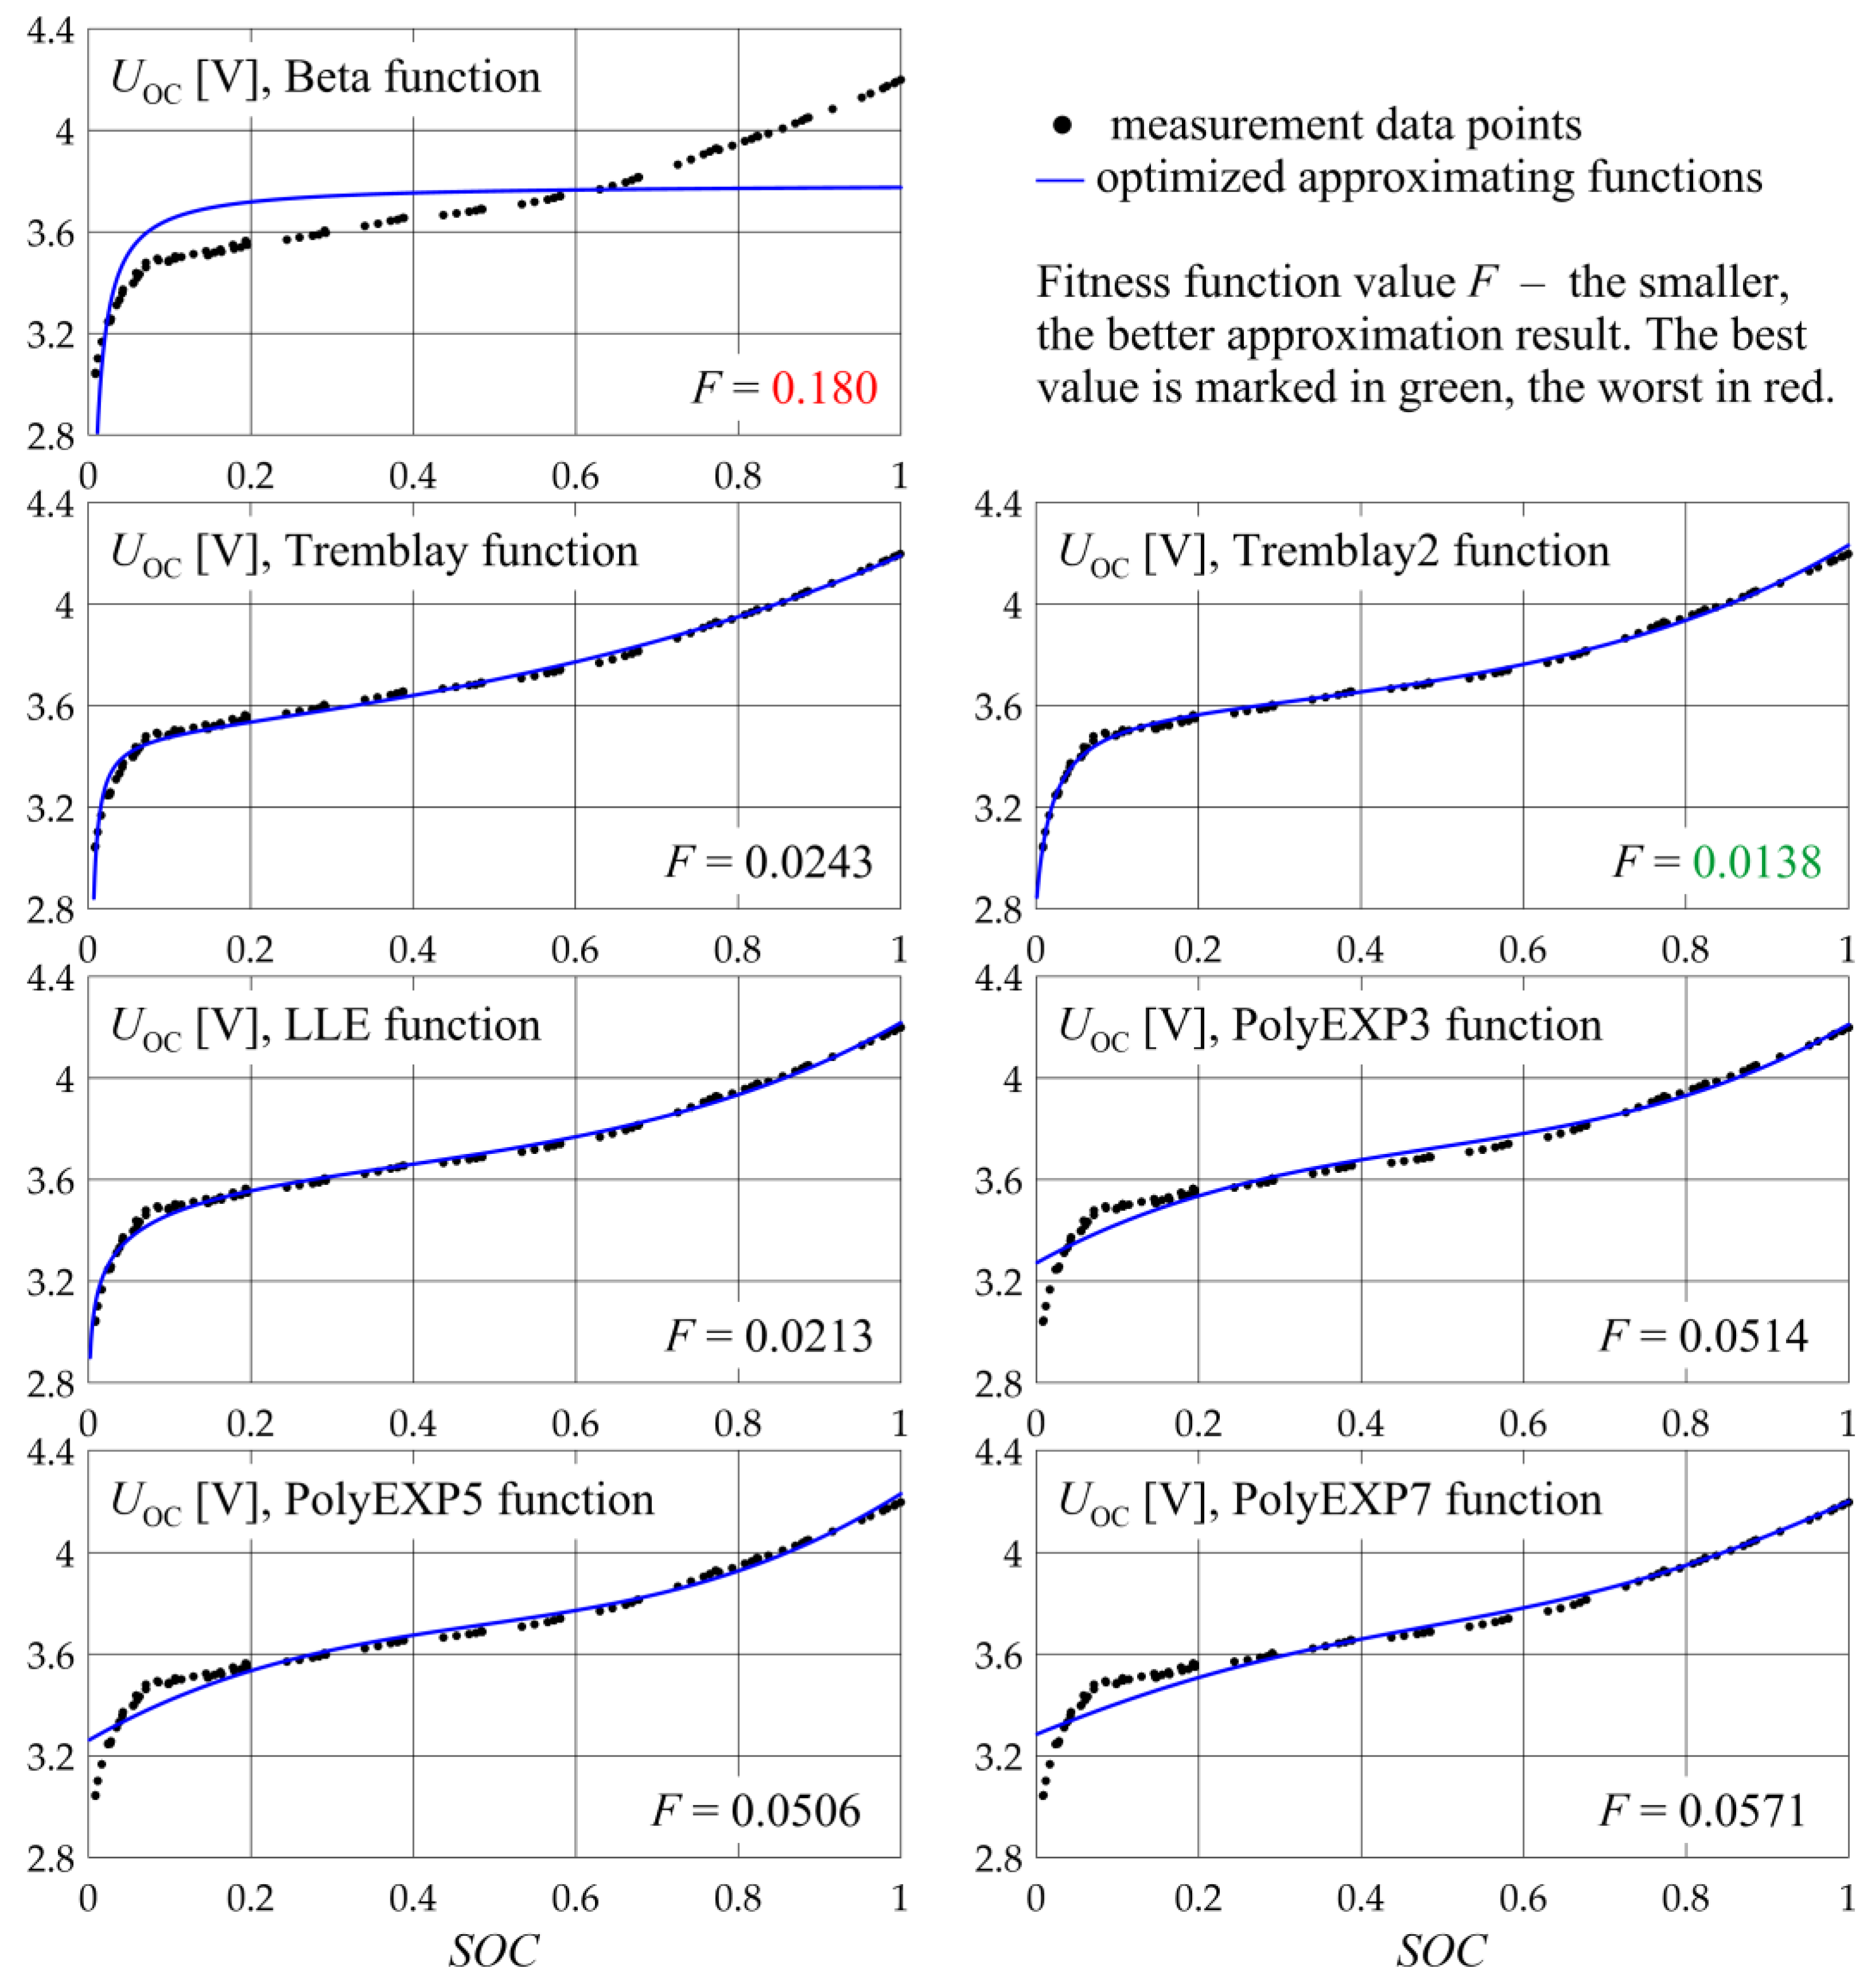
For each function, the optimization was carried out many times, in search of the optimal settings of the PSO algorithm. The best results obtained are shown in Figure 9 and Table 2.
The values of the optimized fitness function (10) given in Table 2 and repeated in Figure 9 are also a measure of the quality of the approximation of the OCV characteristic. The smallest (best) F value was obtained for the Tremblay2 function. Important information from a practical point of view are the limits of the search space given in Table 2 for each of the optimized parameters a, b, c... By carrying out many optimization attempts, these limits were selected so that they were wide enough that the optimal solution always fell within their scope. On the other hand, they are narrow enough so that the search space is not excessively vast, which would hinder the operation of the algorithm, causing that finding the minimum of the objective function and obtaining convergence would require more iterations. The complexity of the optimization task can be assessed on the basis of the calculation duration given in Table 2. The time is given as a relative value, in relation to the smallest one obtained. For example, Table 2 shows that the LEE function took about five times longer to obtain than the Beta function.
The given time values should be treated as approximate because the calculation time, apart from the PSO algorithm itself, is also affected by other tasks performed by the computer’s operating system.
The evaluation of the optimization results presented in Table 2 and Figure 9, carried out from the point of view of the cell model, are included in Section 4.

3.4.2. HPPC Pulses Approximation

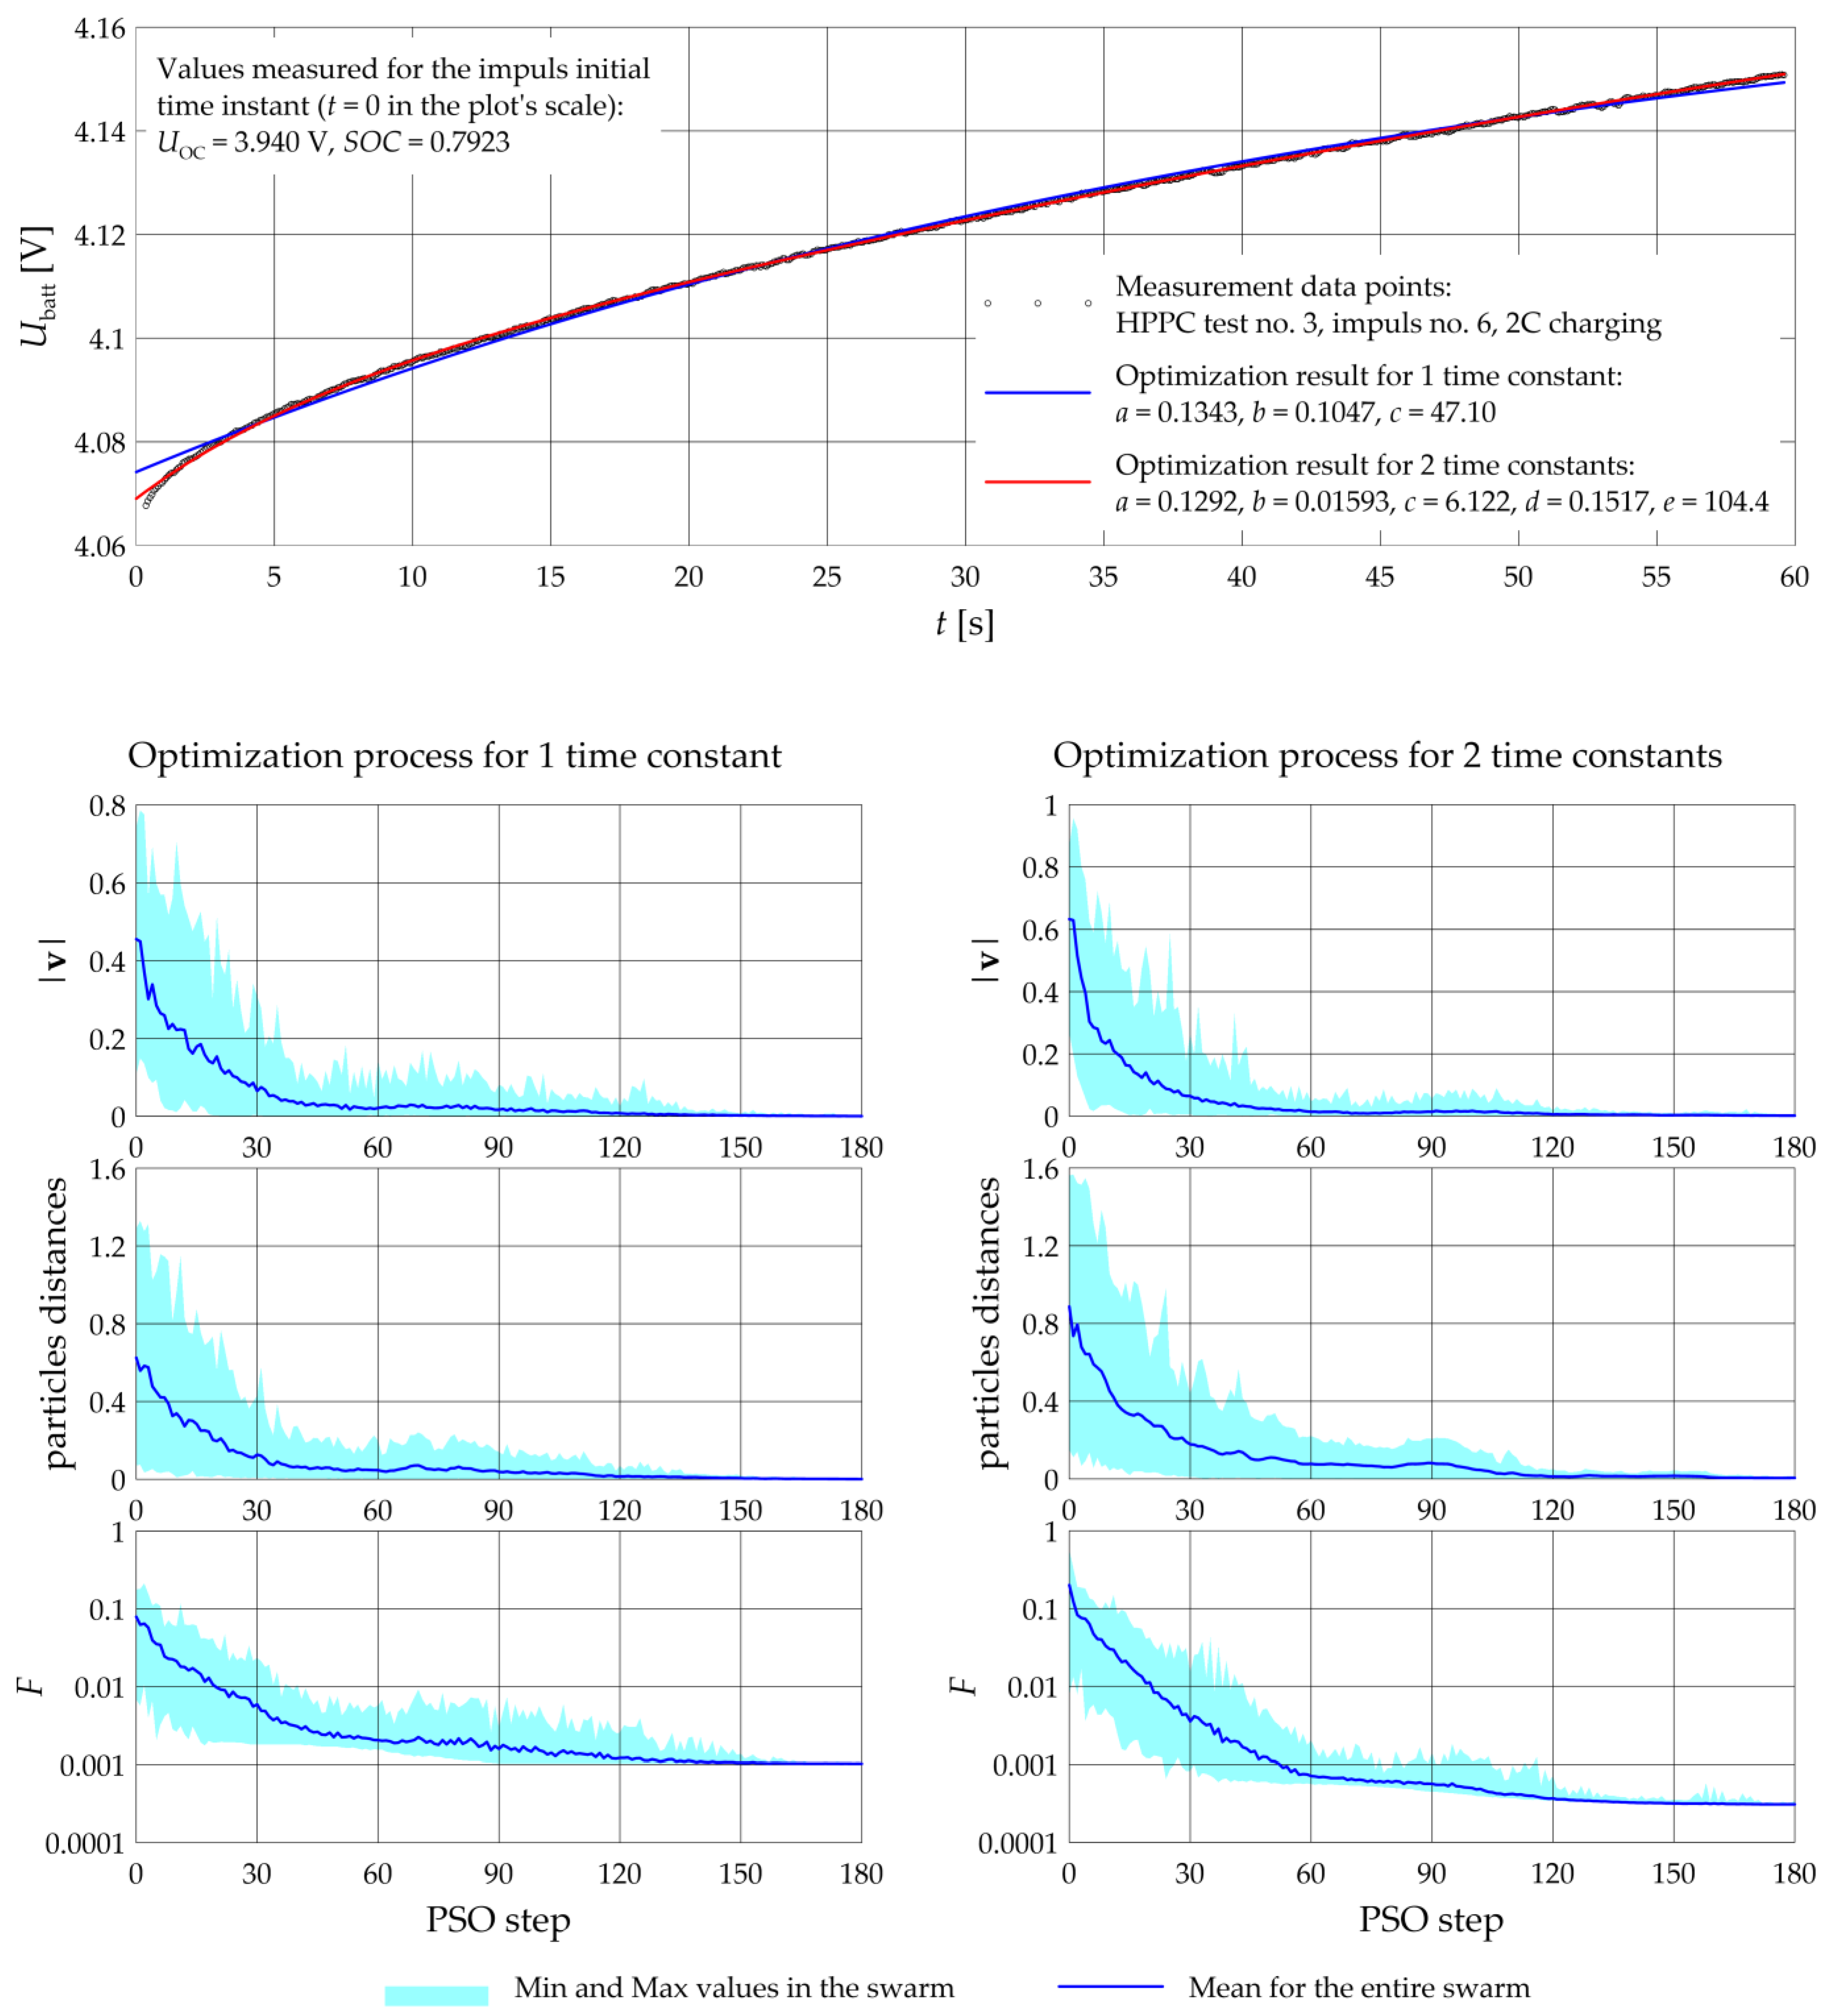
Optimization of the coefficients of the function (9), describing the transient of the HPPC pulse voltage, was carried out in 2 stages. First, for a few selected impulses, initial optimizations were carried out in search of the best settings of the PSO algorithm. Subsequently, two series of optimizations were performed for all pulses, the first series for one time constant in the Thevenin model and the second series for two time constants. The PSO algorithm settings were the same within each series, except for the search space limits, which were adjusted to the internal impedance of the cell that changes with the SOC. A total number of 96 pulses were optimized in each series. Although 15 HPPC tests with 8 pulses each were performed—giving a total of 120—for some pulses (charging for SOC ≈ 1 and discharging for SOC ≈ 0) these were rejected due to distortion by the CC/CV mechanism. Sample optimization results for pulse no. 6 from the HPPC test no. 3 are shown in Figure 10.
Figure 10 also shows graphs illustrating the course of the optimization process. There are maximum, average, and minimum values of the speeds v of the particles in the swarm, the distance between the particles in the swarm, and the values of the fitness function F. These values show when the PSO algorithm converges. Convergence is reached when the speed of the particles drops to zero, which means that the particles stop traversing the search space. When the distances between them also drop to zero, it means that all the particles have gathered at one point in space, corresponding to the minimum found. PSO statistics for both optimization series are summarized in Table 3.
The data presented in Table 3 show that for the approximation of the HPPC pulse with the two-exponential function, smaller (better) values of the objective function F were obtained. This means that the two-time-constant Thevenin model reflects the dynamic properties of the real cell much better. In particular, the median and mean values of the fitness function over the entire series are two times lower for two-time-constant case.

3.4.3. Simulations Compared to Measurements

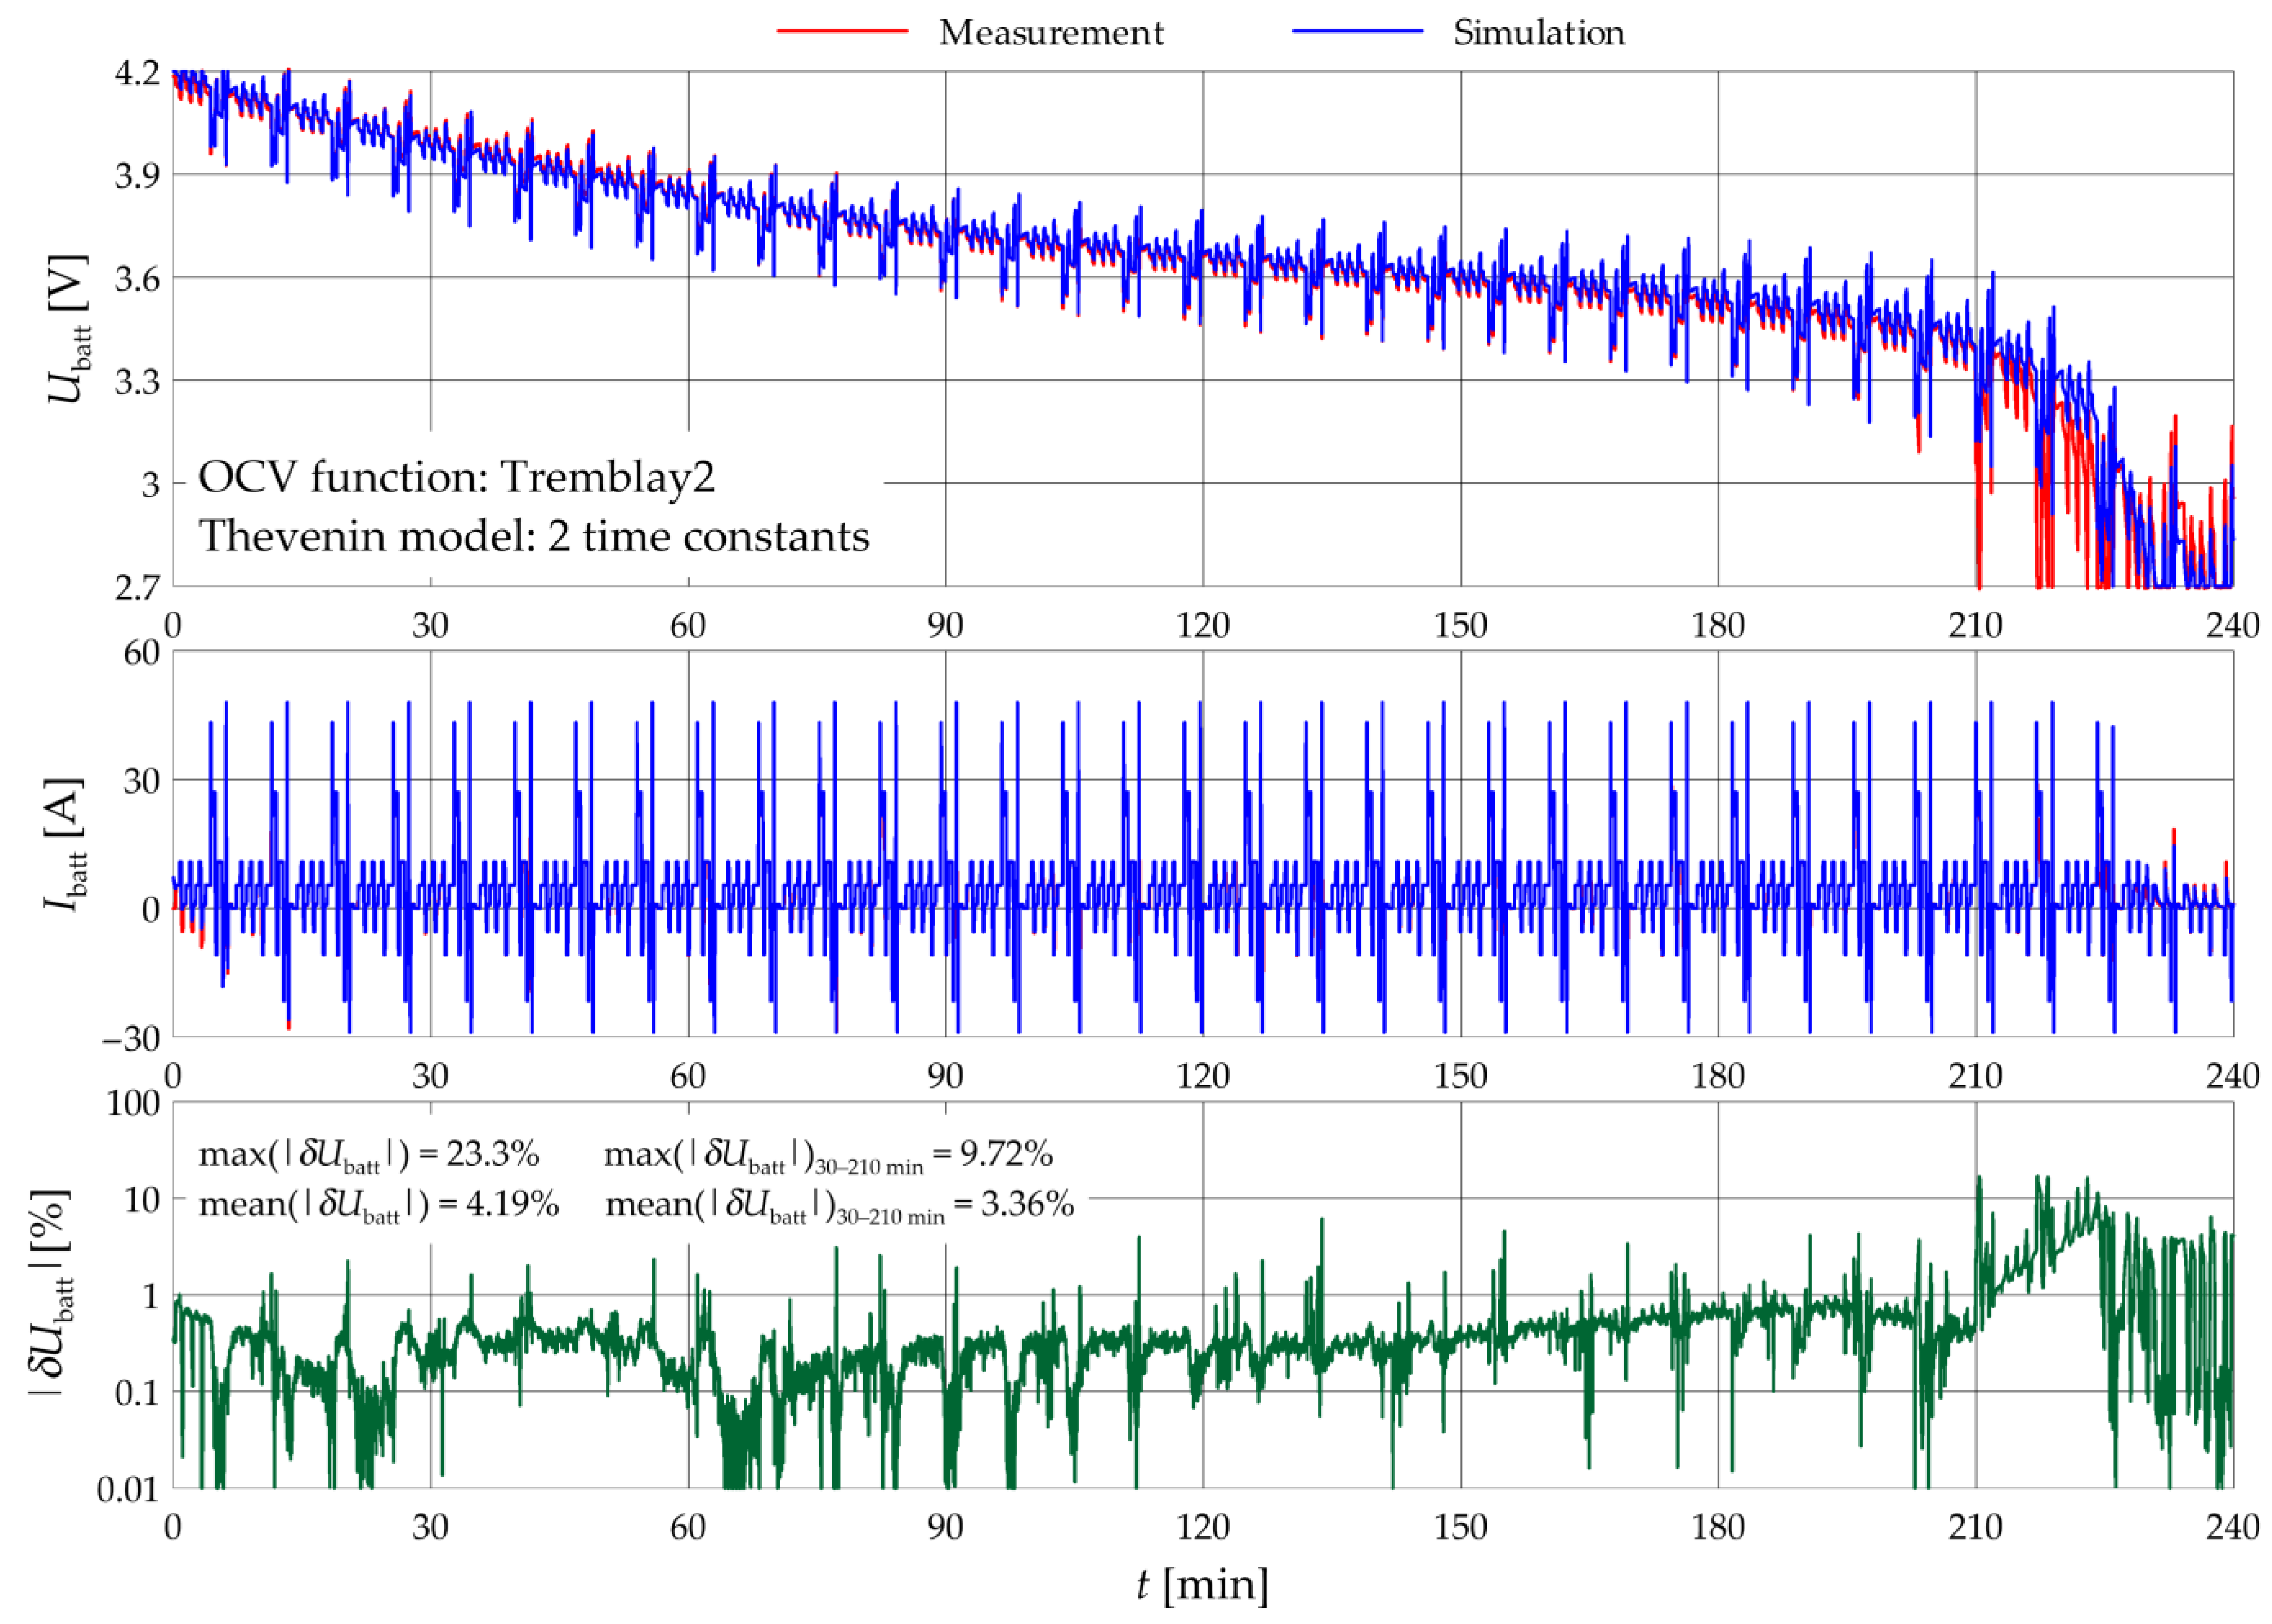
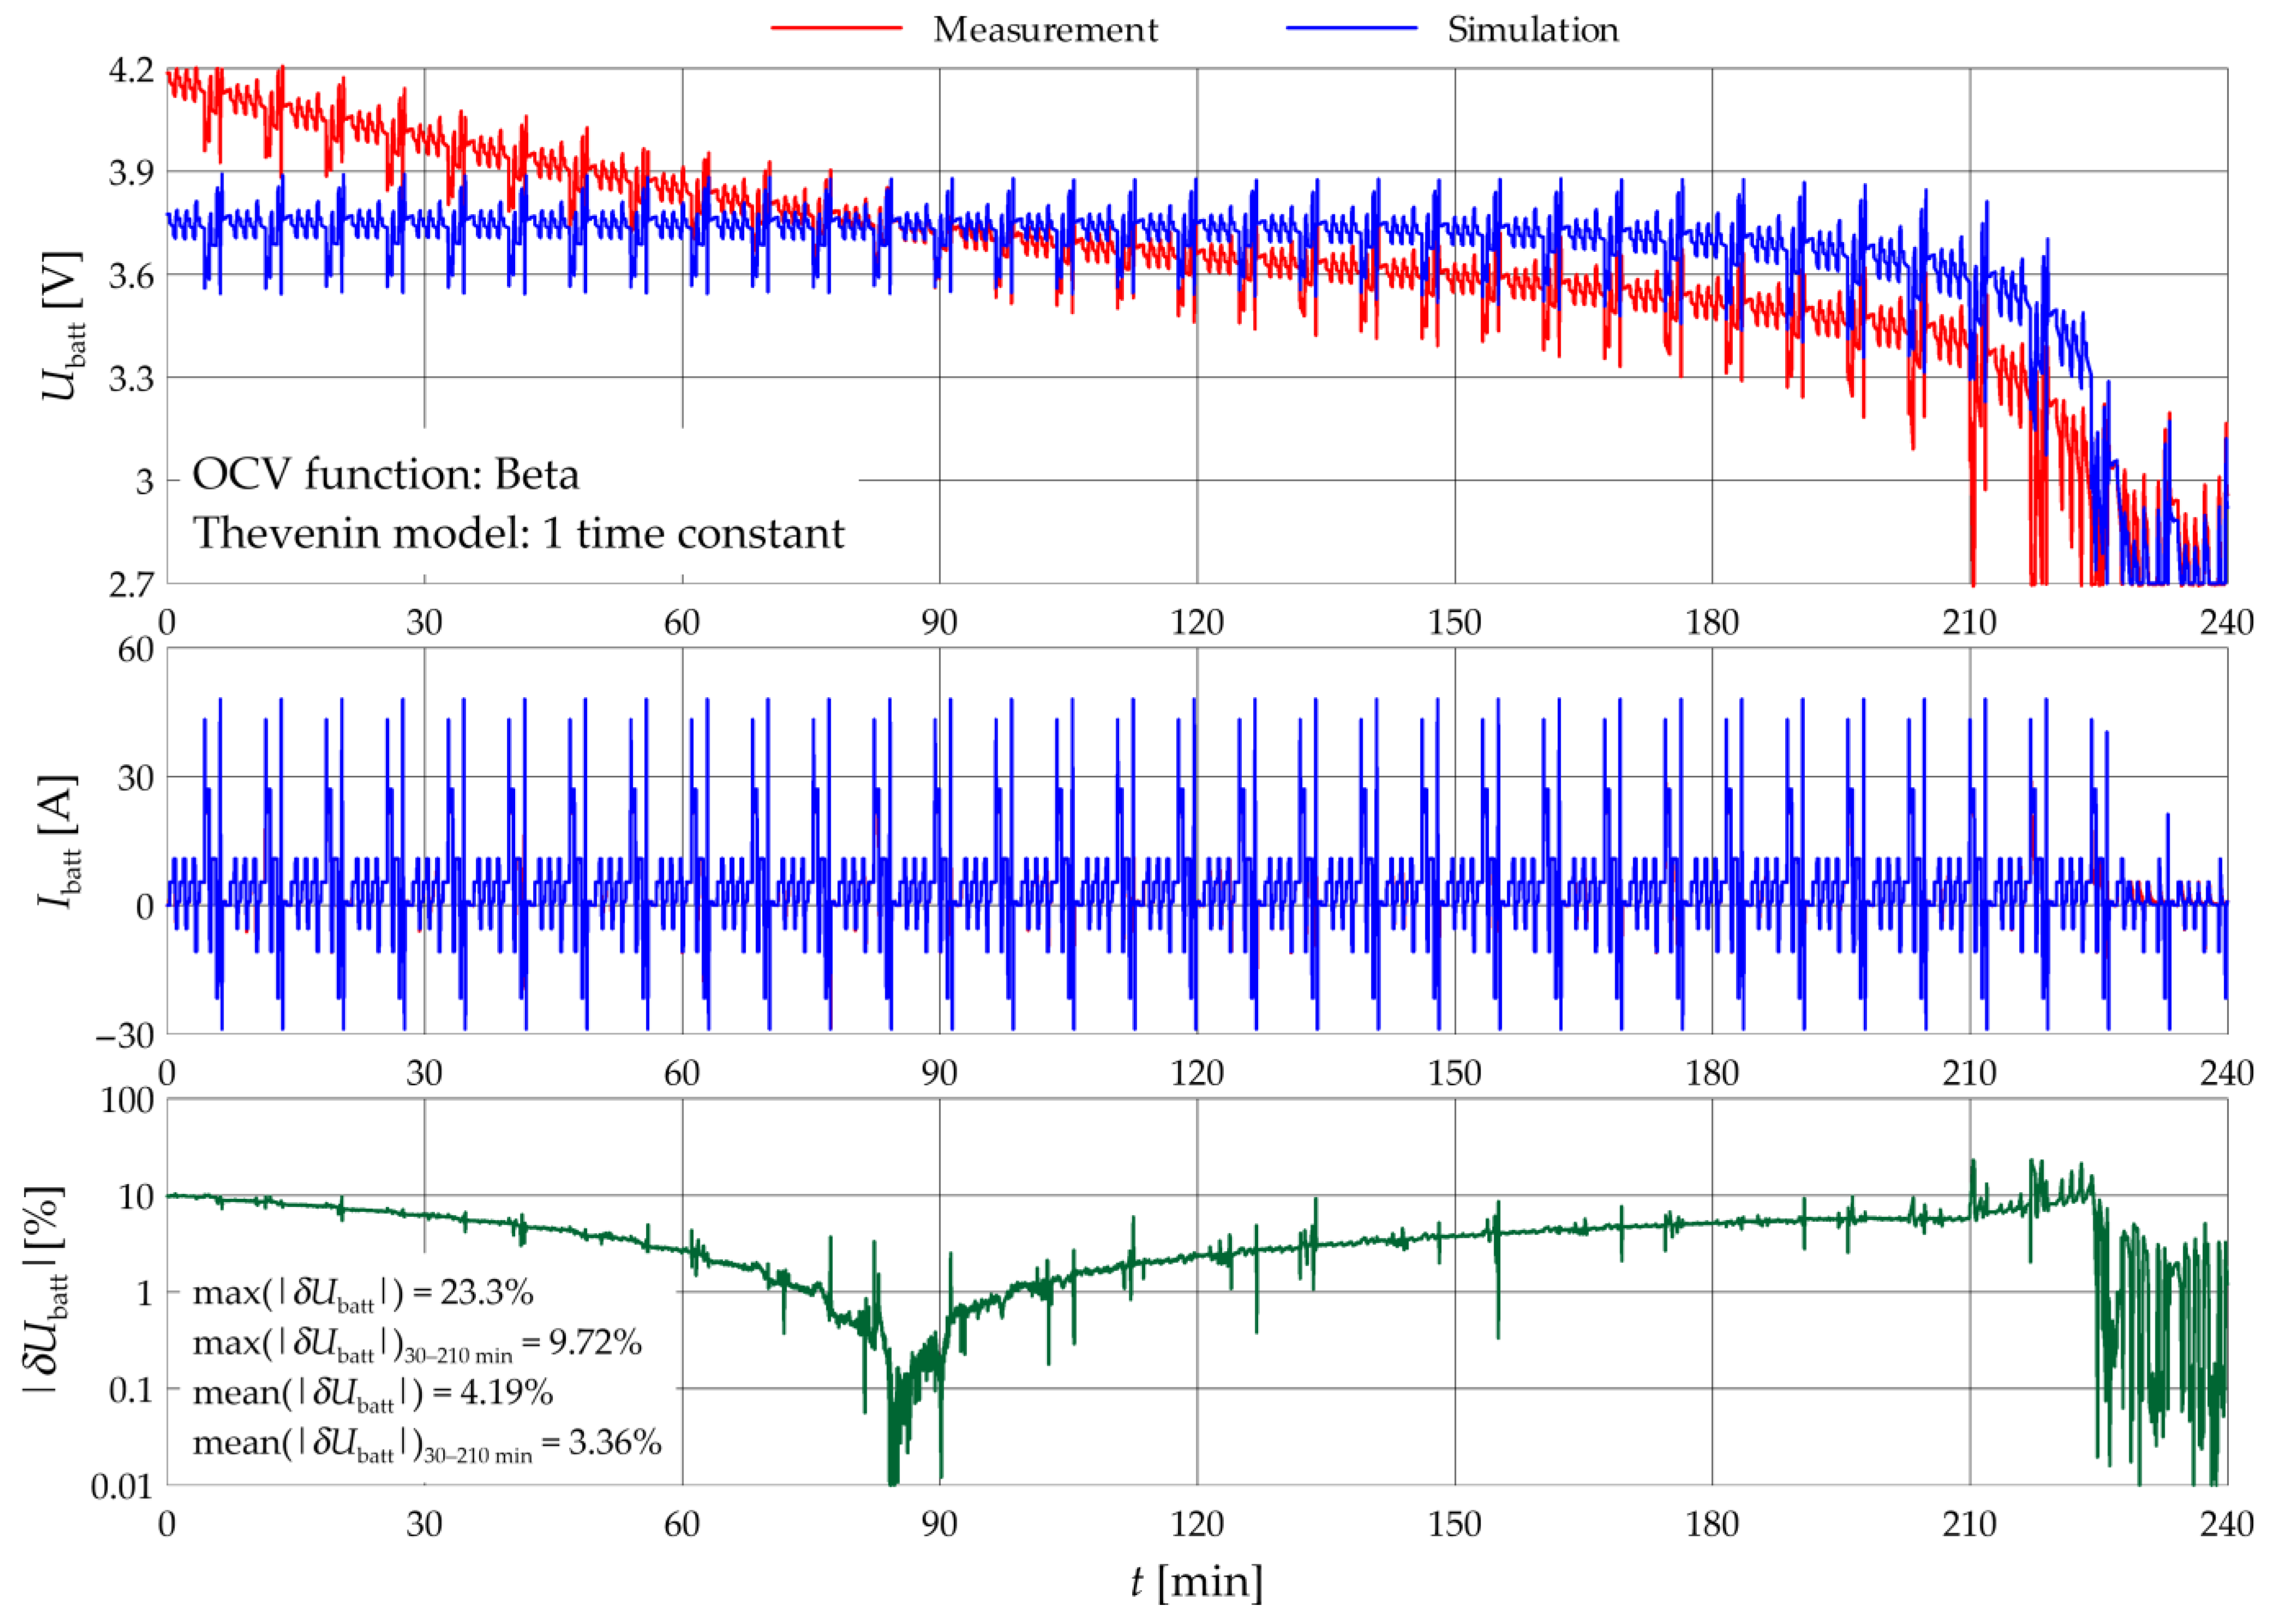
Optimization results, OCV function and parameters of Thevenin’s model were introduced to a simulation model simulating the operating conditions of the cell during the CDC laboratory test. A series of 14 simulations were carried out for seven OCV functions and two versions of the Thevenin model, with one and two time constants. Waveforms obtained for two chosen simulations are shown in Figure 11 and Figure 12. All 14 simulation are summarized in Table 4.
The voltage relative error δUbatt is a simulation voltage error calculated in reference to the measured one. Table 4 and Figure 11 and Figure 12 show the average and maximum error values calculated over the entire simulation time, as well as those calculated for the time period from 30 to 210 min. Values limited to this time interval better reflect the practical usefulness of the simulation model because they ignore the interval in which the battery is fully charged and fully discharged. In practice, the battery operates in these states relatively rarely, and the identified characteristics of the model are burdened with the greatest deviations for these states, overestimating the simulation errors.

4. Discussion

In the tests carried out, the PSO algorithm showed high flexibility and quality of operation sufficient to create a simulation model that accurately reflects the real working conditions of the battery cell.
The optimization task for the algorithm more difficult the more variables are optimized, which requires the use of more advanced cognition methods, topologies, and increasing both the number of particles in the swarm and the number of steps in the algorithm. This can be seen in the results presented in Table 2. For the Beta function, which has only two parameters, the best results were obtained using the simplest GB cognition method and a relatively small number of particles in the swarm (36). The use of more advanced methods and a larger number of particles did not improve the quality of the obtained results. In general, the research conducted showed that the Beta function, although the easiest to parameterize, reflects the shape of the OCV characteristic of the cell the worst. The best optimization results were obtained for the Tremblay2 function, which, despite having five parameters, turned out to be relatively easy to parameterize. Achieving a reasonably good effect for its original version (Tremblay) required the use of the most complex FDR swarm topology, which results in the longest computation time. Experiments with the optimization of the PolyEXP function confirmed its main disadvantage described in the literature, i.e., the tendency to oscillate around the measurement characteristic. Increasing the degree of the polynomial did not improve the situation here, additionally making the optimization more difficult by increasing the number of optimized variables.
Optimization identification of time constants of the Thevenin model (9) required increasing the number of algorithm steps to 180, compared to 120 for OCV characteristics (Table 3). The case in which two time constants are identified required increasing the number of particles in the swarm from 36 (for 1 time constant) to 64, and the topology order from 4 to 8, forcing closer cooperation of particles in the swarm. The identified model with two time constants better reflects the real properties of the cell, which comes from smaller errors obtained in all simulations for this model, compared to the simulations carried out for one time constant (Table 4).
The best simulation results were obtained for the OCV functions Tremblay, Tremblay2 and LLE, and the Thevenin model with two time constants. Table 4 shows that the smallest maximum value of the voltage mean square error was obtained for the Tremblay2 and LLE functions. However, in the limited working interval (30–210 min), in which the working area of the cell with the smallest and largest SOC values was omitted, the Tremblay function turned out to be the best. Table 4 also shows that from the point of view of the precision of the simulation model, the most important is a good representation of the OCV characteristics, and the choice between a model with one or two time constants has a lesser impact on the simulation results. Indeed, this comes from the fact that in Table 4, the results obtained for different OCV functions differ more than the results obtained for the same function but with a different number of time constants of the model.

5. Conclusions

Among the examined functions approximating the OCV characteristics of the cell, the best representation is provided by the Tremblay2 function, slightly ahead of the LLE function in this respect. The parameters of both functions are relatively easy to select with the proposed method based on PSO, with the settings given in Table 2. Therefore, the authors can recommend their use. The proposed optimization method turned out to be ineffective when selecting the polynomial approximation parameters with the PolyEXP function. Therefore, the possible use of this function in practice requires the development of better methods for its parameterization.
Thevenin’s model with two RC pairs turned out to be more accurate than the one-pair model. On the other hand, the number of time constants included has less influence on the accuracy of the cell model than the precise representation of the OCV characteristic. Therefore, the use of a model with one time constant is a good compromise between the quality and complexity of the model, especially since the identification of two time constants is more difficult and requires higher settings of the optimization algorithm.
The applied PSO method enabled obtaining good quality results, but its disadvantage, and thus the factor limiting its application, is the time-consuming calculations. A full series of optimizations for 96 HPPC pulses took a total of several hours. However, it should be noted that this is significantly less than the time required to perform this series of tests in the laboratory.

Author Contributions

Conceptualization, T.B. and R.N.; methodology, T.B. and R.N.; software, T.B.; validation, T.B., R.N. and W.K.; formal analysis, T.B.; investigation, T.B., R.N. and W.K.; resources, T.B., R.N. and W.K.; data curation, T.B.; writing—original draft preparation, T.B.; writing—review and editing, T.B., R.N. and W.K.; visualization, T.B.; supervision, W.K.; project administration, W.K.; funding acquisition, W.K. All authors have read and agreed to the published version of the manuscript.

Funding

This project was co-financed by the European Regional Development Fund in accordance with the contract POIR.01.01.01-00-1427/20-0.

Data Availability Statement

Not applicable.

Acknowledgments

The authors would like to acknowledge the help of Katarzyna Lota and Kamil Frączek (Łukasiewicz Research Network—Institute of Non-Ferrous Metals) in supplying cells for the research.

Conflicts of Interest

The authors declare no conflict of interest.

References

  1. Shi, J.; Guo, H.; Chen, D. Parameter identification method for lithium-ion batteries based on recursive least square with sliding window difference forgetting factor. J. Energy Storage 2021, 44, 103485. [Google Scholar] [CrossRef]
  2. Stroe, D.I.; Swierczynski, M.; Stroe, A.I.; Knudsen Kær, S. Generalized Characterization Methodology for Performance Modelling of Lithium-Ion Batteries. Batteries 2016, 2, 37. [Google Scholar] [CrossRef]
  3. Davis, K.; Hayes, J.G. Comparison of Lithium-Ion Battery Pack Models Based on Test Data from Idaho and Argonne National Laboratories. In Proceedings of the IEEE Energy Conversion Congress and Exposition (ECCE), Detroit, MI, USA, 11–15 October 2020; pp. 5626–5632. [Google Scholar] [CrossRef]
  4. Rahmoun, A.; Biechl, H. Modelling of li-ion batteries using equivalent circuit diagrams. Electr. Rev. 2012, 2, 152–156. [Google Scholar]
  5. Tremblay, O.; Dessaint, L.; Dekkiche, A. A Generic Battery Model for the Dynamic Simulation of Hybrid Electric Vehicles. In Proceedings of the IEEE Vehicle Power and Propulsion Conference, Arlington, TX, USA, 9–12 September 2007; pp. 274–279. [Google Scholar] [CrossRef]
  6. Cipin, R.; Toman, M.; Prochazka, P.; Pazdera, I. Identification of Li-ion Battery Model Parameters. In Proceedings of the International Conference on Electrical Drives & Power Electronics (EDPE), The High Tatras, Slovakia, 24–26 September 2019; pp. 225–229. [Google Scholar] [CrossRef]
  7. Chen, S.X.; Tseng, K.J.; Choi, S.S. Modeling of Lithium-Ion Battery for Energy Storage System Simulation. In Proceedings of the Asia-Pacific Power and Energy Engineering Conference, Wuhan, China, 28–30 March 2009; pp. 1–4. [Google Scholar] [CrossRef]
  8. Huang, K.; Wang, Y.; FENG, J. Research on equivalent circuit Model of Lithium-ion battery for electric vehicles. In Proceedings of the 3rd World Conference on Mechanical Engineering and Intelligent Manufacturing (WCMEIM), Shanghai, China, 4–6 December 2020; pp. 492–496. [Google Scholar] [CrossRef]
  9. He, H.; Xiong, R.; Fan, J. Evaluation of Lithium-Ion Battery Equivalent Circuit Models for State of Charge Estimation by an Experimental Approach. Energies 2011, 4, 582–598. [Google Scholar] [CrossRef]
  10. Sibi Krishnan, K.; Pathiyil, P.; Sunitha, R. Generic Battery model covering self-discharge and internal resistance variation. In Proceedings of the IEEE 6th International Conference on Power Systems (ICPS), New Delhi, India, 4–6 March 2016; pp. 1–5. [Google Scholar] [CrossRef]
  11. Wu, W.; Qin, L.; Wu, G. State of power estimation of power lithium-ion battery based on an equivalent circuit model. J. Energy Storage 2022, 51, 104538. [Google Scholar] [CrossRef]
  12. Li, Z.; Shi, X.; Shi, M.; Wei, C.; Di, F.; Sun, H. Investigation on the Impact of the HPPC Profile on the Battery ECM Parameters’ Offline Identification. In Proceedings of the Asia Energy and Electrical Engineering Symposium (AEEES), Chengdu, China, 28–31 May 2020; pp. 753–757. [Google Scholar] [CrossRef]
  13. Khattak, A.A.; Khan, A.N.; Safdar, M.; Basit, A.; Zaffar, N.A. A Hybrid Electric Circuit Battery Model Capturing Dynamic Battery Characteristics. In Proceedings of the IEEE Kansas Power and Energy Conference (KPEC), Manhattan, KS, USA, 13–14 July 2020; pp. 1–6. [Google Scholar] [CrossRef]
  14. Baczyńska, A.; Niewiadomski, W.; Gonçalves, A.; Almeida, P.; Luís, R. Li-NMC Batteries Model Evaluation with Experimental Data for Electric Vehicle Application. Batteries 2018, 4, 11. [Google Scholar] [CrossRef]
  15. Somakettarin, N.; Funaki, T. Study on Factors for Accurate Open Circuit Voltage Characterizations in Mn-Type Li-Ion Batteries. Batteries 2017, 3, 8. [Google Scholar] [CrossRef]
  16. Gao, Y.; Ji, W.; Zhao, X. SOC Estimation of E-Cell Combining BP Neural Network and EKF Algorithm. Processes 2022, 10, 1721. [Google Scholar] [CrossRef]
  17. Hemi, H.; M’Sirdi, N.K.; Naamane, A.; Ikken, B. Open Circuit Voltage of a Lithium ion Battery Model Adjusted by Data Fitting. In Proceedings of the 6th International Renewable and Sustainable Energy Conference (IRSEC), Rabat, Morocco, 5–8 December 2018; pp. 1–5. [Google Scholar]
  18. Zhang, Q.; Shang, Y.; Li, Y.; Cui, N.; Duan, B.; Zhang, C. A novel fractional variable-order equivalent circuit model and parameter identification of electric vehicle Li-ion batteries. ISA Trans. 2020, 97, 448–457. [Google Scholar] [CrossRef]
  19. Navas, S.J.; Cabello González, G.M.; Pino, F.J.; Guerra, J.J. Modelling Li-ion batteries using equivalent circuits for renewable energy applications. Energy Rep. 2023, 9, 4456–4465. [Google Scholar] [CrossRef]
  20. Wang, J.; Jia, Y.; Yang, N.; Lu, Y.; Shi, M.; Ren, X.; Lu, D. Precise equivalent circuit model for Li-ion battery by experimental improvement and parameter optimization. J. Energy Storage 2022, 52, 104980. [Google Scholar] [CrossRef]
  21. Haghjoo, Y.; Khaburi, D.A. Modeling, simulation, and parameters identification of a lithium-ion battery used in electric vehicles. In Proceedings of the 9th Iranian Conference on Renewable Energy & Distributed Generation (ICREDG), Mashhad, Iran, 23–24 February 2022; pp. 1–7. [Google Scholar] [CrossRef]
  22. Yu, Q.; Wan, C.; Li, J.; E, L.; Zhang, X.; Huang, Y.; Liu, T. An Open Circuit Voltage Model Fusion Method for State of Charge Estimation of Lithium-Ion Batteries. Energies 2021, 14, 1797. [Google Scholar] [CrossRef]
  23. Gao, L.; Liu, S.; Dougal, R.A. Dynamic lithium-ion battery model for system simulation. IEEE Trans. Compon. Packag. Technol. 2002, 25, 495–505. [Google Scholar] [CrossRef]
  24. Wen, F.; Duan, B.; Zhang, C.; Zhu, R.; Shang, Y.; Zhang, J. High-Accuracy Parameter Identification Method for Equivalent-Circuit Models of Lithium-Ion Batteries Based on the Stochastic Theory Response Reconstruction. Electronics 2019, 8, 834. [Google Scholar] [CrossRef]
  25. Feng, D.; Huang, J.; Jin, P.; Chen, H.; Wang, A.; Zheng, M. Parameter Identification and Dynamic Simulation of Lithium-Ion Power Battery Based on DP Model. In Proceedings of the 14th IEEE Conference on Industrial Electronics and Applications (ICIEA), Xi’an, China, 19–21 June 2019; pp. 1275–1279. [Google Scholar] [CrossRef]
  26. Baccouche, I.; Jemmali, S.; Manai, B.; Omar, N.; Amara, N.E.B. Improved OCV Model of a Li-Ion NMC Battery for Online SOC Estimation Using the Extended Kalman Filter. Energies 2017, 10, 764. [Google Scholar] [CrossRef]
  27. Pillai, P.; Sundaresan, S.; Kumar, P.; Pattipati, K.R.; Balasingam, B. Open-Circuit Voltage Models for Battery Management Systems: A Review. Energies 2022, 15, 6803. [Google Scholar] [CrossRef]
  28. Wang, C.; Xu, M.; Zhang, Q.; Feng, J.; Jiang, R.; Wei, Y.; Liu, Y. Parameters identification of Thevenin model for lithium-ion batteries using self-adaptive Particle Swarm Optimization Differential Evolution algorithm to estimate state of charge. J. Energy Storage 2021, 44, 103244. [Google Scholar] [CrossRef]
  29. Tran, M.K.; Mathew, M.; Janhunen, S.; Panchal, S.; Raahemifar, K.; Fraser, R.; Fowler, M. A comprehensive equivalent circuit model for lithium-ion batteries, incorporating the effects of state of health, state of charge, and temperature on model parameters. J. Energy Storage 2021, 43, 103252. [Google Scholar] [CrossRef]
  30. Deng, S.D.; Liu, S.Y.; Wang, L.; Xia, L.L.; Chen, L. An improved second-order electrical equivalent modeling method for the online high power Li-ion battery state of charge estimation. In Proceedings of the IEEE 12th Energy Conversion Congress & Exposition—Asia (ECCE-Asia), Singapore, 24–27 May 2021; pp. 1725–1729. [Google Scholar] [CrossRef]
  31. Parthasarathy, C.; Laaksonen, H.; Halagi, P. Characterisation and Modelling Lithium Titanate Oxide Battery Cell by Equivalent Circuit Modelling Technique. In Proceedings of the IEEE PES Innovative Smart Grid Technologies—Asia (ISGT Asia), Brisbane, Australia, 5–8 December 2021; pp. 1–5. [Google Scholar] [CrossRef]
  32. Nemes, R.; Ciornei, S.; Ruba, M.; Hedesiu, H.; Martis, C. Modeling and simulation of first-order Li-Ion battery cell with experimental validation. In Proceedings of the 8th International Conference on Modern Power Systems (MPS), Cluj-Napoca, Romania, 21–23 May 2019; pp. 1–6. [Google Scholar] [CrossRef]
  33. Nemes, R.O.; Ciornei, S.M.; Ruba, M.; Martis, C. Parameters identification using experimental measurements for equivalent circuit Lithium-Ion cell models. In Proceedings of the 11th International Symposium on Advanced Topics in Electrical Engineering (ATEE), Bucharest, Romania, 28–30 March 2019; pp. 1–6. [Google Scholar] [CrossRef]
  34. Tang, A.; Gong, P.; Li, J.; Zhang, K.; Zhou, Y.; Zhang, Z. A State-of-Charge Estimation Method Based on Multi-Algorithm Fusion. World Electr. Veh. J. 2022, 13, 70. [Google Scholar] [CrossRef]
  35. Jarrraya, I.; Degaa, L.; Rizoug, N.; Chabchoub, M.H.; Trabelsi, H. Comparison study between hybrid Nelder-Mead particle swarm optimization and open circuit voltage—Recursive least square for the battery parameters estimation. J. Energy Storage 2022, 50, 104424. [Google Scholar] [CrossRef]
  36. Mueller, K.; Schwiederik, E.; Tittel, D. Analysis of parameter identification methods for electrical Li-Ion battery modelling. In Proceedings of the World Electric Vehicle Symposium and Exhibition (EVS27), Barcelona, Spain, 17–20 November 2013; pp. 1–9. [Google Scholar] [CrossRef]
  37. Jamali, S.; Eftekhari, A. PSO-Vegas: Algorytm Vegas z poprawioną PSO. Electr. Rev. 2011, 87, 199–203. [Google Scholar]
  38. Shaheen, A.M.; Hamida, M.A.; El-Sehiemy, R.A.; Elattar, E.E. Optimal parameter identification of linear and non-linear models for Li-Ion Battery Cells. Energy Rep. 2021, 7, 7170–7185. [Google Scholar] [CrossRef]
  39. Pizarro-Carmona, V.; Castano-Solís, S.; Cortés-Carmona, M.; Fraile-Ardanuy, J.; Jimenez-Bermejo, G. GA-based approach to optimize an equivalent electric circuit model of a Li-ion battery-pack. Expert Syst. Appl. 2021, 172, 114647. [Google Scholar] [CrossRef]
  40. Hamida, M.A.; El-Sehiemy, R.A.; Ginidi, A.R.; Elattar, E.; Shaheen, A.M. Parameter identification and state of charge estimation of Li-Ion batteries used in electric vehicles using artificial hummingbird optimizer. J. Energy Storage 2022, 51, 104535. [Google Scholar] [CrossRef]
  41. Huang, Y.; Li, Y.; Jiang, L.; Qiao, X.; Cao, Y.; Yu, J. Research on Fitting Strategy in HPPC Test for Li-ion battery. In Proceedings of the IEEE Sustainable Power and Energy Conference (iSPEC), Beijing, China, 21–23 November 2019; pp. 1776–1780. [Google Scholar] [CrossRef]
  42. Castanho, D.; Guerreiro, M.; Silva, L.; Eckert, J.; Antonini Alves, T.; Tadano, Y.d.S.; Stevan, S.L., Jr.; Siqueira, H.V.; Corrêa, F.C. Method for SoC Estimation in Lithium-Ion Batteries Based on Multiple Linear Regression and Particle Swarm Optimization. Energies 2022, 15, 6881. [Google Scholar] [CrossRef]
  43. Poli, R.; Kennedy, J.; Blackwell, T. Particle swarm optimization: An overview. Swarm Intell 2007, 1, 33–57. [Google Scholar] [CrossRef]
  44. Li, W.; Fan, Y.; Jiang, Q.; Xu, Q. Velocity-Driven Particle Swarm Optimization. In Proceedings of the 8th International Conference on Computing and Pattern Recognition (ICCPR ‘19), Beijing, China, 23–25 October 2019; pp. 9–16. [Google Scholar] [CrossRef]
  45. Cleghorn, C.W.; Engelbrecht, A.P. Fitness-distance-ratio particle swarm optimization: Stability analysis. In Proceedings of the Genetic and Evolutionary Computation Conference (GECCO), Berlin, Germany, 15–19 July 2017; pp. 12–18. [Google Scholar] [CrossRef]
  46. Fernandes, C.M.; Rosa, A.C.; Fachada, N.; Laredo, J.L.J.; Merelo, J.J. Particle swarm and population structure. In Proceedings of the Genetic and Evolutionary Computation Conference Companion (GECCO), Kyoto, Japan, 15–19 July 2018; pp. 85–86. [Google Scholar] [CrossRef]
  47. Peram, T.; Veeramachaneni, K.; Mohan, C.K. Fitness-distance-ratio based particle swarm optimization. In Proceedings of the IEEE Swarm Intelligence Symposium (SIS), Indianapolis, IN, USA, 26 April 2003; pp. 174–181. [Google Scholar] [CrossRef]
  48. Clerc, M.; Kennedy, J. The particle swarm—Explosion, stability, and convergence in a multidimensional complex space. IEEE Trans. Evol. Comput. 2002, 6, 58–73. [Google Scholar] [CrossRef]
  49. Diampovesa, S.; Hubert, A.; Yvars, P.A. Designing physical systems through a model-based synthesis approach. Example of a Li-ion battery for electrical vehicles. Comput. Ind. 2021, 129, 103440. [Google Scholar] [CrossRef]
  50. Skarka, W. Model-Based Design and Optimization of Electric Vehicles. In Proceedings of the 25th ISPE International Conference on Transdisciplinary Engineering, Modena, Italy, 3–6 July 2018; Volume 7, pp. 566–575. [Google Scholar]
  51. Peciak, M.; Skarka, W. Assessment of the Potential of Electric Propulsion for General Aviation Using Model-Based System Engineering (MBSE) Methodology. Aerospace 2022, 9, 74. [Google Scholar] [CrossRef]
  52. Mateja, K.; Skarka, W.; Peciak, M.; Niestrój, R.; Gude, M. Energy Autonomy Simulation Model of Solar Powered UAV. Energies 2023, 16, 479. [Google Scholar] [CrossRef]
  53. Peciak, M.; Skarka, W.; Mateja, K.; Gude, M. Impact Analysis of Solar Cells on Vertical Take-Off and Landing (VTOL) Fixed-Wing UAV. Aerospace 2023, 10, 247. [Google Scholar] [CrossRef]
  54. Niestrój, R.; Rogala, T.; Skarka, W. An Energy Consumption Model for Designing an AGV Energy Storage System with a PEMFC Stack. Energies 2020, 13, 3435. [Google Scholar] [CrossRef]
  55. Belt, J.R. Battery Test Manual for Plug-In Hybrid Electric Vehicles, 2nd ed.; U.S. Department of Energy Vehicle Technologies Program: Idaho Falls, ID, USA, 2010. [CrossRef]
  56. Yang, Z.; Wang, X. An improved parameter identification method considering multi-timescale characteristics of lithium-ion batteries. J. Energy Storage 2023, 59, 106462. [Google Scholar] [CrossRef]
  57. Karimi, D.; Behi, H.; Van Mierlo, J.; Berecibar, M. Equivalent Circuit Model for High-Power Lithium-Ion Batteries under High Current Rates, Wide Temperature Range, and Various State of Charges. Batteries 2023, 9, 101. [Google Scholar] [CrossRef]
  58. Plett, G.L. High-performance battery-pack power estimation using a dynamic cell model. IEEE Trans. Veh. Technol. 2004, 53, 1586–1593. [Google Scholar] [CrossRef]
  59. Marušić, D.; Vašak, M. Efficient Method of Identifying a Li-Ion Battery Model for an Electric Vehicle. In Proceedings of the IEEE 20th International Power Electronics and Motion Control Conference (PEMC), Brasov, Romania, 25–28 September 2022; pp. 421–426. [Google Scholar] [CrossRef]
  60. Guenther, C.; Barillas, J.K.; Stumpp, S.; Danzer, M.A. A dynamic battery model for simulation of battery-to-grid applications. In Proceedings of the 3rd IEEE PES Innovative Smart Grid Technologies Europe (ISGT Europe), Berlin, Germany, 14–17 October 2012; pp. 1–7. [Google Scholar] [CrossRef]
  61. Sörés, M.A.; Hartmann, B. Overview of possible methods of determining self-discharge. In Proceedings of the IEEE International Conference on Environment and Electrical Engineering and IEEE Industrial and Commercial Power Systems Europe (EEEIC/I&CPS Europe), Madrid, Spain, 9–12 June 2020; pp. 1–5. [Google Scholar] [CrossRef]
  62. Zhang, Y.; Lyden, S.; de la Barra, B.A.L.; Haque, M.E. Optimization of Tremblay’s battery model parameters for plug-in hybrid electric vehicle applications. In Proceedings of the Australasian Universities Power Engineering Conference (AUPEC), Melbourne, Australia, 19–22 November 2017; pp. 1–6. [Google Scholar]
  63. Li, R.; Wang, Z.; Yu, J.; Lei, Y.; Zhang, Y.; He, J. Dynamic Parameter Identification of Mathematical Model of Lithium-Ion Battery Based on Least Square Method. In Proceedings of the IEEE International Power Electronics and Application Conference and Exposition (PEAC), Shenzhen, China, 4–7 November 2018; pp. 1–5. [Google Scholar] [CrossRef]
  64. Zhang, R.; Pan, Z. Model Identification of Lithium-Ion Batteries Considering Current-Rate Effects on battery impedance. In Proceedings of the 4th International Conference on Power and Renewable Energy (ICPRE), Chengdu, China, 21–23 September 2019; pp. 305–309. [Google Scholar] [CrossRef]
  65. Einhorn, M.; Conte, V.F.; Kral, C.; Fleig, J.; Permann, R. Parameterization of an electrical battery model for dynamic system simulation in electric vehicles. In Proceedings of the IEEE Vehicle Power and Propulsion Conference, Lille, France, 1–3 September 2010; pp. 1–7. [Google Scholar] [CrossRef]
Figure 1. Research methodology outline.
Energies 16 03995 g001
Figure 2. Laboratory setup and simulation model circuit diagram (a), detailed connection diagram of applied devices (b).
Energies 16 03995 g002
Figure 3. Applied HPPC test profile.
Energies 16 03995 g003
Figure 4. Applied charge depleting cycle (CDC) profile.
Energies 16 03995 g004
Figure 5. Battery cell Thevenin equivalent circuit.
Energies 16 03995 g005
Figure 6. Single (charging) HPPC impulse described with function (9).
Energies 16 03995 g006
Figure 7. PSO configuration options. A question mark denotes selecting one of the options.
Energies 16 03995 g007
Figure 8. Swarm topologies.
Energies 16 03995 g008
Figure 9. OCV characteristics approximated with various functions. Fitness function value is a measure of the approximation accuracy.
Energies 16 03995 g009
Figure 10. Single HPPC impulse approximations with one-time-constant and two-time-constant exponential functions.
Energies 16 03995 g010
Figure 11. The best simulation result.
Energies 16 03995 g011
Figure 12. The worst simulation result.
Energies 16 03995 g012
Table 1. Nominal parameters of the cell used in tests.
TypeKOKAM SLPB78205130H
ChemistryNickel Manganese Cobalt (NMC)
Rated capacity Qn16 Ah
Energy density146 Wh/kg
Dimensions (width/length/thickness)220 mm/132 mm/7.8 mm
Voltage (min./average/max.)2.7 V/3.7 V/4.2 V
Continues current (charge/discharge)48 A (3C *)/128 A (8C *)
Peak discharge current
(max. 10 s at SOC > 50%)
240 A (15C *)
* Battery cell C rating: 1C = 16 A.
Table 2. Summarized optimization results for OCV characteristic functions.
OCV Characteristic Approximating Functions
BetaTremblayTremblay2LLEPolyEXP3PolyEXP5PolyEXP7
Optimization results—function parameters and fitness functiona
[limits]
3.775
[2.5, 4]
3.302
[2.5, 4]
3.563
[2.5, 4]
3.760
[2.5, 4]
3.271
[2.5, 5]
3.261
[2.5, 5]
3.250
[2.5, 5]
b
[limits]
0.9962
[0.9, 1]
0.8931
[0.1, 4]
0.6842
[0.1, 5]
0.1474
[0, 2]
3.564 × 10⁻³
[0, 5]
0
[0, 5]
1.219
[0, 5]
c
[limits]
1.564
[0.1, 5]
2.773
[2, 100]
1.583 × 10⁻⁷
[0, 0.3]
2.783
[0, 5]
2.990
[0, 5]
3.574
[0, 5]
d
[limits]
0.004545
[0, 0.1]
0.01618
[0, 1]
−0.3078
[−0.5, 0.5]
1.768
[−3, 3]
1.823
[−3, 3]
1.170
[−3, 3]
e
[limits]
0.02028
[0, 0.1]
2.618
[0.1, 10]
−2.581
[−3, 3]
−2.475
[−3, 3]
−0.8740
[−3, 3]
f
[limits]
1.102
[0.85, 1.5]
1.749
[−3, 3]
0.8092
[−3, 3]
−1.844
[−3, 3]
g
[limits]
1.366
[−3, 3]
2.736
[−3, 3]
h
[limits]
−0.5519
[−3, 3]
−1.397
[−3, 3]
i
[limits]
0.3985
[−3, 3]
j
[limits]
−0.4576
[−3, 3]
F0.180 10.02430.0138 10.02130.05140.05060.0571
PSO total time
(relative)
158.73.895.065.085.045.10
PSO settingsI120120120120120120120
N36646464100100100
Topology (R)FDR (4)VN (4)RL (6)VN (4)VN (4)VN (4)
Cognition (φ)GB (4.1)LB (4.15)FIPS (4.1)FIPS (4.15)LB (4.25)LB (4.25)LB (4.25)
Constraintsv and xonly xv and xv and xv and xv and xv and x
1 The best value is marked in green, the worst in red.
Table 3. PSO settings and statistics for HPPC impulses approximation.
Thevenin Time Constants Number12
PSO settingsI180180
N3664
Topology (R)VN (4)RL (8)
Cognition (φ)FIPS (4.1)FIPS (4.1)
Constraintsv and xv and x
Fitness function statisticsmin(F) *3.07 × 10−41.73 × 10−4
max(F) *3.84 × 10−32.80 × 10−3
mean(F) *9.87 × 10−44.73 × 10−4
median(F) *7.91 × 10−43.95 × 10−4
* Calculated based on final F values of 96 optimizations.
Table 4. Simulation results summary.
OCV FunctionThevenin Time Constantsmax(|δUbatt|)
[%]
mean(|δUbatt|)
[%]
max(|δUbatt|)30–210 min
[%]
mean(|δUbatt|)30–210 min
[%]
Beta1
2
23.31
23.31
4.191
4.15
9.721
9.42
3.361
3.30
Tremblay1
2
19.4
19.3
0.758
0.684 1
6.14
5.77 1
0.359
0.284 1
Tremblay21
2
17.0
16.9 1
0.771
0.684 1
6.45
6.08
0.466
0.377
LEE1
2
17.0
16.9 1
0.800
0.722
6.69
6.32
0.505
0.420
PolyEXP31
2
18.5
18.2
1.53
1.46
7.22
6.85
0.716
0.671
PolyEXP51
2
17.9
17.6
1.42
1.37
7.08
6.71
0.645
0.620
PolyEXP71
2
19.0
18.6
1.54
1.46
6.72
6.35
0.688
0.635
1 The best values is marked in green, the worst in red.
Disclaimer/Publisher’s Note: The statements, opinions and data contained in all publications are solely those of the individual author(s) and contributor(s) and not of MDPI and/or the editor(s). MDPI and/or the editor(s) disclaim responsibility for any injury to people or property resulting from any ideas, methods, instructions or products referred to in the content.