
Techno-Economic and Carbon Emission Assessment of a Large-Scale Floating Solar PV System for Sustainable Energy Generation in Support of Malaysia’s Renewable Energy Roadmap

 , ,
, ,  , , ,
, , ,  , and
, and 
Abstract
:1. Introduction
1.1. Background
1.2. State of the Art
1.3. Key Contributions
- To find an alternative solution to the challenges of securing land for Large-Scale Solar (LSS) in Malaysia.
- To prepare a case study for the suitability of FSPV systems on the reservoir of UMP Lake.
- To design and simulate an FSPV plant in UMP Lake.
- To assess the capital cost, LCOE for the LSS auction, payback period, CO2 reductions and grid integration.
- To assess the feasibility of the LSS strategy of MyRER.
2. FSPV Technology Overview
2.1. PV Modules
2.2. Support Frame
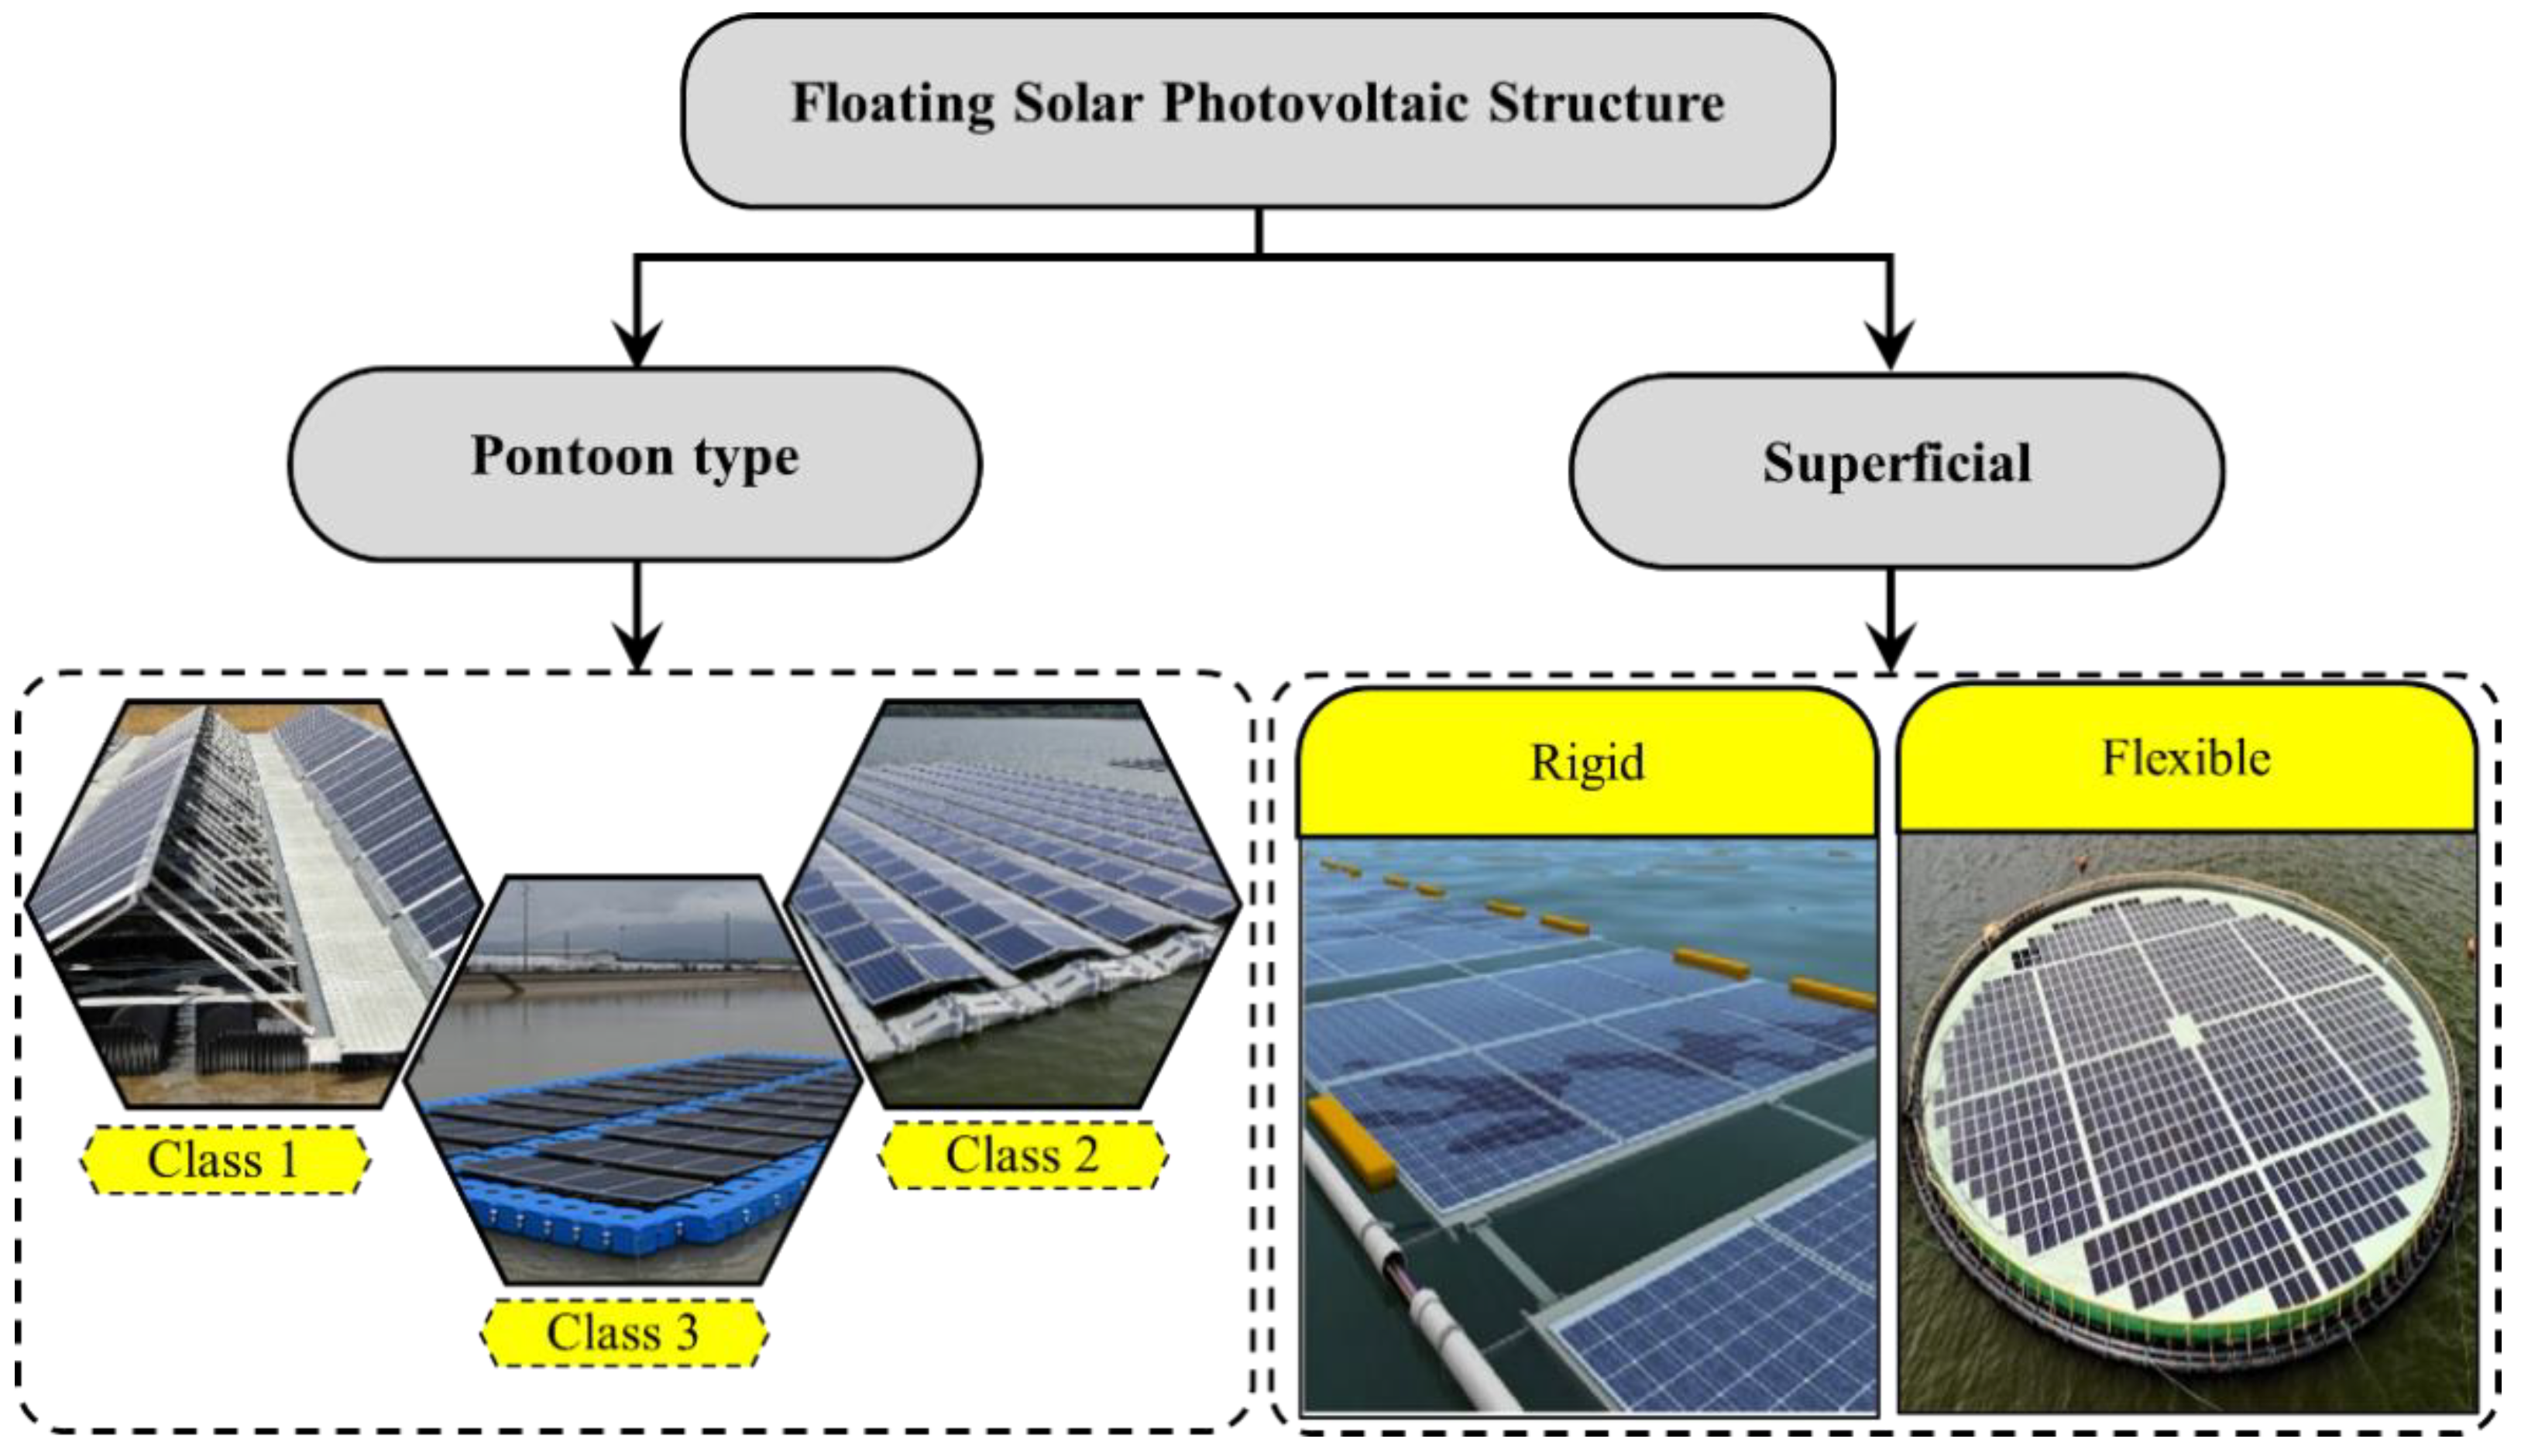
2.3. Floating Structure
2.3.1. Pontoon Type
2.3.2. Superficial
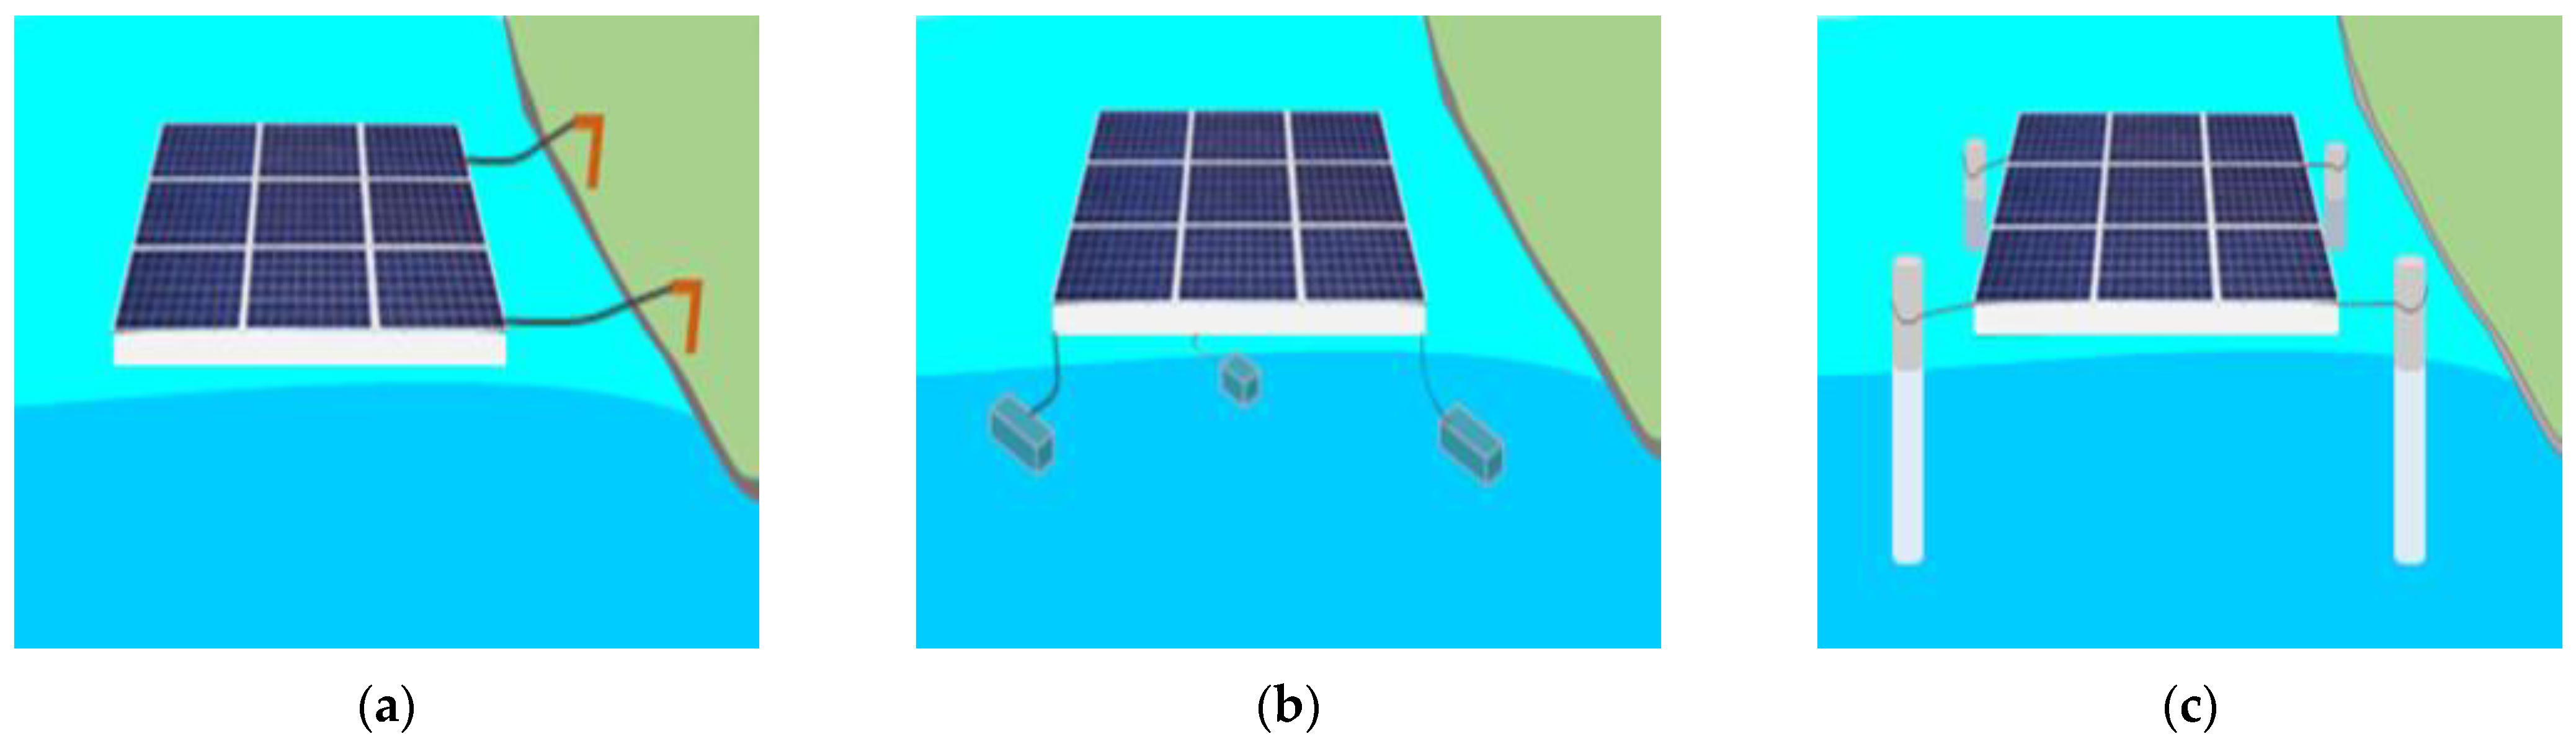
2.4. Mooring System
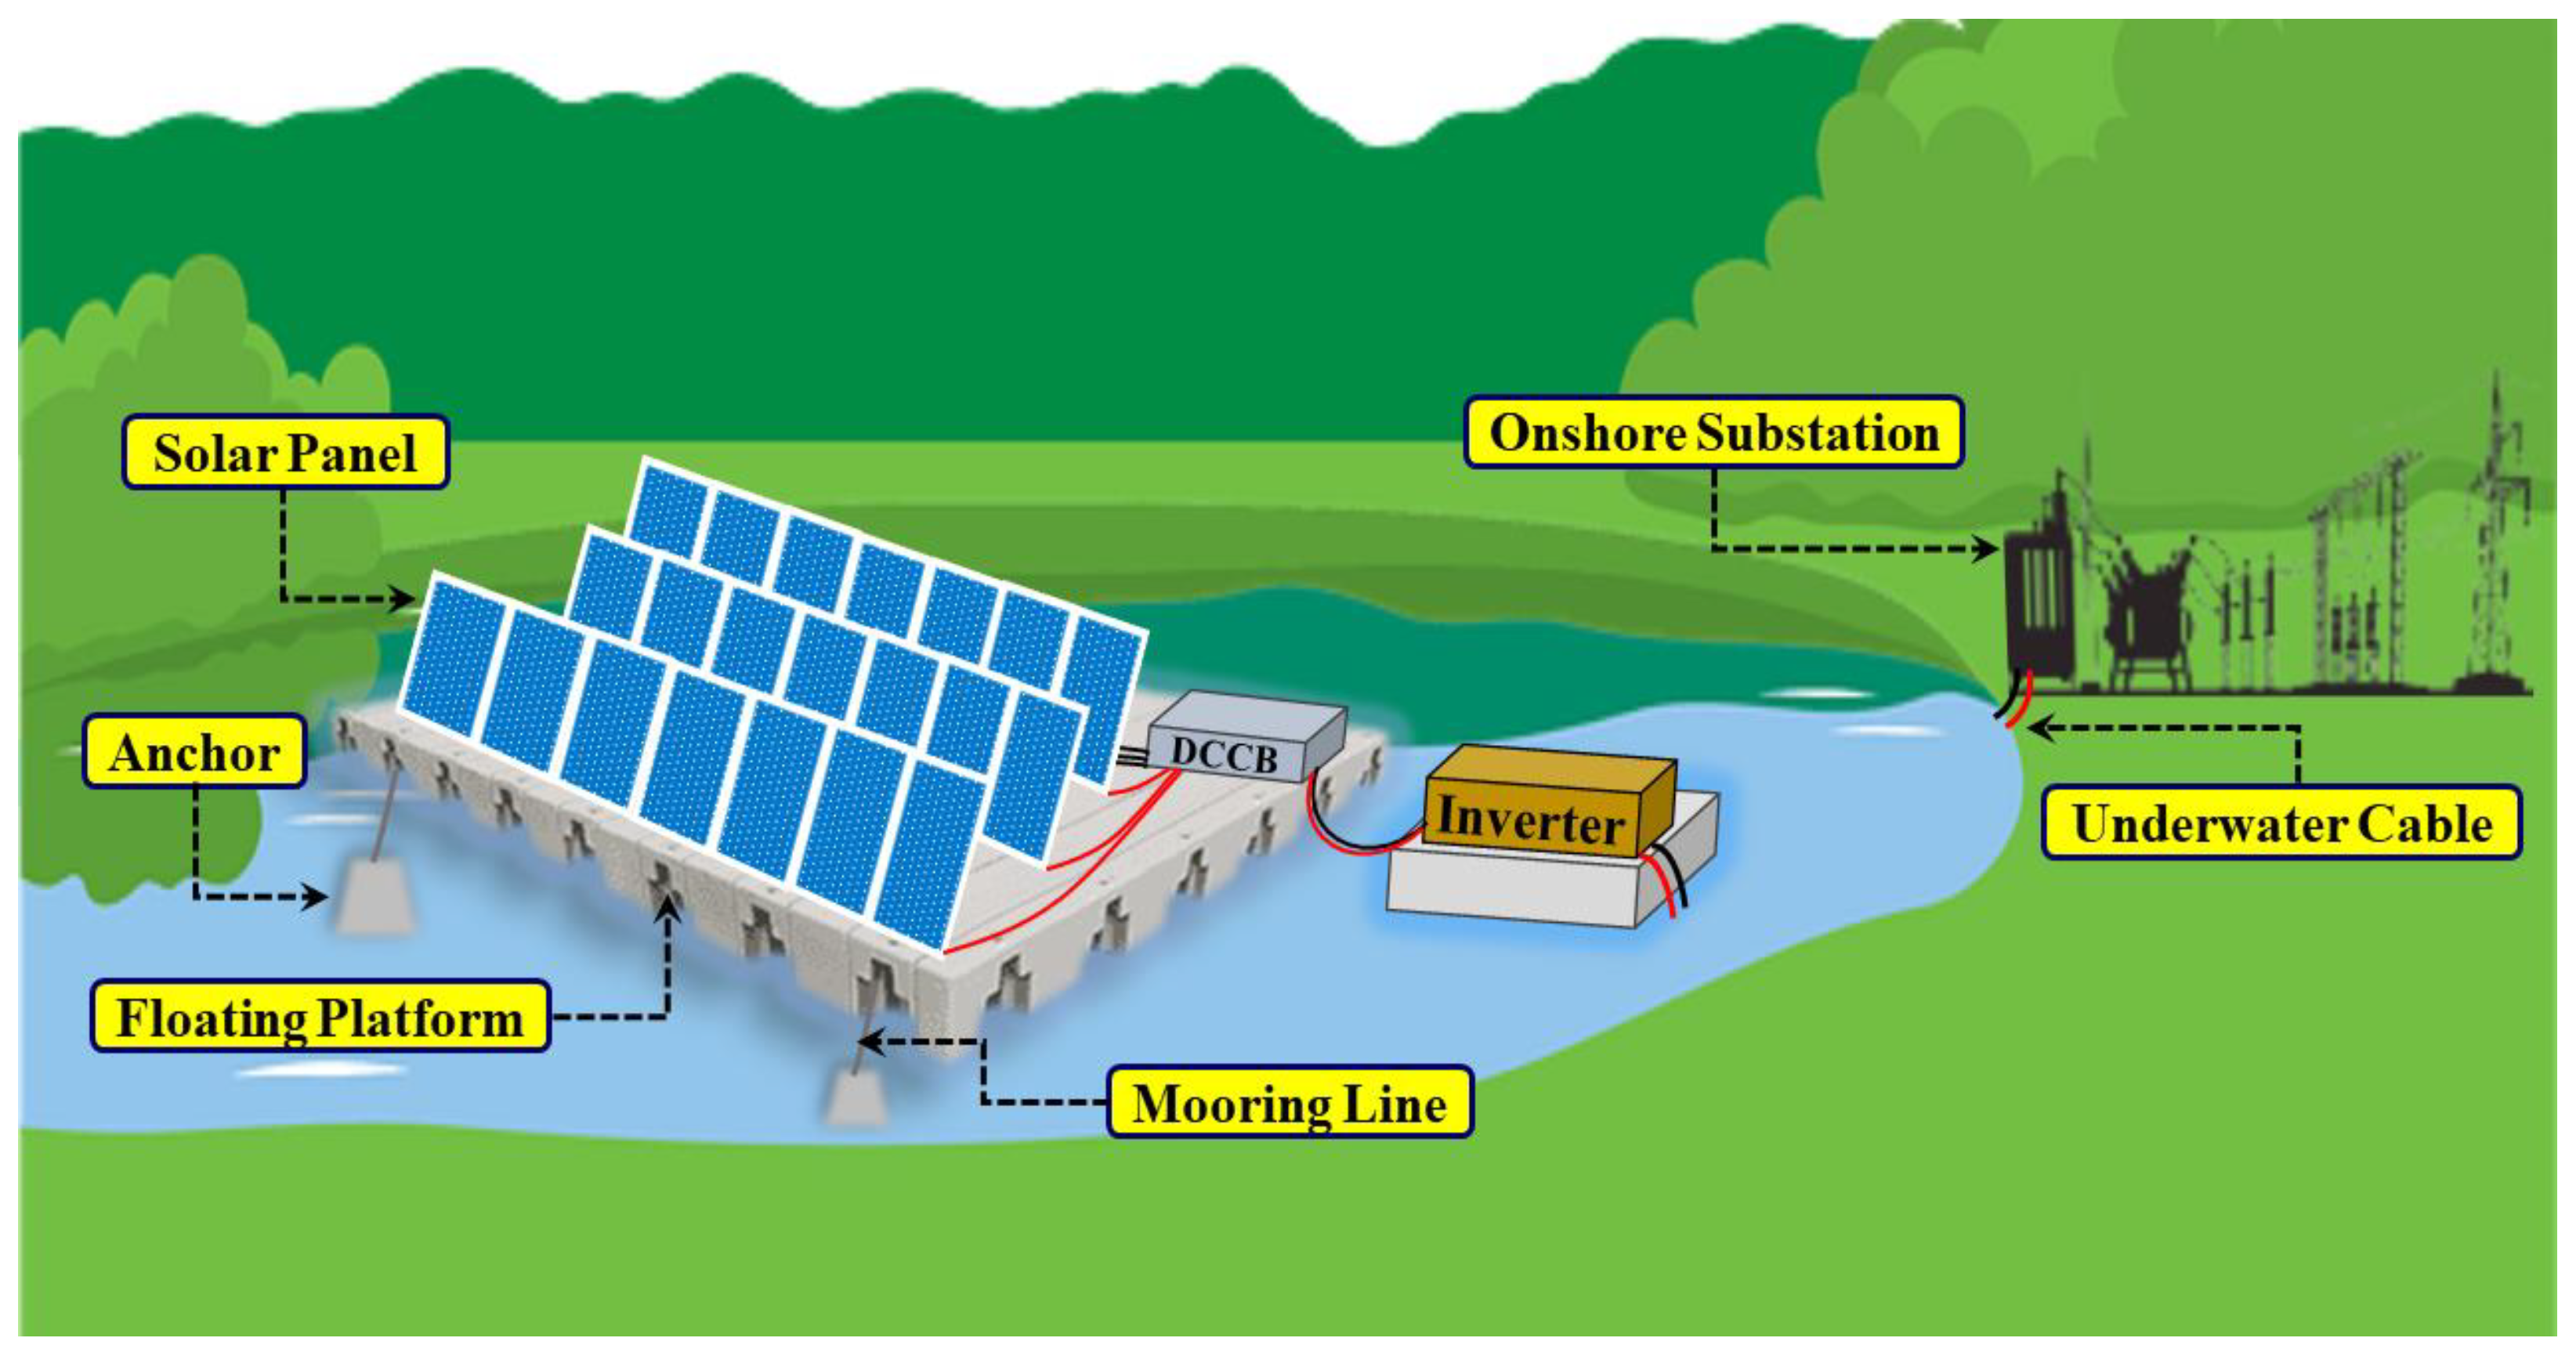
2.5. Electrical Components
- DC Combiner Box (DCCB): The DCCB distributes power in a box with DC breakers and protective devices, creates a single output from numerous DC inputs from the solar PV array and allows lengthy lines to decrease transmission voltage dips between the PV array and inverter.
- Inverter: The inverter transmits solar PV-generated DC to power system utility as AC [99]. With unique functionality, voltage and current management, it is put over floaters or the nearest land or beach. Large power factors, mild short-circuit currents, excellent efficiency, prolonged reliability and little maintenance make a good inverter [100].
- Cables and Connectors: Multiple cables carry PV panel electricity to shore. The FSPV system places the most wires under water. FSPV cables must resist corrosion, mechanical stress, severe UV radiation, and considerable temperature changes. The connections enable easy cable connection and carry a lot of electricity [27].
3. Case Study: FSPV at UMP Lake
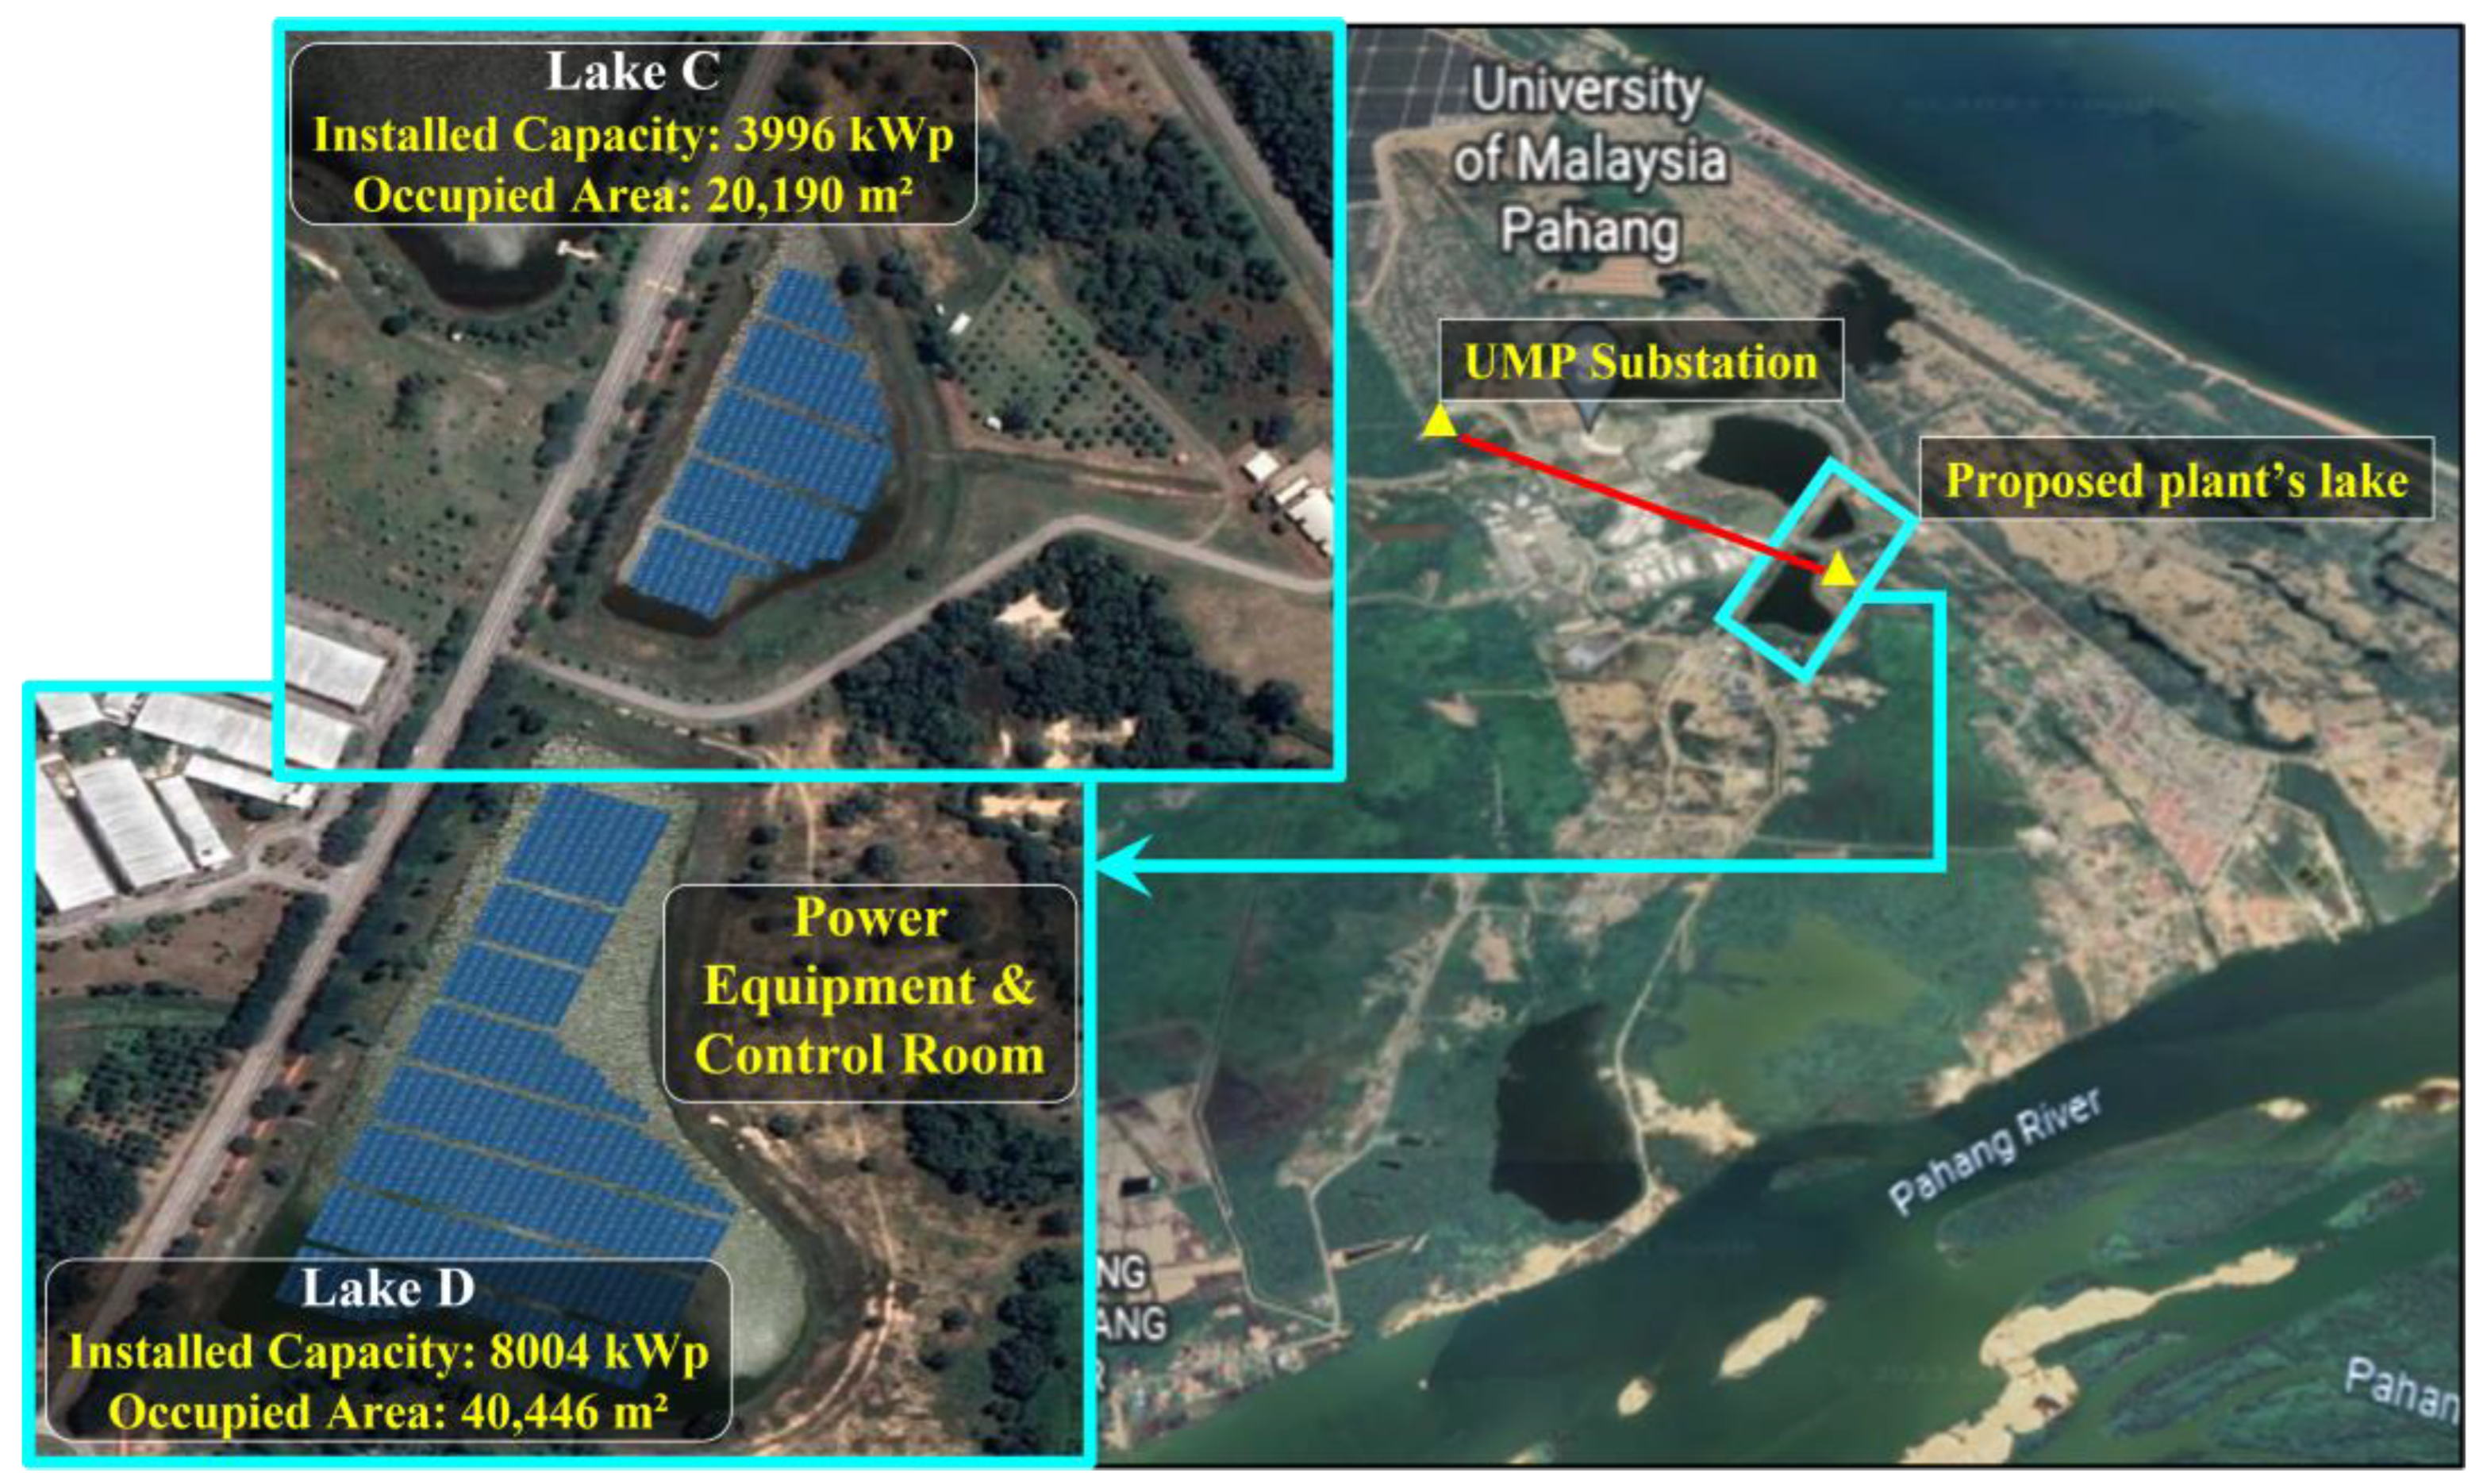
3.1. Lakes Location and Resource Potential
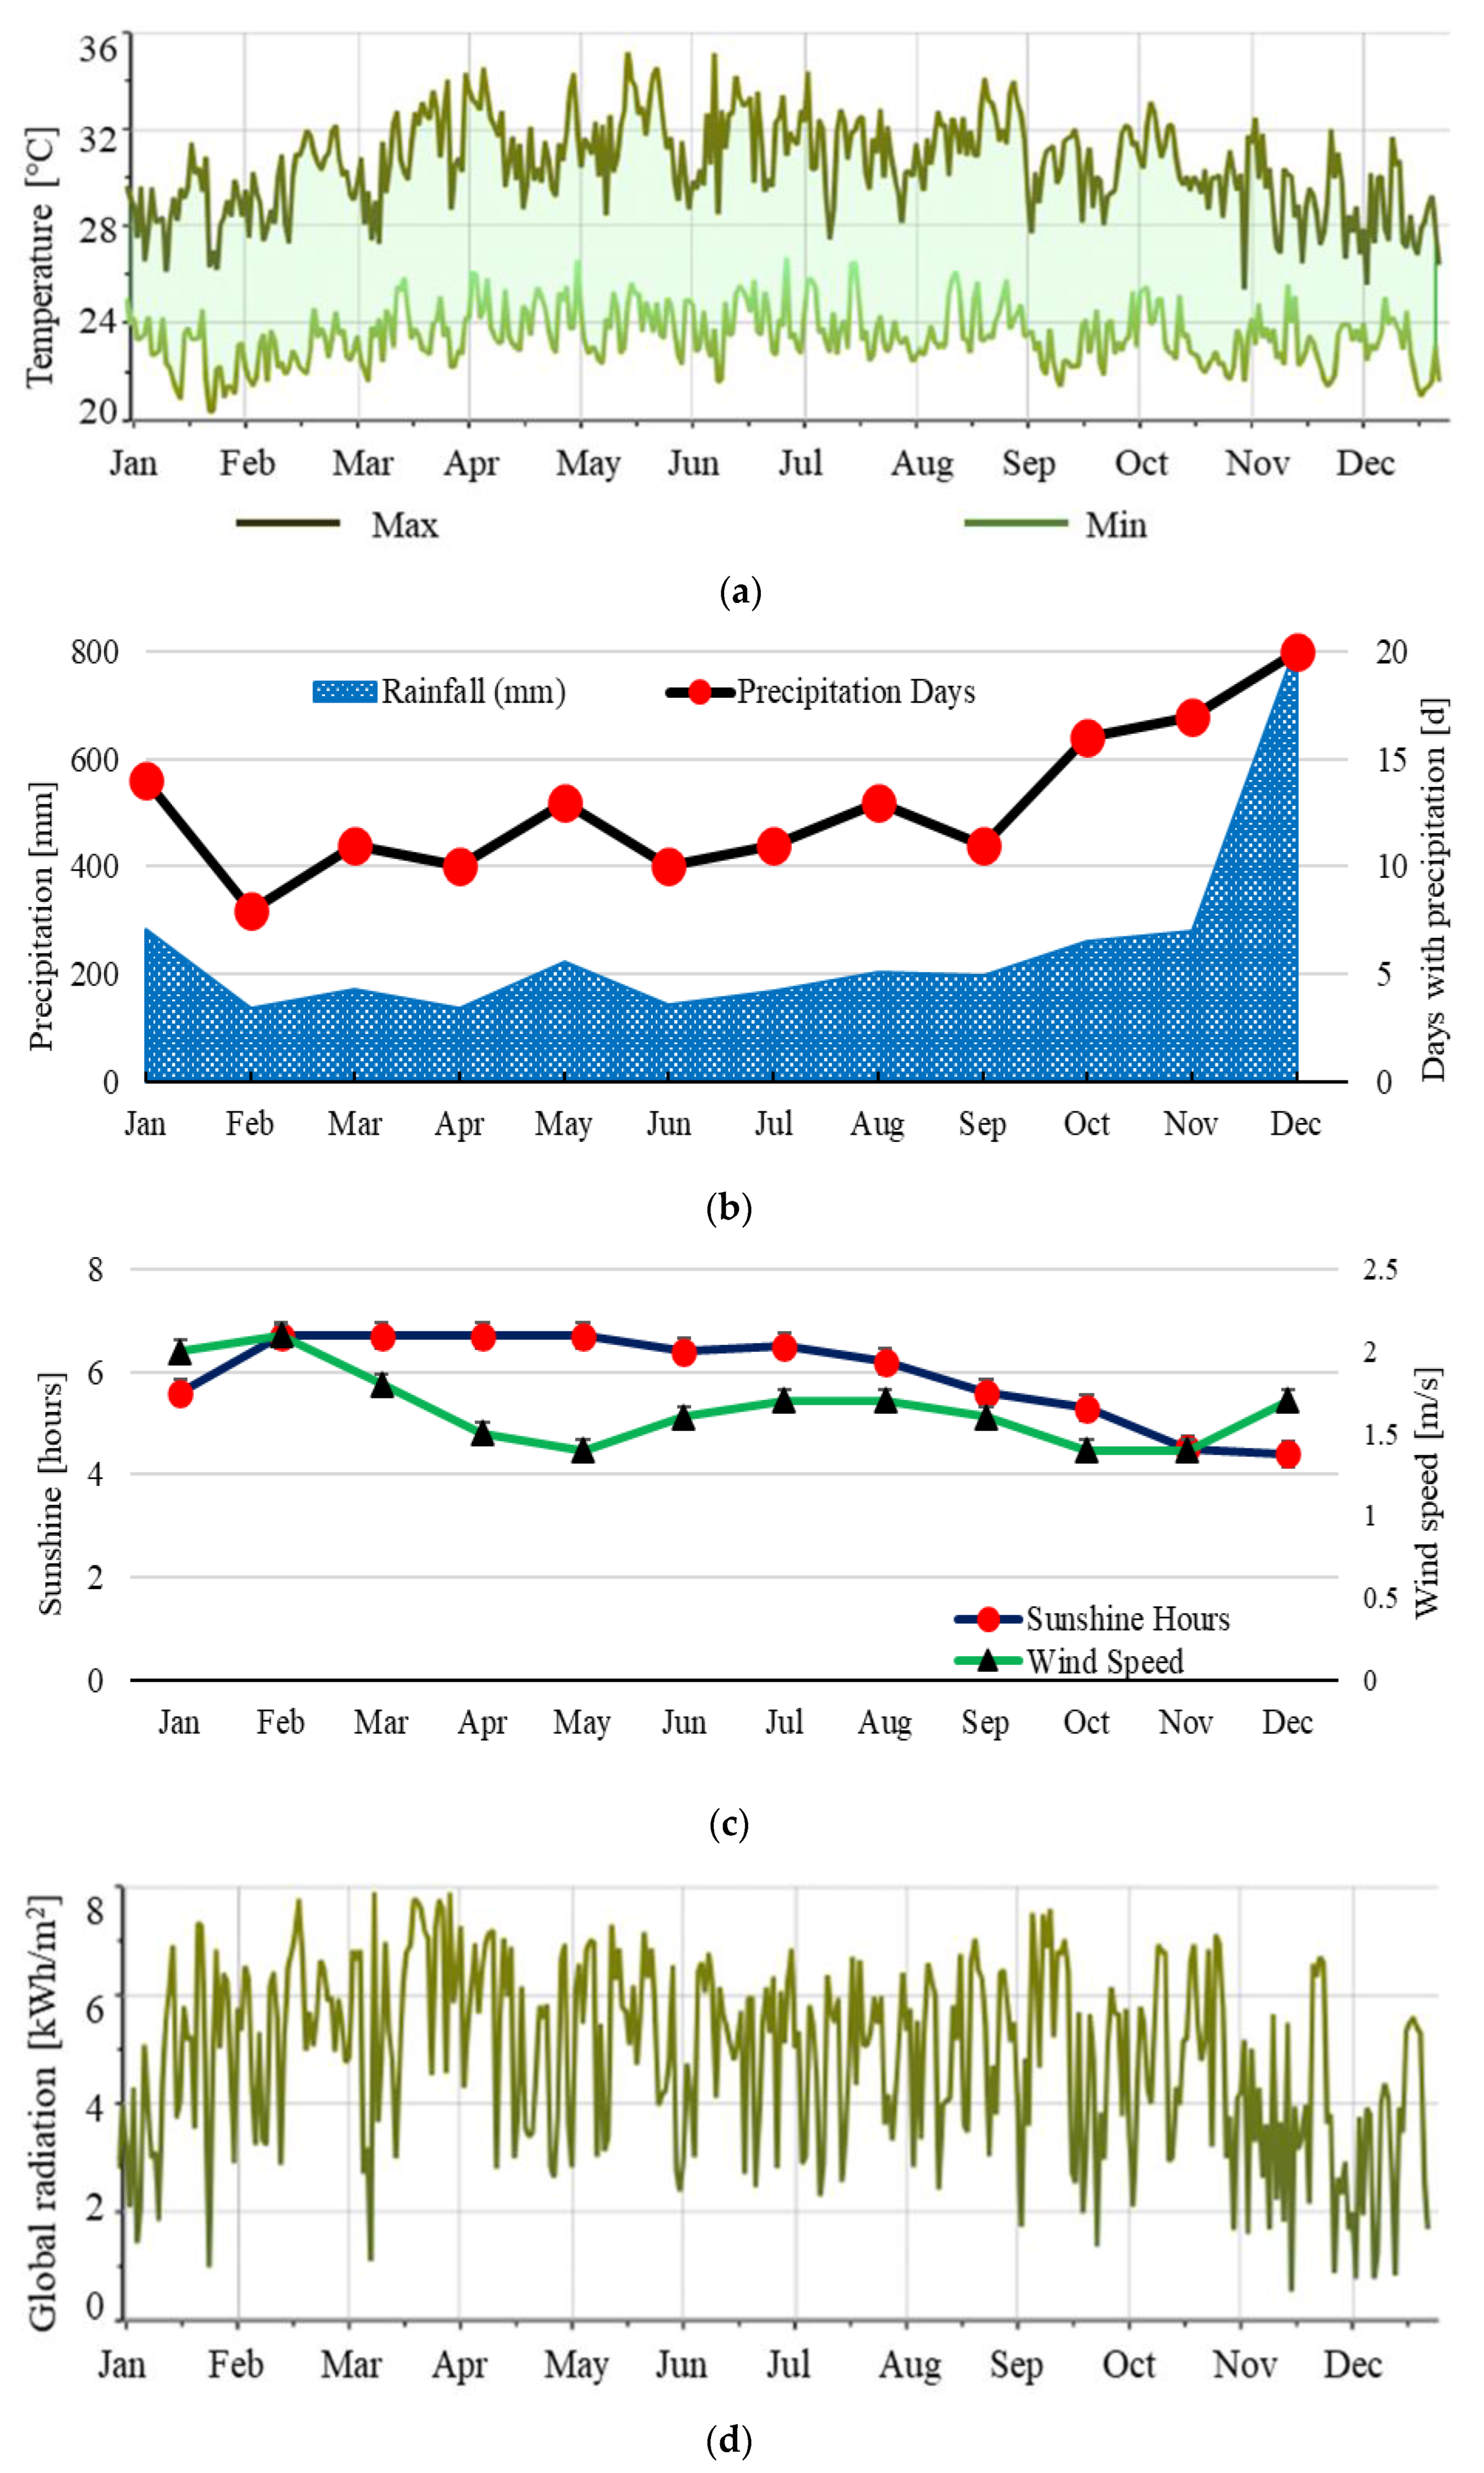
3.2. Local Weather
3.3. Solar Irridation
3.4. Wind Speed
3.5. Summary of the Site Investigation
4. Design Studies
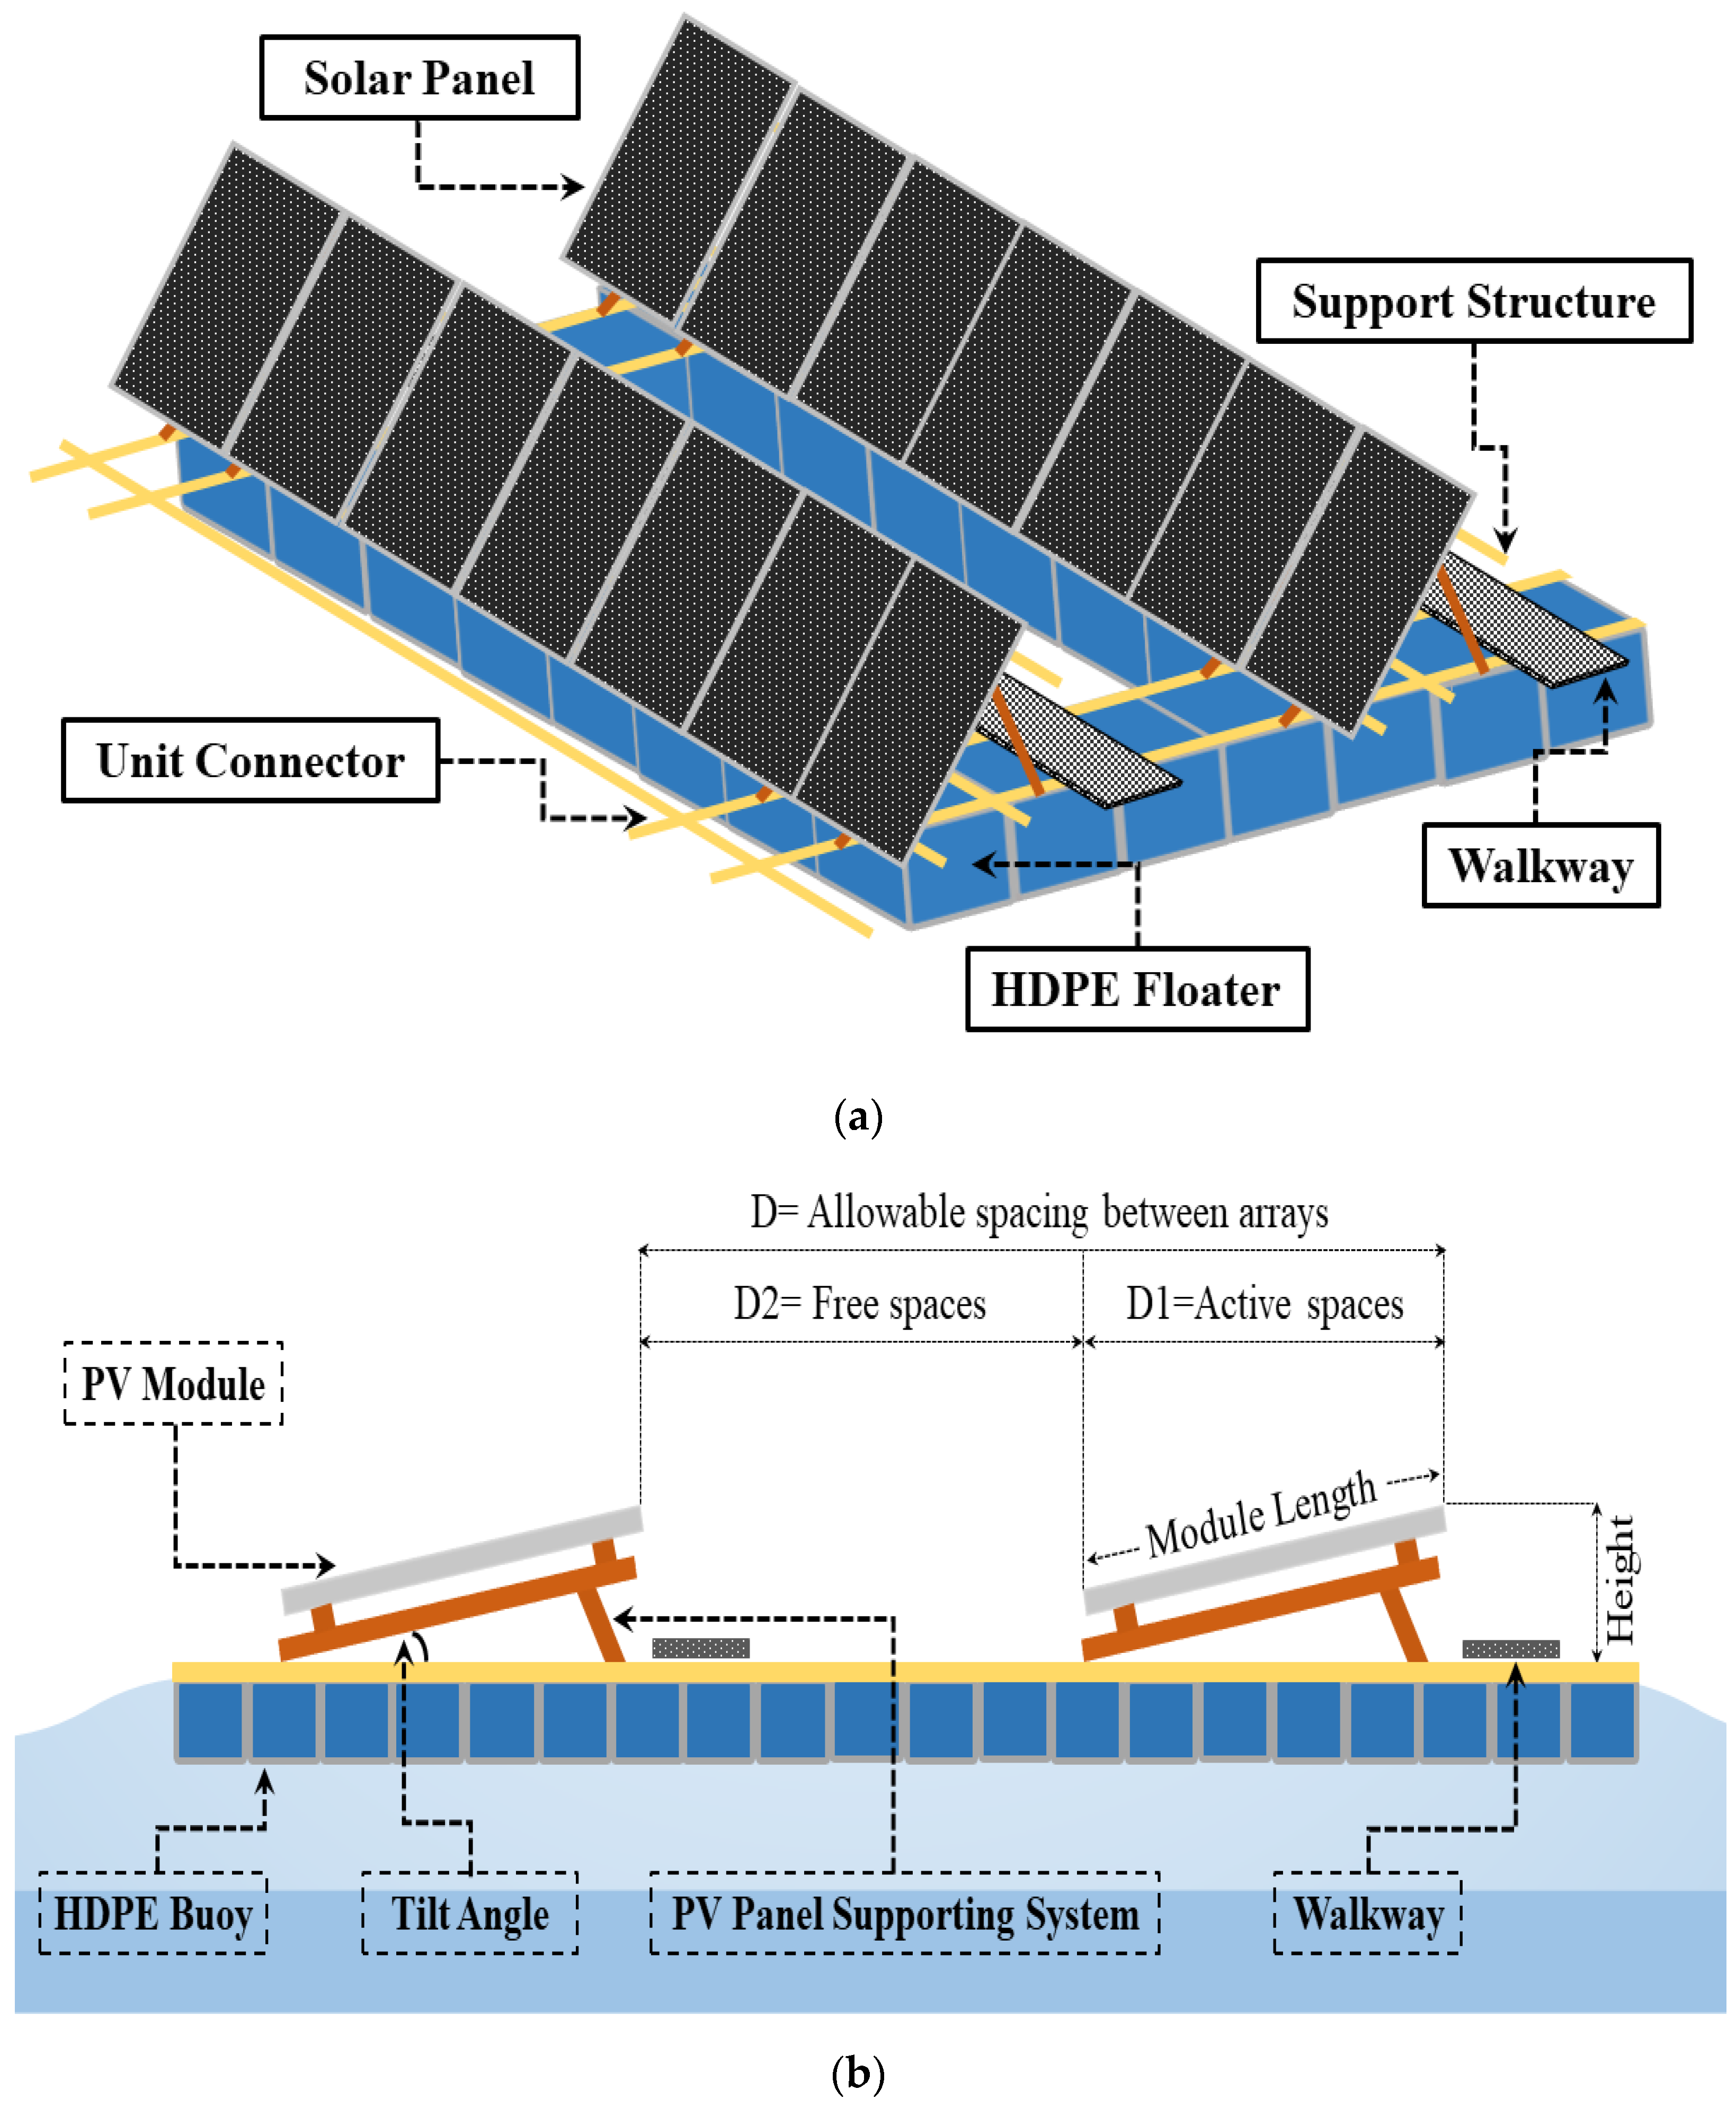
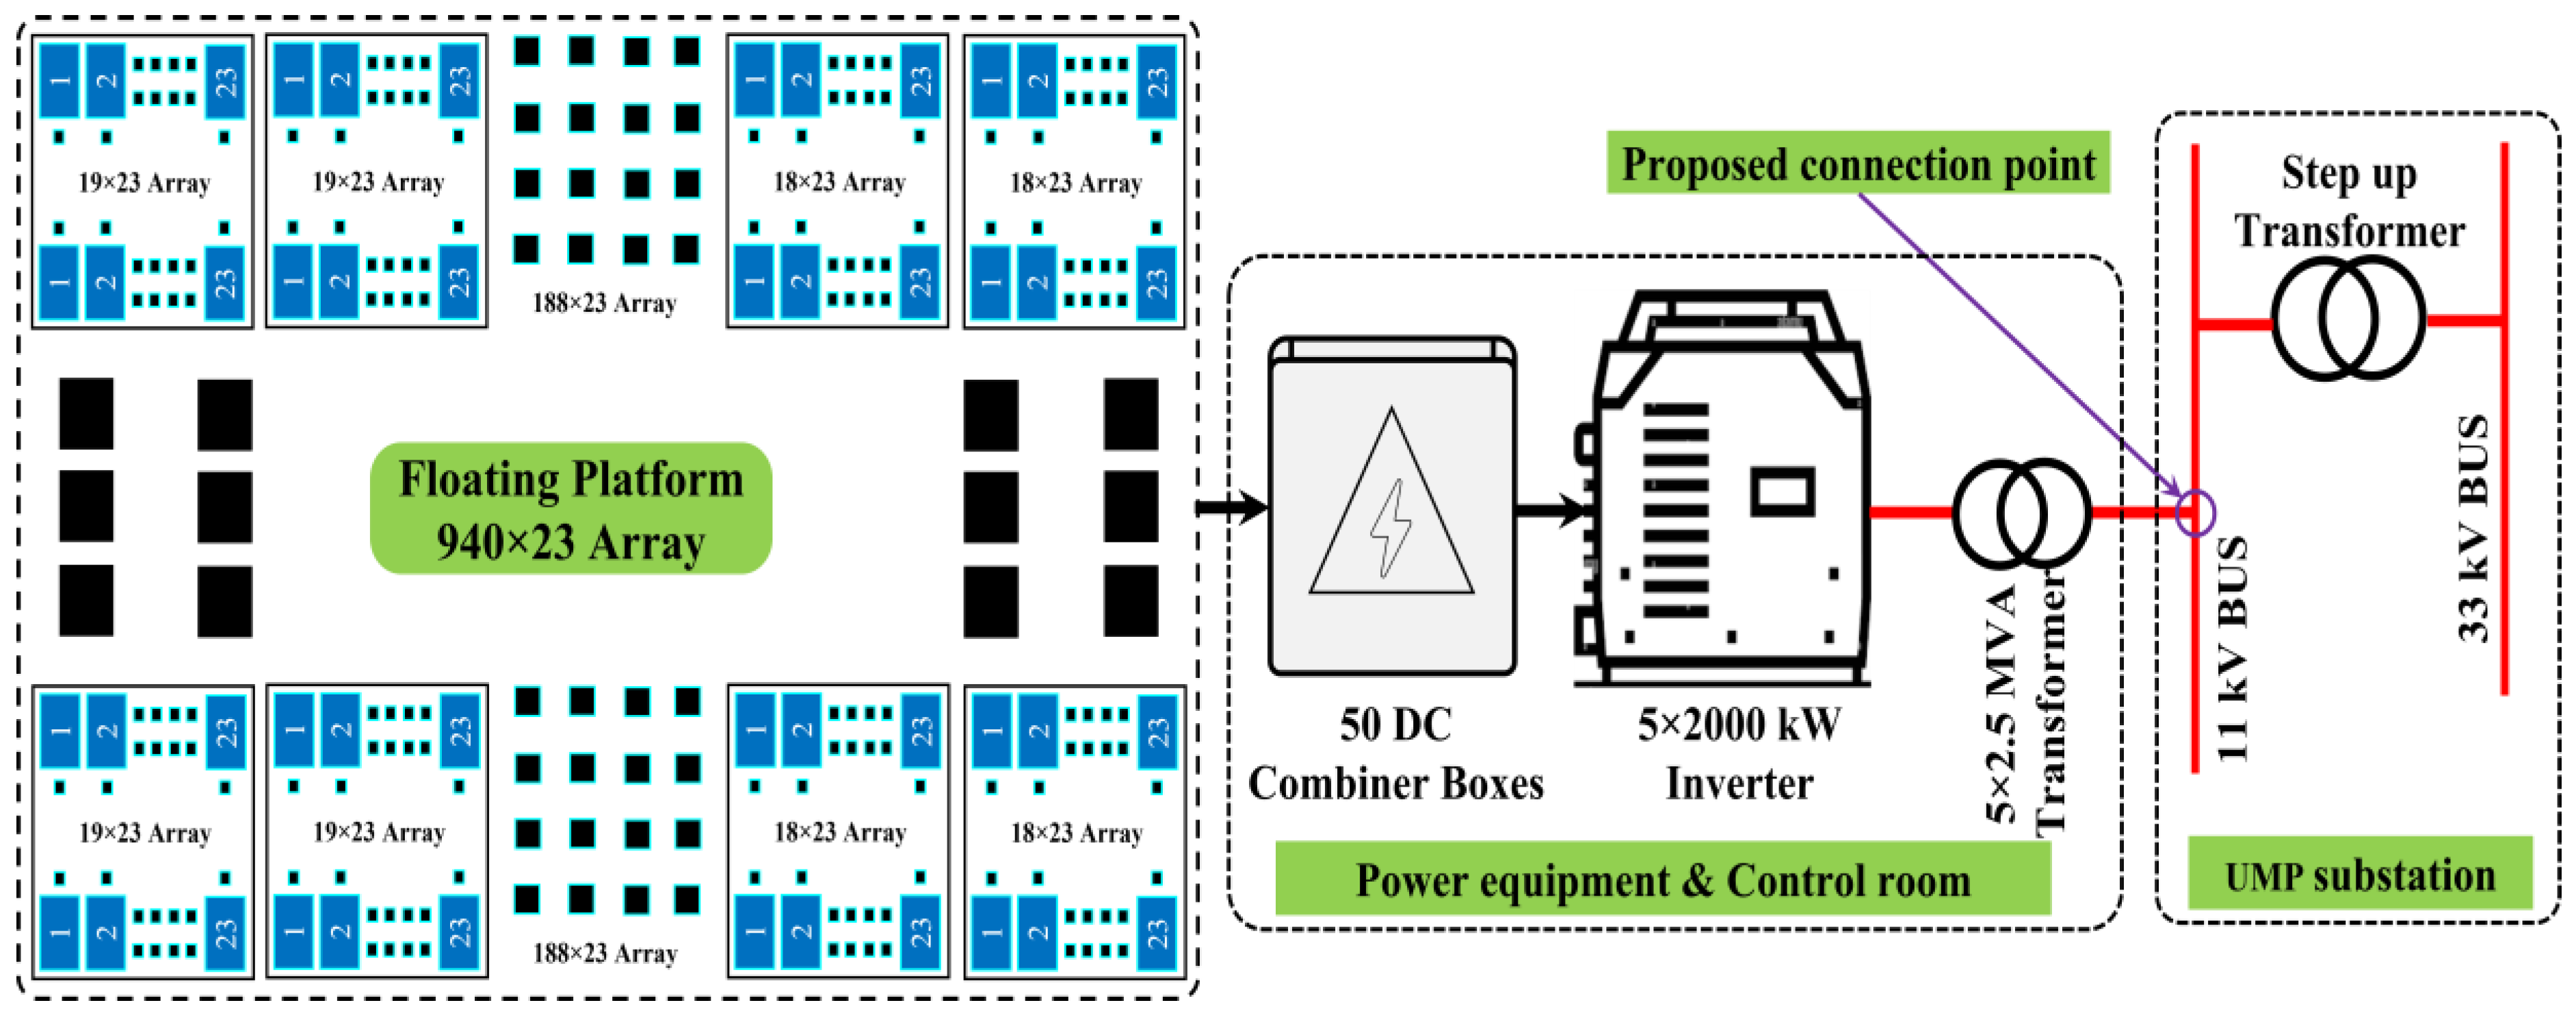
4.1. Architecture of Floating Platform
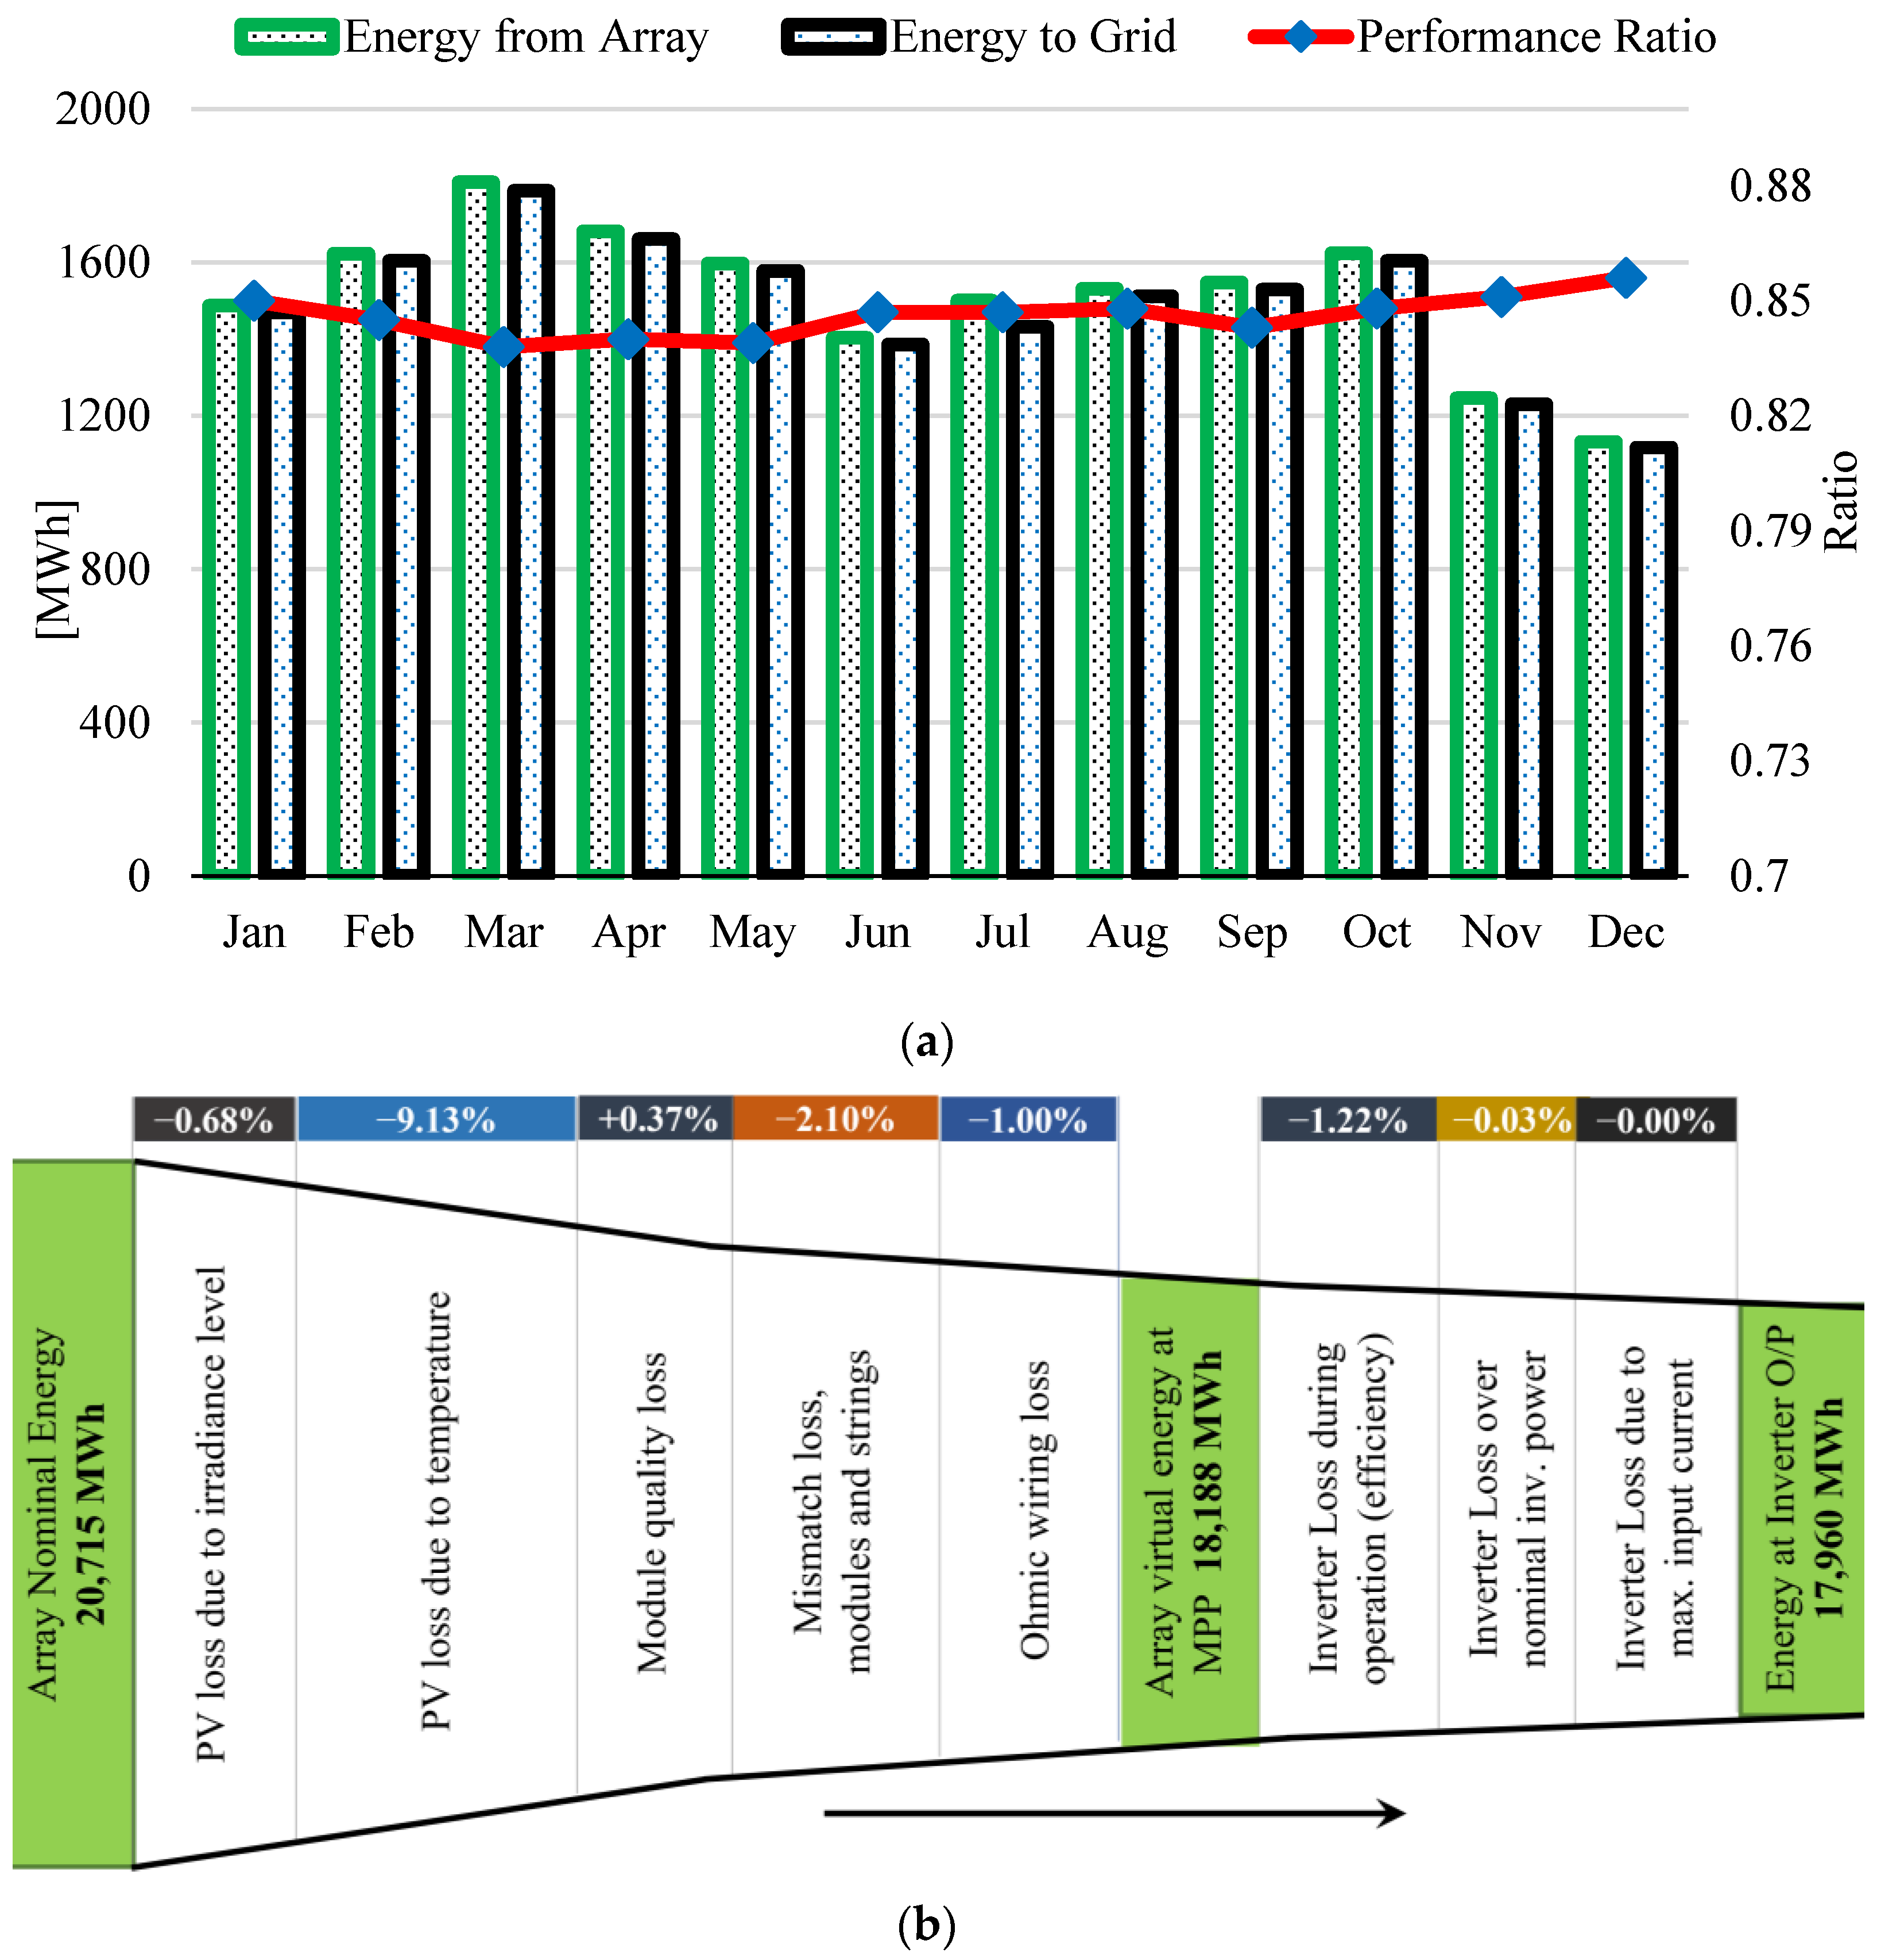
4.2. Simulation Studies
4.3. Specification of PV Array and Plant
5. Analysis and Assessment
5.1. Budgetary Evaluation
5.2. Energy Generation Cost Estimation
5.3. Economic and CO2 Emission Mitigation Assessment
5.4. Grid Connection Analysis
5.5. Feasibility of FSPV under LSS Strategy
- LSS 1: This auction took place in 2016 for the capacity of 371 MW. The lowest bid was RM 0.39/kWh.
- LSS 2: The LSS 2 auction was held in 2017 for 526 MW of capacity, with the lowest price of RM 0.34/kWh. The auction of LSS 2 was 13% less expensive than the auction of LSS 1.
- LSS 3: This auction was held in 2019 for 491.88 MW. The lowest bid was RM 0.17/kWh, 50% lower than LSS 2.
- The last auction, LSS 4, was held in 2020 for the capacity of 1000 MW, with the lowest bid of RM 0.1399/kWh. The bid for LSS 4 was 18% lower than that of LSS 3.
6. Conclusions
- The technical and financial research favorably supports the construction of a 10 MW FSPV plant at UMP Lake.
- The proposed FSPV plant may make a substantial contribution to the country’s large-scale solar strategy.
- According to assessments, FSPV has a 12 MWp capacity and produces 17,690 MWh of energy annually.
- The PR of the plant of 84.5% was simulated using PVsyst software, which shows that the region has significant potential to generate additional RE utilizing FSPV technology.
- The plant only needs to use 60,636 m2 of water bodies to generate 17,960 MWh of electricity annually with an LCOE of USD 0.052/kWh.
- The project’s capital expenditure worth USD 8.94 million is recovered during a payback period of 9.5 years.
- The planned facility helps the country’s initiatives to mitigate the effects of climate change by dramatically reducing CO2 emissions, which would amount to 11,135.2 metric tons annually.
Author Contributions
Funding
Data Availability Statement
Acknowledgments
Conflicts of Interest
References
- Al Mansur, A.; Islam, M.I.; Ul Haq, M.A.; Maruf, M.H.; Shihavuddin, A.S.M.; Amin, M.R. Investigation of PV Modules Electrical Characteristics for Laboratory Experiments Using Halogen Solar Simulator. In Proceedings of the 2020 2nd International Conference on Sustainable Technologies for Industry (STI 2020), Dhaka, Bangladesh, 19–20 December 2020; pp. 19–20. [Google Scholar] [CrossRef]
- Dudley, B. BP Energy Outlook; BP Energy Economics: London, UK, 2019. [Google Scholar]
- Turag, J.H.; Kabir, M.A.; Al Hasan, M.N.; Al Mansur, A.; Islam, M.I.; Haq, M.A.U.; Ashique, R.H.; Shihavuddin, A. Soil Impact on Photovoltaic Performance: A Laboratory-Based Investigation. In Proceedings of the 2022 4th International Conference on Sustainable Technologies for Industry 4.0 (STI), Dhaka, Bangladesh, 17–18 December 2022; IEEE: Piscataway, NJ, USA, 2022. [Google Scholar]
- Rahman, T.; Al Mansur, A.; Islam, S.; Islam, M.I.; Sahin, M.; Awal, M.R.; Shihavuddin, A.; Haq, M.A.U. Effects of Aging Factors on PV Modules Output Power: An Experimental Investigation. In Proceedings of the 2022 4th International Conference on Sustainable Technologies for Industry 4.0 (STI), Dhaka, Bangladesh, 17–18 December 2022; IEEE: Piscataway, NJ, USA, 2022; pp. 1–5. [Google Scholar]
- Yang, R.Y.; Yu, S.H. A Study on a Floating Solar Energy System Applied in an Intertidal Zone. Energies 2021, 14, 7789. [Google Scholar] [CrossRef]
- IRENA. Renewable Capacity Statistics 2021; IRENA: Abu Dhabi, United Arab Emirates, 2021. [Google Scholar]
- UN ESCAP. Regional Energy Trends Report 2020: Tracking SDG 7 in the ASEAN Region; United Nations: New York NY, USA, 2020. [Google Scholar]
- SEDA. Malaysia Malaysia Renewable Energy Roadmap: Pathway towards Low Carbon Energy System; SEDA: Putrajaya, Malaysia, 2021. [Google Scholar]
- Cazzaniga, R.; Rosa-Clot, M. The Booming of Floating PV. Sol. Energy 2021, 219, 3–10. [Google Scholar] [CrossRef]
- Lee, N.; Grunwald, U.; Rosenlieb, E.; Mirletz, H.; Aznar, A.; Spencer, R.; Cox, S. Hybrid Floating Solar Photovoltaics-Hydropower Systems: Benefits and Global Assessment of Technical Potential. Renew. Energy 2020, 162, 1415–1427. [Google Scholar] [CrossRef]
- Rasool, M.; Khan, M.A.; Tahir, S.; Khan, S.A.; Saeed, T.B.; Shahid, E. Integration of Floating Solar PV (FSPV) with Proposed Hydroelectric Project: Technical Analysis of Taunsa Barrage for FSPV in South Punjab, Pakistan. In Proceedings of the Proceedings—2020 23rd IEEE International Multi-Topic Conference, INMIC 2020, Bahawalpur, Pakistan, 5–7 November 2020. [Google Scholar]
- World Bank. Where Sun Meets Water; World Bank: Singapore, 2019. [Google Scholar]
- Kumar, M.; Niyaz, H.M.; Gupta, R. Challenges and Opportunities towards the Development of Floating Photovoltaic Systems. Sol. Energy Mater. Sol. Cells 2021, 233, 111408. [Google Scholar] [CrossRef]
- Sahu, A.; Yadav, N.; Sudhakar, K. Floating Photovoltaic Power Plant: A Review. Renew. Sustain. Energy Rev. 2016, 66, 815–824. [Google Scholar] [CrossRef]
- Elminshawy, N.A.S.; Osama, A.; Naeim, N.; Elbaksawi, O.; Tina, G.M. Thermal Regulation of Partially Floating Photovoltaics for Enhanced Electricity Production: A Modeling and Experimental Analysis. Sustain. Energy Technol. Assess. 2022, 53, 102582. [Google Scholar] [CrossRef]
- Liu, H.; Krishna, V.; Lun Leung, J.; Reindl, T.; Zhao, L. Field Experience and Performance Analysis of Floating PV Technologies in the Tropics. Prog. Photovolt. Res. Appl. 2018, 26, 957–967. [Google Scholar] [CrossRef]
- Abdelal, Q. Floating PV.; An Assessment of Water Quality and Evaporation Reduction in Semi-Arid Regions. Int. J. Low-Carbon Technol. 2021, 16, 732–739. [Google Scholar] [CrossRef]
- Gonzalez Sanchez, R.; Kougias, I.; Moner-Girona, M.; Fahl, F.; Jäger-Waldau, A. Assessment of Floating Solar Photovoltaics Potential in Existing Hydropower Reservoirs in Africa. Renew. Energy 2021, 169, 687–699. [Google Scholar] [CrossRef]
- Choi, Y.K.; Choi, W.S.; Lee, J.H. Empirical Research on the Efficiency of Floating PV Systems. Sci. Adv. Mater. 2016, 8, 681–685. [Google Scholar] [CrossRef]
- Solar Energy Research Institute of Singapore (SERIS). International Finance Corporation Where Sun Meets Water; Solar Energy Research Institute of Singapore: Washington, DC, USA, 2018. [Google Scholar] [CrossRef]
- Haugwitz, F. Floating Solar PV Gains Global Momentum. Available online: https://www.pv-magazine.com/2020/09/22/floating-solar-pv-gains-globalmomentum (accessed on 30 December 2022).
- Aznar, A.Y.; Lee, N.; Booth, S.S. International Applications for Floating Solar Photovoltaics; National Renewable Energy Lab. (NREL): Golden, CO, USA, 2019. [Google Scholar]
- Acharya, M.; Devraj, S. Floating Solar Photovoltaic (FSPV): A Third Pillar to Solar PV Sector; The Energy and Resources Institut: Mitapur, India, 2019. [Google Scholar]
- Trapani, K.; Redón Santafé, M. A Review of Floating Photovoltaic Installations: 2007–2013. Prog. Photovolt. Res. Appl. 2015, 23, 524–532. [Google Scholar] [CrossRef]
- Boersma, T.; van der Laan, J.; Noorduyn, O.M.M. A Comprehensive Overview of 200+ Global Floating Solar Plants. In Proceedings of the A SolarPlaza—Floating Solar Conference, Solarplaza, The Netherland, 2019; pp. 1–19. [Google Scholar]
- Rizvi, T.; Dubey, S.P.; Tripathi, N.; Srivastava, G.; Makhija, S.P.; Mohiddin, M.K. FSPV-Grid System for an Industrial Subsection with PV Price Sensitivity Analysis. Sustainability 2023, 15, 2495. [Google Scholar] [CrossRef]
- Patil, S.S.; Wagh, M.M.; Shinde, N.N. A Review on Floating Solar Photovoltaic Power Plants. Int. J. Sci. Eng. Res. 2017, 8, 789–794. [Google Scholar]
- Cuce, E.; Cuce, P.M.; Saboor, S.; Ghosh, A.; Sheikhnejad, Y. Floating PVs in Terms of Power Generation, Environmental Aspects, Market Potential, and Challenges. Sustainability 2022, 14, 2626. [Google Scholar] [CrossRef]
- Vo, T.T.E.; Ko, H.; Huh, J.; Park, N. Overview of Possibilities of Solar Floating Photovoltaic Systems in the OffShore Industry. Energies 2021, 14, 6988. [Google Scholar] [CrossRef]
- Mamatha, G.; Kulkarni, P.S. Assessment of Floating Solar Photovoltaic Potential in India’s Existing Hydropower Reservoirs. Energy Sustain. Dev. 2022, 69, 64–76. [Google Scholar] [CrossRef]
- Agrawal, K.K.; Jha, S.K.; Mittal, R.K.; Vashishtha, S. Assessment of Floating Solar PV (FSPV) Potential and Water Conservation: Case Study on Rajghat Dam in Uttar Pradesh, India. Energy Sustain. Dev. 2022, 66, 287–295. [Google Scholar] [CrossRef]
- Kumar, A. Floating PV in India: Progress, Challenges and Opportunities; Indian Institute of Technology Roorkee: Roorkee, India, 2021. [Google Scholar]
- Misra, D. Floating Photovoltaic Plant in India: Current Status and Future Prospect. In Proceedings of the International Conference on Thermal Engineering and Management Advances, Jalpaiguri, India, 27–28 June 2020; Springer: Singapore, 2020; pp. 219–232. [Google Scholar]
- Goel, S.; Lenka, S.R.; Sharma, R. Feasibility Study of a Floating Solar Photovoltaic System in Odisha, India. In Innovation in Electrical Power Engineering, Communication, and Computing Technology; Springer: Singapore, 2022; pp. 75–84. [Google Scholar]
- Kakoulaki, G.; Gonzalez Sanchez, R.; Gracia Amillo, A.; Szabo, S.; De Felice, M.; Farinosi, F.; De Felice, L.; Bisselink, B.; Seliger, R.; Kougias, I.; et al. Benefits of Pairing Floating Solar Photovoltaics with Hydropower Reservoirs in Europe. Renew. Sustain. Energy Rev. 2023, 171, 112989. [Google Scholar] [CrossRef]
- Bellini, E. Flemish Government to Support Pilot Floating Solar Projects with 6 Million. Available online: https://www.pv-magazine.com/2018/04/03/belgium-flemish-government-to-support-pilot-floating-solarprojects-with-e6-million/ (accessed on 2 July 2022).
- Magazine, P. Construction Begins on Europe’s Largest Floating PV Plant. Available online: https://www.pv-magazine.com/20%0A21/05/25/europes-largest-floating-pv-plant-comes-online (accessed on 31 December 2022).
- Bax, V.; van de Lageweg, W.I.; van den Berg, B.; Hoosemans, R.; Terpstra, T. Will It Float? Exploring the Social Feasibility of Floating Solar Energy Infrastructure in the Netherlands. Energy Res. Soc. Sci. 2022, 89, 102569. [Google Scholar] [CrossRef]
- Skumanich, A.; Mints, P.; Ghiassi, M. Considerations for the Use of PV and PT for Sea Water Desalination: The Viability of Floating Solar for This Application. In Proceedings of the 2020 47th IEEE Photovoltaic Specialists Conference (PVSC), Calgary, ON, Canada, 15 June–21 August 2020; IEEE: Piscataway, NJ, USA, 2020; pp. 633–635. [Google Scholar]
- Dörenkämper, M.; Wahed, A.; Kumar, A.; de Jong, M.; Kroon, J.; Reindl, T. The Cooling Effect of Floating PV in Two Different Climate Zones: A Comparison of Field Test Data from the Netherlands and Singapore. Sol. Energy 2021, 219, 15–23. [Google Scholar] [CrossRef]
- Qin, Y.; Mueller, N.D.; Siebert, S.; Jackson, R.B.; AghaKouchak, A.; Zimmerman, J.B.; Tong, D.; Hong, C.; Davis, S.J. Flexibility and Intensity of Global Water Use. Nat. Sustain. 2019, 2, 515–523. [Google Scholar] [CrossRef]
- Kenning, T.S. Energy Starts Construction on 17MW Floating Solar Plant in France. Available online: https://www.nsenergybusiness.com/news/akuo-energy-floating-solar-plant-france/ (accessed on 20 July 2022).
- Adenle, A.A. Assessment of Solar Energy Technologies in Africa-Opportunities and Challenges in Meeting the 2030 Agenda and Sustainable Development Goals. Energy Policy 2020, 137, 111180. [Google Scholar] [CrossRef]
- Ravichandran, N.; Fayek, H.H.; Rusu, E. Emerging Floating Photovoltaic System—Case Studies High Dam and Aswan Reservoir in Egypt. Processes 2021, 9, 1005. [Google Scholar] [CrossRef]
- Benzaken, D.; Hoareau, K. From Concept to Practice: The Blue Economy in Seychelles. In The Blue Economy in Sub-Saharan Africa; Routledge: Oxfordshire, UK, 2021; pp. 141–157. ISBN 0367822725. [Google Scholar]
- Beetz, B. Africa Announces Utility-Scale Floating Solar Tender. Available online: https://www.pv-magazine.com/2018/04/09/africa-announces-utility-scale-floating-solar-tender/ (accessed on 6 August 2022).
- Gamarra, C.; Ronk, J.J. Floating Solar: An Emerging Opportunity at the Energy-Water Nexus. Tex. Water J 2019, 10, 32–45. [Google Scholar] [CrossRef]
- Rosa-Clot, M.; Tina, G.M.; Cazzaniga, R.; CTO, R.D.; Whittaker, T.; Rosa-Clot, P. Floating PV Plants; Marco Rosa-Clot, G.M.T., Ed.; Academic Press: London, UK, 2020; ISBN 0128170611. [Google Scholar]
- Pandey, A.K.; Kalidasan, B.; Kumar, R.R.; Rahman, S.; Tyagi, V.V.; Krismadinata; Said, Z.; Salam, P.A.; Juanico, D.E.; Ahamed, J.U.; et al. Solar Energy Utilization Techniques, Policies, Potentials, Progresses, Challenges and Recommendations in ASEAN Countries. Sustainability 2022, 14, 11193. [Google Scholar] [CrossRef]
- Pimentel Da Silva, G.D.; Branco, D.A.C. Is Floating Photovoltaic Better than Conventional Photovoltaic? Assessing Environmental Impacts. Impact Assess. Proj. Apprais. 2018, 36, 390–400. [Google Scholar] [CrossRef]
- Liu, H.; Kumar, A.; Reindl, T. The Dawn of Floating Solar—Technology, Benefits, and Challenges. In WCFS2019; Springer: Berlin/Heidelberg, Germany, 2020; pp. 373–383. [Google Scholar]
- Cecilia Keating Masdar and PLN to Develop Indonesia’s First Floating Solar Plant. Available online: https://www.pv-tech.org/news/masdar-and-pln-partner-to-develop-indonesias-first-floating-solar-project (accessed on 1 January 2023).
- Silalahi, D.F.; Blakers, A.; Stocks, M.; Lu, B.; Cheng, C.; Hayes, L. Indonesia’s Vast Solar Energy Potential. Energies 2021, 14, 5424. [Google Scholar] [CrossRef]
- Le, P.T.; Nguyen, V.D.; Le, P.L. Techno-Economic Analysis of Solar Power Plant Project in Binh Thuan, Vietnam. In Proceedings of the Proceedings 2018 4th International Conference on Green Technology and Sustainable Development, GTSD 2018, Ho Chi Minh City, Vietnam, 23–24 November 2018; IEEE: Piscataway, NJ, USA, 2018; pp. 82–85. [Google Scholar]
- Essak, L.; Ghosh, A. Floating Photovoltaics: A Review. Clean Technol. 2022, 4, 752–769. [Google Scholar] [CrossRef]
- Rahaman, M.A.; Chambers, T.L.; Fekih, A.; Wiecheteck, G.; Carranza, G.; Possetti, G.R.C. Floating Photovoltaic Module Temperature Estimation: Modeling and Comparison. Renew. Energy 2023, 208, 162–180. [Google Scholar] [CrossRef]
- Dai, J.; Zhang, C.; Lim, H.V.; Ang, K.K.; Qian, X.; Wong, J.L.H.; Tan, S.T.; Wang, C.L. Design and Construction of Floating Modular Photovoltaic System for Water Reservoirs. Energy 2020, 191, 116549. [Google Scholar] [CrossRef]
- Pv, S.F. Economic Analysis of a Pumped Hydroelectric Iberian Electricity Market. Energies 2023, 16, 1705. [Google Scholar] [CrossRef]
- Pouran, H.M.; Padilha Campos Lopes, M.; Nogueira, T.; Alves Castelo Branco, D.; Sheng, Y. Environmental and Technical Impacts of Floating Photovoltaic Plants as an Emerging Clean Energy Technology. iScience 2022, 25, 105253. [Google Scholar] [CrossRef] [PubMed]
- Micheli, L.; Talavera, D.L.; Marco Tina, G.; Almonacid, F.; Fernández, E.F. Techno-Economic Potential and Perspectives of Floating Photovoltaics in Europe. Sol. Energy 2022, 243, 203–214. [Google Scholar] [CrossRef]
- Khan, K.A.; Islam, S.; Akter, A.; Islam, A.; Hossain, S. A Study on Floating SPV Power for Practical Utilization across the Globe. Int. J. Adv. Res. Innov. Ideas Educ. 2020, 6, 235–251. [Google Scholar]
- Bui, P.A. Assessing the Technical, Economic, and Environmental Feasibility of Floating Solar Power Generation on Water Reservoirs in Vietnam. Master’s Thesis, Humboldt State University, Arcata, CA, USA, 2019. [Google Scholar]
- Terre, C. Wisewood, Thailand. Available online: https://ciel-et-terre.net/project/wisewood/ (accessed on 2 March 2023).
- MEI, L.P. Study of Potential Capacity for Floating Solar in Malaysia. Ph.D. Thesis, Universiti Tunku Abdul Rahman, Petaling Jaya, Malaysia, 2021. [Google Scholar]
- Cypark Resources Berhad. Facts at A Glance; Cypark: Petaling Jaya, Malaysia, 2017; Available online: http://myagric.upm.edu.my/id/eprint/18853/1/2017.pdf (accessed on 3 March 2023).
- Stiubiener, U.; Carneiro, T.; Bernardino, F.; Trigoso, M.; Benedito, S.; Teixeira, J.C. PV Power Generation on Hydro Dam ’ s Reservoirs in Brazil: A Way to Improve Operational Fl Exibility. Renew. Energy 2020, 150, 765–776. [Google Scholar] [CrossRef]
- Oliveira-Pinto, S.; Stokkermans, J. Assessment of the Potential of Different Floating Solar Technologies—Overview and Analysis of Different Case Studies. Energy Convers. Manag. 2020, 211, 112747. [Google Scholar] [CrossRef]
- Nejad, R.M.; Imanparast, M. Estimation of Technology Progression and Cost Analysis for a Floating Solar Chimney Power Plant: A Special Case—Isfahan City in Iran. IET Renew. Power Gener. 2018, 12, 928–933. [Google Scholar] [CrossRef]
- Goswami, A.; Sadhu, P.; Goswami, U.; Sadhu, P.K. Floating Solar Power Plant for Sustainable Development: A Techno-Economic Analysis. Environ. Prog. Sustain. Energy 2019, 38, e13268. [Google Scholar] [CrossRef]
- Mittal, D.; Saxena, B.K.; Rao, K.V.S. Floating Solar Photovoltaic Systems: An Overview and Their Feasibility at Kota in Rajasthan. In Proceedings of the 2017 International Conference on Circuit, Power and Computing Technologies (ICCPCT), Kollam, India, 20–21 April 2017; IEEE: Kollam, India, 2017; pp. 1–7. [Google Scholar]
- Solomin, E.; Sirotkin, E.; Cuce, E.; Selvanathan, S.P.; Kumarasamy, S. Hybrid Floating Solar Plant Designs: A Review. Energies 2021, 14, 2751. [Google Scholar] [CrossRef]
- Chowdhury, R.; Aowal, M.A.; Mostafa, S.M.G.; Rahman, M.A. Floating Solar Photovoltaic System: An Overview and Their Feasibility at Kaptai in Rangamati. In Proceedings of the 2020 IEEE International Power and Renewable Energy Conference, Karunagappally, India, 30 October–1 November 2020; pp. 20–24. [Google Scholar] [CrossRef]
- Friel, D.; Karimirad, M.; Whittaker, T.; Doran, J.; Howlin, E. A Review of Floating Photovoltaic Design Concepts and Installed Variations. In Proceedings of the 4th International Conference on Offshore Renewable Energy. CORE2019 Proceedings, Glasgow, UK, 30 August 2019; ASRANet Ltd.: Glasgow, UK, 2019. [Google Scholar]
- Cazzaniga, R.; Cicu, M.; Rosa-Clot, M.; Rosa-Clot, P.; Tina, G.M.; Ventura, C. Floating Photovoltaic Plants: Performance Analysis and Design Solutions. Renew. Sustain. Energy Rev. 2018, 81, 1730–1741. [Google Scholar] [CrossRef]
- Gorjian, S.; Sharon, H.; Ebadi, H.; Kant, K.; Scavo, F.B.; Tina, G.M. Recent Technical Advancements, Economics and Environmental Impacts of Floating Photovoltaic Solar Energy Conversion Systems. J. Clean. Prod. 2021, 278, 124285. [Google Scholar] [CrossRef]
- Corsuting, A.S. System Value Analysis Malaysia. 2022. Available online: https://www3.weforum.org/docs/WEF_System_Value_Analysis_Malaysia_2022.pdf (accessed on 5 March 2023).
- Rosa-Clot, M.; Tina, G.M. Submerged and Floating Photovoltaic Systems: Modelling, Design and Case Studies. In Photovoltaic Electricity; Acdemic Press: Cambridge, MA, USA, 2018; pp. 1–242. ISBN 978-0-12-812149-8. [Google Scholar]
- Rappaport, P. The Photovoltaic Effect and Its Utilization. Sol. Energy 1959, 3, 8–18. [Google Scholar] [CrossRef]
- Islam, R.; Parnab, C.; Rahman, M.; Hannan, M.A. Feasibility Study of Hybrid Floating Power Plant Concept at the Bay of Bengal. In Proceedings of the 6th International Youth Conference on Energy (IYCE), Budapest, Hungary, 21–24 June 2017; IEEE: Budapest, Hungary, 2017; pp. 1–6. [Google Scholar]
- Parida, B.; Iniyan, S.; Goic, R. A Review of Solar Photovoltaic Technologies. Renew. Sustain. Energy Rev. 2011, 15, 1625–1636. [Google Scholar] [CrossRef]
- Sharma, P.; Muni, B.; Sen, D. Design Parameters of 10 kw Floating Solar Power Plant. Int. Adv. Res. J. Sci. Eng. Technol. 2015, 2, 85–89. [Google Scholar] [CrossRef]
- Kim, S.H.; Baek, S.C.; Choi, K.B.; Park, S.J. Design and Installation of 500-KW Floating Photovoltaic Structures Using High-Durability Steel. Energies 2020, 13, 4996. [Google Scholar] [CrossRef]
- Perera, H.D.M.R. Designing of 3MW Floating Photovoltaic Power System and Its Benefits over Other PV Technologies. Int. J. Adv. Sci. Res. Eng. 2020, 6, 37–48. [Google Scholar] [CrossRef]
- Choi, Y.K.; Lee, Y.G. A Study on Development of Rotary Structure for Tracking-Type Floating Photovoltaic System. Int. J. Precis. Eng. Manuf. 2014, 15, 2453–2460. [Google Scholar] [CrossRef]
- Rubino, F.; Nisticò, A.; Tucci, F.; Carlone, P. Marine Application of Fiber Reinforced Composites: A Review. J. Mar. Sci. Eng. 2020, 8, 26. [Google Scholar] [CrossRef]
- Ghigo, A.; Faraggiana, E.; Sirigu, M.; Mattiazzo, G.; Bracco, G. Design and Analysis of a Floating Photovoltaic System for Offshore Installation: The Case Study of Lampedusa. Energies 2022, 15, 8804. [Google Scholar] [CrossRef]
- Cazzaniga, R. Floating PV Structures; Elsevier Inc.: Amsterdam, The Netherlands, 2020; ISBN 9780128170618. [Google Scholar]
- NRG Energia Floating Photovoltaic Systems. Available online: http://www.nrg-energia.it/floating-pv-systems.html (accessed on 8 January 2023).
- Aly, S.P.; Barth, N.; Figgis, B.; Essadiqi, E.; Faqif, M.; Ennaoui, A.; Ahzp, S. Mitigating the Effect of Heat and Dust to Enhance Solar Panels Efficiency. In Proceedings of the 2016 International Renewable and Sustainable Energy Conference (IRSEC), Marrakech, Morocco, 14–17 November 2016; IEEE: Piscataway, NJ, USA, 2016; pp. 1–7. [Google Scholar]
- Muaddi, J.A.; Jamal, M.A. Spectral Response and Efficiency of a Silicon Solar Cell below Water Surface. Sol. Energy 1992, 49, 29–33. [Google Scholar] [CrossRef]
- Sheeba, K.N.; Rao, R.M.; Jaisankar, S. Environmental Effects A Study on the Underwater Performance of a Solar Photovoltaic Panel A Study on the Underwater Performance of a Solar Photovoltaic Panel. Energy Sources Part A Recover. Util. Environ. Eff. 2015, 37, 1505–1512. [Google Scholar] [CrossRef]
- Islam, M.I.; Maruf, M.H.; Al Mansur, A.; Ashique, R.H.; Asif ul Haq, M.; Shihavuddin, A.S.M.; Jadin, M.S. Feasibility Analysis of Floating Photovoltaic Power Plant in Bangladesh: A Case Study in Hatirjheel Lake, Dhaka. Sustain. Energy Technol. Assess. 2023, 55, 102994. [Google Scholar] [CrossRef]
- Claus, R.; López, M. Key Issues in the Design of Floating Photovoltaic Structures for the Marine Environment. Renew. Sustain. Energy Rev. 2022, 164, 112502. [Google Scholar] [CrossRef]
- Cazzaniga, R.; Cicu, M.; Rosa-clot, M.; Rosa-clot, P.; Tina, G.M.; Ventura, C. Compressed Air Energy Storage Integrated with Floating Photovoltaic Plant. J. Energy Storage 2017, 13, 48–57. [Google Scholar] [CrossRef]
- Choi, Y. A Study on Power Generation Analysis of Floating PV System Considering Environmental Impact. Int. J. Softw. Eng. Its Appl. 2014, 8, 75–84. [Google Scholar] [CrossRef]
- Trapani, K.; Millar, D.L. The Thin Film Flexible Floating PV (T3F-PV) Array: The Concept and Development of the Prototype. Renew. Energy 2014, 71, 43–50. [Google Scholar] [CrossRef]
- Villa-Caro, R.; Carral, J.C.; Fraguela, J.Á.; López, M.; Carral, L. A Review of Ship Mooring Systems. Brodogradnja 2018, 69, 123–149. [Google Scholar] [CrossRef]
- Kim, S.H.; Yoon, S.J.; Choi, W. Design and Construction of 1MW Class Floating PV Generation Structural System Using FRP Members. Energies 2017, 10, 1142. [Google Scholar] [CrossRef]
- Lumby, B. International Finance Corporation Utility-Scale Solar Photovoltaic Power Plants: A Project Developer’s Guide; The World Bank: Washington, DC, USA, 2015. [Google Scholar]
- Schulz, S.E. Exploring the High-Power Inverter: Reviewing Critical Design Elements for Electric Vehicle Applications. IEEE Electrif. Mag. 2017, 5, 28–35. [Google Scholar] [CrossRef]
- Kumari, A.; Patra, J.; Pal, N.; Kumar, N. Impact of Solar Panel on the Transformer Performance: A Case Study. Iran. J. Sci. Technol. Trans. Electr. Eng. 2020, 44, 1197–1206. [Google Scholar] [CrossRef]
- Rajender, K.; Rajapandiyan, K.; Vallisaranya. Transformer Rating for Solar PV Plants Based on Overloading Capability as per Guidelines. In Proceedings of the 2014 IEEE Region 10 Humanitarian Technology Conference (R10 HTC), Chennai, India, 6–9 August 2014; IEEE: Piscataway, NJ, USA, 2014; pp. 19–24. [Google Scholar]
- Vice Chancellor’s Office Info:Universiti Malaysia Pahang. Available online: https://www.ump.edu.my/ms/info#:~:text=Kampusyangterletakkira-kira,bolehmenempatkan5%2C000orangpelajar (accessed on 11 January 2023).
- Seera, M.; Tan, C.J.; Chong, K.K.; Lim, C.P. Performance Analyses of Various Commercial Photovoltaic Modules Based on Local Spectral Irradiances in Malaysia Using Genetic Algorithm. Energy 2021, 223, 120009. [Google Scholar] [CrossRef]
- Noman, F.; Alkawsi, G.; Abbas, D.; Alkahtani, A.; Tiong, S.K.; Ekanyake, J. A Comprehensive Review of Wind Energy in Malaysia: Past, Present and Future Research Trends. IEEE Access 2020, 1, 124526–124543. [Google Scholar] [CrossRef]
- Foreign Cultural Exchange Consultants Inc.; Van Ginkel Associates Ltd.; Consultants, C.I. Soil Survey Studies And Interpretations in the Pahang Tenggara Region; Kuala Lumpur, Malaysia. 1972. Available online: http://www.wossac.com/downloads/WOSSAC_24087.pdf (accessed on 8 March 2023).
- Zailani, M.Z. Development of Measuring Temperature Change for Water Quality Index in UMP Lake, Pekan Campus. Ph.D. Thesis, Universiti Malaysia Pahang, Pahang, Malaysia, 2010. [Google Scholar]
- Aziz, M.A.A.; Abas, M.F.; Faudzi, A.A.N.; Saad, N.M.; Irawan, A. Development of Wireless Passive Water Quality Catchment Monitoring System. J. Telecommun. Electron. Comput. Eng. 2018, 10, 37–40. [Google Scholar]
- Tekolla, A.W. Rainfall and Flood Frequency Analysis for Pahang River Basin. Master’s Thesis, Lund University, Lund, Malaysia, 2010. Available online: https://lup.lub.lu.se/luur/download?func=downloadFile&recordOId=1701272&fileOId=1701282 (accessed on 8 March 2023).
- Suhaiza, S.N.; Effendi, D.M.; Masiri, K.; Suhaila, S. GIS Spatial Modelling for Seismic Risk Assessment Based on Exposure, Resilience, and Capacity Indicators to Seismic Hazard: A Case Study of Pahang, Malaysia. Geomat. Nat. Hazards Risk 2021, 12, 1948–1972. [Google Scholar] [CrossRef]
- Tongkul, F. An Overview of Earthquake Science in Malaysia. ASM Sci. J. 2021, 14, 12. [Google Scholar] [CrossRef]
- Nam, J.H. Development of Floating Type Photovoltaic Energy Generation System Using the Pultruded Structural Members. Ph.D. Thesis, Hongik University, Seoul, Republic of Korea, 2010. [Google Scholar]
- Kim, S.H.; Won, Y.S.; Seo, S.H.; Park, J.K.; Yoon, S.J. Fabrication and Construction of Floating Photovoltaic Energy Generation Structures Using Fiber Reinforced Polymer Plastic (FRP) Members. Key Eng. Mater. 2017, 730, 613–619. [Google Scholar] [CrossRef]
- Setiawest Hdpe Modular Pontoon Float. Available online: https://setiawestfloats.com/hdpe-pontoon-float (accessed on 17 January 2023).
- Castellano, N.N.; Gázquez Parra, J.A.; Valls-Guirado, J.; Manzano-Agugliaro, F. Optimal Displacement of Photovoltaic Array’s Rows Using a Novel Shading Model. Appl. Energy 2015, 144, 1–9. [Google Scholar] [CrossRef]
- Muhida, R.; Ali, M.; Shireen, P.; Kassim, J.; Eusuf, M.A.; Sutjipto, A.G.E. A Simulation Method to Find the Optimal Design of Photovoltaic Home System in Malaysia, Case Study: A Building Integrated Photovoltaic in Putra Jaya. Int. J. Comput. Inf. Eng. 2009, 3, 1463–1467. [Google Scholar]
- Ghose, D.; Pradhan, S.; Ghose, D.; Pradhan, S. Environmental Effects Floating Solar Plants—Exploring a New Dimension of Energy Generation: A Case Study Floating Solar Plants—Exploring a New Dimension of Energy. Energy Sources Part A Recover. Util. Environ. Eff. 2021, 1–31. [Google Scholar] [CrossRef]
- ADB Guidelines for Financial Management and Analysis of Projects; Manila, Philiphines. 2005. Available online: https://www.adb.org/sites/default/files/institutional-document/31339/financial-governance-management (accessed on 22 February 2023).
- Zublie, M.F.M.; Hasanuzzaman, M.; Rahim, N.A. Modeling, Energy Performance and Economic Analysis of Rooftop Solar Photovoltaic System for Net Energy Metering Scheme in Malaysia. Energies 2023, 16, 723. [Google Scholar] [CrossRef]
- Yusuf, A.K.T. Design and Analysis of Potential Grid Connected Floating Photovoltaic System in UTHM. Ph.D. Thesis, Faculty of Electrical and Electronic Engineering Universiti Tun Hussein Onn Malaysia, Batu Pahat, Malaysia, 2020. [Google Scholar]
- Asian Development Bank Floating PV Candidate Site Report; ADB: Mandaluyong, Philippines, 2021.
- Mittal, D.; Saxena, B.K.; Rao, K.V.S. Comparison of Floating Photovoltaic Plant with Solar Photovoltaic Plant for Energy Generation at Jodhpur in India. In Proceedings of the 2017 International Conference on Technological Advancements in Power and Energy, Kollam, India, 21–23 December 2017; Volume 7, pp. 1–6. [Google Scholar] [CrossRef]
- Mehedi, T.H.; Gemechu, E.; Kumar, A. Life Cycle Greenhouse Gas Emissions and Energy Footprints of Utility-Scale Solar Energy Systems. Appl. Energy 2022, 314, 118918. [Google Scholar] [CrossRef]
- Manoj Kumar, N.; Sudhakar, K.; Samykano, M. Techno-Economic Analysis of 1 MWp Grid Connected Solar PV Plant in Malaysia. Int. J. Ambient Energy 2019, 40, 434–443. [Google Scholar] [CrossRef]
- Khan, M.A.M.; Go, Y.I. Design, Optimization and Safety Assessment of Energy Storage: A Case Study of Large-scale Solar in Malaysia. Energy Storage 2021, 3, e221. [Google Scholar] [CrossRef]
- Khan, R.; Go, Y.I. Assessment of Malaysia’s Large-Scale Solar Projects: Power System Analysis for Solar PV Grid Integration. Glob. Chall. 2020, 4, 1900060. [Google Scholar] [CrossRef] [PubMed]
- Energy Commission Request for Proposal (Rfp) for the Development of Large Scale Solar Photovoltaic (Lsspv) Plants in Peninsular Malaysia for Commercial Operation in 2022/2023 (Lss@Mentari) Selection of Shortlisted Bidders. 2021; Volume 2023. Available online: https://www.st.gov.my/contents/2021/LSS/Announcement%20of%20the%20Selected%20Shortlisted%20Bidders%20for%20LSS%40MEnTARI.pdf (accessed on 5 February 2023).
- Emiliano Bellini Floating Solar Plant with LCOE of $0.051/KWh Comes Online in Malaysia. Available online: https://www.pv-magazine.com/2020/10/21/floating-solar-plant-with-lcoe-of-0-038-kwh-comes-online-in-malaysia/ (accessed on 5 February 2023).


| Refs. | Plant Name | Location | Plant Size | Commission Year | Reservoir Area (ha) | Description |
|---|---|---|---|---|---|---|
| [19,55] | Aichi Solar Project | Central Honshu, Japan | 20 kWp | 2007 | - | The first formal FSPV plant in the world. |
| [56] | Floatvoltaic | Far Niente, CA, USA | 175 kWp | 2008 | - | The first commercial FSPV technology in the world was developed to avoid land occupation and reduce evaporative water loss. |
| [57] | Umenoki Floating Solar Farm | Saitama, Japan | 7.5 MWp | 2015 | 12 | This plant has 27,456 PV panels with bottom anchoring technology and covers 57% of its irrigation reservoir. |
| [57] | Sungrow Huainan Solar Farm | Anhui, China | 40 MWp | 2017 | 250 | A massive floating solar farm by Sungrow Power Supply consisting of 166,000 PV panels. The project’s initial investment was around 45 million dollars. |
| [25] | Three Gorges Huainan Floating Solar PV Park | Anhui, China | 150 MWp | 2018 | 320 | This plant can generate 150,000 MWh of energy, which is able to supply 94,000 residences. Investment cost for this project was USD 151 m. |
| [26] | Dezhou Dingzhuang Floating Solar Farm | Shandong, Dezhou, China | 320 MWp | 2022 | 600 | 200 MW and 120 MW; two separate steps were taken to complete this plant. The facility can generate 550 m kWh and reduce CO2 453,000 tons per year. Number of installed panels: 170,000. |
| [28] | Gunsan Retarding Basin Solar PV Plant | North Jeolla, South Korea | 18.7 MWp | 2018 | 17.42 | The amount of renewable energy generated by this plant is sufficient to run 7450 homes. With a total price tag of USD 24.795 million, this structure uses 50,000 PV panels. |
| [29] | Dangjin and Goheung County Floating Solar Plant | Chungcheongnam, and Jeollanam, South Korea | 280 MWp | 2019 | - | This project is in two different places: (i) Dangjin, 200 MW, and (ii) Goheung, 80 MW. It reduces 160,000 tons of CO2 emissions per year. |
| [32,33] | NTPC Simhadri Floating Solar Project | Simhadri, Andhra Pradesh, India | 25 MWp | 2021 | 60.70 | This power facility can provide renewable electricity for up to 7000 family homes. As a consequence, annual emission levels of CO2 are reduce by 46 thousand tons. There are 109,800 unit panels in total, and the endeavor cost USD 17.45 million. |
| [32,33] | NTPC Kawas Floating Solar PV Park | Kawas, Gujarat, India | 23 MWp | 2022 | - | Located in a raw water-dead lake in Gujrat, this installation is a combination of a land-based plant (33 MW) and a floating plant (23 MW). An estimated USD 39.088 m is needed to complete the construction. |
| [32,33] | NTPC Auraiya Floating Solar PV Project | Auraiya, Uttar Pradesh, India | 20 MWp | 2022 | - | This plant is settled on the raw water reservoir of NTPC, and it can generate 39 million kWh of electricity and reduce 33.6 metric tons of CO2 annually. |
| [31,33] | Kayamkulam Floating Solar Project | Kerala, India | 92 MWp | 2022 | 141.64 | This plant is settled on the salt water body of Rajiv Gandhi gas power station, and it can generate 215.5 m units of energy and reduce 185.5 metric tons of CO2 annually |
| [32,33] | Ramagundam Floating Solar Project | Peddapalli, Telangana, India | 100 MWp | 2022 | 202.4 | This plant is on the raw water lake of the thermal power plant at Telangana, and it can generate 223 million kWh per year and reduce 192 metric tons of CO2 per year. |
| [34] | Omkareshwar Floating Solar Park | Khandwa, Madhya Pradesh, India | 600 MWp | Under Construction | 10,000 | Omkareshwar is going to be the largest FSPV technology in India. The under-implementation project will cost around USD 919 million. |
| [58] | SPIC Thoothukudi Floating Solar PV Park | Thoothukudi, Tamil Nadu, India | 14.8 MWp | 2020 | 15.6 | There are 37,632 photovoltaic panels and 1280 floating modules in the entire system. The installation cost is around USD 10.261 million, and it covers 71.31% of the body of water. It reduces 18,686 tons CO2 per year. |
| [59] | Queen Elizabeth II Reservoir Solar Plant | Surrey, London, UK | 6.36 MWp | 2016 | 128 | With a total of 23,046 PV panels, 61,000 rafts and 177 anchorages, QE2 is one of the biggest FSPV technologies in Europe. The entire construction cost 6 million pounds and spans 5% of the water body. |
| [36] | Hesbaye Frost | Wallonia, Belgium | 998 kWp | 2017 | 3 | The inaugural massive floating FSPV facility in Belgium uses 3120 drifting modules to generate 1 GWh of electricity annually. About 35%of the water body is occupied by construction. |
| [39] | Sekdoorn Solar PV Park | Overijssel, The Netherlands | 14.5 MWp | 2019 | - | The plant produces 13 GWh/year of energy, and the initiative provides sufficient renewable energy to run 4000 homes. The construction cost about USD 16.259 million. |
| [28,41] | Baywa-re Floating Solar PV Park IV | Overijssel, The Netherlands | 27.4 MWp | 2020 | 18.25 | This facility uses 73,000 PV panels at an installation cost of USD 29.455 million, and it has the capacity to provide electricity for about 7800 homes. It can cut CO2 emissions by 12,013 tons per year. |
| [35] | Alto Rabagao Dam Floating Solar | Montalegre, Portugal | 218 kWp | 2017 | 795.3 | The world’s first combined FSPV power plant with a hydroelectric dam with 220 kWp of floating solar capacity. The plant was built with bottom grounding technology, employing 840 PV panels, each of which is rated at 260 W. |
| [60] | O’Mega 1 Solar PV Park | Piolenc, Vaucluse, France | 17 MWp | 2018 | 17 | The facility’s yearly output of 23,035 MWh produces enough renewable energy to operate 4733 residences and prevents the release of 1093 tons of CO2 into the atmosphere. The total estimated expenditure for this undertaking is USD 14.2 million. |
| [45] | Seychelles Solar PV Project | Mahe, Seychelles | 4 MWp | 2018 | - | The LCOE of this plant is USD 0.095/kWh. |
| [61] | Sayreville | Middlesex, NJ, USA | 4.4 MWp | 2019 | 19.66 | This bank-anchoring-based FSPV system comprises 3792 units of PV modules (345 W each) and covers 21% of the lake’s surface area, installed in a water treatment reservoir. |
| [51] | Sembcorp Tuas Floating Solar Project | Tengeh Reservoir, Singapore | 60 MWp | 2021 | 45 | This first LSS in the nation utilizes 122,000 photovoltaic panels and has the potential to offset 32,000 tons of CO2 yearly. |
| [53] | Duriangkang Dam Floating Solar Plant | Duriangkang Reservoir, Indonesia | 2.2 GWp | Under Construction | 1600 | A total of 2,600,000 MWh of energy and 1800 K tons of CO2 are produced and eliminated annually, respectively. The estimated price tag for the endeavor is USD 2235.2 million. |
| [62] | Da Mi Floating Solar PV Park | Binh Thuan, Vietnam | 47.5 MWp | 2019 | 50 | This initiative is projected to generate 70,000 MWh of electricity per year. The total installed cost is USD 66.44 million, and the structure uses 143,940 PV modules. |
| [63] | Wisewood Floating Solar Plant | Phetchaburi, Thailand | 1.26 MWp | 2019 | 2.62 | A total of 3275 PV modules were used in this bank-anchoring-based construction, which spans 43% of the lake area. |
| [64] | Sungai Labu | Sepang, Malaysia | 108 kWp | 2015 | 4.2 | A total of 432 PV modules were used in this bottom-anchoring-based construction, which spans 4% of the lake area. |
| [65] | Ulu Sepri | Negeri Sembilan, Malaysia | 270 kWp | 2016 | 18 | A total of 900 PV modules were used in this bottom-anchoring-based construction, which is settled in a water retention dam. It spans 1.5% of the dam’s area. |
| [64] | Solarvest Selangor Floating Solar PV Park | Selangor, Malaysia | 13 MWp | 2020 | 53 | A total of 16,640 MWh of energy is produced by this LSS facility, providing enough renewable power for 5800 dwellings at an LCOE of USD 0.051 per kWh. The annual CO2 reduction is 11,548 tons, and the estimated cost for this plant is USD 24.886 million. |
| [66] | Saemangeum Floating Solar Energy Project | North Jeolla, South Korea | 2.1 GWp | Under Construction | 3000+ | This project is going to be the world’s largest FSPV plant to date. The investment for this plant is more than USD 515 million. |
| Ref. | Goals and Scopes | Research Gaps | Limitations of Large-Scale FSPV |
|---|---|---|---|
| [67] | To assess the cooling impacts of different FSPV technologies and analyze FSPV plant energy generation. | Inadequate simulation tools and techniques for estimating the generation of energy. | Inadequate information on the cooling effects of various technologies, reliance on technology, and location. |
| [68] | To identify the performance of an FSPV chimney plant in Isfahan, Iran, and to assess its viability based on the return of finance rate, net price value and finance payback duration. | Lack of information on the feasibility analysis of FSPV at Isfahan, Iran. | The need of a significant number of water bodies as well as the possibility of environmental harm. |
| [69] | To assess the economic and environmental viability of a 10 MW FSPV facility. | Lack of explanation of appropriate places for FSPV plants and the payback period. | Increase in levelized cost of energy (LCOE) and the impacts of environmental stress factors. |
| [27] | To offer a global assessment of FSPV systems. | Lack of design studies and applications of FSPV. | Existence of land, its development and purchase, substation capacity and evacuation. |
| [29] | To present a quick summary of onshore and offshore FPV systems, to analyze their pros and cons and to predict their future. | Lack of information about installation and levelized cost for offshore FSPV plants. | Wind and wave loads. |
| [70] | To focus on FSPV technology, including varieties and studies of floating solar farms. The research also examines 1 MW floating PV plants at Kota Barrage and Kishore Sagar Lake in Rajasthan and calculates energy, water saved from evaporation and CO2 emissions. | The discussion is restricted to the reliability of the grid, payback time, capital expenditure and operational expenditure. | Insufficient evidence on long-term performance and the possibility for adverse effects on the environment. |
| [71] | To describe the hybrid floating PV system and list merits and drawbacks. | There is no discussion about the applicability of hybrid FSPVs to manmade lakes. | The absence of a suitable site and the possibility of having an influence on the environment. |
| [72] | To analyze the simulations, theoretical groundwork, calculations, per unit cost and advantages of FSPV. | Insufficiency of information pertaining to design optimization, floating structures, anchoring and mooring systems. | Demand for a massive number of water bodies and dependence on the power grid. |
| [24] | To present an assessment of previous endeavors in confined water bodies, including reservoirs, ponds and small lakes. | Its coverage is restricted to confined waterways completed before 2013. | Effects associated with the environment. |
| [55] | To analyze the latest FPV research’s pros, cons and future. | The effect of FSPV on aquatic ecosystems and sea water quality. | Difficulties of the marine environment in contrast to the freshwater one. |
| [73] | To identify essential technologies, analyze the FSPV literature and explore new, big and distinctive installations. | The absence of norms and guidelines for the design. | An increased starting cost, water body bathymetry features and a high corrosion rate at a saltwater reservoir. |
| [74] | To study FSPV effectiveness, to breakdown and debate possible design ideas to increase the efficiency and cost-effectiveness of FSPV facilities and to summarize experimental findings. | The impact of tracking, cooling and focus on FSPV efficiency is ignored. | Seawater installations face the difficulties of corrosion, wave and wind impacts and algae growth. Costs for offshore FSPV rafts and mooring systems are more than those for a freshwater reservoir. |
| [50] | To evaluate and compare the effects of projects throughout the design, developing, functioning and disposal in tropical environments. | On the long-term effectiveness of FSPV, humidity effects are absent. | FSPV maintenance is difficult if the body of water is often subjected to strong winds, waves, or storms. |
| [75] | To examine various technologies, to conduct a comparative analysis between FSPV and land-based PV, to analyze FPV plants’ economics and environmental consequences and to explain the technology’s principal obstacles and opportunities. | Less information about the long-term effects of putting FSPV modules on water bodies. Salt buildup and algae blooms can damage the modules, and FSPV systems cost more to build. | Salt accumulation could make it harder to choose the best PV panels for an offshore FSPV plant. |
| Structure Type | Description |
|---|---|
| Class 1 |
|
| Class 2 |
|
| Class 3 |
|
| Rigid | |
| Flexible |
| Month | Ta | H_Gh | H_Dh | Sd | RH | Snd |
|---|---|---|---|---|---|---|
| [°C] | [kWh/m2] | [kWh/m2] | [h] | [%] | [mm] | |
| January | 25.6 | 136.8 | 72.7 | 159 | 86.9 | 0 |
| February | 26.2 | 152.6 | 77.3 | 185 | 83.9 | 0 |
| March | 27.1 | 177.1 | 77.9 | 205 | 83.0 | 0 |
| April | 27.8 | 169.4 | 78.8 | 203 | 82.5 | 0 |
| May | 28.0 | 166.8 | 75.7 | 206 | 83.6 | 0 |
| June | 27.8 | 146.2 | 78.2 | 188 | 83.1 | 0 |
| July | 27.5 | 154.9 | 82.7 | 296 | 83.0 | 0 |
| August | 27.4 | 154.2 | 87.6 | 193 | 82.8 | 0 |
| September | 27.2 | 152.6 | 77.7 | 171 | 83.4 | 0 |
| October | 27.0 | 154.1 | 89.5 | 160 | 84.8 | 0 |
| November | 26.4 | 115.9 | 72.8 | 119 | 88.0 | 0 |
| December | 25.8 | 104.2 | 70.2 | 114 | 88.3 | 0 |
| Criteria | Sub-Criteria | Consequence of Observation |
|---|---|---|
| Topography | Geospatial suitability of architecture | The south-east corner of the university, next to Kuala Pahang, is where FSPV installation, operation and maintenance are suggested. In Pahang, sand and clay are the predominant types of soil. However, the projected lake’s soils are clay and loam, descending in the direction of the water [106]. |
| Adequate space for storage and transportation of materials | It is feasible to transport materials via huge trucks from any region of the country because the road near the lake is around 40 feet wide, and there are enough spaces for storing goods inside. | |
| Stable, appropriate and sufficient area for a floating base | The proposed location is favorable for constructing a floating platform because lakes C and D have enough space and water basins. | |
| Limitations due to construction work | The adjacent lake road would stay congested during the construction period, and the lake’s beauty would be temporarily affected, but it would return after the work is over. | |
| Hydrology | Level of water of the lake | A practical measurement was taken on 2 January 2023 and revealed that the lake’s water level is around 9 m in the middle and 2.5–3 m closer to the coast. The water level fluctuates between 0.5 and 2 m due to seasonal precipitation. |
| Determination of the hydrological rate and outflow mechanism | It should include a precise mechanism for measuring the water flow rate to calculate the loads on the floats and anchors. However, regrettably, there are currently no measurement facilities available. When the lake’s water level climbs above its threshold, however, the systemic sewage gates are there to release the water. | |
| Water quality and pH level | According to a visual inspection, the surface water is not as good as the groundwater [107]. The experimental investigation [108] determined that the water in the lakes has an average pH of 6.64. | |
| Risk of floods and cyclones | The lower region of Pahang seems to have a 20% [109] chance of flooding due to various reasons. Despite being one of the higher locations above sea level, an uncertain flood or cyclone may develop in the lakes due to rainfall with a minimal amount of South China Sea wave action. | |
| Height of waves at the lake | At UMP Lake, no observable large waves are seen. However, sometimes, especially during the northeast monsoon season, a small number of waves might be visible, owing to strong storms or wind. | |
| Geology | Soil quality of the lake region | Due to the UMP Lake’s proximity to the South China Sea, sandy soil is expected to be present there. Its soil around the lake is quite good sand with Cu > 4, with a soil sample of almost 2.63 mg/m3 [107]. |
| Probability of earthquakes | In Pahang, Pekan is in seismic risk region 2 [110]. There is a significant danger of earthquakes in the installation region because Pahang has previously seen many earthquake incidents [111]. | |
| Risk of land erosion | The potential annual soil erosion for the surface is 9551.93 tons/ha/year at the installation region [106]. | |
| Roads and Networks | Connecting road at the worksite | At the worksite, there is a suitable connecting road for both large and light transportation. |
| Appropriateness of grid integration | To integrate the generated electricity into the national grid, there is a 33/11 kV substation at UMP, which is around 2.3 km away from the plant. | |
| Protection of the site | The installation site is located inside the university area; thus, the region is always extremely secure. |
| Technical Parameters of PV Panels | |||
| Manufacturer | Trina Solar | Max. Power Point Voltage (Vmpp) | 31.8 V |
| Model | TSM-DE19 | Short Circuit Current (Isc) | 18.56 A |
| Technology | Si-mono | Max. Power Point Current (Impp) | 17.45 A |
| Maximum Power (Pmpp) | 555 Wp | Module size | 1096 × 2384 mm2 |
| Open Circuit Voltage (Voc) | 38.1 V | Number of cells | 2 × 55 |
| Technical Parameters of Inverter | |||
| Manufacturer | Sungrow | Nominal AC power | 2000 kW |
| Model | SG2000 | Max. AC apparent power | 2200 kVA |
| Protection | IP54 (NEMA3R) | Nominal AC current | 3666 A |
| Operating mode | MPPT | Max. AC current | 4032 A |
| Size (W × H × D) | 2.99 × 2.59 × 2.43 m3 | Rated grid voltage | 415 V |
| Weight | 5700 Kg | Grid voltage range | 400–460 V |
| Max. PV input voltage | 1000 V | Nominal grid frequency | 50/60 Hz |
| Startup input voltage | 500 V | Feed-in phases | Triphased |
| Min. working voltage | 460 V | Maximum efficiency | 99% |
| MPPT voltage range | 460–850 V | Number of MPPT | 4 |
| Max. input current | 4880 A | Number of string inputs | 32 |
| Technical Parameters of Transformer | |||
| Manufacturer | ABB | Rated Power | 12.5 MVA |
| Model | Customized | Rated voltage (HV) | 11 kV |
| Number of phases | Three | Rated voltage (LV) | 0.415 kV |
| Cooling system | ONAN | Frequency | 50 Hz (±5%) |
| Technical Parameters of DC combiner box | |||
| Manufacturer | MOREDAY | Max. input current per channel | 20 A |
| Model | MDXLD-PV24/1 | Max. DC output current | 400 A |
| Max. input | 24 strings | Max. DC short-circuit current | 21–32 A |
| Max. output | 1 string | Protection level | IP65 |
| Max. DC input voltage | 1500 V | Dimension (W × H × D) (m3) | 1.2 × 0.75 × 0.25 |
| Plant Summary | |||
|---|---|---|---|
| System nominal DC power | 12 MWp | Rough panels area | 56,490 m2 |
| System Max. DC power | 11.828 MWp | Sensitive cells area | 52,428 m2 |
| System AC power, | 10 MW | Plant occupied area | 60,636 m2 |
| Pnom ratio (DC:AC) | 1.20 | Number of DC combiner boxes | 50 pcs |
| Vmpp (STC) | 663 V | Number of inverters | 5 pcs |
| Impp (STC) | 16.568 kA | Number of transformers, 2.5 MVA | 5 pcs |
| Number of PV panels | 21,620 pcs | Number of AC isolator switches | 5 pcs |
| Number of panels per string | 23 pcs | Substation | 1 pc |
| Array size | 940 × 23 | Weather station | 1 pc |
| Number of floating pontoons (min) | 18,017 pcs | Switchgear and protection | 1 pc |
| SL No. | Purpose | Parameters | Total Cost (Million USD) |
|---|---|---|---|
| 1 | Civil works | Anchoring and mooring system | 0.19 |
| Floating structure | 0.90 | ||
| Wage cost of labor (construction period) | 0.40 | ||
| 2 | Equipment | PV panels | 1.78 |
| Inverters | 0.30 | ||
| DC combiner box | 0.01 | ||
| Weather station | 0.01 | ||
| DC and AC Cables | 0.26 | ||
| Grid substation (transformer, switchgear, SCADA and others) | 1.26 | ||
| Testing and commissioning | 0.01 | ||
| Water storage, supply, repair boats and water monitoring sensors | 0.07 | ||
| Profit edge | 0.60 | ||
| 3 | Miscellaneous | Accessories, fasteners, wiring, PVC flexible pipe, SDB board, fitting–fixing, energy meter, monitoring and display, UPS, lan tools and others | 0.03 |
| 4 | Planning, consultation and inspection | Grid system analysis | 0.02 |
| Feasibility analysis | 0.20 | ||
| Performance analysis | 0.01 | ||
| Geological analysis | 0.01 | ||
| Hydrographic inquiry | 0.01 | ||
| Ecological impact analysis | 0.02 | ||
| Engineering simulation and design | 0.10 | ||
| Explanation of the methodology, assessment strategy, paperwork, and guarantee setup | 0.02 | ||
| Comprehensive engineering assessment | 0.04 | ||
| Budget of finance (from planning to completion)—independent engineer | 0.02 | ||
| 5 | Inland transportation | Logistics | 0.38 |
| 6 | Taxes and duties | Total tax incidence on solar panels (24%) | 0.07 |
| VAT (6%) | 0.45 | ||
| 7 | Additional investment expenditures | Land development and construction | 0.02 |
| Environmental and social cost | 0.25 | ||
| Project management, construction and supervision | 0.25 | ||
| 8 | Contingency | Physical and price | 0.60 |
| 9 | Costs related to the execution | Interest upon installation | 0.64 |
| Fees for committing | 0.01 | ||
| Initial investment cost (without replacement and O&M) | 8.94 | ||
| 10 | Replacement cost | 1.40 | |
| 11 | Operation and maintenance (O&M) cost (21 years) | 9.39 | |
| Total cost of the system (CTS) | 19.73 | ||
| Term | Parameters of EC for LSS | Status of the Proposed FSPV Plant |
|---|---|---|
| General | The LSS program participants should be a local company/authority/owner. | UMP is a national public university of Malaysia. |
| A land or water body can be used for other purposes. | Water bodies are also used for fisheries. | |
| Plant capacity must be between 1 MW and 100 MW. | The proposed plant is 10 MW. | |
| The PPA duration is 21 years. | The design and calculation of the plant were made considering its 21-year lifespan. | |
| Fixed and lower energy prices. | The LCOE of the proposed plant is USD 0.052, which is acceptable according to the previous LSS bids. | |
| Connection study | The connection voltage level is 0.415 kV, 11 kV and 33 kV for the distribution voltage network. | The selected transformer’s output voltage is 11 kV, and it is connected to an 11 kV bus. |
| The nodal point must be at a distribution license (DL) owned substation. | As UMP has a 33/11 kV DL license substation, the nodal point must be in the UMP substation. | |
| Must have VCB/GIS switchgear and a SCADA system. | A GIS-based HT panel and a SCADA-based monitoring system are there. | |
| Power system study | Information related to the single line diagram, plant layout, datasheet of PV panels and inverters, site, location layout, installed and output capacity, COD and others must be sent to CE. | The maximum amount of information possible is provided in this article. More related information and documents will be sent at the time of application. |
| Technical study | Technical parameters, such as voltage range, steady state voltage limit, frequency, power factor, harmonics, fault level, synchronization, etc., must be harmonized with the existing TNB’s network. | The design and selection of equipment were made considering the TNB network. Furthermore, an in-depth study on technical parameters will be conducted before the Request for Proposal (RFP). |
Disclaimer/Publisher’s Note: The statements, opinions and data contained in all publications are solely those of the individual author(s) and contributor(s) and not of MDPI and/or the editor(s). MDPI and/or the editor(s) disclaim responsibility for any injury to people or property resulting from any ideas, methods, instructions or products referred to in the content. |
© 2023 by the authors. Licensee MDPI, Basel, Switzerland. This article is an open access article distributed under the terms and conditions of the Creative Commons Attribution (CC BY) license (https://creativecommons.org/licenses/by/4.0/).
Share and Cite
Islam, M.I.; Jadin, M.S.; Mansur, A.A.; Kamari, N.A.M.; Jamal, T.; Hossain Lipu, M.S.; Azlan, M.N.M.; Sarker, M.R.; Shihavuddin, A.S.M. Techno-Economic and Carbon Emission Assessment of a Large-Scale Floating Solar PV System for Sustainable Energy Generation in Support of Malaysia’s Renewable Energy Roadmap. Energies 2023, 16, 4034. https://doi.org/10.3390/en16104034
Islam MI, Jadin MS, Mansur AA, Kamari NAM, Jamal T, Hossain Lipu MS, Azlan MNM, Sarker MR, Shihavuddin ASM. Techno-Economic and Carbon Emission Assessment of a Large-Scale Floating Solar PV System for Sustainable Energy Generation in Support of Malaysia’s Renewable Energy Roadmap. Energies. 2023; 16(10):4034. https://doi.org/10.3390/en16104034
Chicago/Turabian StyleIslam, Md. Imamul, Mohd Shawal Jadin, Ahmed Al Mansur, Nor Azwan Mohamed Kamari, Taskin Jamal, Molla Shahadat Hossain Lipu, Mohd Nurulakla Mohd Azlan, Mahidur R. Sarker, and A. S. M. Shihavuddin. 2023. "Techno-Economic and Carbon Emission Assessment of a Large-Scale Floating Solar PV System for Sustainable Energy Generation in Support of Malaysia’s Renewable Energy Roadmap" Energies 16, no. 10: 4034. https://doi.org/10.3390/en16104034