Article

Enhancing Hydrogen Production from Biogas through Catalyst Rearrangements

1
Department of Fundamental Research in Energy Engineering, AGH University of Science and Technology, 30-059 Krakow, Poland
2
Department of Machinery and Control Systems, Shibaura Institute of Technology, Tokyo 135-8548, Japan
*
Author to whom correspondence should be addressed.
Energies 2023, 16(10), 4058; https://doi.org/10.3390/en16104058
Submission received: 30 March 2023 / Revised: 26 April 2023 / Accepted: 6 May 2023 / Published: 12 May 2023
(This article belongs to the Collection Energy Efficiency and Environmental Issues)

Abstract

:
Recent trends in hydrogen production include using renewable energy sources, e.g., biogas as feedstocks for steam reforming. Crucial to the field is minimizing existing reforming reactors for their applications to fuel cell systems. Here, we present a novel design of a steam reforming reactor for an efficient biogas conversion to hydrogen. The design includes a radial division of the catalytic insert into individual segments and substituting parts of the catalytic material with metallic foam. The segment configuration is optimized using a genetic algorithm to maximize the efficiency of the reactor. Changes in the catalytic insert design influence the thermal conditions inside the reactor, leading to moderation of the reaction rate. This article presents a promising approach to producing hydrogen from renewable sources via steam reforming. A significant enhancement in the reforming process effectiveness is achieved with a notable decrease in the amount of the catalyst used. The final results demonstrate the capability for acquiring a similar level of biogas conversion with a 41% reduction of the catalytic material applied.

1. Introduction

In recent years, the application of biogas as a sustainable fuel source has gained significant attention. The rising awareness of modern societies and legislation forced the energy industry to start seeking alternative energy sources to fossil fuels [1,2]. Biogas is produced through the breakdown of organic matter and can be considered renewable [3], thus meeting the requirements of the environmentally friendly agenda and making biogas an appealing fuel source. The steam reforming of biogas is a particularly promising application, as it is used for the conversion of hydrocarbons to produce hydrogen [4]. Hydrogen can be used further as an emission-free energy source either through electrochemical conversion or combustion [5,6]. The reforming reaction can be successfully conducted using a variety of biofuels, allowing the reforming process to be considered a renewable source of green hydrogen [7,8]. The importance of biogas as a fuel for the process is crucial, as it is considered to have less impact on the environment than the reforming of natural gas [9]. The reforming process brings a series of issues regarding the thermal conditions occurring inside the reactor, originating from its strong endothermic character [10]. The rapid temperature decay at the upstream region of the reactor results in thermal stresses forming in the reactor, leading to its uneven degradation and reduction of the unit’s lifetime [11]. Furthermore, the uneven temperature distribution reduces the ease of process control. The presented research aims to alleviate the negative consequences of the strong endothermic character of the process via the introduction of the macro-patterning concept [12]. The majority of researchers have focused on the parametric study and optimization of the reaction conditions, allowing for limited improvements [13,14]. The investigation of process parameters is especially important when considering biogas as a fuel, due to its more complex composition, resulting in a higher risk of catalyst poisoning. However, different directions of the reforming development include the application of new materials and design concepts including new catalyst structures, the introduction of new kinds of catalyst supports, and modifications to the design of the reactor [15,16,17]. Research by Palma et al. predicts the intensification of the reforming process with the improvement of thermal conditions [18]. They proposed a structured catalyst for the enhancement of the axial and radial temperature distribution. The authors reported the overall process effectiveness to rise with the enhancement of the thermal conditions in the reactor, further verified by other works [19,20]. The presented research aims to alleviate the negative consequences of the strong endothermic character of the process via the introduction of radial division of the catalytic insert. In parallel to the research on the presented concept, a similar approach was successfully investigated by Cherif et al. [21,22]. They introduced a radially structured catalytic insert, with alternately placed platinum- and nickel-based catalysts for an ATR reforming reactor. The concept originates from the approach proposed by Settar et al. [23]. They described the influence of the application of the macro-patterned active surfaces with the introduction of metallic foam matrices on the enhancement of thermal conditions during the reaction [24,25]. The presented research extends the concept to fill the whole reactor’s volume with a catalytic composite of nickel- and yttria-stabilized zirconia (Ni/YSZ), maximizing the reaction region in the reactor [26]. Further, the reforming unit is divided into segments in the radial direction, instead of the previously investigated longitudinal division [12]. Non-catalytic metallic foam is used as a substitute for parts of the catalyst to adjust the intensity of the proceeding reaction, leading to the unification of the temperature field inside the reactor. To define the optimal alignment of the catalyst, an evolutionary algorithm is coupled with an in-house reforming simulation. By optimizing the configuration of the segments and their morphological parameters using a genetic algorithm, the research aims to achieve enhancement of the biogas reforming effectiveness [27]. The presented analysis includes:
  • Application of the catalytic insert’s radial division for the reforming of biogas.
  • Two individual approaches to the configuration of the segments.
  • Analysis of the robustness of the results, via measuring the hydrogen productivity of specimens defined by the specific algorithms.

2. Mathematical Model

The presented research is conducted using a mathematical model formulated for the process of steam reforming of biogas. Model biogas is analyzed, to allow for the exclusion of additional models incorporating the influence of fuel contamination. The reforming process is carried out in a tubular, micro-scale reactor. The reactor is divided into segments filled with either Ni/YSZ catalyst or metallic foam. Regardless of the material, segments may differ in their porosity and average pore size. The purpose of the metallic foam segments is to locally suppress the reaction, owing to their inferior catalytic activity [28]. Furthermore, metallic foams deliver significant heat exchange area, allowing the gas mixture to reheat after taking part in the reforming reaction on the catalytic segments [29]. Therefore, improving the thermodynamic conditions and enhancing the reaction rate on the successive catalytic segments. During the numerical analysis, two different approaches to the catalytic insert division are investigated. Figure 1 presents the comparison of the conventional reforming unit (Figure 1a) with macro-patterned reactors (Figure 1b,c). The conventional reactor has a homogeneous and continuous catalyst throughout its whole volume. The proposed reactors introduce radial division of the reactor and substitution of its parts with metallic foam segments. The investigated reactors are divided into five coaxial segments. The first of the analyzed strategies incorporate radial division with a constant width of inlet surfaces of each cylinder (Figure 1b). The second strategy predicts the application of identical area of the inlet surfaces for each of the coaxial cylinders (Figure 1c). The computational domain is designed to maintain simple geometrical shapes, to reduce the complexity of the domain [30]. Furthermore, due to the reactor’s cylindrical shape, the computational domain could be simplified into two dimensions. The axial symmetry is assumed, allowing for an application of a quasi-three-dimensional model [31]. Therefore, transport equations for two-dimensional analysis are applied in the mathematical model of the reforming process.

2.1. Chemical Reactions Model

The steam reforming reaction can be summarized by three reactions, dominating the process [11,32]. The reactions are steam reforming of methane (MSR) (Equation (1)), dry reforming of methane (DRY) (Equation (2)), and water–gas shift reaction (WGS) (Equation (3)) [33]. The stoichiometric equations describing the catalytic conversion of biogas are expressed as follows:
CH 4 + H 2 O 3 H 2 + CO , Δ H MSR = 206.1 kJ mol ,
CH 4 + CO 2 2 H 2 + 2 CO , Δ H DRY = 247 kJ mol ,
CO + H 2 O H 2 + CO 2 , Δ H WGS = 41.15 kJ mol .
The presented numerical investigation assumes the application of model biogas as fuel. A mixture of H 2 , CO 2 , and CH 4 is fed to the reforming reactor [34]. The parameters describing the composition of the inlet gases are the steam-to-carbon ratio ( S C ) and carbon-to-carbon ratio ( C C ). The S C parameter defines the ratio of steam to methane and the C C defines the ratio of carbon dioxide to methane [35]. Choice of proper values of the S C and C C is essential for the prevention of the carbon deposition phenomenon [36]. Improper process conditions can lead to the formation of carbon deposits on the catalyst surface [37]. A proper setting of the ratios and the process’ temperature are proven to have the most significant influence on the alleviation of the poisoning hazard [38]. The enthalpy changes Δ H are taken from the literature [12,39]. Knowledge of their rates is essential to allow the inclusion of the reactions into the model. According to the research conducted by Brus et al. [40], the effective rate of MSR and DRY reactions can be expressed with a common equation:
R eff = w ˙ cat A MSR exp E a R ¯ T p CH 4 α p H 2 O + p CO 2 β .
The reaction rates of the MSR and DRY reactions take the following form:
R MSR = R eff p H 2 O p CO 2 + p H 2 O ,
R DRY = R eff p CO 2 p CO 2 + p H 2 O .
The two reforming reactions have a rather slow nature [41]. However, the WGS reaction behaves more unpredictably [42]. Therefore, the formulation of a reliable mathematical description of the reaction is not straightforward. Ahmed and Föger, noticed the WGS reaction to maintain equilibrium under specific conditions [43]. The equilibrium assumption is supported by a considerable number of analyses [44,45,46]. Numerical analyses introducing the assumption allow for a precise estimation of the reforming process and performed well when tested against experimental results [47,48,49]. Therefore, the analyzed process conditions are designed to meet the requirements of the WGS reaction equilibrium assumption, as the concept can be safely considered valid. Following the statements, CO, CO 2 , H 2 and H 2 O have to satisfy the equilibrium equation, described by the following formula:
K WGS = k WGS + k WGS = p CO 2 p H 2 p CO p H 2 O = exp Δ G WGS 0 R ¯ T .
Knowledge of the equilibrium constant allows for the derivation of WGS reaction rate, described with Equation (8):
R WGS = k WGS + p CO p H 2 O + k WGS p H 2 p CO 2 .
The values of partial pressures, included in the Equations (4)–(8), are derived from an analysis of the reactions’ stoichiometry [50,51]. Balancing the reaction’s stoichiometry allows computing the value of R WGS [40].
R WGS = n CH 4 outlet V = n CH 4 inlet × x c r V y c r .
The conversion rate of methane x c r and carbon monoxide y c r can be described as:
x c r = 1 n CH 4 inlet R MSR V n CH 4 inlet ,
y c r = K WGS + 3 x c r χ ω 2 ( K WGS 1 ) ,
where:
χ = ( K WGS S C + 3 x c r ) 2 ,
ω = 4 K WGS x c r ( K WGS 1 ) ( S C x c r ) .
The final formula for the WGS reaction’s rate can be achieved by combining Equation (10) with Equation (9):
R WGS = R MSR y c r .
Table 1 describes the rates of production and consumption of chemical specimens during the reactions (Equations (1)–(3)). The computed values are necessary for computation of the mass transfer Equation (Equation (19)), being its source terms. The heat generation rates by the specific reactions are directly induced by the reactions’ rates (Equations (5), (6) and (14)) and the values of enthalpy change Δ H [40,52]. The heat generation can be expressed with the following formulas:
Q MSR = Δ H MSR R MSR ,
Q DRY = Δ H DRY R DRY ,
Q WGS = Δ H WGS R WGS .

2.2. Heat and Mass Transfer Model

The mathematical description of the heat and mass transfer phenomena is implemented into the model. The assumption of the axial symmetry of the reactor allows for the simplification of the domain into two dimensions. Thus, the sets of the model’s equations are prepared considering the axis and radius as the only dimensions of the analyzed reactor’s geometry. The volume-averaging method is used for the derivation of the governing equations implemented in the model used for the presented numerical investigation [53]. The fundamental transport equations are derived for the laminar flow. The analyzed fluids are considered to be Newtonian and incompressible. Thus, the continuity equation takes the following form [54,55]:
ρ 0 U x x + 1 r r ρ 0 U r r = 0 ,
The continuity Equation (Equation (18)) is the only equation not to be affected by the change of segment morphology. The mass conservation is described using molar fractions of species taking part in the reaction (Equation (19)). The equation is formulated using Fick’s law of diffusion [11]. The rates of mass production and consumption S j depend on the MSR, DRY, and WGS rates and molar masses of the species taking part in the reaction [10,56]. Table 1 includes the exact description of the S j values included in the analysis.
ρ 0 U x Y j x + U r Y j r = x ρ 0 D j , eff Y j x + 1 r r r ρ 0 D j , eff Y j r + S j .
The effective mass diffusivity of species D j eff is computed using the following formula (Equation (20)) [57]:
D j , eff = ( 1 1 ε ) D j .
The value of D j eff depends on the value of porosity ε , making the parameter structure-dependant. The diffusion coefficients D j are computed according to Fuller’s method and Blanc’s law. The properties of substances are taken from the literature [58]. The momentum conservation depends directly on the insert’s morphology. The materials composing the insert are considered porous. Therefore, the material morphology has to be considered in the calculations. The parameters are porosity ε , permeability K p , and inertial coefficient c ine [27]. A separate momentum equation is formulated for each of the computational domain dimensions (Equations (21) and (22)).
ρ 0 ε 0 2 U x U x x + U r U x r = P x + μ ε 2 U x x 2 + 1 r r r U x r μ K p U x ρ 0 c ine K p U x U x 2 + U r 2 ,
ρ 0 ε 0 2 U x U r x + U r U r r = P r + μ ε 2 U r x 2 + 1 r r r U r r U r r 2 μ K p U r ρ 0 c ine K p U r U x 2 + U r 2 .
The value of permeability K p for specific segments is computed with Equation (23), including the segment’s porosity ε [59]:
K p = ε ( 1 ( 1 ε ) 1 / 3 ) 36 ( ( 1 ε ) 1 / 3 ( 1 ε ) ) d p 2 ,
where d p stands for an average pore diameter. The inertial coefficient c ine can be estimated with [60]:
c ine = 0.0095 g s 0.8 ε 3 ( τ 1 ) ( 1.18 ( 1 ε ) 3 π 1 g s ) 1 ,
where tortousity τ and and shape function g s are expressed with following equations [59,60]:
τ = ε 1 ( 1 ε ) 1 / 3 ,
g s = 1 exp ( 1 ε 0.04 ) .
The energy conservation Equation (Equation (27)) considers local thermal conditions, the materials’ parameters, and the heat sources calculated using Equations (15)–(17).
ρ 0 C p U x T loc x + U r T loc r = x λ eff T loc x + 1 r r r λ eff T loc r + Q s .
The introduction of metallic foams necessitates the application of a proper formula for the effective thermal conductivity λ eff [60]. The model chosen for calculating the value of the λ eff was proposed by Boomsma and Poulikakos and further corrected by Dai et al. [61,62]. The outcome relation allows for the derivation of equations describing the thermal conductivity of metallic foams. An adequate model taking the morphology of metallic foams into consideration is included, based on the described literature review [28].
λ eff = 2 l 2 ( R A + R B + R C + R D ) ,
where R A R D stand for the thermal resistances of the porous media cell Sections [12,62].

3. Numerical Model

To conduct numerical calculations using the prepared mathematical model, discretization of the prepared computational domain is required. The numerical simulation is created by the application of the Finite Volume Method [63]. A uniform computational grid with evenly spaced nodes is formed, to assure a minimal complexity of the calculations [30]. The numerical grid is set to take square-shaped elements and its dimensions are equal to 150 elements in the longitudinal and 25 elements in the radial directions. Sufficiency of the proposed grid dimensions is confirmed by previous research on the macro-patterned reforming reactors [12].

3.1. Transport Equations

The partial differential Equations (19), (21), (22) and (27), can be described in a generalized form [31,64]:
Ψ x ϕ x + Ψ r ϕ r = x Γ ϕ x + 1 r r r Γ ϕ r + S ¯ .
Equation (29) is formulated in a manner allowing for the inclusion of any dependant variable ϕ . The convective terms of the equation are described with the left-hand coefficients of Equation (29), which can be selected accordingly to the specific analysis requirements. The diffusive terms Γ and the source terms S ¯ are placed on the right side of the equation. Table 2 describes the source terms S ¯ included in Equation (29). The values presented in Table 2 are applicable only for the segments filled incorporating catalytic material. The source terms are neglected for the metallic foam segments, due to their inferior catalytic activity. The reforming reactions are considered to be put to a halt when the gas mixture passes through the non-catalytic region of the reactor [12].

3.2. Coaxial Segments Configuration

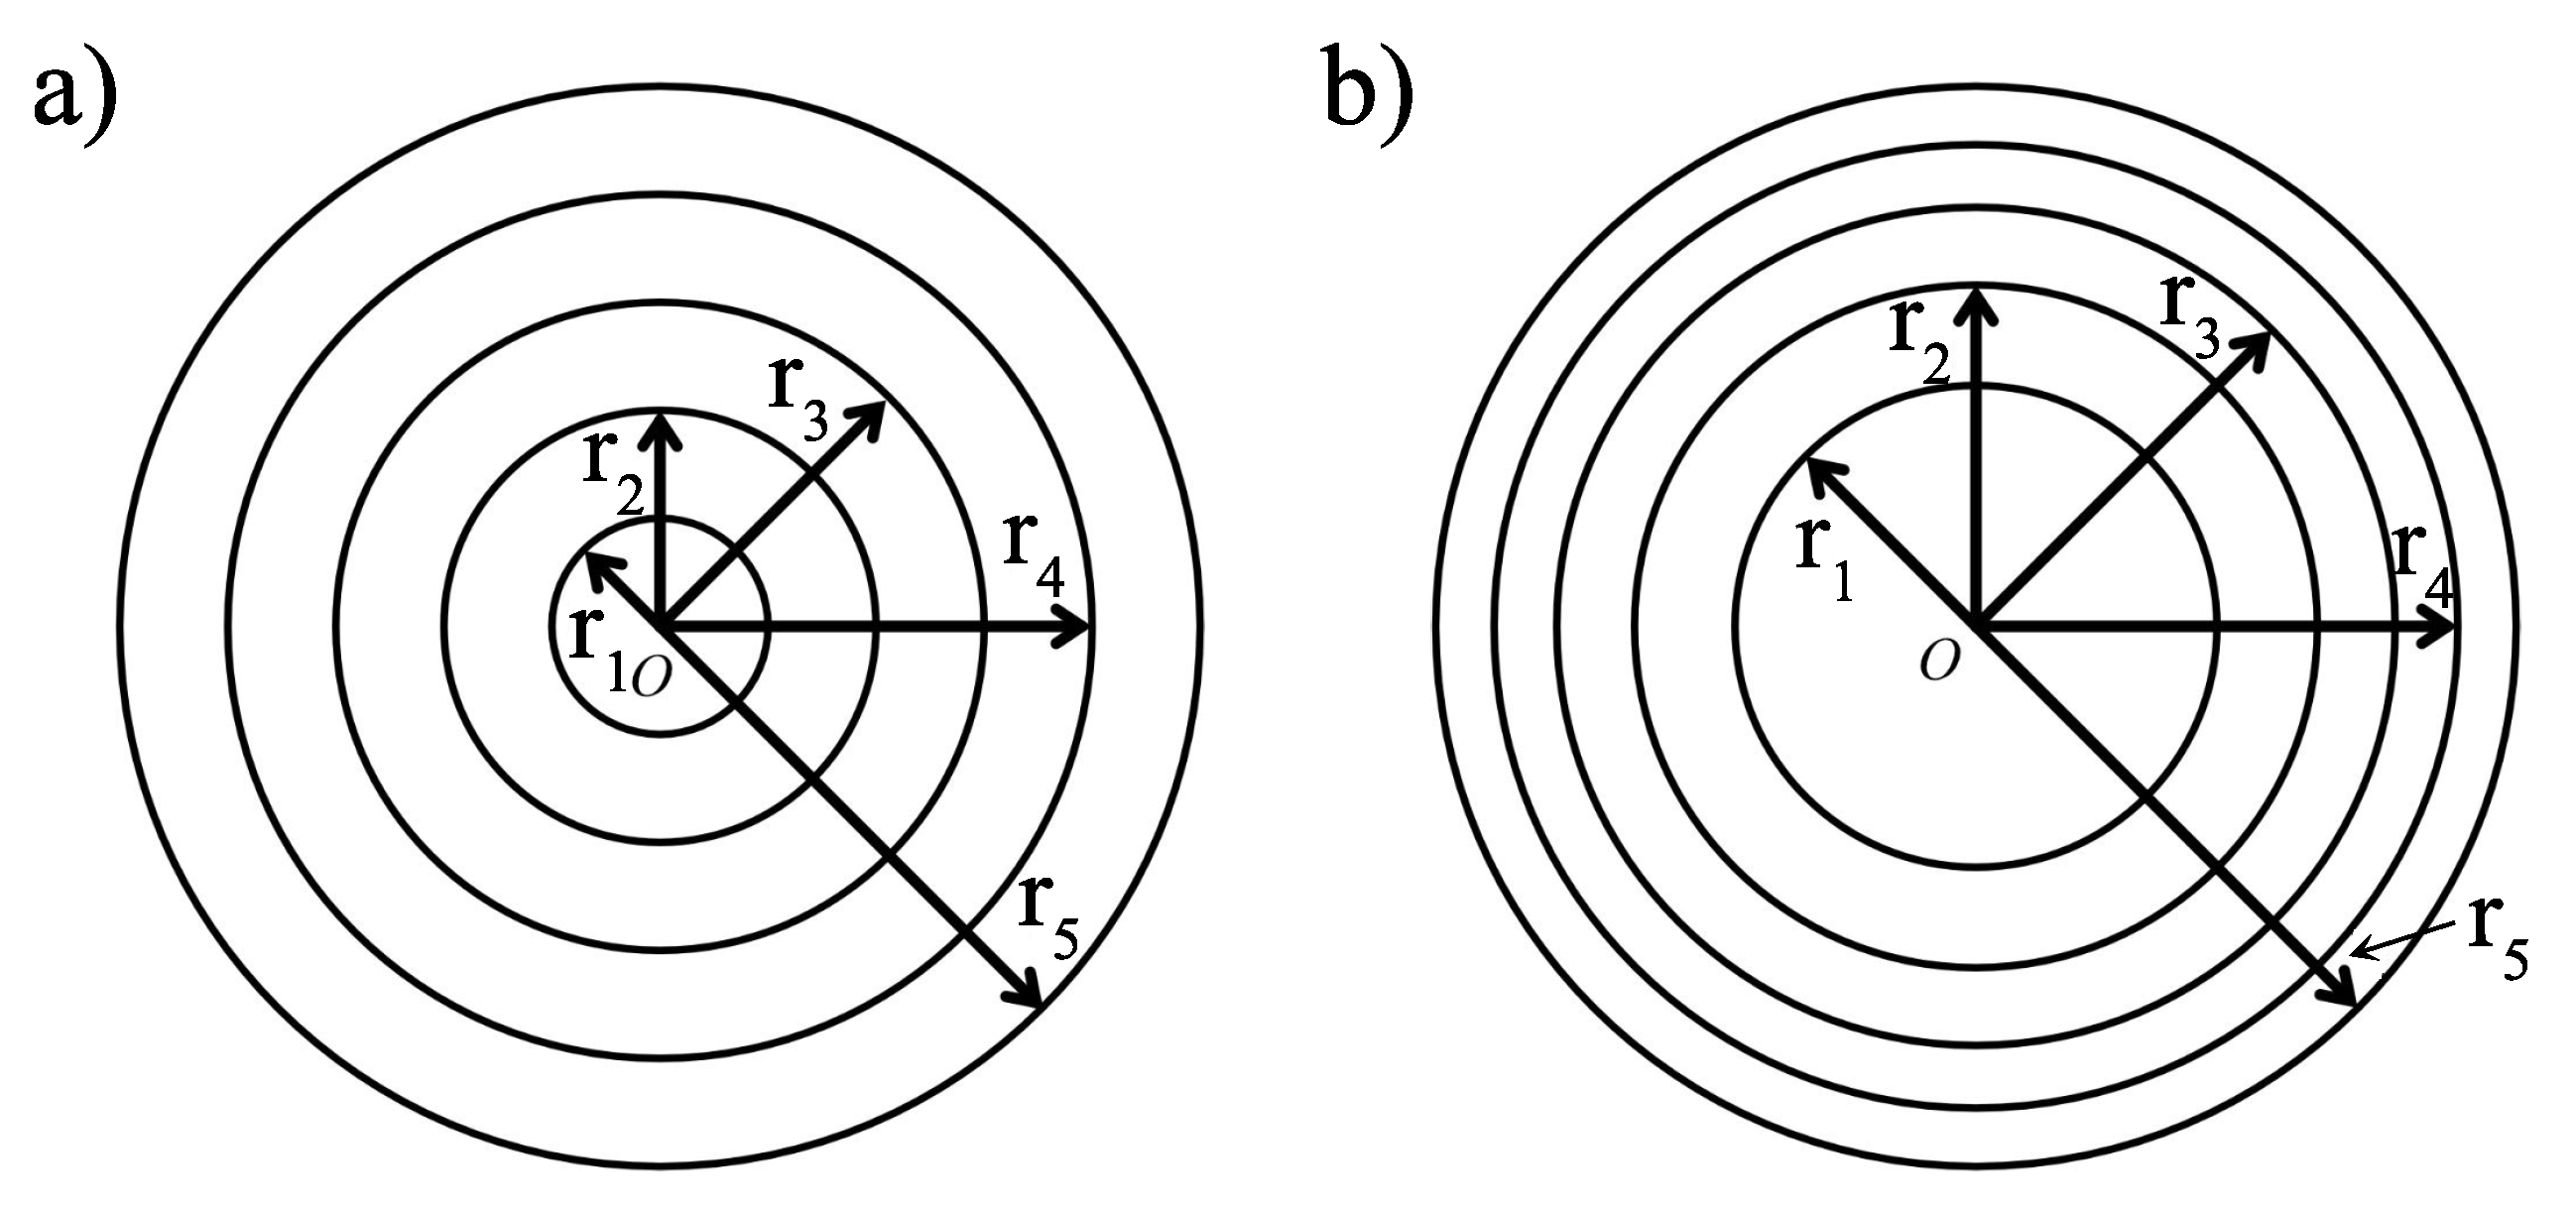
The segments created by the radial division of the catalytic insert take the form of four concentric cylinders and a core in the center of the reactor. Each segment occupies the whole length of the reactor. Strategy I predicts equal widths of the inlet and outlet surfaces, while Strategy II introduces an equal area of inlet and outlet surfaces. The two possible setups are summarized in Figure 2.
The exact dimensions of the particular rings for Figure 2b are calculated using the system of Equation (30), as follows:
2 π r 1 2 = 2 5 π R 2 2 π r 2 2 r 1 2 = 2 5 π R 2 2 π r 3 2 r 2 2 = 2 5 π R 2 2 π r 4 2 r 3 2 = 2 5 π R 2 2 π r 5 2 r 4 2 = 2 5 π R 2
Solving the system of Equation (30) allows the acquiring of radiuses lengths for Strategy II, summarized in Table 3.

3.3. Computational Domain and Boundary Conditions

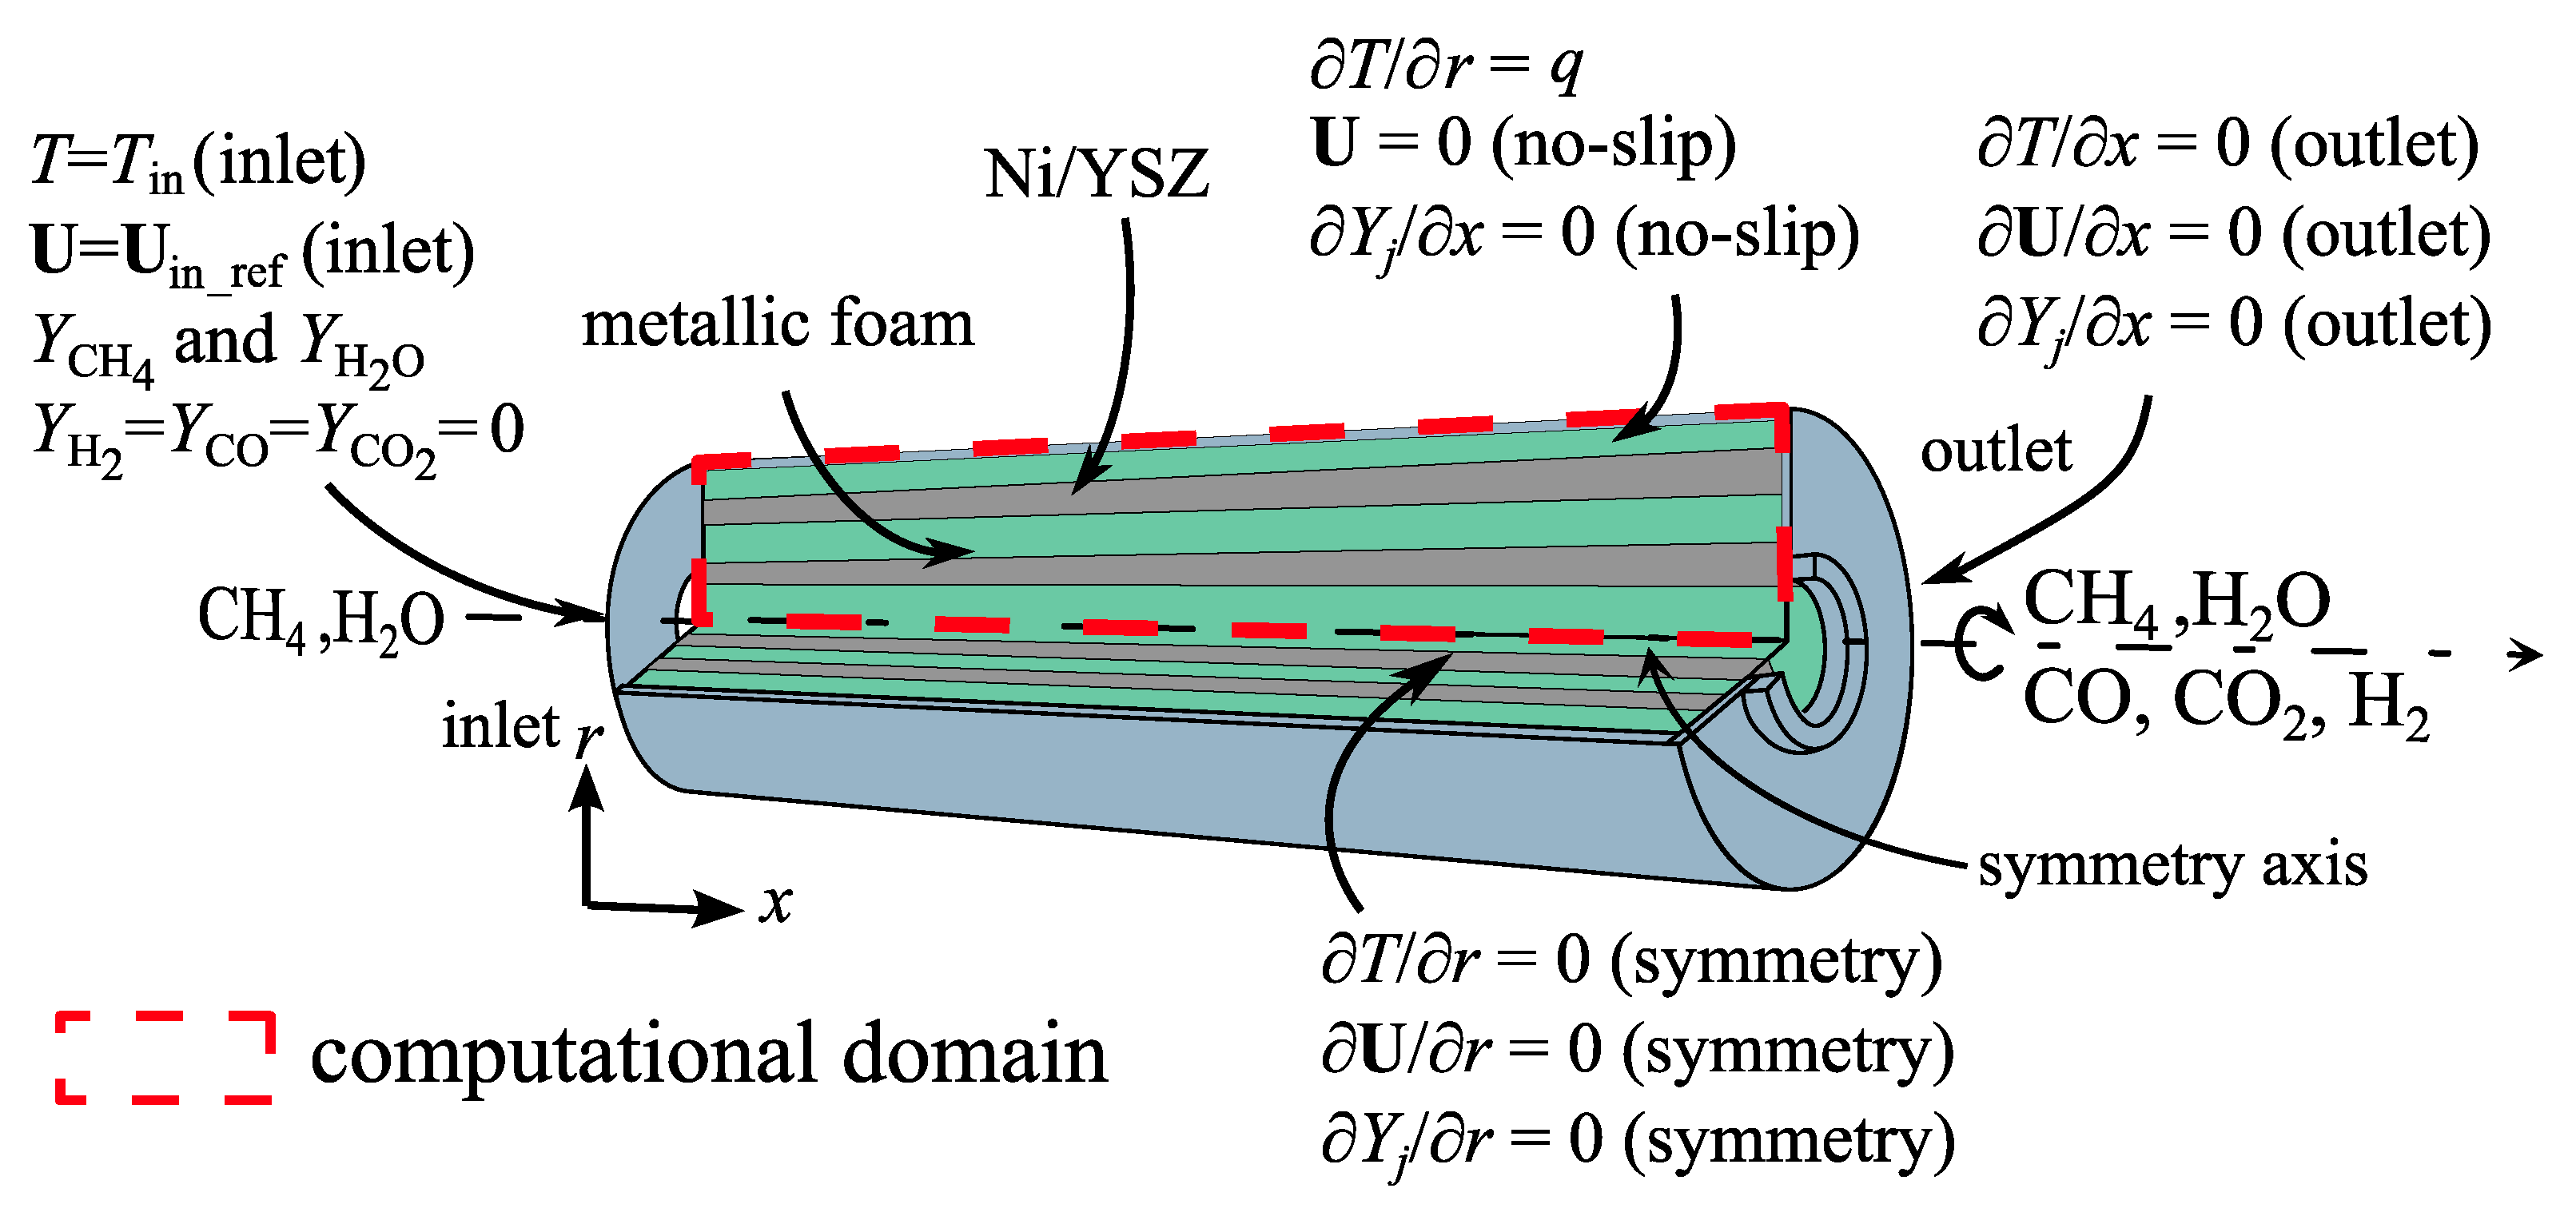
Figure 3 presents the computational domain prepared for the needs of the research. The exact boundaries of the domain are indicated with the red dashed line. The reactor’s axial symmetry allows for the simplification of the calculations to two dimensions only. Therefore, the analyzed region of the reactor constitutes a single slice of the reactor’s cross-section and each segment is represented by a rectangular shape. Segments may differ in their porosity value, average pore size, and catalytic character. The catalytic character decides if a specific segment has Ni/YSZ or metallic foam applied. The first material is a catalytic composite of nickel- and yttria-stabilized zirconia (Ni/YSZ). The catalytic material is chosen accordingly to the experimental analyses conducted previously [12,40]. The catalyst used in the experiment was supplied by AGC SEMI CHEMICAL CO in 2009. It underwent a treatment process at an elevated temperature of 800 °C, with a gas mixture consisting of 150 mL/min nitrogen and 100 mL/min hydrogen, to facilitate the reduction of NiO. The catalyst powder featured a spherical morphology, boasting a diameter of 0.96 μ m and a specific surface area of 4.4 m 2 per 1 g of catalyst. Steel foam is chosen as the second material, introduced for the improvement of heat transfer inside the reactor. The metallic foam segments are introduced as a medium for local containment of the reactions. Suppression of the reforming process, combined with the vast heat exchange capabilities of steel foam, is expected to allow the gas mixture to acquire additional energy before proceeding to the catalytic segment [65]. The model equations require the definition of the thermal conductivity coefficients. λ solid for Ni/YSZ composite is set at 22 W m 1 K 1 [66]. Steel foam is assumed to have the value of λ solid equal to 30 W m 1 K 1 [67]. The remaining parameters analyzed during the investigation describe the reforming process conditions. The setting of SC and C C values is important, due to their influence on the formation of carbon deposits [68]. Applying correct values of the ratios alleviates the risk of poisoning the reactor’s catalyst [69]. S C ratio for the presented analysis is equal to 2.0 and the C C value is set at 1.5, preventing carbon formation [33,38]. The model biogas is assumed as the feedstock for the process and is fed with a rate of 2.64 × 10 6 mol s 1 . Therefore, inlet gas composition consists of methane and carbon dioxide. The temperature of the fuel flowing inside the unit is considered to reach the temperature of the reformer instantly. The symmetry boundary conditions are set at the symmetry axis, while the no-slip boundary condition is applied at the wall of the reformer. The reactor is placed in conditions resembling heating in a furnace. To simulate the conditions, a constant heat flux is applied at the reactor’s wall. The reactor’s wall is assumed to be 0.001 m thick and serves as the sole barrier between the computational domain and the environment. The λ solid for the reactor’s wall is equal to 30 W m 1 K 1 , as the same material as for the metallic foam is chosen [67]. Figure 3 summarizes all of the boundary conditions essential for the conduction of the numerical analysis.

4. Genetic Algorithm

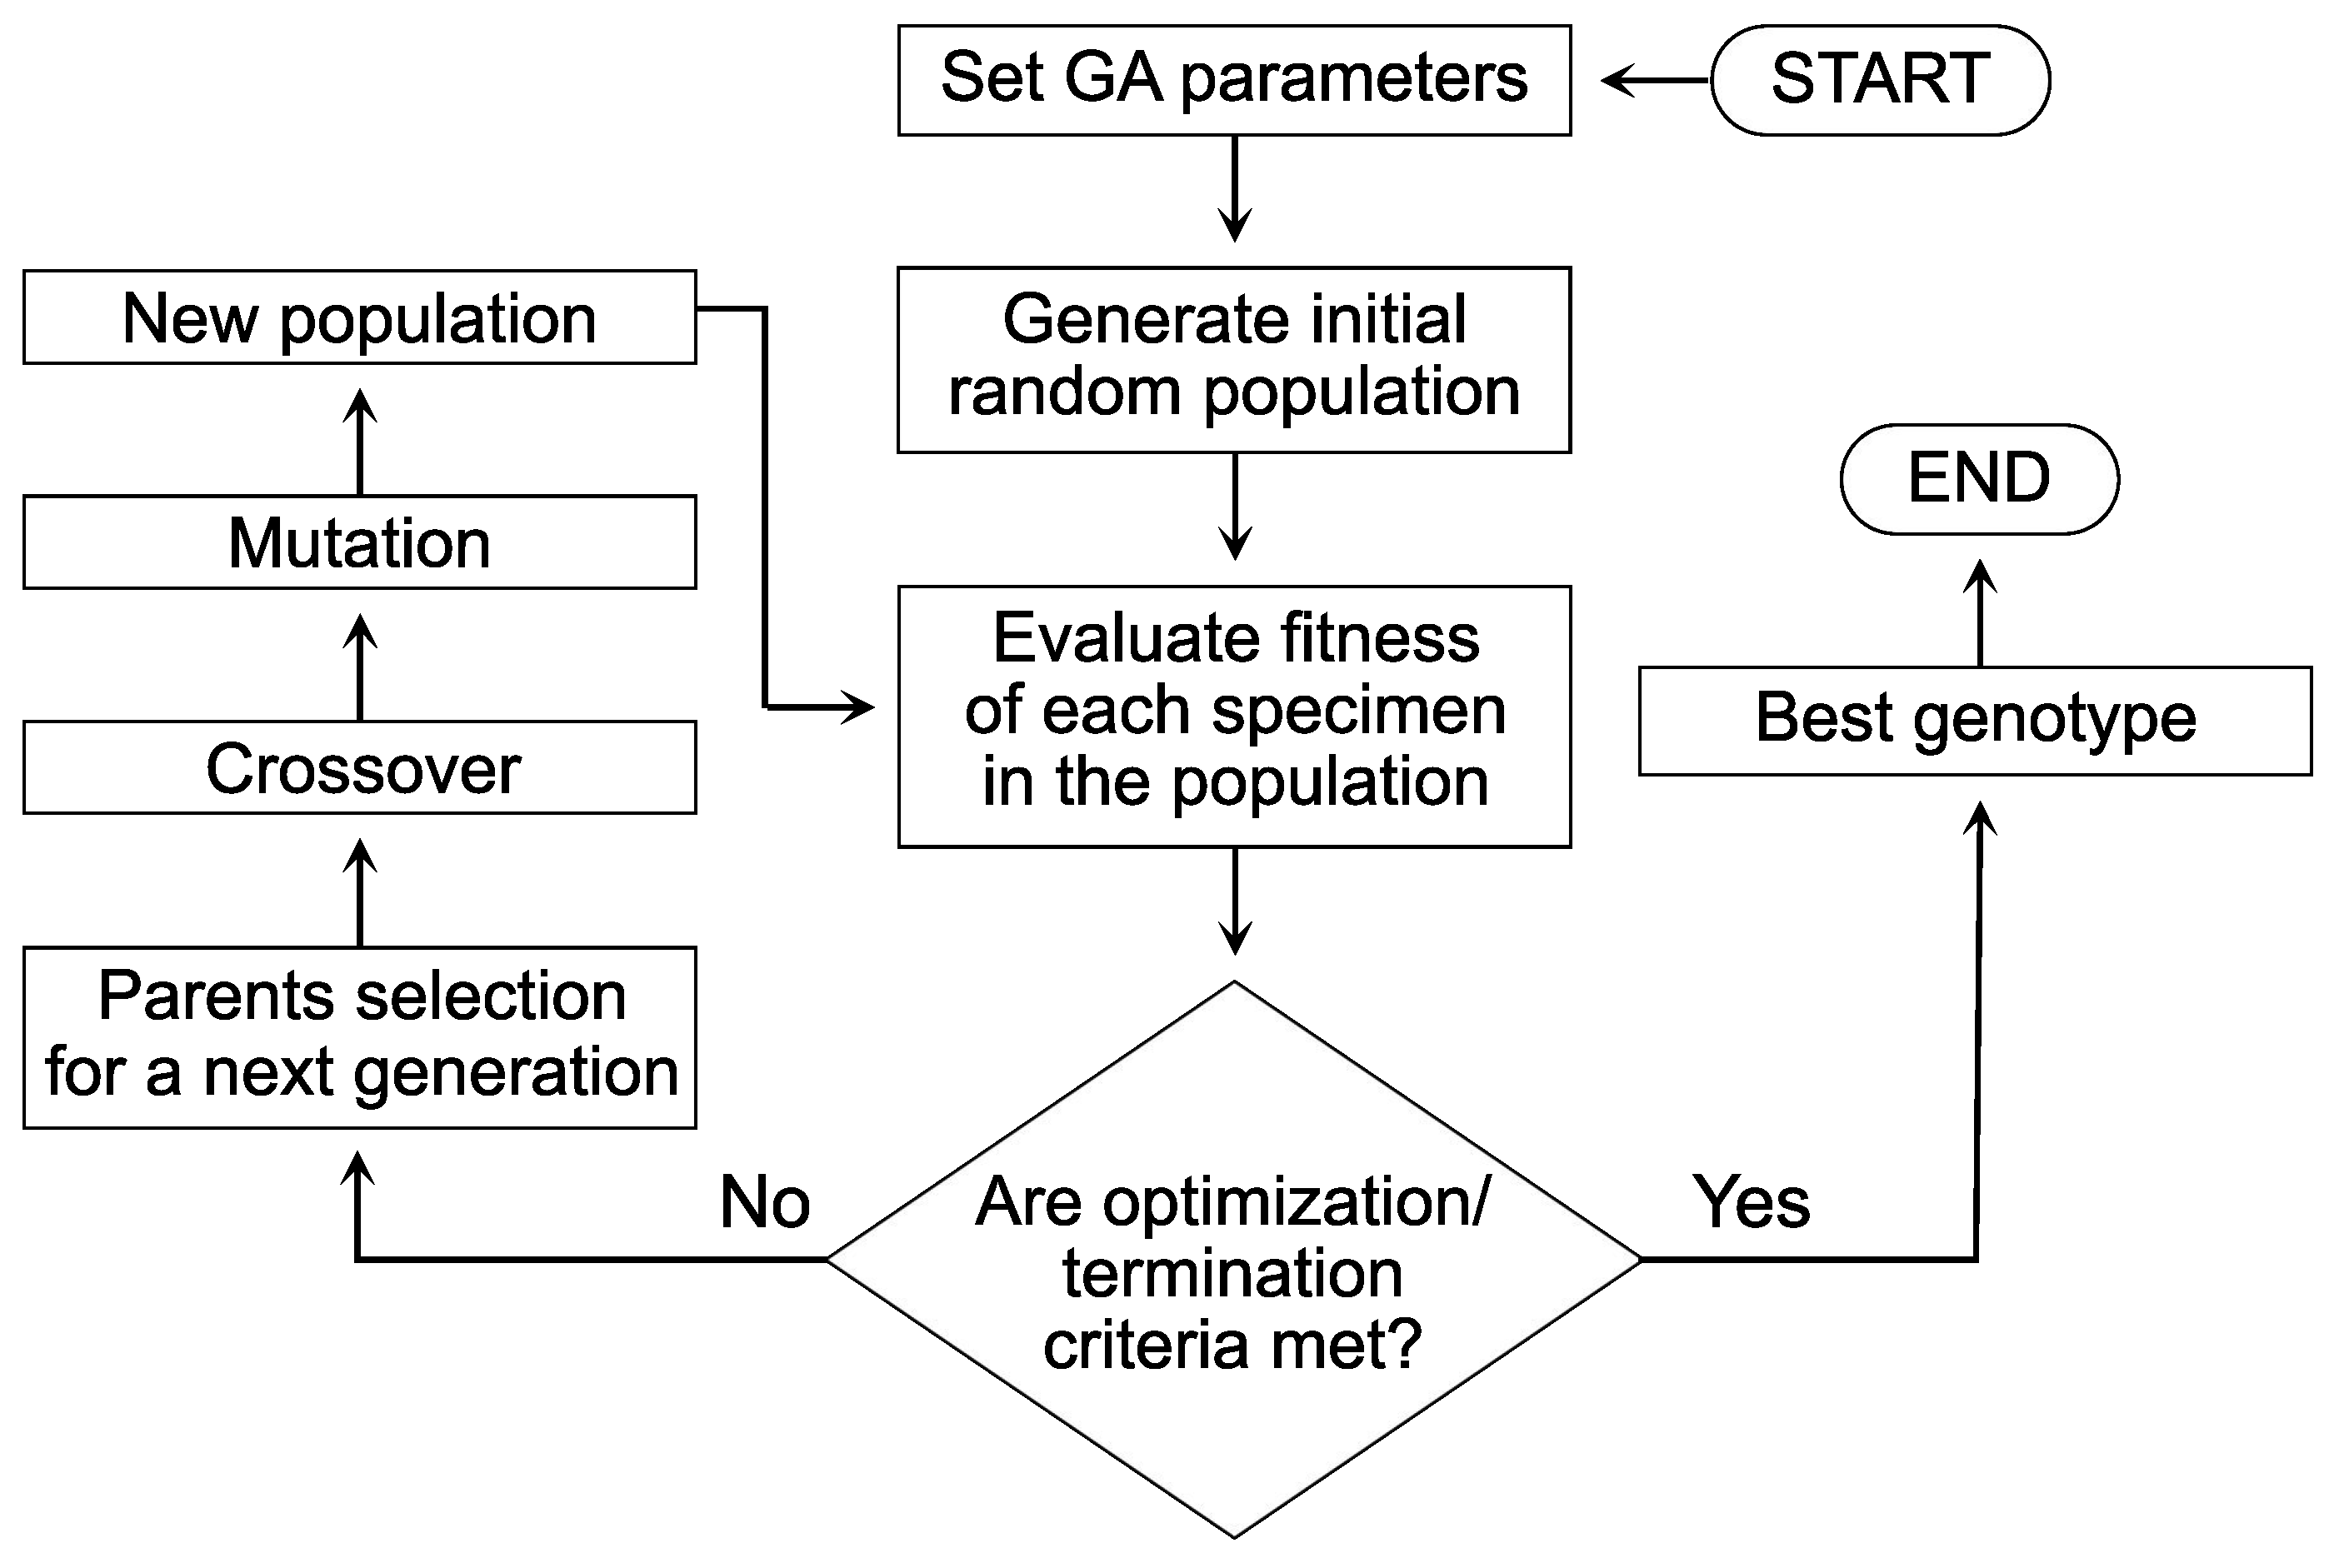
The prepared simulation of the reforming process is further coupled with a genetic algorithm (GA). The algorithm is set to search for a uniform temperature distribution inside the reforming reactor. The improvement in thermal conditions is achieved by successive modifications of the segments’ morphology. GA is a technique bearing its origins in the natural selection process. It is based on the principles of survival of the fittest [70]. The algorithm creates successive populations of specimens representing reforming reactors with various configurations of segments. The optimization procedure starts with the generation of the initial population consisting of specimens with random segment parameters. The reforming simulation is conducted for each of generated specimens and the quality of numerical results is evaluated. The robustness of a specific reactor is calculated using user-defined fitness functions [71]. The functions are defined depending on the nature of the analyzed problem and are necessary for the operation of the algorithm. The aim of the conducted optimization is to improve the temperature field distribution inside the reactor while maintaining a reasonable methane conversion rate [27]. Therefore, the research is considered a multi-objective optimization, as the fitness analysis is required to investigate two separate factors [72]. GA predicts the recombination of best-performing reactors’ segments during the crossover procedure, to acquire even more robust configurations [73]. When the computation of the reforming process for a specific reactor is complete, its fitness value is computed. During the crossover procedure, the algorithm randomly selects pairs of specimens to serve as parents for the succeeding population. The fitness value represents the probability of each specimen being selected for the recombination of parameters [28]. Genetic algorithms can be prone to finding local optimum, especially when dealing with multi-modal search spaces. The algorithm introduces mutation as a prevention mechanism. Furthermore, mutation allows for the introduction of parameters not acquirable during the crossover procedure [74]. The algorithm determines if specific segments are either catalytic or non-catalytic and adjusts their porosity and average pore size throughout the optimization. The algorithm operation is repeated until convergence criteria are met. In the case of the presented analysis, the algorithm is strictly limited to operating for thirty successive generations. The aim of the optimization procedure is to reveal which of the two proposed strategies allows for greater improvement of the reforming process thermal conditions. The operation of the genetic algorithm is briefly summarized in Figure 4. The optimization is conducted to allow for defining which catalyst division strategy returns better results. Therefore, both cases are set to operate for thirty continuous generations and the final outcomes are compared.

5. Results

The analysis has to be preceded by a definition of a reference case. A comparison of subsequent optimization results with the reference case will serve as a benchmark for defining whether any significant improvement in the reaction conditions has been noted for a specific case. The reference case defined for the presented analysis is a conventional reforming reactor, with a catalytic insert being homogeneous and continuous throughout the whole volume of the reactor. The whole insert consists of a composite of nickel- and yttrium-stabilized-zirconia (Ni/YSZ) with a ratio of 60:40. The porosity ε of the reactor’s catalyst is set at 50%, resulting in the catalyst density equal to 2.47 × 10 6 g m 3 . The average pore diameter d p is established at 1.5 mm. The boundary conditions applied for the reference case correspond to the conditions set for the optimization procedure (Section 3.3).
The thermal characteristics of the reforming reaction in a conventional reactor can be observed in Figure 5). The reactor dimensions are divided by the reactor’s radius (5 mm), to acquire a dimensionless set of coordinates. Observable temperature gradients are present throughout the whole volume of the reactor. The most significant temperature drop can be noticed at the inlet of the reactor, due to a considerable amount of energy required for the activation of the reforming reaction [12,52]. The temperature inconsistency of such magnitude has a consequence in thermal stresses occurring inside the catalytic insert. The stresses induce a premature degradation of the catalytic material, leading to a decrease in the process effectiveness [18,75]. An analysis of chemical specimen conversion is included in the research to allow a complete insight into a conventional reforming process. The molar fractions of specimens taking part in the process are illustrated in Figure 6. The molar fractions are averaged over the reactor’s radius. Thus, the graph describes the change of the radius-averaged molar fractions in the longitudinal direction of the reactor. The values of the reactor’s length are divided by the reactor’s radius, to acquire dimensionless values.
The numerical analysis predicted the extension of the macro-patterning concept by additional division of the catalytic insert in the radial direction, resulting in segments resembling concentric cylinders. The radial segments may accommodate one of two possible configurations. The first variant predicts cylinders with equal width of the inlet surface (Strategy I), while the second introduces cylinders with an equal area of the inlet surfaces (Strategy II) (Figure 1). To allow a direct comparison between each of the composed algorithms, hydrogen productivity ζ is introduced. Hydrogen productivity delivers insight into the increase in effectiveness of the reforming reaction for each of the optimized specimens. The ζ parameter is an exact ratio of the hydrogen output and the amount of the applied catalyst ι for a specific reactor (Equation (31)). The amount of the catalyst ι is calculated as the ratio of the catalyst used in a specific reactor, to the amount of the catalyst applied for the reference case.
ζ = H 2 out ι .

5.1. Strategy I

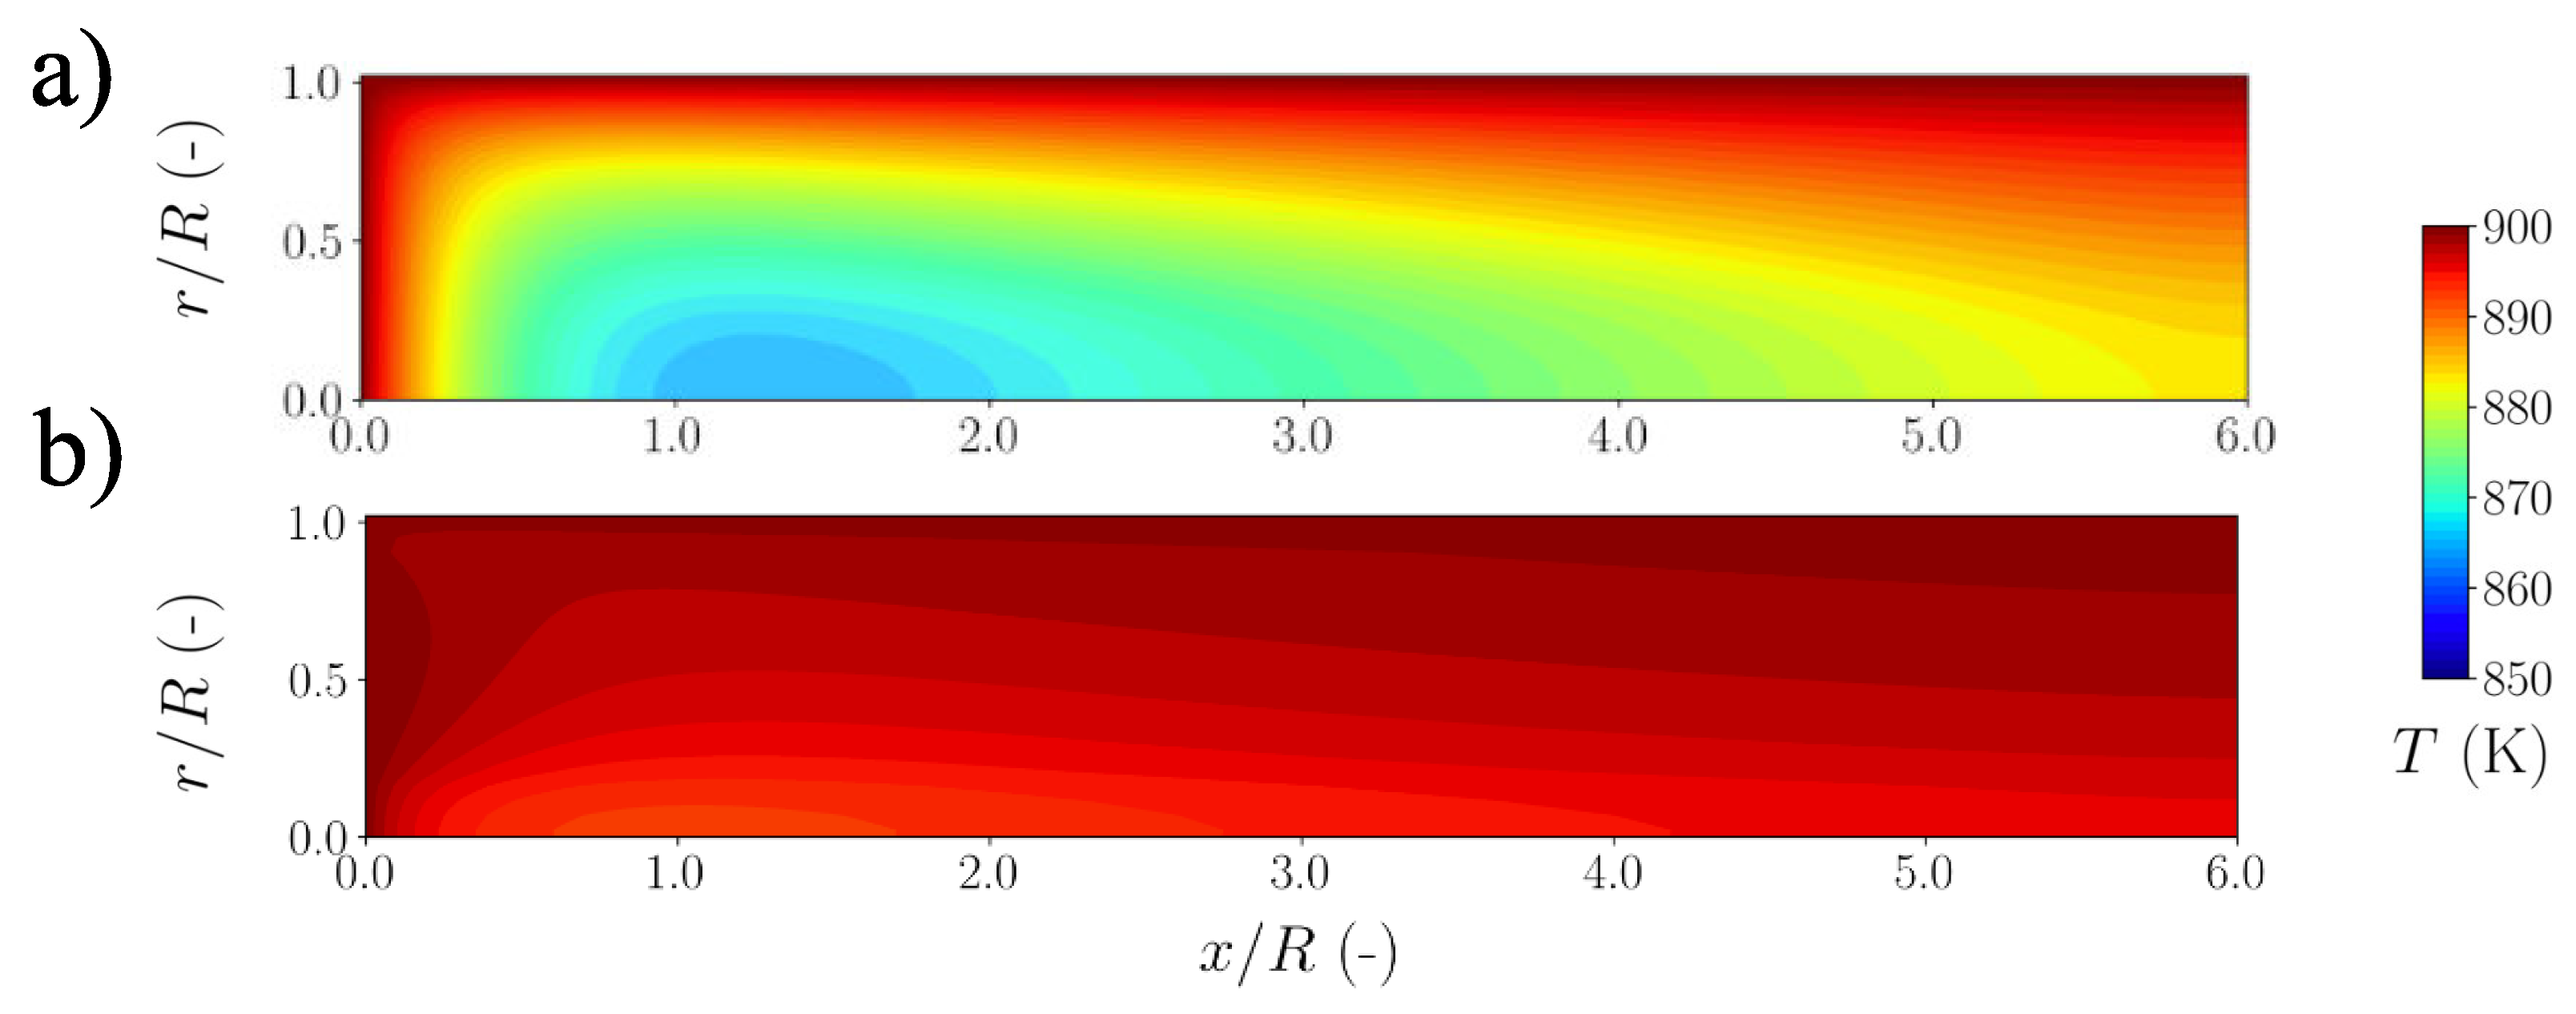
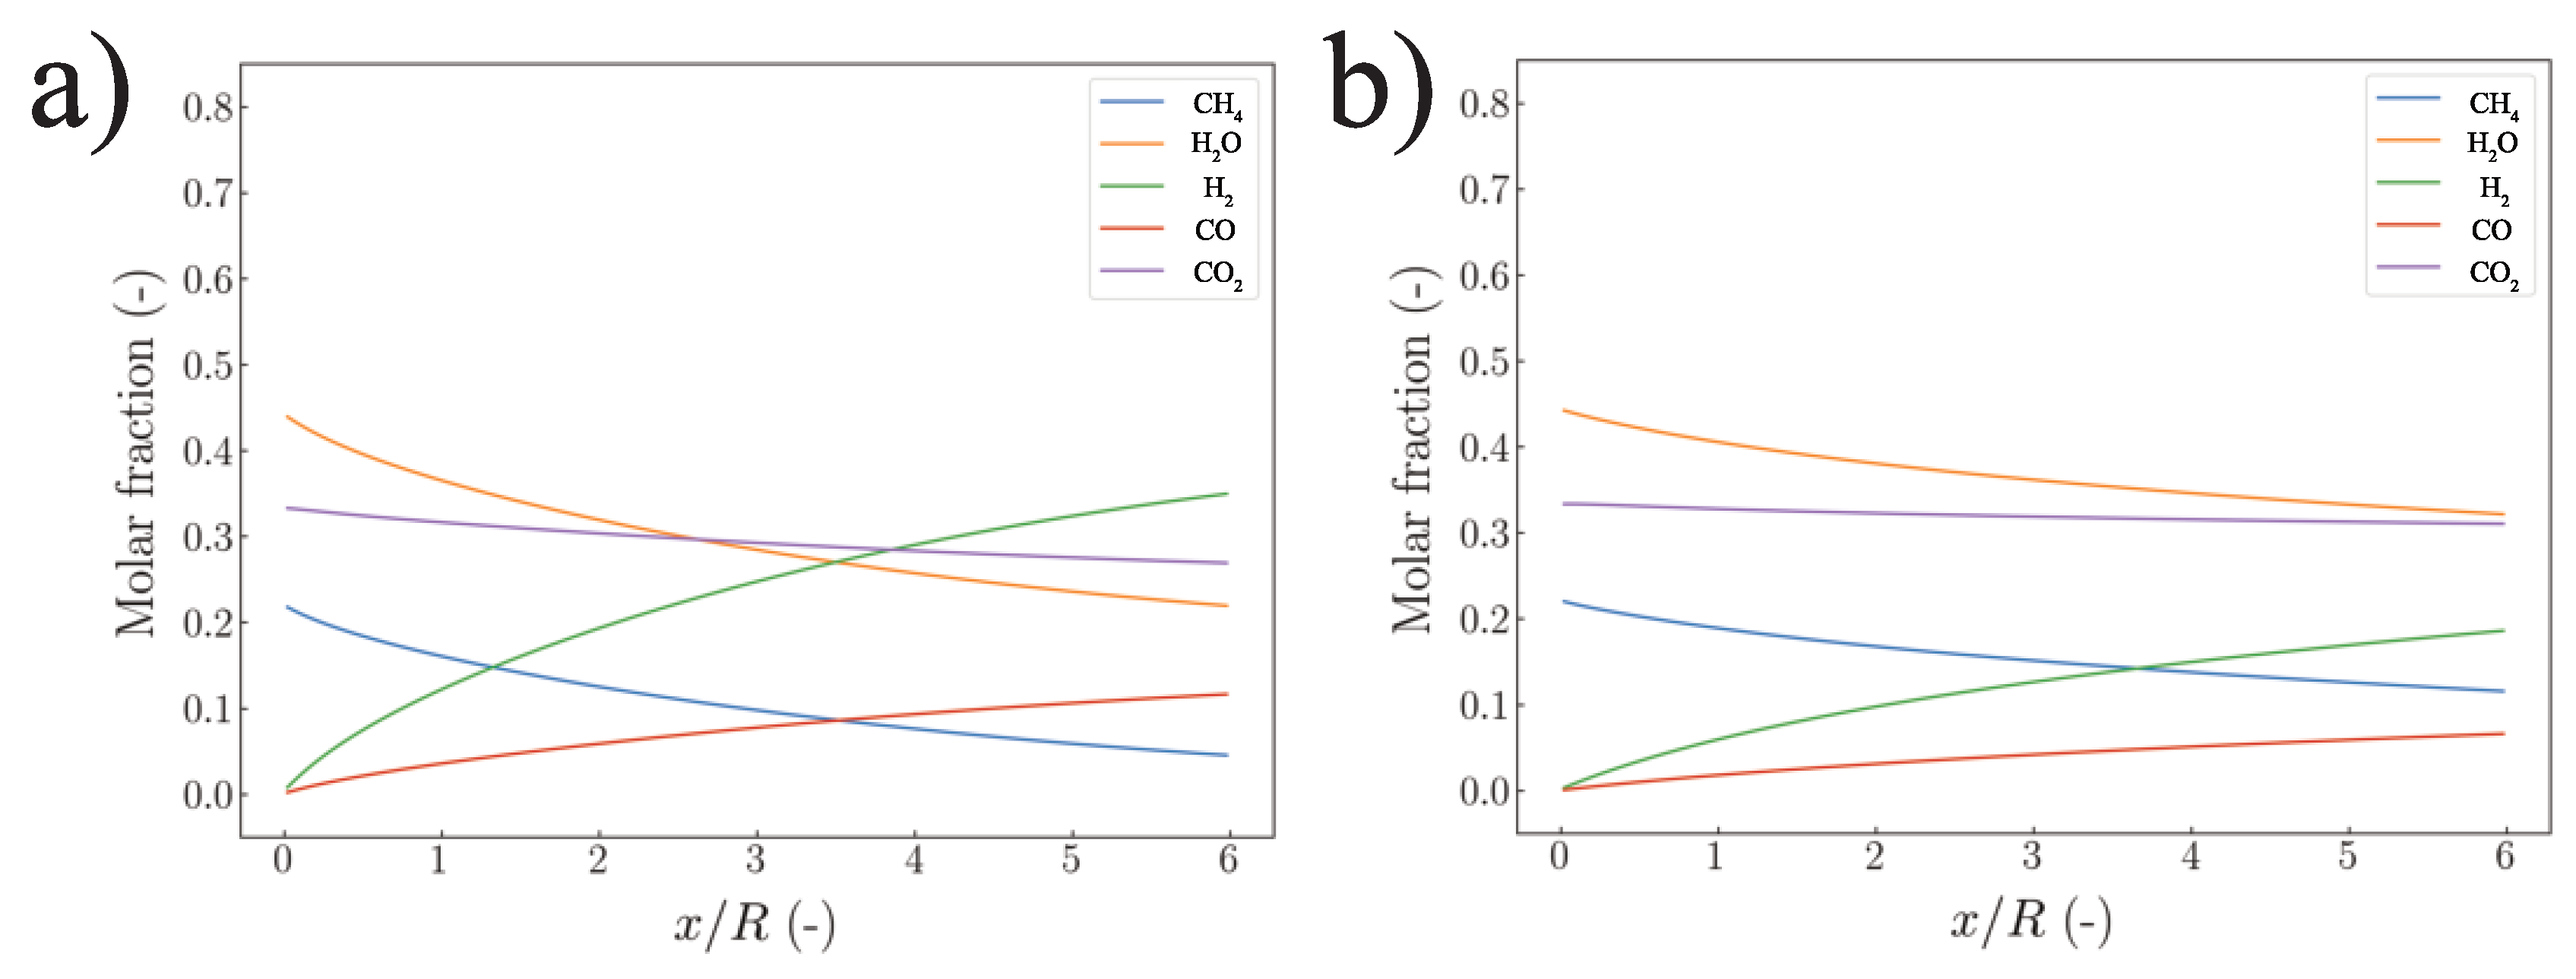
The first of the proposed strategies introduces design optimization of the catalytic insert with radial division introduced. The insert applies five separate segments, filling the whole reactor’s length each. Therefore, the segments could be described as a set of four hollow cylinders and a single core incorporated exactly at the axis of the reactor (Figure 1b). Each of the cylinders has the exact same width of 1 cm and the core in the center of the reactor has a 1 cm radius. Figure 7 shows the temperature distribution for the 1st generation (a) and 30th generation (b), with fitness weights w CH 4 = 0.4 and w T = 0.6. The radius-averaged molar fractions of chemical specimens along the reactor axis, distribution for the 1st generation (a) and 30th generation (b) are presented in Figure 8. The segments distribution designed by the algorithm for Strategy I (side cross-section view (a) and face view (b)) are presented in Figure 9.

5.2. Strategy II

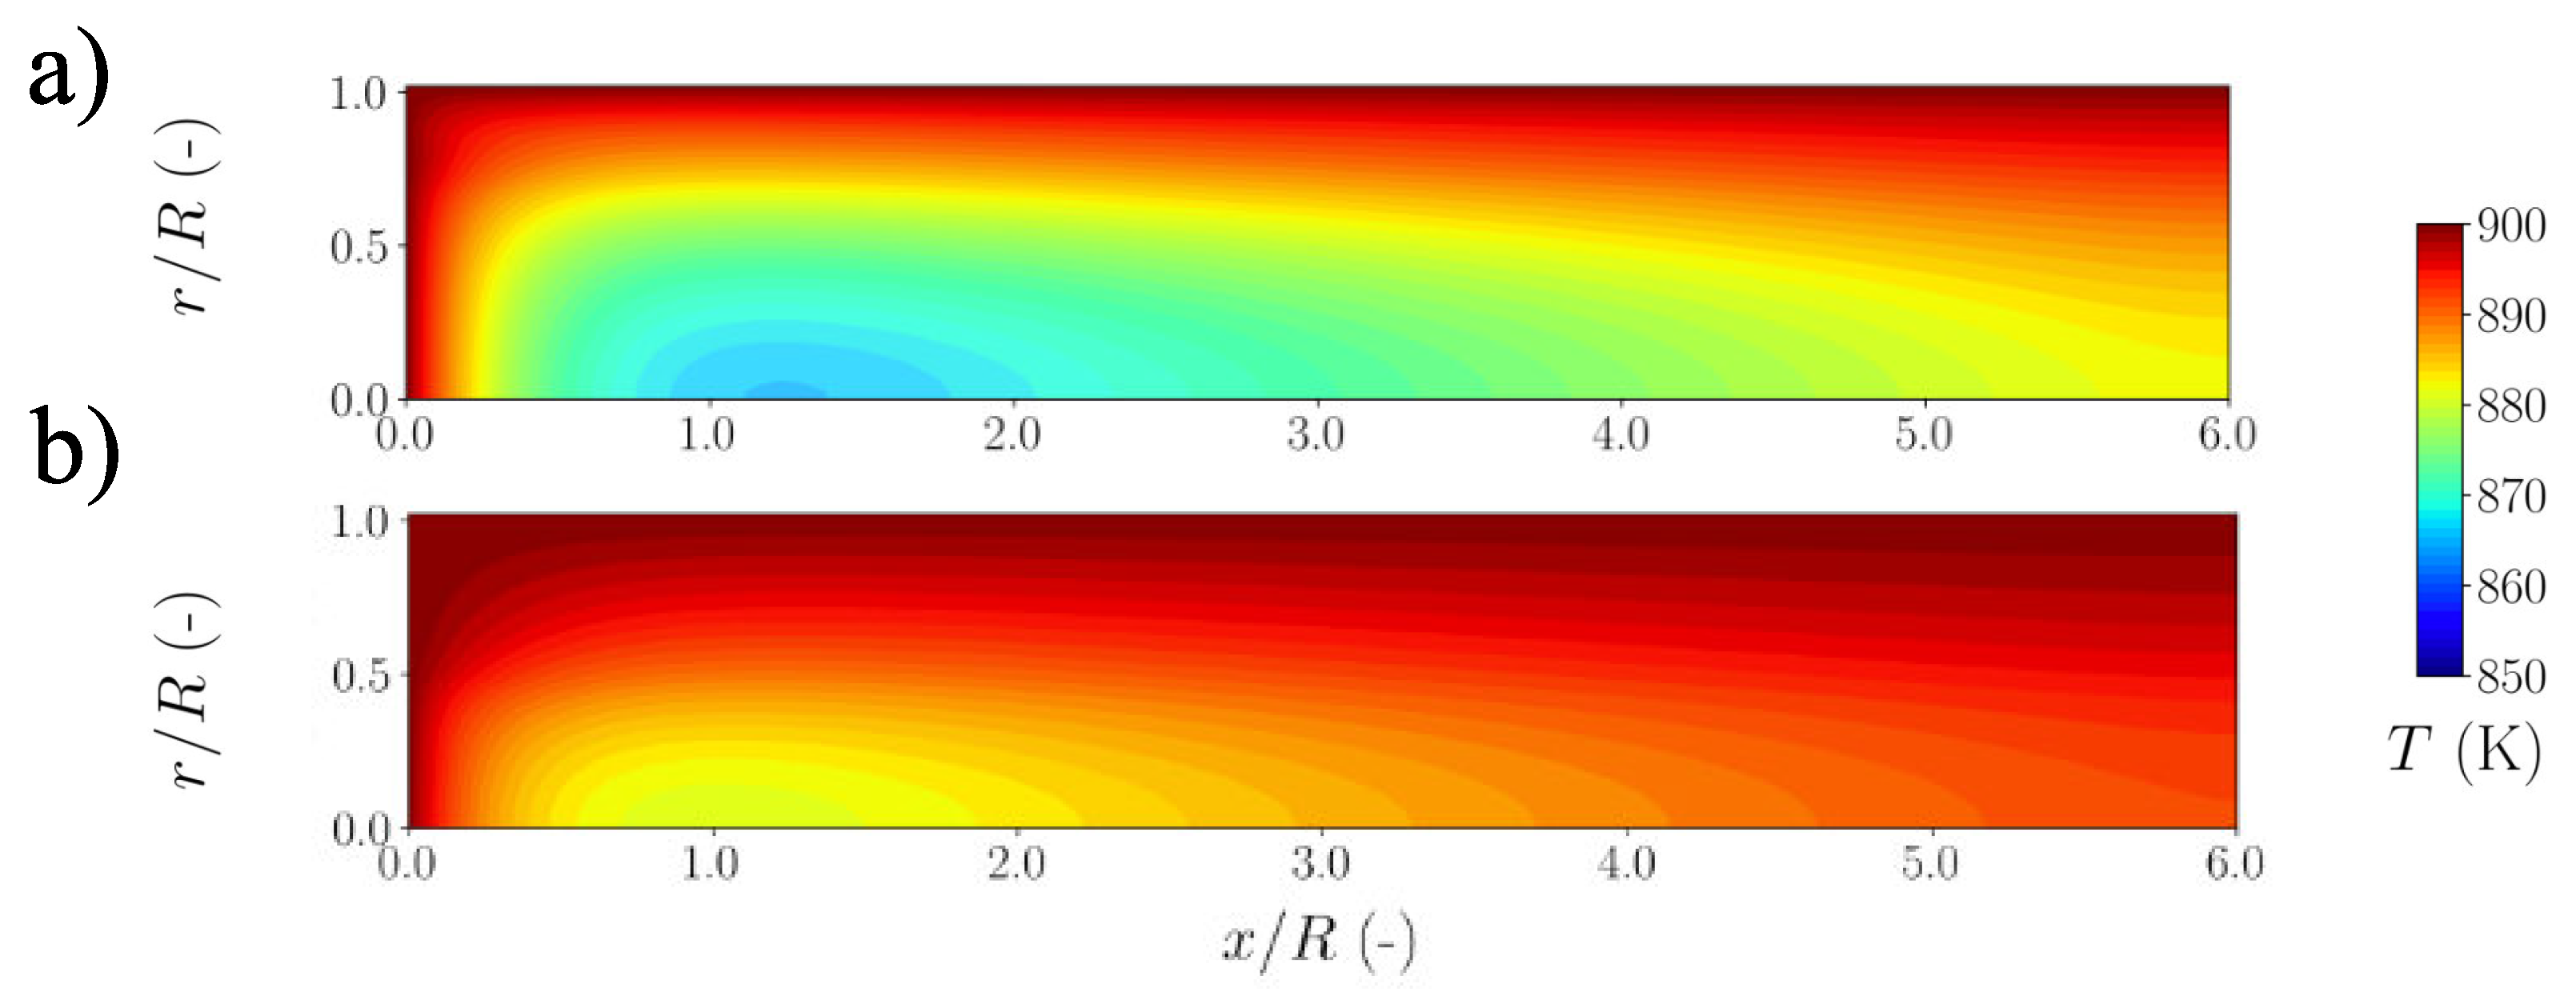
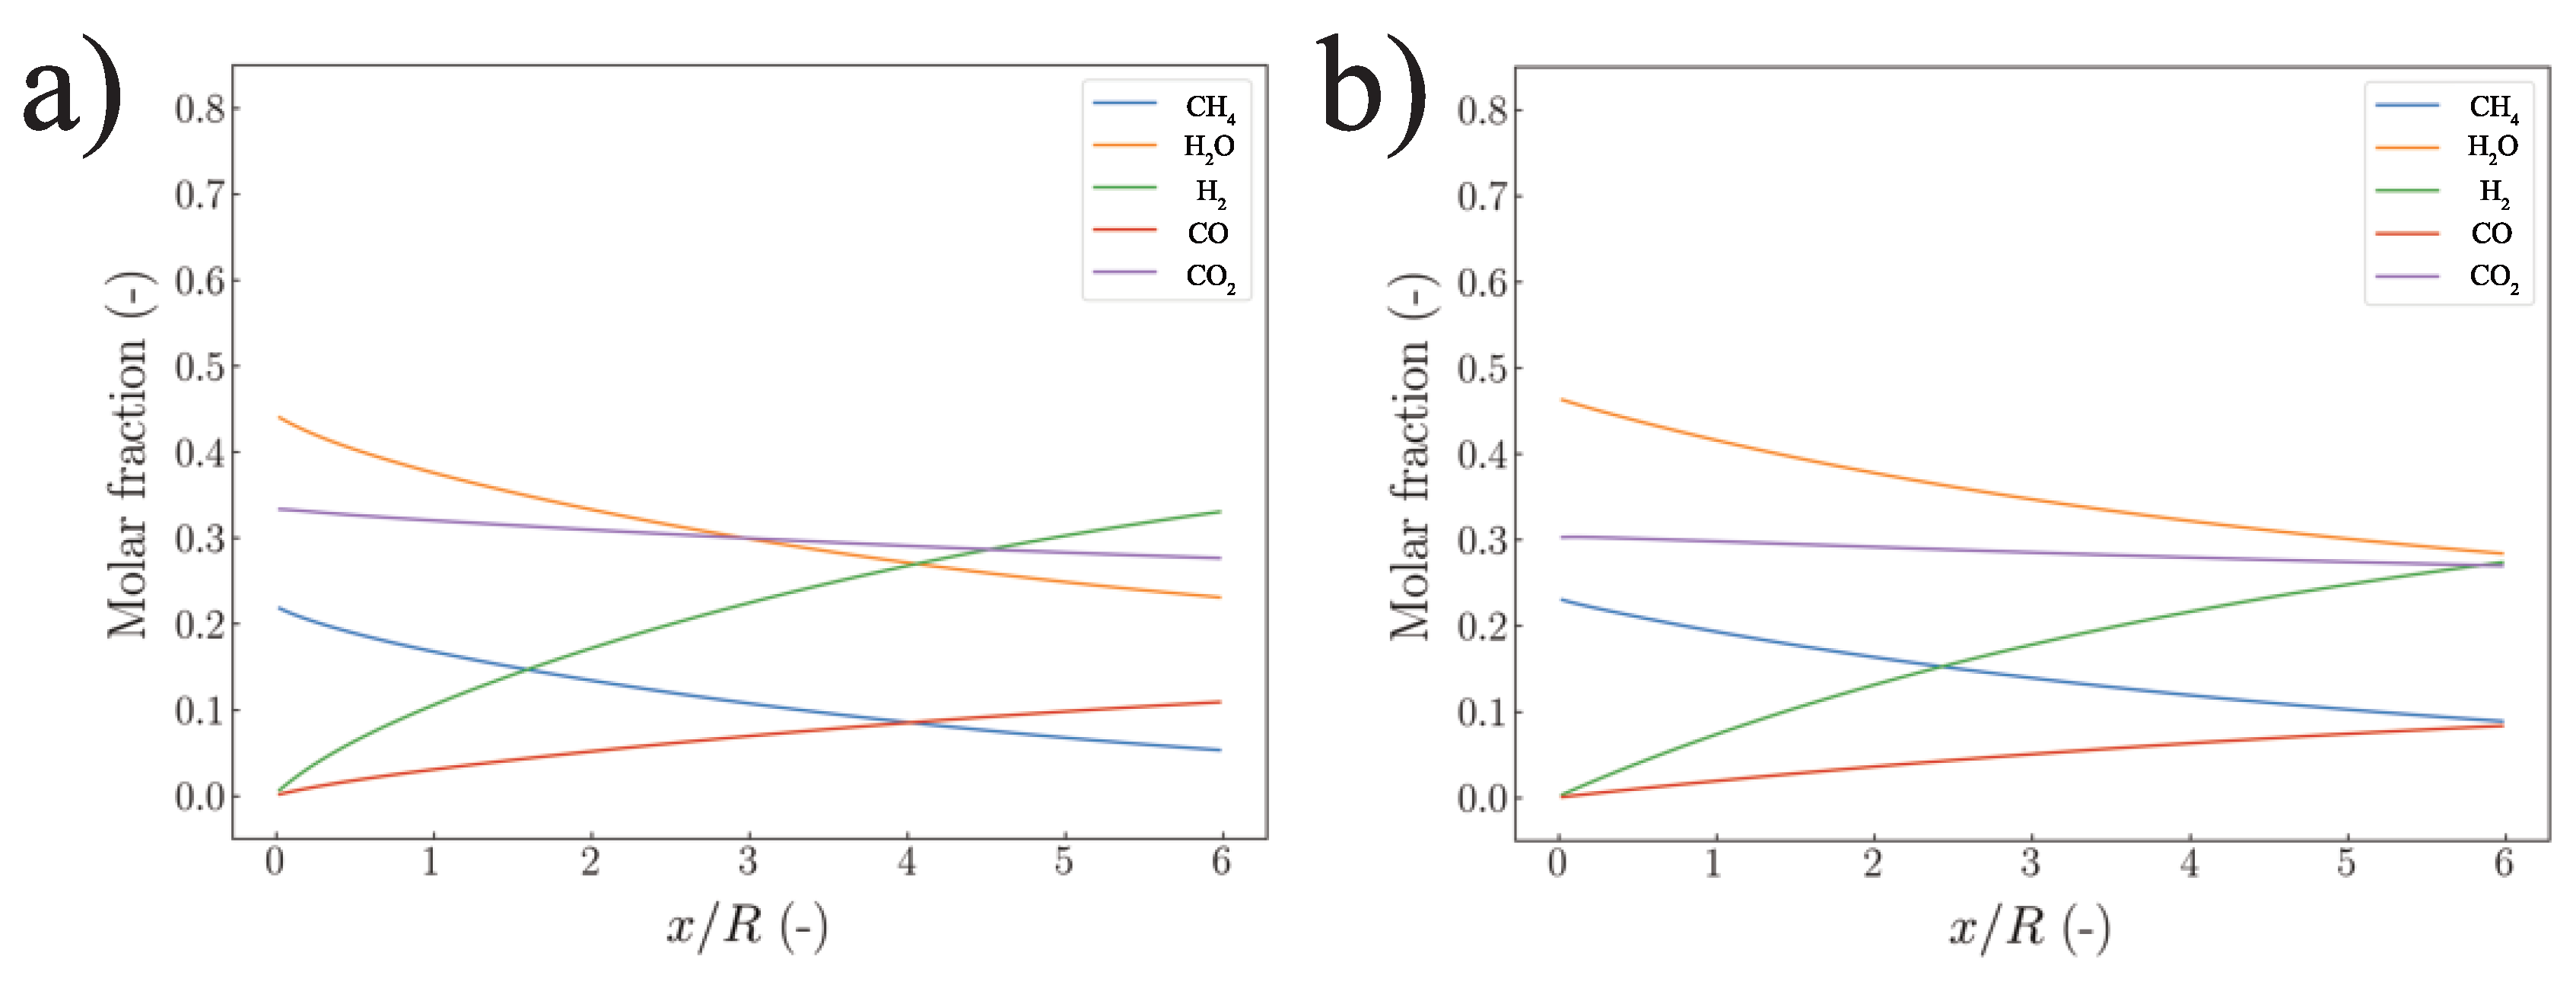
The second strategy predicts the optimization of the catalytic insert divided into five radial segments. As in the case of strategy I (Section 5.1), the catalytic insert incorporates division in the radial direction only (Figure 1c). The insert constitutes of four hollow, coaxial cylinders and a single core in the center. However, the width of specific segments differs to maintain the same areas of inlet surfaces for each segment, as explained in Figure 2. Figure 10 shows the temperature distribution for the 1st generation (a) and 30th generation (b), with fitness weights w CH 4 = 0.4 and w T = 0.6. The radius-averaged molar fractions of chemical specimens along the reactor axis, distribution for the 1st generation (a) and 30th generation (b) are presented in Figure 11. The segments distribution designed by the algorithm for Strategy II (side cross-section view (a) and face view (b)) are presented in Figure 12.
The hydrogen productivity, methane conversion rate, and thermal fitness of the reactors acquired at the end of the optimization are summarized in Table 4. According to the acquired results, the second strategy seems to be more appealing. The algorithm successfully limited the temperature gradients, simultaneously maintaining the methane conversion rate at a considerable level.

5.3. Reactor Extension

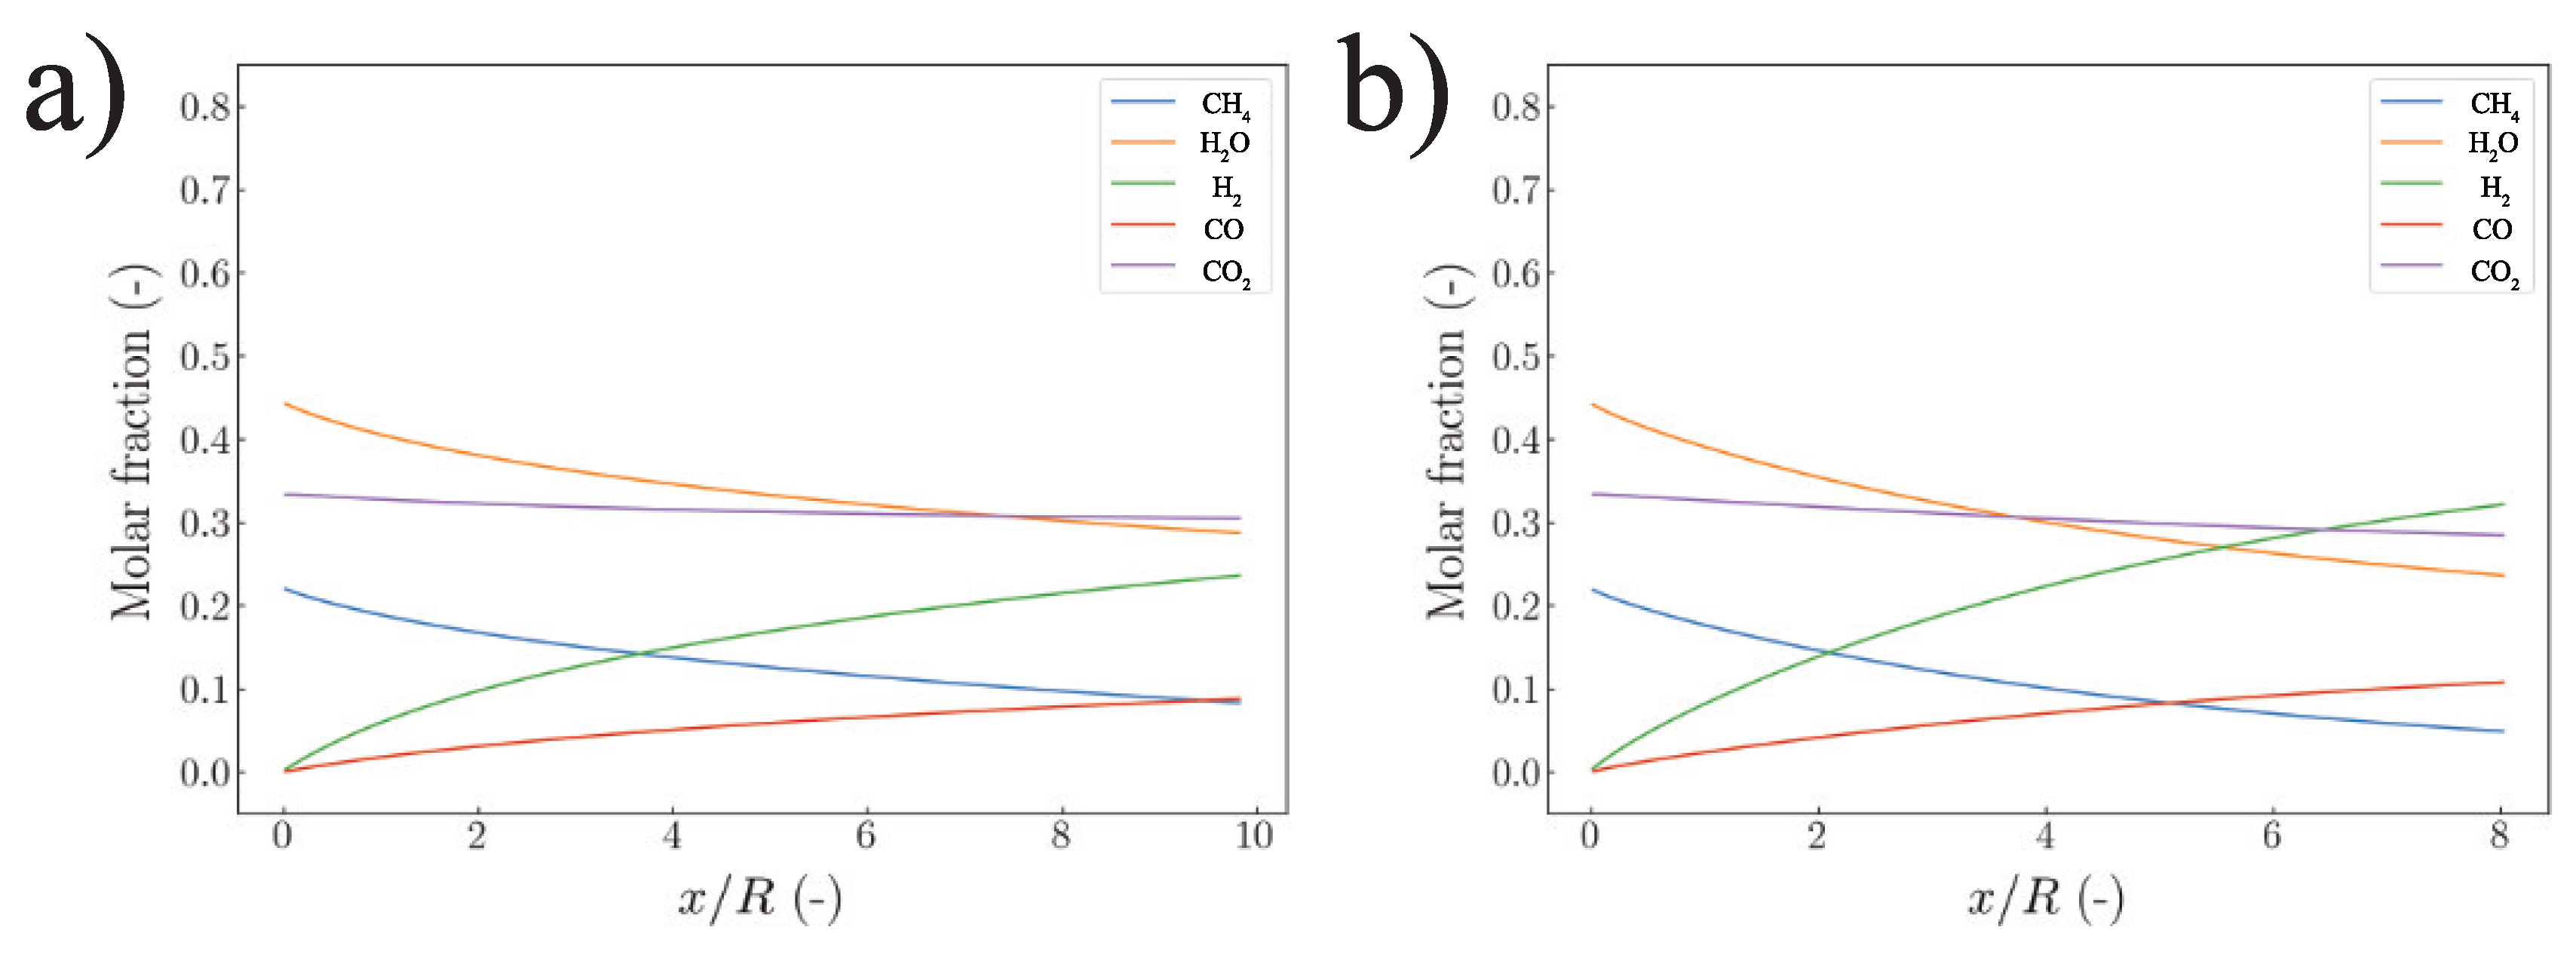
The knowledge of methane conversion rate (Table 4) allows for modification of the reformer dimensions. The two best reactors found by both algorithms are elongated proportionally to the ratio of the methane conversion rate between the reference case and the respective solutions found during the optimization. The operation resulted in acquiring methane conversion at a level equal to the value reported for the reference case. The values of methane conversion and hydrogen productivity for the elongated specimens are summarized in Table 5. The temperature distribution for the extended reformers is presented Figure 13 and the radius-averaged molar fractions in Figure 14.

6. Conclusions

The goals of the presented research are to provide a numerical toolkit designed to optimize the thermal conditions inside the steam reforming reactor and subsequent verification of which of the proposed catalyst division strategies delivers results of better quality. The measure for altering the temperature distribution is the macro-pattering concept. The concept introduces a novel approach to the catalytic insert’s geometry design. The insert is divided into individually parametrized segments and some parts of the catalyst may become substituted with a non-reactive metallic foam. The macro-patterning concept investigated in the analysis introduces the division of the catalytic insert in the radial direction. In total, two different approaches to the segments are introduced. The radial segments may either have equal widths of the inlet surfaces or equal areas of the inlet surfaces. Analyzing the results leads to the following conclusions:
1.
The macro-patterning concept with radially structured catalytic insert is a valid concept for the enhancement of biogas reforming.
2.
Strategy II with equal areas of the segment’s inlet surfaces returned results of higher quality.
3.
The introduction of the macro-patterning concept is proven to enhance the effectiveness of the reforming reaction. The hydrogen productivity has been almost doubled for the best solution when compared with the reference case.
The conducted research indicates the influence of altering the steam reforming thermal conditions on the overall process proceeding. The possible improvement in process effectiveness on the unification of the temperature distribution is confirmed. The presented results indicate that proper handling of the thermal conditions can allow for acquiring conversion levels close to the reference reactor while reducing the amount of the catalyst by 41%. The proposed macro-patterning concept proves the possibility of acquiring even higher biogas conversion rates, using the same amount of catalyst as in the case of the reference case. However, the macro-patterned reactors would have to suffer reduced compactness, as to acquire the exact level of conversion, an extension of the reactor’s dimensions is required. However, the enlargement of the reactors is not a tremendous drawback, particularly when considering the predicted improvement of the unit’s lifetime and easier control of the process, owing to the reduction in magnitude of the thermal stresses.

Author Contributions

Conceptualization, M.P. and G.B.; methodology, M.P. and G.B.; software, M.P. and G.B.; validation, J.S.S., S.K. and G.B.; formal analysis, G.B., S.K. and J.S.S.; investigation, M.P.; resources, M.P.; data curation, M.P.; writing—original draft preparation, M.P.; writing—review and editing, G.B., S.K. and J.S.S.; visualization, M.P.; supervision, J.S.S.; project administration, G.B. and J.S.S.; funding acquisition, J.S.S. All authors have read and agreed to the published version of the manuscript.

Funding

This research was funded by the Polish National Agency for Academic Exchange (NAWA) grant number BPI/PST/2021/1/00023.

Data Availability Statement

All data are available on request.

Acknowledgments

The presented research was supported by the Polish National Agency for Academic Exchange (NAWA), within the Strategic Partnerships Programme, Project No. BPI/PST/2021/1/ 00023 (project title: Strategic cooperation with Japan in the field of Energy and Environmental Engineering).

Conflicts of Interest

The authors declare no conflict of interest.

Nomenclature

AArrhenius constant (mol s 1 g 1 Pa α + β )
ajcoefficient in the discretized Equation (the unit depends on the case)
bconstant term in the discretization Equation (the unit depends on the case)
Cmultmultiplication coefficient used for fitness scaling (-)
Cpspecific heat at constant pressure (J kg 1 K 1 )
cineinertial coefficient (-)
catredcatalyst reduction (%)
Djmass diffusivity of the species j (m 2 s 1 )
ddimensionless foam ligament radius (-)
dpaverage pore diameter (mm)
Eaactivation energy (J mol 1 )
edimensionless cubic node length (-)
ffitness value (-)
fracmole fraction (-)
ΔGchange of standard Gibbs free energy (J mol 1 )
gsshape function derived for the metallic foam structure (-)
ΔHenthalpy change (J mol 1 )
Kppermeability (m 2 )
Kequilibrium constant (-)
k WGS + / rate constant of the forward/backward water–gas-shift reaction (mol s 1 m 3 Pa 2 )
kMSRrate constant of the methane/steam reforming reaction (mol s 1 m 3 Pa 2 )
Lmaximal x dimension (m)
lnode-to-node length (m)
nmolar flow rate (mol 1 )
Ppressure (Pa)
pjpartial pressure of the species j (Pa)
Qheat flux (W m 3 )
Qsheat source/sink (W m 3 )
Rreactor radius (m)
Rithermal resistances of the porous media cell subsections (m 2 K W 1 )
R ¯ universal gas constant (J mol 1 K 1 )
RMSRsteam reforming reaction rate (mol s 1 m 3 )
RWGSwater–gas shift reaction rate (mol s 1 m 3 )
rmarithmetic mean between r n and r s (m)
Δrgrid r dimension (m)
Sjmass source/sink of the species j (kg s 1 m 3 )
S ¯ source term (the unit depends on the case)
S ¯ C constant in the linear source term
S ¯ P dependent variable coefficient in the linear source term (the unit depends on the case)
SCsteam-to-carbon ratio (-)
Ttemperature (K)
ΔTdifference between maximal and minimal temperatures inside the reactor (K)
Urgas phase average local velocity in the r direction (m s 1 )
Uxgas phase average local velocity in the x direction (m s 1 )
uvelocity (m s 1 )
uvelocity vector (m s 1 )
Vvolume of the reactor (m 3 )
Wmjmolecular mass (g mol 1 )
wifunction’s weight (-)
w ˙ cat catalyst weight density (g m 3 )
Δxgrid x dimension (m)
xcrmethane conversion rate (-)
Yjmass fraction of the species j (-)
ycrcarbon monoxide conversion rate (-)
Greek letters
αorder of the reaction with respect to methane (-)
βorder of the reaction with respect to water (-)
Γdiffusive term (the unit depends on the case)
εporosity (-)
ζhydrogen productivity (-)
ιratio of the catalyst amount in a specific reactor to the amount of catalyst in the reference reactor (-)
λthermal conductivity (W m 1 K 1 )
μdynamic viscosity (Pa s)
ρdensity (g m 3 )
ρ0density of the gas mixture (kg m 3 )
ρ ¯ pseudo density (the unit depends on the case)
τtortuosity (-)
ϕjdependent variable (the unit depends on the case)
Ψrconvective term in the r direction (the unit depends on the case)
Ψxconvective term in the x direction (the unit depends on the case)
Subscripts
A, B, C, Dunit cell subsections
avgaverage value
CH4methane or based on the methane conversion rate
Enode to the right of the central node
einterface to the right of the central node
effeffective value
ininlet
jchemical species, grid element’s location, specimen
loclocal average, both over the gas and solid phase
MSRsteam reforming reaction
maxmaximal value
minminimal value
mixgas mixture
Nnode above the central node
ninterface above the central node
normnormalized value
outoutlet
Pcentral node of the grid
Snode below the central node
sinterface below the central node
Ttemperature based
Wnode to the left of the central node
WGSwater–gas-shift reaction
winterface to the left of the central node
Chemical species
CH4methane
COcarbon monoxide
CO2carbon dioxide
H2hydrogen
H2Osteam

References

  1. Zou, C.; Zhao, Q.; Zhang, G.; Xiong, B. Energy revolution: From a fossil energy era to a new energy era. Nat. Gas Ind. B 2016, 3, 1–11. [Google Scholar] [CrossRef]
  2. Liobikienė, G.; Dagiliūtė, R. Do positive aspects of renewable energy contribute to the willingness to pay more for green energy? Energy 2021, 231, 120817. [Google Scholar] [CrossRef]
  3. Deublein, D.; Steinhauser, A. Biogas from Waste and Renewable Resources: An Introduction; John Wiley & Sons: Hoboken, NJ, USA, 2011. [Google Scholar]
  4. Minh, D.P.; Siang, T.J.; Vo, D.V.N.; Phan, T.S.; Ridart, C.; Nzihou, A.; Grouset, D. Hydrogen production from biogas reforming: An overview of steam reforming, dry reforming, dual reforming, and tri-reforming of methane. Hydrog. Supply Chain. 2018, 111–166. [Google Scholar] [CrossRef]
  5. Manoharan, Y.; Hosseini, S.E.; Butler, B.; Alzhahrani, H.; Senior, B.T.F.; Ashuri, T.; Krohn, J. Hydrogen fuel cell vehicles; current status and future prospect. Appl. Sci. 2019, 9, 2296. [Google Scholar] [CrossRef]
  6. Kozhukhova, A.E.; du Preez, S.P.; Bessarabov, D.G. Catalytic hydrogen combustion for domestic and safety applications: A critical review of catalyst materials and technologies. Energies 2021, 14, 4897. [Google Scholar] [CrossRef]
  7. Marcoberardino, G.D.; Vitali, D.; Spinelli, F.; Binotti, M.; Manzolini, G. Green hydrogen production from raw biogas: A techno-economic investigation of conventional processes using pressure swing adsorption unit. Processes 2018, 6, 19. [Google Scholar] [CrossRef]
  8. De Risi, A.; Colangelo, G.; Milanese, M. Advanced Technologies for Green Hydrogen Production. Energies 2023, 16, 2882. [Google Scholar] [CrossRef]
  9. Shamsi, M.; Moghaddas, S.; Naeiji, E.; Farokhi, S. Techno-Economic, Energy, Exergy, and Environmental Comparison of Hydrogen Production from Natural gas, Biogas, and their Combination as Feedstock. Arab. J. Sci. Eng. 2023, 1–17. [Google Scholar] [CrossRef]
  10. Mozdzierz, M.; Brus, G.; Sciazko, A.; Komatsu, Y.; Kimijima, S.; Szmyd, J.S. An attempt to mimimize the temperature gradient along a plug-flow methane/steam reforming reactor by adopting locally controlled heating zones. J. Phys. Conf. Ser. 2014, 530, 012040. [Google Scholar] [CrossRef]
  11. Mozdzierz, M.; Chalusiak, M.; Kimijima, S.; Szmyd, J.S.; Brus, G. An afterburner-powered methane/steam reformer for a solid oxide fuel cells application. Heat Mass Transf. 2018, 54, 2331–2341. [Google Scholar] [CrossRef]
  12. Pajak, M.; Mozdzierz, M.; Chalusiak, M.; Kimijima, S.; Szmyd, J.S.; Brus, G. A numerical analysis of heat and mass transfer processes in a macro-patterned methane/steam reforming reactor. Int. J. Hydrogen Energy 2018, 43, 20474–20487. [Google Scholar] [CrossRef]
  13. Simpson, A.P.; Lutz, A.E. Exergy analysis of hydrogen production via steam methane reforming. Int. J. Hydrogen Energy 2007, 32, 4811–4820. [Google Scholar] [CrossRef]
  14. Naseri, A.T.; Peppley, B.A.; Pharoah, J.G. A systematic parametric study on the effect of a catalyst coating microstructure on its performance in methane steam reforming. Int. J. Hydrogen Energy 2015, 40, 16086–16095. [Google Scholar] [CrossRef]
  15. Ali, S.; Al-Marri, M.J.; Abdelmoneim, A.G.; Kumar, A.; Khader, M.M. Catalytic evaluation of nickel nanoparticles in methane steam reforming. Int. J. Hydrogen Energy 2016, 41, 22876–22885. [Google Scholar] [CrossRef]
  16. Kolaczkowski, S.T.; Awdry, S.; Smith, T.; Thomas, D.; Torkuhl, L.; Kolvenbach, R. Potential for metal foams to act as structured catalyst supports in fixed-bed reactors. Catal. Today 2016, 273, 221–233. [Google Scholar] [CrossRef]
  17. Cherif, A.; Nebbali, R. Numerical analysis on autothermal steam methane reforming: Effects of catalysts arrangement and metal foam insertion. Int. J. Hydrogen Energy 2019, 44, 22455–22466. [Google Scholar] [CrossRef]
  18. Palma, V.; Ricca, A.; Martino, M.; Meloni, E. Innovative structured catalytic systems for methane steam reforming intensification. Chem. Eng. Process. Process. Intensif. 2017, 120, 207–215. [Google Scholar] [CrossRef]
  19. Dubinin, A.M.; Shcheklein, S.E.; Tuponogov, V.G.; Ershov, M.I. Mini CHP based on the electrochemical generator and impeded fluidized bed reactor for methane steam reforming. Int. J. Hydrogen Energy 2018, 43, 13543–13549. [Google Scholar] [CrossRef]
  20. Cherif, A.; Nebbali, R.; Sen, F.; Sheffield, J.W.; Doner, N.; Nasseri, L. Modeling and simulation of steam methane reforming and methane combustion over continuous and segmented catalyst beds in autothermal reactor. Int. J. Hydrogen Energy 2022, 47, 9127–9138. [Google Scholar] [CrossRef]
  21. Pajak, M.; Brus, G.; Mozdzierz, M.; Szmyd, J. Steam Reforming Reactor and a Method of Hydrogen Production Using a Steam Reforming Reactor. Patent Application (Poland) P.438133, 11 June 2021. [Google Scholar]
  22. Cherif, A.; Lee, J.S.; Nebbali, R.; Lee, C.J. Novel design and multi-objective optimization of autothermal steam methane reformer to enhance hydrogen production and thermal matching. Appl. Therm. Eng. 2022, 217, 119140. [Google Scholar] [CrossRef]
  23. Settar, A.; Nebbali, R.; Madani, B.; Abboudi, S. Numerical investigation on the wall-coated steam methane reformer improvement: Effects of catalyst layer patterns and metal foam insertion. Int. J. Hydrogen Energy 2017, 42, 1490–1498. [Google Scholar] [CrossRef]
  24. Settar, A.; Abboudi, S.; Lebaal, N. Effect of inert metal foam matrices on hydrogen production intensification of methane steam reforming process in wall-coated reformer. Int. J. Hydrogen Energy 2018, 43, 12386–12397. [Google Scholar] [CrossRef]
  25. Settar, A.; Mansouri, Z.; Nebbali, R. Impact of Ni-based catalyst patterning on hydrogen production from MSR: External steam reformer modelling. Int. J. Hydrogen Energy 2018, 44, 11346–11354. [Google Scholar] [CrossRef]
  26. Pajak, M.; Brus, G.; Szmyd, J.S. Catalyst Distribution Optimization Scheme for Effective Green Hydrogen Production from Biogas Reforming. Energies 2021, 14, 5558. [Google Scholar] [CrossRef]
  27. Pajak, M.; Brus, G.; Szmyd, J.S. Genetic algorithm-based strategy for the steam reformer optimization. Int. J. Hydrogen Energy 2023, 48, 11652–11665. [Google Scholar] [CrossRef]
  28. Pajak, M.; Buchaniec, S.; Kimijima, S.; Szmyd, J.S.; Brus, G. A multiobjective optimization of a catalyst distribution in a methane/steam reforming reactor using a genetic algorithm. Int. J. Hydrogen Energy 2021, 46, 20183–20197. [Google Scholar] [CrossRef]
  29. Boomsma, K.; Poulikakos, D.; Zwick, F. Metal foams as compact high performance heat exchangers. Mech. Mater. 2003, 35, 1161–1176. [Google Scholar] [CrossRef]
  30. Kaw, A.; Kalu, E.K.; Nguyen, D. Numerical Methods with Applications; University of South Florida: Tampa, FL, USA, 2011. [Google Scholar]
  31. Patankar, S.V. Numerical Heat Transfer and Fluid Flow; Hemisphere: Washington, DC, USA, 1980. [Google Scholar]
  32. Komatsu, Y.; Kimijima, S.; Szmyd, J.S. A Performance Analysis of a Solid Oxide Fuel Cell-Micro Gas Turbine Hybrid System Using Biogas. ECS Trans. 2009, 25, 1061–1070. [Google Scholar] [CrossRef]
  33. Brus, G.; Nowak, R.; Szmyd, J.S.; Komatsu, Y.; Kimijima, S. An Experimental and Theoretical Approach for the Carbon Deposition Problem During Steam Reforming of Model Biogas. J. Theor. Appl. Mech. 2015, 53, 273–284. [Google Scholar] [CrossRef]
  34. Nishino, T.; Szmyd, J.S. Numerical analysis of a cell-based indirect internal reforming tubular SOFC operating with biogas. J. Fuel Cell Sci. Technol. 2010, 7, 0510041–0510048. [Google Scholar] [CrossRef]
  35. Usman, M.; Wan Daud, W.; Abbas, H.F. Dry reforming of methane: Influence of process parameters—A review. Renew. Sustain. Energy Rev. 2015, 45, 710–744. [Google Scholar] [CrossRef]
  36. Koncewicz, W.; Moździerz, M.; Brus, G. A fast Gaussian process-based method to evaluate carbon deposition during hydrocarbons reforming. Int. J. Hydrogen Energy 2021, in press. [CrossRef]
  37. Kaczmarczyk, R. Thermodynamic Analysis of the Effect of Green Hydrogen Addition to a Fuel Mixture on the Steam Methane Reforming Process. Energies 2021, 14, 6564. [Google Scholar] [CrossRef]
  38. Tomiczek, M.; Kaczmarczyk, R.; Mozdzierz, M.; Brus, G. A numerical analysis of heat and mass transfer during the steam reforming process of ethane. Heat Mass Transf. 2018, 54, 2305–2314. [Google Scholar] [CrossRef]
  39. Mazhar, A.; Khoja, A.H.; Azad, A.K.; Mushtaq, F.; Naqvi, S.R.; Shakir, S.; Hassan, M.; Liaquat, R.; Anwar, M. Performance Analysis of TiO2-Modified Co/MgAl2O4 Catalyst for Dry Reforming of Methane in a Fixed Bed Reactor for Syngas (H2, CO) Production. Energies 2021, 14, 3347. [Google Scholar] [CrossRef]
  40. Brus, G.; Komatsu, Y.; Kimijima, S.; Szmyd, J.S. An analysis of biogas reforming process on Ni/YSZ and Ni/SDC catalysts. Int. J. Thermodyn. 2012, 15, 43–51. [Google Scholar]
  41. Brus, G.; Kimijima, S.; Szmyd, J.S. Experimental and numerical analysis of transport phenomena in an internal indirect fuel reforming type Solid Oxide Fuel Cells using Ni/SDC as a catalyst. J. Phys. Conf. Ser. 2012, 395, 012159. [Google Scholar] [CrossRef]
  42. Nagata, S.; Momma, A.; Kato, T.; Kasuga, Y. Numerical analysis of output characteristics of tubular SOFC with internal reformer. J. Power Sources 2001, 101, 60–71. [Google Scholar] [CrossRef]
  43. Ahmed, K.; Föger, K. Approach to equilibrium of the water-gas shift reaction on a Ni/zirconia anode under SOFC conditions. J. Power Sources 2001, 103, 150–153. [Google Scholar] [CrossRef]
  44. Iwai, H.; Yamamoto, Y.; Saito, M.; Yoshida, H. Numerical simulation of intermediate-temperature direct-internal-reforming planar solid oxide fuel cell. Energy 2011, 36, 2225–2234. [Google Scholar] [CrossRef]
  45. Sciazko, A.; Komatsu, Y.; Brus, G.; Kimijima, S.; Szmyd, J.S. A novel approach to improve the mathematical modelling of the internal reforming process for solid oxide fuel cells using the orthogonal least squares method. Int. J. Hydrogen Energy 2014, 39, 16372–16389. [Google Scholar] [CrossRef]
  46. Peng, X.; Jin, Q. Molecular simulation of methane steam reforming reaction for hydrogen production. Int. J. Hydrogen Energy 2022, 47, 7569–7585. [Google Scholar] [CrossRef]
  47. Brus, G. Experimental and numerical studies on chemically reacting gas flow in the porous structure of a solid oxide fuel cells internal fuel reformer. Int. J. Hydrogen Energy 2012, 37, 17225–17234. [Google Scholar] [CrossRef]
  48. Sciazko, A.; Komatsu, Y.; Brus, G.; Kimijima, S.; Szmyd, J.S. An Application of Generalized Least Squares Method to an Analysis of Methane/Steam Reforming Process on a Ni/YSZ Catalyst. ECS Trans. 2013, 57, 2987–2996. [Google Scholar] [CrossRef]
  49. Sciazko, A.; Komatsu, Y.; Brus, G.; Kimijima, S.; Szmyd, J.S. A novel approach to the experimental study on methane/steam reforming kinetics using the Orthogonal Least Squares method. J. Power Sources 2014, 262, 245–254. [Google Scholar] [CrossRef]
  50. Brus, G.; Miyawaki, K.; Iwai, H.; Saito, M.; Yoshida, H. Tortuosity of an SOFC anode estimated from saturation currents and a mass transport model in comparison with a real micro-structure. Solid State Ionics 2014, 265, 13–21. [Google Scholar] [CrossRef]
  51. Wolf, M. Thermodynamic assessment of the stability of bulk and nanoparticulate cobalt and nickel during dry and steam reforming of methane. RSC Adv. 2021, 11, 18187–18197. [Google Scholar] [CrossRef]
  52. Xu, J.; Froment, G.F. Methane steam reforming: II. Diffusional limitations and reactor simulation. AIChE J. 1989, 35, 97–103. [Google Scholar] [CrossRef]
  53. Carbonell, R.G.; Whitaker, S. Heat and Mass Transfer in Porous Media. In Fundamentals of Transport Phenomena in Porous Media; Bear, J., Corapcioglu, M.Y., Eds.; Springer: Dordrecht, The Netherlands, 1984. [Google Scholar]
  54. Nishino, T.; Komori, H.; Iwai, H.; Suzuki, K. Development of a comprehensive numerical model for analyzing a tubular-type indirect internal reforming SOFC. In Proceedings of the 1st International Fuel Cell Science, Engineering and Technology Conference Rochester, New York, NY, USA, 21–23 April 2003; pp. 521–528. [Google Scholar]
  55. Nishino, T.; Iwai, H.; Suzuki, K. Comprehensive Numerical Modeling and Analysis of a Cell-Based Indirect Internal Reforming Tubular SOFC. J. Fuel Cell Sci. Technol. 2006, 3, 33–44. [Google Scholar] [CrossRef]
  56. Tan, W.C.; Iwai, H.; Kishimoto, M.; Brus, G.; Szmyd, J.S.; Yoshida, H. Numerical analysis on effect of aspect ratio of planar solid oxide fuel cell fueled with decomposed ammonia. J. Power Sources 2018, 384, 367–378. [Google Scholar] [CrossRef]
  57. Suzuki, K.; Iwai, H.; Nishino, T. Electrochemical and thermo-fluid modeling of a tubular solid oxide fuel cell with accompaning indirect internal fuel reforming. In Transport Phenomena in Fuel Cells; Sunden, B., Faghri, M., Eds.; WIT Press: Southampton, UK, 2005; pp. 83–131. [Google Scholar]
  58. Poling, B.E.; Prausnitz, J.M.; O’Connell, J.P. The Properties of Gases and Liquids; McGraw-Hill: New York, NY, USA, 2001. [Google Scholar] [CrossRef]
  59. Yang, X.; Lu, T.J.; Kim, T. An analytical model for permeability of isotropic porous media. Phys. Lett. A Sect. Gen. At. Solid State Phys. 2014, 378, 2308–2311. [Google Scholar] [CrossRef]
  60. Bhattacharya, A.; Calmidi, V.V.; Mahajan, R.L. Thermophysical properties of high porosity metal foams. Int. J. Heat Mass Transf. 2002, 45, 1017–1031. [Google Scholar] [CrossRef]
  61. Boomsma, K.; Poulikakos, D. On the effective thermal conductivity of a three- dimensionally structured fluid-saturated metal foam. Heat Mass Transf. 2001, 44, 827–836. [Google Scholar] [CrossRef]
  62. Dai, Z.; Nawaz, K.; Park, Y.G.; Bock, J.; Jacobi, A.M. Correcting and extending the Boomsma-Poulikakos effective thermal conductivity model for three-dimensional, fluid-saturated metal foams. Int. Commun. Heat Mass Transf. 2010, 37, 575–580. [Google Scholar] [CrossRef]
  63. Moukalled, F.; Mangani, L.; Darwish, M. The Finite Volume Method; Springer International Publishing: Cham, Switzerland, 2016; pp. 103–135. [Google Scholar]
  64. Chalusiak, M.; Wrobel, M.; Mozdzierz, M.; Berent, K.; Szmyd, J.; Kimijima, S.; Brus, G. A numerical analysis of unsteady transport phenomena in a Direct Internal Reforming Solid Oxide Fuel Cell. Int. J. Heat Mass Transf. 2019, 131, 1032–1051. [Google Scholar] [CrossRef]
  65. Zhao, C.Y. Review on thermal transport in high porosity cellular metal foams with open cells. Int. J. Heat Mass Transf. 2012, 55, 3618–3632. [Google Scholar] [CrossRef]
  66. Kawashima, T.; Hishinuma, M. Thermal properties of porous Ni/YSZ composites at high temperatures. Mater. Trans. JIM 1996, 37, 1518–1524. [Google Scholar] [CrossRef]
  67. Peet, M.J.; Hasan, H.S.; Bhadeshia, H.K.D.H. Prediction of thermal conductivity of steel. Int. J. Heat Mass Transf. 2011, 54, 2602–2608. [Google Scholar] [CrossRef]
  68. Bartholomew, C.H. Carbon Deposition in Steam Reforming and Methanation. Catal. Rev. 1982, 24, 67–112. [Google Scholar] [CrossRef]
  69. Lakhapatri, S.L.; Abraham, M.A. Deactivation due to sulfur poisoning and carbon deposition on Rh-Ni/Al2O3 catalyst during steam reforming of sulfur-doped n-hexadecane. Appl. Catal. A Gen. 2009, 364, 113–121. [Google Scholar] [CrossRef]
  70. Goldberg, D.E. Genetic Algorithms in Search Optimization & Machine Learning; Addison-Wesley Longman Publishing Co., Inc.: Boston, MA, USA, 1989. [Google Scholar]
  71. Tai, X.Y.; Ocone, R.; Christie, S.D.; Xuan, J. Multi-objective optimisation with hybrid machine learning strategy for complex catalytic processes. Energy AI 2022, 7, 100134. [Google Scholar] [CrossRef]
  72. Maciol, P.; Gawad, J.; Podorska, D. Arrangement of flow modification devices in continuous casting tundish based on multicriterion optimization. Arch. Metall. Mater. 2007, 52, 105–112. [Google Scholar]
  73. Agharezaei, P.; Sahu, T.; Shock, J.; O’Brien, P.G.; Ghuman, K.K. Designing catalysts via evolutionary-based optimization techniques. Comput. Mater. Sci. 2023, 216, 111833. [Google Scholar] [CrossRef]
  74. Raja, B.D.; Patel, V.; Jhala, R.L. Thermal design and optimization of fin-and-tube heat exchanger using heat transfer search algorithm. Therm. Sci. Eng. Prog. 2017, 4, 45–57. [Google Scholar] [CrossRef]
  75. Mozdzierz, M.; Brus, G.; Sciazko, A.; Komatsu, Y.; Kimijima, S.; Szmyd, J.S. Towards a Thermal Optimization of a Methane/Steam Reforming Reactor. Flow Turbul. Combust. 2016, 97, 171–189. [Google Scholar] [CrossRef]
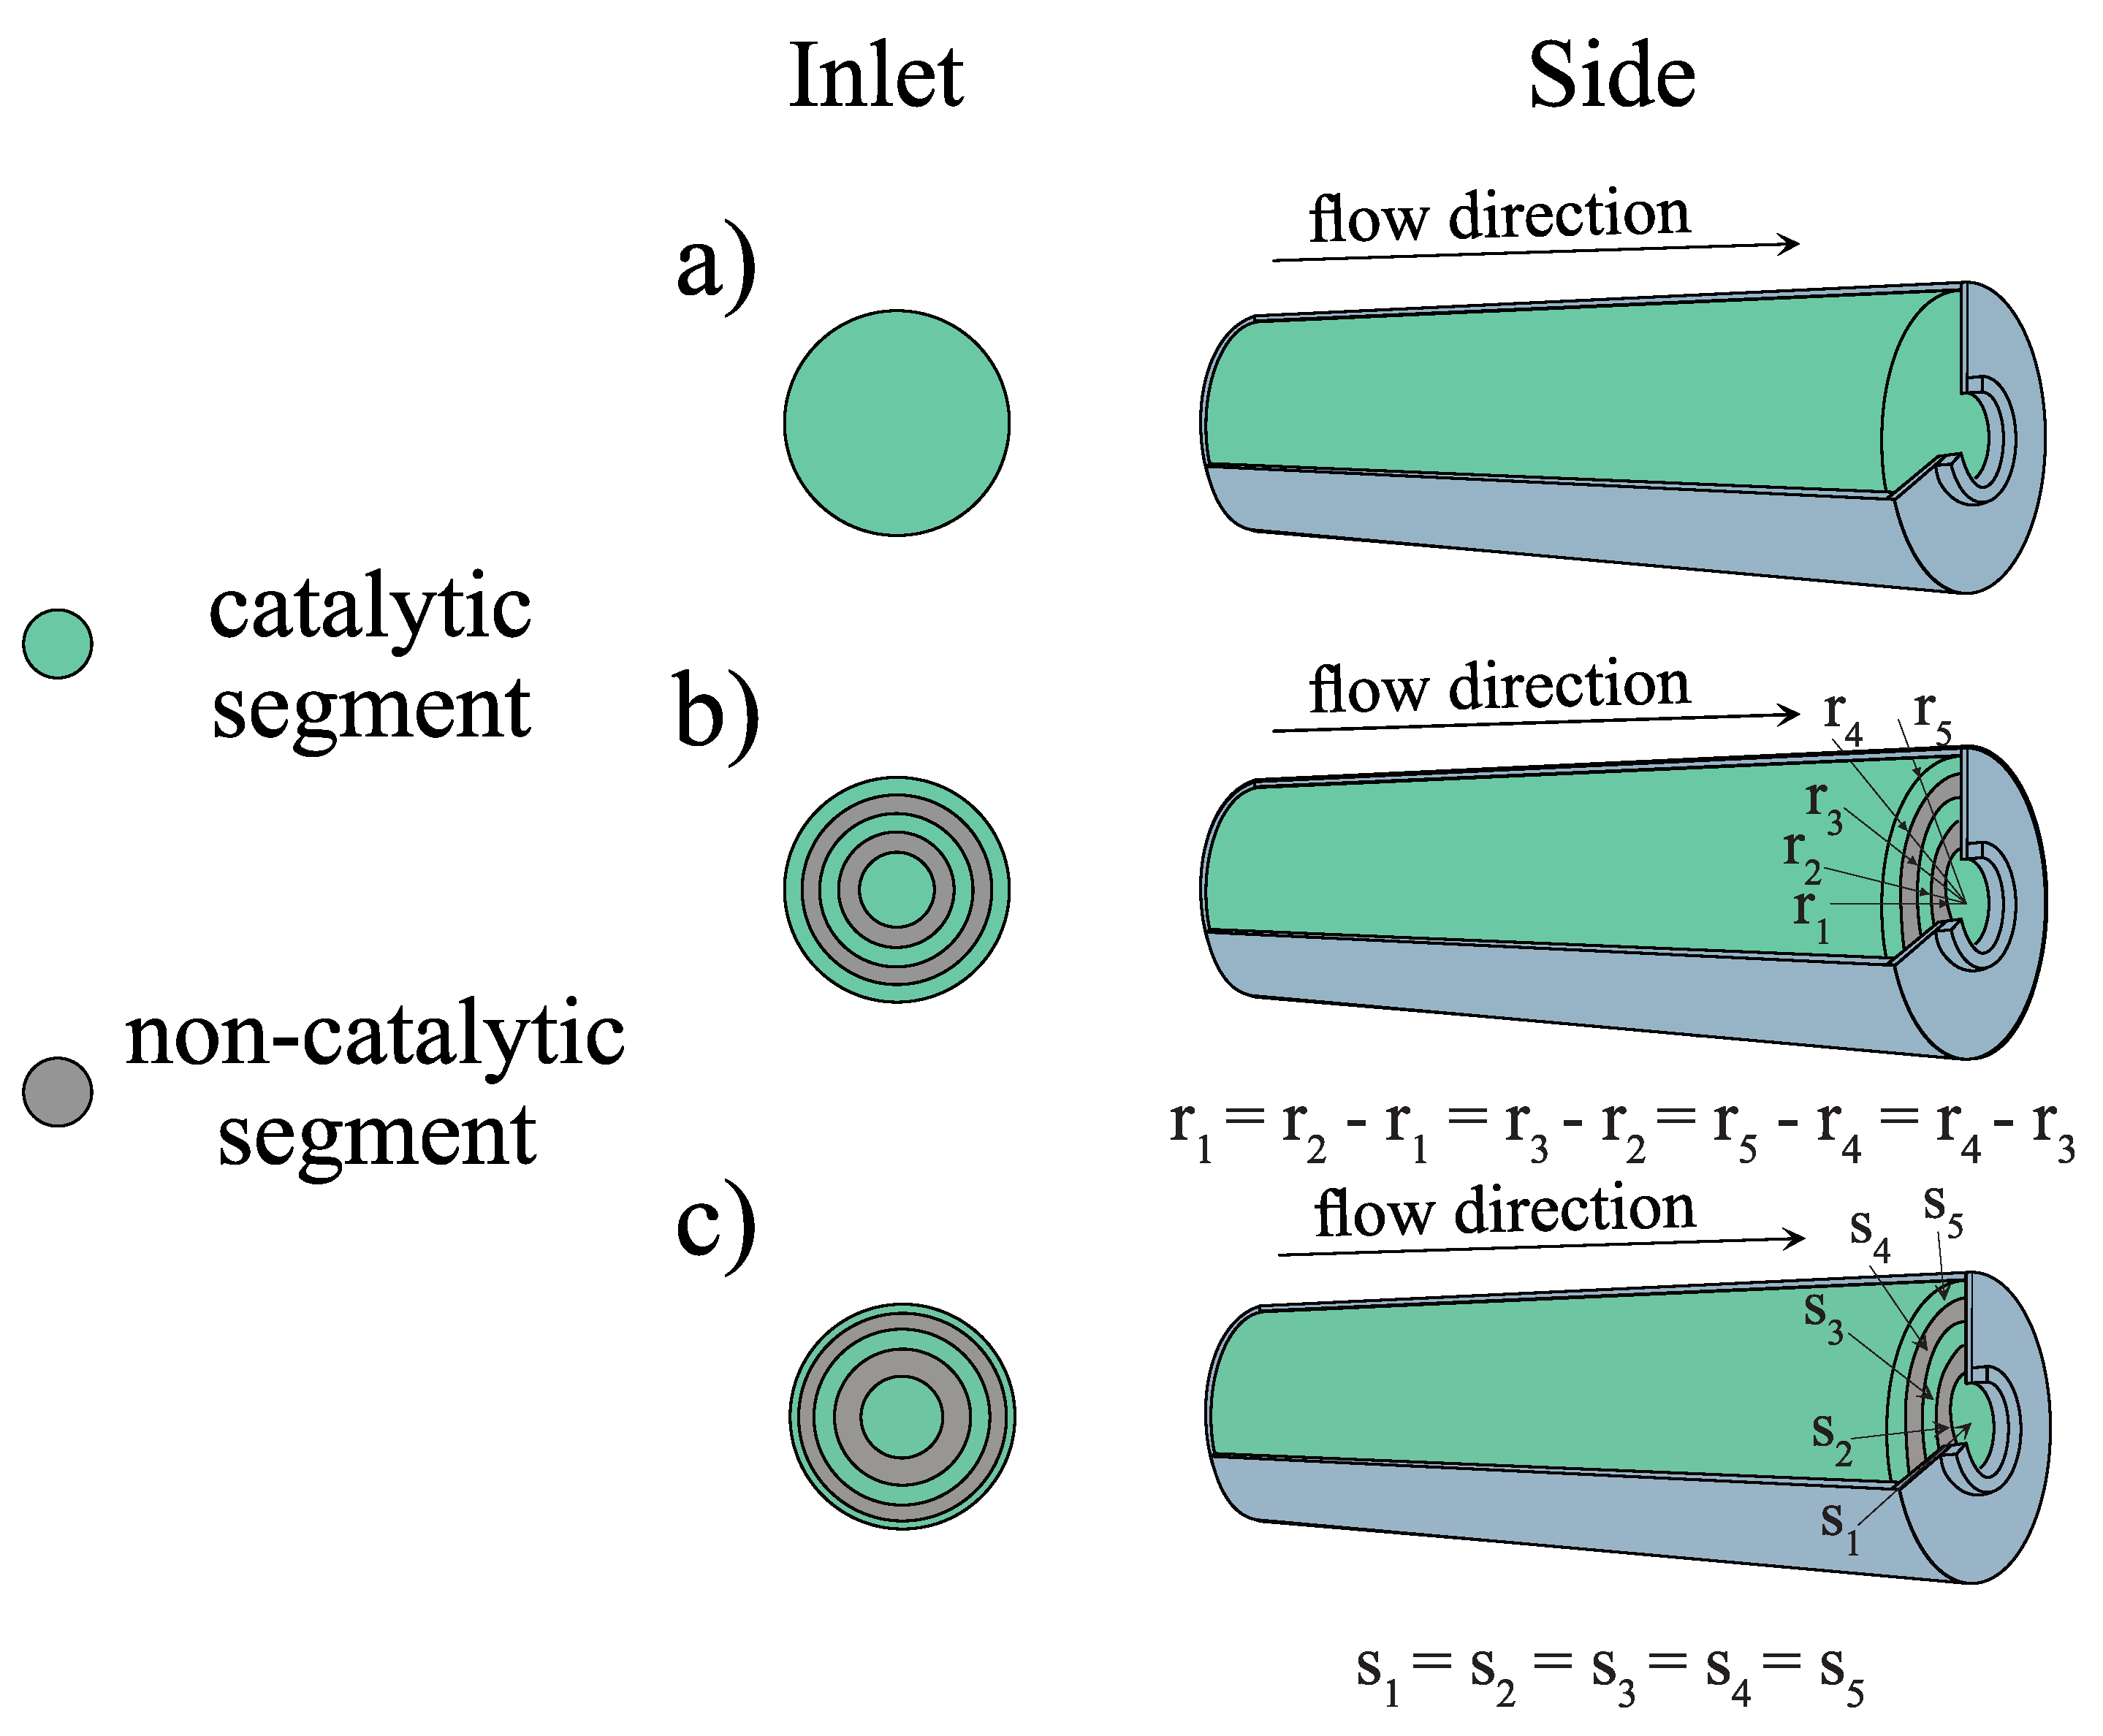
Figure 1. The catalytic insert designs: (a) Reference reactor with homogeneous and continuous catalytic insert, (b) Strategy I—catalytic insert divided in the radial direction (equal width of inlet surface), (c) Strategy II—catalytic insert divided in the radial direction (equal area of inlet surface).
Energies 16 04058 g001
Figure 2. The coaxial segments configurations: (a) Strategy I—equal width of rings, (b) Strategy II—equal inlet and outlet surface.
Energies 16 04058 g002
Figure 3. The reactor’s geometry with computational domain and boundary conditions indicated.
Energies 16 04058 g003
Figure 4. Summary of the genetic algorithm procedure.
Energies 16 04058 g004
Figure 5. Temperature field distribution—reference case ( T in = 900 K, u in = 0.15 m s 1 , S C = 2.0, C C = 1.5, w ˙ cat = 2.47 × 10 6 ).
Energies 16 04058 g005
Figure 6. Radius-averaged molar fractions—reference case ( T in = 900 K, u in = 0.15 m s 1 , S C = 2.0, C C = 1.5, w ˙ cat = 2.47 × 10 6 ).
Energies 16 04058 g006
Figure 7. Strategy I—Temperature field distribution: (a) 1st generation (b) 30th generation ( w CH 4 = 0.4 , w T = 0.6 , T in = 900 K, u in = 0.15 m s 1 , S C = 2.0, C C = 1.5).
Energies 16 04058 g007
Figure 8. Strategy I—Radius-averaged molar fractions: (a) 1st generation (b) 30th generation ( w CH 4 = 0.4 , w T = 0.6 , T in = 900 K, u in = 0.15 m s 1 , S C = 2.0, C C = 1.5).
Energies 16 04058 g008
Figure 9. Strategy I—Segments distribution for 30th generation (a) side cross-section view, (b) face view ( w CH 4 = 0.4 , w T = 0.6 , T in = 900 K, u in = 0.15 m s 1 , S C = 2.0, C C = 1.5).
Energies 16 04058 g009
Figure 10. Strategy II—Temperature field distribution: (a) 1st generation (b) 30th generation ( w CH 4 = 0.4 , w T = 0.6 , T in = 900 K, u in = 0.15 m s 1 , S C = 2.0, C C = 1.5).
Energies 16 04058 g010
Figure 11. Strategy II—Radius-averaged molar fractions: (a) 1st generation (b) 30th generation ( w CH 4 = 0.4 , w T = 0.6 , T in = 900 K, u in = 0.15 m s 1 , S C = 2.0, C C = 1.5).
Energies 16 04058 g011
Figure 12. Strategy II—Segments distribution for 30th generation (a) side cross-section view, (b) face view ( w CH 4 = 0.4 , w T = 0.6 , T in = 900 K, u in = 0.15 m s 1 , S C = 2.0, C C = 1.5).
Energies 16 04058 g012
Figure 13. Extended reactors—Temperature field distribution: (a) Strategy I, (b) Strategy II ( w CH 4 = 0.4 , w T = 0.6 , T in = 900 K, u in = 0.15 m s 1 , S C = 2.0, C C = 1.5).
Energies 16 04058 g013
Figure 14. Extended reactors—Radius-averaged molar fractions: (a) Strategy I, (b) Strategy II ( w CH 4 = 0.4 , w T = 0.6 , T in = 900 K, u in = 0.15 m s 1 , S C = 2.0, C C = 1.5).
Energies 16 04058 g014
Table 1. Mass sources/sinks.
SpeciesMass Generation MSRMass Generation WGSMass Generation DRYSummarized
Generation
H 2 3 R MSR M H 2 R WGS M H 2 2 R DRY M H 2 3 R MSR M H 2 b r e a k + R WGS M H 2
+ 2 R DRY M H 2
CO R MSR M CO R WGS M CO 2 R DRY M CO R MSR M CO b r e a k R WGS M CO + 2 R DRY M CO
CO 2 0 R WGS M CO 2 R DRY M CO 2 R WGS M CO 2
2 R DRY M H 2
CH 4 R MSR M CH 4 0 R DRY M H 2 R MSR M CH 4
R DRY M H 2
H 2 O R MSR M H 2 O R WGS M H 2 O 0 R MSR M H 2 O
R WGS M H 2 O
Table 2. Coefficients and terms for substitution in Equation (29).
Equation ϕ Ψ x Ψ r Γ S ¯
(19) Y j ρ 0 U x ρ 0 U r ρ 0 D j , eff S j
(21) U x ρ 0 ε 0 2 U x ρ 0 ε 0 2 U r μ ε 0 P x μ K p U x ρ 0 c ine K p U x U x 2 + U r 2
(22) U r ρ 0 ε 0 2 U r ρ 0 ε 0 2 U r μ ε 0 P r μ K p U r ρ 0 c ine K p U r U x 2 + U r 2 μ U r ε 0 r 2
(27)T ρ 0 C p U x ρ 0 C p U r λ eff Q s
Table 3. Rings’ dimensions.
RadiusEqual Width (cm)Equal Surface (cm)
r 1 1 5
r 2 2 10
r 3 3 15
r 4 4 2 5
r 5 55
Table 4. Results acquired for the two analyzed strategies after the computing of thirty generations.
CaseL (m)Conv. CH 4 T Fit. H 2 out ι ζ cat red   ( % )
REF0.30.8310.2730.3841.000.3840.00
Strategy I0.30.5070.8740.1860.390.4770.61
Strategy II0.30.6180.6770.2800.440.6360.56
Table 5. Extended reactors—Results acquired for the two analyzed strategies after the computing of thirty generations.
CaseL (m)Conv. CH 4 T Fit. H 2 out ι ζ cat red   ( % )
REF0.300.8310.2730.3841.000.3840.00
Strategy I0.490.8120.8740.2410.640.3770.36
Strategy II0.400.8100.6770.3210.590.5440.41
Disclaimer/Publisher’s Note: The statements, opinions and data contained in all publications are solely those of the individual author(s) and contributor(s) and not of MDPI and/or the editor(s). MDPI and/or the editor(s) disclaim responsibility for any injury to people or property resulting from any ideas, methods, instructions or products referred to in the content.