

Enhancing Hydrogen Production from Biogas through Catalyst Rearrangements

Abstract
:1. Introduction
- Application of the catalytic insert’s radial division for the reforming of biogas.
- Two individual approaches to the configuration of the segments.
- Analysis of the robustness of the results, via measuring the hydrogen productivity of specimens defined by the specific algorithms.
2. Mathematical Model
2.1. Chemical Reactions Model
2.2. Heat and Mass Transfer Model
3. Numerical Model
3.1. Transport Equations
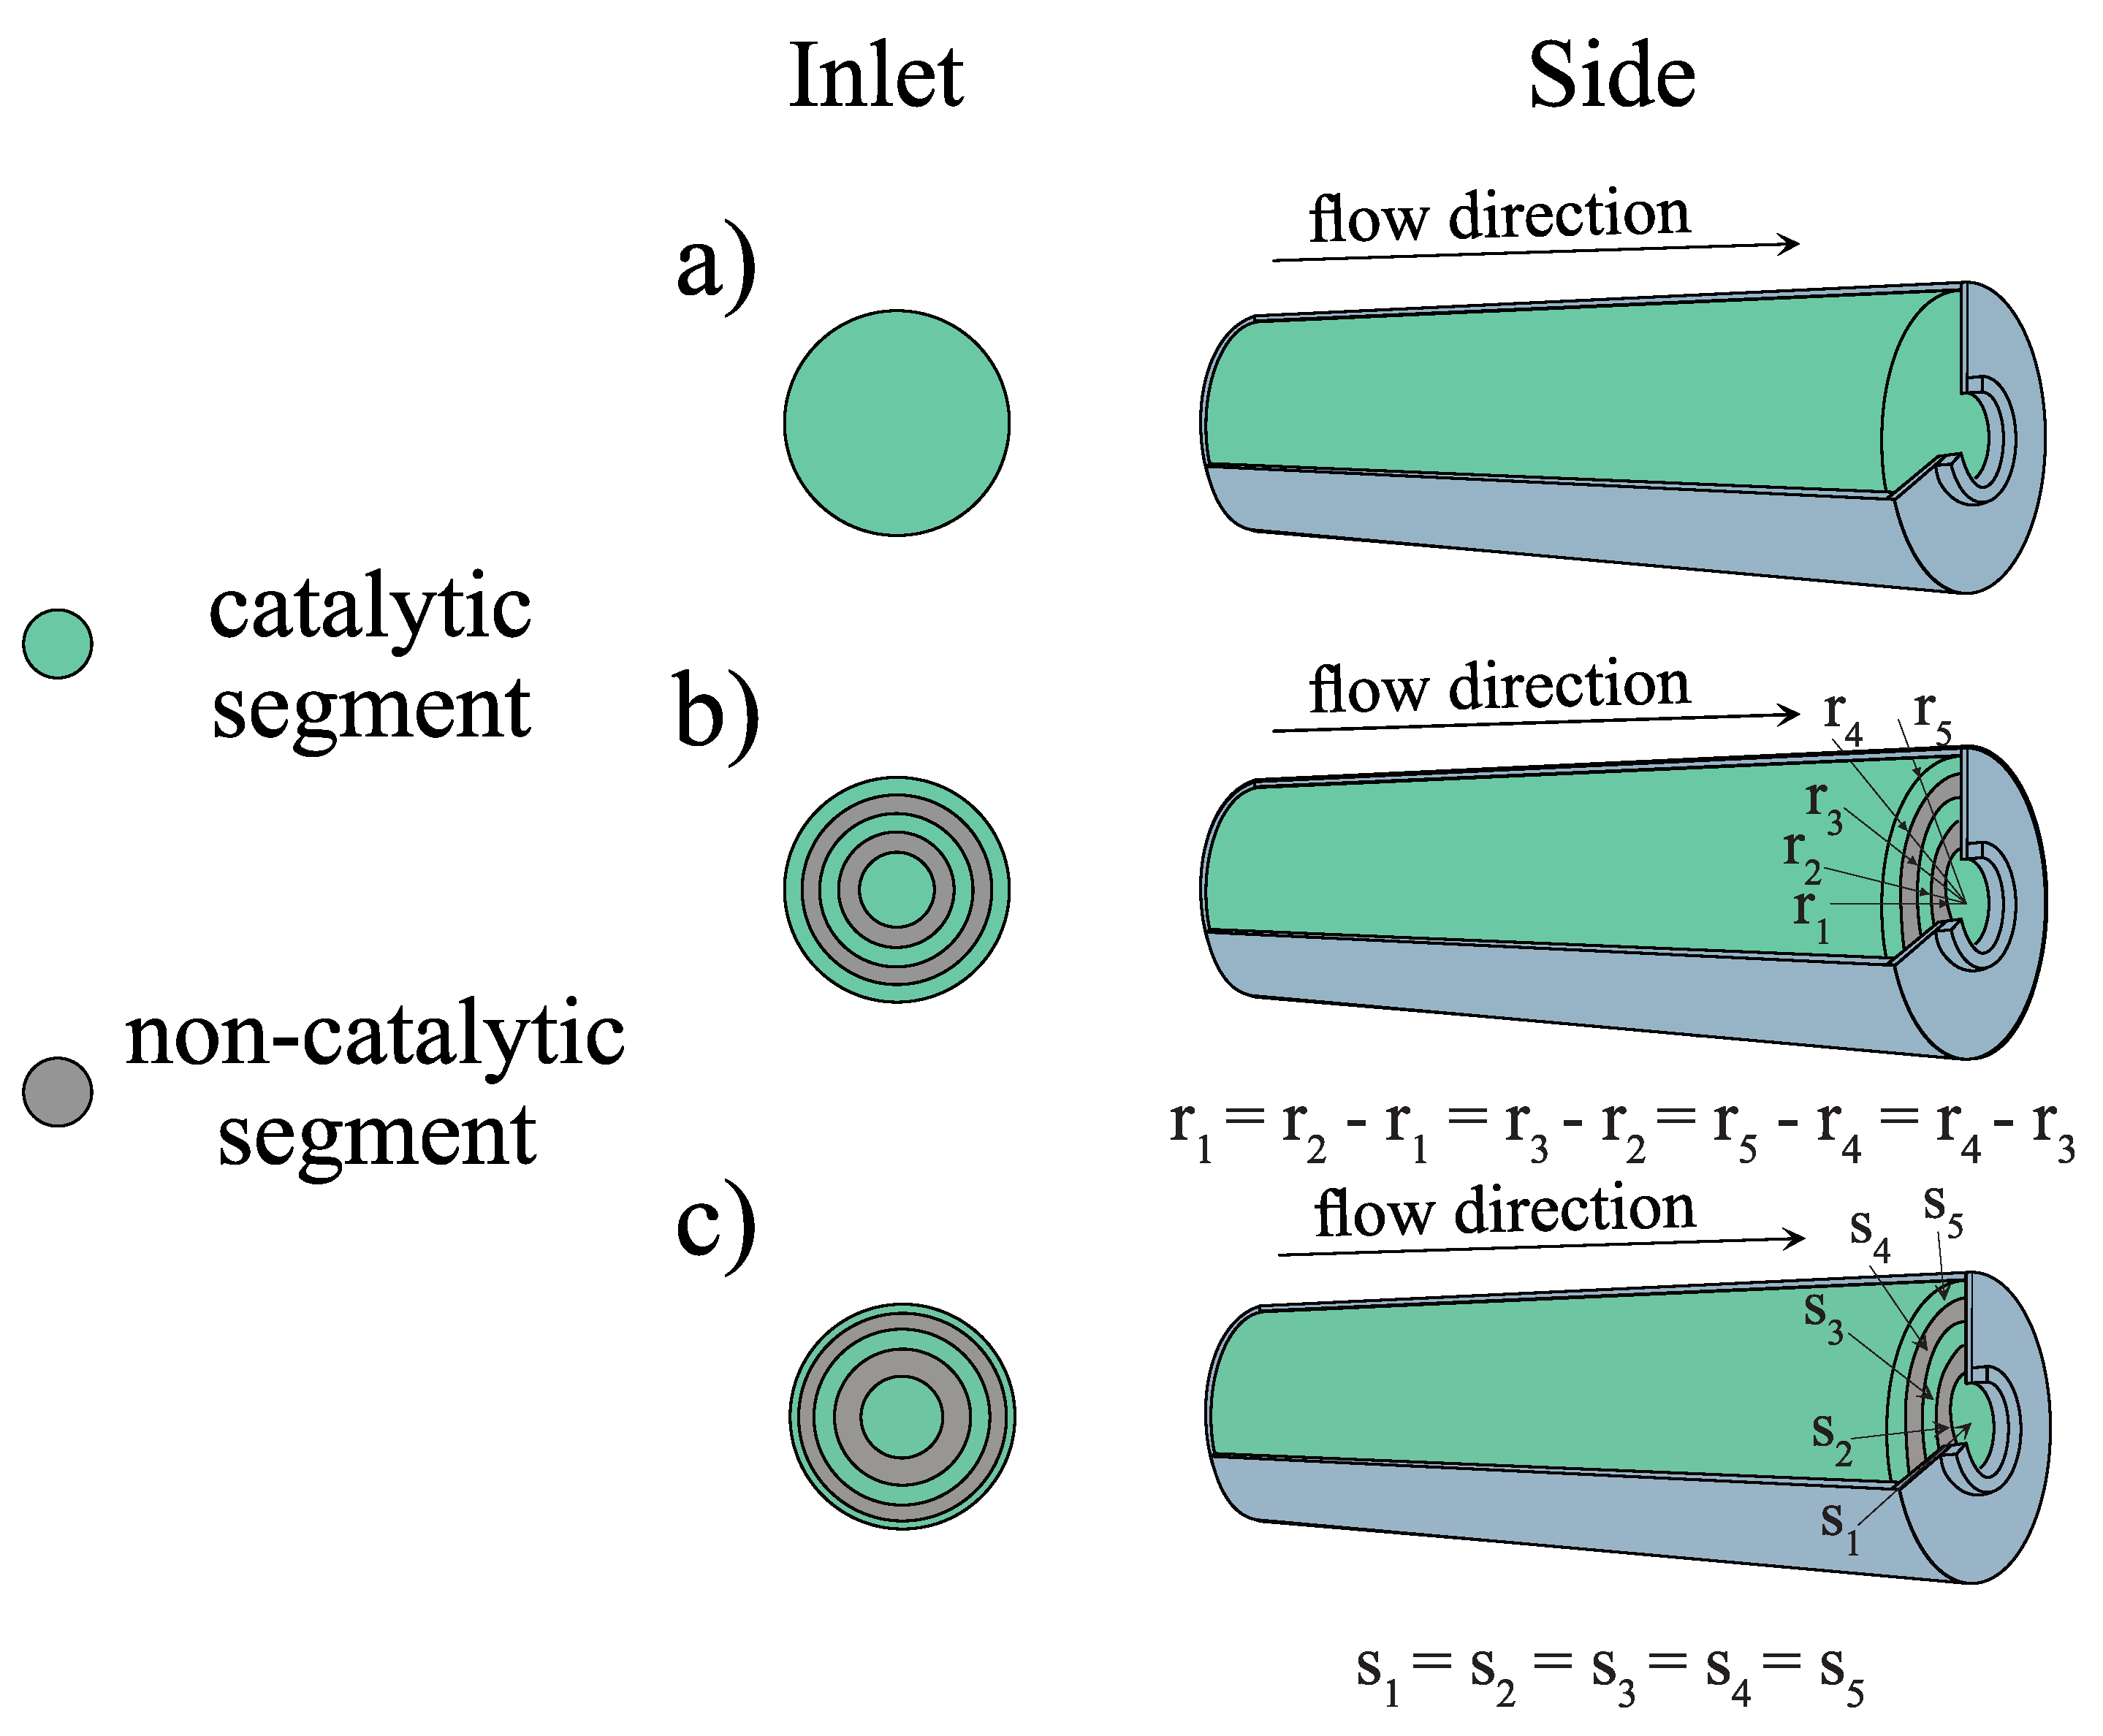
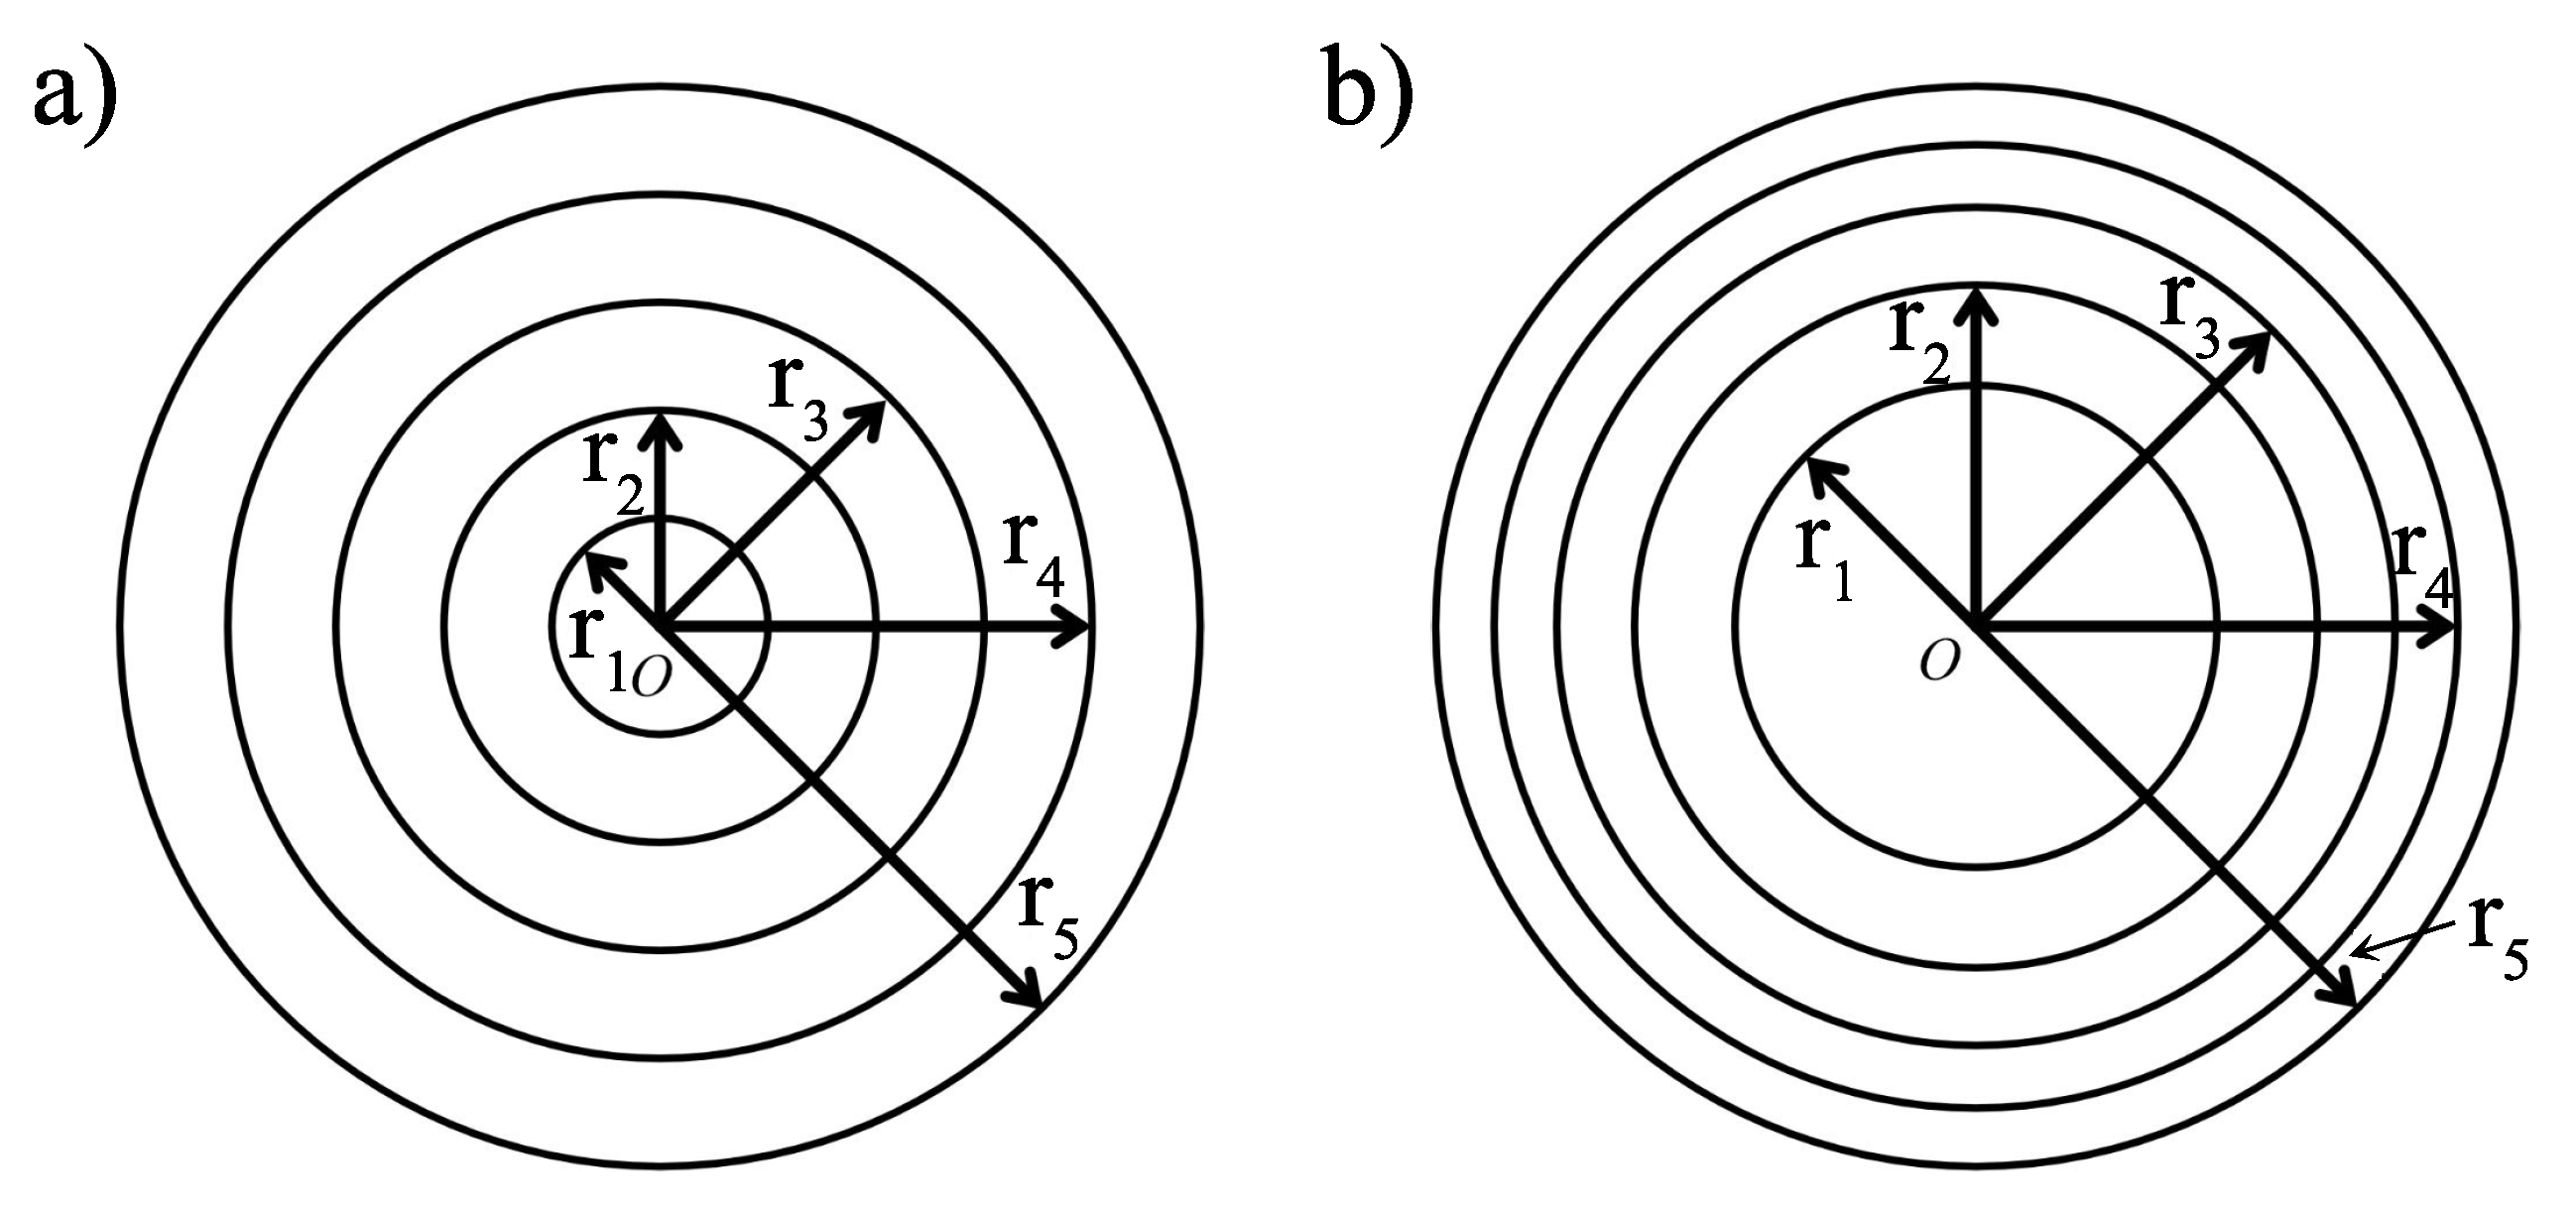
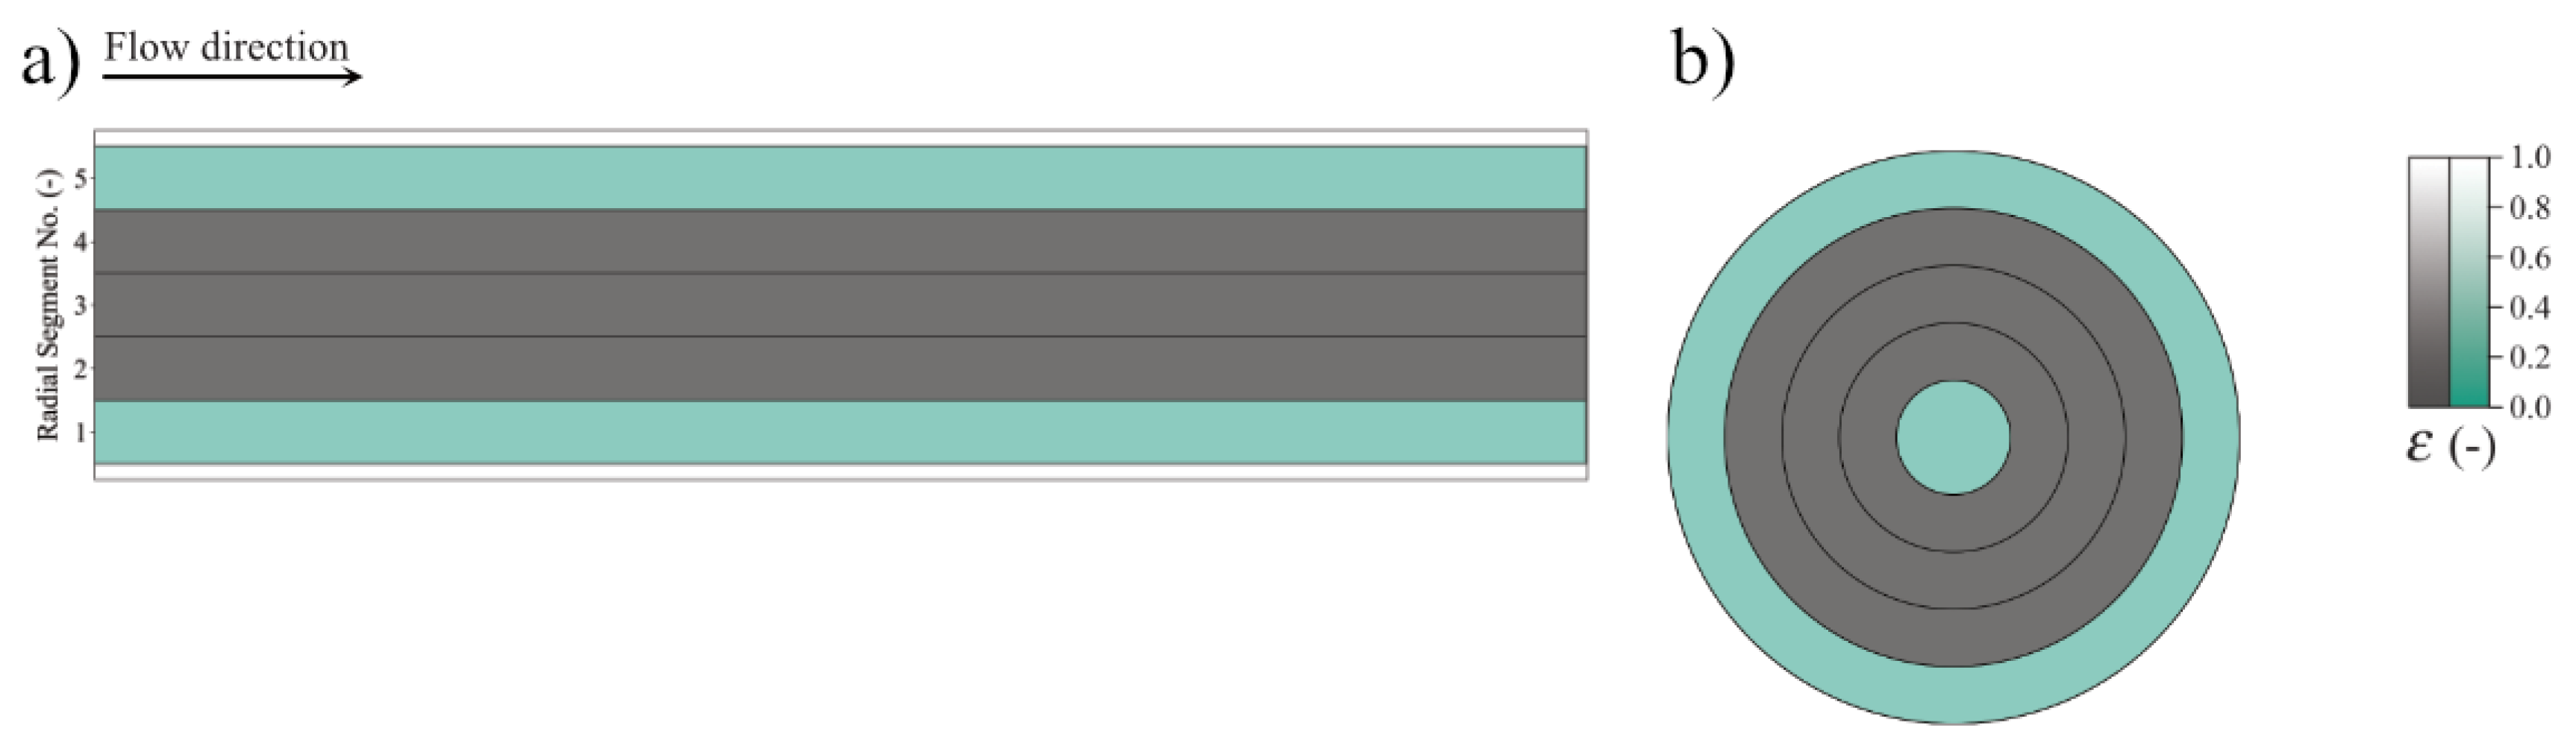
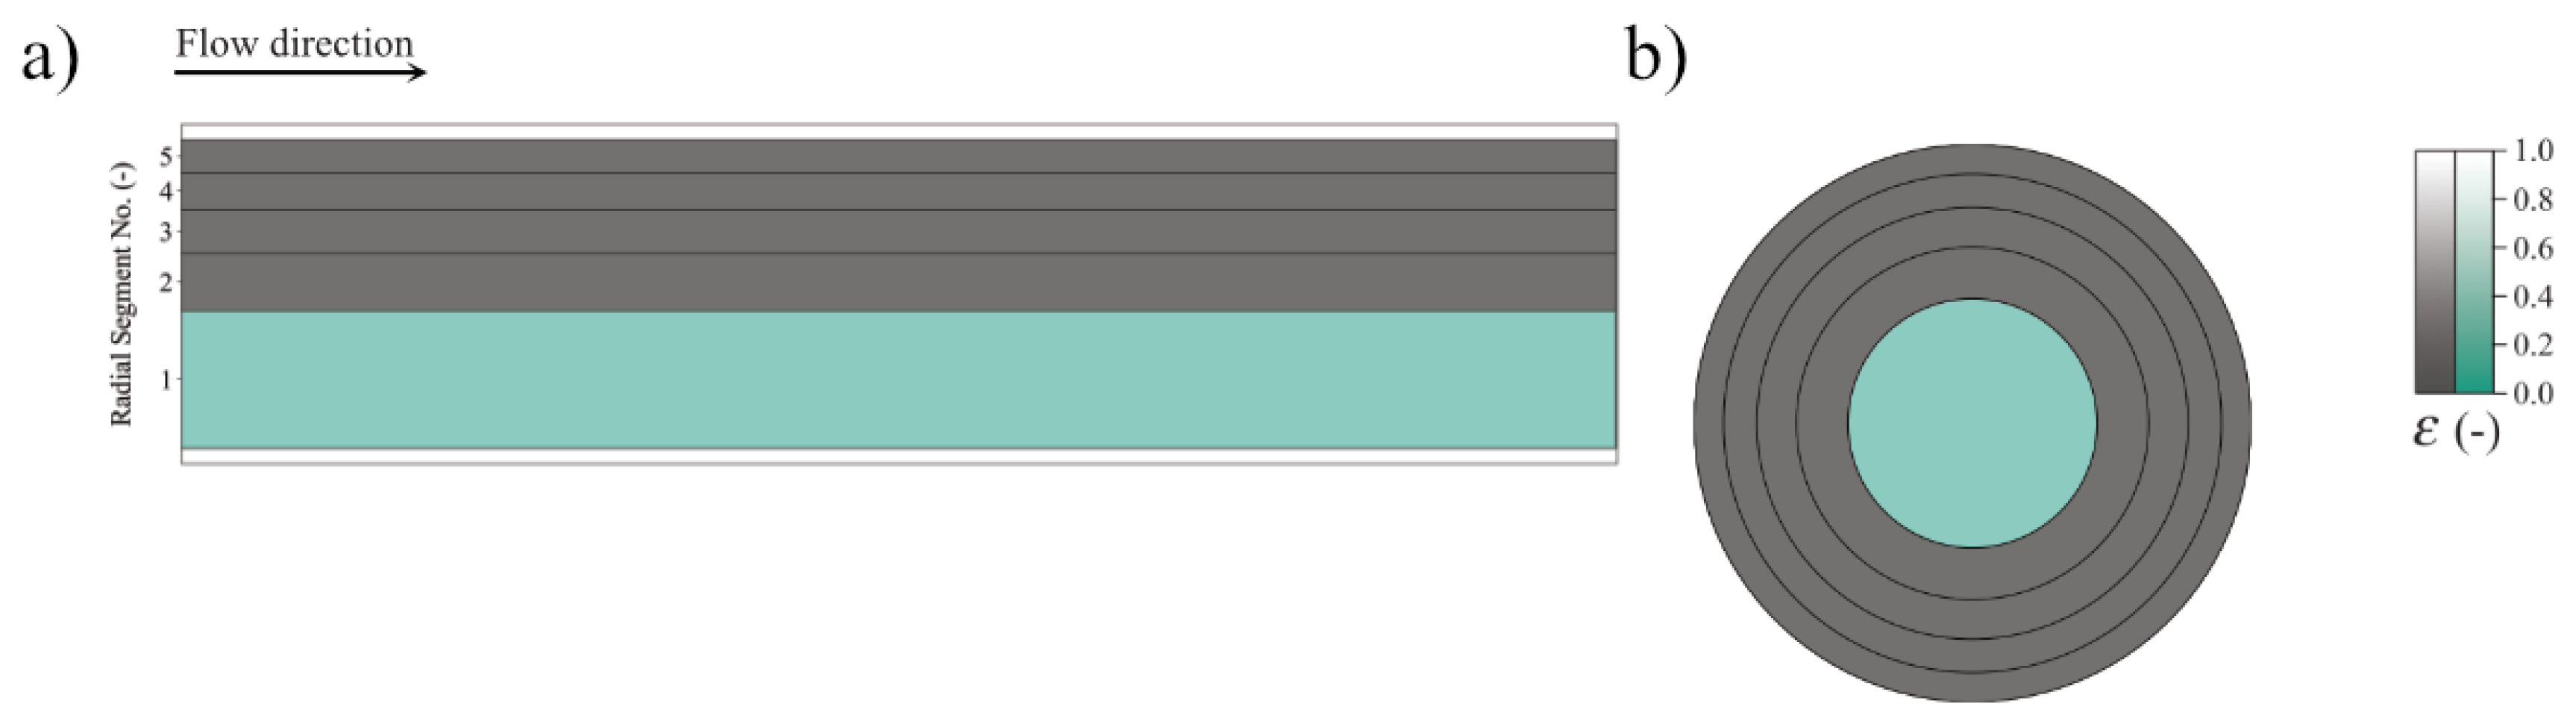
3.2. Coaxial Segments Configuration
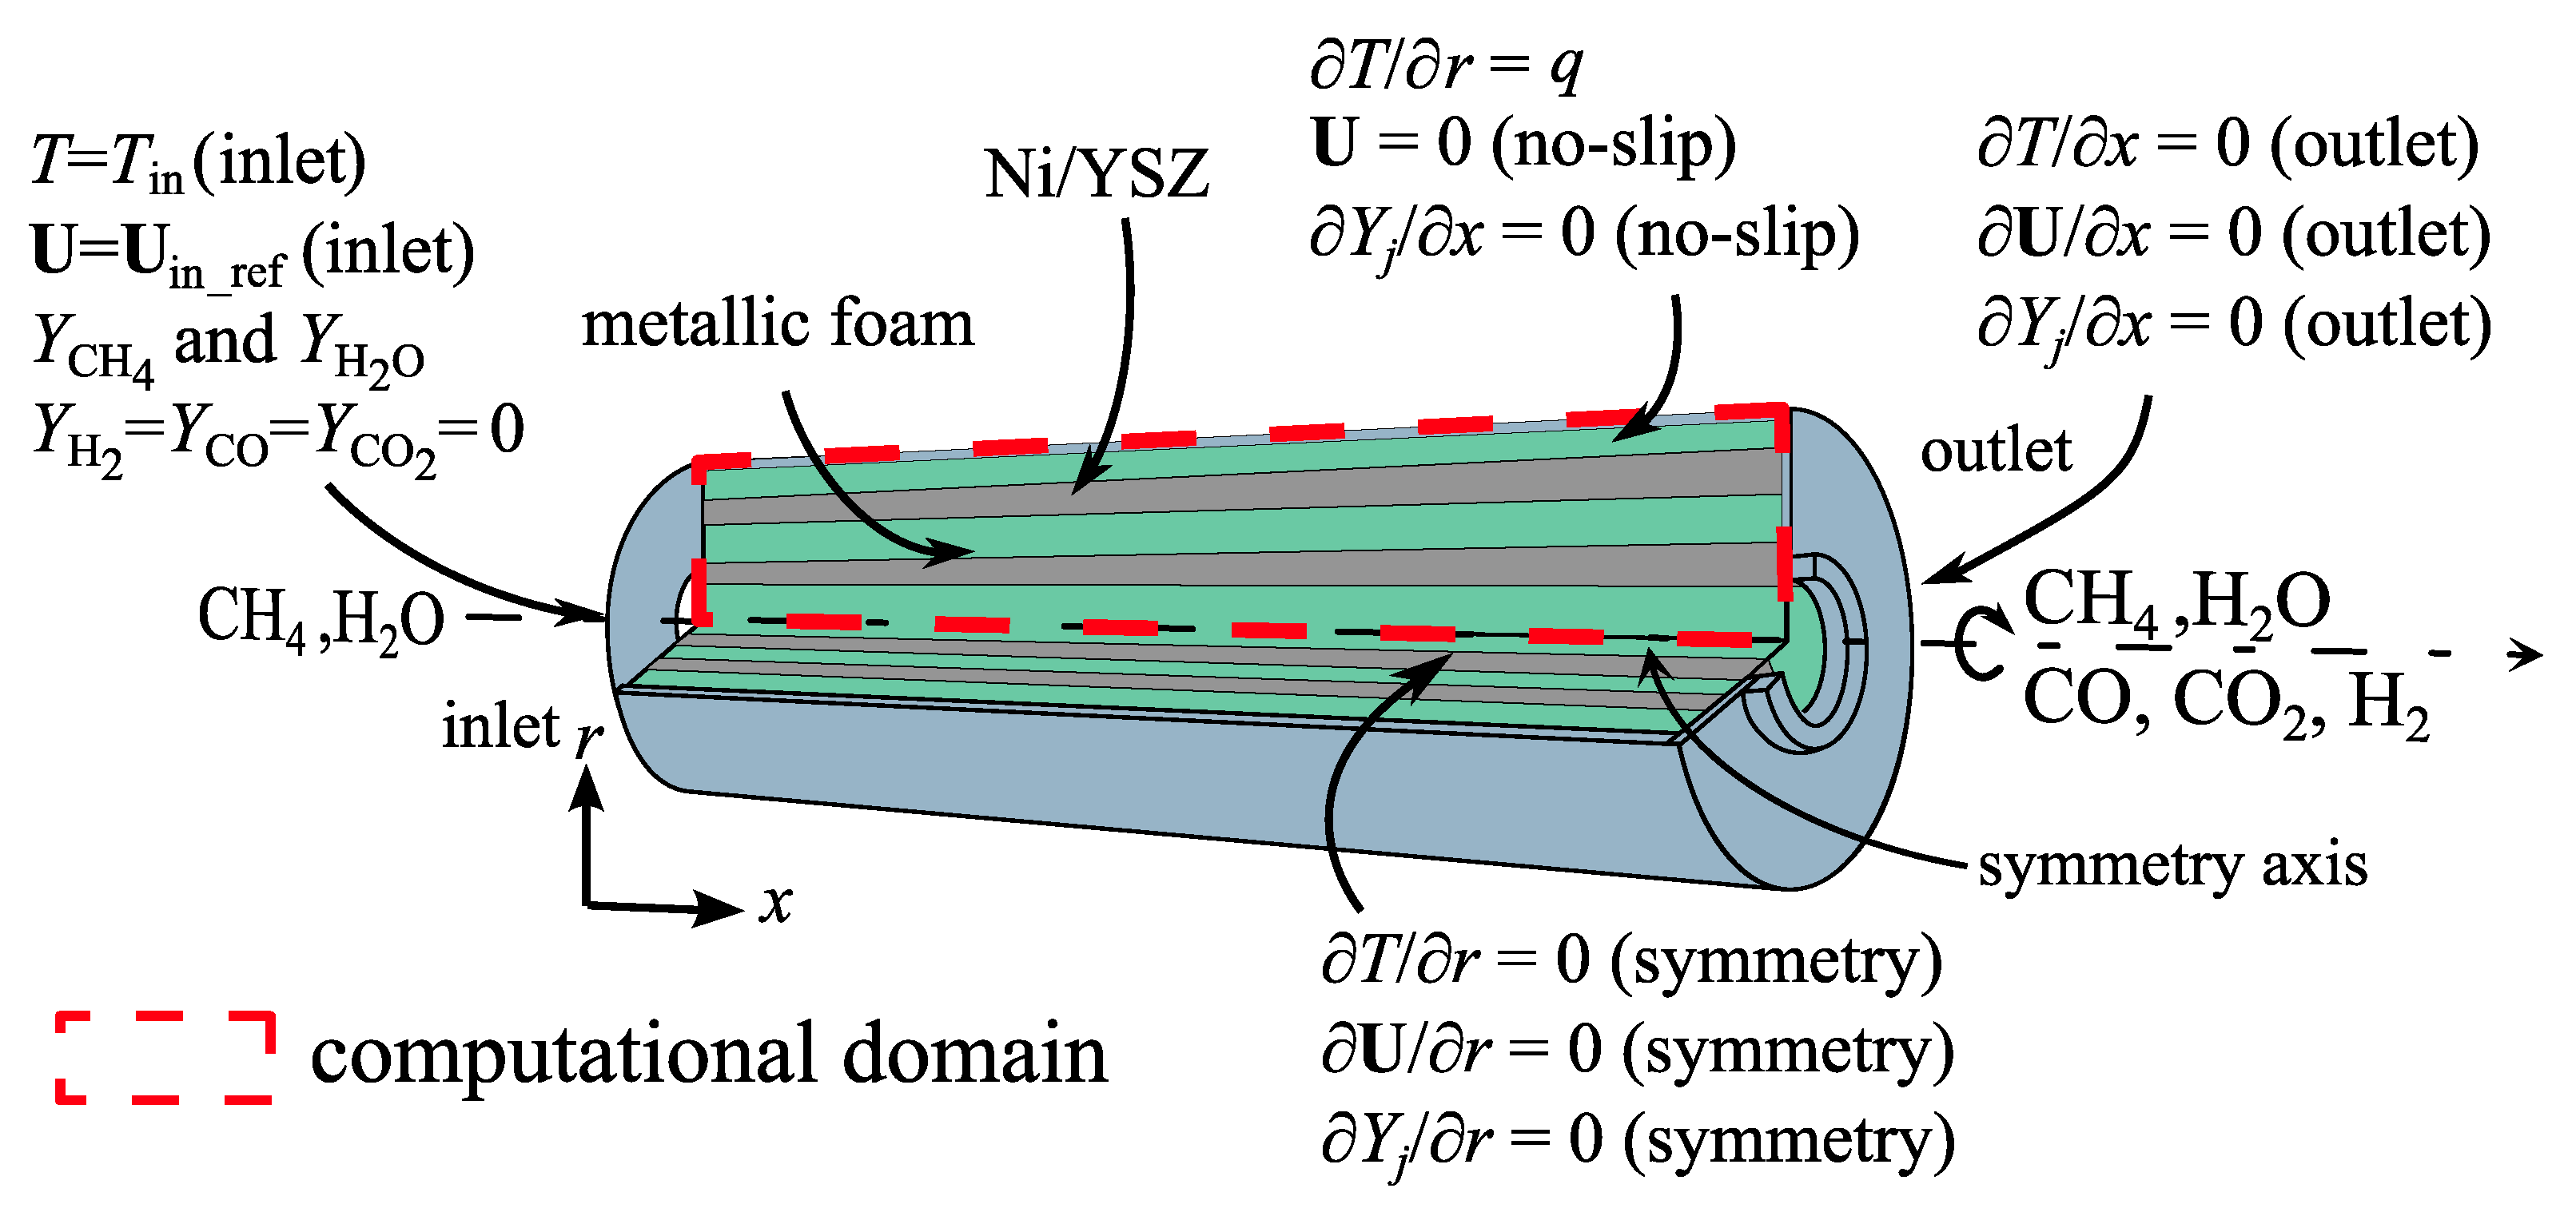
3.3. Computational Domain and Boundary Conditions
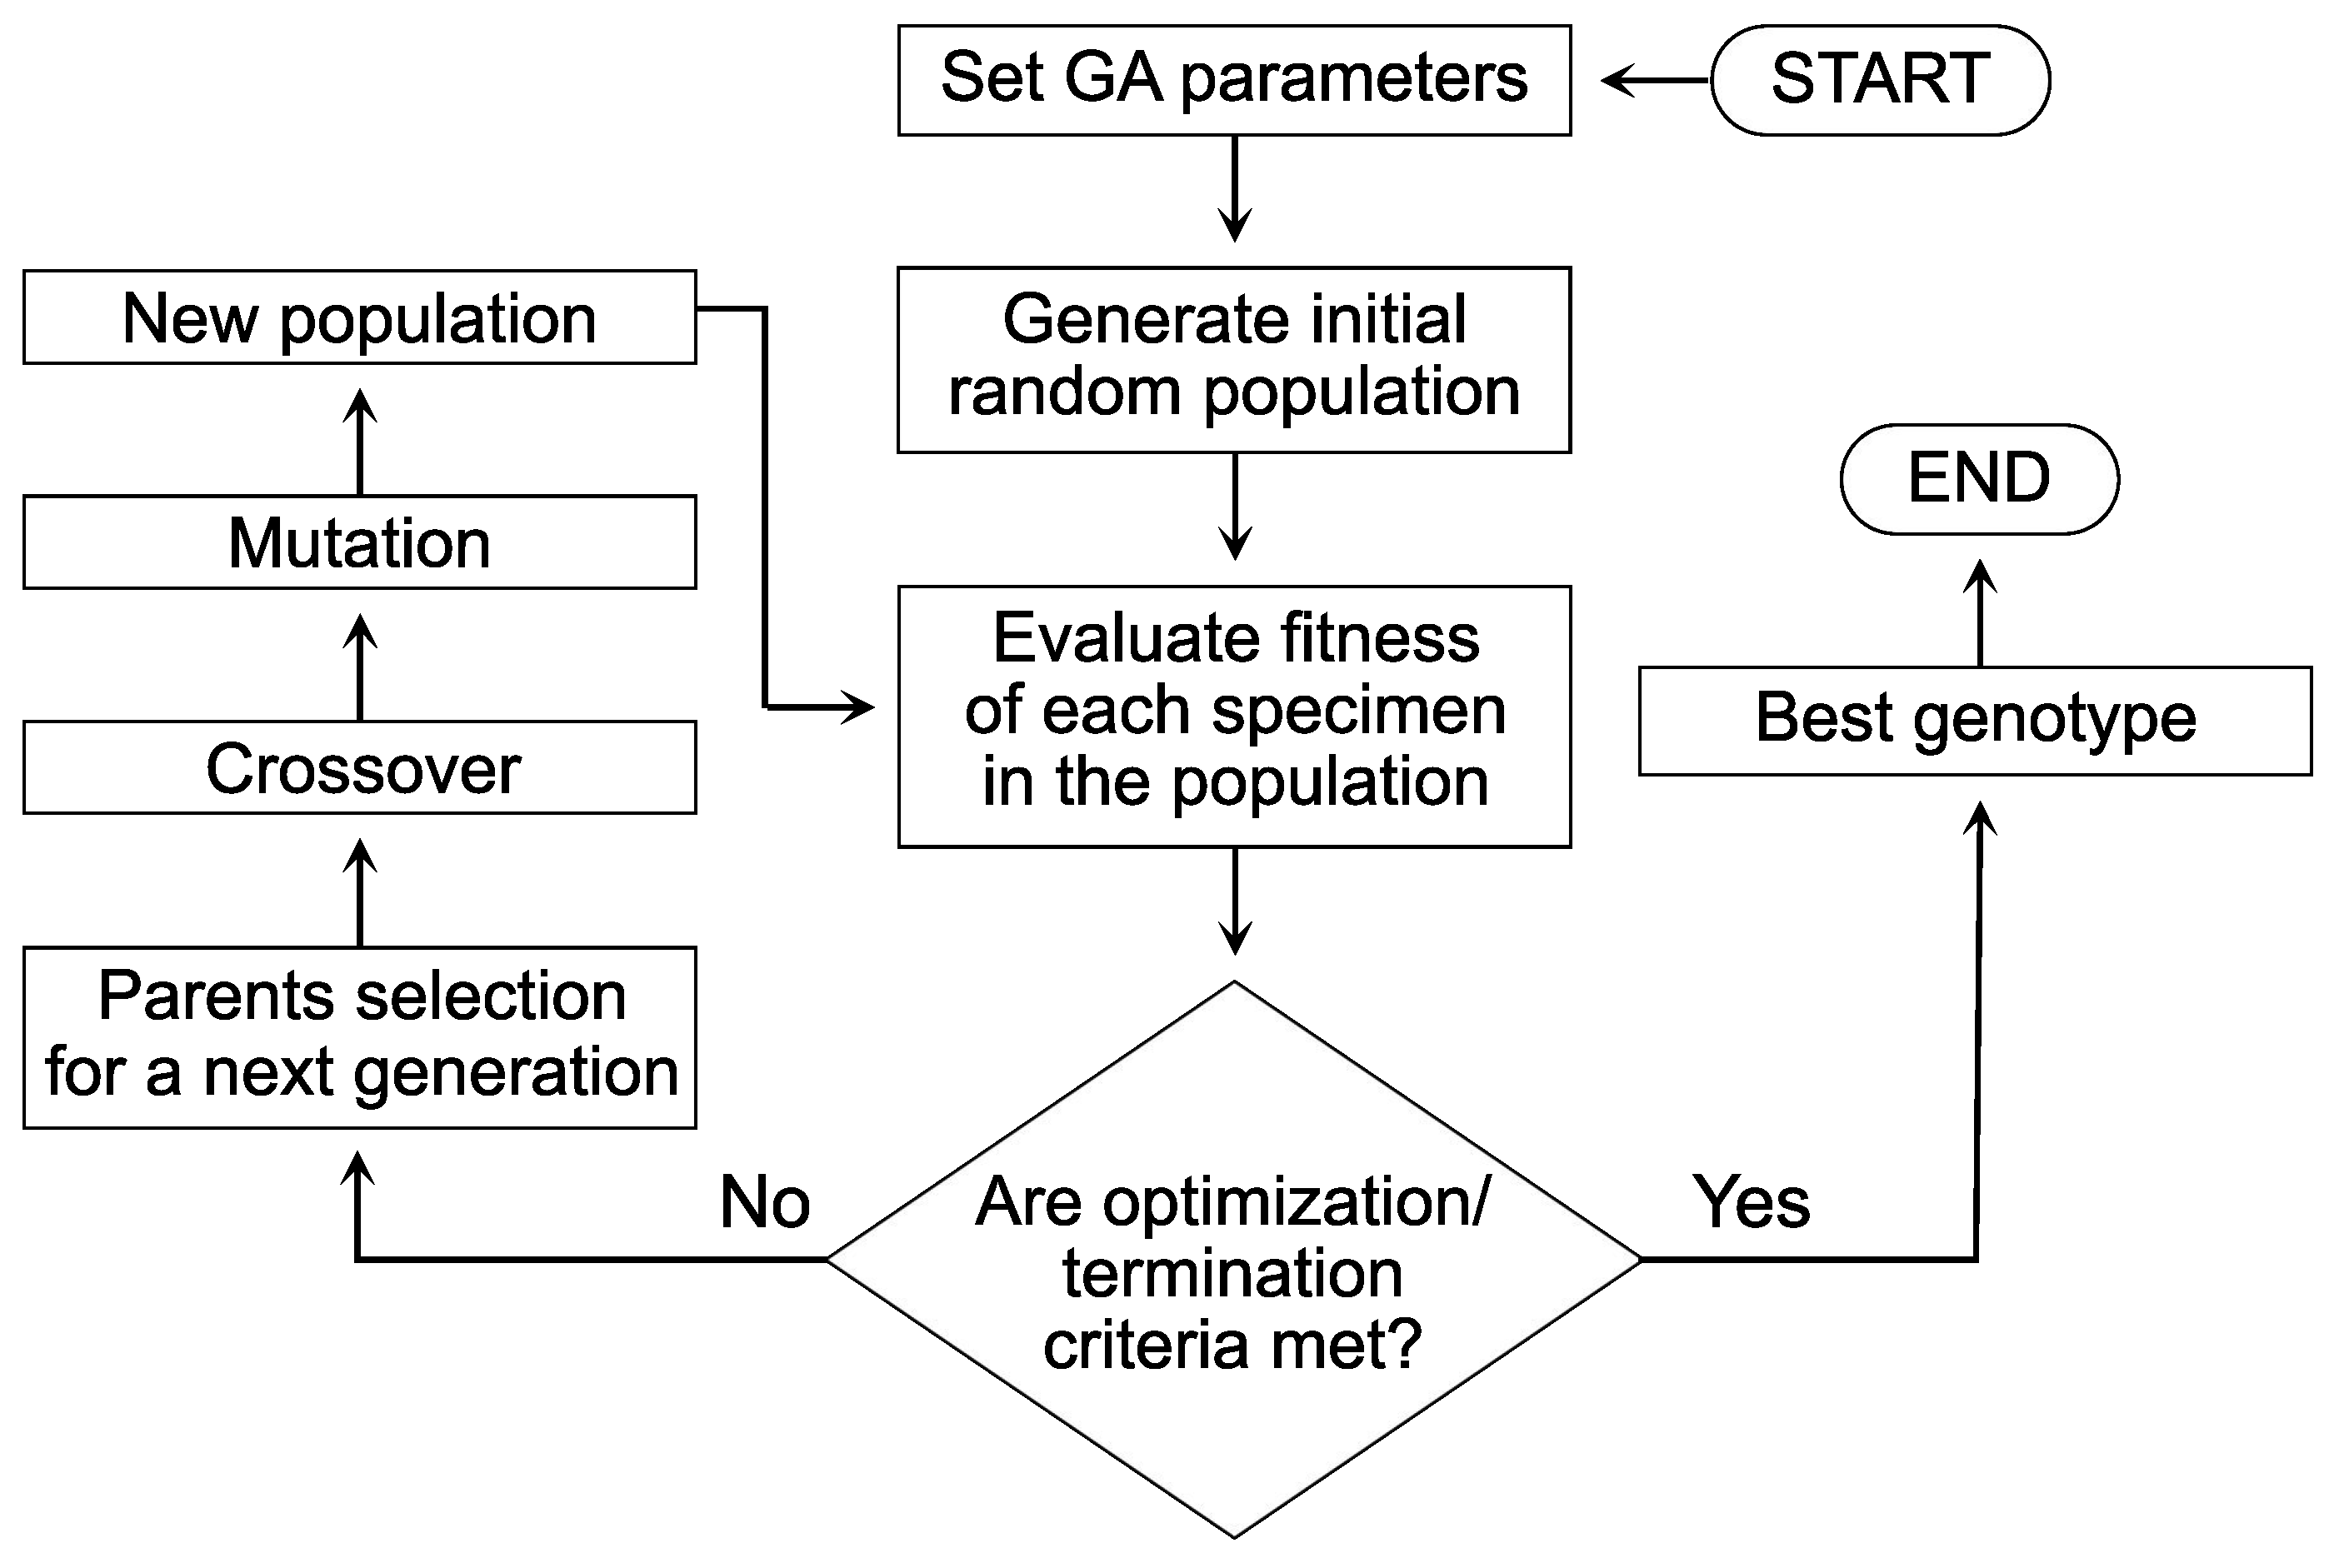
4. Genetic Algorithm
5. Results
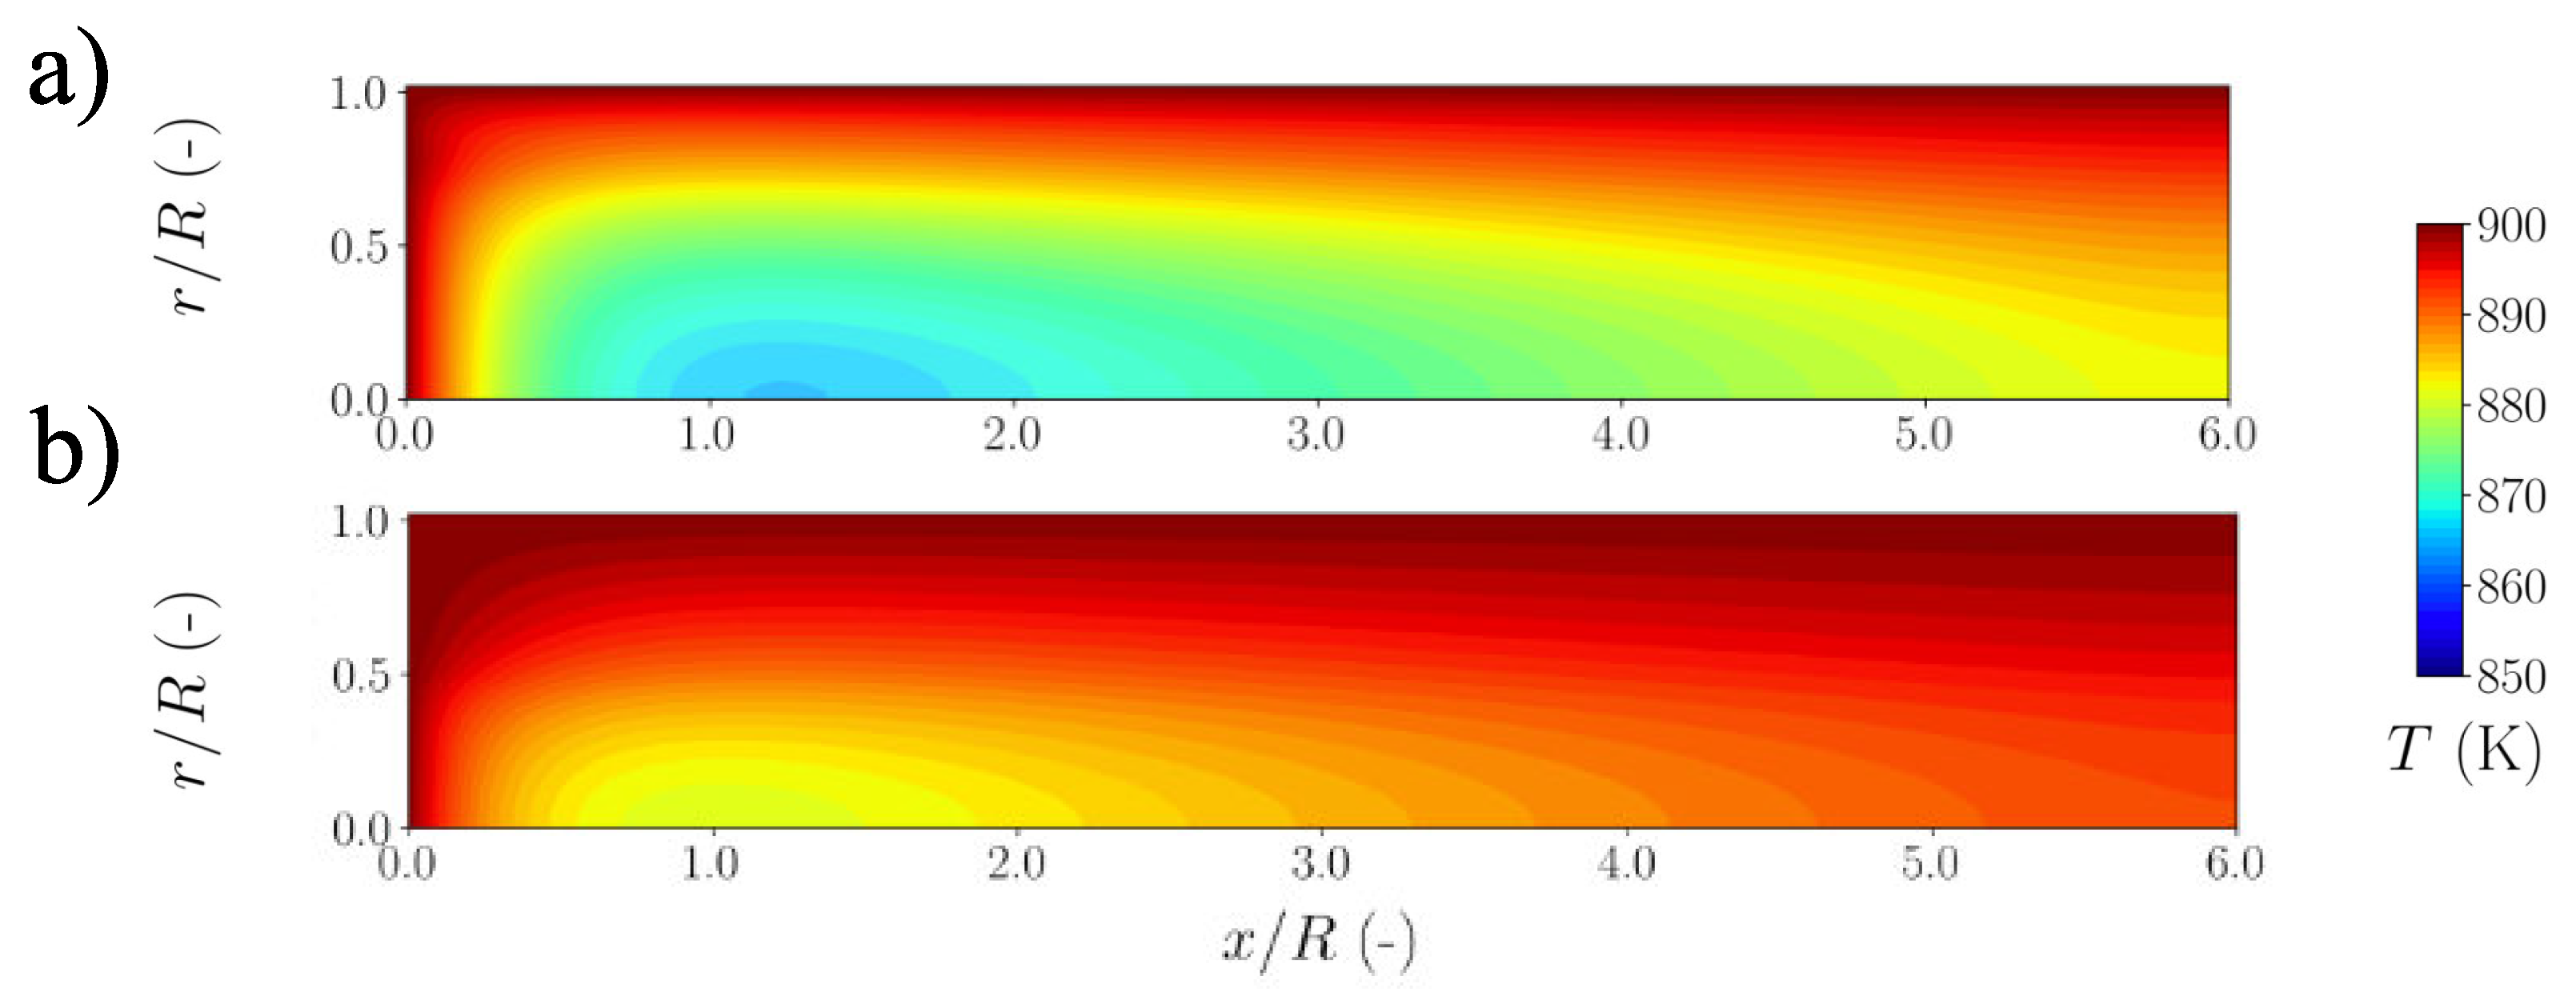
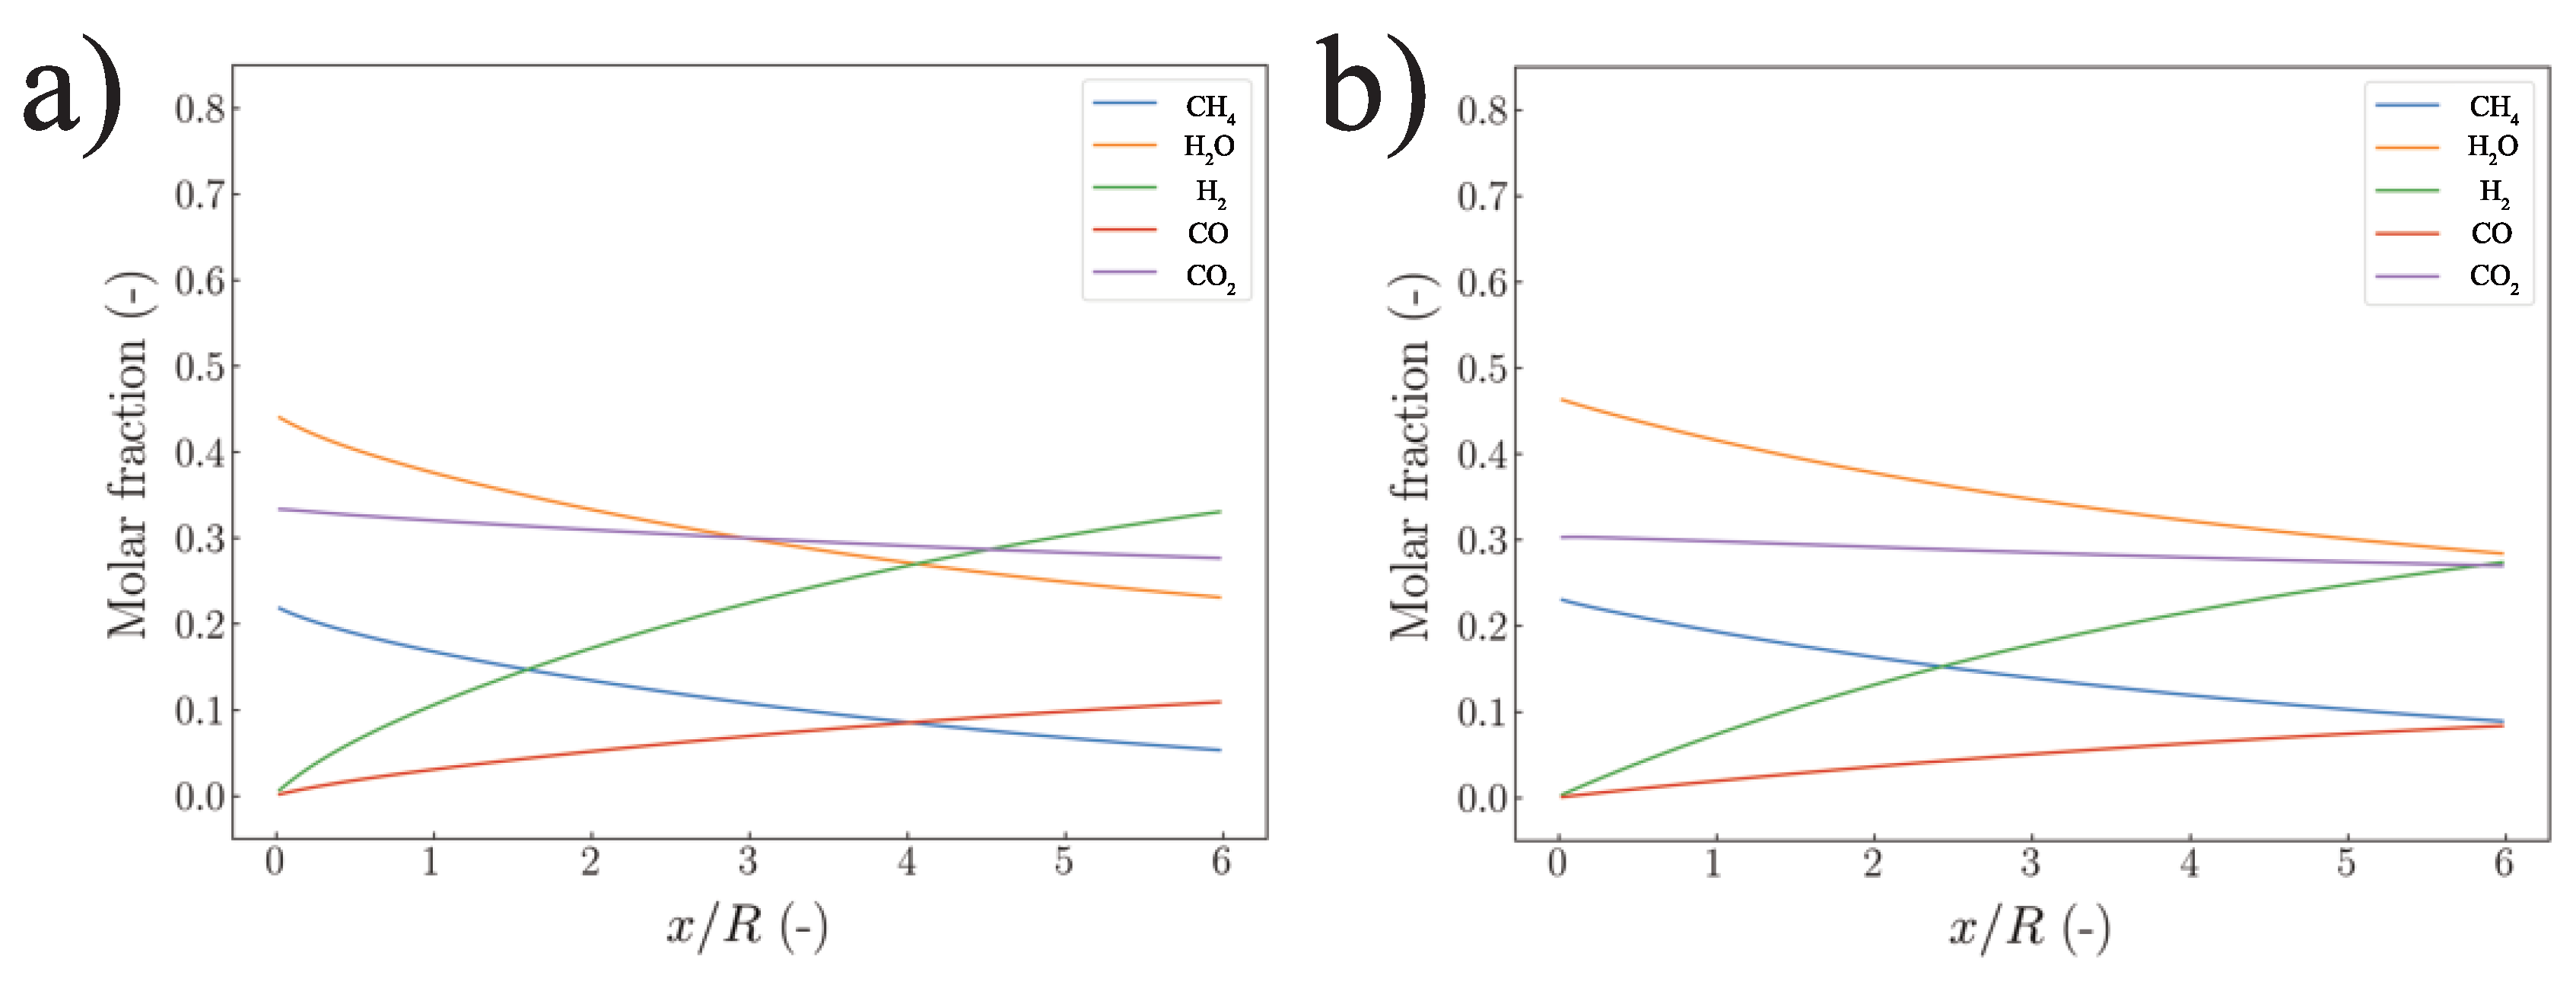
5.1. Strategy I
5.2. Strategy II
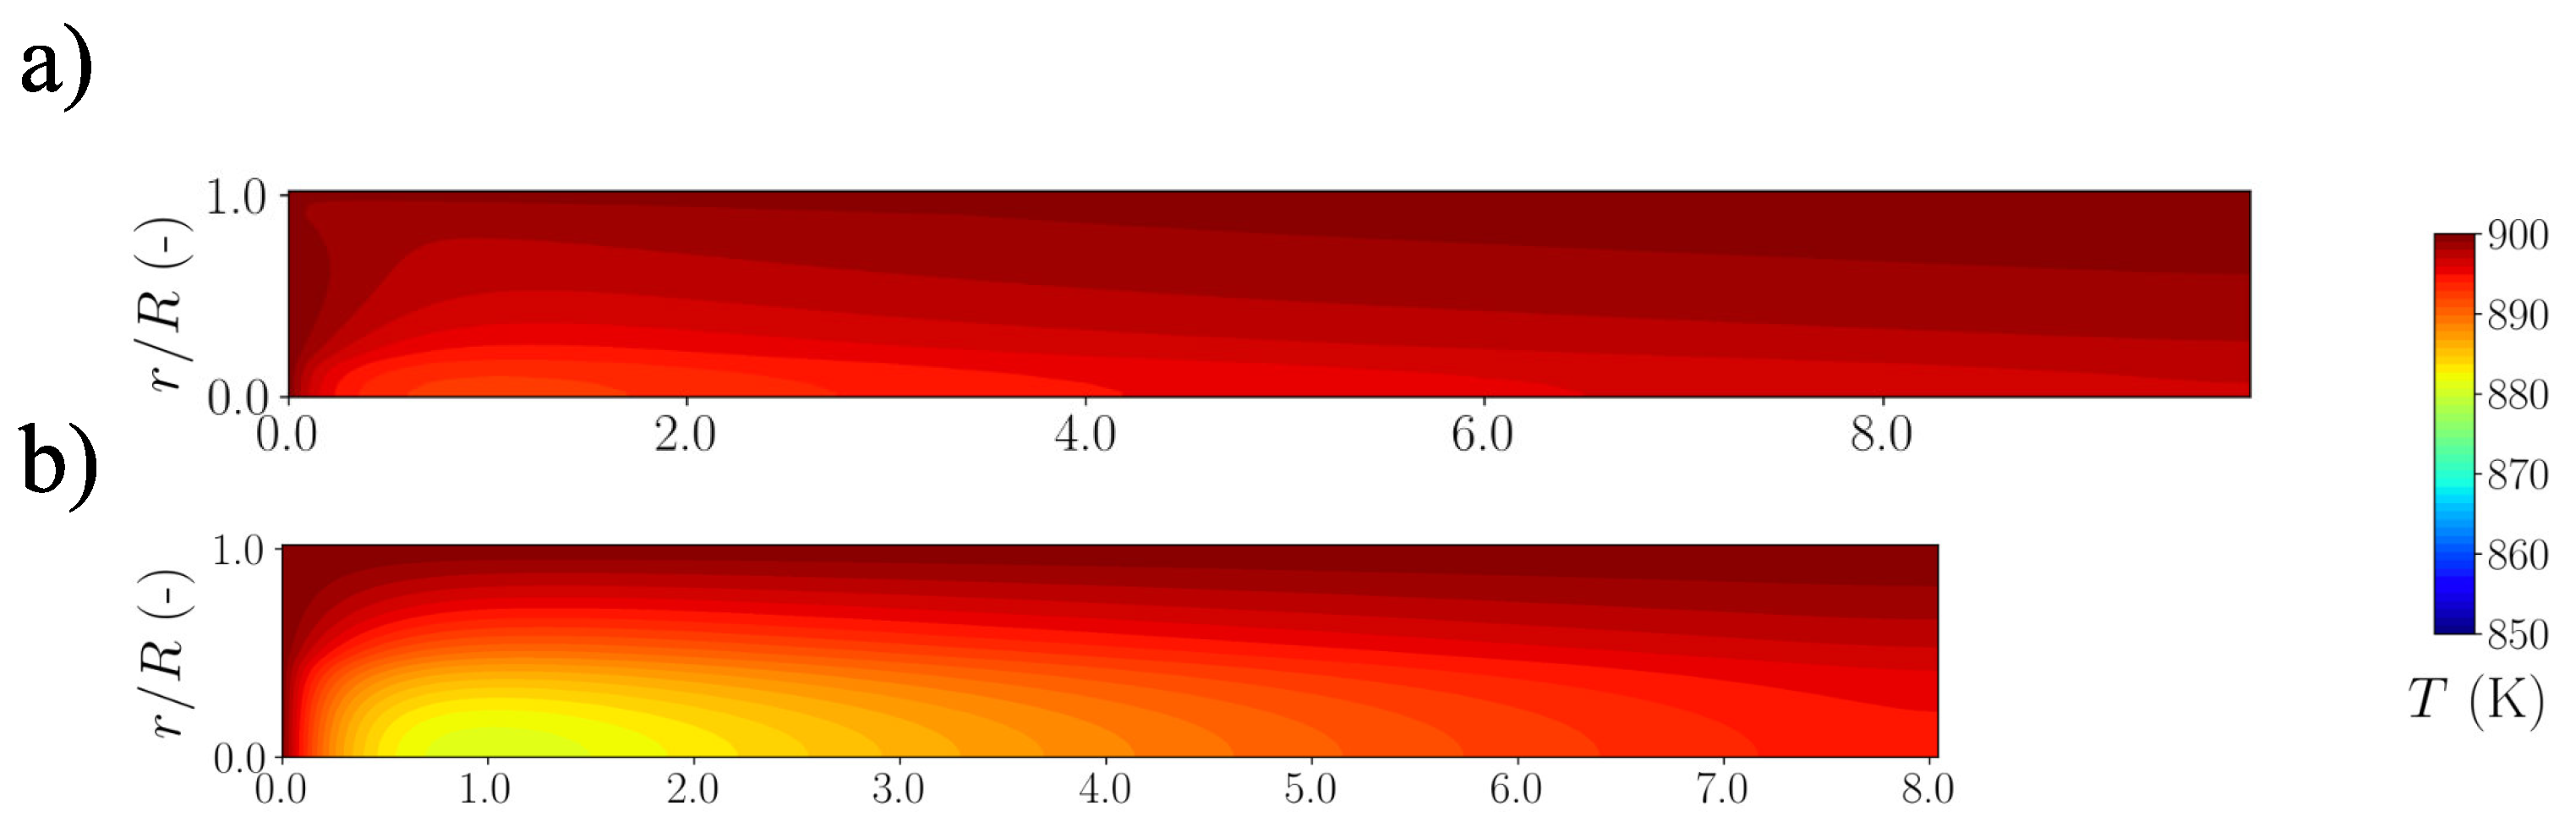
5.3. Reactor Extension
6. Conclusions
- 1.
- The macro-patterning concept with radially structured catalytic insert is a valid concept for the enhancement of biogas reforming.
- 2.
- Strategy II with equal areas of the segment’s inlet surfaces returned results of higher quality.
- 3.
- The introduction of the macro-patterning concept is proven to enhance the effectiveness of the reforming reaction. The hydrogen productivity has been almost doubled for the best solution when compared with the reference case.
Author Contributions
Funding
Data Availability Statement
Acknowledgments
Conflicts of Interest
Nomenclature
| A | Arrhenius constant (mol s g Pa) |
| aj | coefficient in the discretized Equation (the unit depends on the case) |
| b | constant term in the discretization Equation (the unit depends on the case) |
| Cmult | multiplication coefficient used for fitness scaling (-) |
| Cp | specific heat at constant pressure (J kg K) |
| cine | inertial coefficient (-) |
| catred | catalyst reduction (%) |
| Dj | mass diffusivity of the species j (m s) |
| d | dimensionless foam ligament radius (-) |
| dp | average pore diameter (mm) |
| Ea | activation energy (J mol) |
| e | dimensionless cubic node length (-) |
| f | fitness value (-) |
| frac | mole fraction (-) |
| ΔG | change of standard Gibbs free energy (J mol) |
| gs | shape function derived for the metallic foam structure (-) |
| ΔH | enthalpy change (J mol) |
| Kp | permeability (m) |
| K | equilibrium constant (-) |
| rate constant of the forward/backward water–gas-shift reaction (mol s m Pa) | |
| kMSR | rate constant of the methane/steam reforming reaction (mol s m Pa) |
| L | maximal x dimension (m) |
| l | node-to-node length (m) |
| n | molar flow rate (mol ) |
| P | pressure (Pa) |
| pj | partial pressure of the species j (Pa) |
| Q | heat flux (W m) |
| Qs | heat source/sink (W m) |
| R | reactor radius (m) |
| Ri | thermal resistances of the porous media cell subsections (m K W) |
| universal gas constant (J mol K) | |
| RMSR | steam reforming reaction rate (mol s m) |
| RWGS | water–gas shift reaction rate (mol s m) |
| rm | arithmetic mean between and (m) |
| Δr | grid r dimension (m) |
| Sj | mass source/sink of the species j (kg s m) |
| source term (the unit depends on the case) | |
| constant in the linear source term | |
| dependent variable coefficient in the linear source term (the unit depends on the case) | |
| SC | steam-to-carbon ratio (-) |
| T | temperature (K) |
| ΔT | difference between maximal and minimal temperatures inside the reactor (K) |
| Ur | gas phase average local velocity in the r direction (m s) |
| Ux | gas phase average local velocity in the x direction (m s) |
| u | velocity (m s) |
| u | velocity vector (m s) |
| V | volume of the reactor (m) |
| Wmj | molecular mass (g mol) |
| wi | function’s weight (-) |
| catalyst weight density (g m) | |
| Δx | grid x dimension (m) |
| xcr | methane conversion rate (-) |
| Yj | mass fraction of the species j (-) |
| ycr | carbon monoxide conversion rate (-) |
| Greek letters | |
| α | order of the reaction with respect to methane (-) |
| β | order of the reaction with respect to water (-) |
| Γ | diffusive term (the unit depends on the case) |
| ε | porosity (-) |
| ζ | hydrogen productivity (-) |
| ι | ratio of the catalyst amount in a specific reactor to the amount of catalyst in the reference reactor (-) |
| λ | thermal conductivity (W m K) |
| μ | dynamic viscosity (Pa s) |
| ρ | density (g m) |
| ρ0 | density of the gas mixture (kg m) |
| pseudo density (the unit depends on the case) | |
| τ | tortuosity (-) |
| ϕj | dependent variable (the unit depends on the case) |
| Ψr | convective term in the r direction (the unit depends on the case) |
| Ψx | convective term in the x direction (the unit depends on the case) |
| Subscripts | |
| A, B, C, D | unit cell subsections |
| avg | average value |
| CH4 | methane or based on the methane conversion rate |
| E | node to the right of the central node |
| e | interface to the right of the central node |
| eff | effective value |
| in | inlet |
| j | chemical species, grid element’s location, specimen |
| loc | local average, both over the gas and solid phase |
| MSR | steam reforming reaction |
| max | maximal value |
| min | minimal value |
| mix | gas mixture |
| N | node above the central node |
| n | interface above the central node |
| norm | normalized value |
| out | outlet |
| P | central node of the grid |
| S | node below the central node |
| s | interface below the central node |
| T | temperature based |
| W | node to the left of the central node |
| WGS | water–gas-shift reaction |
| w | interface to the left of the central node |
| Chemical species | |
| CH4 | methane |
| CO | carbon monoxide |
| CO2 | carbon dioxide |
| H2 | hydrogen |
| H2O | steam |
References
- Zou, C.; Zhao, Q.; Zhang, G.; Xiong, B. Energy revolution: From a fossil energy era to a new energy era. Nat. Gas Ind. B 2016, 3, 1–11. [Google Scholar] [CrossRef]
- Liobikienė, G.; Dagiliūtė, R. Do positive aspects of renewable energy contribute to the willingness to pay more for green energy? Energy 2021, 231, 120817. [Google Scholar] [CrossRef]
- Deublein, D.; Steinhauser, A. Biogas from Waste and Renewable Resources: An Introduction; John Wiley & Sons: Hoboken, NJ, USA, 2011. [Google Scholar]
- Minh, D.P.; Siang, T.J.; Vo, D.V.N.; Phan, T.S.; Ridart, C.; Nzihou, A.; Grouset, D. Hydrogen production from biogas reforming: An overview of steam reforming, dry reforming, dual reforming, and tri-reforming of methane. Hydrog. Supply Chain. 2018, 111–166. [Google Scholar] [CrossRef]
- Manoharan, Y.; Hosseini, S.E.; Butler, B.; Alzhahrani, H.; Senior, B.T.F.; Ashuri, T.; Krohn, J. Hydrogen fuel cell vehicles; current status and future prospect. Appl. Sci. 2019, 9, 2296. [Google Scholar] [CrossRef]
- Kozhukhova, A.E.; du Preez, S.P.; Bessarabov, D.G. Catalytic hydrogen combustion for domestic and safety applications: A critical review of catalyst materials and technologies. Energies 2021, 14, 4897. [Google Scholar] [CrossRef]
- Marcoberardino, G.D.; Vitali, D.; Spinelli, F.; Binotti, M.; Manzolini, G. Green hydrogen production from raw biogas: A techno-economic investigation of conventional processes using pressure swing adsorption unit. Processes 2018, 6, 19. [Google Scholar] [CrossRef]
- De Risi, A.; Colangelo, G.; Milanese, M. Advanced Technologies for Green Hydrogen Production. Energies 2023, 16, 2882. [Google Scholar] [CrossRef]
- Shamsi, M.; Moghaddas, S.; Naeiji, E.; Farokhi, S. Techno-Economic, Energy, Exergy, and Environmental Comparison of Hydrogen Production from Natural gas, Biogas, and their Combination as Feedstock. Arab. J. Sci. Eng. 2023, 1–17. [Google Scholar] [CrossRef]
- Mozdzierz, M.; Brus, G.; Sciazko, A.; Komatsu, Y.; Kimijima, S.; Szmyd, J.S. An attempt to mimimize the temperature gradient along a plug-flow methane/steam reforming reactor by adopting locally controlled heating zones. J. Phys. Conf. Ser. 2014, 530, 012040. [Google Scholar] [CrossRef]
- Mozdzierz, M.; Chalusiak, M.; Kimijima, S.; Szmyd, J.S.; Brus, G. An afterburner-powered methane/steam reformer for a solid oxide fuel cells application. Heat Mass Transf. 2018, 54, 2331–2341. [Google Scholar] [CrossRef]
- Pajak, M.; Mozdzierz, M.; Chalusiak, M.; Kimijima, S.; Szmyd, J.S.; Brus, G. A numerical analysis of heat and mass transfer processes in a macro-patterned methane/steam reforming reactor. Int. J. Hydrogen Energy 2018, 43, 20474–20487. [Google Scholar] [CrossRef]
- Simpson, A.P.; Lutz, A.E. Exergy analysis of hydrogen production via steam methane reforming. Int. J. Hydrogen Energy 2007, 32, 4811–4820. [Google Scholar] [CrossRef]
- Naseri, A.T.; Peppley, B.A.; Pharoah, J.G. A systematic parametric study on the effect of a catalyst coating microstructure on its performance in methane steam reforming. Int. J. Hydrogen Energy 2015, 40, 16086–16095. [Google Scholar] [CrossRef]
- Ali, S.; Al-Marri, M.J.; Abdelmoneim, A.G.; Kumar, A.; Khader, M.M. Catalytic evaluation of nickel nanoparticles in methane steam reforming. Int. J. Hydrogen Energy 2016, 41, 22876–22885. [Google Scholar] [CrossRef]
- Kolaczkowski, S.T.; Awdry, S.; Smith, T.; Thomas, D.; Torkuhl, L.; Kolvenbach, R. Potential for metal foams to act as structured catalyst supports in fixed-bed reactors. Catal. Today 2016, 273, 221–233. [Google Scholar] [CrossRef]
- Cherif, A.; Nebbali, R. Numerical analysis on autothermal steam methane reforming: Effects of catalysts arrangement and metal foam insertion. Int. J. Hydrogen Energy 2019, 44, 22455–22466. [Google Scholar] [CrossRef]
- Palma, V.; Ricca, A.; Martino, M.; Meloni, E. Innovative structured catalytic systems for methane steam reforming intensification. Chem. Eng. Process. Process. Intensif. 2017, 120, 207–215. [Google Scholar] [CrossRef]
- Dubinin, A.M.; Shcheklein, S.E.; Tuponogov, V.G.; Ershov, M.I. Mini CHP based on the electrochemical generator and impeded fluidized bed reactor for methane steam reforming. Int. J. Hydrogen Energy 2018, 43, 13543–13549. [Google Scholar] [CrossRef]
- Cherif, A.; Nebbali, R.; Sen, F.; Sheffield, J.W.; Doner, N.; Nasseri, L. Modeling and simulation of steam methane reforming and methane combustion over continuous and segmented catalyst beds in autothermal reactor. Int. J. Hydrogen Energy 2022, 47, 9127–9138. [Google Scholar] [CrossRef]
- Pajak, M.; Brus, G.; Mozdzierz, M.; Szmyd, J. Steam Reforming Reactor and a Method of Hydrogen Production Using a Steam Reforming Reactor. Patent Application (Poland) P.438133, 11 June 2021. [Google Scholar]
- Cherif, A.; Lee, J.S.; Nebbali, R.; Lee, C.J. Novel design and multi-objective optimization of autothermal steam methane reformer to enhance hydrogen production and thermal matching. Appl. Therm. Eng. 2022, 217, 119140. [Google Scholar] [CrossRef]
- Settar, A.; Nebbali, R.; Madani, B.; Abboudi, S. Numerical investigation on the wall-coated steam methane reformer improvement: Effects of catalyst layer patterns and metal foam insertion. Int. J. Hydrogen Energy 2017, 42, 1490–1498. [Google Scholar] [CrossRef]
- Settar, A.; Abboudi, S.; Lebaal, N. Effect of inert metal foam matrices on hydrogen production intensification of methane steam reforming process in wall-coated reformer. Int. J. Hydrogen Energy 2018, 43, 12386–12397. [Google Scholar] [CrossRef]
- Settar, A.; Mansouri, Z.; Nebbali, R. Impact of Ni-based catalyst patterning on hydrogen production from MSR: External steam reformer modelling. Int. J. Hydrogen Energy 2018, 44, 11346–11354. [Google Scholar] [CrossRef]
- Pajak, M.; Brus, G.; Szmyd, J.S. Catalyst Distribution Optimization Scheme for Effective Green Hydrogen Production from Biogas Reforming. Energies 2021, 14, 5558. [Google Scholar] [CrossRef]
- Pajak, M.; Brus, G.; Szmyd, J.S. Genetic algorithm-based strategy for the steam reformer optimization. Int. J. Hydrogen Energy 2023, 48, 11652–11665. [Google Scholar] [CrossRef]
- Pajak, M.; Buchaniec, S.; Kimijima, S.; Szmyd, J.S.; Brus, G. A multiobjective optimization of a catalyst distribution in a methane/steam reforming reactor using a genetic algorithm. Int. J. Hydrogen Energy 2021, 46, 20183–20197. [Google Scholar] [CrossRef]
- Boomsma, K.; Poulikakos, D.; Zwick, F. Metal foams as compact high performance heat exchangers. Mech. Mater. 2003, 35, 1161–1176. [Google Scholar] [CrossRef]
- Kaw, A.; Kalu, E.K.; Nguyen, D. Numerical Methods with Applications; University of South Florida: Tampa, FL, USA, 2011. [Google Scholar]
- Patankar, S.V. Numerical Heat Transfer and Fluid Flow; Hemisphere: Washington, DC, USA, 1980. [Google Scholar]
- Komatsu, Y.; Kimijima, S.; Szmyd, J.S. A Performance Analysis of a Solid Oxide Fuel Cell-Micro Gas Turbine Hybrid System Using Biogas. ECS Trans. 2009, 25, 1061–1070. [Google Scholar] [CrossRef]
- Brus, G.; Nowak, R.; Szmyd, J.S.; Komatsu, Y.; Kimijima, S. An Experimental and Theoretical Approach for the Carbon Deposition Problem During Steam Reforming of Model Biogas. J. Theor. Appl. Mech. 2015, 53, 273–284. [Google Scholar] [CrossRef]
- Nishino, T.; Szmyd, J.S. Numerical analysis of a cell-based indirect internal reforming tubular SOFC operating with biogas. J. Fuel Cell Sci. Technol. 2010, 7, 0510041–0510048. [Google Scholar] [CrossRef]
- Usman, M.; Wan Daud, W.; Abbas, H.F. Dry reforming of methane: Influence of process parameters—A review. Renew. Sustain. Energy Rev. 2015, 45, 710–744. [Google Scholar] [CrossRef]
- Koncewicz, W.; Moździerz, M.; Brus, G. A fast Gaussian process-based method to evaluate carbon deposition during hydrocarbons reforming. Int. J. Hydrogen Energy 2021, in press. [CrossRef]
- Kaczmarczyk, R. Thermodynamic Analysis of the Effect of Green Hydrogen Addition to a Fuel Mixture on the Steam Methane Reforming Process. Energies 2021, 14, 6564. [Google Scholar] [CrossRef]
- Tomiczek, M.; Kaczmarczyk, R.; Mozdzierz, M.; Brus, G. A numerical analysis of heat and mass transfer during the steam reforming process of ethane. Heat Mass Transf. 2018, 54, 2305–2314. [Google Scholar] [CrossRef]
- Mazhar, A.; Khoja, A.H.; Azad, A.K.; Mushtaq, F.; Naqvi, S.R.; Shakir, S.; Hassan, M.; Liaquat, R.; Anwar, M. Performance Analysis of TiO2-Modified Co/MgAl2O4 Catalyst for Dry Reforming of Methane in a Fixed Bed Reactor for Syngas (H2, CO) Production. Energies 2021, 14, 3347. [Google Scholar] [CrossRef]
- Brus, G.; Komatsu, Y.; Kimijima, S.; Szmyd, J.S. An analysis of biogas reforming process on Ni/YSZ and Ni/SDC catalysts. Int. J. Thermodyn. 2012, 15, 43–51. [Google Scholar]
- Brus, G.; Kimijima, S.; Szmyd, J.S. Experimental and numerical analysis of transport phenomena in an internal indirect fuel reforming type Solid Oxide Fuel Cells using Ni/SDC as a catalyst. J. Phys. Conf. Ser. 2012, 395, 012159. [Google Scholar] [CrossRef]
- Nagata, S.; Momma, A.; Kato, T.; Kasuga, Y. Numerical analysis of output characteristics of tubular SOFC with internal reformer. J. Power Sources 2001, 101, 60–71. [Google Scholar] [CrossRef]
- Ahmed, K.; Föger, K. Approach to equilibrium of the water-gas shift reaction on a Ni/zirconia anode under SOFC conditions. J. Power Sources 2001, 103, 150–153. [Google Scholar] [CrossRef]
- Iwai, H.; Yamamoto, Y.; Saito, M.; Yoshida, H. Numerical simulation of intermediate-temperature direct-internal-reforming planar solid oxide fuel cell. Energy 2011, 36, 2225–2234. [Google Scholar] [CrossRef]
- Sciazko, A.; Komatsu, Y.; Brus, G.; Kimijima, S.; Szmyd, J.S. A novel approach to improve the mathematical modelling of the internal reforming process for solid oxide fuel cells using the orthogonal least squares method. Int. J. Hydrogen Energy 2014, 39, 16372–16389. [Google Scholar] [CrossRef]
- Peng, X.; Jin, Q. Molecular simulation of methane steam reforming reaction for hydrogen production. Int. J. Hydrogen Energy 2022, 47, 7569–7585. [Google Scholar] [CrossRef]
- Brus, G. Experimental and numerical studies on chemically reacting gas flow in the porous structure of a solid oxide fuel cells internal fuel reformer. Int. J. Hydrogen Energy 2012, 37, 17225–17234. [Google Scholar] [CrossRef]
- Sciazko, A.; Komatsu, Y.; Brus, G.; Kimijima, S.; Szmyd, J.S. An Application of Generalized Least Squares Method to an Analysis of Methane/Steam Reforming Process on a Ni/YSZ Catalyst. ECS Trans. 2013, 57, 2987–2996. [Google Scholar] [CrossRef]
- Sciazko, A.; Komatsu, Y.; Brus, G.; Kimijima, S.; Szmyd, J.S. A novel approach to the experimental study on methane/steam reforming kinetics using the Orthogonal Least Squares method. J. Power Sources 2014, 262, 245–254. [Google Scholar] [CrossRef]
- Brus, G.; Miyawaki, K.; Iwai, H.; Saito, M.; Yoshida, H. Tortuosity of an SOFC anode estimated from saturation currents and a mass transport model in comparison with a real micro-structure. Solid State Ionics 2014, 265, 13–21. [Google Scholar] [CrossRef]
- Wolf, M. Thermodynamic assessment of the stability of bulk and nanoparticulate cobalt and nickel during dry and steam reforming of methane. RSC Adv. 2021, 11, 18187–18197. [Google Scholar] [CrossRef]
- Xu, J.; Froment, G.F. Methane steam reforming: II. Diffusional limitations and reactor simulation. AIChE J. 1989, 35, 97–103. [Google Scholar] [CrossRef]
- Carbonell, R.G.; Whitaker, S. Heat and Mass Transfer in Porous Media. In Fundamentals of Transport Phenomena in Porous Media; Bear, J., Corapcioglu, M.Y., Eds.; Springer: Dordrecht, The Netherlands, 1984. [Google Scholar]
- Nishino, T.; Komori, H.; Iwai, H.; Suzuki, K. Development of a comprehensive numerical model for analyzing a tubular-type indirect internal reforming SOFC. In Proceedings of the 1st International Fuel Cell Science, Engineering and Technology Conference Rochester, New York, NY, USA, 21–23 April 2003; pp. 521–528. [Google Scholar]
- Nishino, T.; Iwai, H.; Suzuki, K. Comprehensive Numerical Modeling and Analysis of a Cell-Based Indirect Internal Reforming Tubular SOFC. J. Fuel Cell Sci. Technol. 2006, 3, 33–44. [Google Scholar] [CrossRef]
- Tan, W.C.; Iwai, H.; Kishimoto, M.; Brus, G.; Szmyd, J.S.; Yoshida, H. Numerical analysis on effect of aspect ratio of planar solid oxide fuel cell fueled with decomposed ammonia. J. Power Sources 2018, 384, 367–378. [Google Scholar] [CrossRef]
- Suzuki, K.; Iwai, H.; Nishino, T. Electrochemical and thermo-fluid modeling of a tubular solid oxide fuel cell with accompaning indirect internal fuel reforming. In Transport Phenomena in Fuel Cells; Sunden, B., Faghri, M., Eds.; WIT Press: Southampton, UK, 2005; pp. 83–131. [Google Scholar]
- Poling, B.E.; Prausnitz, J.M.; O’Connell, J.P. The Properties of Gases and Liquids; McGraw-Hill: New York, NY, USA, 2001. [Google Scholar] [CrossRef]
- Yang, X.; Lu, T.J.; Kim, T. An analytical model for permeability of isotropic porous media. Phys. Lett. A Sect. Gen. At. Solid State Phys. 2014, 378, 2308–2311. [Google Scholar] [CrossRef]
- Bhattacharya, A.; Calmidi, V.V.; Mahajan, R.L. Thermophysical properties of high porosity metal foams. Int. J. Heat Mass Transf. 2002, 45, 1017–1031. [Google Scholar] [CrossRef]
- Boomsma, K.; Poulikakos, D. On the effective thermal conductivity of a three- dimensionally structured fluid-saturated metal foam. Heat Mass Transf. 2001, 44, 827–836. [Google Scholar] [CrossRef]
- Dai, Z.; Nawaz, K.; Park, Y.G.; Bock, J.; Jacobi, A.M. Correcting and extending the Boomsma-Poulikakos effective thermal conductivity model for three-dimensional, fluid-saturated metal foams. Int. Commun. Heat Mass Transf. 2010, 37, 575–580. [Google Scholar] [CrossRef]
- Moukalled, F.; Mangani, L.; Darwish, M. The Finite Volume Method; Springer International Publishing: Cham, Switzerland, 2016; pp. 103–135. [Google Scholar]
- Chalusiak, M.; Wrobel, M.; Mozdzierz, M.; Berent, K.; Szmyd, J.; Kimijima, S.; Brus, G. A numerical analysis of unsteady transport phenomena in a Direct Internal Reforming Solid Oxide Fuel Cell. Int. J. Heat Mass Transf. 2019, 131, 1032–1051. [Google Scholar] [CrossRef]
- Zhao, C.Y. Review on thermal transport in high porosity cellular metal foams with open cells. Int. J. Heat Mass Transf. 2012, 55, 3618–3632. [Google Scholar] [CrossRef]
- Kawashima, T.; Hishinuma, M. Thermal properties of porous Ni/YSZ composites at high temperatures. Mater. Trans. JIM 1996, 37, 1518–1524. [Google Scholar] [CrossRef]
- Peet, M.J.; Hasan, H.S.; Bhadeshia, H.K.D.H. Prediction of thermal conductivity of steel. Int. J. Heat Mass Transf. 2011, 54, 2602–2608. [Google Scholar] [CrossRef]
- Bartholomew, C.H. Carbon Deposition in Steam Reforming and Methanation. Catal. Rev. 1982, 24, 67–112. [Google Scholar] [CrossRef]
- Lakhapatri, S.L.; Abraham, M.A. Deactivation due to sulfur poisoning and carbon deposition on Rh-Ni/Al2O3 catalyst during steam reforming of sulfur-doped n-hexadecane. Appl. Catal. A Gen. 2009, 364, 113–121. [Google Scholar] [CrossRef]
- Goldberg, D.E. Genetic Algorithms in Search Optimization & Machine Learning; Addison-Wesley Longman Publishing Co., Inc.: Boston, MA, USA, 1989. [Google Scholar]
- Tai, X.Y.; Ocone, R.; Christie, S.D.; Xuan, J. Multi-objective optimisation with hybrid machine learning strategy for complex catalytic processes. Energy AI 2022, 7, 100134. [Google Scholar] [CrossRef]
- Maciol, P.; Gawad, J.; Podorska, D. Arrangement of flow modification devices in continuous casting tundish based on multicriterion optimization. Arch. Metall. Mater. 2007, 52, 105–112. [Google Scholar]
- Agharezaei, P.; Sahu, T.; Shock, J.; O’Brien, P.G.; Ghuman, K.K. Designing catalysts via evolutionary-based optimization techniques. Comput. Mater. Sci. 2023, 216, 111833. [Google Scholar] [CrossRef]
- Raja, B.D.; Patel, V.; Jhala, R.L. Thermal design and optimization of fin-and-tube heat exchanger using heat transfer search algorithm. Therm. Sci. Eng. Prog. 2017, 4, 45–57. [Google Scholar] [CrossRef]
- Mozdzierz, M.; Brus, G.; Sciazko, A.; Komatsu, Y.; Kimijima, S.; Szmyd, J.S. Towards a Thermal Optimization of a Methane/Steam Reforming Reactor. Flow Turbul. Combust. 2016, 97, 171–189. [Google Scholar] [CrossRef]


| Species | Mass Generation MSR | Mass Generation WGS | Mass Generation DRY | Summarized Generation |
|---|---|---|---|---|
+ | ||||
| CO | + | |||
| 0 | ||||
| 0 | ||||
| 0 |
| Radius | Equal Width (cm) | Equal Surface (cm) |
|---|---|---|
| r | 1 | |
| r | 2 | |
| r | 3 | |
| r | 4 | |
| r | 5 | 5 |
| Case | L (m) | Conv. | T Fit. | ||||
|---|---|---|---|---|---|---|---|
| REF | 0.3 | 0.831 | 0.273 | 0.384 | 1.00 | 0.384 | 0.00 |
| Strategy I | 0.3 | 0.507 | 0.874 | 0.186 | 0.39 | 0.477 | 0.61 |
| Strategy II | 0.3 | 0.618 | 0.677 | 0.280 | 0.44 | 0.636 | 0.56 |
| Case | L (m) | Conv. | T Fit. | ||||
|---|---|---|---|---|---|---|---|
| REF | 0.30 | 0.831 | 0.273 | 0.384 | 1.00 | 0.384 | 0.00 |
| Strategy I | 0.49 | 0.812 | 0.874 | 0.241 | 0.64 | 0.377 | 0.36 |
| Strategy II | 0.40 | 0.810 | 0.677 | 0.321 | 0.59 | 0.544 | 0.41 |
Disclaimer/Publisher’s Note: The statements, opinions and data contained in all publications are solely those of the individual author(s) and contributor(s) and not of MDPI and/or the editor(s). MDPI and/or the editor(s) disclaim responsibility for any injury to people or property resulting from any ideas, methods, instructions or products referred to in the content. |
© 2023 by the authors. Licensee MDPI, Basel, Switzerland. This article is an open access article distributed under the terms and conditions of the Creative Commons Attribution (CC BY) license (https://creativecommons.org/licenses/by/4.0/).
Share and Cite
Pajak, M.; Brus, G.; Kimijima, S.; Szmyd, J.S. Enhancing Hydrogen Production from Biogas through Catalyst Rearrangements. Energies 2023, 16, 4058. https://doi.org/10.3390/en16104058
Pajak M, Brus G, Kimijima S, Szmyd JS. Enhancing Hydrogen Production from Biogas through Catalyst Rearrangements. Energies. 2023; 16(10):4058. https://doi.org/10.3390/en16104058
Chicago/Turabian StylePajak, Marcin, Grzegorz Brus, Shinji Kimijima, and Janusz S. Szmyd. 2023. "Enhancing Hydrogen Production from Biogas through Catalyst Rearrangements" Energies 16, no. 10: 4058. https://doi.org/10.3390/en16104058