1. Introduction
Optimizing a company’s capital structure is a critical aspect in financial management; it can significantly influence the firm’s overall financial performance and risks to which it will be exposed [
1]. A well-balanced capital structure can help the business to reduce its cost of capital, maintain financial flexibility, and achieve sustainable growth [
2]. Nowadays, optimizing the capital structure to balance cost of capital and risk is one of the most important challenges faced by companies [
3].
According to the latest statistics in the sector of gas and oil, the consumption of gas will increase to 4280.7 million tons in 2030. On the other side, the consumption of oil will also increase to 4645 million tons in 2030 [
4]. This information makes the topic of this study actual and provides authors with more researches about the oil and gas sector.
The nature of companies that work in the sector of gas and oil is different and pushes these companies to follow some procedures to protect themselves [
5]. For example, the prices of oil and gas change drastically and have not been not stable, especially in the last three or four years. This is because of the political conditions and the effect of COVID-19 on all countries as well as all gas and oil companies around the world [
6].
Reducing the costs that the companies in the sector of gas and oil will encounter when they operate and practice their activities will be the only escape from the fluctuation in oil and gas prices and other risks to which these companies will be exposed.
This study enhances the concept of capital structure optimization by introducing a practical and precise approach that considers the variables of cost of equity, cost of debts, and the ratio of debt and equity in capital structure [
7,
8]. The object of this study will be the capital structure of the Qatar Gas Transport Company and how to optimize it. The subject will be the financial relationships that appear from applying Monte Carlo simulation using a programming language (Python) to obtain the optimal capital structure in the Qatar Gas Transport Company.
Many theories have discussed the topic of capital structure and its optimization according to its importance in solving different problems in a company. Exposing the company to bankruptcy, financial performance, dividends, and retained earnings policies are all aspects that will be affected by the capital structure and its components.
The development of other theories and research in the optimization of capital structure is important, but not sufficient to overcome all of the disadvantages in this domain, thus this research tries to improve the method of optimization of capital structure, as well as to reduce the gap to obtain more optimal results.
The suggested method in this research will use Monte Carlo simulation to model various scenarios and determine the scenario that can reduce the cost of capital to the greatest extent in the Qatar Gas Transport Company. However, identifying the optimal capital structure is not a straightforward task, as it depends on various factors, such as industry characteristics, firm-specific factors, and macroeconomic conditions [
9,
10].
This paper will contribute to enriching the academic and professional publications on capital structure optimization and offer practical guidance for managers and investors aiming to enhance their companies’ financial performance. The proposed method is anticipated to positively impact firms’ financial performance and pave the way for further research in this area.
This study can be divided to different stages. The first stage contains the introduction, followed by the literature reviews and clarification on the participation of other authors on the topic of study. The following stage introduces the method that will be used in this research and the collection of the required data. The results of applying the method of Black and Scholes and the discussion on the results are presented, and then the final stage provides the conclusion with an appendix.
2. The Concept of Optimizing Capital Structure in the Literature and Regulations
The concept of optimizing capital structure has been a subject of interest for both academics and practitioners for many years. Over time, various methodologies have been developed to help determine the optimal mix of debt and equity in a company [
11,
12]. In recent years, Monte Carlo simulation has emerged as a promising tool for this purpose [
13].
This research relies on a variety of academic and professional sources in the fields of finance, such as risk management and optimal financing. The sources used in this study are diversified and include academic articles, textbooks, and professional publications. It is also important to mention that this study depends on the publications of the most important researchers in the field of finance and statistics, such as Eugene Fama [
14] and Franco Modigliani [
15].
In their study, “Optimal Capital Structure under Corporate and Personal Taxation”, Modigliani and Miller (1963) represented the starting point for understanding the concept of optimizing capital structure [
16]. They introduced the trade-off theory of capital structure, which argues that companies seek an optimal balance between the benefits of debt (tax shields) and the costs of debt (financial distress). Although the work was later used as the main reference for all researchers in determining capital structure, it was introduced before the widespread use of Monte Carlo simulation and new applications for modelling the optimal solution [
17,
18].
Jesus Cuauhtemoc Tellez Gaytan, Karamath Ateeq 2022 developed the cornerstone to predict the ratios of capital structure through input variables such as financial ratios and algorithm error metrics applied in ANN, SVR, and LR models. The authors plan to extend this work to evaluate and predict the capital structure in future research work with individual applications of profitability, liquidity, solvency, and turnover ratios [
19]. This study can help the authors in the previous research to use the programming language Python to program some functions and predict the optimal capital structure.
Hyunseob Kim 2020 discussed how the size of the labor market will affect the formulation of the capital structure. The size of the labor market can be considered as a factor in determining the capital structure, but it will not be sufficient to make the decision on the optimal capital structure [
20].
A more recent study under the name “Capital structure: The case of firms issuing debt” by Yushu Zhu (2012) investigated the relationship between financial leverage and firm characteristics in a cross-sectional setting and a panel setting [
21]. Monte-Carlo-simulation-based inference results confirm the spurious ratio problem, which arises in a cross-sectional multiple regression model sharing common divisors [
22,
23]. To avoid the spurious ratio problem, this study adopted variables in changes instead of ratios in two panel models: a first-differenced fixed-effects panel model and a dynamic generalized method of moments panel model [
24]. The results of the model explained the most convenient level of debt after controlling for endogeneity, and there was no significant association between debt and firm characteristics. This study provided evidence about the importance of endogeneity in financial leverage decisions.
Liu et al. (2020) proposed a Monte Carlo optimization model for dynamic capital structure adjustment in Chinese public–private partnerships under uncertainty of revenue [
25]. The model introduced a comparison analysis of dynamic capital structures in a specific project with different scenarios in three adopted strategies in capital structure. Through the simulation results, the authors demonstrated the effectiveness of government subsidies in enhancing project financial viability and sustainability compared with capital market financing and debt financing. This model filled the gap in dealing with changes through dynamic capital structures in PPP projects, providing a policy to improve the survival of PPPs during project operation under revenue uncertainty.
Chang and Dasgupta (2011) proposed the use of Monte Carlo simulations to evaluate the appropriateness of inferences and empirical methodology in capital structure research when the data generation process is not standard [
26,
27]. The authors argued that the evolution of the debt ratio under various types of managerial behavior can generate non-standard leverage processes, which create challenges for statistical inference in empirical capital structure research. Through several examples, they illustrated the benefits of Monte Carlo simulations in evaluating the appropriateness of inferences and empirical methodology in such cases.
The problem of optimizing capital structure was discussed from the macroeconomic point of view by Elmina Homapour 2022 and Larry Su et al., who mentioned that, after the financial crises in 2008, the determination of capital structure will consider different macroeconomic variables such as IPGrate, TAXGrate, ComPaperSp, RiskP, M3Grate, and FTSE100Re. The research was relevant and helped the authors to determine which factors will have a greater effect on capital structure, but did not exactly calculate the cost of capital according to these assumptions. Beside the macroeconomic factors, there are also internal variables can affect and determine the capital structure in companies [
28].
A recent study by Senova et al. (2023) proposed a novel approach for assessing the risk of a project using the Monte Carlo method and the Crystal Ball software tool [
29]. The study mentioned the challenges faced by companies in making effective investment decisions under market turbulence and increasing inflation, which can negatively affect managerial decisions. The authors showed that their methodology can support effective investment decision-making based on assessing the level of risk. The study used two types of projects to demonstrate the methodology, and sensitivity analysis and simulations were performed using the Crystal Ball software tool. The output of the study includes the creation of tornado graphs that display risk factors based on their degree of influence on the criterion value.
Taking into consideration the survey carried out by Graham, J (2021) at Duke university, the results showed that managers do not have the required knowledge to optimize the capital structure. These results give the current study more importance because it specifies one method to determine the optimal capital structure [
30].
The application of Monte Carlo simulation in the context of capital structure optimization offers a robust and flexible approach to address the complex trade-off and determine the optimal mix of debt and equity in capital structure [
31].
Other research works investigating the adjustment of capital structures carried out by companies to reduce costs were discussed by Y. Ramakrishna and H. Alzoubi 2022; K. Lee, et al. 2022; B Espen Eckbo, Michael Kisser, 2021; and Bolton, P., 2020 [
32,
33,
34,
35].
The approach used in this study to optimize the capital structure using the programming language Python is a significant and notable contribution to the scientific community. The use of the programming language Python provides access to a vast array of tools and packages, which enhance the efficiency and effectiveness of analysis. This, in turn, makes the process more accessible and applicable to a wider range of researchers and practitioners who may be familiar with Python as a programming language [
36].
This approach allows us to consider a more extensive range of variables and factors, which are critical in modeling capital structure optimization.
Furthermore, the methodology used in this research can potentially lead to more accurate decisions and results about capital structure, which can be applied widely by businesses and investors. This is particularly relevant in today’s dynamic and complex economic environment, where the need to make financial decisions is essential for long-term success. Moreover, this approach incorporates industry-specific considerations for a liquefied natural gas (LNG) company, such as Qatar Gas Transport Company Limited [
37]. By tailoring the analysis to the unique characteristics and risks associated with LNG companies, we can provide more targeted insights and recommendations for capital structure optimization in this specific context.
In conclusion, a Python-based Monte Carlo optimization method for capital structure represents a significant advancement in the field of optimization of capital structure, by offering a tailored, efficient, and innovative approach for the decision-making process. By building upon the foundational work of previous researchers and incorporating industry-specific factors and machine learning techniques, this method holds great promise for both the scientific community and practitioners in the field of finance.
3. Data and Methods
In this research, the goal is optimizing a firm’s capital structure by applying the Monte Carlo method using the programming language Python. To achieve this goal, the financial data will be transferred from a chosen company and various scenarios involving debt and equity financing will be simulated.
Qatar Gas Transport Company was established in 2004 and has the largest fleet worldwide that ships liquid natural gas, with the number of carries equal to 69; these carries are responsible for the transfer of the gas from Qatar to all countries around the world and perform one of the most important roles of transportation link in the Qatar liquid natural gas supply chain.
The data for this study will be sourced from the firm’s financial statements, which contain the required information about revenue, expenses, assets, liabilities, and equity. Qatar Gas Transport Company was selected as the subject for this study. Qatar Gas is a publicly listed company operating in the maritime transportation industry; it specializes in transporting liquefied natural gas (LNG). The company’s financial performance will be analyzed from 2019 to 2022 [
38,
39].
The method that will be used in this study involves choosing 10,000 different components of equity and debts in the selected company. With the help of a programming language (Python), all of the components will be examined to decide if they reduce the cost of capital. Every result will be compared to the previous one through specific instructions in the programming language Python.
It is worth looking at the historical values of a company’s various financial indicators.
Table 1 shows the historical data including the mean and standard deviation.
The following is clear from
Table 1:
- -
The firm experienced a significant increase in total capitalization from 2020 to 2022;
- -
Equity steadily increased over the four-year period, indicating shareholder value creation;
- -
The interest expense remained relatively stable over the four-year period, indicating that the firm may have a manageable debt load;
- -
The firm’s share of equity increased steadily over the four-year period, indicating that the firm may be shifting towards a more equity-heavy capital structure [
40].
Negative factors for the firm:
- -
The share of debt remained high, indicating a relatively high level of leverage and financial risk;
- -
The risk-free rate experienced fluctuations over the four-year period, indicating potential macroeconomic volatility that could impact the firm’s cost of capital;
- -
The significant drop in debt from 2020 to 2021 may indicate that the firm is actively paying down debt, which could impact cash flow and restrict growth opportunities.
To apply the Monte Carlo simulation, the Python programming language and its libraries for data analysis and simulation will be utilized. Monte Carlo simulation is a statistical technique that employs random sampling to simulate diverse outcomes and estimate the likelihood of each outcome. In this study, various scenarios of debt and equity will be modelled to identify the ideal capital structure for the selected company.
The Monte Carlo simulation will be carried out in the following stages (data preprocessing: the financial data of the selected company will be filtered and reprocessed to ensure the accuracy and consistency):
Simulation of scenarios: different scenarios of debt and equity will be modeled to identify the optimal capital structure for the firm. In each scenario, the levels of financing debt and equity will vary and simulate the company’s financial performance under those circumstances;
Analysis of simulation results: the simulation outcomes will be analyzed to pinpoint the scenario that maximizes the company’s value. To evaluate the different scenarios, profitability, cash flows, and other financial metrics will be taken into consideration;
Sensitivity analysis: a sensitivity analysis will be conducted to evaluate the robustness of the simulation results. The assumptions will vary and parameters will be used in the simulation to determine the impact on the optimal capital structure.
The simulation will be based on the following assumptions:
- -
The company’s revenue and expenses will grow at a constant rate over the simulation period [
41,
42].
Revenue (
) and expenses (
) can be calculated as follows:
: initial revenue;
: the initial and expenses;
: the growth rate;
: the number of periods.
- -
The interest rates for debt financing will remain constant over the simulation period;
- -
The company’s tax rate will remain constant over the simulation period;
- -
The company’s cost of equity and cost of debt will be estimated using the weighted average cost of capital (WACC) method. They can be found using the following Formulas (3)–(5):
where ke is cost of equity,
is the risk-free rate,
is the company’s beta, and
is the equity risk premium. In this study, the equity risk premium (ERP) will be used instead of the market risk premium in the calculations because it is more accurate in capturing the risk associated with a specific company’s stock.
The equity risk premium reflects the additional return that investors require to hold a particular company’s stock beside the risk-free asset. This makes the ERP a more tailored measure for a company’s specific risk profile, as it is used for the company’s unique characteristics and potential risks [
43].
In the code that should be prepared to apply this process, the required components to calculate the cost of equity will be inserted as follows:
params = {‘interest_expense’: (1139, 53), ‘total_capitalization’: (28,971, 1024),
‘income_before_tax’: (1439, 176), ‘risk_free_rate’: (0.0422, 0.011),
‘beta’: (0.41, 0.05), ‘equity_risk_premium’: (0.067, 0.009),
‘total_equity’: (11,255, 2025), ‘total_debt’: (20,942, 2178)}
iterations = 10,000
More details about the code and its instructions will be explained in
Appendix A.
where kd is cost of debt,
is interest expense, and
is debt.
where WACC is the weighted average cost of capital,
is the market value of equity,
is the market value of debt,
is the total value of the company
, ke is the cost of equity, kd is the cost of debt, and
is the corporate tax rate.
The simulation outcomes will be used to identify the scenario that maximizes the company’s value and minimizes its WACC. Additionally, we will evaluate the sensitivity of the simulation results to changes in the assumptions and parameters used in the simulation. This approach will allow to obtain more results about the potential risk and associated return with various scenarios.
The Monte Carlo simulation is a computational process that uses a significant number of simulations to accurately estimate the probabilities of different outcomes. To carry out the simulation, we will utilize the Python programming language and its libraries for data analysis and simulation, such as NumPy and Pandas.
The simulation entails creating a probability distribution for each input parameter, including revenue, expenses, interest rates, and tax rates. Then, a range of possible outcomes for each parameter will be produced.
These outcomes will be combined to simulate the company’s financial performance under each scenario involving the debt and equity combination in capital structure.
In conclusion, the simulation results can be used in the Qatar Gas Transport Company to make well-informed decisions regarding their financing strategies. By simulating numerous outcomes, the method can offer a more accurate estimation of the potential risk and return of an investment.
4. Results
Simulation Outcomes
The WACC in 30 December 2022 can be calculated with the help of
Table 1, and it will equal 6%. The cost of equity and cost of debt can be calculated in the same way, equaling 5.8% and 4.2%, respectively.
After analyzing the financial data and calculating the WACC in 2022, the Monte Carlo method can be applied to identify the optimal capital structure for Qatar Gas Transport Company Limited (Nakilat). A total of 10,000 scenarios will be generated, simulating different combinations of debt and equity financing, to evaluate their impact on the company’s financial performance.
Table 2 below summarizes the distribution of outcomes for key financial metrics such as enterprise value (EV) and weighted average cost of capital (WACC) under the simulated financing scenarios.
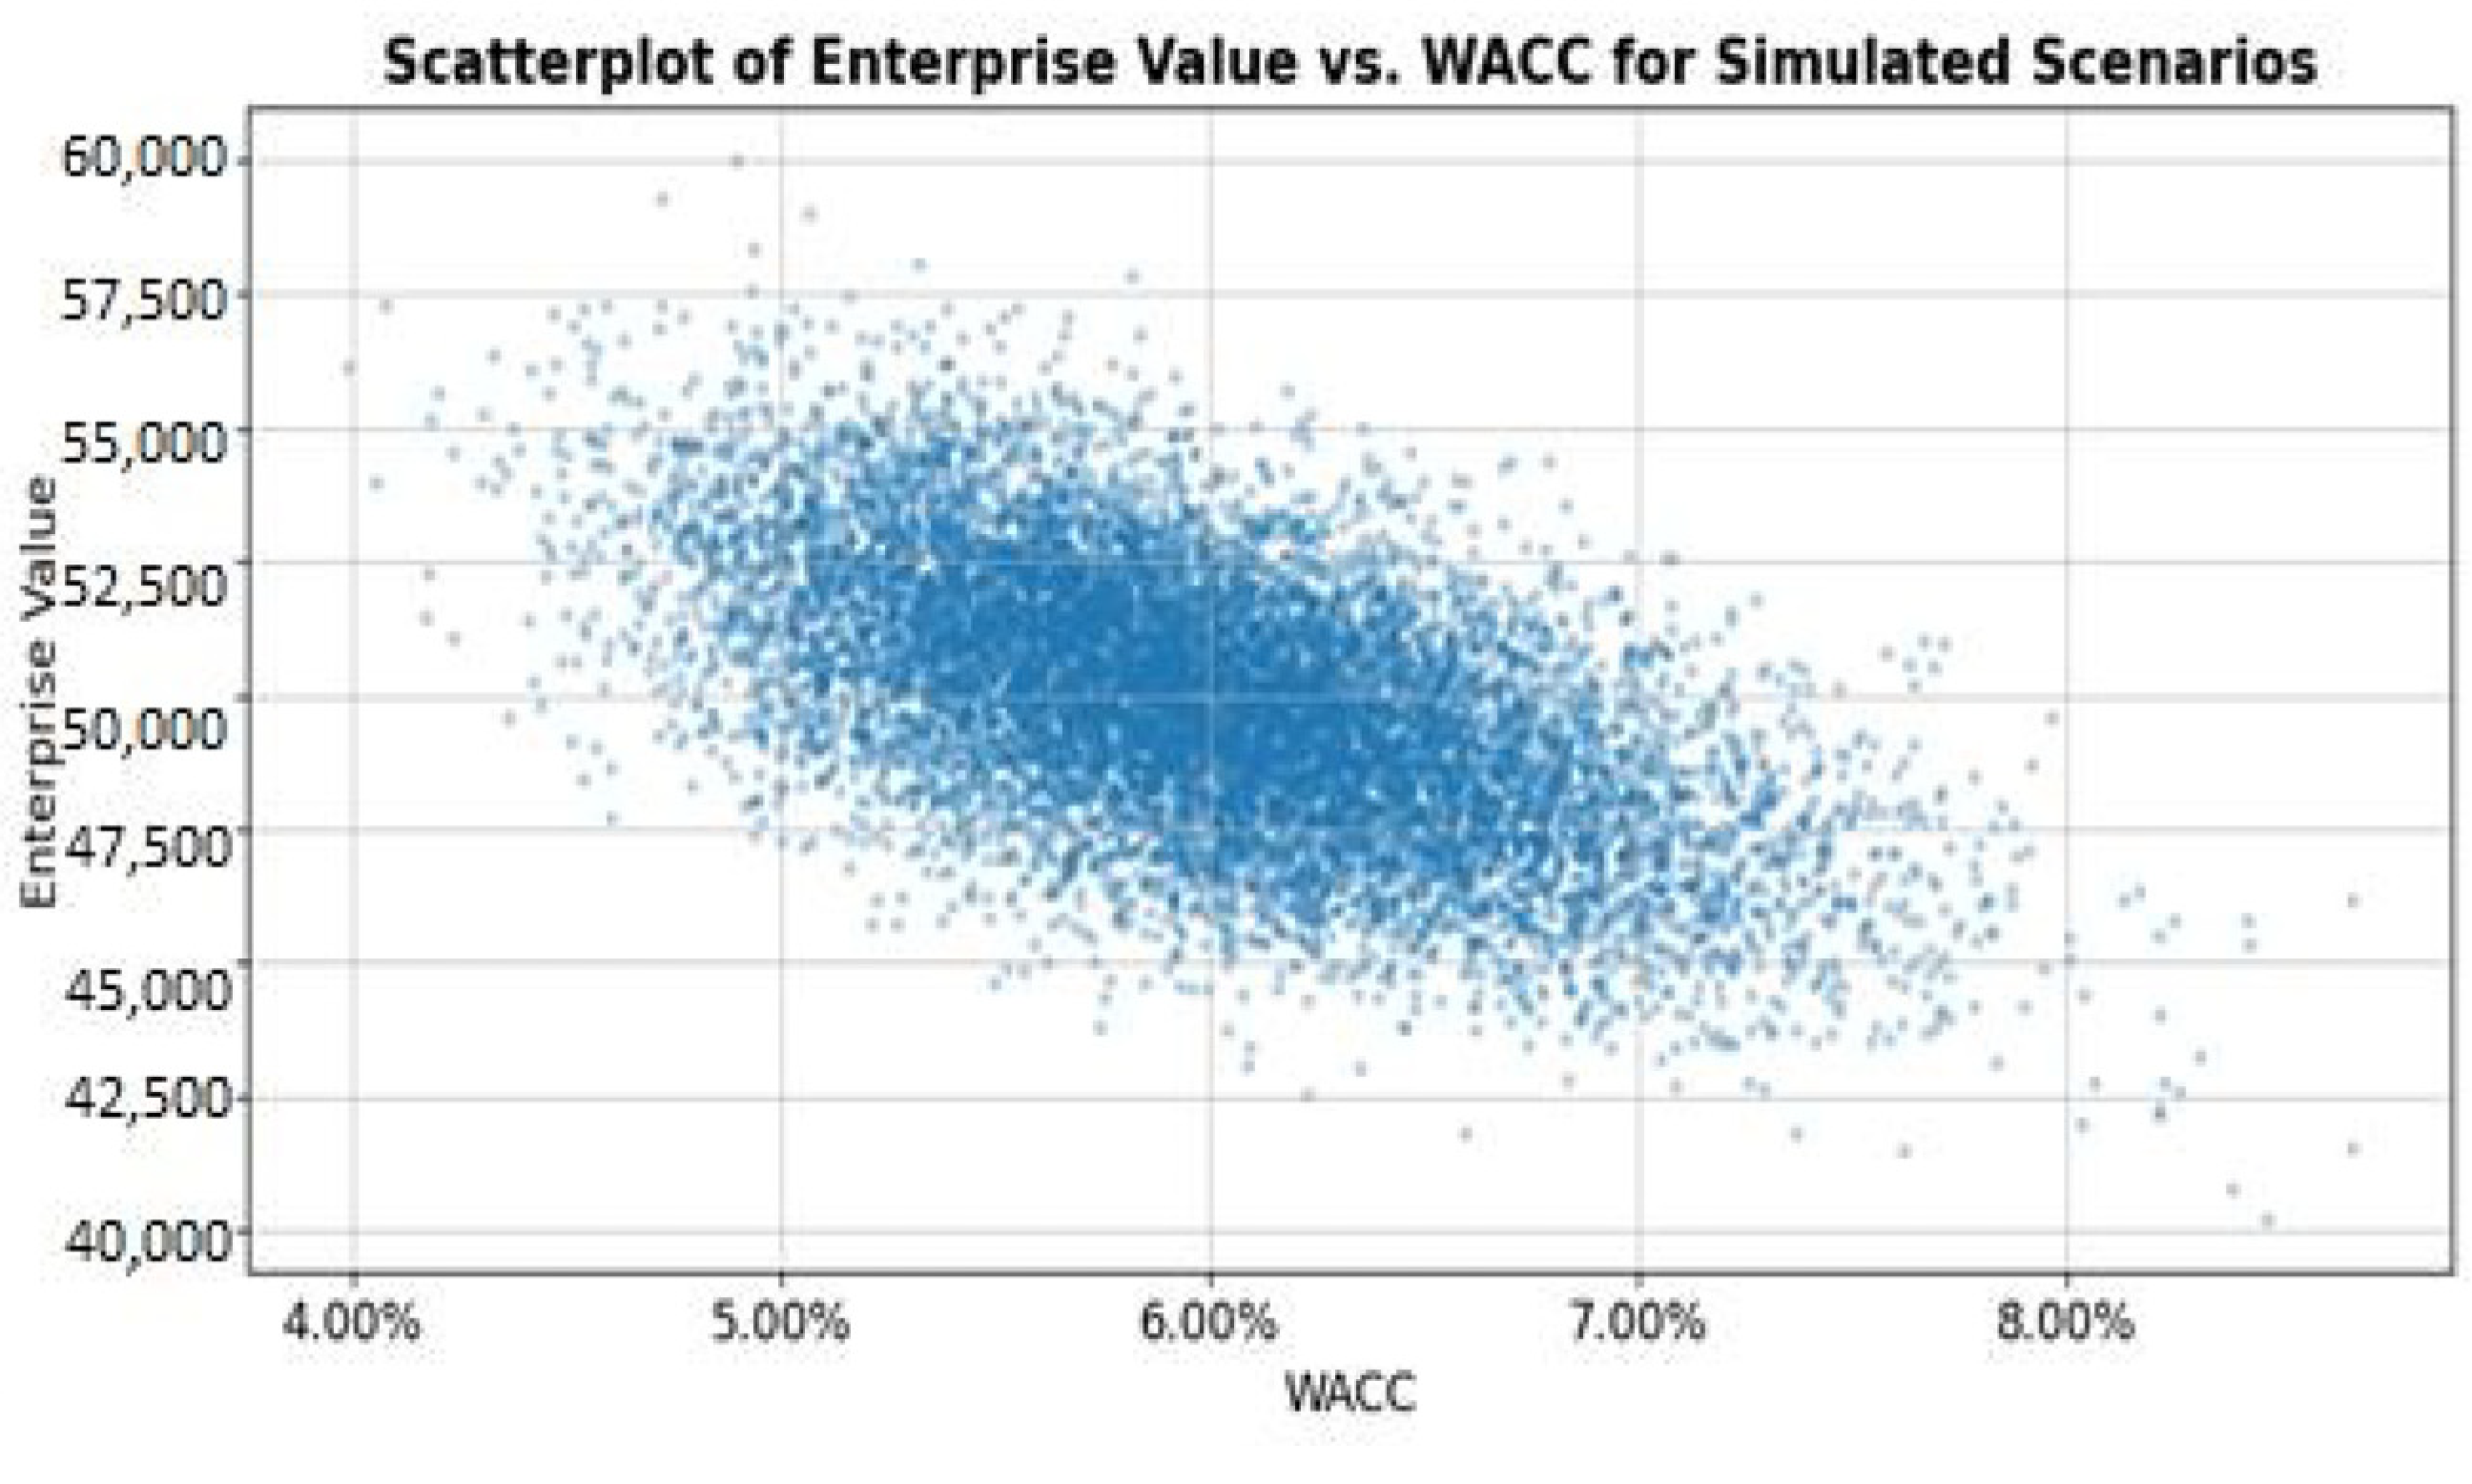
Figure 1 presents a scatterplot of the company’s value against the weighted average cost of capital for each simulated scenario, illustrating the trade-off between company value and cost of financing.
Analysis showed that the optimal capital structure scenario, which maximizes the company’s value and minimizes its WACC, is characterized by a median debt-to-equity ratio of 2.32.
In conclusion, the results of the Monte Carlo simulation indicate that the optimal capital structure for the Qatar Gas Transport Company involves a share of debt of 69%, which maximizes the company’s value up at 55,000 KK QAR and minimizes the weighted average cost of capital at a median level of 5% (
Figure 2) (current 6%).
The scatterplot reflects that the lowest repeated values of weighted average cost of capital were located around the value of 5%. This fact can enable us to conclude that the minimum value of WACC is 5%, even though there are lower values of WACC than 5%, but at a lower frequency than that of values of 5% (
Figure 1).
The cost of equity and cost of debt for those scenarios have average values of 5.8% and 4.2%, respectively (previously 7.1% and 5.4%, respectively). This optimal scenario is expected to enhance the company’s financial performance and align with its strategic objectives and risk appetite.
The results of the sensitivity analysis were used to assess the robustness of our optimal capital structure recommendation and to understand the impact of changes in the underlying assumptions and input parameters on the company’s value and weighted average cost of capital (WACC).
Table 3 below summarizes the impact of varying key input parameters, such as the equity risk premium, beta, risk-free rate, interest expense, and total debt.
Table 3.
Sensitivity analysis results.
Table 3.
Sensitivity analysis results.
| |
Parameter
|
Low Value
|
Optimal Value
|
High Value
|
Impact on EV
|
Impact on WACC
|
|---|
| 0 | Interest Expense | 1052.73 | 1139 | 1225.25 | 0 | 0.54% |
| 1 | Total Capitalization | 27,302.9 | 28,971 | 30,653.7 | 3350.73 | 0.00% |
| 2 | Income Before Tax | 1155.33 | 1439 | 1729.62 | 0 | 0.00% |
| 3 | Risk-Free Rate | 2.4% | 4.2% | 6.1% | 0.0% | 1.26% |
| 4 | Beta | 32.8% | 41.0% | 49.2% | 0.0% | 0.38% |
| 5 | ERP | 5.2% | 6.7% | 8.2% | 0.0% | 0.43% |
| 6 | Total Equity | 7922.01 | 11,255 | 14,600.7 | 0 | 0.20% |
| 7 | Total Debt | 17,360.7 | 20,942 | 24,602 | 7241.25 | −1.36% |
The WACC value at the 95th percentile for the given parameter
The WACC value at the 5th percentile for the given parameter
The enterprise value at the 95th percentile for the given parameter
The enterprise value at the 5th percentile for the given parameter
): Number of iterations in the exact percentile
The code calculates the 5th and 95th percentiles for each parameter using np.percentile (values, 5) and np.percentile (values, 95), respectively. The impacts on WACC and EV are then calculated using the difference between these percentiles.
This approach allows to quantify the sensitivity of the WACC and EV to changes in the parameters at the 5th and 95th percentiles, giving a better understanding of how these financial metrics are affected by the variations in the underlying parameters.
Sensitivity analysis suggests that the risk-free rate and total debt have the highest impact on WACC, with a 1.26% and −1.36% impact, respectively, while the impact of the other parameters is relatively smaller.
On the other hand, the total capitalization has the highest impact on EV, with an impact of 3350, followed by total debt, which has an impact of 7241.
The other parameters have a negligible impact on EV. All details and programming in the code to optimize capital structure are shown in
Appendix A.
Figure 3,
Figure 4 and
Figure 5 illustrate the impact of varying the share of debt and share of equity on the company’s WACC, demonstrating the sensitivity of the optimal capital structure scenario to changes in these parameters. Moreover, they illustrate the inverse relationship between the company’s debt level and WACC.
The implications of the sensitivity analysis for the robustness and reliability of optimal capital structure recommendation are as follows.
The optimal capital structure scenario may be sensitive to changes in the underlying assumptions and input parameters. Therefore, decision-makers should monitor and adjust these parameters to ensure that the optimal capital structure remains valid and aligned with the company’s objectives.
The company should be ready to adapt its financing strategy in response to changes in the most significant factors, such as interest rates and the equity risk premium, to maintain its optimal capital structure and minimize the cost of financing [
43].
The sensitivity analysis highlights the importance of scenario planning and risk management in capital structure optimization. By considering a wide range of potential outcomes and their associated risks, the company can make more informed decisions about its financing strategy and better manage its exposure to external risks.
The sensitivity analysis provides valuable insights into the potential impact of changes in key input parameters on the optimal capital structure for Qatar Gas Transport Company Limited (Nakilat). By understanding the sensitivity of the optimal capital structure to these parameters, the company can make more robust and well-informed financing decisions, ensuring that its capital structure remains optimal and aligned with its strategic objectives and risk appetite.
The validity of results depends on the values of WACC for every component of debt and equity in the capital structure. Looking at the other 9999 components of debt and equity, the value of WACC will be higher than 5%. This will ensure us that the results obtained in our analyses are correct.
5. Discussion
The sensitivity analysis results show the impact of changing key input parameters on the company’s enterprise value (EV) and weighted average cost of capital (WACC). This analysis helps to assess the robustness of the optimal capital structure recommendation and provides insights into the potential effects of changes in the underlying assumptions and input parameters.
The sensitivity analysis suggests that the risk-free rate and total debt have the most significant impact on WACC, while total capitalization has the highest impact on EV. The other parameters have a relatively smaller effect on the company’s financial metrics. This information is crucial for the company and its management, as it shows the need to monitor and adjust these parameters to maintain the optimal capital structure and minimize all of the costs related to the capital sources.
Figure 3 and
Figure 4 further illustrated the sensitivity of the optimal capital structure scenarios to changes in the share of debt and share of equity. These visualizations emphasize the importance of scenario planning and risk management in capital structure optimization. From those figures, we can see that, the lower the WACC, the higher the EV and the share of debt.
The key implications of the sensitivity analysis for the robustness and reliability of the optimal capital structure recommendation are as follows.
Decision-makers should continuously monitor and adjust the underlying assumptions and input parameters to ensure that the optimal capital structure remains valid and aligned with the company’s objectives.
The company should be ready to adapt its financing strategy in response to changes in significant factors, such as interest rates and the equity risk premium, to achieve the optimal capital structure and minimize the cost of financing.
Scenario planning and risk management are essential components of capital structure optimization. By considering a wide range of potential outcomes and associated risks, the company can make more informed decisions about its financing strategy and better manage its exposure to external risks.
More discussion can be added to see the results that can be obtained by applying different methods using the programming language Python to calculate the components of weighted average cost of capital. This will help to determine the optimal capital structure in the case of an absence of the required data in one method. For example, to calculate the cost of equity, instead of applying the capital asset pricing model, the dividends growth model can be applied if the dividends, market price of company, and growth rate of dividends are available. Moreover, in the same equation, the market price of a company can be calculated according to different theories such as the earning yields theory, asset valuation theory, Black and Scholes theory, and the value of operation.
6. Conclusions
In this research, it can be concluded that, under the optimal capital structure scenario, which is identified through Monte Carlo simulation and sensitivity analysis, financing the company with a higher share of debt leads to a lower weighted average cost of capital (WACC). This observation can be clearly visualized in
Figure 5, which illustrates the inverse relationship between the company’s debt level and WACC.
This phenomenon can be explained by the Modigliani–Miller (M&M) theorem, a cornerstone of modern corporate finance theory. According to the M&M theorem, under certain assumptions, the value of a firm is unaffected by its capital structure, and the WACC remains constant as the debt-to-equity ratio changes. However, in the presence of taxes, the theorem’s propositions are altered. The interest payments on debt are tax-deductible, creating a tax shield that effectively lowers a firm’s WACC as its debt level increases. This tax benefit is one of the key reasons that financing with debt can be more profitable than equity financing in specific scenarios.
After the analysis, and based on the results of the Monte Carlo simulation and the sensitivity analysis, we can provide the following recommendations for Qatar Gas Transport Company Limited (Nakilat) to optimize its capital structure.
Shift towards the optimal capital structure: The company should aim to adjust its capital structure to the identified optimal scenario, which involves a share of debt of 69%. This adjustment will help maximize the company’s value while minimizing the weighted average cost of capital.
Monitor and adjust key parameters: The company should keep a close eye on the most sensitive parameters, such as the risk-free rate, total debt, and total capitalization, and adjust its financing strategy accordingly to maintain the optimal capital structure.
Develop a comprehensive risk management plan: In order to manage external risks and ensure that the company’s capital structure will stay optimal over time, it is crucial to establish a comprehensive risk management plan that encompasses scenario planning and sensitivity analysis.
Maintain flexibility in financing strategy: Given the potential fluctuations in key parameters and the dynamic nature of the industry, it is essential for the company to maintain flexibility in its financing strategy. This will enable Nakilat to adapt to changing market conditions and continue to pursue growth opportunities while minimizing the cost of capital.
In conclusion, the Monte Carlo simulation and sensitivity analysis have provided valuable insights into the optimal capital structure for Qatar Gas Transport Company Limited (Nakilat). By following the recommendations outlined in this discussion, the company can optimize its capital structure, enhance its financial performance, and better align with its strategic objectives and risk appetite.
The limitations in this study are represented in ignoring other factors that can play an important role in determining the optimal capital structure. For example, besides the cost of capital that the company should spend to finance its capital, the company also should see the return that will be generated from operating activities and compare it with the cost; this will provide more accurate results to make the right decision about the optimal capital structure. Macroeconomic factors should also be taken into consideration to determine the optimal capital structure.
This study will support other research works in the future with the required feedback by introducing the use of programming languages as a new method to solve financial problems related to capital structure and its financing.


 ,
, 
