Article

Effect of a Cu-Ferrite Catalyzed DPF on the Ultrafine Particle Emissions from a Light-Duty Diesel Engine

1
Department of Industrial Engineering, University of Salerno, Via Giovanni Paolo II 132, 84084 Fisciano, Italy
2
Department of Chemical, Materials and Production Engineering, University of Naples “Federico II”, P.le Tecchio 80, 80125 Napoli, Italy
3
Department of Engineering, University of Naples “Parthenope”, Centro Direzionale Isola C4, 80143 Napoli, Italy
*
Author to whom correspondence should be addressed.
Energies 2023, 16(10), 4071; https://doi.org/10.3390/en16104071
Submission received: 5 April 2023 / Revised: 26 April 2023 / Accepted: 11 May 2023 / Published: 13 May 2023
(This article belongs to the Special Issue NOx, PM and CO2 Emission Reduction in Fuel Combustion Processes)

Abstract

:
The emissions of diesel engines in terms of particulate matter are limited all over the world. One possible solution for reaching the target imposed by the various regulations could be the adoption of a catalytic diesel particulate filter (CDPF). Nevertheless, the effect of CDPFs on the particle size distributions (PSDs) during the regeneration process needs to be deeply investigated. Therefore, this research work is focused on a detailed PSD analysis during the active regeneration of a 30 %wt CuFe2O4 loaded CDPF at the exhaust of an L-D diesel engine to reach a more complete understanding of the filter behavior. The results of the experimental tests evidence that at the CDPF outlet, compared to a standard DPF: (i) during the start-up of the regeneration, the particle emissions are three orders of magnitude lower and remain two orders of magnitude lower for particle sizes larger than 50 nm; (ii) the PSDs measured in the time range of 200–450 s exhibit the bimodality observed during the accumulation phase, with a peak that is three orders of magnitude lower; (iii) at the end of the regeneration, the PN distribution exhibits reductions of two and three orders of magnitude for particle sizes of 5 nm and above 50 nm, respectively.

1. Introduction

Diesel engines are still considered high-efficiency energy conversion systems since their operation under fuel lean combustion allows the production of lower CO2 [1], carbon monoxide (CO) and hydrocarbon (HC) emissions compared to spark ignition engines [2]. On the other hand, other compounds are present in the exhaust emissions of diesel engines, both in the gas phase and in the solid phase as particles [1]. The gas phase is commonly characterized by the presence of N2, CO2, O2, H2O, CO and NOx, as the main components, and the well-known soot is the main component of the solid phase [3]. In the last few years, the use of biodiesel and metallic additives dispersed in diesel have been proved to improve engine efficiency and reduce emissions [4]. However, the former introduces new challenges, such as corrosion in metal alloys, aluminum, and copper [4]. In any case, diesel engines are characterized by high particulate matter (PM) emissions, since some of their peculiarities, in particular, their fuel composition and the operating conditions realized in the combustion chamber, allow nonhomogeneous mixing, resulting in favored PM formation in the high-temperature regions with higher fuel contents [2]. PM is constituted of volatile and aromatic compounds (polycyclic aromatic hydrocarbons (PAHs) and heavier aromatic compounds) and non-volatile compounds (soot) [5]. Soot is characterized by a turbostratic structure, in which the particles are marked by the presence of crystallites of discernable lengths and with some stacking faults in their peripheries, while their centers have random crystallite orientations and are highly disordered [6]. Moreover, a thin-layer SOF (soluble organic fraction) may be formed on these particles, since small amounts of fuel and engine oil from the crankcase may escape oxidation reactions in the combustion chamber. It is well known that diesel emissions have direct negative effects on human health, causing several kinds of damage, including asthma, lung and heart disease, and cancer, and the main carcinogenic and mutagenic respiratory health risks are related to exposure to PAH, in gas phase and/or adsorbed on soot [7,8]. These harmful effects have led to the limitation of PM emissions from diesel engines all over the world through proper regulations, with the limits becoming more stringent over time [9]. For example, particle mass limits have dropped by more than 95% from the early 1990s (Euro I) to 2009 (Euro V) for light-duty diesel (L-D) vehicles in Europe [7]. A particle number (PN) limit (6 × 10¹¹ particles/km, taking into consideration only particles over 23 nm) was first introduced in 2011 (Euro Vb) for L-D diesel vehicles and was introduced in EURO VI emission standards also for gasoline direct injection (GDI) engines [10,11]. Car manufacturers have widely introduced diesel particulate filters (DPFs) in their vehicles to comply with these limits; thus, DPFs have become a crucial technology for achieving the tradeoff between emission limits and engine performance. In general, the DPF is a ceramic monolith with a honeycomb multi-channel structure composed of silicon carbide (SiC), whose parallel channels are alternately plugged, creating the so-called wall-flow configuration. In this way, the exhaust gas is constrained to go through the porous walls of the channels [12]. These devices ensure PM reduction with a quite impressive efficiency—more than 95% in terms of mass and concentrations higher than 99% over a wide range of engine operating conditions [12,13]. Since the particles are trapped by the millions of complex structured pores inside the DPF structure via the physical filtration principle, either the periodic or the continuous elimination of these particles is key to ensuring a long lifetime of the filter [14]. This removal process is called regeneration and consists in the oxidation of the trapped soot [15]. Efficient regeneration is required in order to keep the fuel penalty due to DPF presence as low as possible. In fact, a regeneration process that is not able to fully burn the deposited soot may result in a fast increase in the backpressure, consequently causing different drawbacks, including increased fuel consumption, engine failure or even fire events [16]. During the regeneration step, only the organic components can be burned, while the salts, which are known as DPF ash, survive and require manual dredging. For a diesel vehicle driven 20,000 km per year, regeneration would be expected every 4–14 days if a frequency of regeneration events is assumed to vary from 250 to 800 km [17]. In recent years, the development of models that are able to accurately predict DPF behavior in all its functioning phases (from the soot loading up to the regeneration stages) has become mandatory. Therefore, the attention of researchers has focused on this issue.
Three main regeneration strategies can be adopted, namely:
i.
Active regeneration, in which the exhaust gas is heated up to the oxidation temperature of soot, about 550–600 °C [18,19,20];
ii.
Passive regeneration, in which the soot oxidation temperature is lowered by the adoption of a catalyst [21,22]; and
iii.
Composite regeneration, which consists of a combination of the other two [23].
Regarding the passive regeneration strategy, the catalyst can be either mixed with the fuel (fuel-borne catalyst, FBC) or deposited on the DPF, thereby obtaining a catalyzed DPF (CDPF) [7]. CeO2 is the most widely used FBC; it can lower soot oxidation temperature and consequently soot emissions. However, recent studies have evidenced that its use reduces soot and THC emissions by up to 30% at part load under low-temperature combustion conditions, but no significant differences are observed at high load [24]. Moreover, the addition of CeO2 and Fe(C5H5)2 nanoparticles to ultralow sulfur diesel (ULSD) may increase the total particle count, due to the formation of self-nucleated metallic nanoparticles, and toxic effects on human health may occur due to modifications in the physicochemical characteristics of PM caused by FBC-doped fuels [25]. Apart from CeO2, different metals have been proposed as fuel additives, including Mn, Fe, Cu, Al, Be and Pt, all showing positive effects in reducing diesel engine emissions [4]. In recent years, different active species have been proposed for use in soot oxidation, both in powder forms and deposited on DPFs, including Ce0.5Zr0.5O2 catalysts promoted by multivalent transition-metal (Mn, Fe and Co) oxides [26]; nanostructured structures, such as equimolar ceria-praseodymia [27]; and CoOx-decorated CeO2 (CoCeO2) heterostructured catalysts [28], copper ferrite (CuFe2O4) [22], Ag/Al2O3 [29], nanoscale Mn3O4 [30], Mn2O3 [31], Fe-doped Mn2O3 [32] and CeO2 [33]. All the proposed catalysts have shown good activity in soot burning, with soot temperature oxidation in the range of 300–500 °C.
DPF regeneration in L-D vehicles, both in active and passive strategies, is achieved by using an after/post-injection strategy to increase the temperature of the exhausts up to soot burnout temperature. In particular, this strategy involves an after- and a post-injection: the former allows, through the injection of a checked amount of fuel during the expansion stroke, the evaporation of the latter, which occurs during the exhaust valve opening [34]. The unburned and vaporized fuel exiting the combustion chamber is subsequently oxidized in the diesel oxidation catalyst (DOC). This secondary fuel oxidation allows the exhaust gas to reach the ignition soot temperature (500–600 °C) across the DPF. A deep understanding of the phenomena related to the post-injection allows extremely important improvements to DPF operation modes, also in terms of extra fuel penalties during active regeneration [35,36,37].
Although the DPF regeneration condition has not been included yet in vehicle emission regulations, many previous studies have emphasized the emissions that occur during regeneration, evidencing how gaseous pollutants, as well as particulate emissions, in terms of mass and number, largely increase [1,35]. Experimental tests performed with the aim of investigating active regeneration events evidenced remarkable transient particulate emissions. Various mechanisms have been proposed in the literature to explain these observations [9,36,38,39,40,41,42]:
i.
A decreased filtration efficiency may be due to the particles being taken away from the cake layer and from inside the porous walls;
ii.
The increased temperature due to active regeneration has been suggested to lead to expansion of the porous wall, resulting in a further lower filtration efficiency;
iii.
The particle flow into the exhaust system may be changed due to different operating conditions in the engine in the case of active regeneration; fuel injection into the engine cylinder towards the end of the expansion stroke could change it significantly;
iv.
The injection of extra fuel into the tailpipe may lead to the formation of additional particles upstream of the inlet of the DPF (the main hypothesis is that the trapped particles may fragment during rapid oxidation events, thereby escaping the DPF, resulting in particle breakthrough phenomena);
v.
Active regeneration may be characterized by the emission of semi-volatile particles in addition to solid ones.
A deep understanding of the particle emissions during the active regeneration of a non-catalyzed wall-flow SiC DPF has been made possible by performing dedicated experimental tests [43]. In particular, a detailed analysis of PSDs at the exhaust of a EURO V L-D diesel engine was performed, with the engine working under different operating conditions, aiming at estimating the PN removal efficiency of the filter in the range of 5–100 nm. Moreover, the experimental tests allowed investigation of the evolution of PN concentration during the regeneration procedure, highlighting the influence of DPF temperature and the fuel post-injection strategy. The results of the PSD analysis have shown that:
i.
At the DPF inlet, during the accumulation phase, a strong bimodality with sub-10 nm particles dominating the PN concentration is present;
ii.
At the DPF outlet, a filtration efficiency higher than 90% was detected, demonstrating that the wall-flow filter can also remove the sub-23 nm particles. In particular, an efficiency value of about 99% has been detected in the range of 20–40 nm [43].
In previous works, we have demonstrated good results in terms of soot oxidation using a 30 %wt CuFe2O4 loaded catalytic DPF (CDPF) [23,44]. However, in the literature, the use of a CDPF resulted in high particle emissions, in particular during the first phase of the regeneration step [45]. Therefore, in this work the research was focused on detailed PSD analysis of the particles emitted during the active regeneration of the CDPF at the exhaust of a Euro V L-D diesel engine in order to reach a more complete understanding of the filter behavior, also aiming at its potential use in the real world. Using a scanning mobility particle sizer (SMPS), a PN distribution in the range of 4.5–160 nm was obtained during the soot filtration stage of the CDPF at various engine operating conditions. The filtration efficiency of the CDPF in the above specified range was calculated by alternately sampling the particles at the filter entrance and exit. Moreover, the regeneration process was deeply investigated in terms of the dynamic behavior of the PN size distributions.

2. Materials and Methods

2.1. The Monoliths

In this work, semicircular commercial monoliths in SiC (Pirelli Ecotechnology (Arese, Italy), 150 cpsi) with a radius of 9 cm were used to assemble the DPF. The bare monoliths were preliminarily calcined at 1000 °C for 48 h. This thermal treatment allowed the formation of a SiO2 layer on SiC granules, increasing the adhesion of the active species over the filter even in the absence of a washcoat. Therefore, two filters with a total volume of about 3.5 L (D = 190 mm and L = 125 mm) were obtained by coupling four monoliths for each one, obtaining a Vfilter/engine displacement ratio = 1.3. The main features of the assembled bare filters are shown in Table S1.

2.2. Catalytic Filter Preparation

The preparation procedure of the CDPF began with the preliminary dipping for 30 min of one of the assembled bare DPFs in a 1:1 HF:HNO3 acid mixture maintained at 45 °C, aiming at increasing the initial average pore diameter [23]. This procedure allowed the enhancement of the catalyst loading capacity, ensuring similar pressure drops. The selected active species was copper ferrite (CuFe2O4), owing to its high activity and very good stability demonstrated in the catalytic oxidation of soot, shown in our previous works [10,22,23].
The catalyst precursor solution was prepared by mixing iron nitrate and copper nitrate (2:1 molar ratio) in distilled water, with continuous stirring at 80 °C. The CDPF was prepared following the previously optimized preparation procedure [44] by repeating the phases of impregnation in the prepared solution, with drying at 80 °C and calcination at 1000 °C after each impregnation, until the desired load of active species of 30 %wt was reached.

2.3. Characterization of the Catalytic Filters

Different characterization analyses were used for the characterization of the different materials employed in this work.
The active phase in powder form was investigated using the X-ray diffraction (XRD) technique (with a microdiffractometer (Rigaku (Tokyo, Japan) D-max-RAPID), using Cu-Kα radiation), aiming at verifying the formation of the desired crystalline forms of CuFe2O4.
The structured samples were characterized through:
i.
Scanning electron microscopy (SEM), using a Philips Mod.XL30 coupled to an energy dispersive X-ray spectrometer (EDS; Oxford, UK) for the surface analysis;
ii.
Hg porosimetry tests, with N2 adsorption at −196 °C (to calculate the samples’ specific surface areas (SSAs) through BET);
iii.
Ultrasound adherence test (exposure of the monoliths to ultrasound according to an optimized experimental procedure [44]).
Moreover, H2-TPR measurements were performed to investigate the reducibility of the catalyst using a sample of the catalytic SiC monolith at room temperature up to 900 °C at a heating rate of 5 °C/min with a 5% H2/N2 flow. The concentrations of the gas stream were monitored by means of a mass spectrometer (HIDEN Analytical, Warrington, UK).
SEM images and Raman spectra (inVia Raman Microscope (Renishaw, Wotton-under-Edge, UK), equipped with a 514 nm Ar ion laser operating at 25 mW) were used for the characterization of the soot emitted by the diesel engine used for the experimental tests, as well as of the soot deposited on the catalytic filter after the deposition step.

2.4. Experimental Layout and Instruments

The experimental tests were carried out in the Energy and Propulsion Laboratory at the University of Salerno. The engine test bed, auxiliary plants, sensors and emission probes were in the engine test cell. The propulsion system was remotely controlled from an adjacent room, where the control console and the equipment for the management of the hardware, actuators and sensors were located. Figure 1 shows the engine test bed equipped with an eddy-current dyno (Borghi-Saveri, Bologna, Italy) and a light-duty EURO V common-rail diesel engine, whose main technical data are reported in Table S2.
The main hardware and software systems for the engine-dyno control are:
i.
The AVL microIFEM for the management of the engine-dyno system by means of Puma open software;
ii.
The AVL Indimicro to monitor and process the in-cylinder data by means of Indicom software;
iii.
The control unit ETAS ES592.1 to manage the engine control unit (ECU) by means of INCA v7.1. The latter allows the visualization, processing and handling of the measurement signals and the control settings of the ECU, thus enabling engine operating modes different from the basic ECU calibration. In particular, it is possible to handle the combustion control variables, such as rail pressure, injection pattern, boost pressure and exhaust gas recirculation (EGR), to investigate specific engine operating conditions.
Focusing on the exhaust emissions, PM measurement was performed using the AVL Smoke Meter 415S (AVL List GmbH, Graz, Austria). The measurement of NO and NOx concentrations across the DPF was performed using the Cambustion CLD500 fast NOx sensor, a chemi-luminescence detector (CLD) with a response time of 3 ms.
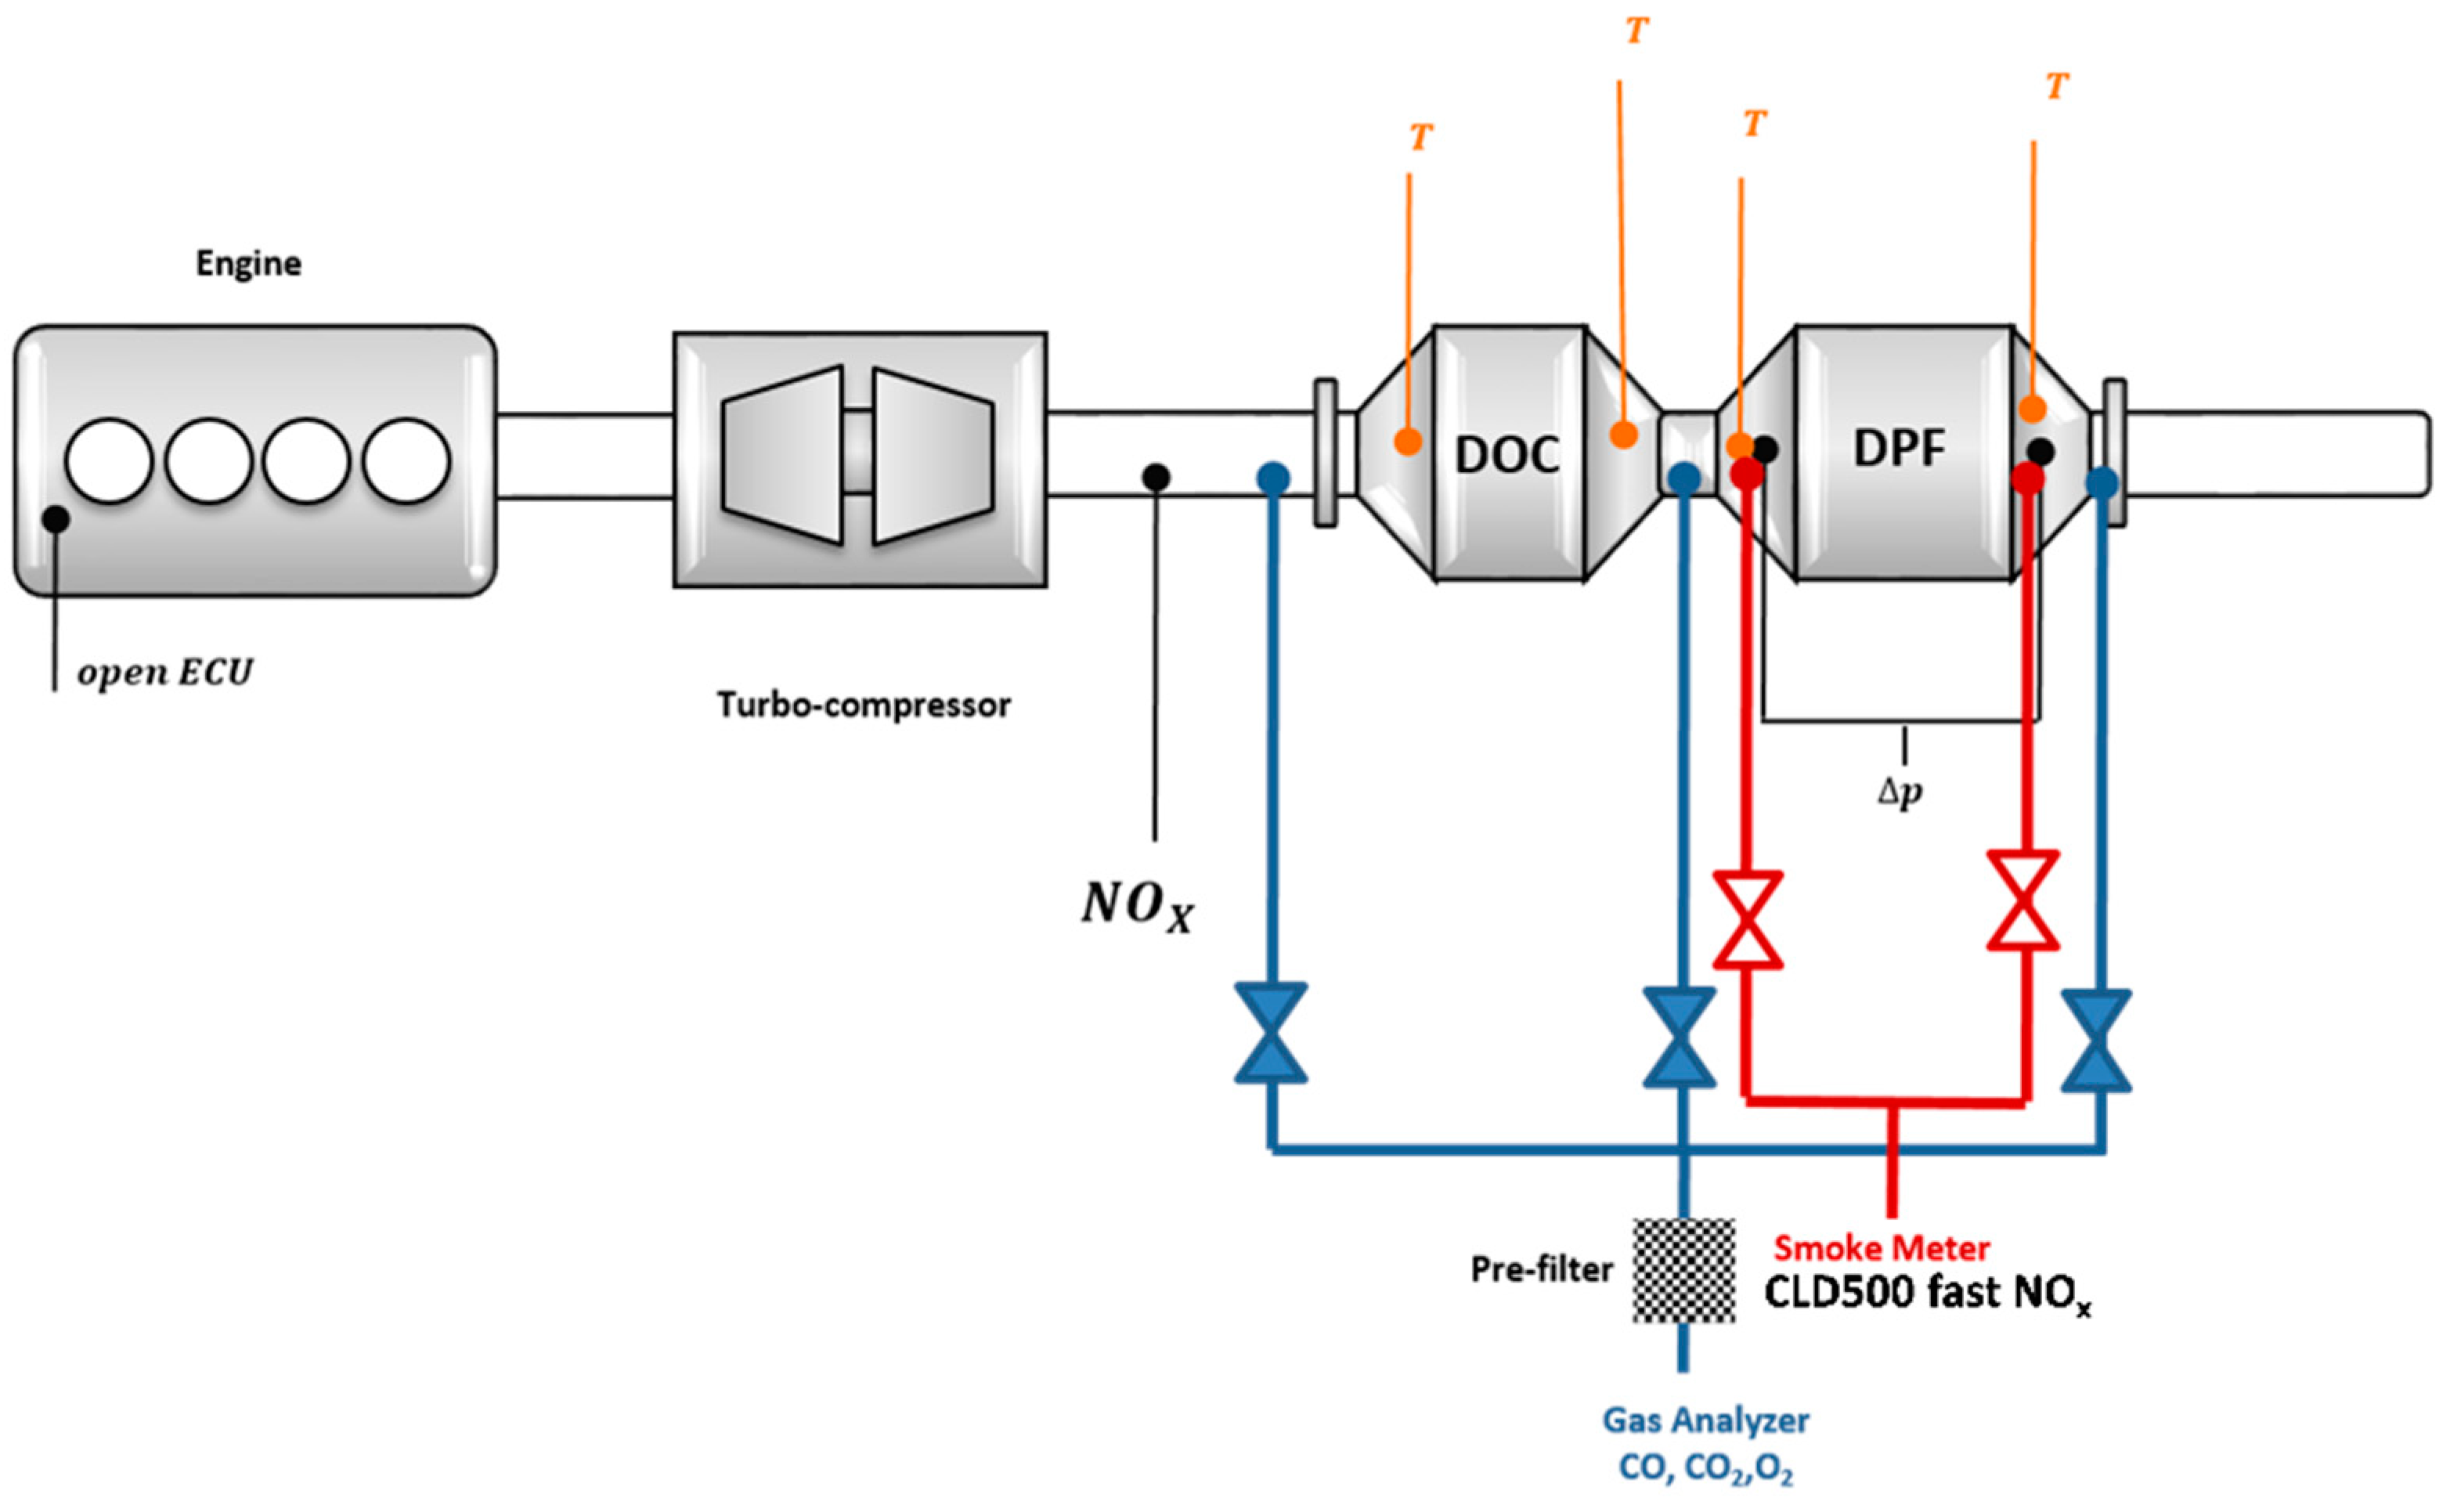
The engine exhaust pipeline was modified in order to properly locate the DPFs and sensors. As schematically represented in Figure 2, the filter was placed downstream of the DOC, and two variable section ducts were placed upstream and downstream of it. The CDPF was wrapped in a heat-expanding intumescent ceramic mat (Interam® Mat Mount 550 by 3M Italia Srl (Pioltello, Italy) before being enclosed in the stainless-steel reactor of the experimental plant. Temperature and pressure drop across the filter were continuously monitored by means of two K type thermocouples (at the inlet and outlet of the CDPF) and a differential pressure sensor (MDTP), respectively. The latter was composed of two sensors located upstream and downstream of the filter, and its signals were continuously processed by a microcontroller that returned the pressure drop. This device was powered in voltage by an external power supply set at 5 V. K thermocouples were connected to the AVL Puma Open, while the MTDP, after the calibration with a sphygmomanometer, was connected to a TLK. The output current signal was linked via RS232 to a Lab-View interface. For the investigation of passive regeneration with the CDPF, the measurement of NO and NO2 concentrations was performed using the Cambustion CLD 500 (Cambustion, Cambridge, UK), equipped with two independent probes for NO and NOx sensing. An alternate sampling, arranged like the soot measurement described above, allowed investigation of the variation in NOx concentration across the filter [22]. The filter assembly in the exhaust pipe and the CDPF placed in the reactor are shown in Figure 3. The main sensors and measurement instruments are listed in Table S3, with the corresponding accuracies.
The PSDs were measured by means of an SMPS system consisting of an electrostatic classifier (EC; TSI Model 3082 (TSI, Shoreview, MN, USA)), a nano-differential mobility analyzer (nano-DMA; TSI Model 3085 (TSI, Shoreview, MN, USA)) and an advanced aerosol neutralizer (TSI Model 3088 (TSI, Shoreview, MN, USA)) linked to a condensation particle counter (CPC; TSI Model 3750 (TSI, Shoreview, MN, USA)). A sample flow rate of 0.3 L/min and a sheath flow rate of 3 L/min in the EC were chosen as operating conditions, allowing the analysis of particle sizes in the range of 4.5–160 nm. For each sample, the data were reported as averaged values of multiple scans, where the duration of a single scan was set to 60 s. The PSD measurements were performed by diluting the aerosols sampled from the engine before entering the SMPS system. The dilution tool was a two-stage dilution system obtained from Dekati (fine particle sampler; Model FPS-4000 (Dekati, Kangasala, Finland)), and two dilution ratios (DRs) of 80 and 130 were used, depending on the operating condition. Moreover, the dilution temperature of the first stage was set at 25 °C. The dilution ratio was properly chosen in order to avoid the condensation/coagulation of particles along the sampling line. In other research papers, higher DRs were used for particle analysis, and heated lines were employed; however, it is worth noting that the specific experimental setup strongly influences the critical DR; the important parameters are PN, gas phase composition in the sampling line and residence time. The critical DR was checked in all the investigated conditions [46,47,48]. In this work, two different DRs were used to obtain, after the CDPF, a higher signal-to-noise ratio by using the lower DR, still achieving the critical dilution conditions.

3. Results and Discussion

3.1. SiC Monoliths before Catalyst Deposition

The dipping of the monoliths in the acid solution for 30 min before catalyst deposition had the effect of increasing both the initial average pore diameter from 17 to 22 μm and the SSA from 0.35 m2/g to 2.20 m2/g.

3.2. Soot Emitted by the Diesel Engine

The soot emitted by the diesel engine used for the experimental tests was characterized by means of SEM and SEM-EDX analysis (Figures S1 and S2).
The SEM images evidenced the typical spherical aggregates of soot, whose primary constituents had dimensions in the order of 50–300 nanometers. The SEM-EDX analysis evidenced that the elements detected on soot trapped by the CDPF during the experimental tests were the typical elements present in the fuel, namely, S, Cr, Mn and Ni. Other detected elements (Fe, Cu, Si and O) are the constituents of both carrier and active species.
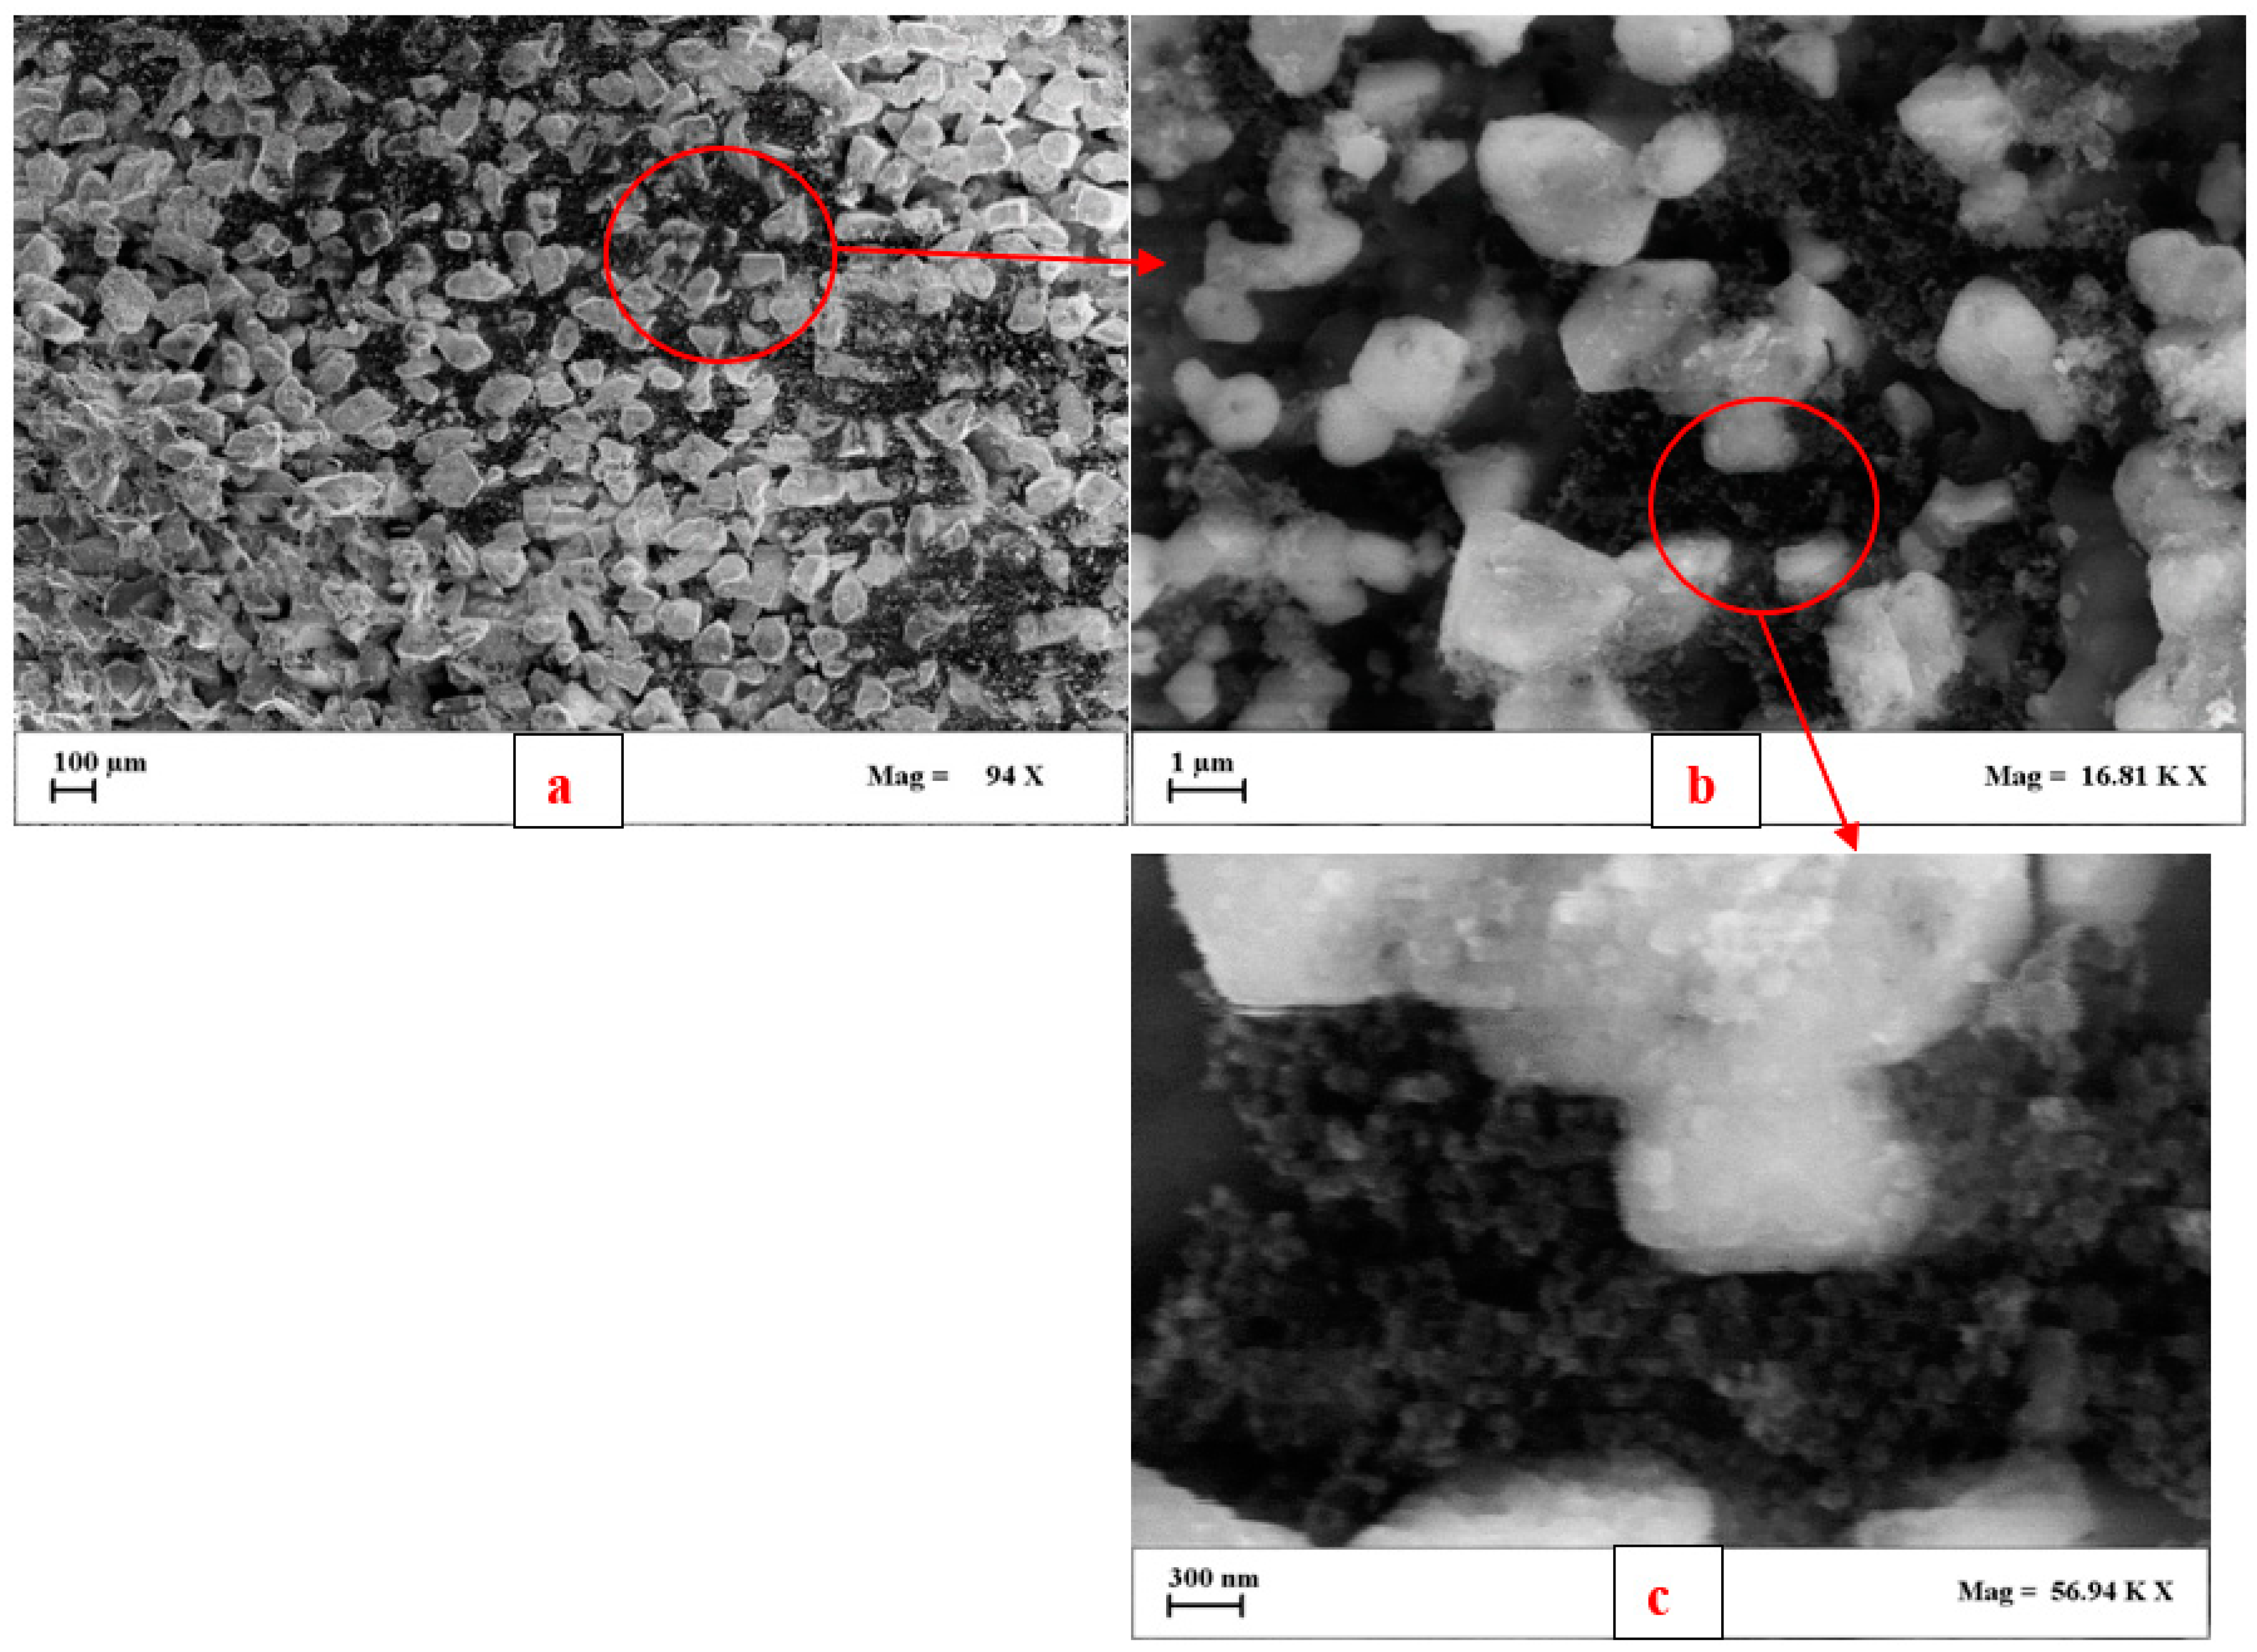
The SEM analysis was used to also characterize the catalytic filter after the soot deposition stage in order to investigate the soot–catalyst contact (Figure 4). In particular, the following images of catalyst pieces after a soot deposition step were obtained, where a load of about 5 g/L was reached, and so at the same load of soot relevant to the regeneration step.
The SEM images shown in Figure 4 evidenced the soot–catalyst contact features. In particular, in Figure 4a it is possible to observe that the filter surface is entirely covered by the trapped soot with a very homogeneous distribution, confirming the very high CDPF ability to store a high soot amount with an optimal filtration efficiency. Moreover, Figure 4b,c are related to the inner surfaces of the carrier walls. It can be observed that the catalyst particles are in very strict contact with the trapped soot, allowing many contact points between the soot and the catalyst, resulting in higher catalytic activity of the CDPF.
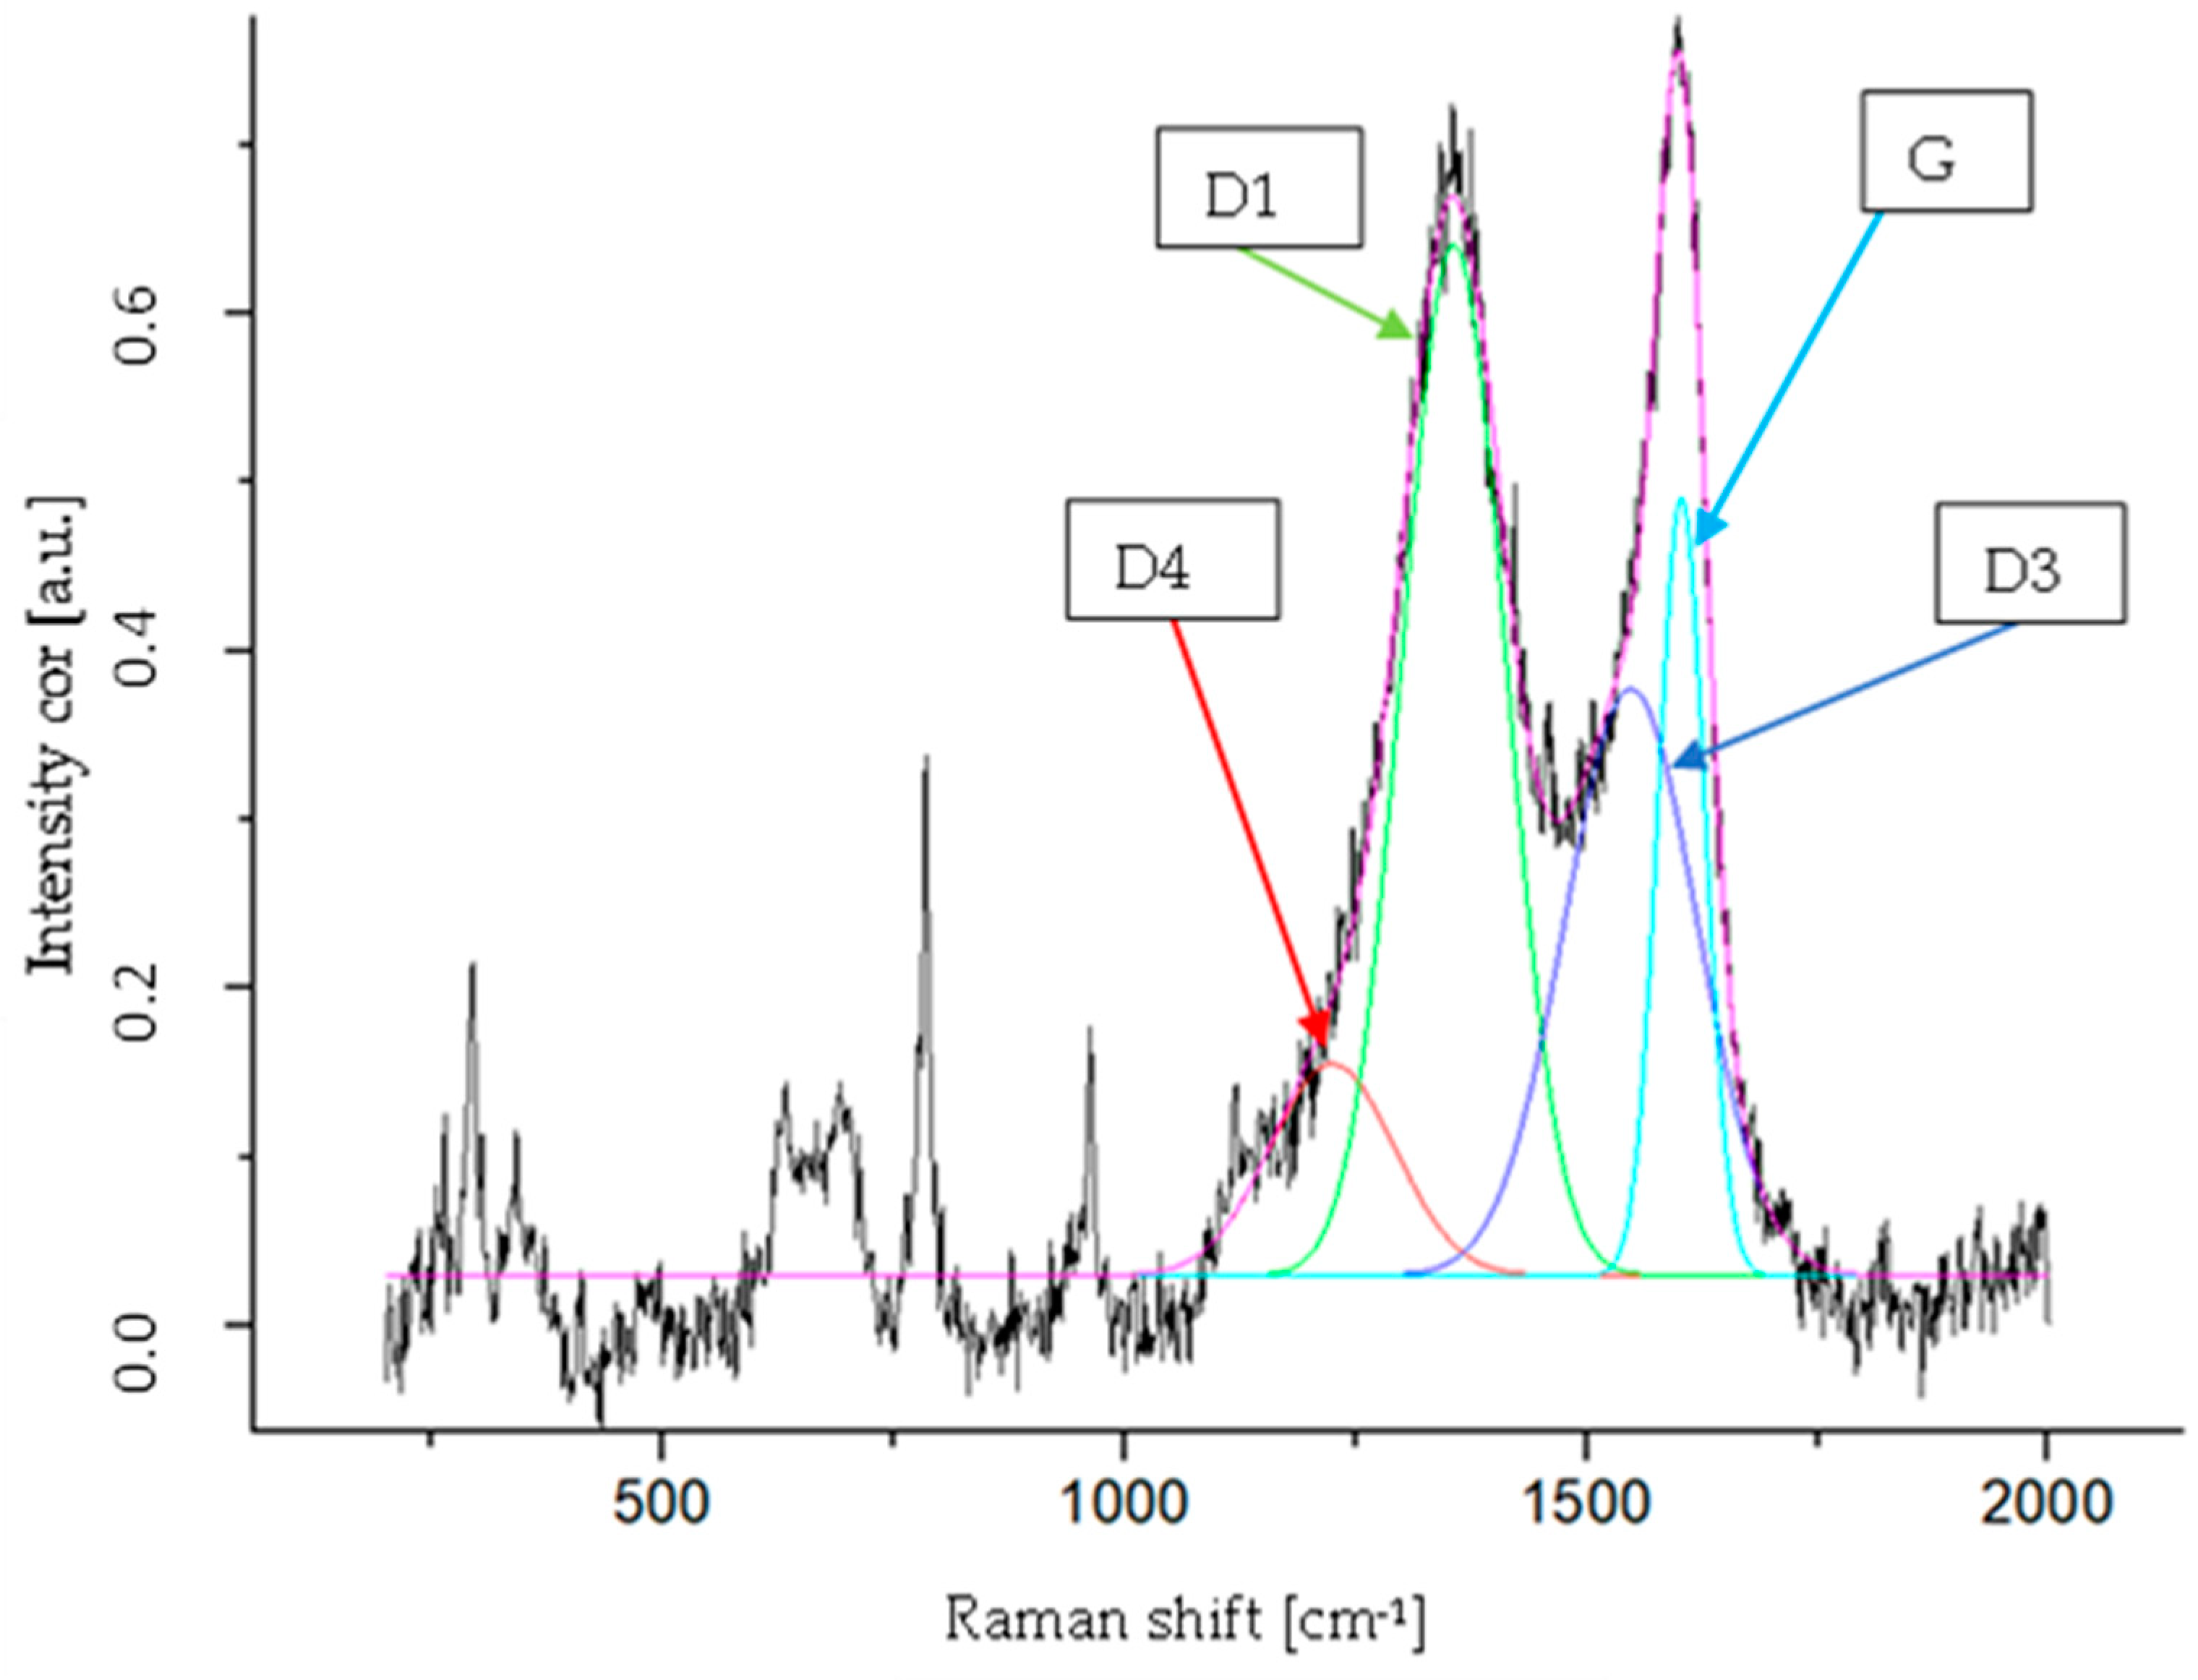
The Raman spectrum of a sample of the spent CDPF (Figure 5) evidenced the typical peaks of the SiC carrier at 295, 784 and 964 cm−1 [49]. Moreover, in Figure 5 the peaks relevant to soot are also present, and they have been attributed to bands G, D1, D3 and D4, as summarized in Table 1 [50].

3.3. Fresh Catalytic Samples

The XRD patterns of the prepared copper ferrite in comparison with cubic (database 77-0010), tetragonal (database 34-0425) and commercial (Merck KGaA, Darmstadt, Germany) forms are reported in Figure S3. XRD analysis shows the presence in the prepared catalyst of the typical peaks of tetragonal and cubic forms of CuFe2O4, whose average crystallite dimensions, calculated using the Scherrer formula, are about 20 nm. Two minor peaks ascribed to low amounts of oxides (CuO and Fe2O3) are also present.
The optimized procedure for the deposition of the active species, coupled to the modified porosity of the SiC monoliths, resulted in a uniform and homogeneous distribution of the copper ferrite not only on the monolith walls, but also in the porosities. The comparison of the catalytic and the bare samples in terms of BET specific surface area evidenced that the deposition of the active species resulted in a decrease in this parameter from 2.20 to 0.40 m2/g. This result could be ascribed to the catalyst placement and the inside roughness caused by acid treatment. At this point, it is it is important to emphasize that this cannot be considered a negative result. In fact, these catalytic systems properly developed for the limitation of soot emissions are specifically applied to heterogeneous solid–solid–gas systems, in which the contact and the interactivity between the solid matrices (soot and catalyst) and the gas phase (mainly O2) are the main parameters influencing the feasibility of soot combustion. Therefore, the maximization of these features is mandatory. In the catalytic systems investigated in this work, an intensified soot–catalyst contact was realized, as reported in our previous works [44], highlighting the very good catalytic activity towards soot oxidation with the O2 present in the engine exhausts.
The SEM images shown in Figure 6 evidenced that the active species were homogeneously distributed, confirming previously reported results [23,44]. Moreover, no cracks formed due to preliminary acid treatment (Figure 6a), and the pores were not plugged after the catalyst deposition (Figure 6b). A deeper analysis of Figure 6 provides evidence that the catalyst aggregates formed a compact porous layer on the SiC granules (Figure 6c), which can be optimal for enhancing the soot–catalyst contact during the regeneration stage. Moreover, the catalyst deposition procedure allowed the deposition of the active species also in the pores of the DPF channel walls (Figure 6d), without their plugging.
The SEM-EDX analysis enabled the mapping of the elements present on the filter (Figure S4), and the detected elements were the structural ones (C, O and Si) and the catalyst active species (Cu and Fe).
The ultrasound adherence tests, shown in Figure S5 as weight loss (%) vs. number of cycles, evidenced weight losses much lower than those reported in the literature for washcoated supports [51]. These results proved that the preliminary calcination at 1000 °C for 48 h favored the adhesion of the active species on the SiC granules even in the absence of a washcoat, due to the formation of SiO2 streaks on the SiC granules, as previously reported [52].
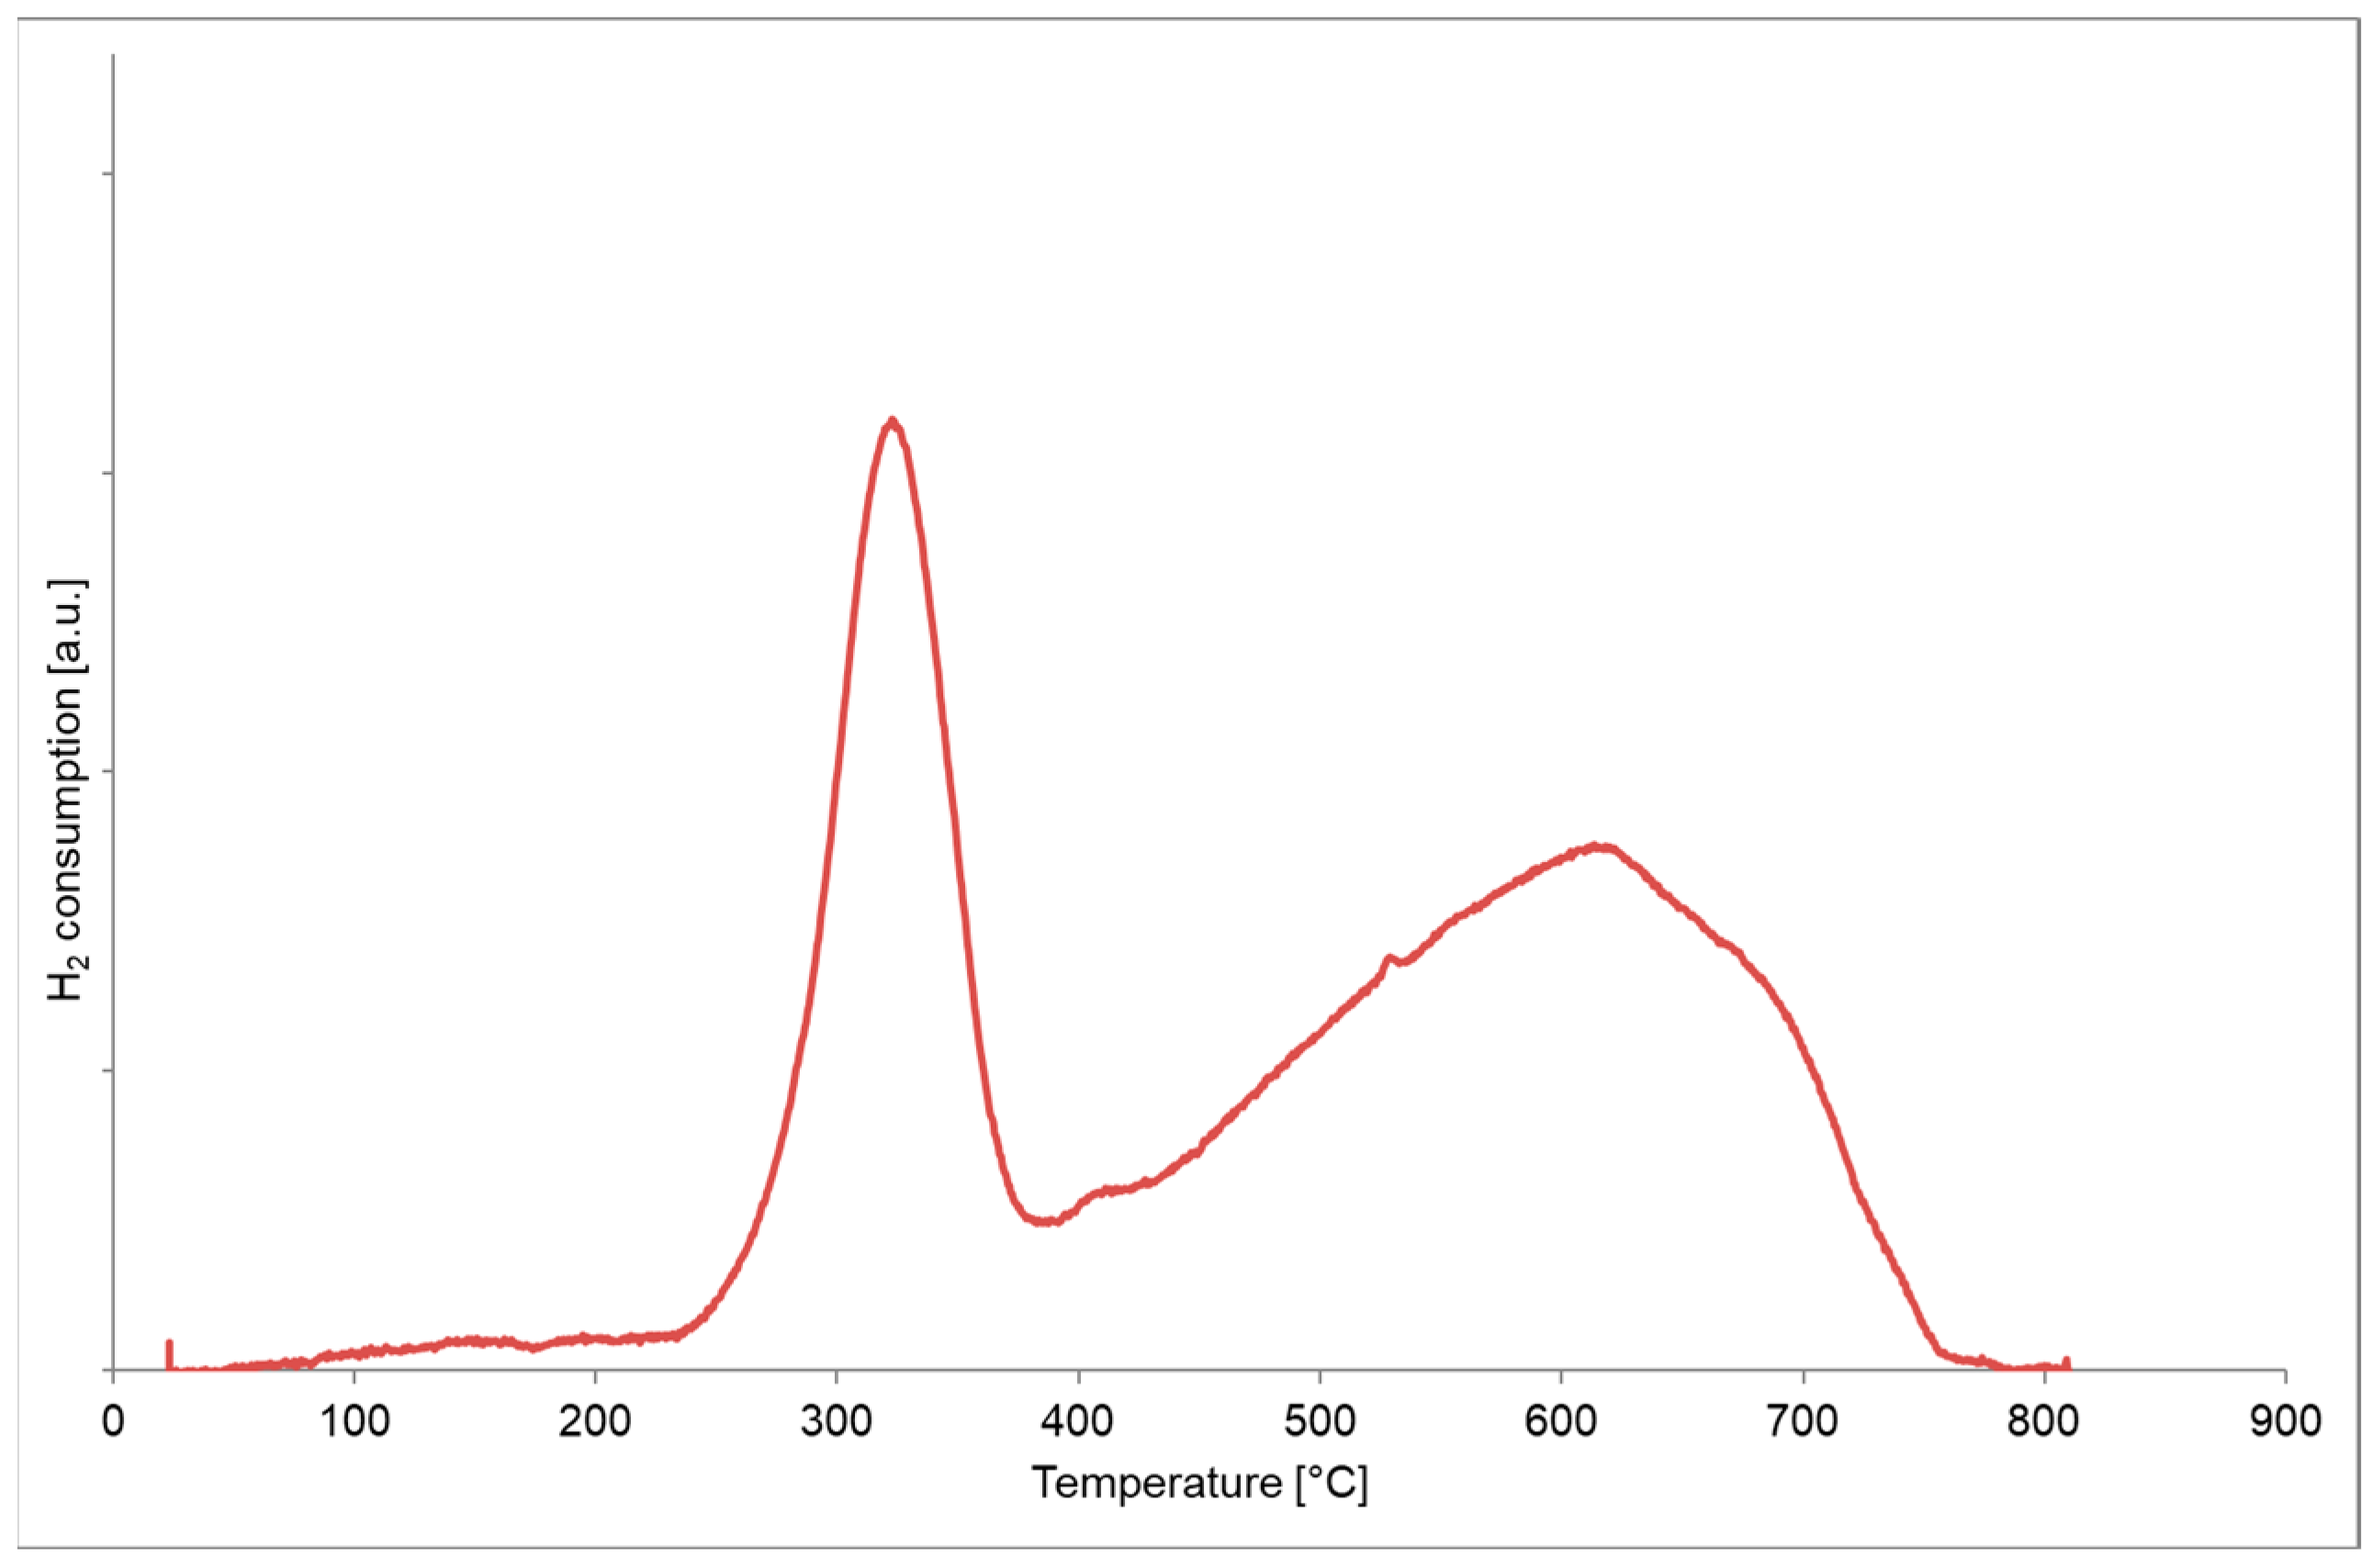
The H2-TPR profile is shown in Figure 7 as H2 consumption vs. temperature.
Two pronounced reduction peaks, at about 300 °C and 610 °C, were present, which were attributed to the reduction of copper ferrite at lower temperatures and of Fe3O4 to Fe at higher temperatures [53].
By considering the two reduction reactions, it is possible to calculate the total amount of H2 consumed for Cu moles (H2/Cu ratio). In this case, this value was about 4, which:
i.
Is consistent with the amount necessary to obtain the complete reduction of CuFe2O4 to Cu and Fe following the overall reaction (Equation (1)); and
ii.
Corresponds to a load of CuFe2O4 equal to about 30.01 %wt, which is in very good agreement with the estimated 30 %wt of CuFe2O4 on the catalytic sample.
C u F e 2 O 4 + 4 H 2 C u + 2 F e + 4 H 2 O

3.4. Experimental Tests in the Engine Test Cell

Both the soot loading and regeneration stages were performed under properly selected operating conditions in order to consider the influence of the exhaust flow rate on soot loading in terms of soot flow rate and soot cake properties. In particular, steady-state conditions were used to perform the soot loading, with a standard injection strategy consisting of pilot, pre- and main injections. In this phase, a constant value for the exhaust flow rate was used, aiming at monitoring the effective soot accumulation. In fact, two main terms are responsible for the pressure drop across the DPF:
i.
ΔPfilter, due to the presence of the clean filter in the exhaust pipe, depending on both gas flow parameters (volumetric flow rate, viscosity and density) and filter geometry (volume, filter cell size, wall thickness and filter length); and
ii.
ΔPsoot, related to the soot accumulation in the DPF, mainly in terms of soot cake properties [54].
During the filtration, the soot mass flow rate was calculated using the following formula:
m ˙ s o o t = m ˙ e x h ρ C s o o t
where m ˙ e x h and ρ are the mass flow rate (in kg/h) and density (in mg/m3) of the exhaust gas at the inlet of the DPF, while C s o o t is the PM concentration in mg/m3 measured by the smoke meter. During the experimental tests, the soot concentration across the filters was continuously monitored in order to estimate the DPF efficiency, in terms of PM, using the following equation:
η f i l t r a t i o n = C s o o t _ i n C s o o t _ o u t C s o o t _ i n 100
where C s o o t _ i n and C s o o t _ o u t are the PM concentrations in mg/m3 upstream and downstream of the filters, respectively.
The measurement of torque, fuel consumption, exhaust flow rate, T and DP across the filter was carried out to compare the engine performance during the filtration stage. The PSD measurements were carried out upstream and downstream of the CDPF. The size-dependent filter removal efficiency during the accumulation was evaluated for each diameter using the following equation:
η f i l t r a t i o n = ( N p a r t i c l e s ) i n ( N p a r t i c l e s ) o u t ( N p a r t i c l e s ) i n 100
where the subscripts “in” and “out” indicate the number of particles before and after the filtration, respectively. Moreover, the PN emission evolution during the active regeneration was detected. This represents a critical issue in a future perspective; in fact, the regeneration procedure could be entailed in the type of approval cycle (i.e., RDE).
The experimental tests during the soot loading phase were performed under four different engine loads in the range of 22–36%, with an engine speed equal to 2140 rpm and standard ECU calibration. The main engine variables are reported in Table S4. Engine load conditions were selected to compare filter performance also when the passive regeneration occurred with the CDPF (e.g., loads equal to 33% and 36%).
Regarding the active regeneration, PSD was correlated with the time history of DP across the CDPF and inlet/outlet temperatures. According to the description reported in a previous work [43], the procedure was actuated when a soot loading of 5 g/L had been reached: this quantity, not far from that reported in the literature [55,56], was recommended by the filter manufacturer as a value that does not impact on engine performance. The comparison between the CDPF and the bare DPF is shown in Figure 8 in terms of normalized pressure drop and temperature during the regeneration phase in the same engine operating conditions. The beneficial effect of the catalyst deposited on the DPF is evident: the DP curve decreases, meaning that soot oxidation occurrence is needed at temperatures lower than 400 °C for the CDPF (Figure 8a) and about 600 °C for the bare DPF (Figure 8b). Regarding the contents of the following sections, the whole regeneration process of the CDPF was divided into three consecutive phases (Figure 8a):
i.
Start-up (0–200 s), in which any soot oxidation occurs;
ii.
Soot combustion (200–450 s);
iii.
End of regeneration, in which constant DP (after 450 s) and constant differences between temperatures across the CDPF are present.

Particle Emission Measurements

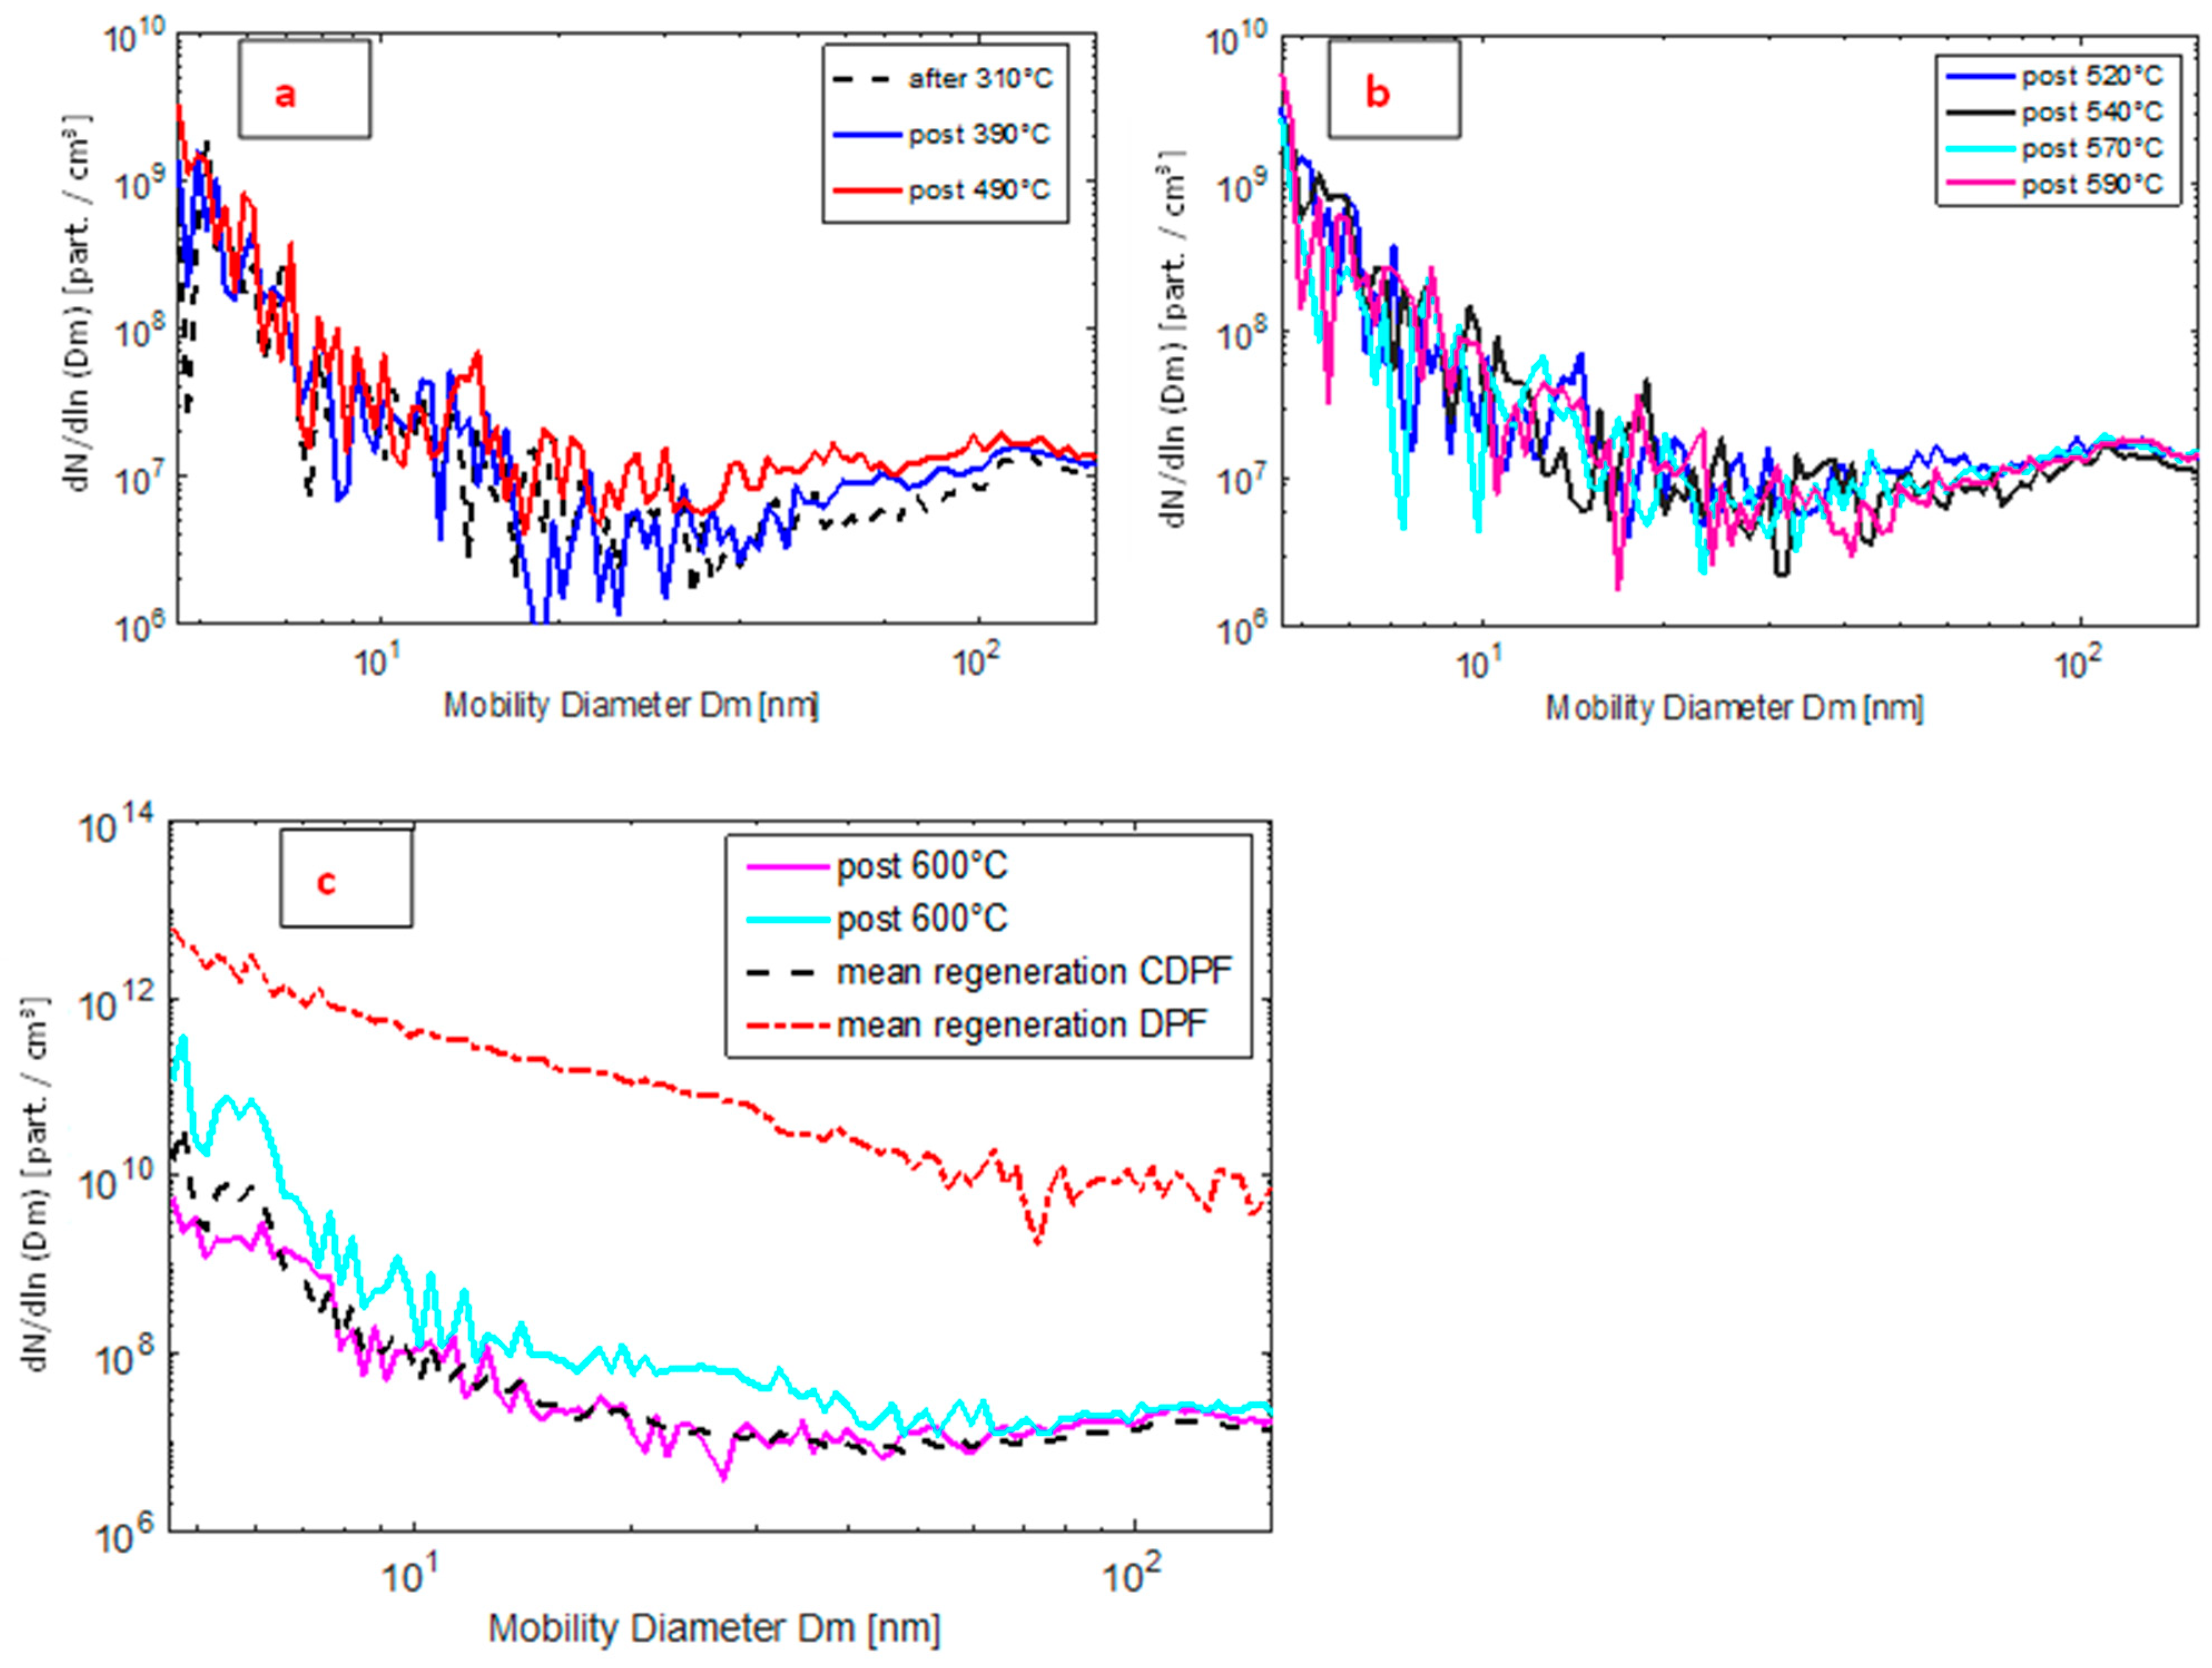
In this section, the PSDs at the CDPF outlet are presented and discussed; the results are compared with those obtained for the DPF [43] to emphasize the differences in terms of particle emissions. The plots shown in Figure 9, Figure 10, Figure 11 and Figure 12 correspond to the raw experimental PSD data measured in the engine tailpipe. Due to the complex setup adopted for the measurements and the intrinsic oscillations due to the typical wave propagation of the engine exhaust gas flow to be analyzed, the PSD data were expected to be noisy. However, in this case no digital filter to generate a smoother data distribution was applied to render this aspect for readers and better evaluate the quality of the data and the difficulty in obtaining them. Regarding the particle size determination, Figure 9, Figure 10, Figure 11 and Figure 12 show the mobility diameter (Dm) in a log scale; therefore, the range of values mentioned in the text can be considered correct despite the data oscillation trend. Moreover, the PSDs are represented on the Y-axis in Figure 9, Figure 10 and Figure 12 as dN/dln (Dm), where N is the number density and Dm is the mobility diameter.
Figure 9 shows the PN concentration at the CDPF outlet for test case #1. The PSD bimodality [43] was still observed, and, after a minimum around 20–30 nm, the particle number increased for larger diameters (blue line). Differently from what was recently measured by authors with a regular DPF in the same conditions [43], a remarkable difference between the empty and partially filled filter was observed; in particular, an appreciable increase in the range of 10–100 nm was clearly visible (red line). The latter is due to the high reactivity of the CPDF, which ensures complete filter emptying during the active regeneration. However, the slight PN increase disappears after a few minutes of accumulation.
Figure 10 shows a comparison of the catalytic and the bare filters. In Figure 10a, the PSDs for test cases #1 and #2 (low engine speed) are reported: the two filters exhibited very similar results in terms of both shape and concentration across the whole range investigated. On the other hand, in Figure 10b (test cases #3 and #4—high engine speed) the CDPF presents a slight increase in PN in both test cases. Focusing on test case #3, the peak of 5 nm particles is three times higher than that observed for the DPF (green and black lines, respectively). The trend was observed up to 40 nm, after which the difference between the PSDs measured with the two filters was negligible. Similar remarks could be made with reference to the comparison of the PSDs obtained in test case #4. The increase in the number of 5 nm particles confirmed that, in the CDPF, the passive regeneration occurs starting from 33% of engine load [21]. In fact, while for the standard filter the PN removal efficiency was comparable, for the CDPF at 36% of engine load a slight reduction was detected. This results in partial filter emptying, thus allowing a reduction in the frequency of active regeneration. It is worth remarking that the particle emissions detected were much lower than those achieved during active regeneration; therefore, a reduction in both pollutants and fuel consumption can be achieved by operating the CDPF rather than the DPF.
The above results were also confirmed by the filtration efficiency estimation, as defined by Equation (3), shown in Figure 11.
In accordance with the DPF results, the highest PN removal was observed for test case #1, due to the lowest spatial velocity. In particular, the CDPF seemed to be very effective also for the sub-23 nm particles and exhibited a constant efficiency, below 40 nm, close to 99%. The narrow difference, compared with the DPF [43], is due to the lower mean pore diameter which affects the particle removal efficiency. On the other hand, in test case #4 the passive regeneration event leads to a slight decrease in efficiency for particle diameters below 10 nm. This phenomenon was not noticed for the standard DPF, which exhibited very close values for all the investigated conditions. For particles larger than 60 nm, the filtration efficiency began to decrease, and the CDPF exhibited similar behavior to the DPF.
Figure 12a shows the PSDs measured at the CDPF exit during the start-up of the regeneration. The dashed black line represents the PN distribution obtained by actuating the fuel after injection. The concentrations of particles with sizes below 10 nm were one order of magnitude lower than in the DPF and remained almost constant for the whole particle size range investigated; the PSDs are like those measured during the accumulation phase, as proof of the high reactivity of the catalyst. The benefits of the CDPF are even more striking comparing the PSDs when the fuel post-injection is actuated (blue and red lines). In fact, no significant increase in particle emissions was observed; moreover, the results highlight the absence of a correlation between the concentration peak of particles with sizes below 10 nm and the post-injection fuel quantity. In particular, the particle emissions were three orders of magnitude lower than the standard filter and remained two orders of magnitude lower for particle sizes larger than 50 nm. The slight increase in the concentration of particles in the range of 30–60 nm (red line) was probably due to the start of the soot oxidation, which resulted in the soot layer fragmentation responsible for a lower filtration efficiency towards the particles in this range.
Figure 12b shows the PSDs measured at the CDPF exit during the second phase of the regeneration process (200–450 s). The plots refer to different mean inlet temperatures to analyze the evolution of PSDs in the second stage of regeneration. Compared to the results obtained with the standard filter, the CDPF exhibited a bimodality of the PSDs also observed during the accumulation phase, with a peak of 5 nm particles equal to 3 × 10⁹ #/cm3, three orders of magnitude lower than for the DPF. Very similar values were detected during this stage, which emphasizes the improved soot oxidation thanks to the catalytic activity. The reduction in PN concentration at the outlet of the CDPF was confirmed by the sharp increase in the outlet temperature: while for the standard filter it exceeded the inlet temperature after 380 s [43], for the catalytic filter, this occurred much earlier, after 220 s. Moreover, the temperature increase across the filter reached 100 °C, two times higher than that detected across the DPF. Given these considerations, it can be asserted that the local oxidation temperatures were much higher and that complete combustion of the particles was achieved.
Figure 12c shows the PSDs at the end of the regeneration, identified by the quasi-constant pressure drop across the CDPF and the decrease in the outlet temperature. The magenta and cyan lines refer to two consecutive measurements collected in a time window of one minute in the same inlet conditions. A PN peak of 2 × 10¹¹ was detected for particles with sizes below 10 nm in the later measurement (cyan line), which is more than one order of magnitude higher than the earlier measurement (red line). Furthermore, an appreciable increase in the range of 20–40 nm was noticed, which yielded a PSD shape not observed in the earlier measurements. This behavior can be explained considering that, despite the same inlet temperature being used, the DPF core exhibited a higher temperature in the former case, thus promoting the oxidation of the particles with lower diameters. Furthermore, this result confirms the complete emptying of the CDPF, previously evidenced in Figure 9.
The dashed black line in Figure 12 shows the mean PSD during the whole regeneration process for the CDPF. The comparison with the corresponding values detected for the DPF, represented by the dashed red line, highlights the impressive reduction in particle emissions achieved by the CDPF in the whole range investigated. In particular, the peak of the 5 nm PN dropped from 4 × 10¹² to 3 × 10¹⁰, two orders of magnitude lower, while for the particle size above 50 nm the reduction reached three orders of magnitude, from 1010 to 107.
This very important result highlighted that the use of a well-designed CDPF can allow the oxidation of accumulated soot at lower temperatures and decrease in particle emissions during the regeneration phase, not only with respect to a bare DPF, but also with respect to recent studies in the literature, in which increases in emissions of particles of sizes above and below 23 nm were observed [45,57].

4. Conclusions

In this work, starting from the results previously obtained on soot oxidation during DPF regeneration [21,22,23], the research focused on the detailed PSD analysis of particles emitted during the active regeneration of a CuFe2O4 catalyzed DPF at the exhaust of an L-D common-rail diesel engine. Different tests were performed under different engine operating conditions, aiming at estimating the PN removal efficiency of the CDPF in the range of 5–100 nm. The filtration efficiency in the investigated PN range was evaluated by alternately sampling the particles upstream and downstream of the CDPF. In particular, the dynamics of the PN size distributions during the regeneration process were investigated. The results of the experimental tests evidenced that, during the start-up of the regeneration, differently from the standard DPF, no significant increase in particle emissions at the CDPF outlet was observed. In fact, particle emissions three orders of magnitude lower than those detected when regenerating the standard filter were observed, and they remained two orders of magnitude lower for particle sizes larger than 50 nm. With the regeneration going on, in the range of 200–450 s, the PSDs measured at the CDPF outlet exhibited the bimodality observed during the accumulation phase, with a peak that was three orders of magnitude lower than that detected in the case of the bare DPF. At the end of the regeneration, characterized by a quasi-constant pressure drop across the CDPF, an impressive reduction in PN emissions was still observed vs. the standard DPF, with PN values that were two and three orders of magnitude lower for the particle sizes of 5 nm and above 50 nm, respectively. This very important result highlighted that the use of a well-designed CDPF can allow the oxidation of the accumulated soot at lower temperatures and a decrease in particle emissions during the regeneration phase, not only with respect to a bare DPF, but also with respect to recent studies in the literature, in which increases in emissions of particles above and below 23 nm were observed.

Supplementary Materials

The following supporting information can be downloaded at: https://www.mdpi.com/article/10.3390/en16104071/s1, Table S1: Geometrical data of the bare DPF; Table S2: Engine technical data; Table S3: Sensors accuracy; Table S4: Engine conditions during accumulation phase in 4 test cases; Figure S1: SEM image of the soot emitted by the Diesel engine used in the experimental tests; Figure S2: SEM image (left) and EDX mapping (right) of soot emitted by the Diesel engine as trapped by the CDPF; Figure S3: XRD pattern of the prepared CuFe2O4 compared with cubic, tetragonal and commercial copper ferrite; Figure S4: SEM image and distribution of elements, obtained by EDX element mapping, for the 30%wt CuFe2O4 loaded DPF; Figure S5: Ultrasonic tests performed on 30 %wt CuFe2O4 catalysed monolith.

Author Contributions

Conceptualization, E.M., B.R., G.D.F., M.S., I.A. and V.P.; methodology, E.M., B.R., G.D.F., M.S., I.A. and V.P.; software, E.M., B.R., G.D.F., M.S., I.A. and V.P.; validation, E.M., B.R., G.D.F., M.S., I.A. and V.P.; formal analysis, E.M., B.R., G.D.F., M.S., I.A. and V.P.; investigation, E.M., B.R., G.D.F., M.S., I.A. and V.P.; resources, E.M., B.R., G.D.F., M.S., I.A. and V.P.; data curation, E.M., B.R., G.D.F., M.S., I.A. and V.P.; writing—original draft preparation, E.M., B.R., G.D.F., M.S., I.A., V.P.; writing—review and editing, E.M., B.R., G.D.F., M.S., I.A. and V.P.; visualization, E.M., B.R., G.D.F., M.S., I.A. and V.P.; supervision, I.A. and V.P.; project administration, I.A. and V.P. All authors have read and agreed to the published version of the manuscript.

Funding

This research received no external funding.

Data Availability Statement

Not available.

Conflicts of Interest

The authors declare no conflict of interest.

References

  1. Beatrice, C.; Di Iorio, S.; Guido, C.; Napolitano, P. Detailed characterization of particulate emissions of an automotive catalyzed DPF using actual regeneration strategies. Exp. Therm. Fluid Sci. 2012, 39, 45–53. [Google Scholar] [CrossRef]
  2. Alexandrino, K. Comprehensive Review of the Impact of 2,5-Dimethylfuran and 2-Methylfuran on Soot Emissions: Experiments in Diesel Engines and at Laboratory-Scale. Energy Fuels 2020, 34, 6598–6623. [Google Scholar] [CrossRef]
  3. Zhang, Y.; Xia, C.; Liu, D.; Zhu, Y.; Feng, Y. Experimental investigation of the high-pressure SCR reactor impact on a marine two-stroke diesel engine. Fuel 2023, 335, 127064. [Google Scholar] [CrossRef]
  4. Pacino, A.; La Porta, C.; La Rocca, A.; Cairns, A. Copper leaching effects on combustion characteristics and particulate emissions of a direct injection high pressure common rail diesel engine. Fuel 2023, 340, 127536. [Google Scholar] [CrossRef]
  5. Apicella, B.; Mancaruso, E.; Russo, C.; Tregrossi, A.; Oliano, M.M.; Ciajolo, A.; Vaglieco, B.M. Effect of after-treatment systems on particulate matter emissions in diesel engine exhaust. Exp. Therm. Fluid Sci. 2020, 116, 110107. [Google Scholar] [CrossRef]
  6. Bagi, S.; Kamp, C.J.; Sharma, V.; Aswath, P.B. Multiscale characterization of exhaust and crankcase soot extracted from heavy-duty diesel engine and implications for DPF ash. Fuel 2020, 282, 118878. [Google Scholar] [CrossRef]
  7. Meloni, E.; Palma, V. Most Recent Advances in Diesel Engine Catalytic Soot Abatement: Structured Catalysts and Alternative Approaches. Catalysts 2020, 10, 745. [Google Scholar] [CrossRef]
  8. Gren, L.; Malmborg, V.B.; Jacobsen, N.R.; Shukla, P.C.; Bendtsen, K.M.; Eriksson, A.C.; Essig, Y.J.; Krais, A.M.; Loeschner, K.; Shamun, S.; et al. Effect of Renewable Fuels and Intake O2 Concentration on Diesel Engine Emission Characteristics and Reactive Oxygen Species (ROS) Formation. Atmosphere 2020, 11, 641. [Google Scholar] [CrossRef]
  9. Fang, J.; Meng, Z.; Li, J.; Du, Y.; Qin, Y.; Jiang, Y.; Bai, W.; Chase, G.G. The effect of operating parameters on regeneration characteristics and particulate emission characteristics of diesel particulate filters. Appl. Therm. Eng. 2019, 148, 860–867. [Google Scholar] [CrossRef]
  10. Meloni, E.; Palma, V. Low Temperature Microwave Regeneration of Catalytic Diesel Particulate Filter. Chem. Eng. Trans. 2018, 70, 721–726. [Google Scholar] [CrossRef]
  11. Saffaripour, M.; Chan, T.W.; Liu, F.; Thomson, K.A.; Smallwood, G.J.; Kubsh, J.; Brezny, R. Effect of Drive Cycle and Gasoline Particulate Filter on the Size and Morphology of Soot Particles Emitted from a Gasoline-Direct-Injection Vehicle. Environ. Sci. Technol. 2015, 49, 11950–11958. [Google Scholar] [CrossRef] [PubMed]
  12. Kong, X.; Li, Z.; Shen, B.; Wu, Y.; Zhang, Y.; Cai, D. Simulation of flow and soot particle distribution in wall-flow DPF based on lattice Boltzmann method. Chem. Eng. Sci. 2019, 202, 169–185. [Google Scholar] [CrossRef]
  13. Yamamoto, K.; Nakamura, M.; Yane, H.; Yamashita, H. Simulation on catalytic reaction in diesel particulate filter. Catal. Today 2010, 153, 118–124. [Google Scholar] [CrossRef]
  14. Yamamoto, K.; Oohori, S.; Yamashita, H.; Daido, S. Simulation on soot deposition and combustion in diesel particulate filter. Proc. Combust. Inst. 2009, 32, 1965–1972. [Google Scholar] [CrossRef]
  15. Oi-Uchisawa, J.; Obuchi, A.; Wang, S.; Nanba, T.; Ohi, A. Catalytic performance of Pt/MOx loaded over SiC-DPF for soot oxidation. Appl. Catal. B Environ. 2003, 43, 117–129. [Google Scholar] [CrossRef]
  16. Zhang, M.; Ge, Y.; Wang, X.; Peng, Z.; Tan, J.; Hao, L.; Lv, L.; Wang, C. An investigation into the impact of burning diesel/lubricant oil mixtures on the nature of particulate emissions: Implications for DPF ash-loading acceleration method. J. Energy Inst. 2020, 93, 1207–1215. [Google Scholar] [CrossRef]
  17. Giechaskiel, B. Particle Number Emissions of a Diesel Vehicle during and between Regeneration Events. Catalysts 2020, 10, 587. [Google Scholar] [CrossRef]
  18. Jiaqiang, E.; Zhao, M.; Zuo, Q.; Zhang, B.; Zhang, Z.; Peng, Q.; Han, D.; Zhao, X.; Deng, Y. Effects analysis on diesel soot continuous regeneration performance of a rotary microwave-assisted regeneration diesel particulate filter. Fuel 2020, 260, 116353. [Google Scholar] [CrossRef]
  19. Kurien, C.; Srivastava, A.K.; Lesbats, S. Experimental and computational study on the microwave energy based regeneration in diesel particulate filter for exhaust emission control. J. Energy Inst. 2020, 93, 2133–2147. [Google Scholar] [CrossRef]
  20. Kurien, C.; Srivastava, A.K.; Gandigudi, N.; Anand, K. Soot deposition effects and microwave regeneration modelling of diesel particulate filtration system. J. Energy Inst. 2020, 93, 463–473. [Google Scholar] [CrossRef]
  21. Rossomando, B.; Arsie, I.; Meloni, E.; Palma, V.; Pianese, C. Experimental Test on the Feasibility of Passive Regeneration in a Catalytic DPF at the Exhaust of a Light-Duty Diesel Engine; SAE Technical Paper 2019-24-0045; SAE International (Europe): London, UK, 2019. [Google Scholar]
  22. Rossomando, B.; Arsie, I.; Meloni, E.; Palma, V.; Pianese, C. Experimental Testing of a Low Temperature Regenerating Catalytic DPF at the Exhaust of a Light-Duty Diesel Engine; SAE Technical Paper 2018-01-0351; SAE International (Europe): London, UK, 2018. [Google Scholar]
  23. Meloni, E.; Palma, V.; Vaiano, V. Optimized microwave susceptible catalytic diesel soot trap. Fuel 2017, 205, 142–152. [Google Scholar] [CrossRef]
  24. Leach, F.C.; Davy, M.; Terry, B. Combustion and emissions from cerium oxide nanoparticle dosed diesel fuel in a high speed diesel research engine under low temperature combustion (LTC) conditions. Fuel 2021, 288, 119636. [Google Scholar] [CrossRef]
  25. Zhang, Z.-H.; Balasubramanian, R. Effects of Cerium Oxide and Ferrocene Nanoparticles Addition as Fuel-Borne Catalysts on Diesel Engine Particulate Emissions: Environmental and Health Implications. Environ. Sci. Technol. 2017, 51, 4248–4258. [Google Scholar] [CrossRef] [PubMed]
  26. He, J.; Yao, P.; Qiu, J.; Zhang, H.; Jiao, Y.; Wang, J.; Chen, Y. Enhancement effect of oxygen mobility over Ce0.5Zr0.5O2 catalysts doped by multivalent metal oxides for soot combustion. Fuel 2021, 286, 119359. [Google Scholar] [CrossRef]
  27. Andana, T.; Piumetti, M.; Bensaid, S.; Russo, N.; Fino, D. Heterogeneous mechanism of NOx-assisted soot oxidation in the passive regeneration of a bench-scale diesel particulate filter catalyzed with nanostructured equimolar ceria-praseodymia. Appl. Catal. A Gen. 2019, 583, 117136. [Google Scholar] [CrossRef]
  28. Mori, K.; Jida, H.; Kuwahara, Y.; Yamashita, H. CoOx-decorated CeO2 heterostructures: Effects of morphology on their catalytic properties in diesel soot combustion. Nanoscale 2020, 12, 1779–1789. [Google Scholar] [CrossRef]
  29. Serhan, N.; Tsolakis, A.; Wahbi, A.; Martos, F.; Golunski, S. Modifying catalytically the soot morphology and nanostructure in diesel exhaust: Influence of silver De-NOx catalyst (Ag/Al2O3). Appl. Catal. B Environ. 2019, 241, 471–482. [Google Scholar] [CrossRef]
  30. Ji, F.; Men, Y.; Wang, J.; Sun, Y.; Wang, Z.; Zhao, B.; Tao, X.; Xu, G. Promoting diesel soot combustion efficiency by tailoring the shapes and crystal facets of nanoscale Mn3O4. Appl. Catal. B Environ. 2019, 242, 227–237. [Google Scholar] [CrossRef]
  31. Singer, C.; Kureti, S. Soot oxidation in diesel exhaust on manganese oxide catalyst prepared by flame spray pyrolysis. Appl. Catal. B Environ. 2020, 272, 118961. [Google Scholar] [CrossRef]
  32. Kuwahara, Y.; Fujibayashi, A.; Uehara, H.; Mori, K.; Yamashita, H. Catalytic combustion of diesel soot over Fe and Ag-doped manganese oxides: Role of heteroatoms in the catalytic performances. Catal. Sci. Technol. 2018, 8, 1905–1914. [Google Scholar] [CrossRef]
  33. Di Sarli, V.; Landi, G.; Lisi, L.; Saliva, A.; Di Benedetto, A. Catalytic diesel particulate filters with highly dispersed ceria: Effect of the soot-catalyst contact on the regeneration performance. Appl. Catal. B Environ. 2016, 197, 116–124. [Google Scholar] [CrossRef]
  34. Jeftić, M.; Yu, S.; Han, X.; Reader, G.T.; Wang, M.; Zheng, M. Effects of Postinjection Application with Late Partially Premixed Combustion on Power Production and Diesel Exhaust Gas Conditioning. J. Combust. 2011, 2011, 891096. [Google Scholar] [CrossRef]
  35. D’Aniello, F.; Rossomando, B.; Arsie, I.; Pianese, C. Development and Experimental Validation of a Control Oriented Model of a Catalytic DPF; SAE Technical Paper 2019-01-0985; SAE International (Europe): London, UK, 2019. [Google Scholar]
  36. Lao, C.T.; Akroyd, J.; Eaves, N.; Smith, A.; Morgan, N.; Bhave, A.; Kraft, M. Modelling particle mass and particle number emissions during the active regeneration of diesel particulate filters. Proc. Combust. Inst. 2019, 37, 4831–4838. [Google Scholar] [CrossRef]
  37. Wang, D.-Y.; Tan, P.-Q.; Zhu, L.; Wang, Y.-H.; Hu, Z.-Y.; Lou, D.-M. Novel soot loading prediction model of diesel particulate filter based on collection mechanism and equivalent permeability. Fuel 2021, 286, 119409. [Google Scholar] [CrossRef]
  38. Dwyer, H.; Ayala, A.; Zhang, S.; Collins, J.; Huai, T.; Herner, J.; Chau, W. Emissions from a diesel car during regeneration of an active diesel particulate filter. J. Aerosol Sci. 2010, 41, 541–552. [Google Scholar] [CrossRef]
  39. Meng, Z.; Chen, C.; Li, J.; Fang, J.; Tan, J.; Qin, Y.; Jiang, Y.; Qin, Z.; Bai, W.; Liang, K. Particle emission characteristics of DPF regeneration from DPF regeneration bench and diesel engine bench measurements. Fuel 2020, 262, 116589. [Google Scholar] [CrossRef]
  40. Wihersaari, H.; Pirjola, L.; Karjalainen, P.; Saukko, E.; Kuuluvainen, H.; Kulmala, K.; Keskinen, J.; Rönkkö, T. Particulate emissions of a modern diesel passenger car under laboratory and real-world transient driving conditions. Environ. Pollut. 2020, 265, 114948. [Google Scholar] [CrossRef]
  41. Liati, A.; Schreiber, D.; Dasilva, Y.A.R.; Eggenschwiler, P.D. Ultrafine particle emissions from modern Gasoline and Diesel vehicles: An electron microscopic perspective. Environ. Pollut. 2018, 239, 661–669. [Google Scholar] [CrossRef]
  42. Meng, Z.; Li, J.; Fang, J.; Tan, J.; Qin, Y.; Jiang, Y.; Qin, Z.; Bai, W.; Liang, K. Experimental study on regeneration performance and particle emission characteristics of DPF with different inlet transition sections lengths. Fuel 2020, 262, 116487. [Google Scholar] [CrossRef]
  43. Rossomando, B.; Meloni, E.; De Falco, G.; Sirignano, M.; Arsie, I.; Palma, V. Experimental characterization of ultrafine particle emissions from a light-duty diesel engine equipped with a standard DPF. Proc. Combust. Inst. 2021, 38, 5695–5702. [Google Scholar] [CrossRef]
  44. Palma, V.; Ciambelli, P.; Meloni, E.; Sin, A. Optimal CuFe2O4 load for MW susceptible catalysed DPF. Chem. Eng. Trans. 2013, 35, 727–732. [Google Scholar] [CrossRef]
  45. R’mili, B.; Boréave, A.; Meme, A.; Vernoux, P.; Leblanc, M.; Noël, L.; Raux, S.; D’anna, B. Physico-Chemical Characterization of Fine and Ultrafine Particles Emitted during Diesel Particulate Filter Active Regeneration of Euro5 Diesel Vehicles. Environ. Sci. Technol. 2018, 52, 3312–3319. [Google Scholar] [CrossRef] [PubMed]
  46. Salenbauch, S.; Sirignano, M.; Pollack, M.; D’anna, A.; Hasse, C. Detailed modeling of soot particle formation and comparison to optical diagnostics and size distribution measurements in premixed flames using a method of moments. Fuel 2018, 222, 287–293. [Google Scholar] [CrossRef]
  47. Sgro, L.A.; Sementa, P.; Vaglieco, B.M.; Rusciano, G.; D’anna, A.; Minutolo, P. Investigating the origin of nuclei particles in GDI engine exhausts. Combust. Flame 2012, 159, 1687–1692. [Google Scholar] [CrossRef]
  48. De Filippo, A.; Maricq, M.M. Diesel Nucleation Mode Particles: Semivolatile or Solid? Environ. Sci. Technol. 2008, 42, 7957–7962. [Google Scholar] [CrossRef]
  49. Burton, J.C.; Sun, L.; Pophristic, M.; Lukacs, S.J.; Long, F.H.; Feng, Z.C.; Ferguson, I.T. Spatial characterization of doped SiC wafers by Raman spectroscopy. J. Appl. Phys. 1998, 84, 6268–6273. [Google Scholar] [CrossRef]
  50. Sadezky, A.; Muckenhuber, H.; Grothe, H.; Niessner, R.; Pöschl, U. Raman microspectroscopy of soot and related carbonaceous materials: Spectral analysis and structural information. Carbon 2005, 43, 1731–1742. [Google Scholar] [CrossRef]
  51. Giani, L.; Cristiani, C.; Groppi, G.; Tronconi, E. Washcoating methods for Pd/gamma-Al2O3 deposition on metallic foams. Appl. Catal. B Environ. 2006, 62, 121–131. [Google Scholar] [CrossRef]
  52. Palma, V.; Ciambelli, P.; Meloni, E.; Sin, A. Catalytic DPF microwave assisted active regeneration. Fuel 2015, 140, 50–61. [Google Scholar] [CrossRef]
  53. Kameoka, S.; Tanabe, T.; Tsai, A.P. Self-assembled porous nano-composite with high catalytic performance by reduction of tetragonal spinel CuFe2O4. Appl. Catal. A Gen. 2010, 375, 163–171. [Google Scholar] [CrossRef]
  54. Choi, S.; Oh, K.-C.; Lee, C.-B. The effects of filter porosity and flow conditions on soot deposition/oxidation and pressure drop in particulate filters. Energy 2014, 77, 327–337. [Google Scholar] [CrossRef]
  55. Haralampous, O.A.; Kandylas, I.P.; Koltsakis, G.C.; Samaras, Z.C. Diesel particulate filter pressure drop Part 1: Modelling and experimental validation. Int. J. Engine Res. 2004, 5, 149–162. [Google Scholar] [CrossRef]
  56. Lapuerta, M.; Rodríguez-Fernández, J.; Oliva, F. Effect of soot accumulation in a diesel particle filter on the combustion process and gaseous emissions. Energy 2012, 47, 543–552. [Google Scholar] [CrossRef]
  57. Yamada, H.; Inomata, S.; Tanimoto, H. Mechanisms of Increased Particle and VOC Emissions during DPF Active Regeneration and Practical Emissions Considering Regeneration. Environ. Sci. Technol. 2017, 51, 2914–2923. [Google Scholar] [CrossRef]
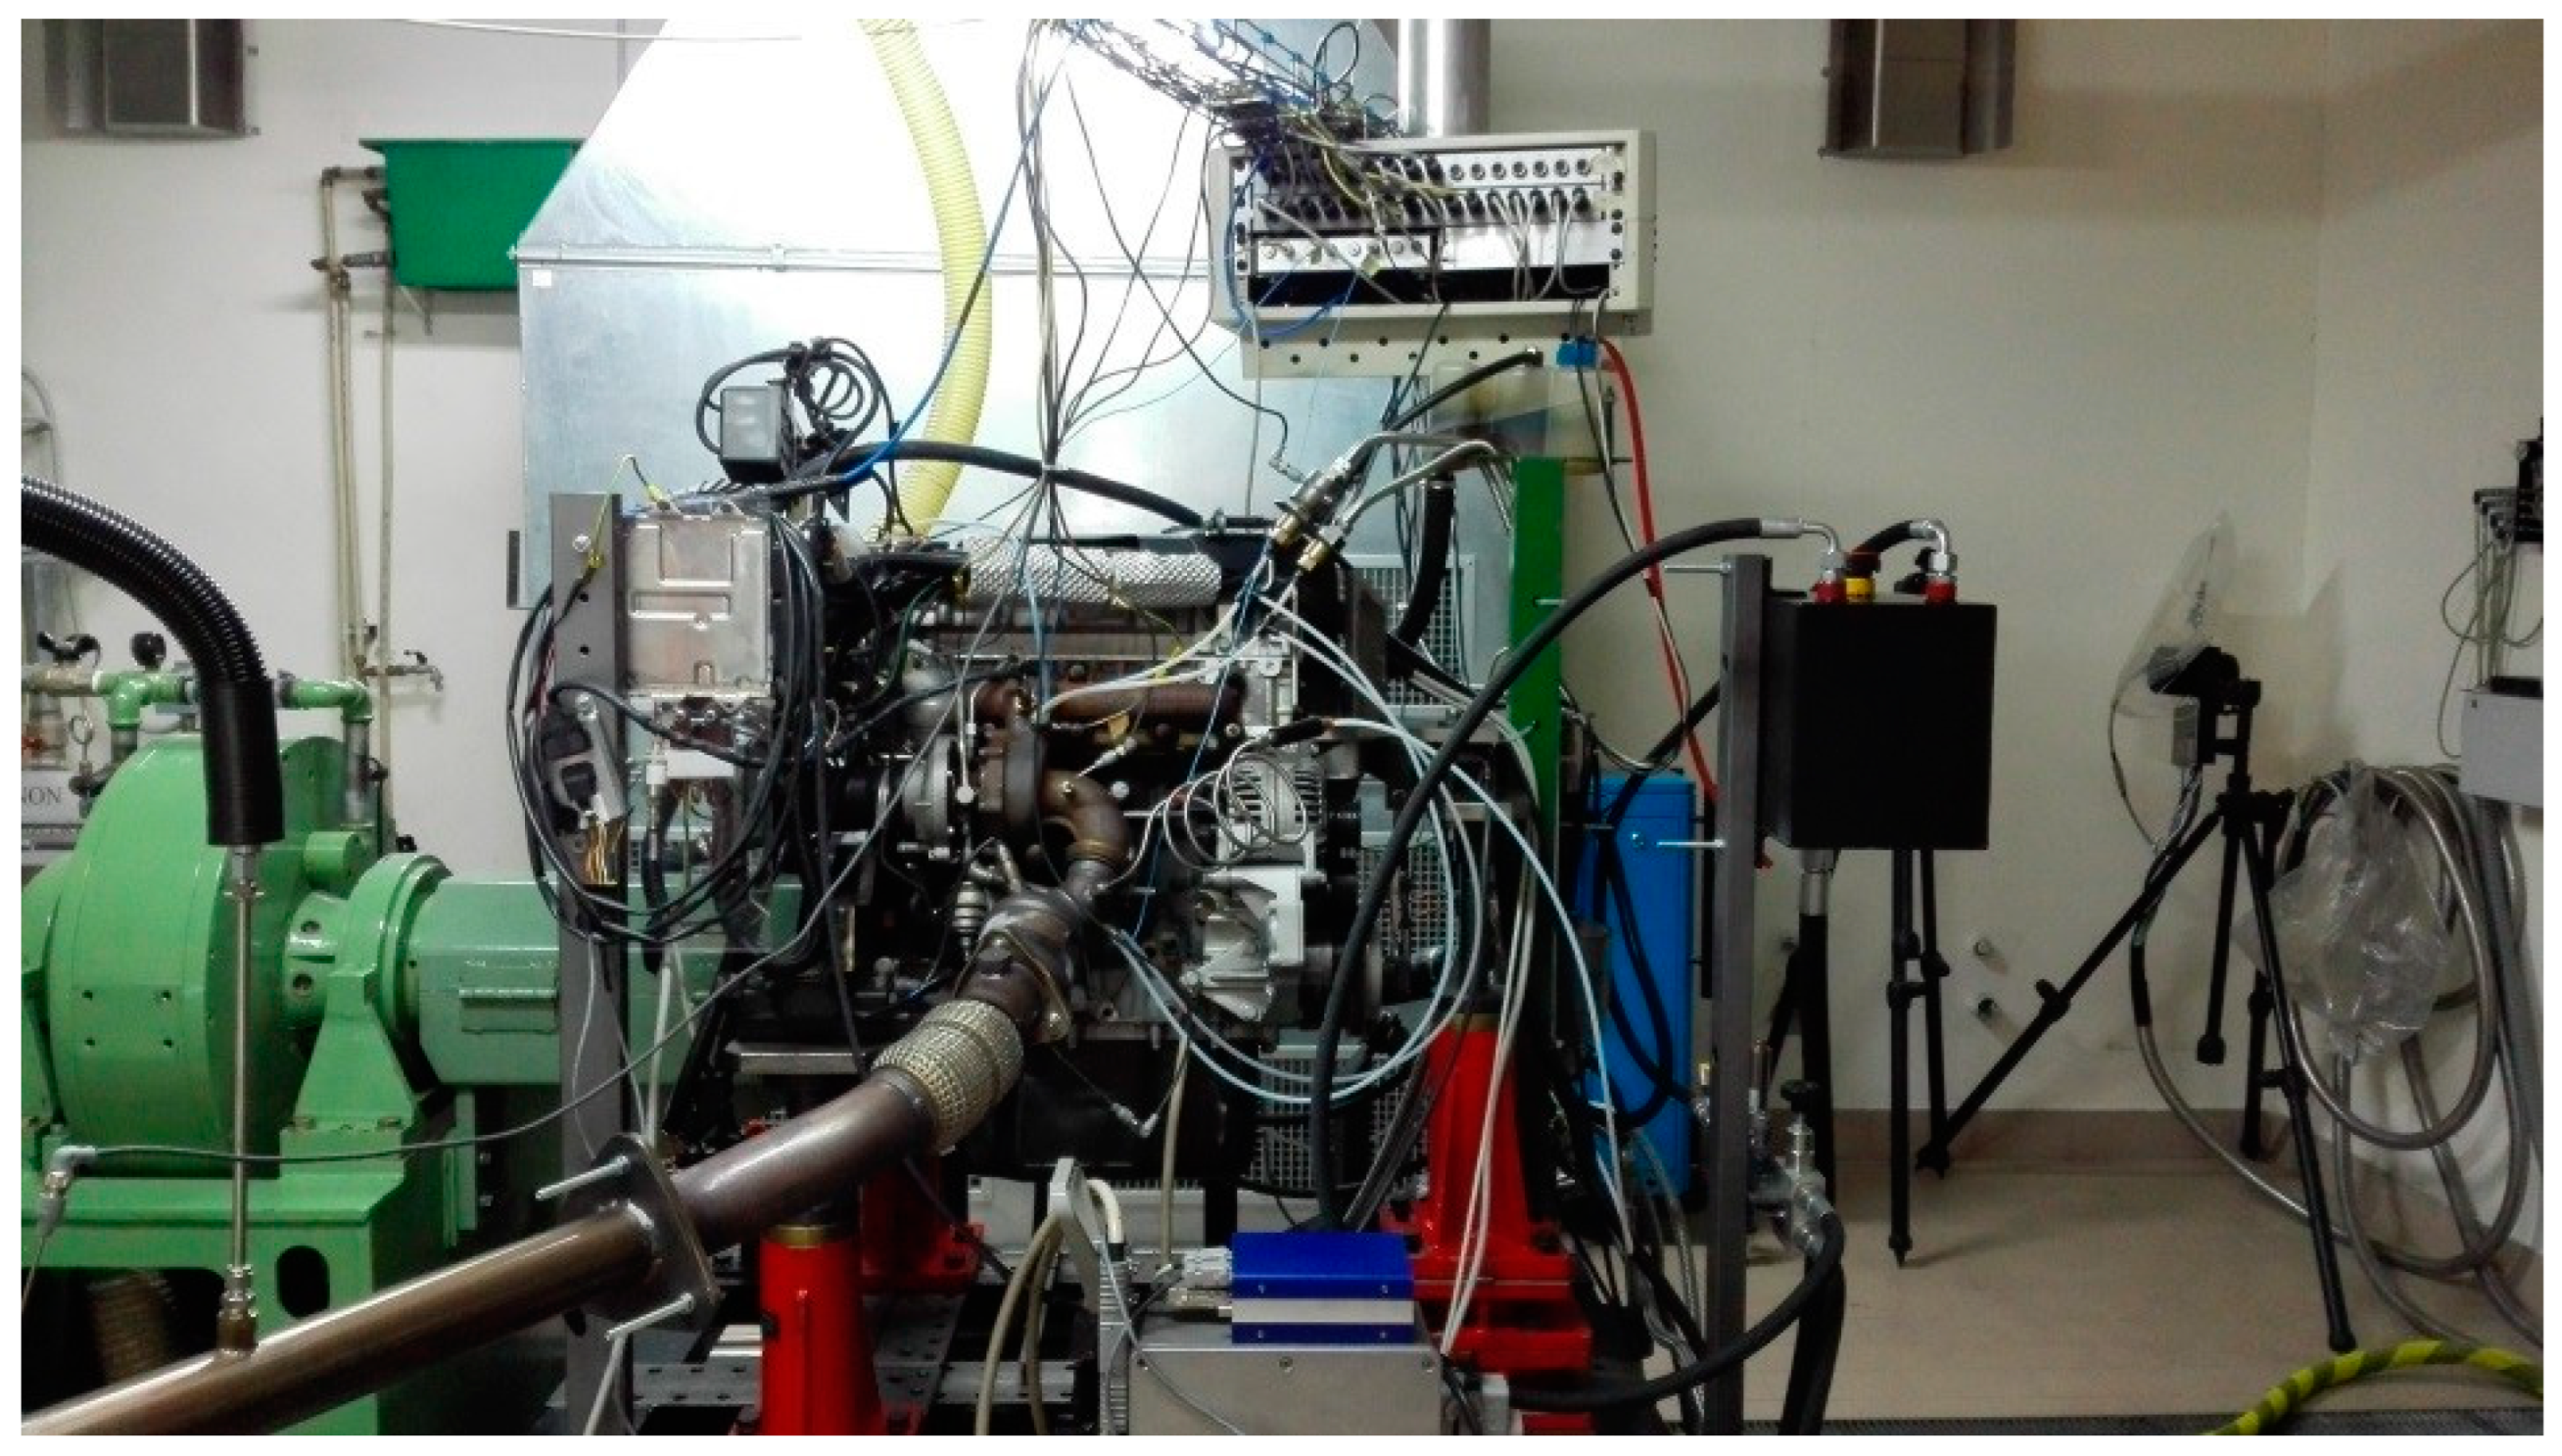
Figure 1. Engine test bed.
Energies 16 04071 g001
Figure 2. Schematic representation of the experimental layout and sensors.
Energies 16 04071 g002
Figure 3. CDPF in the reactor used in the experimental campaign (a,b) and the filter assembly in the exhaust pipe (c).
Energies 16 04071 g003
Figure 4. SEM images at different magnitudes (a), 94 X; (b), 16.81 X; (c), 56.94 X of the catalytic filter after the soot deposition stage and with a soot load of 5 g/L.
Energies 16 04071 g004
Figure 5. Fitting of the curve representing the Raman spectrum of diesel soot with band identification.
Energies 16 04071 g005
Figure 6. SEM images of the 30 %wt CuFe2O4 loaded monolith at various magnitudes: (a) 190 KX, (b) 965 KX, (c) 10.00 KX and (d) 25.09 KX.
Energies 16 04071 g006
Figure 7. H2-TPR profile of a SiC monolith loaded with 30 %wt of CuFe2O4.
Energies 16 04071 g007
Figure 8. Trend of pressure drop and temperature across the (a) CDPF and (b) DPF during the regeneration.
Energies 16 04071 g008
Figure 9. PSDs at the CDPF outlet for test case #1 during the accumulation (blue line) and just after the active regeneration ended (red line).
Energies 16 04071 g009
Figure 10. Comparison of outlet PSDs during accumulation for test cases #1 and #2 (left side) and for test cases #3 and #4 (right side).
Energies 16 04071 g010
Figure 11. PN removal efficiency of the CDPF for test cases #1 and #4.
Energies 16 04071 g011
Figure 12. PSDs during the evolution of the regeneration at the CDPF outlet, at the start-up of the regeneration (a), in the range of 200–450 s (b) and at the end (c).
Energies 16 04071 g012
Table 1. Raman bands and vibration modes reported for soot.
BandRaman Shift (cm−1)Vibration Mode [50]
G1602Ideal graphitic lattice (E2g-symmetry)
D11356Disordered graphitic lattice (graphene layer edges, A1g symmetry)
D31548Amorphous carbon (Gaussian line shape)
D41224Disordered graphitic lattice (A1g symmetry)
Disclaimer/Publisher’s Note: The statements, opinions and data contained in all publications are solely those of the individual author(s) and contributor(s) and not of MDPI and/or the editor(s). MDPI and/or the editor(s) disclaim responsibility for any injury to people or property resulting from any ideas, methods, instructions or products referred to in the content.