Article

An Analysis of the Effects of Renewable Energy Intermittency on the 2030 Korean Electricity Market

1
Department of Energy & Electrical Engineering, Tech University of Korea (TUK), Siheung-si 15073, Republic of Korea
2
Power Systems Engineering Center, National Renewable Energy Laboratory (NREL), Golden, CO 15013, USA
*
Authors to whom correspondence should be addressed.
Energies 2023, 16(10), 4189; https://doi.org/10.3390/en16104189
Submission received: 30 March 2023 / Revised: 14 May 2023 / Accepted: 16 May 2023 / Published: 18 May 2023
(This article belongs to the Section F5: Artificial Intelligence and Smart Energy)

Abstract

:
Republic of Korea has unique geographical characteristics similar to those of an island, resulting in an isolated power system. For this reason, securing sufficient operating reserves for the system’s stability and reliability in the face of the intermittency of increasing variable renewable energy (VRE) is paramount, and this will pave the way to achieving the nation’s decarbonization target and carbon neutrality. However, the current reserve-operation method in Republic of Korea does not take into account energy-system conditions, such as the intermittency of the VRE. Therefore, this paper presents an analysis of the impact of changes in reserve-operation methods on the electricity market in the future Republic of Korean power system, with the increased levels of VRE that are currently envisioned. Specifically, three reserve-operation methods, including Korea’s current reserve-power-operation standards, were applied to the two power-system plans announced by the Korean government to analyze the annual generator operation and costs. The analysis results show that securing reserves proportional to the VRE would exert negative effects, such as increased power-generation costs and the curtailment of nuclear and VRE generation. These results can contribute to the estimation of operational reserves needed for high levels of VRE and to the design of new the Korean reserve market, to be introduced in 2025.

1. Introduction

In order to respond to the abnormal global climate, the Paris Agreement was adopted in 2015, and countries have set their own greenhouse-gas-reduction targets and started to undertake efforts to meet them [1].
With the exception of China and India, most countries have declared the aim of reaching carbon neutrality by 2050 and are exploring various measures to reduce carbon emissions. In particular, the production of forms of variable renewable energy (VRE), such as solar and wind power, are considered the key to achieving carbon neutrality. However, the power generation of VRE is difficult to predict with high accuracy due to various factors, such as weather and temperature [2]. Due to their intermittency, increases in VREs can have a negative impact on system stability, necessitating measures to stabilize future power systems [3].
Many countries are enhancing their energy-system flexibility through reserve capacity to address the intermittency of VRE. Nord Pool, with a focus on the Nordic region, where the share of renewable energy generation is high, separates upward and downward reserves to enhance system flexibility [4]. Furthermore, in the United States, MISO utilizes a ramp-capacity product that provides market-based incentives to generators contributing to demand response [5]. Germany aims to optimize operational efficiency by transitioning from hourly to 15-min market scheduling, seeking a reduction in reserve capacity against an increasing level of VRE generation [6].
The increase in VRE is a major measure for achieving carbon neutrality in Republic of Korea. The Republic of Korea’s Enhanced Update of its First Nationally Determined Contribution (the Enhanced NDC), announced in 2019. and the 10th Basic Plan for Long-Term Electricity Supply and Demand (10th Basic Plan), take into account factors such as community and system acceptance. While they differ in the proportion of nuclear power and renewable energy generation, both plans envision a significant increase in VRE as a major measure for carbon neutrality [7,8]. In response to the increase in VRE generation, plans are undergoing development and implementation to introduce energy-storage systems (ESS) and establish a digital operational system capable of real-time control [8]. Furthermore, research is being conducted on the potential of gas-fired power generation in the future electricity market and the economic viability of pumped-storage hydroelectricity as a means to address the VRE intermittency. These studies focus on the power-generation sources expected to play a key role in the future electricity market [9,10]. However, these studies have limitations in terms of market operation, as they focus on specific power-generation sources. The power market in Republic of Korea has its own unique characteristics compared to the other countries. Due to the existence of North Korea, Republic of Korea has unique geographical characteristics, similar to those of islands, making it difficult to establish interconnections with other utilities, unlike the United States and European countries. These geographical characteristics make Republic of Korea’s power system isolated, increasing its vulnerability to the intermittency of VRE and, thus, increasing the importance of its reserve capacity. As the share of carbon-free energy sources, mostly VREs in this context, increases in the overall generation mix, the relative generation capacity of fossil-fuel power plants, which currently provide reserve capacity, decreases. This makes it more challenging to secure operating reserves. In particular, the renewable-energy-generation capacity in Republic of Korea more than doubled between 2017 and 2021. As the share of renewable energy rapidly increases, the probability of encountering system issues related to securing downward reserves, such as the curtailment for VRE, also increases. As a result, there is an increasing need to improve the efficiency of reserve operations.
For these reasons, Republic of Korea needs to ensure an adequate operating reserve and to enhance its energy system’s reliability through enhanced market operation. The current method for securing a constant operating reserve based on the Korean Electricity Market Operation Rules (KEMOR) does not consider the upcoming changes in the system, making it challenging to address the intermittency of VRE [11]. Therefore, this paper studies the future Korean electricity market, as projected for 2030, assuming a high level of VRE, which is a critical intermediate step towards carbon neutrality. It compares the existing reserve-operation method, which does not consider the energy system’s condition, with a hypothetical operational method, which secures additional reserves proportional to VRE generation to address its intermittency. Based on the market model built for the future Korean power system, this paper analyzes the impact of these methods on the market from operational and cost perspectives and provides insights for the future direction of the market’s operation, in which reserve capacity will be increasingly important.
This paper consists of four sections. Section 2 describes the Korean electricity market and the intermittency of VRE. Section 3 presents scenario configurations and a model with additional constraints in a typical UC problem, and discusses the results. Finally, Section 4 presents the research conclusions.

2. Background

2.1. Policy of Korea

Carbon neutrality is becoming a necessity, not an option, due to the abnormal global climate. The Korean government is also implementing various policies to reduce carbon emissions.
The Enhanced NDC and 10th Basic Plan recently announced by the Korean government aim to reduce greenhouse-gas emissions by 44.4% by 2030 compared to the levels recorded in 2018. To achieve carbon-emission-reduction targets, the Enhanced NDC emphasizes renewable energy, which is a variable power source, while the 10th Basic Plan emphasizes nuclear power, which is a rigid power source. Both resources are important energy sources for reducing carbon emissions. However, the increase in VRE generation creates the need to operate the energy system in order to respond to intermittency. Nuclear power generators in Republic of Korea are optimized for 100% power output, and their flexible operation is difficult due to the challenges of output adjustment. For these reasons, if nuclear power generators operate at full capacity during low-demand seasons, such as spring and fall, in Republic of Korea, it may not be possible to secure sufficient operating reserves to cope with the intermittency of VRE, which can lead to problems in system operation.
So far, the generation of VRE in Republic of Korea has not been sufficiently large to undermine the system’s reliability. However, if VRE generation gradually increases due to the aim of carbon neutrality in the future, the method of securing constant operating reserves in Republic of Korea may exacerbate system-operation issues.

2.2. Intermittency and Curtailment of VRE

2.2.1. Intermittency of VRE

Solar and wind power are categorized as forms of variable renewable energy (VRE) due to their inherent intermittency. Intermittency includes uncertainty, which involves difficulties in forming predictions, and variability, in which power-generation output fluctuates quickly and significantly. Figure 1 shows the uncertainty and variability of VRE [12]. The difference between the predicted and actual power-generation output of wind-power generation represents the uncertainty of VRE. Furthermore, the fluctuation of actual output in wind-power generation represents variability.
Increasing VRE is a very effective way to achieve the carbon-emission-reduction target. However, various issues caused by intermittency, as explained earlier, need to be considered. As the generation capacity of VRE increases, several issues arise due to the prediction error and rapid output variation, including an increase in operating-reserve requirements and backup-generation costs, the duck-curve problem of demand, and a reduction in the ability to maintain ancillary services, such as voltage and frequency control, due to limited output regulation [3].
The point at which the net load decreases can be seen as the point at which the amount of renewable energy generated reaches its maximum. To cope with the system issues caused by the intermittency of VRE and maintain the energy system’s stability, an additional operating reserve is required as the amount of renewable energy generated increases. However, there may be problems, such as additional costs and the failure to secure an operating reserve, due to the operational constraints of power generators, whose output can fluctuate.
In addition, the current operating-reserve standards in Korea are based on the KEMOR, as shown in Table 1. The rule specify that a constant operating reserve must always be secured without considering the intermittency of VRE. If these rules are applied in the future power market, problems may arise.

2.2.2. Response to Intermittency

The problem caused by intermittent renewable energy is faced not only by Republic of Korea, but also by major countries. Germany, Denmark, and CAISO in the United States are making efforts to increase the flexibility of fossil fuel generators and increase the accuracy with which VRE generation is predicted [13]. These efforts involve responses to the uncertainty caused by the rapid changes in VRE generation and by the accurate prediction of VRE generation, respectively. In addition, the formation of links between neighboring countries or neighboring utilities within countries is underway to resolve transmission congestion, improve system reliability, and solve renewable oversupply with low costs.
Republic of Korea is responding to the problems caused by the intermittency of VRE through the curtailment of VRE generation on Jeju Island [14]. However, the curtailment of VRE generation involves forcibly stopping power generation without compensation, leading to damages to VRE-generation businesses. Moreover, as Republic of Korea features geographic problems that pose challenges to the electricity market and the formation of systemic links with neighboring countries, as well as a high proportion of nuclear power, which has limited ability to provide ancillary services, it is necessary to seek realistic solutions for Republic of Korea’s situation.

3. 2030 Electricity Market Analysis Model

3.1. Annual Market Analysis Model

3.1.1. Overview of Annual Market Analysis Model

In the previous section, we confirmed that the comparison of various Korean policies and the increase in VRE could result in a lack of operating reserve due to the duck-curve problem, in which the net load in the energy system rapidly decreases at a specific point. Increasing the use of VRE is an important step towards achieving greenhouse gas emission targets, but it requires long-term planning to anticipate and address potential issues. In this paper, we conducted modeling similar to the actual electricity market to analyze how VRE affects the electricity market through changes in the method of securing reserve power in response to its intermittency.
To simulate the actual electricity market, we used unit commitment (UC) problems, which determine the on/off status of generators. The UC problem is formulated using binary decision variables in a mixed integer programming (MIP) framework. The non-linear characteristics of the MIP formulation can either result in the computation of only a local optimal solution or the requirement of a significant amount of time to find the global optimal solution [15]. To reduce the computational time created by the UC problem, we performed an annual analysis by repeating weekly operations for 52 weeks and used the method of linear programming relaxation to convert binary decision variables into variables between 0 and 1. In [16], this approach was used to find a similar optimal solution to the MIP formula with an error of 0.06% at a rate that was approximately 15 times faster after removing the binary decision variables.
In this section, we explain additional system constraints created by VRE, in addition to the linearly relaxed UC problems for generators used in [16].

3.1.2. Linear Programing (LP) Relaxation Model

Equation (1) is the objective function for this study. The objective function minimizes the annual power-generation cost derived from the hourly power generations of generator g at time t , P g , t , and the generation cost C g .
minimize   t T ( g G P g , t C g )   where   C g = C g f u e l + C E T S F g e g G ,   t T
As in Equation (1), C g is modeled as the sum of the fuel cost C g f u e l and the environmental cost C E T S F g e . To reduce the computation burden, the fuel cost for each generator is linearized considering the no-load cost, based on the KEMOR [11], and the fuel cost, depending on the generator type. Figure 2 depicts the cost function of a coal power generator used in this study and its linearization. As illustrated, the quadratic function is relaxed based on the generator’s maximum cost and output in order to make the objective function more tractable, which in turn improves the computational efficiency. If the quadratic power-generation cost function is applied to all generators in 2030, the simulation process will take a significant amount of time. Therefore, in this paper, it is applied with relaxation, as shown in the graph of the linear power-generation cost function in Figure 2. The maximum generation cost was calculated from the quadratic power-generation cost function, and then divided by the maximum output to obtain the cost in MW. The cost derived in this way was used as the slope to create a linear cost function. At this point, the no-load cost was also simplified and applied to the linear equation in the relaxation process. The generator start-up cost is ignored in the model because its impact on the cost is insignificant.
The environmental cost is expressed as C E T S F g e , where C E T S is the carbon-emission trading price and F g e is the carbon-emission factor of power generator g . The environmental cost discourages coal power generation. Since the method for regulating the generation of coal power within the carbon-emission-reduction policy for 2030 is yet to be decided, we assume a 100% paid allocation for certified emission reductions. We use a method to constrain the annual coal power generation by varying the carbon-emission trading price to achieve the 2030 carbon-emission target announced in the Enhanced NDC and the 10th Basic Plan [8]. As a result, the carbon-emission trading price increase implies more environmental costs for coal power generators with high emission factors and, thus, leads to a decrease in coal power generation, discouraging the carbon emissions.
As this work employs the general constraints of a typical UC problem, such as supply and demand constraints and generator start-up and stop constraints, they are not explained. Interested readers are referred to [17]. Here, the focus is on the constraints related to the generation reserve, the key focus of this work. The constraints of interest in this paper are listed as follows.
G F R t g G G F g , t u p + h H E h , t g f u p , g G ,   h H ,   t T
G F R t g G G F g , t d w + h H E h , t g f d w + R E N t g f d w , g G ,   h H ,   t T
A G C R t g G A G C g , t u p + h H E h , t a g c u p , g G ,   h H ,   t T
A G C R t g G A G C g , t d w + h H E h , t a g c d w + R E N t a g c d w , g G ,   h H ,   t T
G F g , t u p P g max G F g r a t e u g , t , g G ,   t T
G F g , t d w P g max G F g r a t e u g , t , g G ,   t T
A G C g , t u p R U g A G C g t i m e u g , t , g G ,   t T
A G C g , t d w R D g A G C g t i m e u g , t , g G ,   t T
Q S g , t u p R U g Q S g t i m e u g , t , g G ,   t T
P g , t + G F g , t u p + A G C g , t u p + Q S g , t u p P g max u g , t , g G ,   t T
P g , t ( G F g , t d w + A G C g , t d w ) P g min u g , t , g G ,   t T
E h , t d c h + E h , t g f u p + E h , t a g c u p + E h , t q sup E h , t d c h , max u h , t d c h , h H ,   t T
E h , t d c h ( E h , t g f d w + E h , t a gcd w ) E h , t d c h , min u h , t d c h , h H ,   t T
E h , t g f u p + E h , t a gc u p + E h , t q s u p E R F h W L h , t , h H ,   t T
E h , t g f u p E h g f , max u h , t d c h , h H ,   t T
E h , t g f d w E h g f , max u h , t d c h , h H ,   t T
R E N t g f d w + R E N t a gcd w + R E N t c u r t R E N t , t T
R E N t g f d w R F g f d w G F R t , t T
R E N t a g c d w R F a g c d w A G C R t , t T
G F R t G F R b + ( R E N t R E N t c u r t ) G F F r e n , t T
A G C R t A G C R b + ( R E N t R E N t c u r t ) A G C F r e n , t T
Q S R t Q S R b + ( R E N t R E N t c u r t ) Q S F r e n , t T
G G = t T ( g G P g , t F g e ) G G t arg e t , g G ,   t T
Equations (2)–(15) represent the constraints related to reserves in a typical UC problem. In this model, G F R t , A G C R t and Q S R t are similar to the primary, secondary, and tertiary reserves, respectively, secured on an hourly basis. Equations (2)–(5) separate the upward and downward reserves for GF and AGC. The H represents a set of pumped hydro storage (PHS) units, G F g , t u p and A G C g , t u p represent the upward reserve of general generators, and E h , t g f u p and E h , t a g c u p represent the upward reserve of the PHS units. The upward reserve is considered only for conventional generators, i.e., all except VREs and PHS units. However, this model assumes that VREs can participate in the downward reserve through curtailment, and R E N t g f d w and R E N t a g c d w represent the primary and secondary downward reserve of a VRE, respectively. Equations (6)–(10) represent the constraints on each reserve type. Equations (6) and (7) heuristically assume that only a certain proportion G F g r a t e of the maximum generation capacity can be secured for G F g , t u p and G F g , t d w , which prevents a small number of generators from securing excessive reserve. Equations (8)–(10) constrain the reserve of each generator to be secured during the response time A G C t i m e , Q S t i m e defined in the KEMOR, such as A G C g , t u p , A G C g , t d w and Q S g , t u p , through the ramp-up R U g and ramp-down R D g of each generator’s output. Separating the upward and downward reserves allows more flexible operations, as shown in Equations (11) and (12). The P g max is only affected by the upward reserve and P g min is only affected by the downward reserve. The same benefit is derived from the maximum/minimum generation of PHS E h d c h , max / E h d c h , min , as shown in (13) and (14). Equations (15)–(17) constrain the reserve that can be secured based on the upper reservoir water level for PHS, and the maximum amount of primary reserve that can be secured for E h , t g f u p and E h , t g f d w . In this model, Equations (15) and (16) are used to heuristically assume that PHS can secure reserve to a certain proportion E R F h of the current upper reservoir water level W h , t to reflect actual operation. Furthermore, PHS also has high ramp-up/down capabilities. Therefore, E h , t g f u p and E h , t g f d w , which need to respond quickly, are constrained by setting the maximum amount E h g f , max . The generation-state-decision variables u g , t and u h , t d c h used in Equations (6)–(17) are binary decision variables in MIP, but they are relaxed as real numbers between 0 and 1 in this model. Equations (18)–(20) constrain the reserve of renewable energy sources such that the sum of securing reserves R E N t g f d w , R E N t a g c d w , and curtailment R E N t c u r t cannot exceed R E N t . Furthermore, to prevent renewable energy from excessively securing downward reserves, the factors R F g f d w and R F a g c d w are used to limit the downward-reserve amount of renewable energy. Finally, Equations (21)–(23) represent constraints on the hourly required reserve. Typically, the reserve is secured at a constant amount per hour. The G F R b , A G C R b , and Q S R b are the reserve requirements currently specified in the KEMOR [11]. However, in this model, we assume that an additional reserve is required to account for the VRE intermittency, in addition to the G F R b , A G C R b , and Q S R b . The additional reserve is set to be proportional to the VRE generation, i.e., it is calculated based on the expected hourly VRE generation R E N t and the hourly VRE curtailment R E N t c u r t , calculated from the actual generation. Finally, the additional reserve is calculated by multiplying the actual power generation by the additional reserve’s requirement factors G F F r e n , A G C F r e n , and Q S F r e n per unit of VRE power generation to be obtained for each reserve. Equation (24) represents the annual total greenhouse-gas emissions, G G , by considering the amount of power generated and the emission factor; the G G calculated must be less than the target carbon emission, G G t arg e t .

3.1.3. Scenario for Addressing the Intermittency of VRE

This paper aims to investigate the effects of the additional reserve and the participation of renewable energy in securing the downward reserve as a means of coping with the intermittency of renewable energy sources, within the operation of the electricity market, to achieve greenhouse-gas-reduction targets. Therefore, the following scenarios were constructed to conduct an analysis of the annual electricity-market impact.
  • Scenario A: Securing of constant operating reserve by time (applying current the Korean electricity market’s operation rules).
  • Scenario B: Changes in operating reserve secured by time for responding to intermittency of VRE (securing of additional operating reserve in proportion to VRE power generation).
  • Scenario C: Changes in operating reserve secured by time for responding to intermittency of VRE + separation of upward and downward reserve + participation in securing of VRE downward reserve.
Scenario A is modeled based on the current operating-reserve rules of the current KEMOR, in which a constant operating reserve is secured regardless of the system’s condition, and it is simulated using the analytical framework described above, with the additional consideration of Equations (25)–(29).
G F g , t u p = G F g , t d w , g G ,   t T
A G C g , t u p = A G C g , t d w , g G ,   t T
E h , t g f u p = E h , t g f d w , h H ,   t T
E h , t a g c u p = E h , t a g c d w , h H ,   t T
R F g f d w = R F a g c d w = G F F r e n = A G C F r e n = Q S F r e n = 0 ,
According to the current KEMOR, the upward and downward reserves are not secured separately, so the generators always secure both upward and downward reserves at same time, as shown in Equations (25)–(28). In addition, the current reserve rules do not consider the intermittency of renewable energy and always secure a constant operating reserve by time. Therefore, the reserve factors related to renewable energy, such as R F g f d w , R F a g c d w , G F F r e n , A G C F r e n , and Q S F r e n , in Equation (29) all have values of zero.
The operating reserve required according to the current KEMOR can be found in Table 1. This is the operating reserve required for Scenario A. The primary reserve G F R b is 1000 MW and the tertiary reserve Q S b is 1400 MW. For the secondary reserve, which corresponds to the, both the secondary reserve of 1400 MW and the frequency-regulation reserve of 700 MW are considered together.
In Scenario B, additional operating-reserve proportional to the VRE power generation is secured in order to respond to the intermittency of renewable energy. This operating reserve is secured in addition to the current reserve requirements under the KEMOR.
R F g f d w = R F a g c d w = 0 .
Therefore, as in Scenario A, Equations (25)–(28) are applied, but only factors R F g f d w and R F a g c d w , which are related to the downward-reserve constraints of renewable energy, have zero values, as in Equation (30). Unlike Equation (29), the factors for securing additional reserve, G F F r e n and A G C F r e n , can ensure reliability rates of approximately 99.7% and 95.4%, respectively, using 0.07116 and 0.11992 as the standard deviations of the 1-min and 10-min variability of renewable energy, respectively [18]. The Q S F r e n uses an error of approximately 3.67% based on the maximum error from CAISO between January 2017 and March 2019, taking into account the solar- and wind-power capacity [18]. The G F F r e n and A G C F r e n vary in real time due to various factors, such as the output range of renewable energy, weather, and temperature. However, in this paper, they are linearized based on the variability at 25 GW of output and applied.
Scenario C involves the participation of renewable energy in the securing of downward reserves, along with the separation of upward and downward reserves in Scenario B. Equations (25)–(30), applied in the previous scenarios, are not applied in this case, and additional reserve-securing factors are used, as in Scenario B. To prevent the excessive securing of downward reserves by renewable energy, it is assumed that only 50% of the real-time reserve requirement is secured. Accordingly, the values of R F g f d w and R F a g c d w are assumed to be 0.5.
To compare Scenarios A, B, and C, Scenario 1 was constructed based on the 10th Basic Plan, which was announced for the 2030 market outlook. In addition, Scenario 2 was constructed based on the Enhanced NDC, which had a higher proportion of VRE generation before the 10th Basic Plan. The 10th Basic Plan and the Enhanced NDC differ in terms of their market details, so most of the input data, such as total demand and demand pattern, emission factor, market participating generator capacity, and VRE generation pattern, were based in Scenario 1’s 10th Basic Plan. Scenario 2 was constructed by changing only the proportion of nuclear and renewable energy generation, similar to the Enhanced NDC. Figure 3 shows the common annual demand and VRE-generation patterns in Scenario 1 and Scenario 2. First, the total annual demand is 550.3 TWh, with a peak of 99.8 GW in the winter season. The demand is higher in summer and winter than in spring and autumn due to cooling and heating, and the sudden drops in demand in winter and autumn are due to holidays such as the Lunar New Year and Chuseok. While the same generation pattern was used, Scenario 1 demonstrated a total of 128.1 TWh (VRE: 93.8 TWh) and Scenario 2 demonstrated a total of 182.4 TWh (VRE: 145.9 TWh) for the annual predicted renewable energy generation. In Scenario 2, the predicted renewable energy generation was approximately 55% higher than in Scenario 1.
The capacity of the facilities participating in the market was also applied uniformly to Scenario 1 and Scenario 2. Table 2 shows the power-generation capacities and proportions of major fuel sources. The capacity was applied uniformly, contrary, while the power generation ratio, by contrast was changed. This is because nuclear power generators are much more cost-effective than power generation based on fossil fuels, such as coal, LNG, and oil, and they generate almost fixed outputs, as base-load power generators, without carbon emissions. Therefore, to adjust the annual generation to decrease in Scenario 2 with the same capacity as in Scenario 1, the utilization factor of the nuclear power generators in Scenario 2 was adjusted to approximately 73% of that in Scenario 1.
Excluding the major fuel sources described above, other energy sources, such as biomass, fuel cells, IGCC, and marine, as well as non-carbon mixed fuels, such as ammonia and hydrogen, which are combusted with coal or LNG, were difficult to apply in the simulation, so it was assumed that they maintained a constant output during the simulation. Furthermore, in addition to fossil fuel generators such as coal, LNG, and oil, which have carbon emission factors for each generator in Equation (24), fuel cells and IGCC also contribute to carbon emissions. In this study, it is assumed that 25% of the total power generation for fuel cells uses gray hydrogen, based on the 1st Hydrogen Economy Implementation Plan in Republic of Korea. For IGCC, carbon emissions were calculated using an emission factor of approximately 66% of that of coal power generators. Calculated in this way, the target carbon emissions for 2030, G G t a r g e t should be below 149.9 MtCO2eq, which is the target emission in the Enhanced NDC. Furthermore, in the scenario notation, they are denoted as shown in Table 3, below, and the basic scenarios used for comparison are Scenario 1-A and Scenario 2-A.

3.2. Analysis of Scenario Results

In this section, the analysis results of the scenarios presented in Section 1 are described. In order to consider the simulation results for each scenario and the reasons behind them, an analysis of specific periods, such as when the renewable energy curtailment was the highest, were conducted.

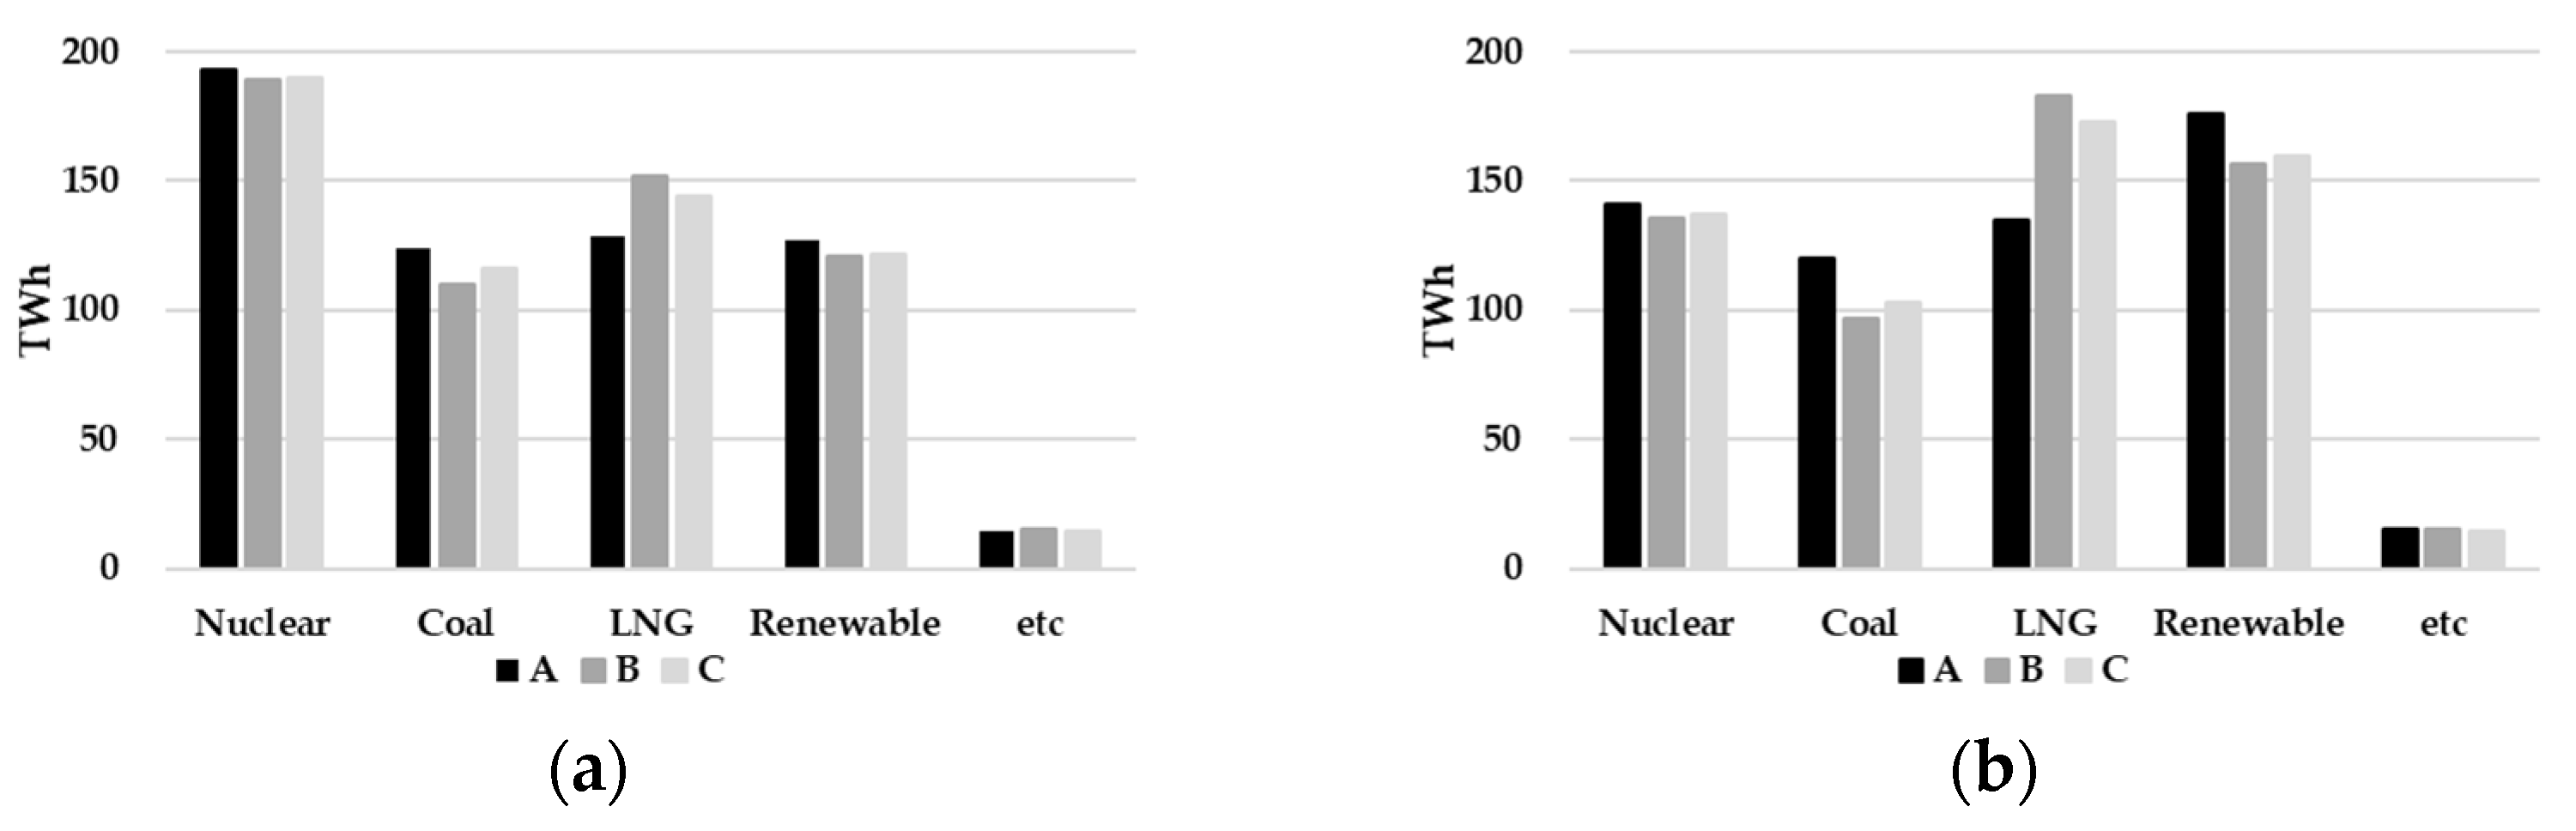
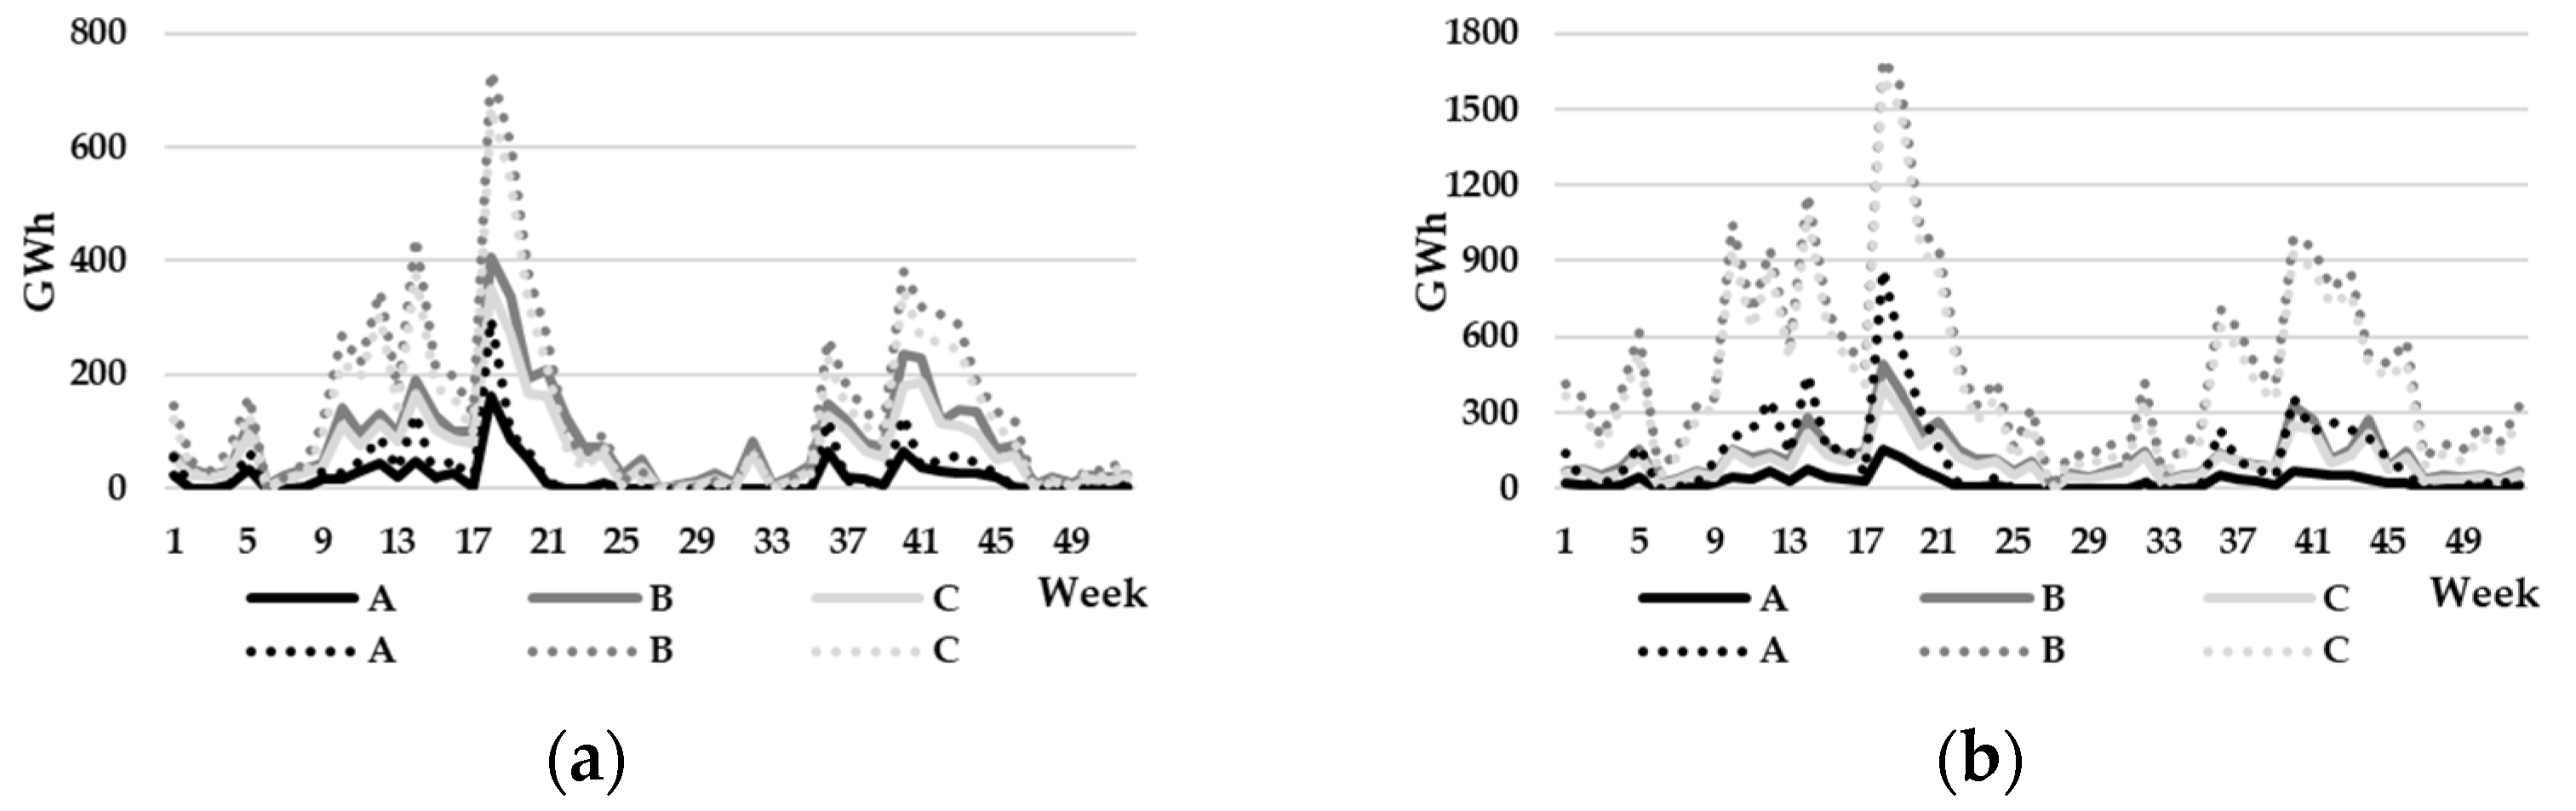
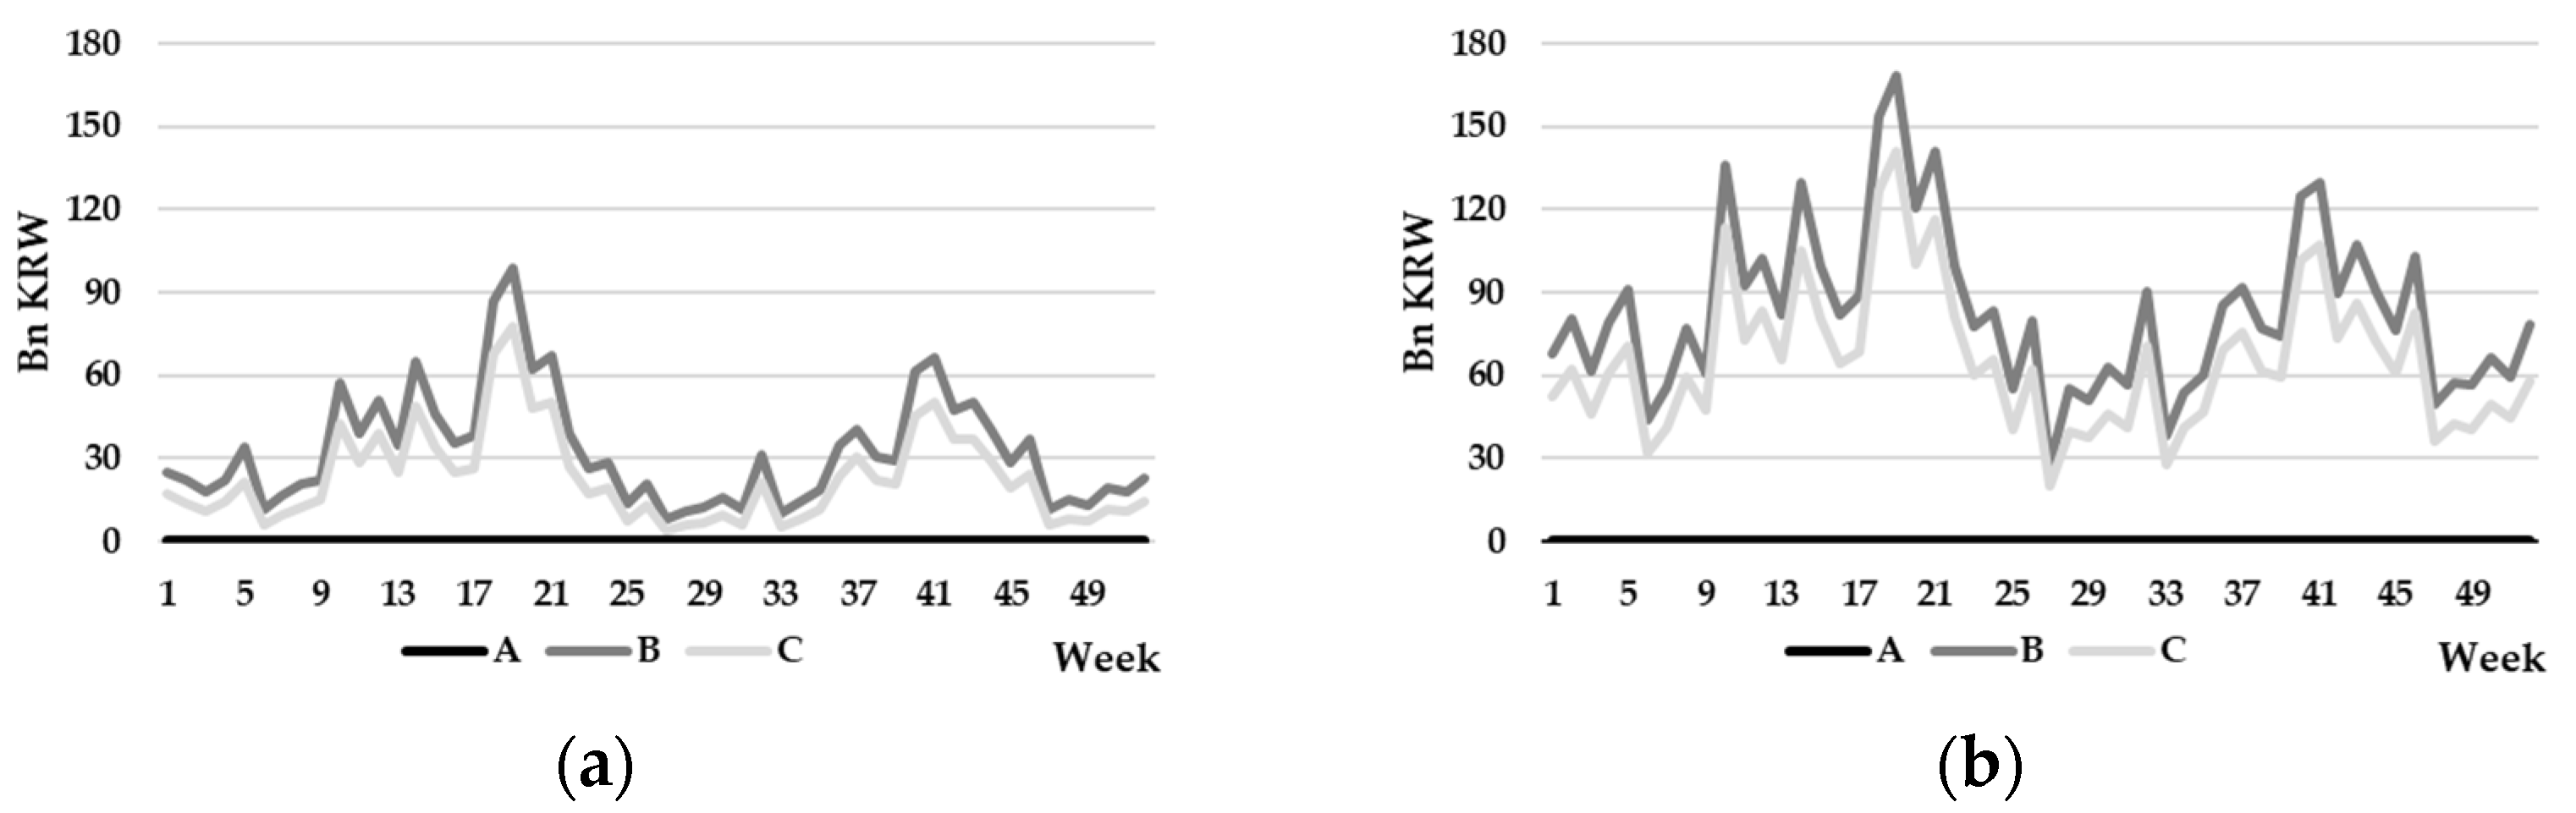
3.2.1. Annual Electricity-Market Operation

The first noticeable result in the annual electricity-market operation was the change in the amount generated by each power source. Figure 4 shows the annual generation amount by each power source for Scenario 1 and Scenario 2, according to the method of securing reserve power. In both Scenario 1 and Scenario 2, when additional reserve power is secured to cope with the intermittency of VRE, the amount of energy generated by nuclear, renewable-energy, and coal power generators decreased compared to the basic scenarios (Scenario 1-A and Scenario 2-A), while the amount generated by LNG power generators increased. Table 4 shows the increase or decrease rates of the major power sources compared to the basic scenario (Scenario 1-A and Scenario 2-A). In Scenario 1-B and Scenario 2-B, depending on the power sources, there was a maximum change of about 18% to 35% compared to the basic scenario.
The changes in the annual power-generation mix also affected the consumed-power-generation cost. Table 5 shows the carbon-emission trading price applied to environmental cost for achieving carbon-emission-reduction targets by scenario, as well as the average power-generation cost per MWh and the annual power-generation cost of major fossil-fuel power sources calculated accordingly. In the basic scenarios, Scenario 1-A and Scenario 2-A, there was little difference in terms of the cost, as the combined generation of nuclear and renewable energy, which have low generation costs, was approximately 4.3 TWh annually, with a difference of about 1.3%. However, if the reserve-power requirement increased due to the intermittency of VRE, the generation cost in Scenario 2 increased significantly. This is because in Scenario 2, which has a large amount of renewable energy generation, reserve power is secured by increasing the generation of LNG, which has high power-generation flexibility, but also high costs, in order to cope with intermittency. Furthermore, in order to increase the amount of LNG generated, the average generation cost of coal and LNG is increased by adding a higher carbon-emission trading price to the environmental costs, which also reduces the cost difference between the two power generators.
Figure 3, above, and Table 6, below, show the annual demand patterns of Scenario 1 and Scenario 2, the predicted renewable energy generation, and the reserve power requirements according to the renewable energy generation. The lowest point of the net load, which was previously expected to be problematic, occurred at the 18th week. At this time, the operating-reserve requirements increased by up to about 47% for Scenario 1 and by up to about 68% for Scenario 2 compared to the operating-reserve requirement in the current electricity-market operation rules, as shown in Table 6. The reason why Scenario 1-C and Scenario 2-C need more reserves than Scenario 1-B and Scenario 2-B is that the participation of renewable energy in downward reserves reduces the amount of renewable energy curtailment required to secure reserves. Scenarios B and C require much greater reserves than scenario A. The operating-reserve requirement in Scenario A does not adequately address the intermittency of VRE in the future Korean electricity market, compared to previous studies [18]. Scenarios B and C can secure an appropriate amount of operating reserves to address intermittency, but they may also intensify problems such as increased power-generation costs and the enhanced curtailment of nuclear and VRE generation. This is because the decrease in net load caused by the increase in VRE causes problems in the securing of reserves by reducing the generation of fossil-fuel-power generators, which are cost-disadvantageous. The decrease in generation of fossil-fuel-power generators in operation is unfavorable for securing a downward reserve. Moreover, reducing the number of operating fossil-fuel generators to secure downward reserve may cause problems in securing the upward reserve instead. Therefore, it is necessary to increase the fossil-fuel generation needed to secure the reserve through measures such as the curtailment of renewable energy generation and limiting the operation of nuclear power generators. Since the difficulty in adjusting the output of nuclear power generators can also affect the system, these issues must be carefully considered.
In Figure 3, it can be seen that the situation with the lowest net load occurs at week 18. Figure 5 shows the amount of limited nuclear power generation and curtailed renewable energy generation that can occur in such situations. On each graph, the amount of nuclear power reduction and the amount of renewable energy curtailment increase to secure the reserve in the 18th week, when the net load is lowered. The decrease in the power generated by nuclear power generators and in the renewable energy with low power-generation costs leads to an increase in fossil-fuel generation, which is expensive due to the nature of the electricity market, in which supply and demand must be the same.
The power-generation costs incurred over 52 weeks showed a pattern similar to that on the demand graph. This is a natural procedure in which the higher the demand, the higher the amount of energy generated by the generators. However, when the net load is low, the tighter the reserve constraint, the more additional costs are incurred. Figure 6 shows increasing power-generation costs compared to Scenario 1-A and Scenario 2-A. Figure 6 shows a pattern similar to Figure 5, described above. All of these patterns increased the most in the 18th week, when the net load decreased due to the high renewable energy generation.
Table 7 shows the annual SMP values by Scenario. The maximum value in Table 7, occurred when the net load was high, and it increased in proportion to the added environmental cost. The minimum value occurred when renewable energy curtailment took place, and it was reducible to zero by decreasing the amount of renewable energy curtailment. However, while the generation costs increased as the reserve constraints became stronger, the average SMP, by contrast, decreased as the constraints became stronger. The Average(ALL) refers to the average SMP value for all the points in time over the course of a year, while Average(CUT) represents the average SMP value excluding the points where the curtailment of renewable energy led to 0 KRW in costs. Both values decreased as the constraint became stronger. To analyze the causes of this phenomenon, it is necessary to consider the data on the proportion of power generated, nuclear power curtailment, and curtailed renewable energy together, and for a clearer analysis, it is necessary to analyze the data at the point at which the net load decreased.

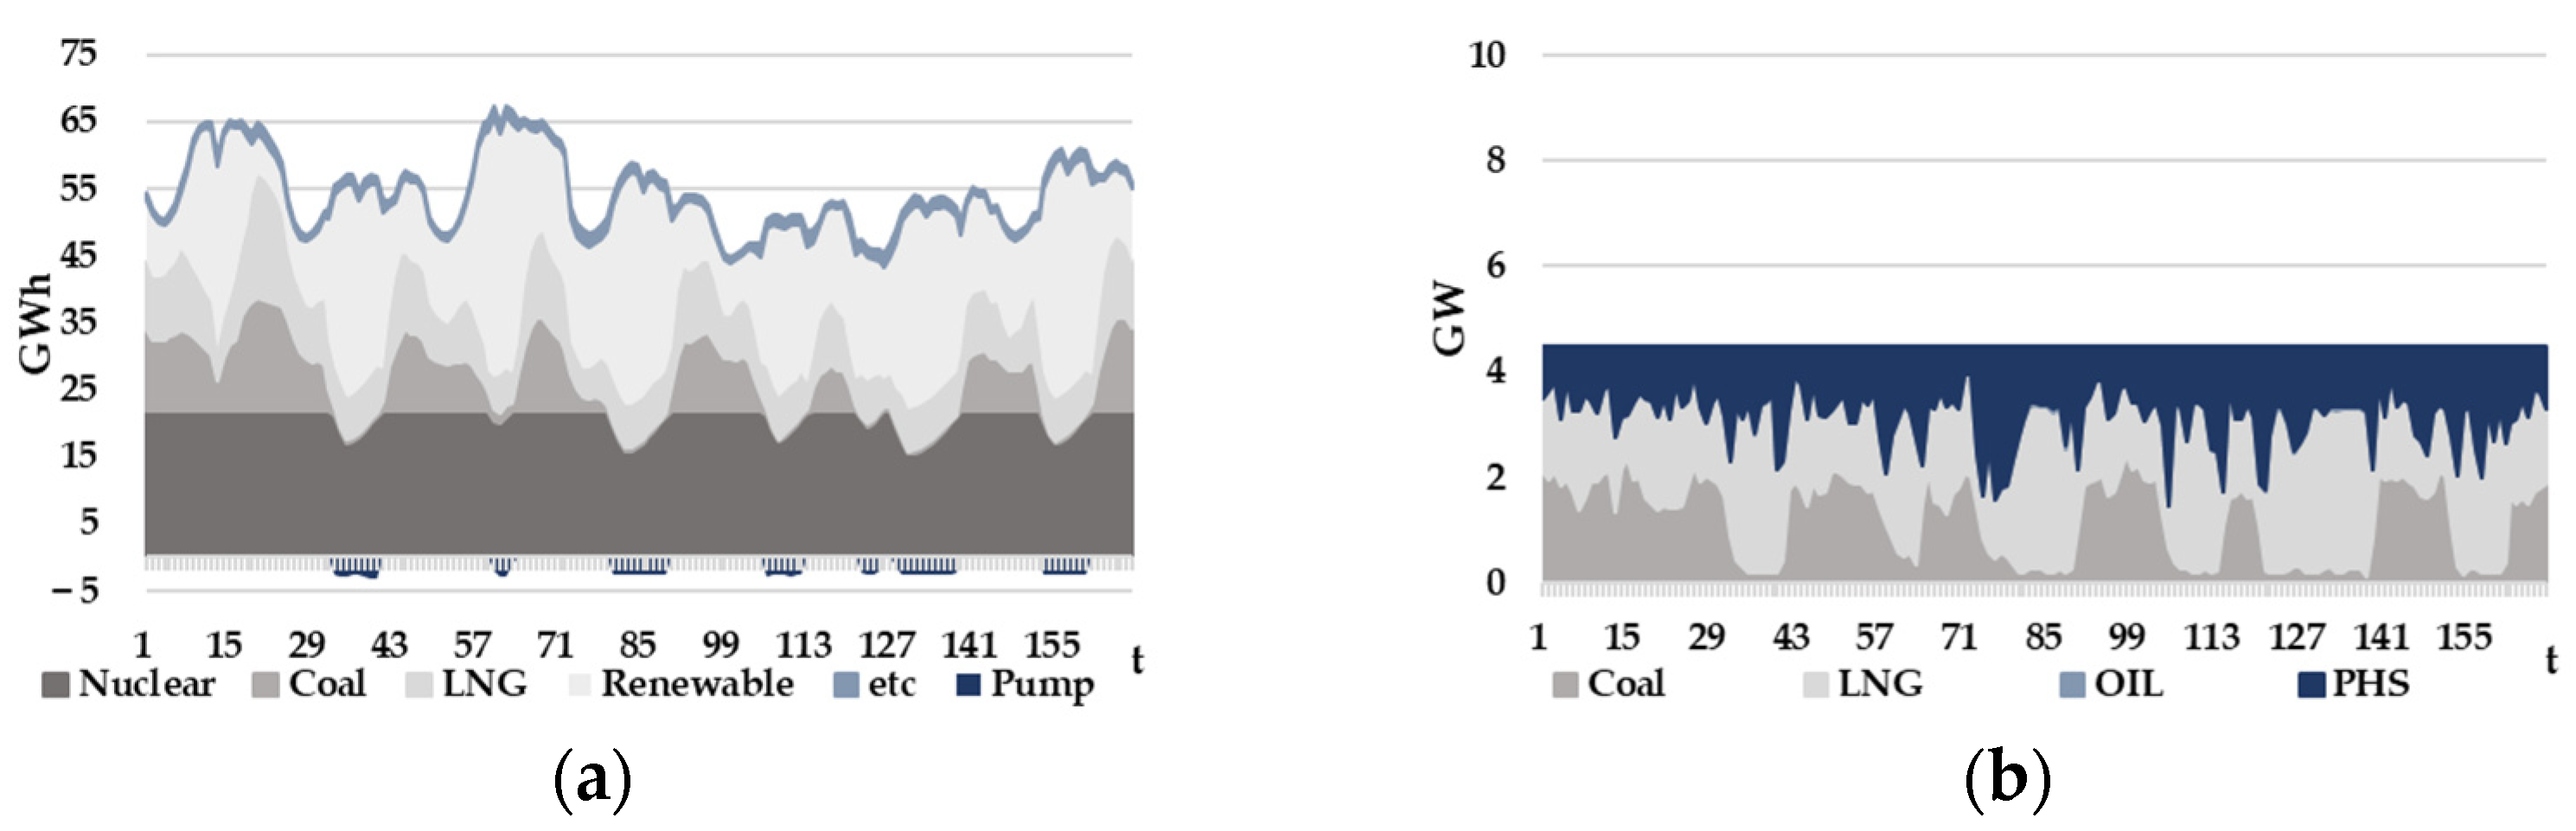
3.2.2. Analysis of Maximum Curtailment Time for VRE

The data for the 18th week, when each value reached its maximum, was analyzed to investigate the causes of the decrease in SMP due to the strengthening of the reserve constraints, along with the similarities in the patterns of limited nuclear power, renewable energy curtailment, and additional generation costs by week in the annual data. Figure 7 and Figure 8 show the cumulative power generation and the cumulative reserve by power source during a week in Scenario 1-A and Scenario 2-A. In the following figures, the variable t on the x-axis represents hours. In both scenarios, reserve power is secured consistently at all points in time according to current electricity-market-operation rules.
In Scenario 1-B and Scenario 2-B, the amount of LNG generated increased significantly compared to Scenario A, as additional reserves were required, depending on the amount of renewable energy generated. In Figure 9 and Figure 10, which show the cumulative power generation and the cumulative reserve for Scenario 1-B and Scenario 2-B, respectively, the changes in LNG generation and reserve-capacity proportion can be observed. As with the previous proportion of annual power generation, for securing operating-reserve capacity the generation of LNG, which has high flexibility and with which it is easy to secure reserve capacity, increased.
Figure 11 and Figure 12 show the cumulative power generation and cumulative reserve for Scenario 1-C and Scenario 2-C. Although it was small, there was a separation between the upward and downward reserves, and as the renewable energy secured about 50% of the downward reserve, the flexibility in response to the reserve constraints increased. Compared to Scenario 1-B and Scenario 2-B, the proportion of the reserve for coal generation increases. The correlation between the power generation and the reserve was related to the decrease in the average SMP value as the reserve constraint became stronger.
Table 8, below, shows the average SMP and weekly generation costs for each scenario during week 18, which is the week with the maximum nuclear curtailment and maximum renewable energy curtailment. Table 9 and Table 10 show the generation data for coal and LNG for the same period. When checking the average SMP for the week, it was seen that the average SMP for Scenario 1 and Scenario 2 decreased compared to Scenario A in both Scenario B and Scenario C. This was because, as shown in Table 10, the reserve requirement for each time period increased in Scenarios B and C, resulting in an increase in the minimum output-boundary operation for securing the reserve of LNG power generators. As the power generators operating at the minimum output boundary to secure the reserve were excluded from the determination of the market-clearing prices, the average SMP decreased as the reserve constraint became stronger. In Scenario C, the participation in the downward reserve of the renewable energy alleviated the reserve constraint, which also ameliorated the problem compared to Scenario B. The results of this weekly analysis can be expanded and interpreted as an annual analysis. As in the weekly analysis, the annual results also show that increases in renewable energy can lead to intermittency, and that backup fossil-fuel power generators become more important in handling the resulting increase in demand for reserve, as shown in Table 4. This can lead to an increase in nuclear-power-generator-output limits and renewable energy curtailment.
However, in this study, the UC problem was modeled using linear relaxation, so, as shown in Table 9 and Table 10, there were cases in which generators operated below their minimum output, which differed from reality. This problem was observed in all the scenarios, A, B, and C, but in scenario C, there were more generators operating below their minimum output compared to scenarios A and B. As mentioned earlier, if renewable energy increases and the required operating reserve increases accordingly, binary decision variables are changed to stop or start some generators, and the generation of power by generators that are already running is adjusted to secure the operating reserve. However, in this paper, instead of using binary decision variables to stop or start the generators, the variable u g , t in Equations (11) and (12) was changed to adjust the power-generation ranges of the generators and to secure the operating reserve. The u g , t takes a real number between 0 and 1, allowing the generators to operate at below their real physical minimum output by changing the range of the maximum and minimum outputs defined in each scenario. In Scenario C, due to the participation in the downward reserve of the renewable energy and the separation of the upward and downward reserves, the need for fossil-fuel generators to increase output decreased compared to Scenario B scenario for securing the reserve. However, in the process of securing the upward reserves, generators are operated below their minimum output while simultaneously increasing the generation of low-cost VRE and decreasing the generation of expensive fossil fuels to minimize costs. The operations below the minimum physical output of the generators found in these results cannot occur in the actual operation of generators, which suggests that LP relaxation can cause distortions in the interpretation of the results, not just the control over the power produced by the generators.
The simulation results in the scenarios regarding the responses to the intermittency of VRE show that if additional operating reserves are secured based on the hourly VRE generation, the importance of backup fossil-fuel generation increases, and at the same time, there is an increase in the nuclear-power-generator-output limit and VRE curtailment. In Scenarios 1 and 2, with different proportions of VRE generation, this trend was found to be common through the comparison of the results of Scenario A, in which a constant reserve capacity by time was secured, and Scenarios B and C, in which additional reserve capacity by time was secured. In the case of Scenario C, this trend was ameliorated compared to Scenario B due to the participation of the VRE in the securing of the downward reserve. While the results of Scenarios A, B, and C showed a common trend in Scenarios 1 and 2, this trend was more pronounced in Scenario 2, which had a higher proportion of VRE generation. As Scenario 2 had greater annual VRE generation than Scenario 1, the required reserve increased. To ensure this increased reserve, the importance of backup fossil-fuel generation, the limited use of nuclear power generation for reserve power, VRE curtailment, and the cost of power generation increases. The magnitude of these effects increases as constraints become stricter.

4. Conclusions

This paper compared and analyzed additional methods with which to secure an operating reserve in the Korean electricity market for achieving the 2030 carbon-emission-reduction target, in response to the intermittency of VRE. If VRE generation is increased without a long-term system plan, it may lead to issues such as reducing the reliability of the system. This paper assumed the current KEMOR as the base scenario and modeled the annual UC problem to comparatively analyze how changes in the methods with which the operating reserve is secured in response to the increase in VRE generation would affect the Korean electricity market, prior to long-term system planning. When comparing each scenario, it was found that it will be difficult to respond to the intermittency of VRE in 2030 through the operating-reserve regulations of the current KEMOR. However, if the amount of operating reserve secured is increased to cope with intermittency, it may lead to system problems, such as limits on nuclear-power-generator output and VRE curtailment, along with an increase in costs. By separating the upward- and downward-reserve capacity and securing the downward reserve capacity through VRE curtailment, these issues were found to be improved. However, if, in the future, compensation policies are applied according to the current KEMOR that ignore the compensation costs for VRE curtailment, new analyses will need to be conducted from a cost perspective. Additionally, the analysis results showed that an increase in VRE generation resulted in higher generation costs. If VRE is curtailed to ensure the reliability of the system and an actual downward reserve is secured, it is also possible that the target VRE generation for 2030 may not be achieved. Therefore, to increase the acceptance of VRE, long-term system planning is necessary, such as ensuring the flexibility of backup fossil-fuel generators. Due to its geographical characteristics, Republic of Korea is more vulnerable to the intermittency of renewable energy than other countries. Therefore, the operating reserve is crucial in the power system. However, while Republic of Korea has an energy market within its electricity market, it does not have a reserve market. Recently, due to the rapid increase in VRE, the importance of a reserve market has been acknowledged, and efforts are underway to implement it by 2025. This paper contributes to the aim of establishing a reserve market, such as through the calculation of the reserve capacity and reserve price, through a market analysis considering the energy system’s conditions in relation to the increase in VRE.
Since, in this paper, the Korean electricity market in 2030 was assumed, a scenario was constructed that was similar to that envisioned in the policies proposed so far, but no details on the operation and characteristics of nuclear power generators used to reduce carbon emissions by focusing on renewable energy are presented. Korean nuclear power generators are optimized for 100% output operation, so difficulties are created by the output variation due to stability issues. In this paper, since the annual unit simulation was repeated for 52 weeks, the modeling of the annual nuclear power generators’ output constraints was limited. Therefore, in the results in this paper, there were differences between actual operations and the output limits for each week. In addition, in renewable energy, volatility and prediction errors change depending on the output section, so further research is needed to consider the characteristics of nuclear power generators and renewable energy in the future.

Author Contributions

Formal analysis, investigation, writing—original draft preparation, I.D.; conceptualization, methodology, writing—review and editing, S.L.; writing—review and editing, G.-S.S.; supervision, S.K. All authors have read and agreed to the published version of the manuscript.

Funding

This work was supported by the Korea Institute of Energy Technology Evaluation and Planning (KETEP) and the Ministry of Trade, Industry and Energy (MOTIE) of the Republic of Korea (grant number: 20224000000490).

Data Availability Statement

Not applicable.

Conflicts of Interest

The authors declare no conflict of interest.

References

  1. United Nations Framework Convention on Climate Change. Paris Agreement. 2015. Available online: https://unfccc.int/process-and-meetings/the-paris-agreement (accessed on 5 January 2023).
  2. Baharvandi, A.; Aghaei, J.; Niknam, T.; Shafie-Khah, M.; Godina, R.; Nojavan, S. Bundled Generation and Transmission Planning Under Demand and Wind Generation Uncertainty Based on a Combination of Robust and Stochastic Optimization. IEEE Trans. Sustain. Energy 2018, 9, 1477–1486. [Google Scholar] [CrossRef]
  3. Bird, L.; Milligan, M.; Lew, D. Integrating Variable Renewable Energy: Challenges and Solutions; National Renewable Energy Laboratory (NREL): Golden, CO, USA, 2013.
  4. Saez-Gallego, J.; Morales, J.M.; Maden, H.; Jonsson, T. Determining reserve requirements in DK1 area of Nord Pool using a probabilistic approach. Energy 2014, 74, 682–693. [Google Scholar] [CrossRef]
  5. Wang, B.; Hobbs, B.F. Real-Time Markets for Flexiramp: A Stochastic Unit Commitment-Based Analysis. IEEE Trans. Power Syst. 2015, 31, 846–860. [Google Scholar] [CrossRef]
  6. Hirth, L.; Ziegenhagen, I. Balancing power and variable renewables: Three links. Renew. Sustain. Energy Rev. 2015, 50, 1035–1051. [Google Scholar] [CrossRef]
  7. Korean Ministry of Trade, Industry and Energy. Submission under the Paris Agreement the Republic of Korea’s Enhanced Update of Its First Nationally Determined Contribution. 2021. Available online: https://www.2050cnc.go.kr/base/board/read?boardManagementNo=4&boardNo=100&searchCategory=&page=1&searchType=&searchWord=&menuLevel=2&menuNo=12 (accessed on 12 January 2023).
  8. Korean Ministry of Trade, Industry and Energy. 10th Basic Plan for Long-term Electricity Supply and Demand. 2023. Available online: https://www.motie.go.kr/motie/ms/nt/announce3/bbs/bbsView.do?bbs_seq_n=68162&bbs_cd_n=6&currentPage=1&search_key_n=&cate_n=&dept_v=&search_val_v=&biz_anc_yn_c= (accessed on 23 January 2023).
  9. Kim, E.H.; Park, Y.G.; Roh, J.H. Competitiveness of open-cycle gas turbine and its potential in the future Korean electricity market with high renewable energy mix. Energy Policy 2019, 129, 1056–1069. [Google Scholar] [CrossRef]
  10. Ko, Y.J.; Choi, G.Y.; Lee, S.Y.; Kim, S.S. Economic analysis of pumped hydro storage under Korean governmental expansion plan for renewable energy. In Proceedings of the 6th International Conference on Energy and Environment Research (ICEER), University of Aveiro, Aveiro, Portugal, 22–25 July 2019. [Google Scholar]
  11. Korea Power Exchange. The Electricity Market Operation Rules. 2023. Available online: https://new.kpx.or.kr/board.es?mid=a10205010000&bid=0030 (accessed on 9 January 2023).
  12. Ela, E.; Diakov, V.; Ibanez, E.; Heaney, M. Impacts of Variability and Uncertainty in Solar Photovoltaic Generation at Multiple Timescales; National Renewable Energy Laboratory (NREL): Golden, CO, USA, 2013.
  13. KEPCO Economy & Management Research Institute. Power Economics Review. 2019. Available online: https://home.kepco.co.kr/kepco/KR/ntcob/list.do?boardCd=BRD_000271&menuCd=FN3120 (accessed on 3 March 2023).
  14. Lee, J.Y.; Lee, J.H.; Wi, Y.M. Impact of Revised Time of Use Tariff on Variable Renewable Energy Curtailment on Jeju Island. Electronics 2021, 10, 135. [Google Scholar] [CrossRef]
  15. Nguyen, T.A.; Byrne, R.H.; Chalamala, B.R.; Gyuk, I. Maximizing the Revenue of Energy Storage Systems in Market Areas Considering Nonlinear Storage Efficiencies. In Proceedings of the 2018 International Symposium on Power Electronics, Electrical Drives, Automation and Motion (SPEEDAM), Amalfi, Italy, 20–22 June 2018. [Google Scholar]
  16. Choi, G.Y. A Study on Linearization of Unit Commitment for Annual Power Market Simulation. Master’s Thesis, Tech University of Korea, Siheung, Republic of Korea, 2021. Available online: https://library.tukorea.ac.kr/search/i-discovery/1671699?type=biblios-list-view (accessed on 20 February 2023).
  17. Lee, J.H.; Lee, S.Y.; Lee, K.S. Multistage Stochastic Optimization for Microgrid Operation Under Islanding Uncertainty. IEEE Trans. Smart Grid 2021, 12, 56–66. [Google Scholar] [CrossRef]
  18. Korea Hydro & Nuclear Power. The Analysis of the Value and Benefits of Pumped Hydro Storage Units According to Changes in the Energy Policy of the New Government; Korea Hydro & Nuclear Power: Gyeongju, Republic of Korea, 2020. [Google Scholar]
Figure 1. Variability and uncertainty of VRE.
Energies 16 04189 g001
Figure 2. Power-generation cost function of coal generator #1.
Energies 16 04189 g002
Figure 3. Annual demand and VRE-generation patterns in 2030.
Energies 16 04189 g003
Figure 4. Annual power generation by major fuel sources in (a) Scenario 1, (b) Scenario 2.
Energies 16 04189 g004
Figure 5. Weekly power-generation curtailment of nuclear generators (solid line) and VRE (dotted line) in (a) Scenario 1 and (b) Scenario 2.
Energies 16 04189 g005
Figure 6. Additional weekly power-generation costs compared to Scenario A for (a) Scenario 1 and (b) Scenario 2.
Energies 16 04189 g006
Figure 7. Amounts accumulated by fuel source in Scenario 1-A: (a) power generation, (b) reserve.
Energies 16 04189 g007
Figure 8. Amounts accumulated by fuel sources in Scenario 2-A: (a) power generation, (b) reserve.
Energies 16 04189 g008
Figure 9. Amounts accumulated by fuel sources in Scenario 1-B: (a) power generation, (b) reserve.
Energies 16 04189 g009
Figure 10. Amounts accumulated by fuel sources in Scenario 2-B (a) power generation, (b) reserve.
Energies 16 04189 g010
Figure 11. Amounts accumulated by fuel sources in Scenario 1-C (a) power generation, (b) upward reserve, (c) downward reserve.
Energies 16 04189 g011
Figure 12. Amounts accumulated by fuel sources in Scenario 2-C: (a) power generation, (b) upward reserve, (c) downward reserve.
Energies 16 04189 g012
Table 1. Operating-reserves rules, from Korean market-operation rules.
Capacity (MW)Rules
Frequency Control700response within 5 min
maintain output for more than 30 min
Primary1000response within 10 s
maintain output for more than 5 min
Secondary1400response within 10 min
maintain output for more than 30 min
Tertiary1400response within 30 min
Table 2. Installed capacities and ratios of major fuel Sources for power generation.
NuclearCoalLNGOilPHSSum
Capacity (GW)29.030.857.00.714.7122.2
Ratio (%)23.725.223.70.63.8100
Table 3. The notation of each scenario.
ScenarioABC
1Scenario 1-AScenario 1-BScenario 1-C
2Scenario 2-AScenario 2-BScenario 2-C
Table 4. Increase or decrease rates of major power sources compared to the basic scenario (%).
ScenarioNuclearCoalLNGRenewable
1B−1.89−11.03+18.29−4.82
C−1.41−6.33+11.95−3.82
2B−3.57−19.51+35.68−11.26
C−2.80−14.16+27.89−9.61
Table 5. Annual cost results for each scenario.
ScenarioCarbon Emission Trading Price
(1000 KRW/tCO2eq)
Coal
(1000 KRW/MWh)
LNG
(1000 KRW/MWh)
Annual
Generation Cost
(Trillion KRW)
1A70 112.72 121.2530.05
B72114.36121.9931.75
C71113.45121.6231.23
2A70112.72121.2530.11
B77118.46123.8634.44
C75116.82123.1233.52
Table 6. Annual operating-reserve requirements for each scenario (TW).
Scenario12
ABCABC
Primary8.7614.4614.668.7616.8017.16
Secondary18.4028.0028.3518.4031.9532.55
Tertiary12.2615.2015.3112.2616.4116.59
Table 7. Annual SMP for each scenario (1000 KRW/MWh).
Scenario12
ABCABC
MAX127.0 127.93127.91130.1141.5137.6
Min000000
AVG(ALL)107.291.4495.1103.082.686.0
AVG(CUT)111.0106.33108.1111.4109.7111.1
Table 8. Average SMP and weekly generation costs in 18th Week.
ScenarioAVG(ALL)
(1000 KRW/MWh)
AVG(CUT)
(1000 KRW/MWh)
Weekly Generation Cost
(Bn KRW)
1A74.6 101.9287.0
B46.578.9373.7
C53.185.8354.5
2A68.9106.1272.6
B35.982.6426.4
C41.690.8399.4
Table 9. Data on operating coal generators in 18th week.
ScenarioGeneration
(MWh)
Securing Reserve
(MW)
Average Generation Rate (%)Generators above Min Output (EA)Generators below Min Output (EA)
1A68020546.4821
B213961259.6871
C1804Upward 506
Downward 506
33.4547
2A00000
B218762570.0080
C2664Upward 842
Downward 441
58.1482
Table 10. Data in operating LNG generators in 18th Week.
ScenarioGeneration
(MWh)
Securing Reserve
(MW)
Average Generation Rate (%)Generators above Min Output (EA)Generators below Min Output (EA)
1A7204333842.202815
B14,772409451.974814
C12,996Upward 4292
Downward 1853
42.712443
2A6446333148.41219
B16,609454852.655317
C14,343Upward 4656
Downward 2184
44.682844
Disclaimer/Publisher’s Note: The statements, opinions and data contained in all publications are solely those of the individual author(s) and contributor(s) and not of MDPI and/or the editor(s). MDPI and/or the editor(s) disclaim responsibility for any injury to people or property resulting from any ideas, methods, instructions or products referred to in the content.

