

Implementation Strategy of Test Facility Based on Auto-Transformer for LVRT/HVRT Evaluation of Large-Scale Wind Turbine

Abstract
:1. Introduction
- -
- A 30 kW-scale artificial LVRT/HVRT test facility implemented by impedance determination algorithm and operation strategy is confirmed that can be stably applied for the LVRT/HVRT field test of a large-scale wind turbine;
- -
- From systematical simulation analysis and test by the artificial test simulator, it shows that LVRT/HVRT facility-based autotransformer can efficiently perform as a test facility for large-scale wind turbines and has the advantage of implementing voltages in a wide range;
- -
- Through the proposed impedance determination algorithm, it is confirmed that a test facility can be stably developed for a 12 MW-scale LVRT/HVRT facility.
2. Characteristics of the LVRT/HVRT Test Facility for Wind Turbines
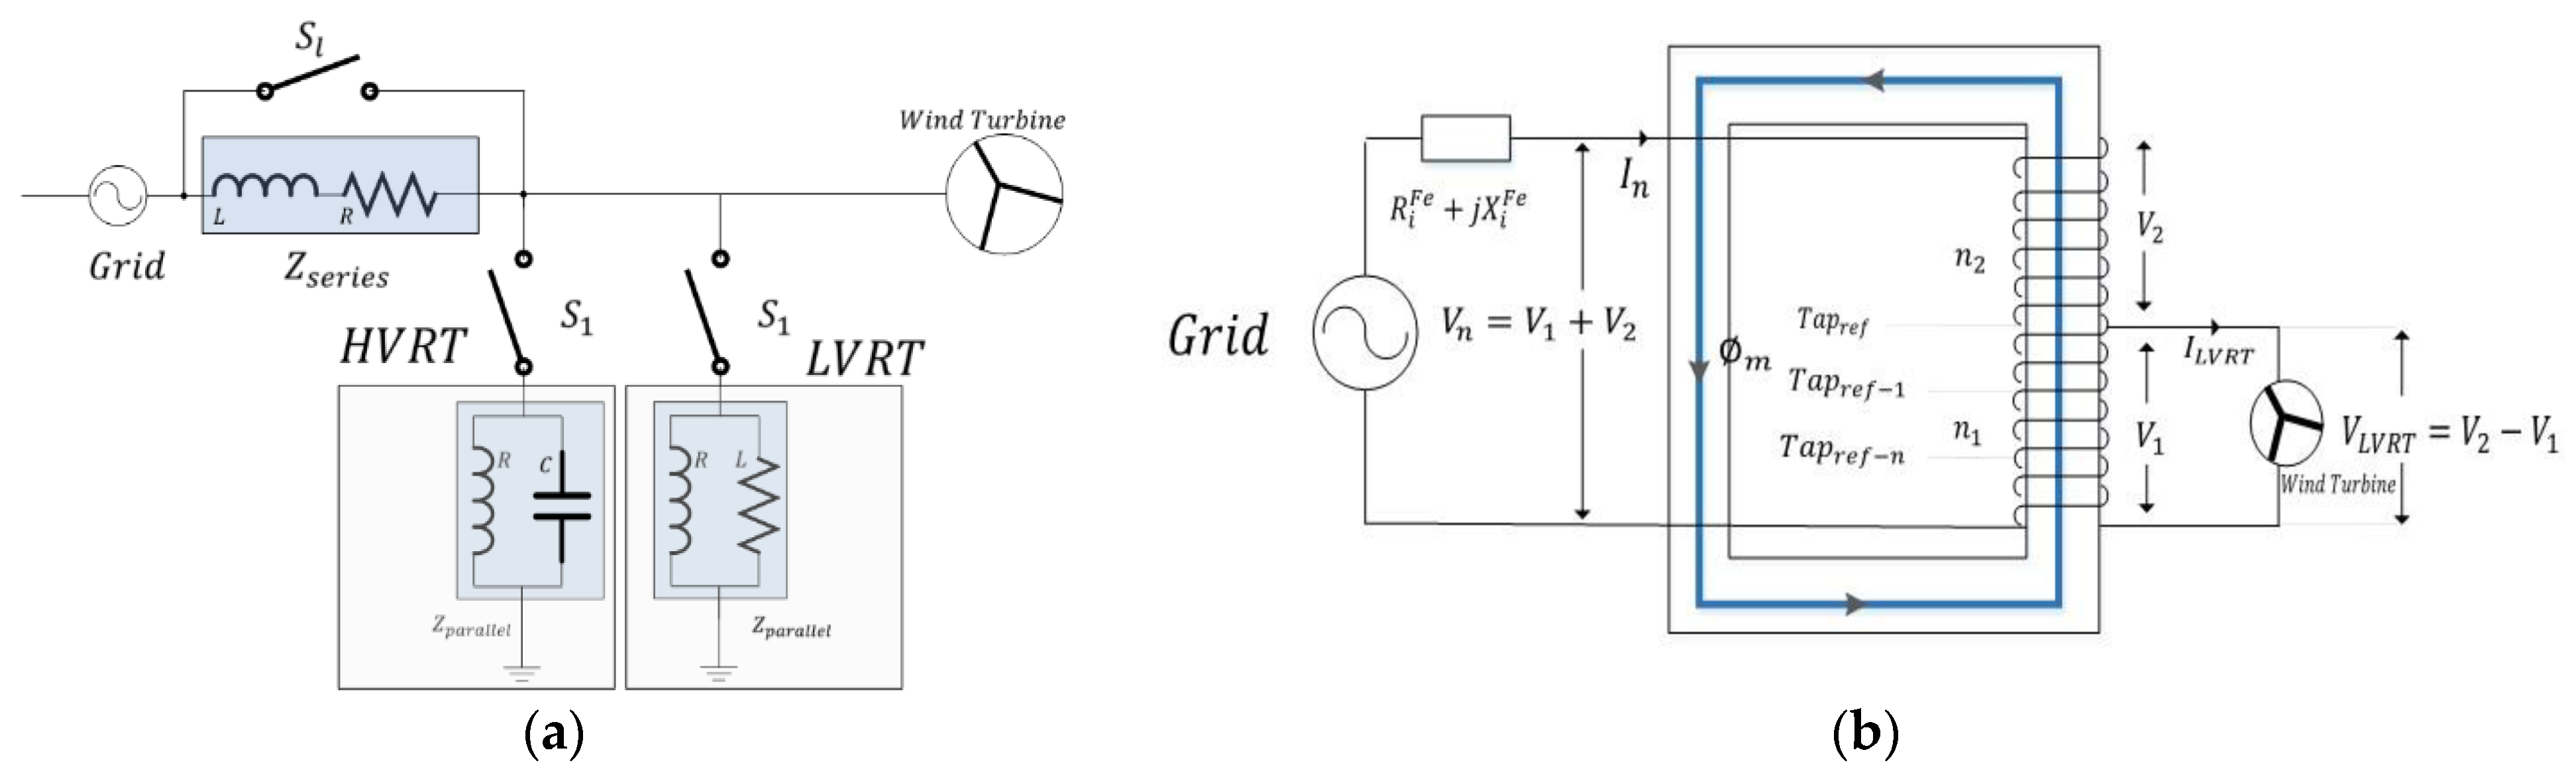
2.1. Characteristics of the LVRT/HVRT Test Facility
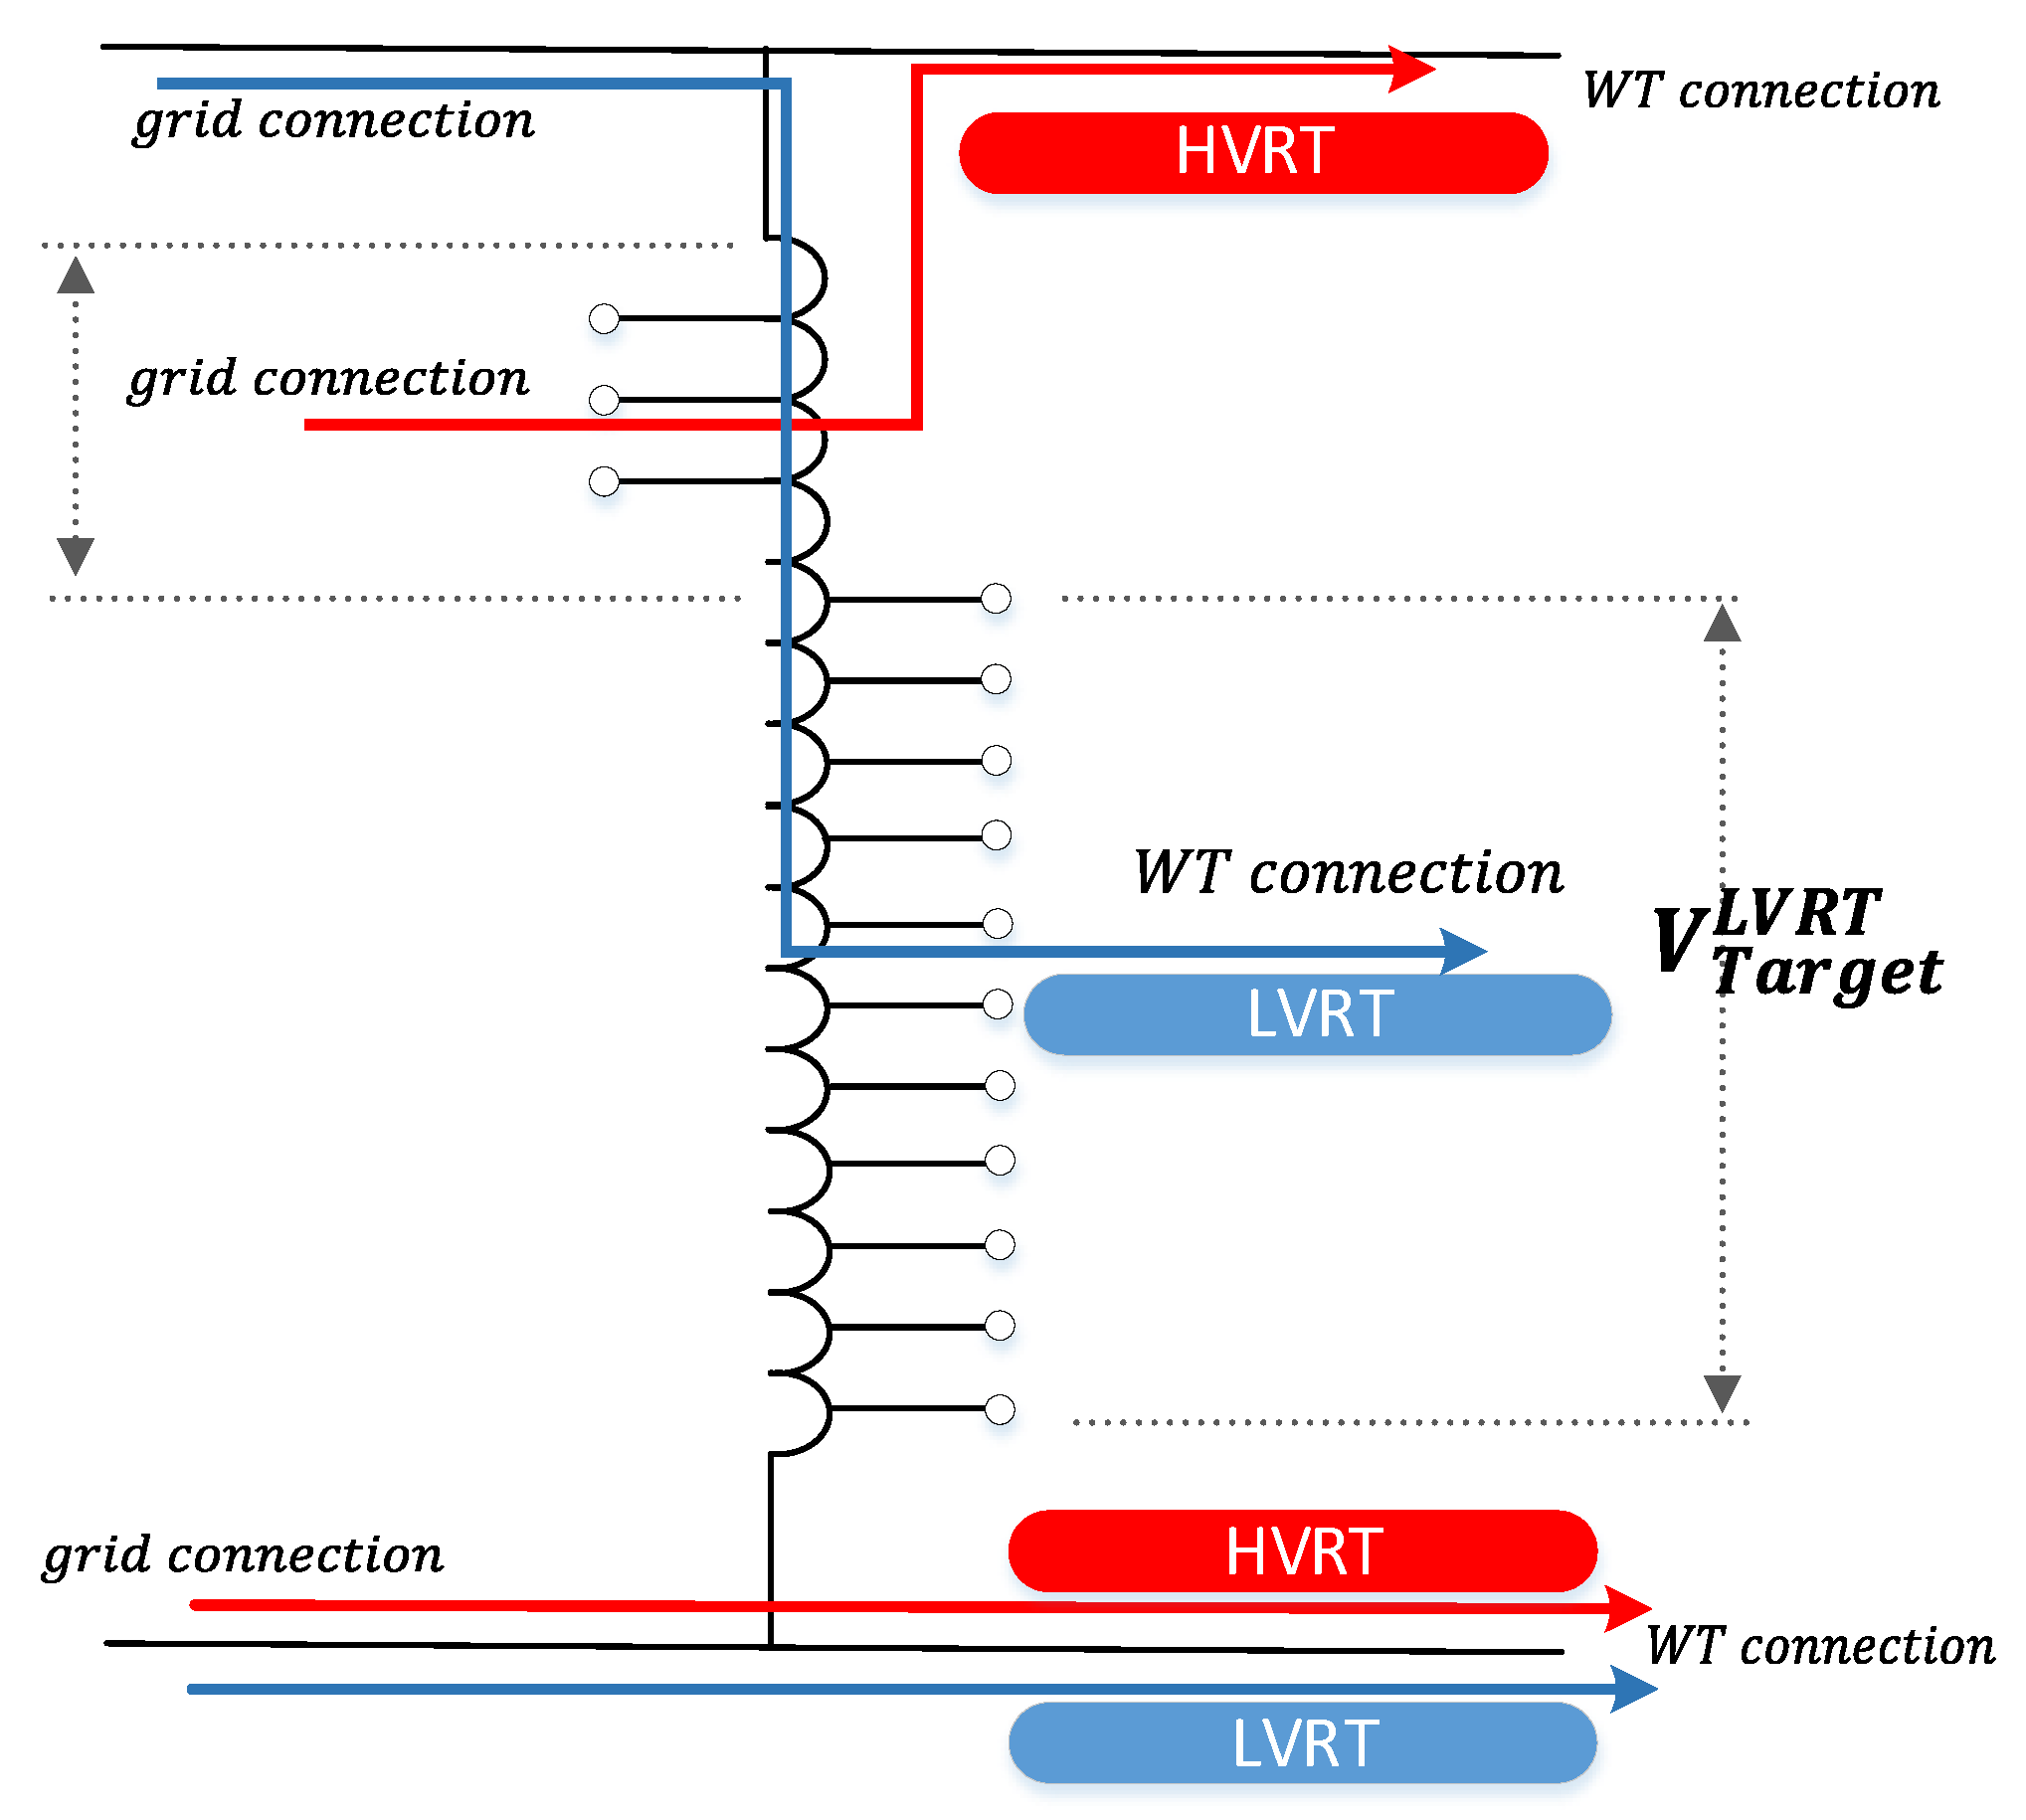
2.2. Modeling of LVRT and HVRT Test Facility
3. The Two-Step Layer Impedance Determination Algorithm of the LVRT/HVRT Test Facility
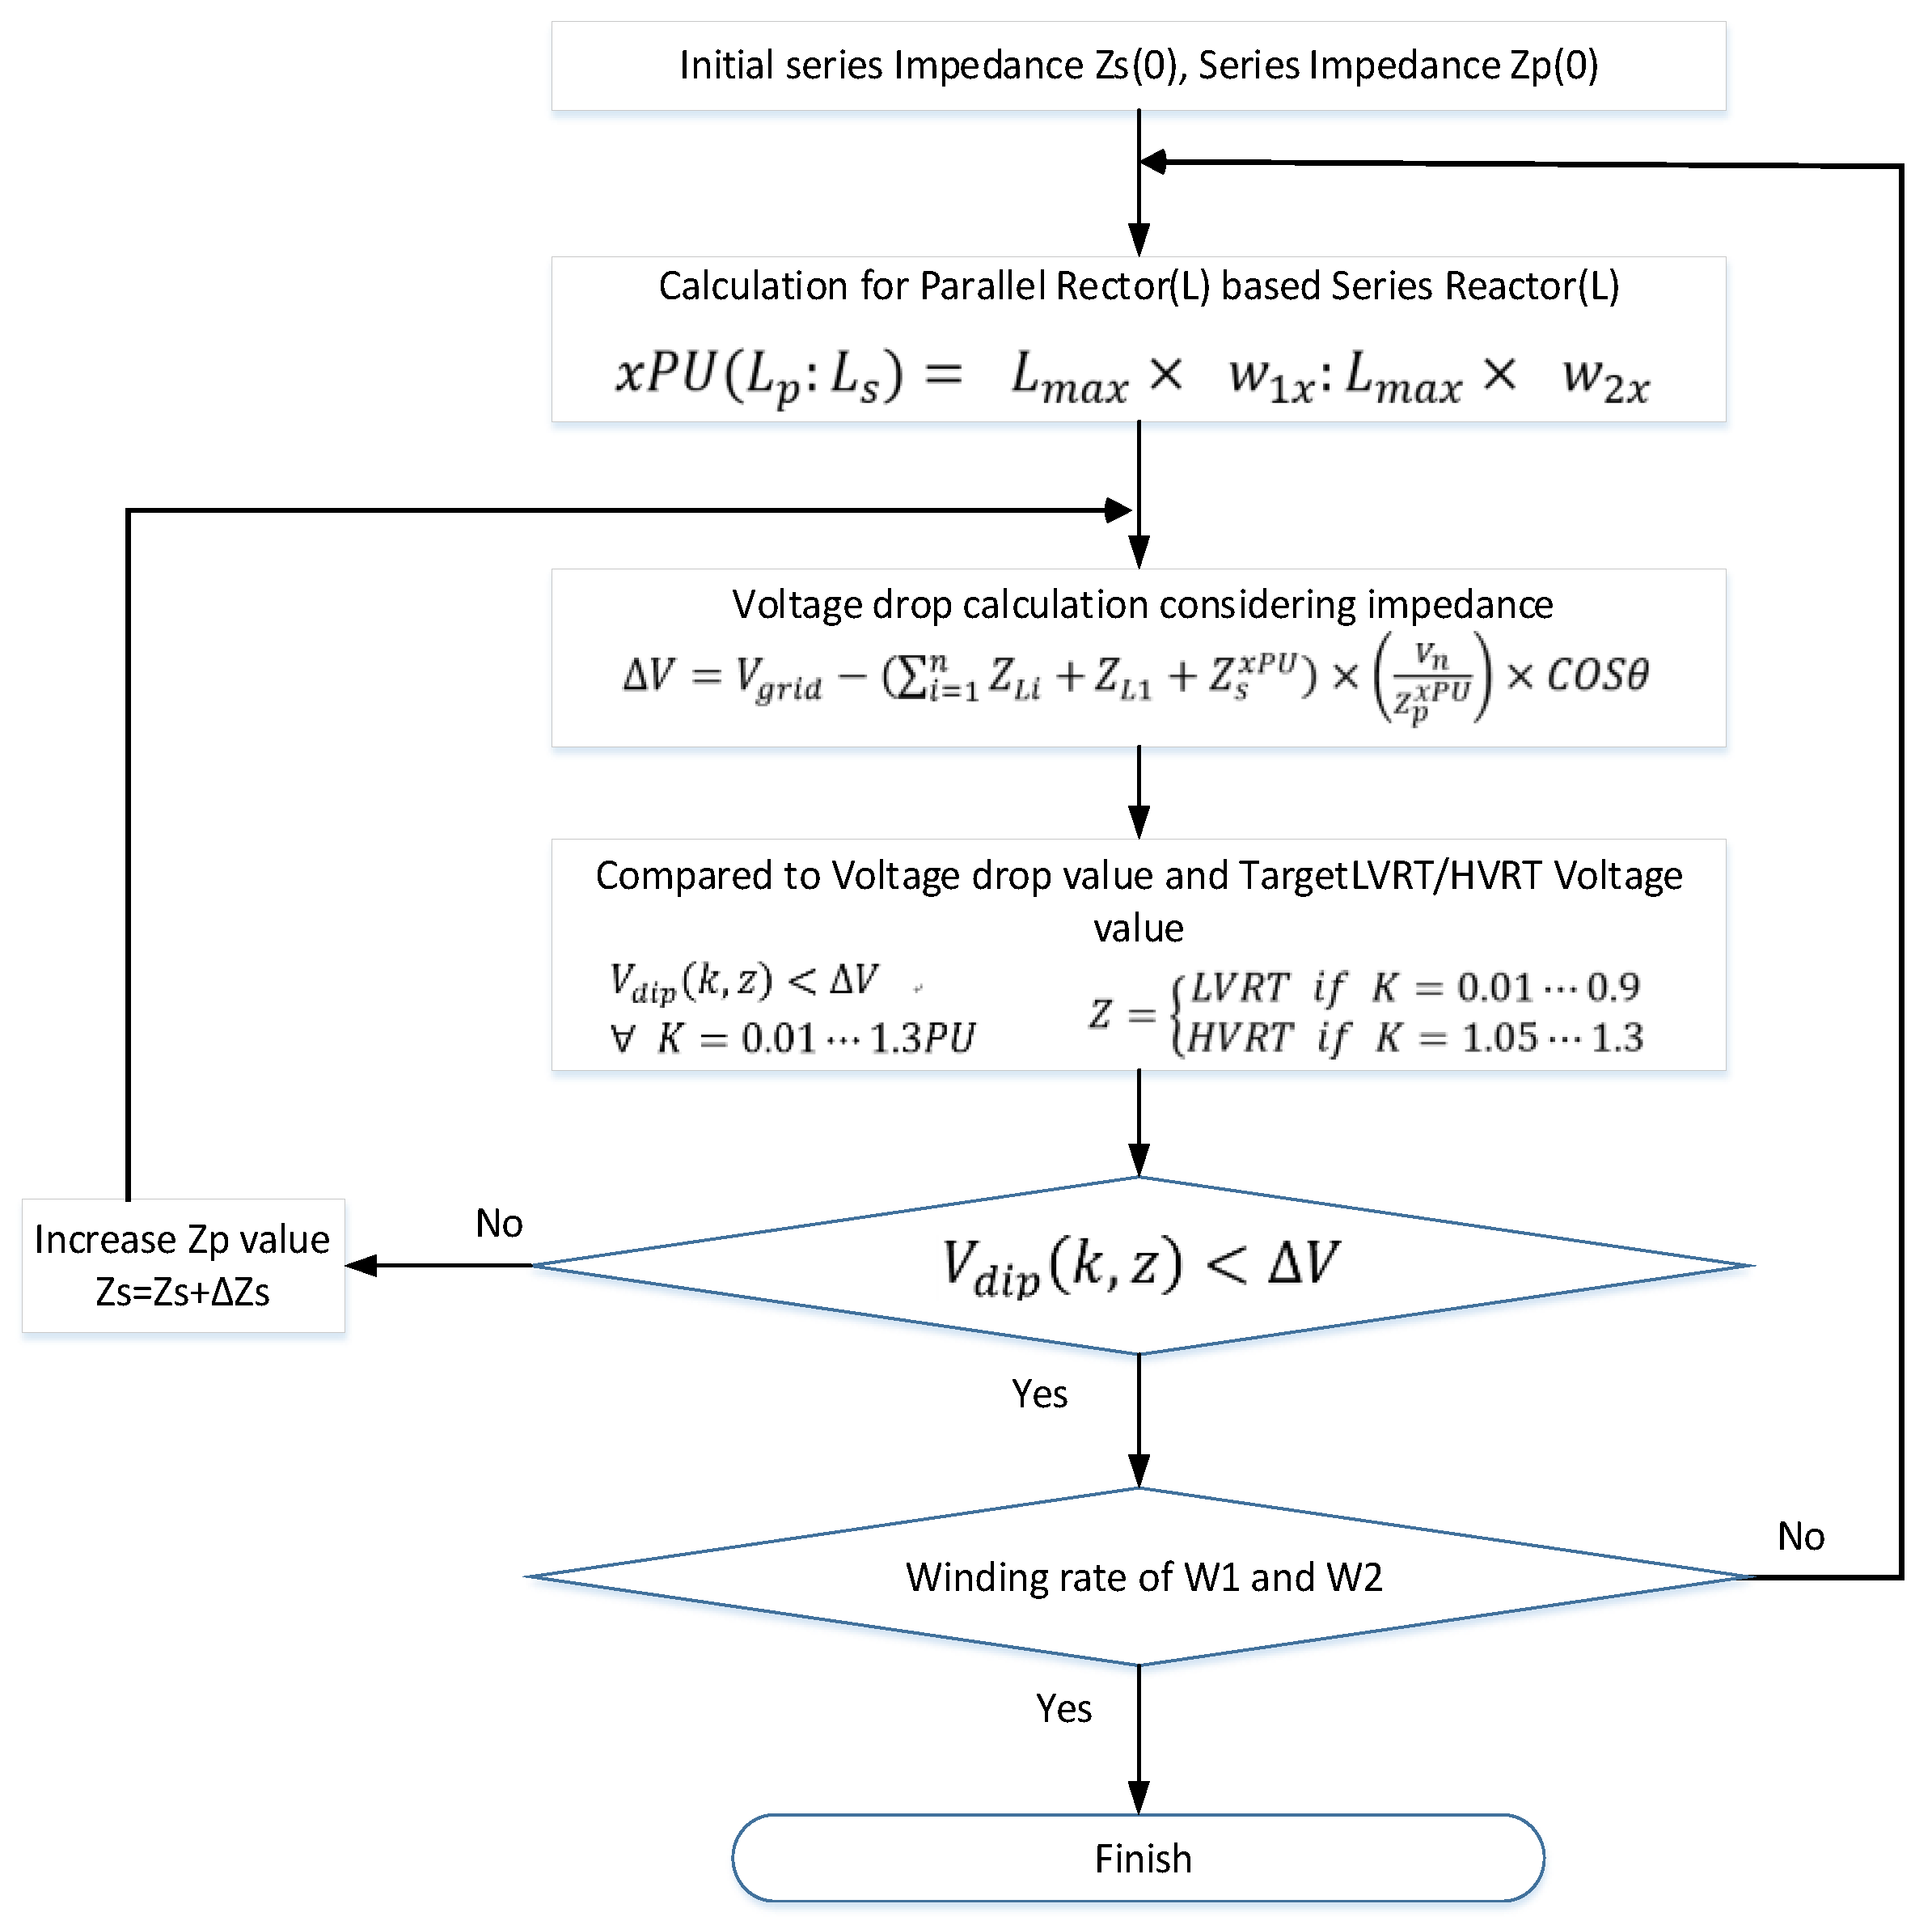
3.1. Impedance Determination Based on an Impedance Map
3.2. Successive Approximation Method Using a Two-Step Layer
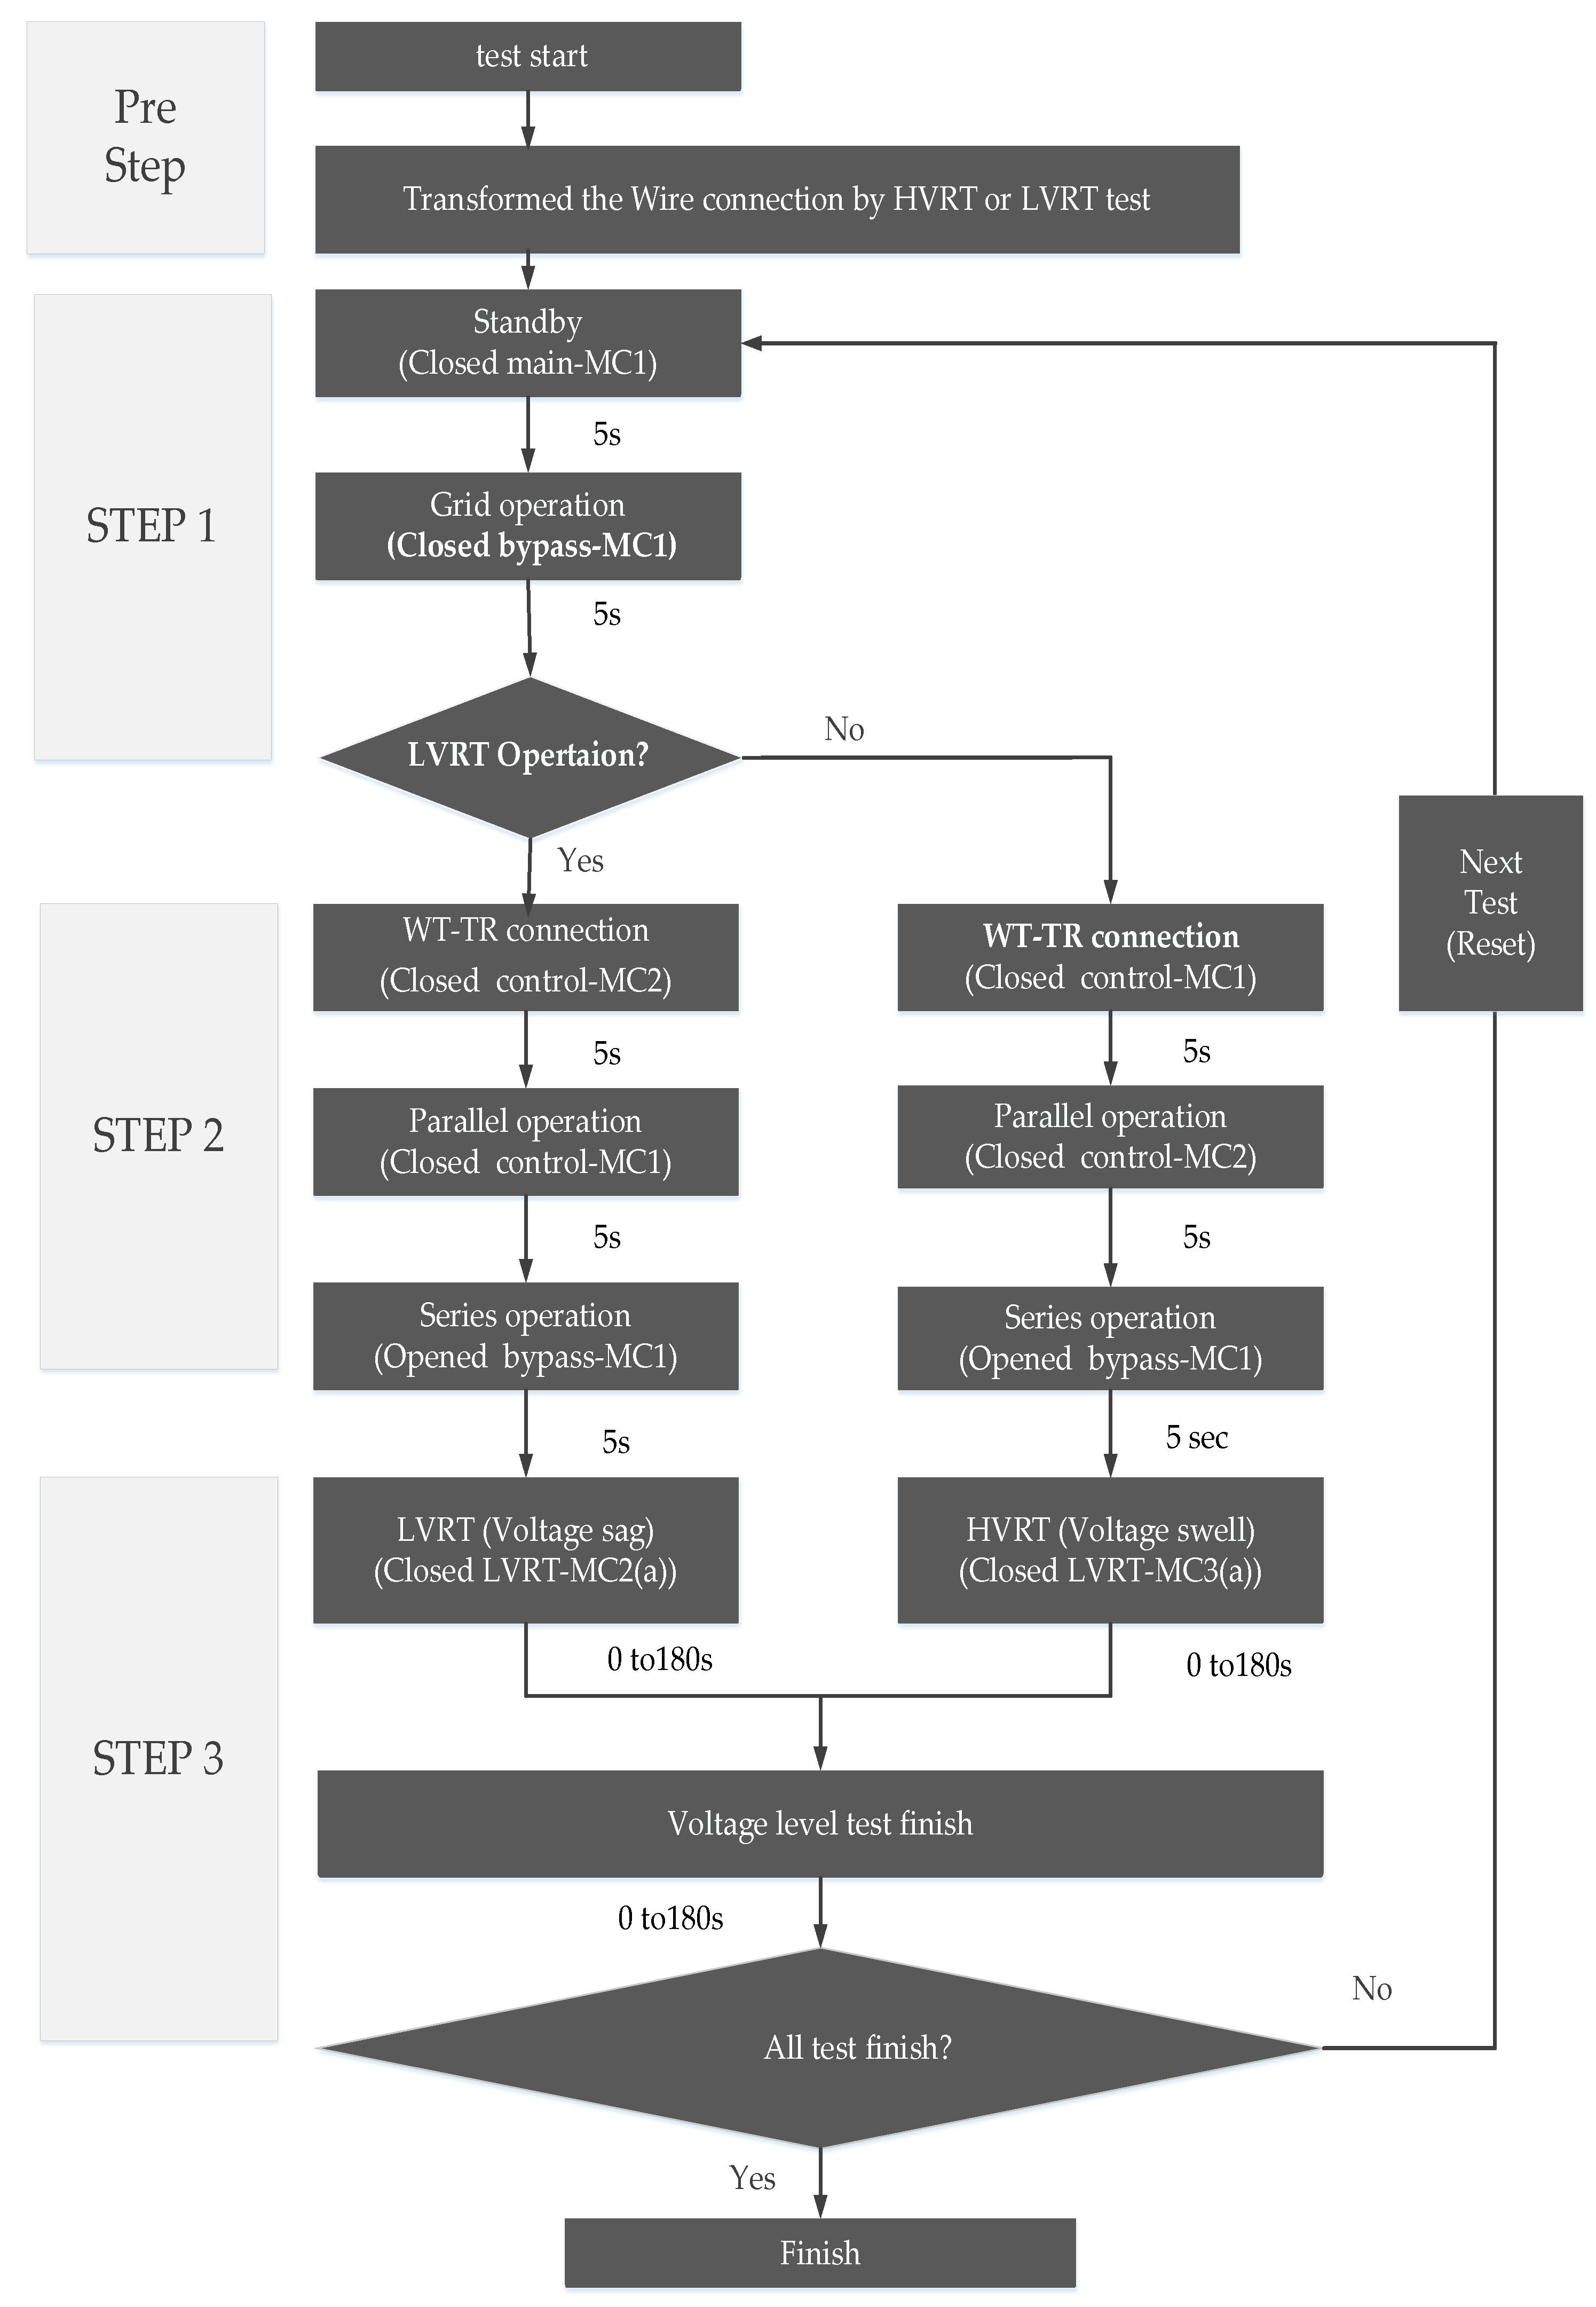
4. Differential Operation Procedure of the LVRT/HVRT Test Facility-Based Autotransformer
4.1. Test Facility Operation Strategy in LVRT State
- (1)
- STEP 1: Normal operation
- -
- Standby: power is not applied to the LVRT test facility (the normal state where the voltage sag does not occur due to switches (bypass circuit breaker, selection circuit breaker and control circuit breaker) is the open situation);
- -
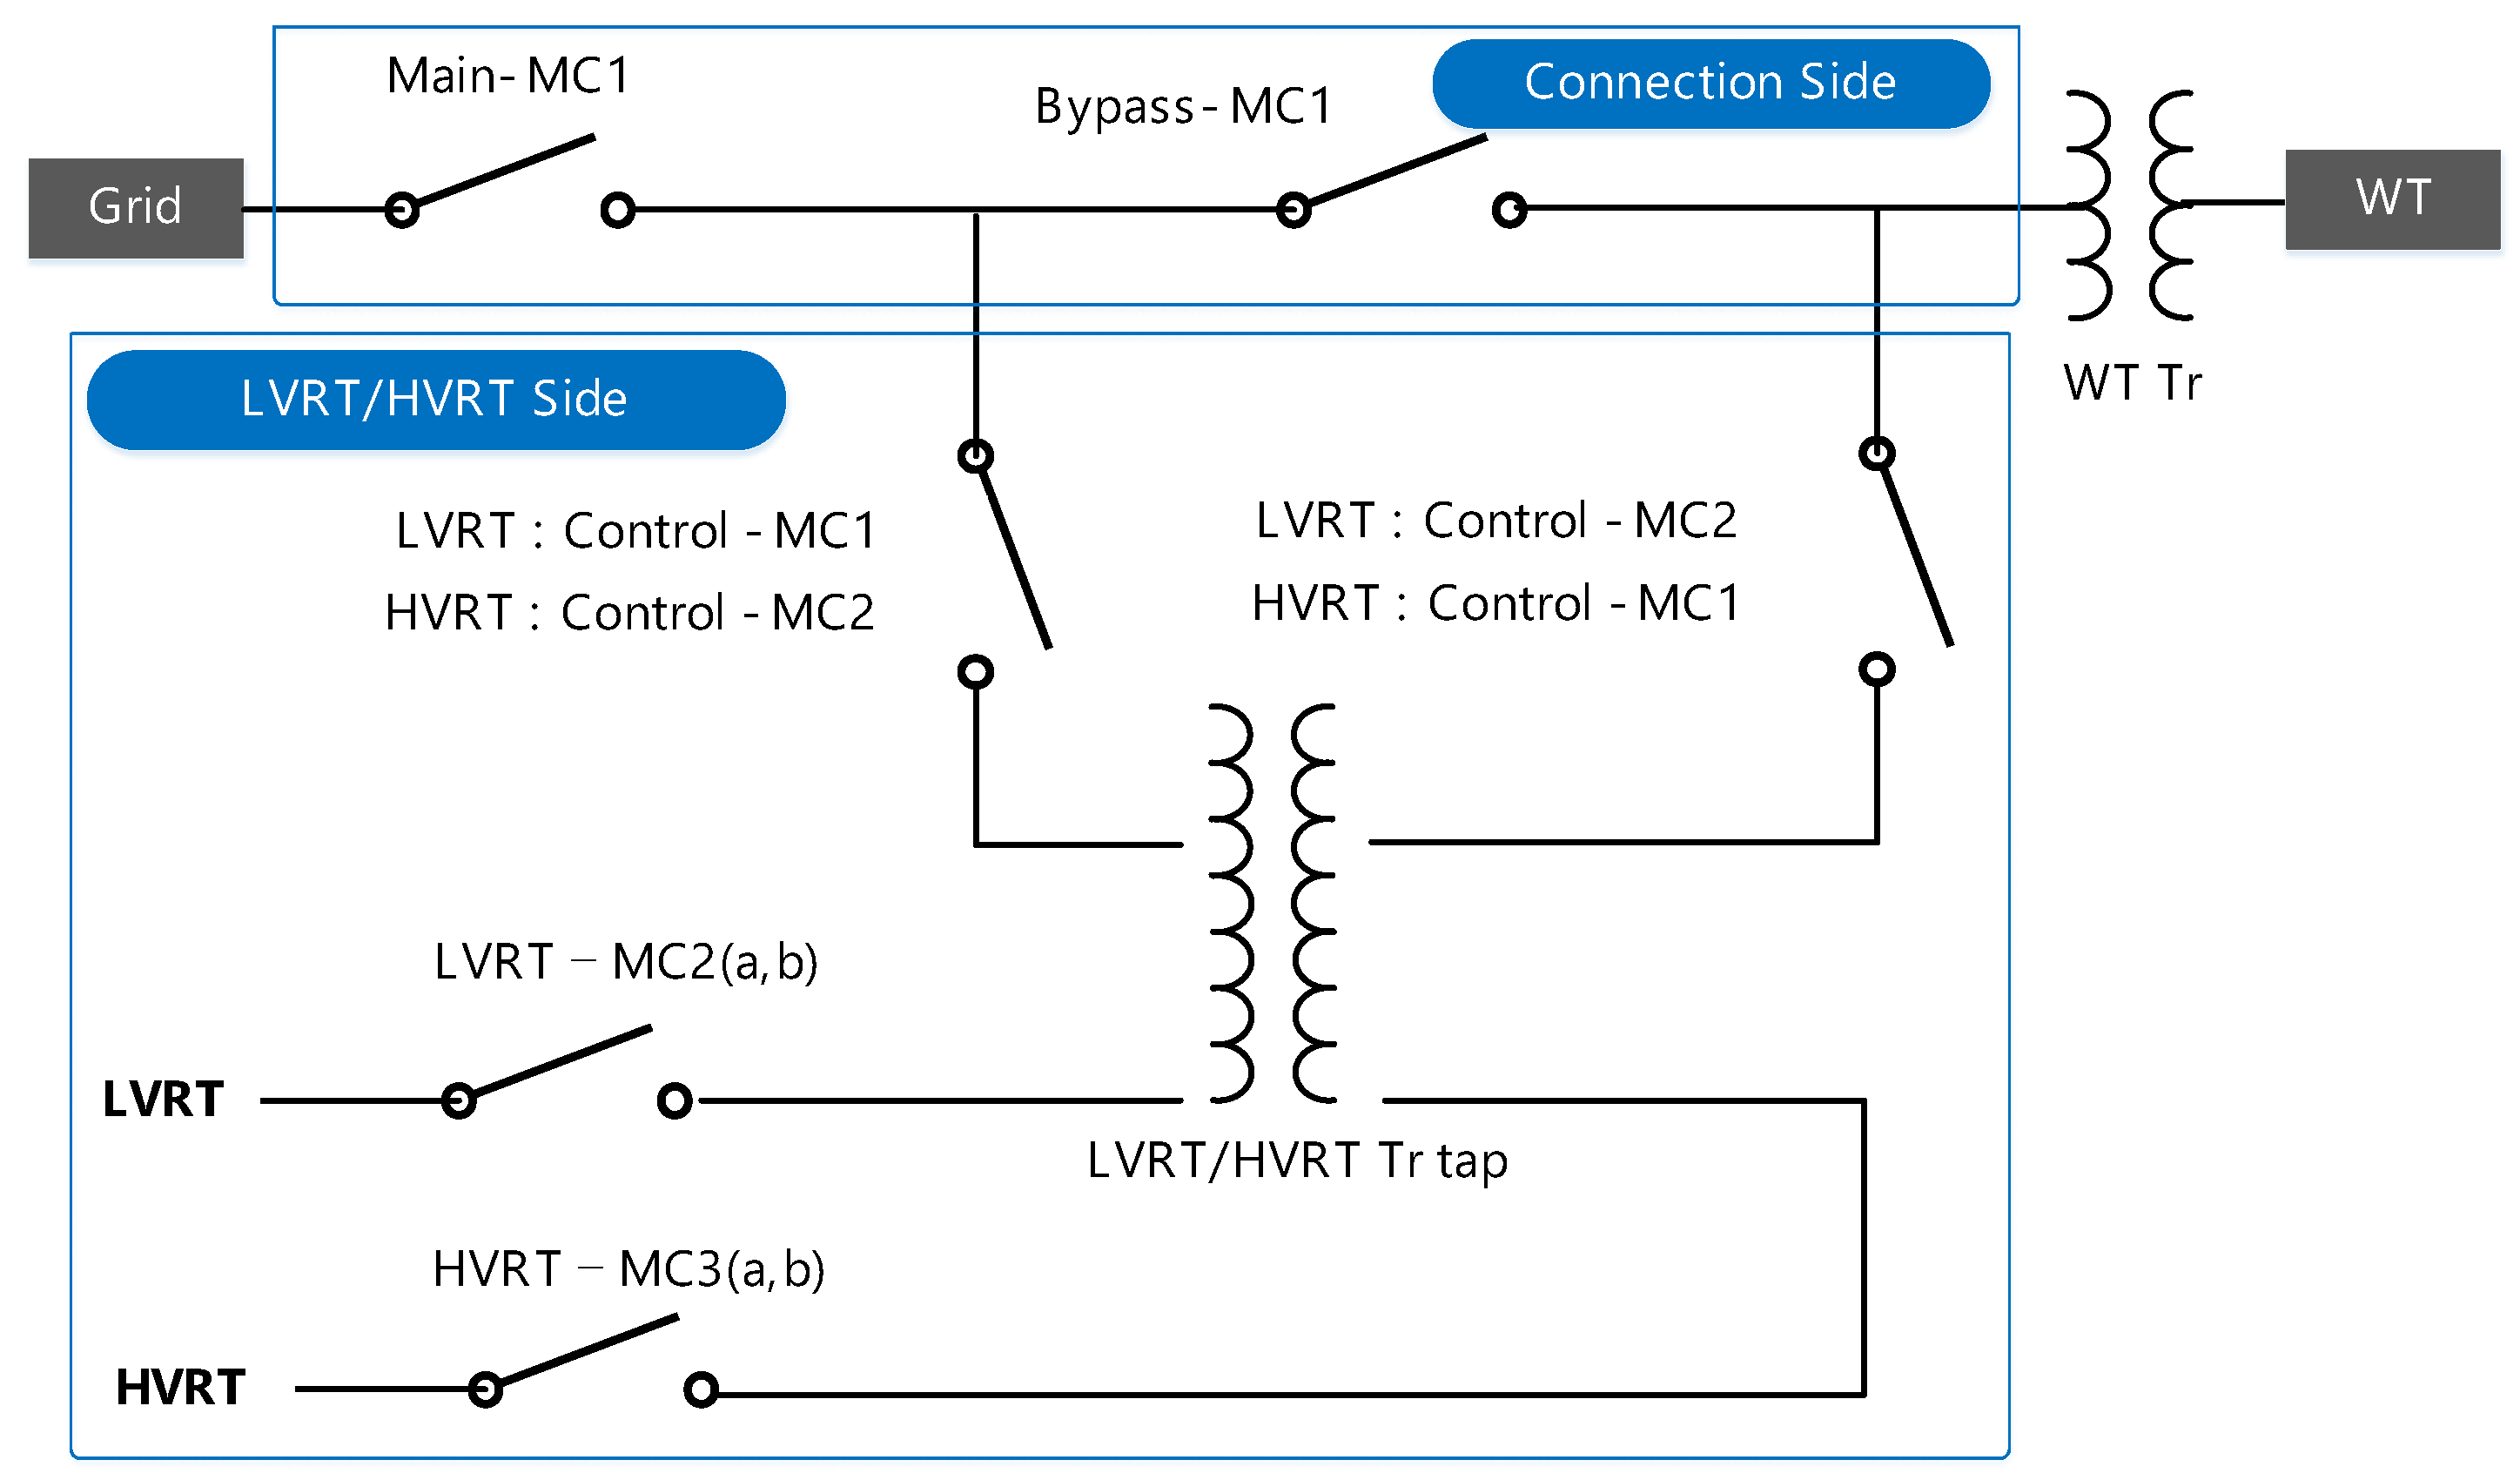
- Grid connection: the state in which only the grid and the wind turbine are directly connected without the test facility according to the closed situation of main-MC1 (the main circuit breaker) and bypass-MC1 (the bypass circuit breaker).
- (2)
- STEP 2: Tap operation
- -
- WT-TR connection: the connection state between the shunt tap of the test facility and the wind turbine according to the closed situation of control-MC2 (selection circuit breaker of WT side).
- -
- Parallel operation: the test facility is connected in parallel with the grid according to the closed situation of control-MC1 (the selection circuit breaker of the grid), which is located between the input of series winding in the test facility and grid.
- -
- Series operation: the test facility is connected in series between the grid and WT by bypass-MC1 is open while control-MC2 remains closed (to be kept as a rated voltage).
- (3)
- STEP 3: LVRT operation
4.2. Test Facility Operation Strategy in HVRT State
- (1)
- STEP 1: Normal operation
- (2)
- STEP 2: Tap operation
- -
- WT-TR connection: the connection state between the shunt taps of the test facility and the wind turbine according to the closed situation of control-MC1 (selection circuit breaker of the WT side).
- -
- Parallel operation: the test facility is connected in parallel with the grid according to the closed situation of control-MC2 (selection circuit breaker of the grid), which is located between the input of the series winding in the test facility and grid.
- -
- Series operation: the test facility is connected in series between the grid and WT by bypass-MC1 is open while control-MC1 remains closed situation (to be kept as rated voltage.
- (3)
- STEP 3: HVRT operation
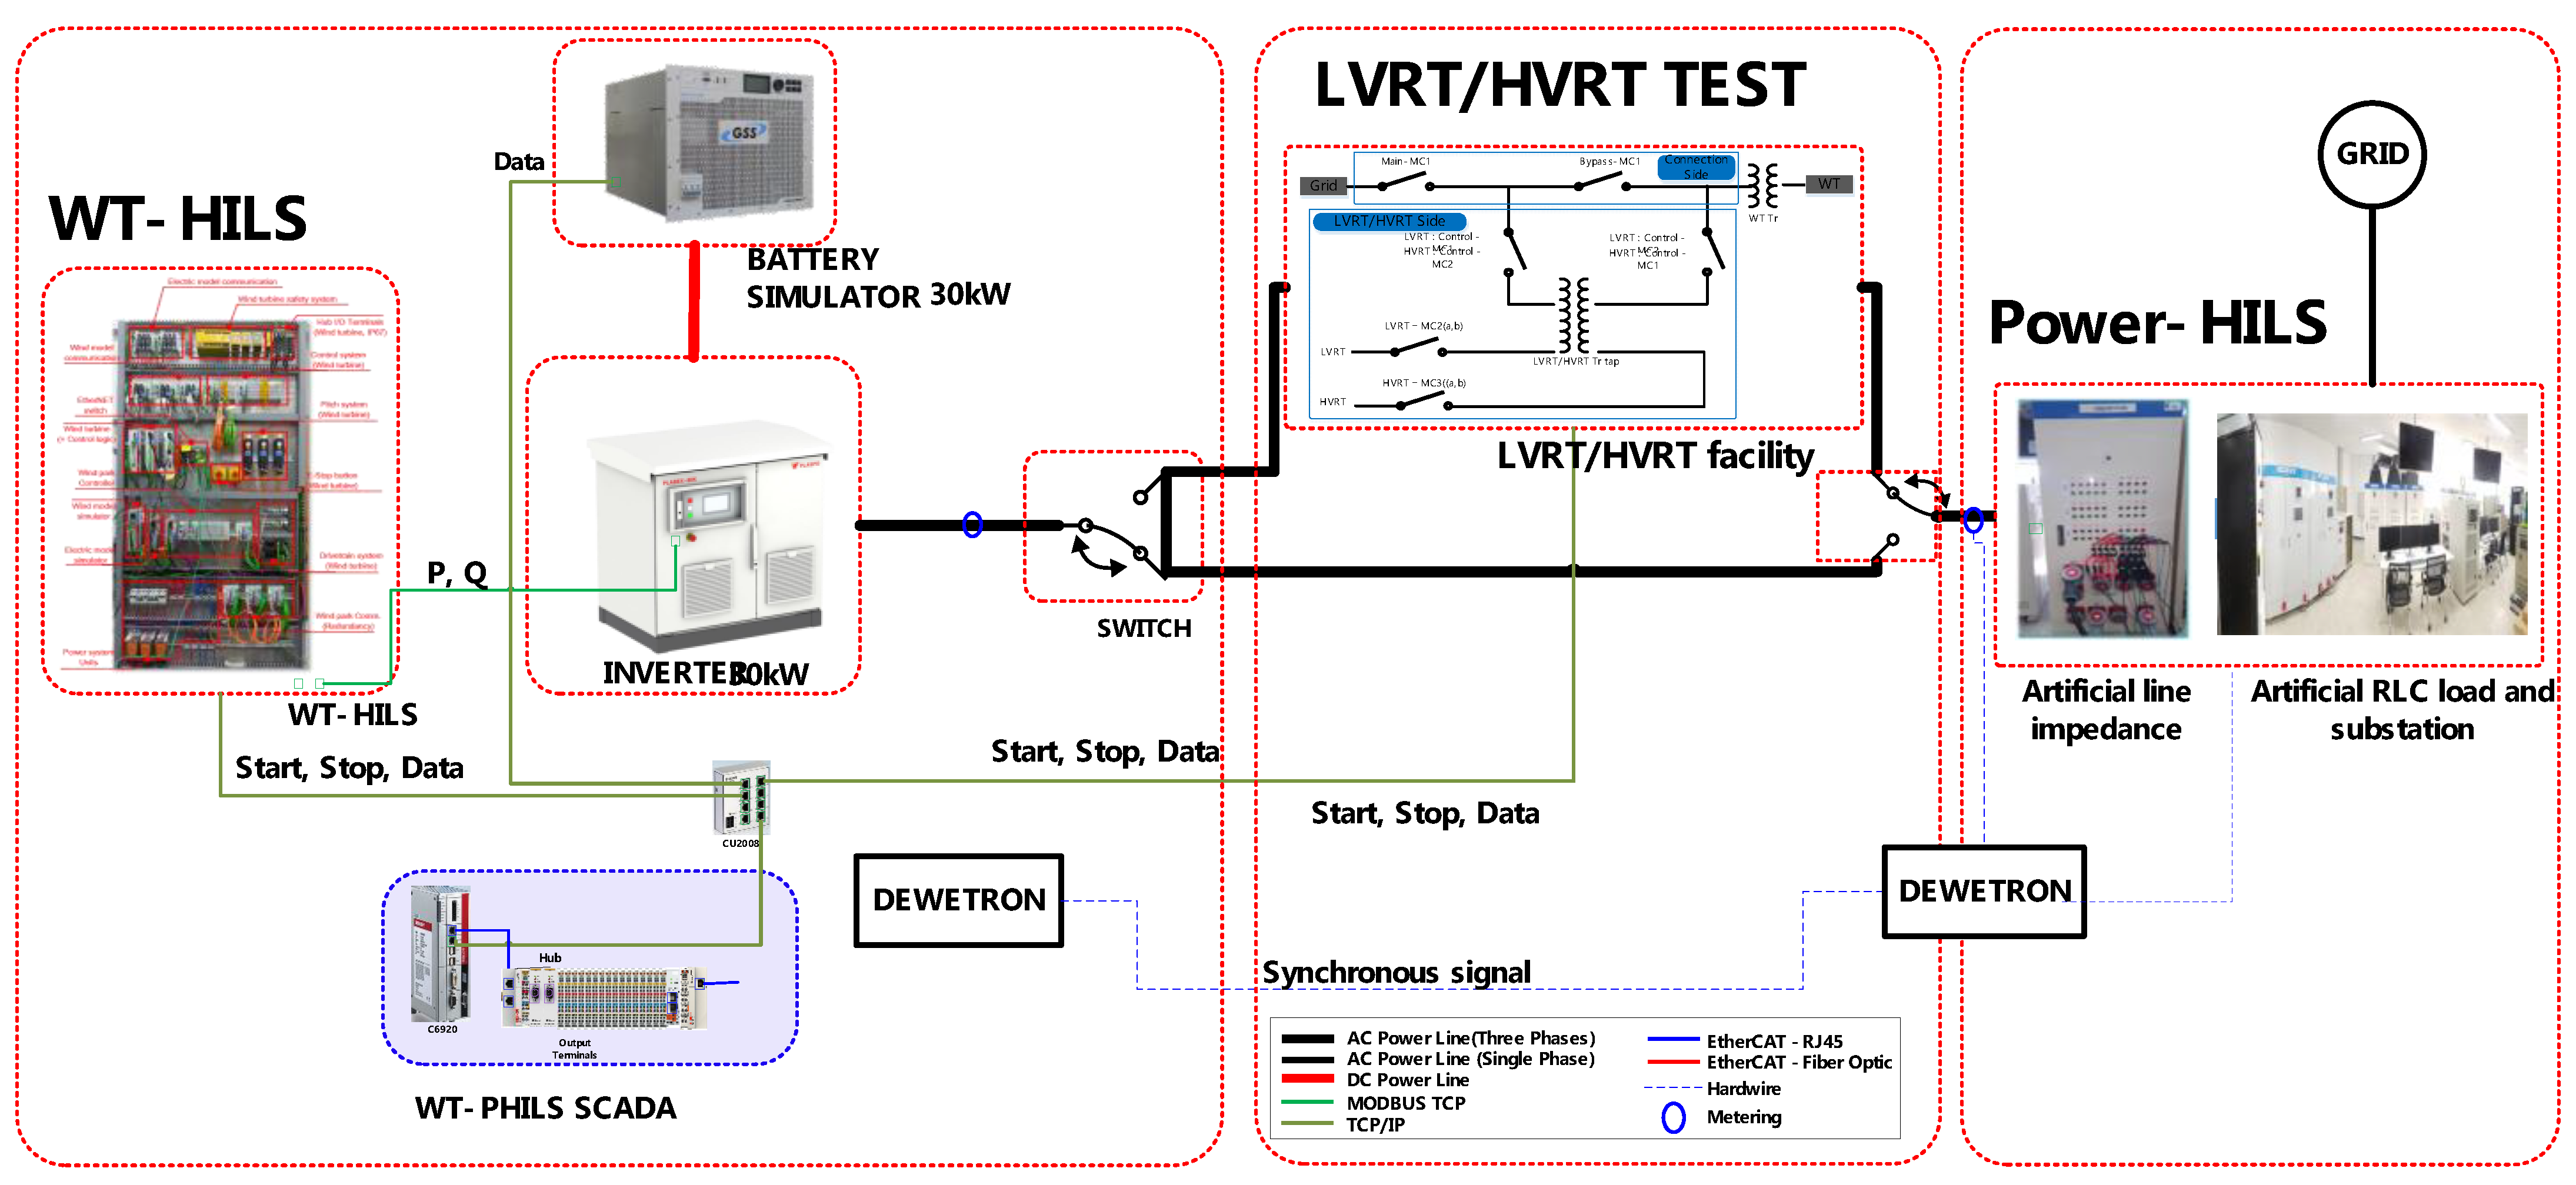
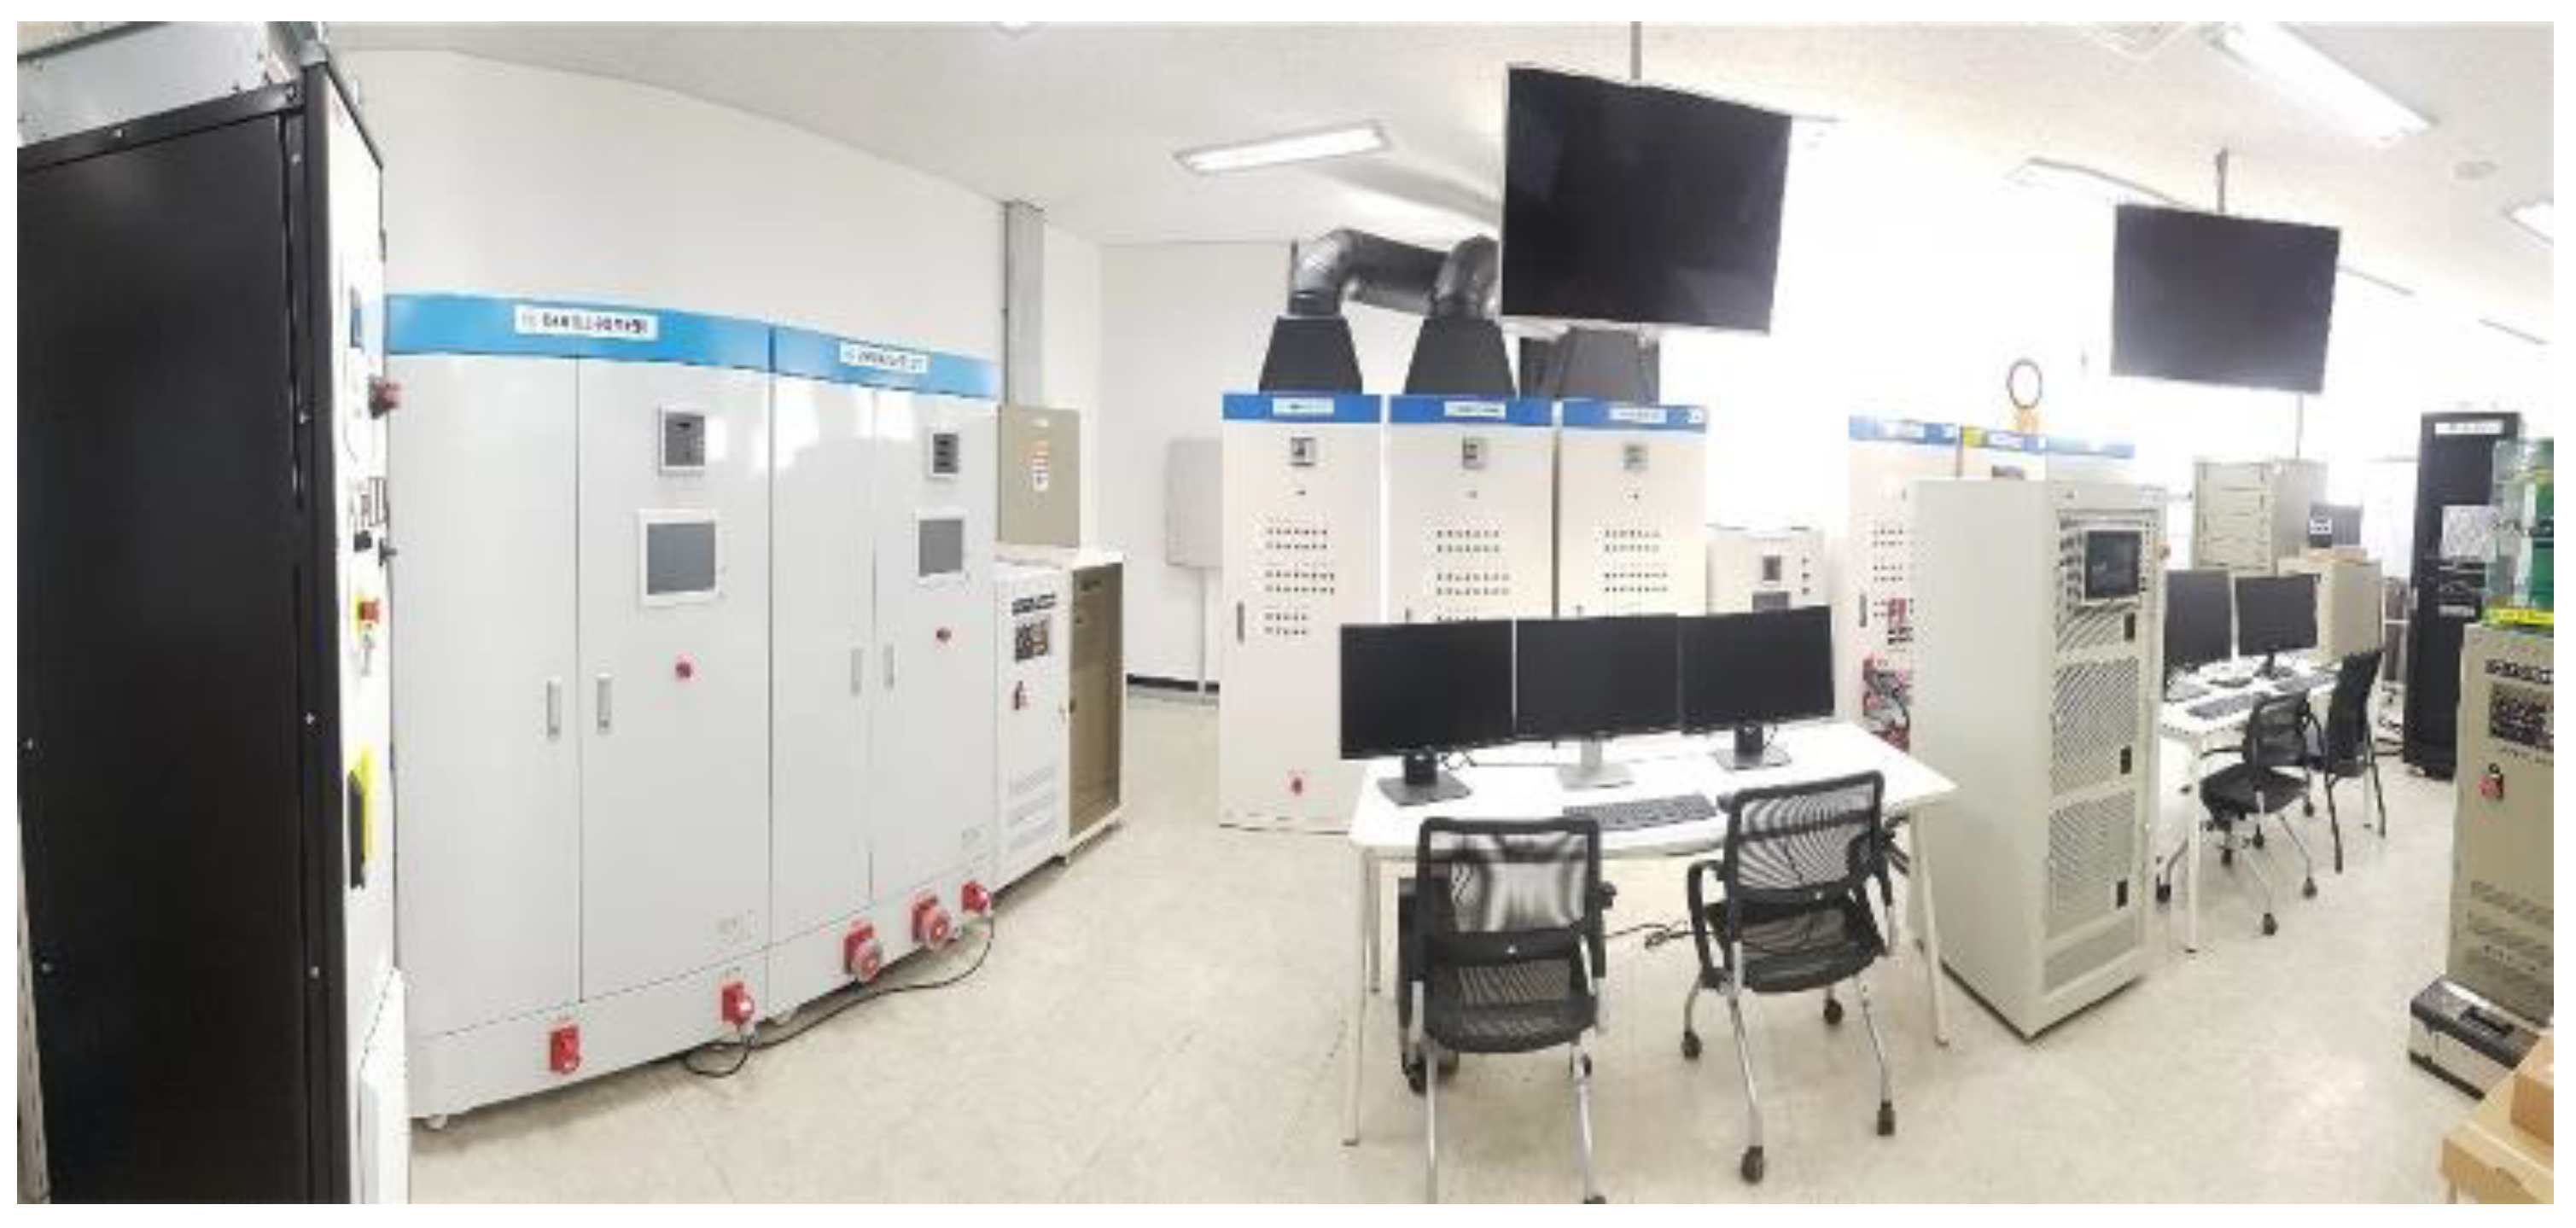
5. Implementation of a 30 kW-Scale Hardware-in-Loop Test System for LVRT/HVRT Performance Evaluation of WT
5.1. Evaluation System for a 30 kW-Scale Hardware-in-Loop Test System
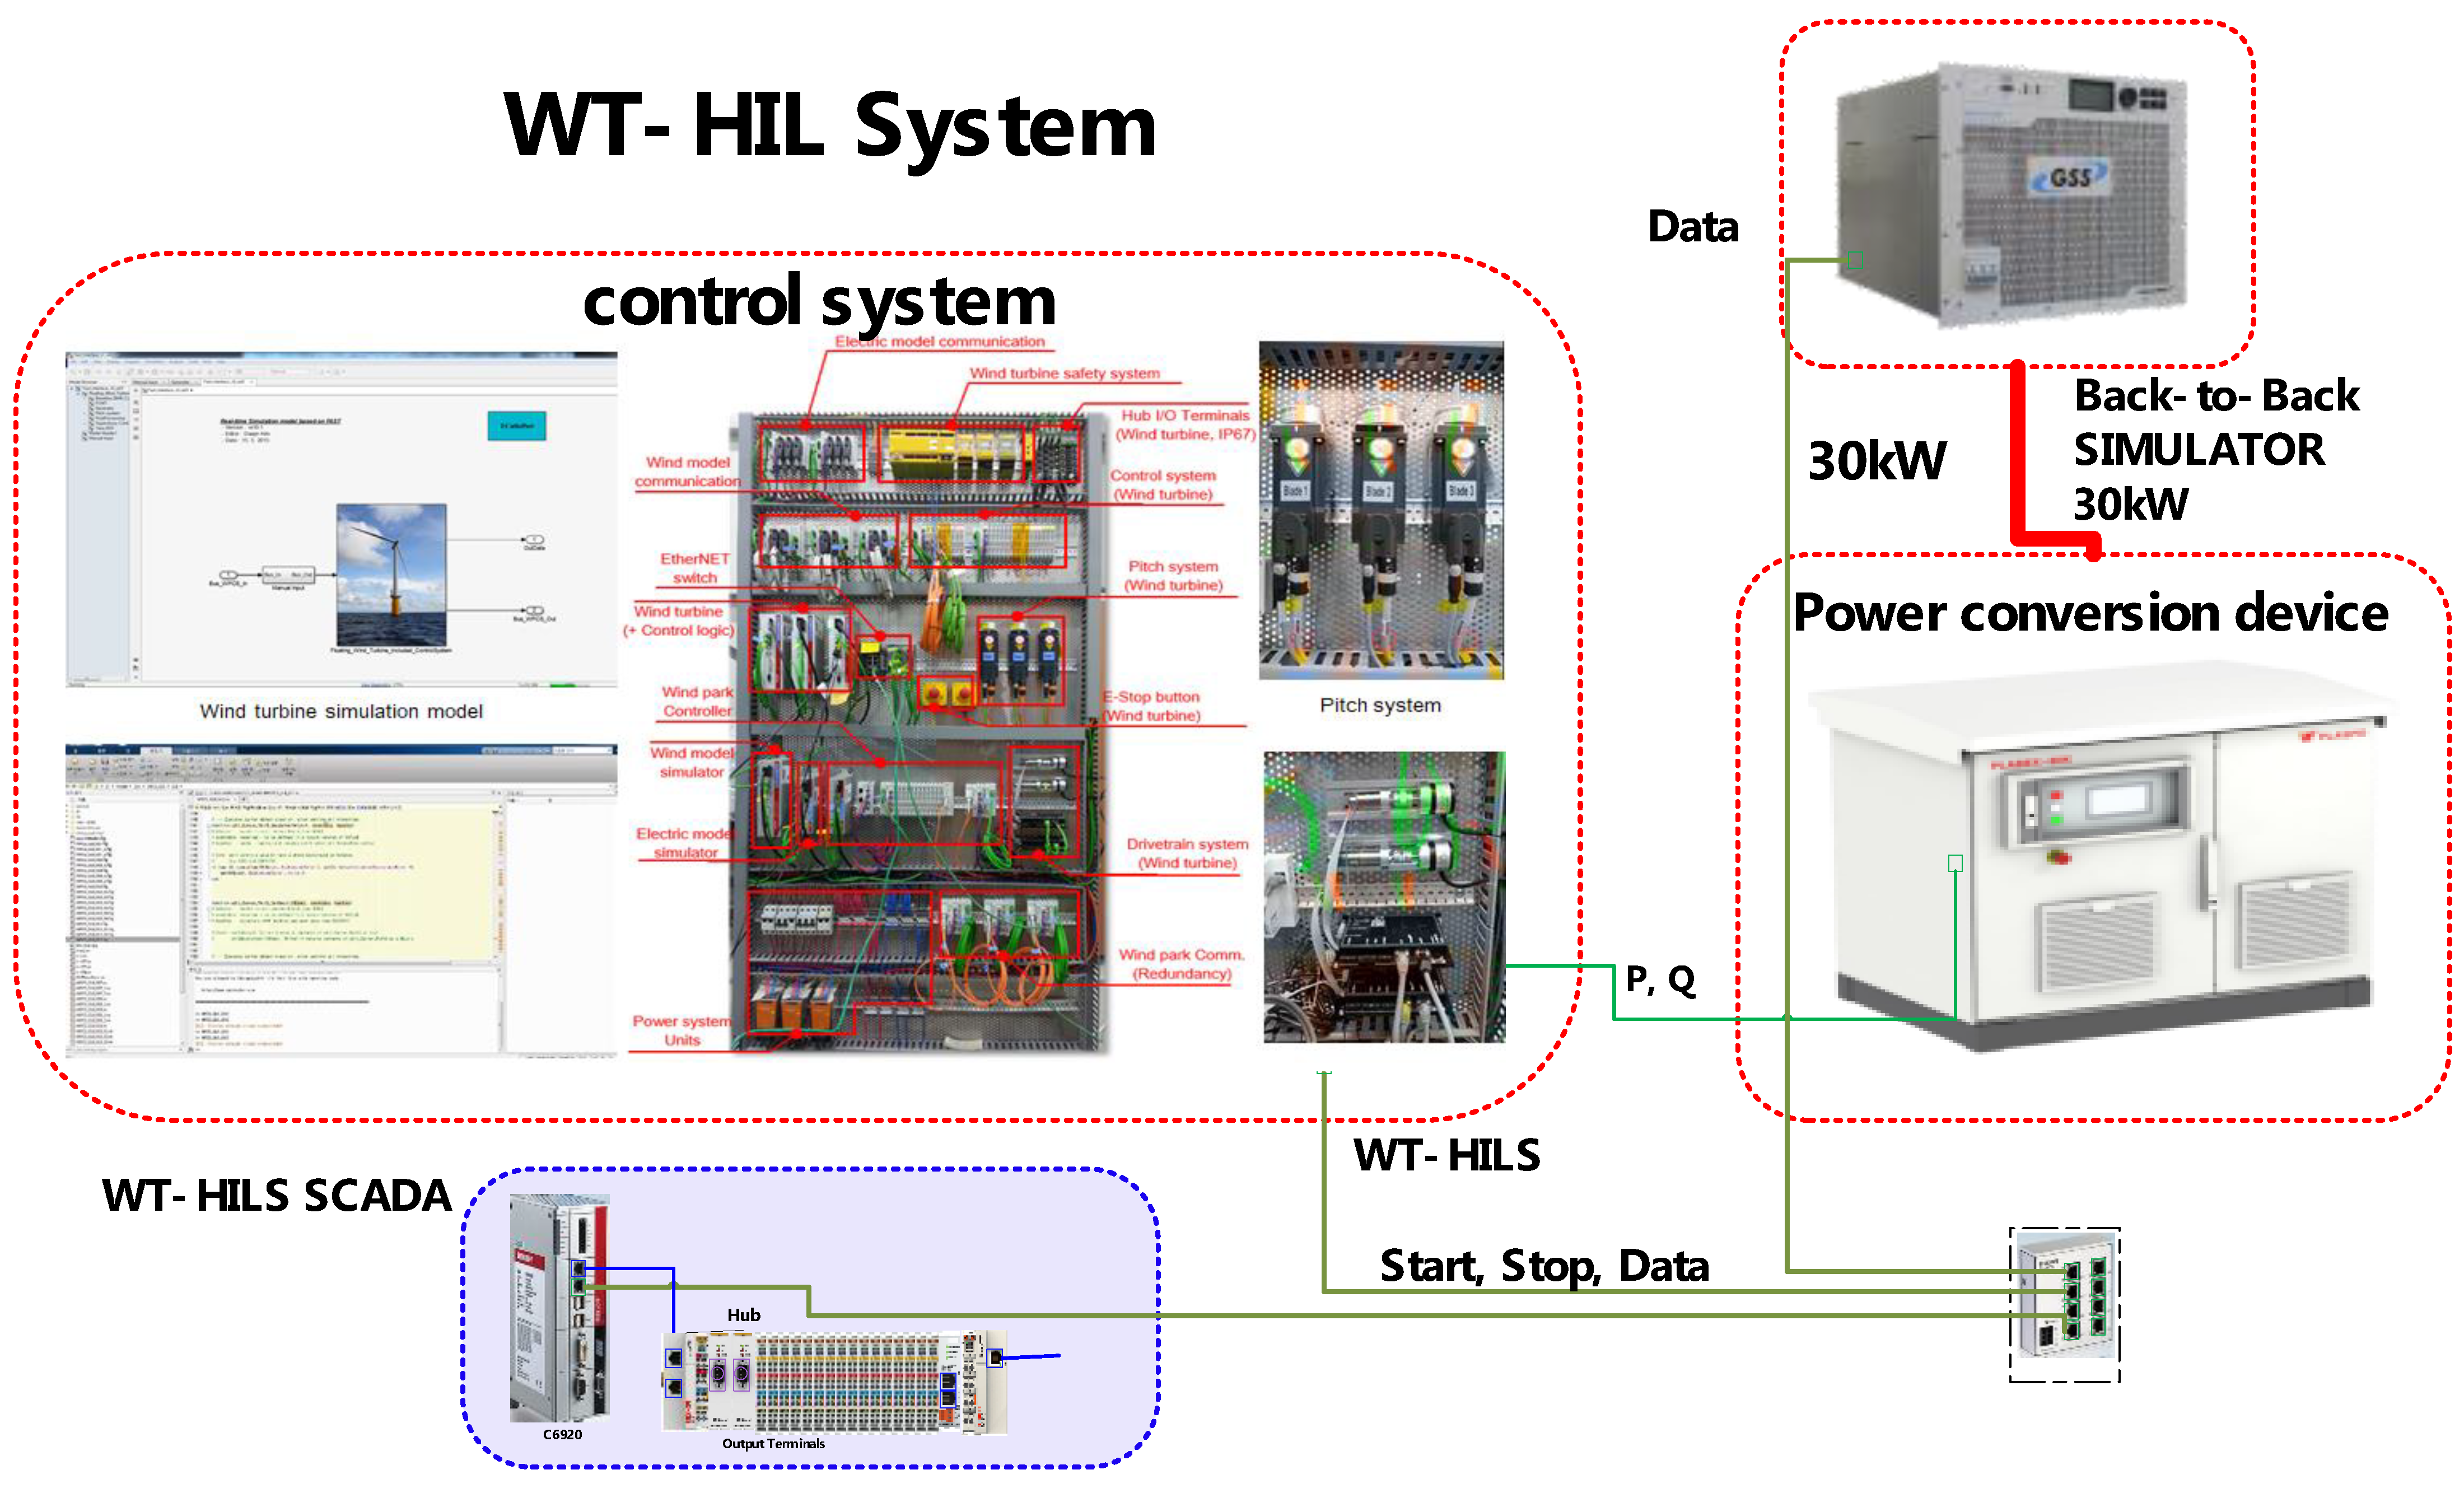
5.2. Wind Turbine Hardware-in-Loop System
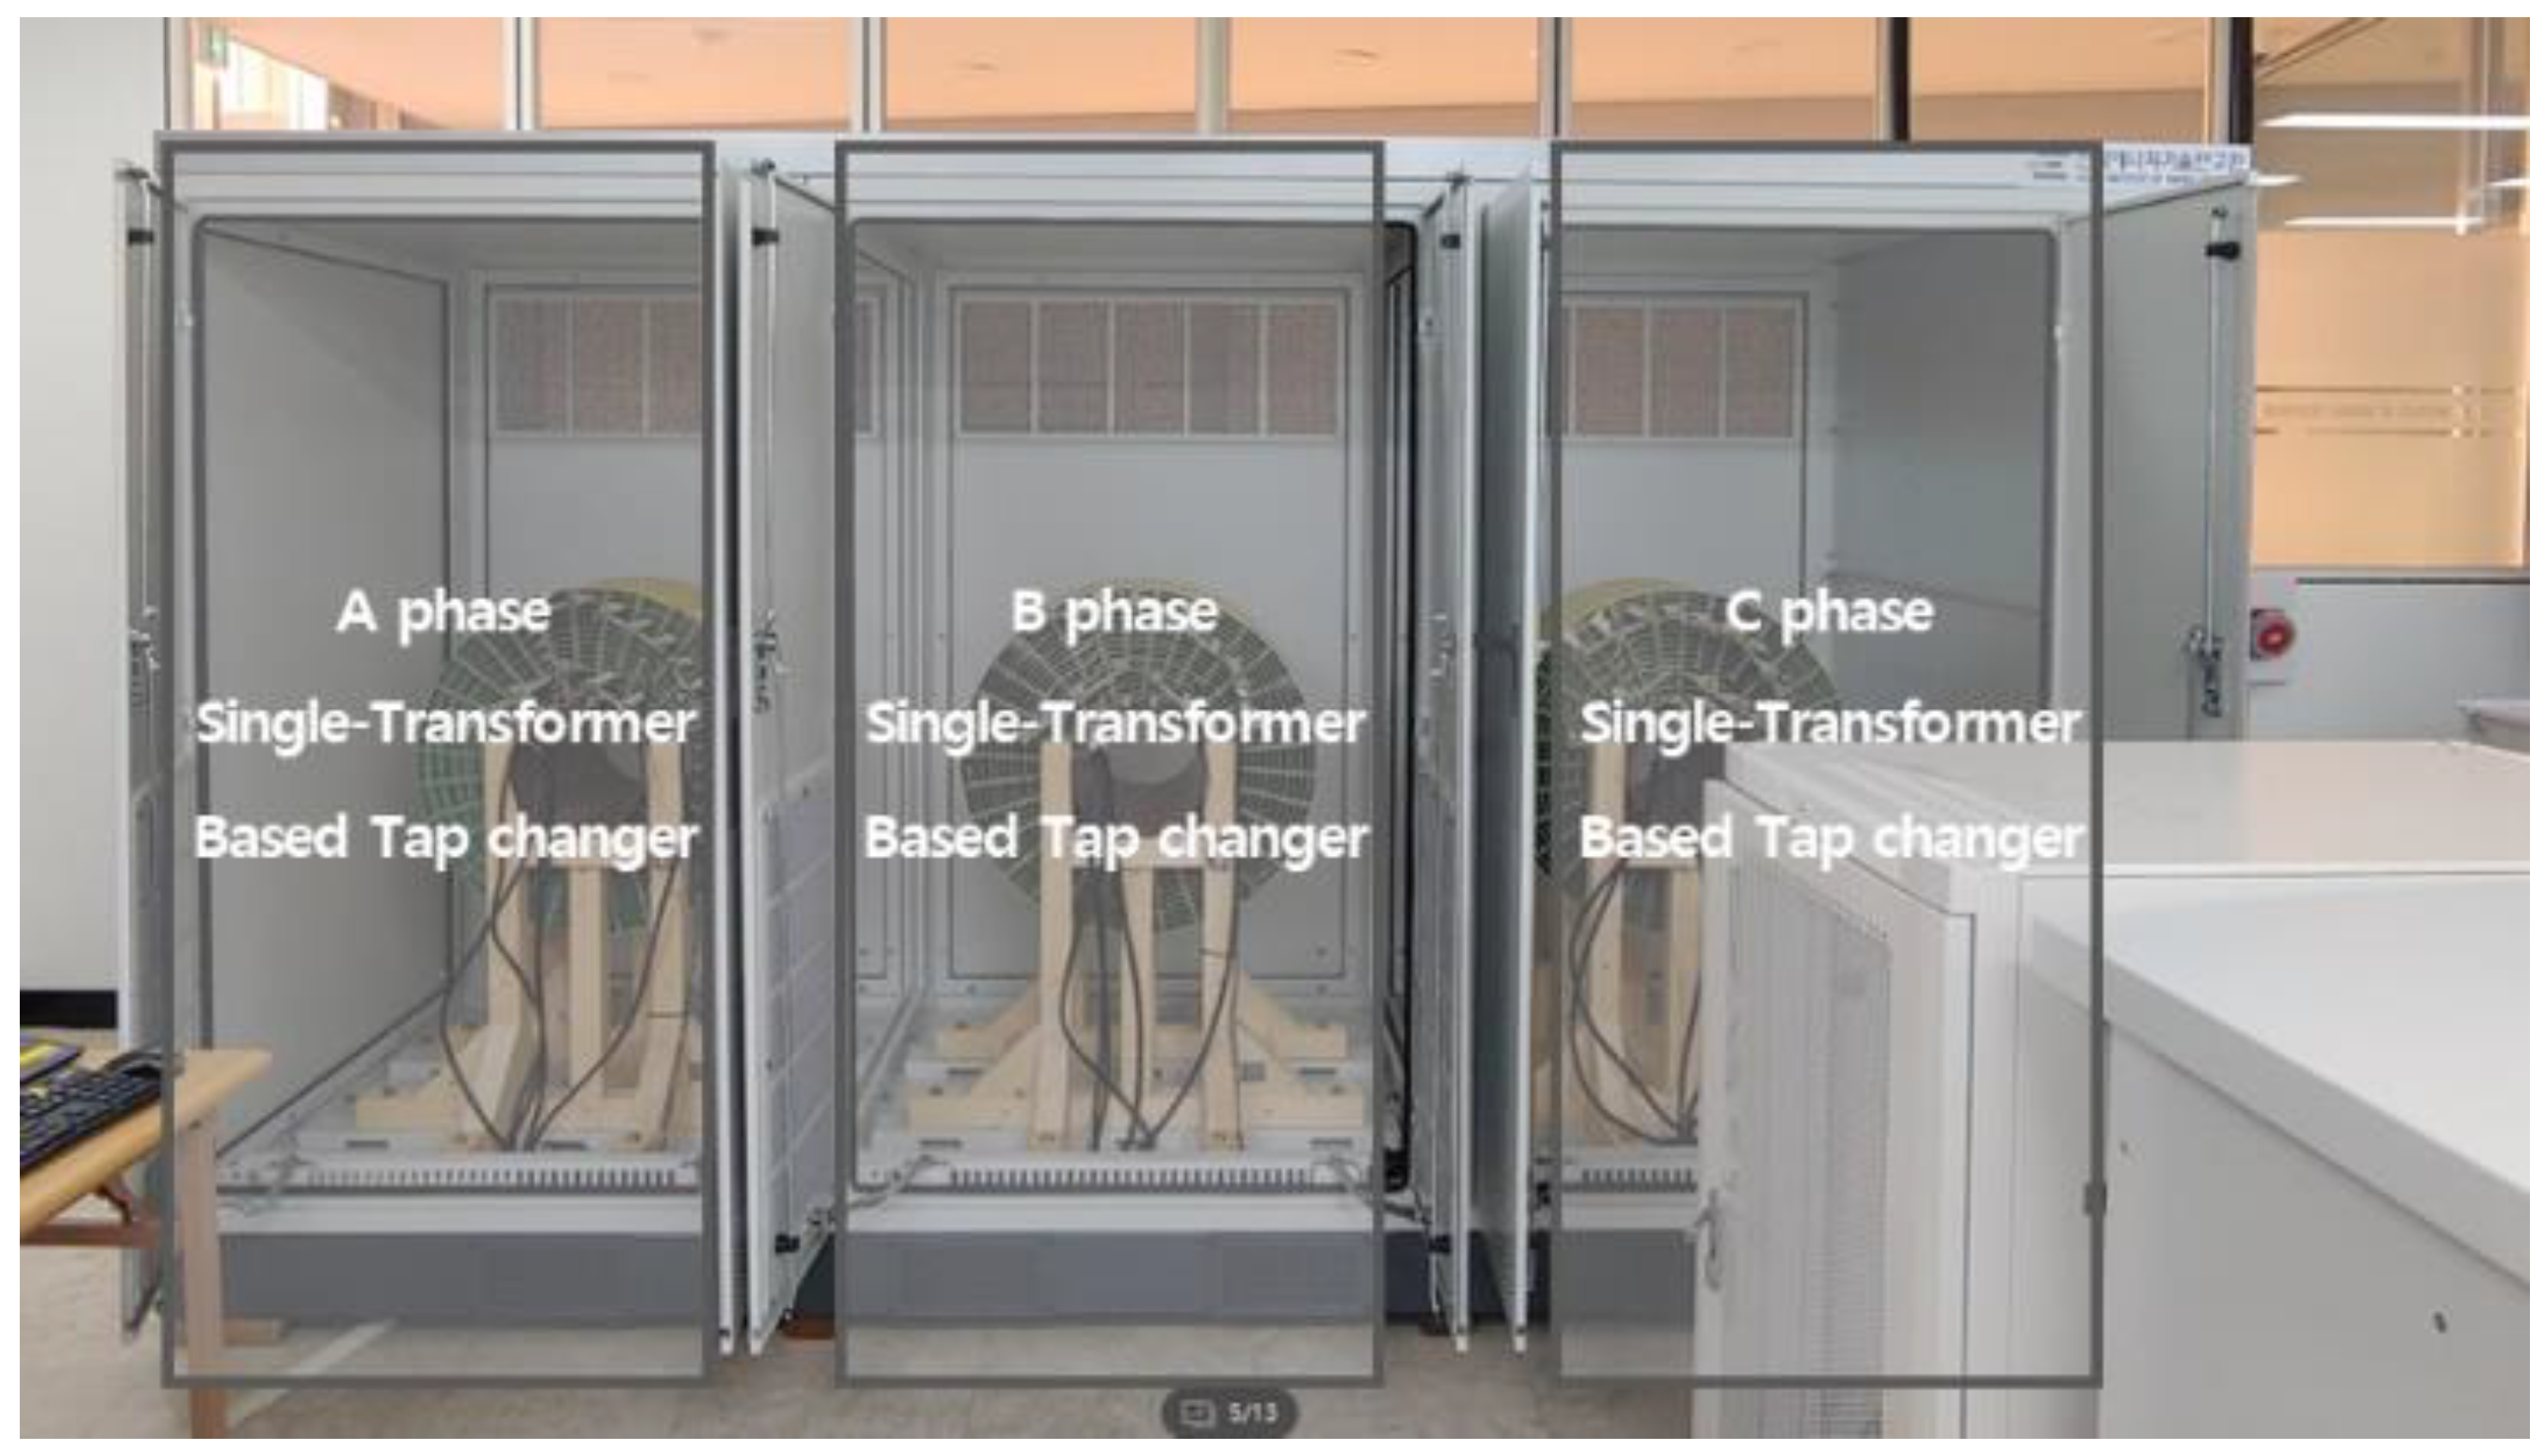
5.3. A 30 kW-Scale LVRT/HVRT Facility
5.4. Power Hardware-in-Loop System
6. Test Results and Analysis
6.1. Test Conditions
6.2. Impedance Determination for LVRT/HVRT Test
6.3. Impedance Determination for LVRT/HVRT Test
- (1)
- Performance verification
- (2)
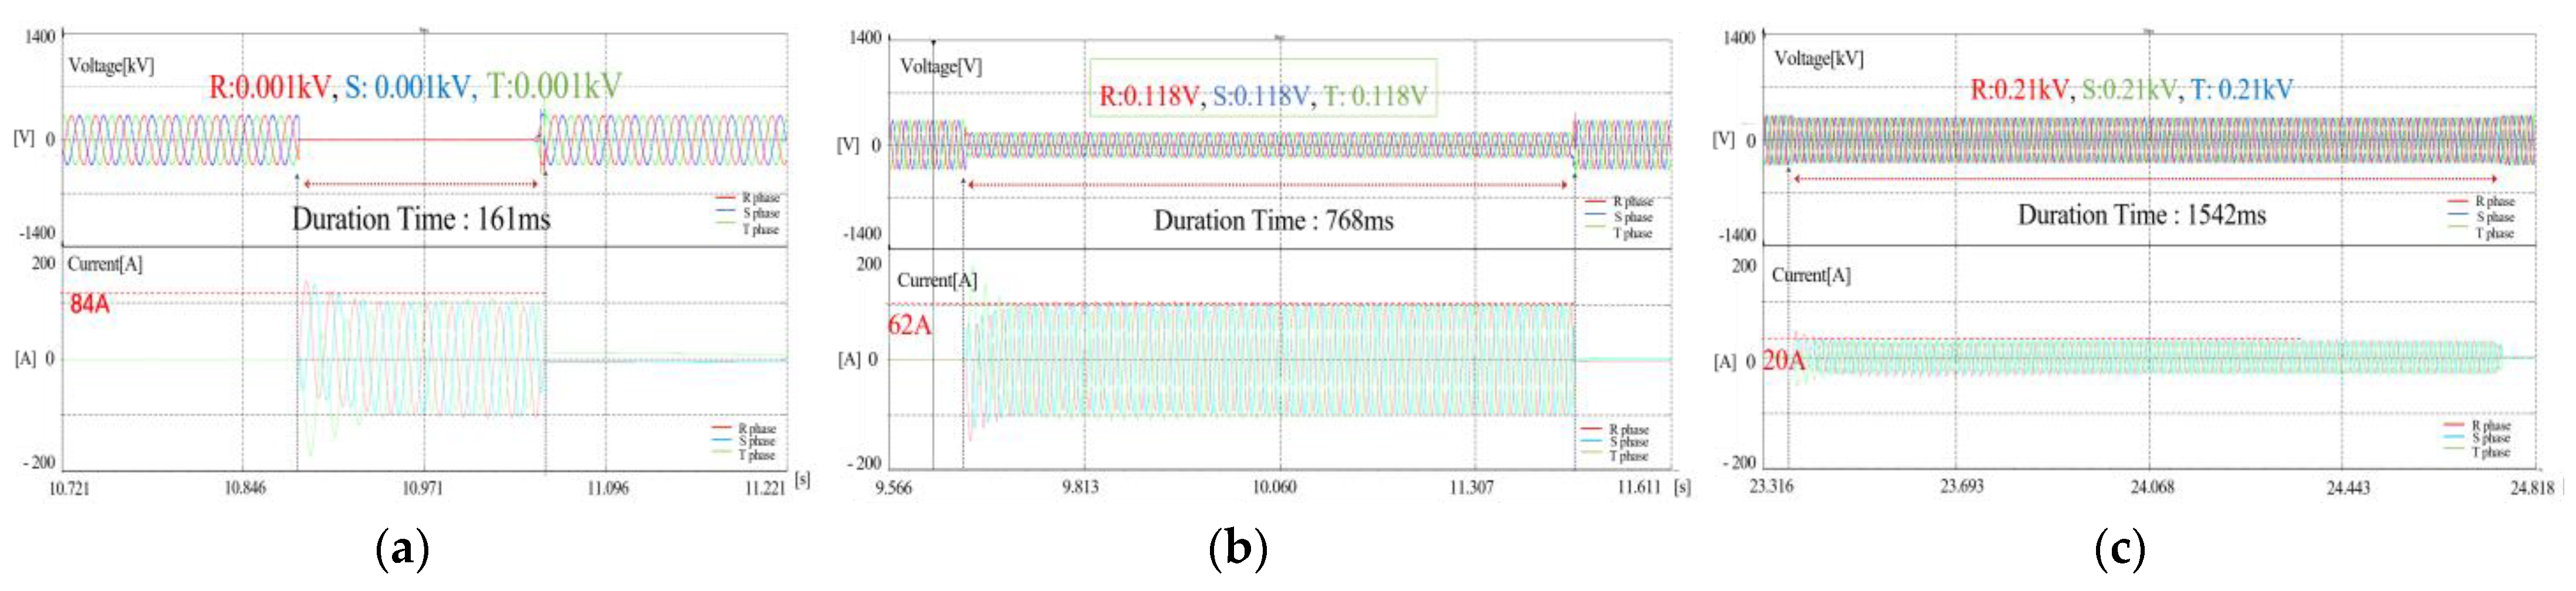
- LVRT Test results
- -
- The 0 PU test
- -
- The 0.5 PU test
- -
- The 0.9 PU test
- (3)
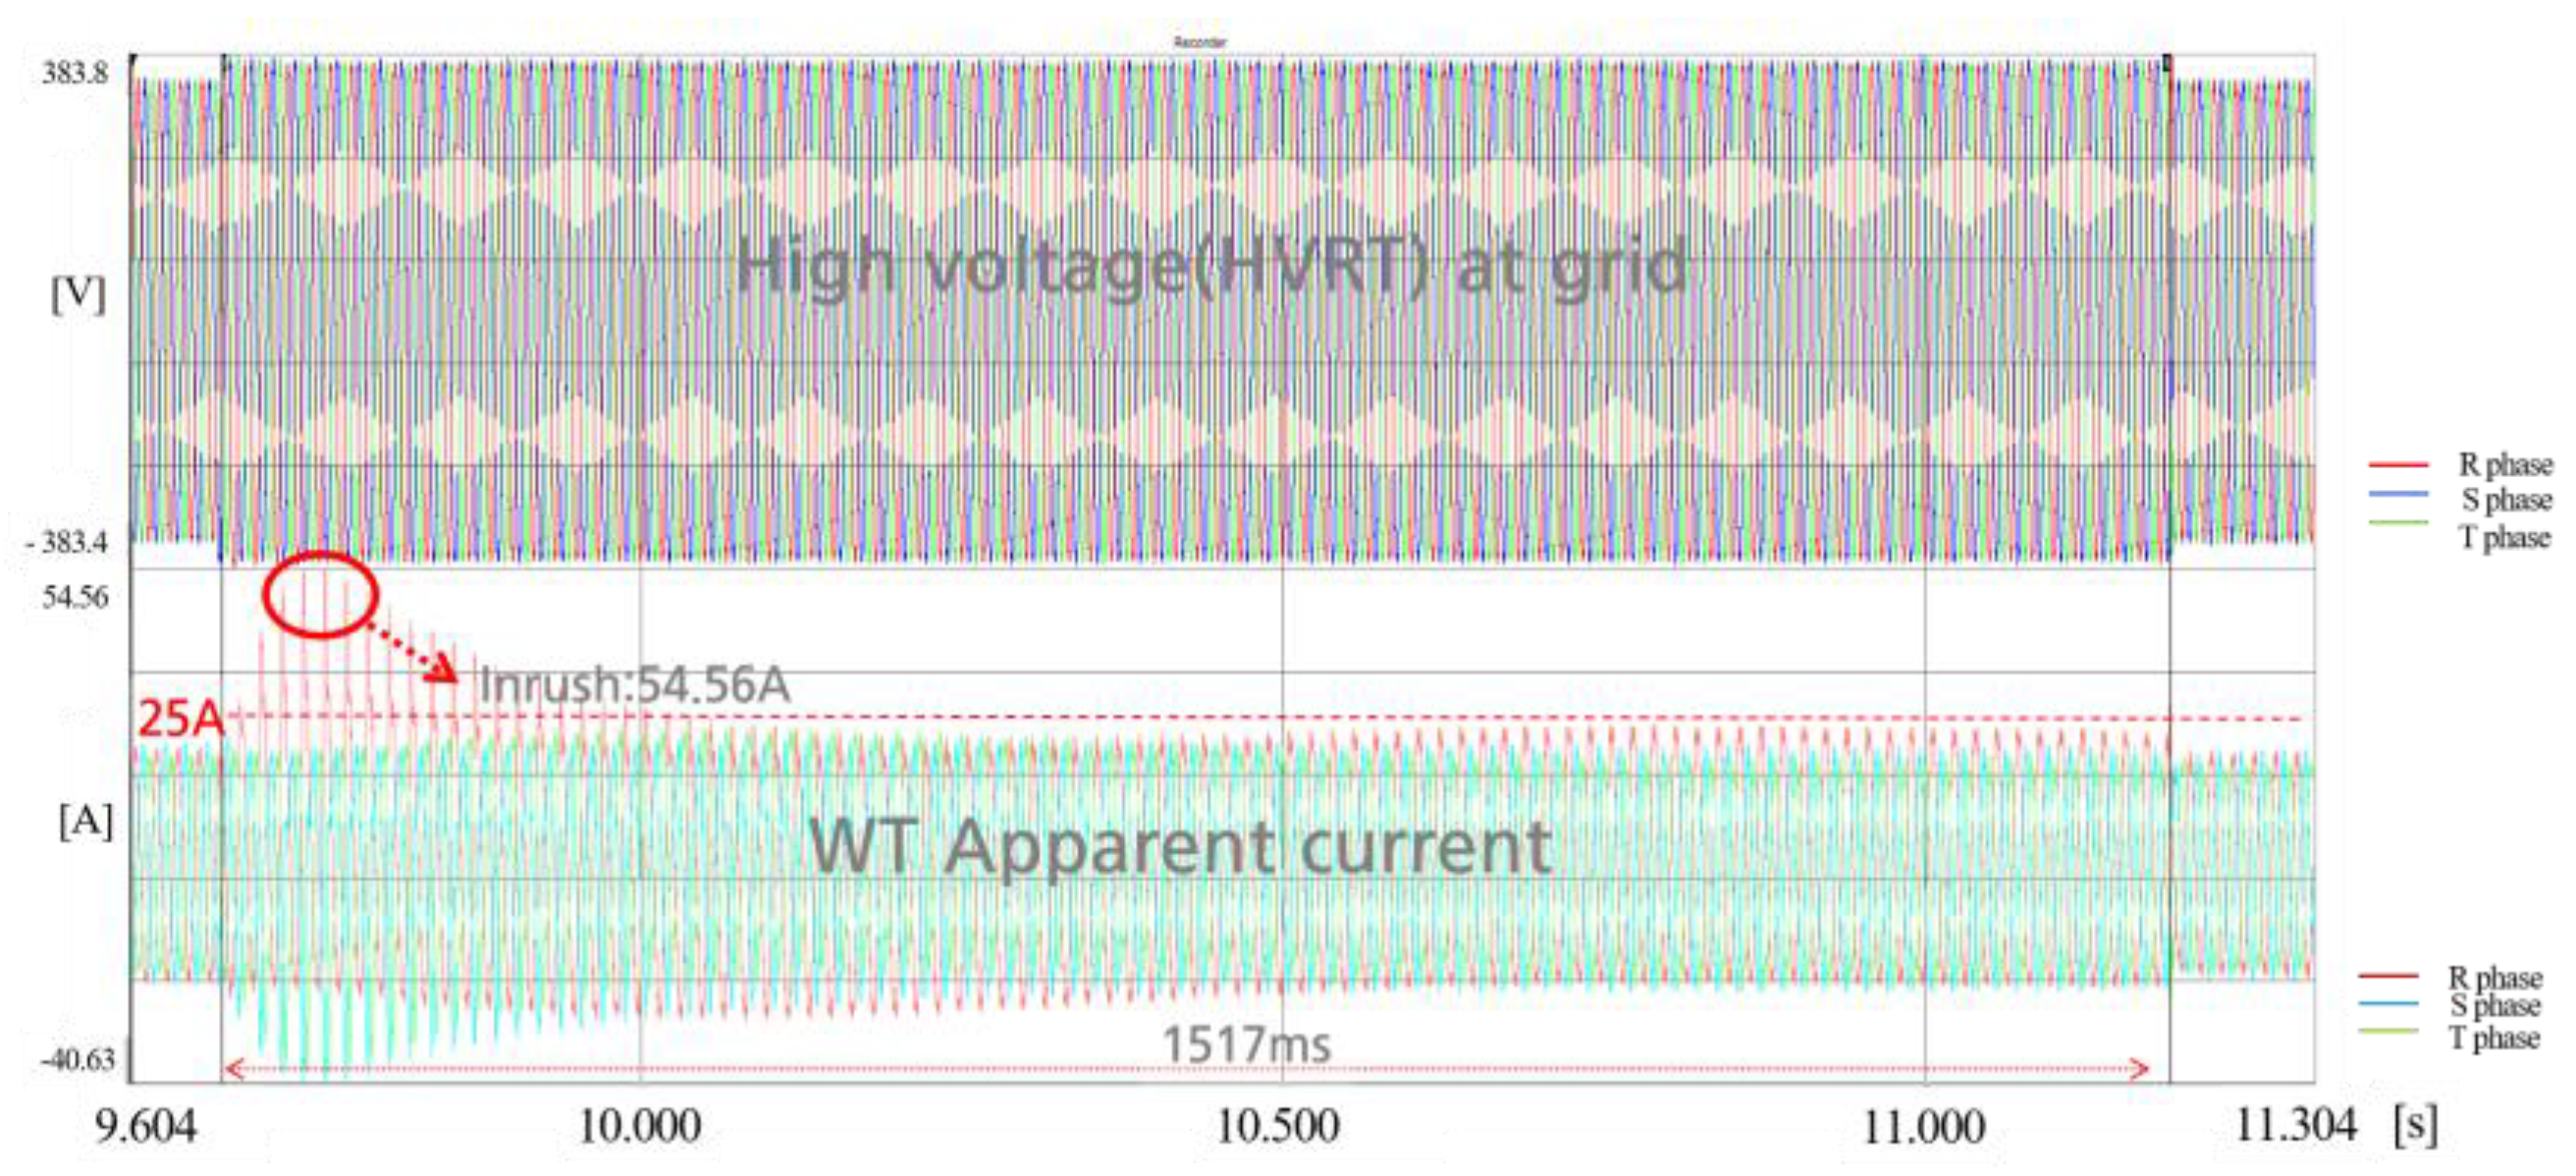
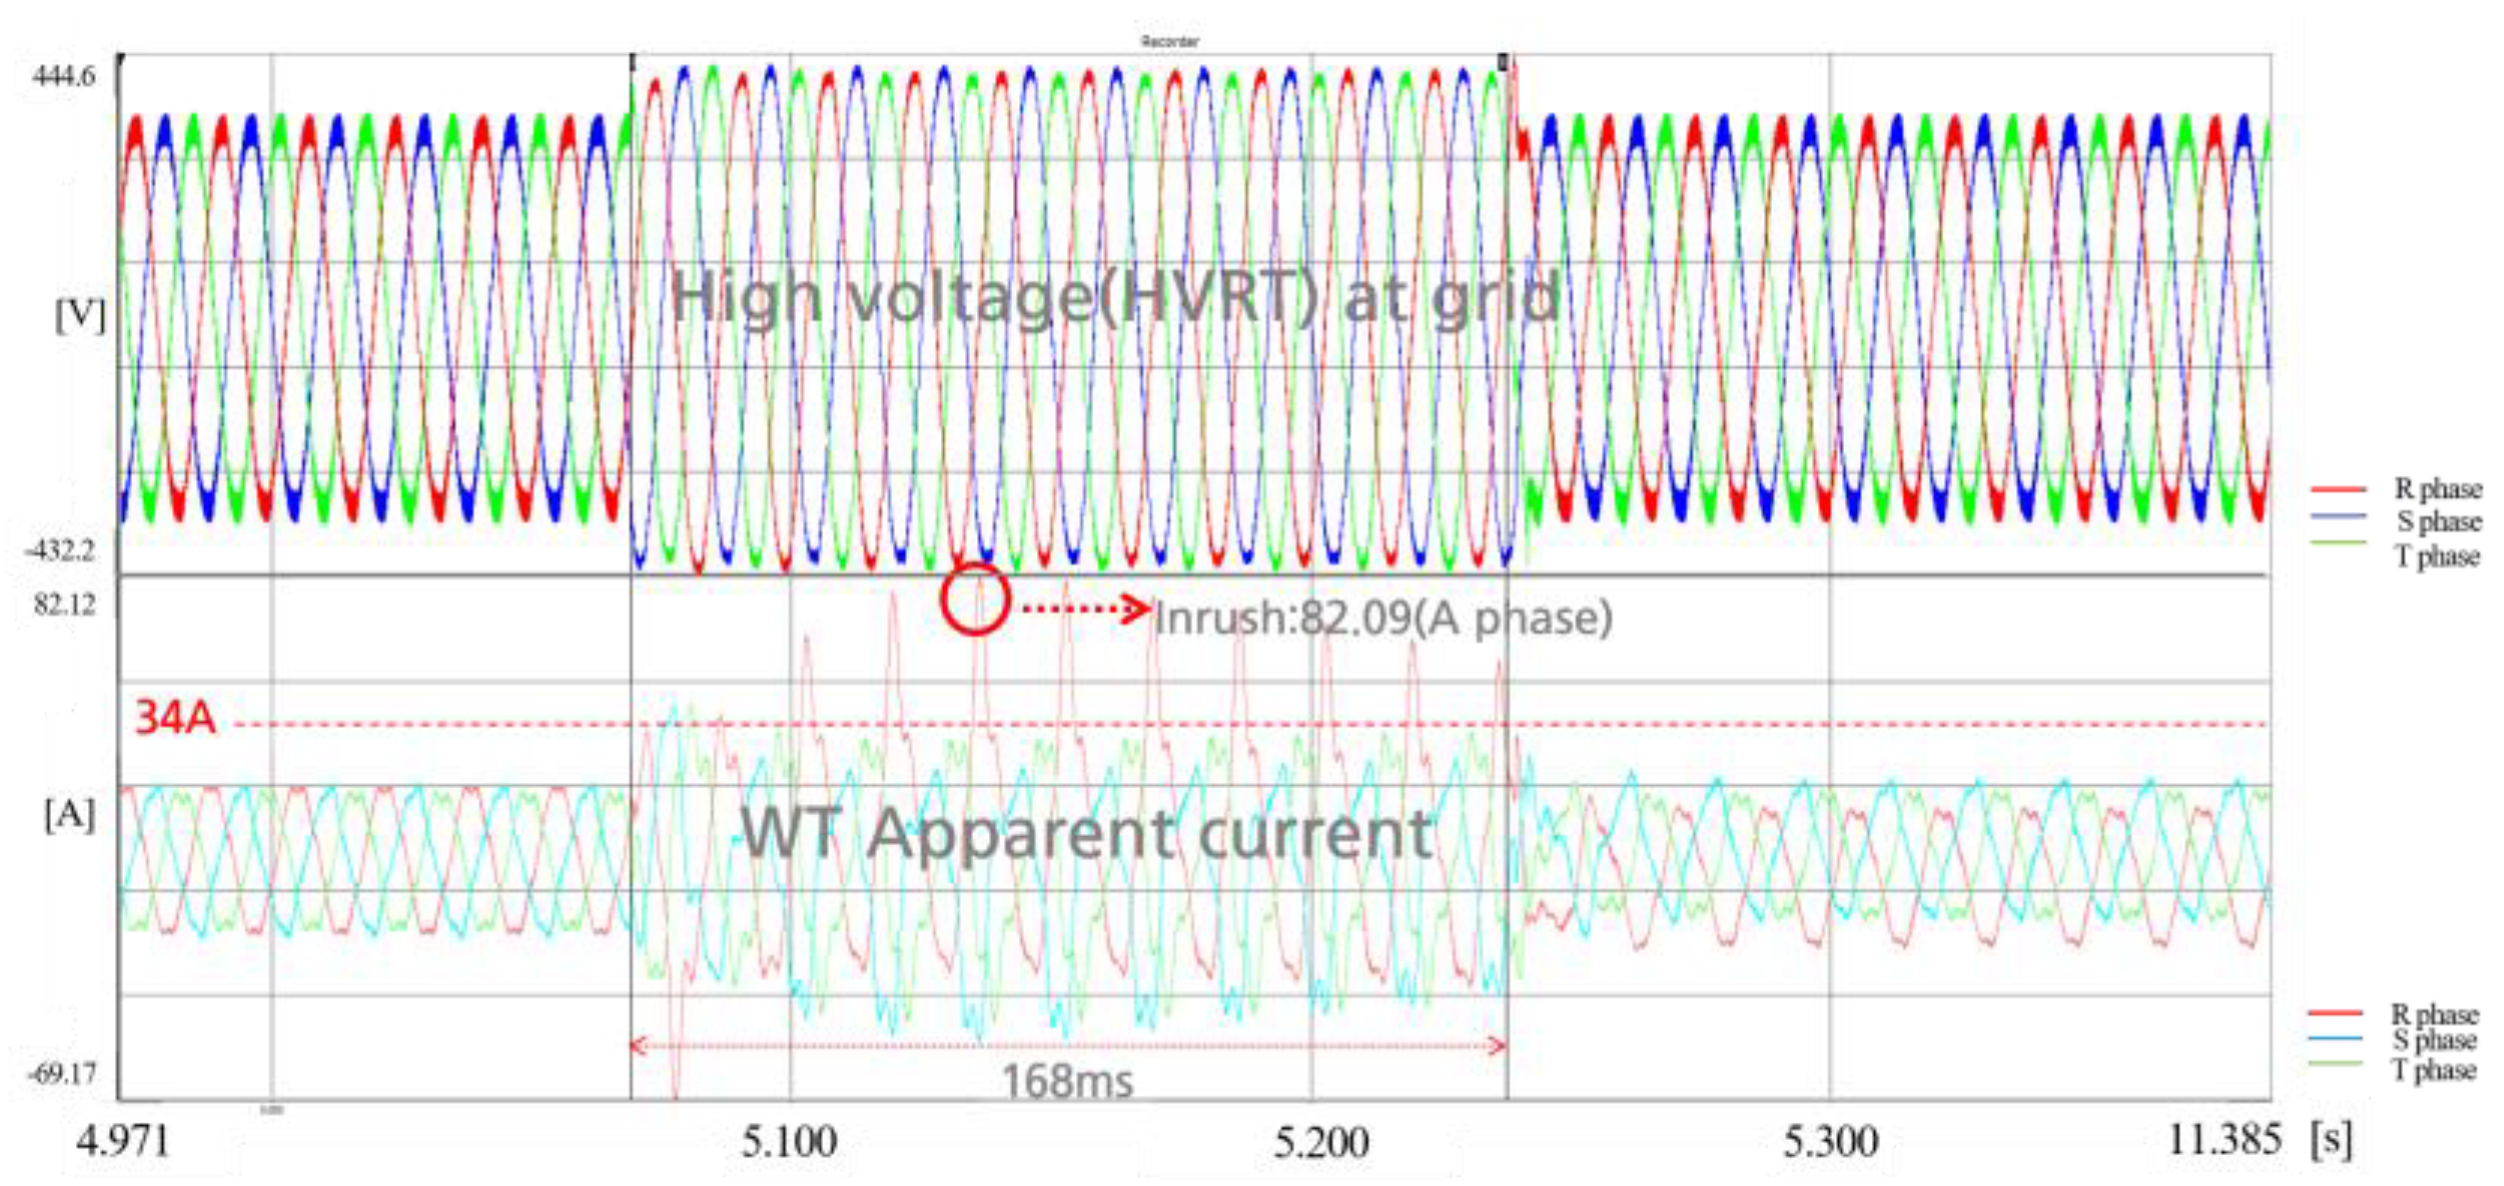
- HVRT Test Results
- -
- The 1.1 PU test
- -
- The 1.3 PU test
7. Conclusions
- (1)
- For the operation of the LVRT/HVRT test facility, the wiring method of the autotransformer should be changed according to the overvoltage (HVRT) and undervoltage (LVRT) tests. Under these concepts, this paper proposes a differential operation strategy considering LVRT/HVRT wiring method to perform the stable test when the wind turbine generates power normally;
- (2)
- Using the proposed method, it was confirmed that the voltage of the auto-transformer was appropriately outputted from zero PU to 0.5 PU by the impedance determination method. However, the voltages from 0.5 PU to 1.3 PU were not outputted as accurate values due to a voltage drop caused by series impedance, even though the current determined by parallel impedance was kept within the allowable range (based on three times the short circuit ratio). Therefore, a parallel and series impedance at voltage level from 0.7 PU to 1.3 PU was adapted as re-calculated values by successive approximation method;
- (3)
- From the voltage characteristic results of all test procedures, it was confirmed that the error range of test voltage was satisfied within 5%, presented by the test guideline of IEC-61400-21-1. It was also found that the duration time of LVRT was exactly maintained as the value time presented by the test guideline of IEC-61400-21-1;
- (4)
- Therefore, it is clear that the proposed test strategy and implementation method of the test facility are useful tools for the dynamic performance verification of WT. Furthermore, based on the test results using a 30 kW-scale facility, we plan to apply the operation and tap decision method to a 12 MW facility in future work.
Author Contributions
Funding
Data Availability Statement
Conflicts of Interest
References
- Gu, H.; Yan, R.; Saha, T. Review of system strength and inertia requirements for the national electricity market of Australia. CSEE J. Power Energy Syst. 2019, 5, 295–305. [Google Scholar]
- Probert, S.; Nutt, S. Generator Fault Ride through (FRT) Investigation—Stage 1; Transpower New Zealand Ltd.: Wellington, New Zealand, 2009. [Google Scholar]
- IEC Standard 61400-21; IEC 61400: Wind Energy Generation Systems-Part 21-1: Measurement and Assessment of Electrical Characteristics—Wind Turbines 8.5.2.2. IEC: Geneva, Switzerland, 2019.
- Korea Electricity Security Review, KEEI 2021. Available online: www.iea.org (accessed on 3 May 2023).
- Karkri, Y.E.; Rey-Boué, A.B.; Moussaoui, H.E.; Stöckl, J.; Strasser, T.I. Improved Control of Grid-connected DFIG-based Wind Turbine using Proportional-Resonant Regulators during Unbalanced Grid. Energies 2019, 12, 4041. [Google Scholar] [CrossRef]
- Arani, M.F.M.; Mohamed, Y.A.R.I. Assessment and Enhancement of a Full-Scale PMSG-Based Wind Power Generator Performance under Faults. IEEE Trans. Energy Convers. 2016, 31, 735–746. [Google Scholar] [CrossRef]
- Kim, K.H.; Jeung, Y.C.; Lee, D.C.; Kim, H.G. LVRT Scheme of PMSG Wind Power Systems Based on Feedback Linearization. IEEE Trans. Power Electron. 2012, 27, 2376–2384. [Google Scholar] [CrossRef]
- Geng, H.; Liu, L.; Li, R.Q. Synchronization and Reactive Current Support of PMSG-Based Wind Farm during Severe Grid Fault. IEEE Trans. Sustain. Energy 2018, 9, 1596–1604. [Google Scholar] [CrossRef]
- Zhong, C.; Wei, L.; Yan, G. Low Voltage Ride-through Scheme of the PMSG Wind Power System Based on Coordinated Instantaneous Active Power Control. Energies 2017, 10, 995. [Google Scholar] [CrossRef]
- Yang, Y.; Blaabjerg, F.; Zou, Z. Benchmarking of Voltage Sag Generators. In Proceedings of the 38th Annual Conference on IEEE Industrial Electronics Society, Montreal, QC, Canada, 25–28 October 2012; pp. 943–948. [Google Scholar]
- Park, J.B.; Kim, M.S.; Rho, D.S. Characteristic Analysis and Implementation of 30 kW Portable Test Equipment for Performance Evaluation in Energy Storage System. Trans. Korean Inst. Electr. Eng. 2018, 67, 715–723. [Google Scholar]
- Essl, N.; Renner, H. Influence of LVRT test equipment characteristics on the dynamic performance of a power generation unit quality characteristics of grid connected wind turbines. In Proceedings of the 23rd International Conference on Electricity Distribution, Lyon, France, 15–18 June 2015; p. 1133. [Google Scholar]
- Kikusato, H. Performance analysis of grid-forming inverters in existing conformance testing. Energy Rep. 2022, 8, 73–83. [Google Scholar] [CrossRef]
- Saniter, C.; Janning, J. Test bench for grid code simulator for multiMW wind turbines, design and control. IEEE Trans. Power Electron. 2008, 23, 1707–1715. [Google Scholar] [CrossRef]
- Uphues, A.; Nötzold, K.; Wegener, R.; Soter, S.; Griessel, R. Inverter based voltage sag generator with PR-controller. In Proceedings of the 38th Annual Conference on IEEE Industrial Electronics Society, Montreal, QC, Canada, 25–28 October 2012; pp. 1037–1042. [Google Scholar]
- Pollanen, R.; Kankainen, L.; Paakkonen, M.; Ollila, J.; Strandberg, S. Full-power converter based test bench for low voltage ride-through testing of wind turbine converters. In Proceedings of the 2011 14th European Conference on Power Electronics and Applications, Birmingham, UK, 30 August–1 September 2011; pp. 1–10. [Google Scholar]
- Zeng, R.; Nian, H.; Zou, P. A three-phase programmable voltage sag generator for low voltage ride-through capability test of wind turbines. In Proceedings of the 2010 IEEE Energy Conversion Congress and Exposition, Atlanta, GA, USA, 12–16 September 2010; pp. 305–311. [Google Scholar]
- Rainer Klosse. High-Voltage-Ride-Through Test System Based on Transformer Switching. In Proceedings of the 12th International Workshop on Large-Scale Integration of Wind Power into Power Systems as well as Transmission Networks for offshore Wind Power Plant, London, UK, 22–24 October 2013. [Google Scholar]
- Wessels, C.; Lohde, R.; Fuchs, F.W. Transformer based voltage sag generator to perform LVRT and HVRT tests in the laboratory. In Proceedings of the 14th International Power Electronics and Motion Control Conference EPE-PEMC 2010, Ohrid, Macedonia, 6–8 September 2010; pp. T11-8–T11-13. [Google Scholar]
- Jonkman, J.; Buhl, M.L. FAST User’s Guide; National Renewable Energy Laboratory: Golden, CO, USA, 2005. [Google Scholar]


| Ref. | Contents | |
|---|---|---|
| Previous Methods | Proposed Method | |
| [5,6,7,8,9,10] |
|
|
| [12,13] |
|
|
| [14,15,16,17] |
|
|
| Impedance (Existing) | Transformer (Proposed) |
|---|---|
|
|
|
|
|
|
|
|
| Voltage (x PU) | HVRT | Voltage (x PU) | LVRT | ||
|---|---|---|---|---|---|
| 1.3 | 0.23 | 0.77 | 0.9 | 0.1 | 0.9 |
| 0.8 | 0.2 | 0.8 | |||
| 1.25 | 0.2 | 0.8 | 0.7 | 0.3 | 0.7 |
| 0.6 | 0.4 | 0.6 | |||
| 1.2 | 1.67 | 0.83 | 0.5 | 0.5 | 0.5 |
| 1.15 | 1.3 | 0.87 | 0.4 | 0.6 | 0.4 |
| 0.3 | 0.7 | 0.3 | |||
| 1.11 | 0.9 | 0.91 | 0.2 | 0.8 | 0.2 |
| 0.1 | 0.9 | 0.1 | |||
| 1.05 | 0.5 | 0.95 | 0 | 0.99 | 0.01 |
| Category | Value | Unit |
|---|---|---|
| Rated Power | 5 | MW |
| Rotor Orientation | Upwind | - |
| Number of Blades | 3 | - |
| Rotor Diameter | 126 | m |
| Hub Height | 90 | m |
| Cut-In, Rated Rotor Speed | 6.9, 12.1 | rpm |
| Cut-In, Rated, Cut-Out Wind Speed | 3, 11.4, 25 | m/s |
| Gearbox Ratio | 97:1 | - |
| Generator Inertia | 534,116 | kg m2 |
| Nacelle Mass | 240,000 | kg |
| Tower Mass | 347,460 | kg |
| Classification | Detailed Configuration |
|---|---|
| type of transformer | Air-core & iron-core reactors |
| rated specification | Phase 60 Hz, |
| capacity of transformer | 30 kVA |
| Coil | AI 2NC 2.8 × 10.5 × 1H2W |
| current density | 0.79 A/mm2 |
| No. of turns | 6th floor = 72 T) |
| cooling duct | 10 T × 5 = 50 m |
| Hosting Capacity | S.Tr Ratio | S.Tr Impedance | Line Impedance | Capacity of WT | Rated Current of WT | Line Length |
|---|---|---|---|---|---|---|
| 30 kW | 0.38 kV/ 0.38 kV | 6% | 4% | >10 kW | 20 A | 2 km |
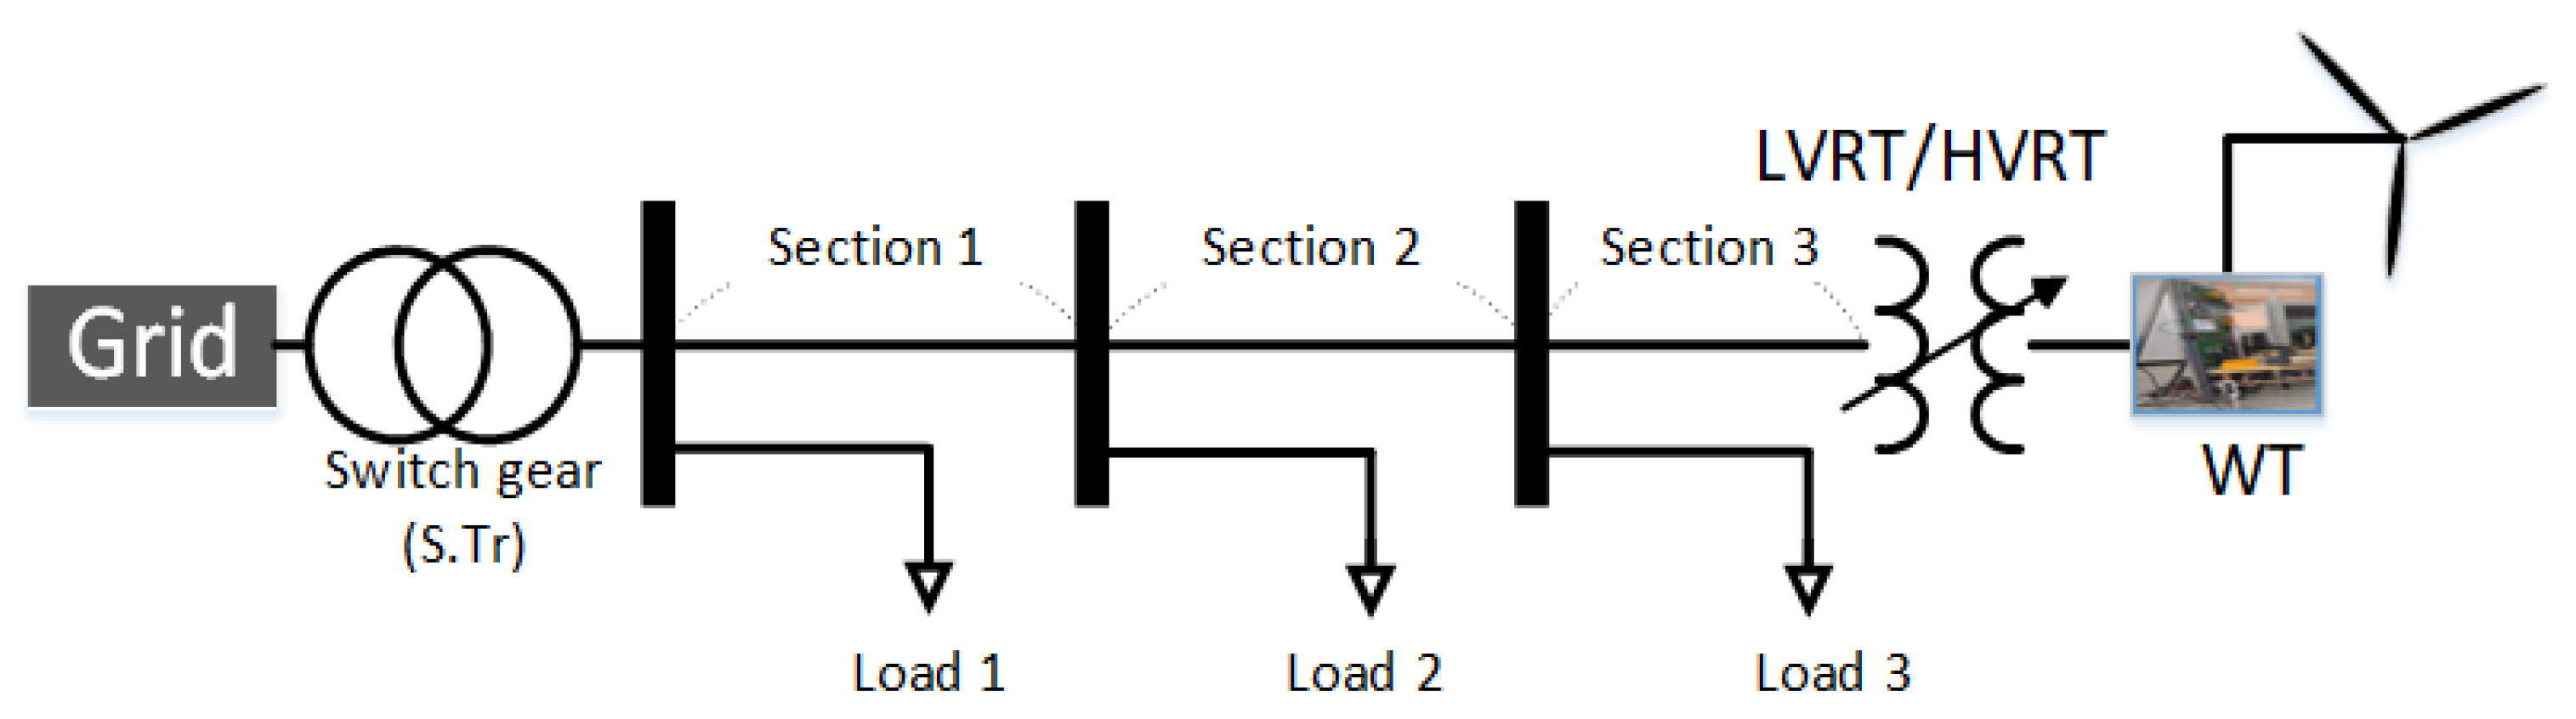
| Section | Line length | Impedance (%; 1 MVA) | Load | RES | ||
| 1 | 0.4 km | 0.8% | 2 kW | 0 | ||
| 2 | 0.8 km | 1.6% | 2 kW | 0 | ||
| 3 | 0.8 km | 1.6% | 1 kW | WT 10 kW (WT HILS) | ||
| Test | Voltage Rate (Percent Unit) | Situation | Phase | WT Operating Power | Duration Time |
|---|---|---|---|---|---|
| Test 1 | 0.0 PU | LVRT | 3 Phase | Full load | 150 ms |
| Test 2 | 0.5 PU | LVRT | 3 Phase | Full load | 900 ms |
| Test 3 | 0.9 PU | LVRT | 3 Phase | Full load | 1500 ms |
| Test 4 | 1.1 PU | HVRT | 3 Phase | Full load | 600 ms |
| Test 5 | 1.3 PU | HVRT | 3 Phase | Full load | 150 ms |
| Z (Ω) Uint | Max. Z (Ω) in Case 3 Phase Fault | ||||
|---|---|---|---|---|---|
| 0.129 Ω (0.344 mH) | rate capacity (30 kVA) | 5.064 Ω (13.44 mH), 45.58 A | |||
| capacity considering three-phase fault (90 kVA) | 1.296 Ω/(3.44 mH), 136.8 A | ||||
| Adapted Z Ω | 3.44 mH | %Z (1 MVA base) | 846% | ||
| Voltage | HVRT/LVRT | ||||
| W1 parallel rate | W2 Series rate | Impedance (Determination) | |||
| Applied Method | Parallel | Series mH | |||
| 130% | 0.77 | 0.23 | Two-step (HVRT) | 2.65 mH | 0.79 mH |
| 110% | 0.83 | 1.67 | Two-step (HVRT) | 2.86 mH | 0.58 mH |
| 90% | 0.9 | 0.1 | Two-step (LVRT) | 3.10 mH | 0.34 mH |
| 50% | 0.5 | 0.5 | One-step (LVRT) | 1.00 mH | 1.72 mH |
| 0 % | 0 | 1 | One-step (LVRT) | 0.01 mH | 3.44 mH |
| Test No. | Test Condition | Test Results | ||||
|---|---|---|---|---|---|---|
| Voltage (Percent Unit) | Duration Time | Voltage (Percent Unit) | Voltage | Duration Time | Current | |
| Test 1 | 0.0 PU | 150 ms | 0.01 PU | 0.003 kV | 161 ms | 84 A |
| Test 2 | 0.5 PU | 900 ms | 0.49 PU | 0.118 kV | 768 ms | 62 A |
| Test 3 | 0.9 PU | 1500 ms | 0.94 PU | 0.208 kV | 1542 ms | 20 A |
| Test | Test Condition | Test Results | ||||
|---|---|---|---|---|---|---|
| Voltage (Percent Unit) | Duration Time | Voltage (Percent Unit) | Voltage | Duration Time | Current | |
| Test 4 | 1.07 PU | 1350 ms | 1.09 PU | 0.24 kV | 1360 ms | 24 A |
| Test 5 | 1.3 PU | 150 ms | 1.3 PU | 0.28 kV | 167 ms | 43 A |
| (Average within 10 min) Current | (Average within 10 min) 3 Phase Voltage | (Average within 10 min) Capacity |
|---|---|---|
| 21 A | 378 V | 7.57 kW/1.26 kWh |
| Before the Test (Steady State) | During the Test (Transient) | After the Test (Steady State) | ||||||
|---|---|---|---|---|---|---|---|---|
| WT Output Current | Phase Voltage | WT + Grid Output Current | Test Voltage | Duration Time | WT Output Current | Phase Voltage | ||
| Inrush | Steady State | |||||||
| 54 A | 20 A | 0.219 kV 0.99 PU | 83 A | 0.00 kV 0.0 PU | 158 ms | Within 1 s: 32 A After 1 s: 22 A | 0.218 kV 0.99 PU | |
| Before the Test (Steady State) | During the Test (Transient) | After the Test (Steady State) | ||||||
|---|---|---|---|---|---|---|---|---|
| WT Output Current | Phase Voltage | WT + Grid Output Current | Test Voltage | Duration Time | WT Output Current | Phase Voltage | ||
| Inrush | Steady State | |||||||
| 71 A | 20 A | 0.219 kV 0.99 PU | 62 A | 0.115 kV 0.52 PU | 768 ms | Within1 s: 33 A After 1s: 16 A | 0.216 kV 0.98 PU | |
| Before the Test (Steady State) | During the Test (Transient) | After the Test (Steady State) | ||||||
|---|---|---|---|---|---|---|---|---|
| WT Output Current | Phase Voltage | WT + Grid Output Current | Test Voltage | Duration Time | WT Output Current | Phase Voltage | ||
| Inrush | Steady State | |||||||
| 23 A | 21 A | 0.219 kV 0.99 PU | 21 A | 0.204 kV 0.927 pu | 1515 ms | Within 1 s: 21 A After 1 s: 21 A | 0.219 kV 0.99 PU | |
| Before the Test (Steady State) | During the Test (Transient) | After the Test (Steady State) | ||||||
|---|---|---|---|---|---|---|---|---|
| WT Output Current | Phase Voltage | WT + Grid Output Current | Test Voltage | Duration Time | WT Output Current | Phase Voltage | ||
| Inrush | Steady State | |||||||
| 54 A | 21 A | 0.219 V 0.99 PU | 25 A | 0.241 kV 1.09 PU | 1517 ms | Within 1 s: 21 A After 1 s: 21 A | 0.219 V 0.99 PU | |
| Before the Test (Steady State) | During the Test (Transient) | After the Test (Steady State) | |||||
|---|---|---|---|---|---|---|---|
| WT Output Current | Phase Voltage | WT + Grid Output Current | Test Voltage | Duration Time | WT Output Current | Phase Voltage | |
| Inrush | Steady State | ||||||
| 82 A | 21 A | 0.219 V 0.99 PU | 34 A | 0.281 kV 1.27 PU | 168 ms | Within 1 s: 22 A After 1 s: 22 A | 0.219 V 0.99 PU |
Disclaimer/Publisher’s Note: The statements, opinions and data contained in all publications are solely those of the individual author(s) and contributor(s) and not of MDPI and/or the editor(s). MDPI and/or the editor(s) disclaim responsibility for any injury to people or property resulting from any ideas, methods, instructions or products referred to in the content. |
© 2023 by the authors. Licensee MDPI, Basel, Switzerland. This article is an open access article distributed under the terms and conditions of the Creative Commons Attribution (CC BY) license (https://creativecommons.org/licenses/by/4.0/).
Share and Cite
Kim, B.; Nam, Y.-H.; Ryu, K.-S.; Kim, D.-J. Implementation Strategy of Test Facility Based on Auto-Transformer for LVRT/HVRT Evaluation of Large-Scale Wind Turbine. Energies 2023, 16, 4194. https://doi.org/10.3390/en16104194
Kim B, Nam Y-H, Ryu K-S, Kim D-J. Implementation Strategy of Test Facility Based on Auto-Transformer for LVRT/HVRT Evaluation of Large-Scale Wind Turbine. Energies. 2023; 16(10):4194. https://doi.org/10.3390/en16104194
Chicago/Turabian StyleKim, Byungki, Yang-Hyun Nam, Kyung-Sang Ryu, and Dae-Jin Kim. 2023. "Implementation Strategy of Test Facility Based on Auto-Transformer for LVRT/HVRT Evaluation of Large-Scale Wind Turbine" Energies 16, no. 10: 4194. https://doi.org/10.3390/en16104194