Article

Highly Conductive Cerium- and Neodymium-Doped Barium Zirconate Perovskites for Protonic Ceramic Fuel Cells

1
Department of Physics, Mersin University, Mersin 33343, Turkey
2
School of Chemistry and Chemical Engineering, University of Surrey, Guildford GU2 7XH, UK
3
Department of Nanotechnology and Advanced Materials, Mersin University, Mersin 33343, Turkey
*
Author to whom correspondence should be addressed.
Energies 2023, 16(11), 4318; https://doi.org/10.3390/en16114318
Submission received: 7 April 2023 / Revised: 9 May 2023 / Accepted: 23 May 2023 / Published: 25 May 2023
(This article belongs to the Section D2: Electrochem: Batteries, Fuel Cells, Capacitors)

Abstract

:
The rare-earth-doped zirconia-based solid electrolytes have gained significant interest in protonic ceramic fuel cell (PCFC) applications due to their high ionic conductivity. However, these solid electrolytes are susceptible to low conductivity and chemical stability at low operating temperatures, which are of interest in commercializing ceramic fuel cells. Thus, tailoring the structural properties of these electrolytes towards gaining high ionic conductivity at low/intermediate temperatures is crucial. In this study, Ce (cerium) and Nd (neodymium) co-doped barium zirconate perovskites, BaZr(0.80-x-y)CexNdyY0.10Yb0.10O3-δ (BZCNYYO) of various doping fractions (x, y: 0, 0.5, 0.10, 0.15), were synthesized (by the Pechini method) to systematically analyze their structural and conductivity properties. The X-ray diffraction patterns showed a significant lattice strain, and the stress inferences for each co-doped BZCNYYO sample were compared with Nd-cation-free reference samples, BaZrO3 and BaZr(0.80-x-y-z)CexYyYbzO3-δ (x: 0, 0.70; y: 0.20, 0.10; z: 0, 0.10). The comparative impedance investigation at low-to-intermediate temperatures (300–700 °C) showed that BaZr0.50Ce0.15Nd0.15Y0.10Yb0.10O3-δ offers the highest lattice strain and stress characteristics with an ionic conductivity (σ) of 0.381 mScm−1 at 500 °C and activation energy (Ea) of 0.47 eV. In addition, this σ value was comparable to the best reference sample BaZr0.10Ce0.70Y0.10Yb0.10O3-δ (0.404 mScm−1) at 500 °C, and it outperformed all the reference samples when the set temperature condition was ≥600 °C. The result of this study suggests that Ce- and Nd-doped BZCNYYO solid electrolytes will be a specific choice of interest for developing intermediate-temperature PCFC applications with high ionic conductivity.

1. Introduction

Protonic ceramic fuel cells (PCFCs) have been considered as a promising alternative to high-temperature solid oxide fuel cells (SOFCs), owing to their main advantage of being highly protonic conductive at the intermediate temperature range (300–600 °C). In this respect, the BaZrO3- and BaCeO3- perovskite oxide-based proton conducting electrolyte materials have been studied extensively in the PCFCs as they exhibit high ionic conductivities at this optimal temperature range with low activation energies (0.4–0.6 eV) [1,2]. In recent years, BaZrO3 compounds have found a lot of new applications, such as hybrid luminescent composites and luminescent screens [3,4]. Reportedly, the former BaCeO3 electrolyte exhibited a higher proton conductivity of 10−2 Scm−1 at 600 °C [5]. However, its high chemical affinity towards the atmospheric gases or any acidic compounds (CO2, SO2, and H2O), under practical electrochemical systems, can create undesired by-products of carbonates and hydroxides, which results in the alteration of the cerate phase, respectively [6,7]. On the other hand, the latter electrolyte, BaZrO3, offers excellent chemical stability under various acidic and atmospheric gases [7,8,9]. However, it delivers a lower conductivity than that of sintered BaCeO3 pellets as reasoned by its significant grain boundary resistance [10,11]. Therefore, to mitigate these disadvantages, the approach of a solid solution or a combination of these perovskites has been adopted, which conversely benefits both the conductivity and chemical stability [12,13,14,15].
For instance, the most widely used protonic ceramic electrolyte is the highly conductive compound BaCe70Zr10Y10Yb10O3-δ [16,17]. In this compound, while Y and Yb ratios are constant at 0.10 mole, the unit cell volume decreases with adding Zr, and chemical stability improves because the ionic radius of Zr4+ is smaller than Ce4+. The ionic radii of Ce4+ and Zr4+ are 0.870 Å and 0.720 Å, respectively [18]. Reducing the Ce4+ dopant ratio (increasing the Zr4+ dopant ratio) in the compound BaCe70Zr10Y10Yb10O3-δ improves the chemical stability [10,14]. Some studies have shown that the Nd additive helps the sintering properties of ceramic composites [19], and its additive can also be used as an alternative sintering aid by improving the protonic ceramic electrolytes properties [7,20]. In addition, synthesizing techniques are fundamental to obtaining single-phase and dense structures. The wet synthesizing (such as Sol-Gel, citrate-nitrate combustion, or Pechini) methods have too many more advantages, such as low sintering temperatures, less porosity, and obtaining nano-sized particles in reaction, than the traditional ceramic (solid-state) method [21].
In this study, the improvement of physicochemical properties of the most popular electrolyte material BaZr(0.80-x-y)CexNdyY0.10Yb0.10O3-δ (BZCYYO) was investigated with the addition of Ce4+ and Nd3+ cations in various dopant ratios. The electrolyte powders were synthesized using the Pechini method. The doping amount of Y and Yb cations was fixed at 0.10 mol for all samples. The effect of the dopant ratio on crystal parameters and conductivity properties of pellets was investigated.

2. Experimental Procedure

2.1. Materials

The metal precursors such as BaNO3 (Alfa Aesar, Haverhill, MA, USA, 99%), ZrCl4 (Alfa Aesar, 99.5%), Ce(NO3)3·6H2O (Alfa Aesar, 99.5%), Nd(NO3)3·6H2O (Alfa Aesar, 99.9%), Y(NO3)3·6H2O (Alfa Aesar, 99.9%), and Yb(NO3)3·6H2O (Alfa Aesar, 99.9%) were used without further purifications. In addition, the citric acid (Merck, Darmstadt, Germany) (anhydrous, denoted as CA) and ethylene glycol (Sigma Aldrich, Livonia, MI, USA) (62.07 g mol−1, denoted as EG) were utilized as chelating agents polymerization. In addition, polyvinyl alcohol (PVA, Sigma Aldrich) as a binder and n-propanol (Sigma Aldrich) as a solvent were used for the preparation of the pellet. Further, silver paste (TedPella Pelco, Redding, CA, USA) was used as an adhesive contact, and silver wire (0.25 mm diameter, 99.95% purity, Johnson Matthey, London, UK) as a current lead was applied for the impedance analysis. All the starting materials were weighted in the glove box filled within an inert atmosphere in order to eliminate the partial hydrolyzation process of ZrCl4.

2.2. Electrolyte Powder Synthesis and Characterizations

The preparation of an ABO3 perovskite structure system, BaZr1-γMγO3-δ (M stands for Ce, Nd, Y, and Yb metal cations; γ as the molar amount of 0, 0.05, 0.10, 0.15, 0.20, 0.25, and 0.30) involves a typical Pechini method. The stoichiometry ratio of Y- and Yb- B-site cations were fixed to a 0.10 molar, whereas Ce and Nd B-site cations were varied accordingly. The resultant product yielded various stoichiometry combinations of BaZr0.80-x-yCexNdyY0.10Yb0.10O3-δ, and they are collectively denoted as BZCNYYO. The developed various compounds (B1–B16) are listed in Table 1. In addition, to compare their performance, several counter samples of BaZrO3 were synthesized using a similar synthesis approach. For instance, Ce-, Nd-, Y-, and Yb-free (A1); Ce-, Nd-, and Yb-free (A2); Yb-free (A3); Nd-free, with a high molar amount of Ce cation (A4); and Nd-free, with a low molar amount of Zr (A5) compounds, were developed to understand the effective role of each B-site dopants in the BZCNYYO. In detail, all the metal precursors were weighed inside a glove box under a nitrogen atmosphere. Each stoichiometric ratio of BZCNYYO and their counter samples were dissolved separately in deionized water under constant stirring. Followed by the addition of CA and EG, a step-by-step process, to the metal precursor solution in the ratio to the metal precursor of 2:1. These mixtures were stirred further at 80 °C for 2 h to obtain a gel-like substance state. Subsequently, they were dried in an oven at 120 °C for 24 h. The dried products were ground using an agate mortar. As the first step of the heating process, the ground products were calcined in a muffle furnace (Tegra, MP1100, Turkey) at 750 °C for 3 h in an alumina crucible at a ramp rate of 3 °C min−1. In the second-step heating process, the calcined products were transferred to a high-temperature muffle (Protherm, Yenimahalle/Ankara, Turkey) and treated to 1200 °C for 12 h at a ramp rate of ~5 °C per minute. At the end of the process, the products were further ground using agate mortar.

2.3. XRD Characterization

The XRD (Rigaku Smartlab, The Woodlands, TX, USA) analysis was performed to understand the crystallographic phase identification. The samples were analyzed at a 0.02 step width in 7° ≤ 2θ ≤ 90° angular range and 21.6746 °/min scanning speed at room temperature. The diffracted beams were counted with a 1D silicon strip detector (D/teX Ultra 250, The Woodlands, TX, USA). The XRD patterns were indexed, and the corresponding lattice parameters (a) of all samples were assigned accordingly, with the help of PDXL2 software supported with the DICVOL06 method using the CuKα1 (λ = 1.54056 Å) peaks [22]. It is worth mentioning that the primary phases are calculated using calculated hkl values, and the secondary phases are indexed using ICDD PDF-2 cards from the database.

2.4. Fabrication of the Electrolyte Pellets and Conductivity Measurements

Prior to the pellet fabrication, a 2 wt.% PVA added BZCNYYO ceramic powders were prepared in three steps. Firstly 15 wt.% PVA solution (PVAsol) was prepared with diluted water at 85 °C and stirred for 4 h on the hot plate. In Step 1, the proper amount of PVAsol was stirred in 10 mL diluted hot water at 85 °C for 15 min on a hot plate. In step 2, 20 mL n-propanol was added under continuous stirring for 30 min at 85 °C on a hot plate. In step 3, the BZCNYYO ceramic powder was added slowly, and then the solution was transferred to the cold stirrer, and the stirring continued for 2 h at room temperature. The proper amount of PVAsol was calculated as PVA; the ceramic ratio was 2:98 wt.% and depended on stocked ceramic powder weight. The processing variables applied in all three steps have been summarised in Table 2. The mixture was dried in a vacuum oven at 85 °C overnight. Finally, the dried products were ground using agate mortar. For the preparation of the pellet, the ground powders were pressed to a solid pellet of 15 mm diameter under 106 MPa pressure and followed by a two-step sintering process. In the first step, the pellets were calcined to 500 °C for 3 h at a ramp rate of 4 °C per minute heating rate, and in the second step, the pellets were placed on an alumina setter plate and reheated to 1350 °C for 24 h at a ramp rate of 4 °C per minute condition. The high-temperature sintering was carried out using YSZ and MgO crucibles. To incur the loss of BaO at a high-temperature process, a sacrificial amount of BaO was added. The impedance of all the samples was measured by a potentiostat/galvanostat system (Gamry Instrument Interface 1010E, Warminster, PA, USA) using electrochemical impedance spectroscopy (EIS) technique with the frequency range of 0.1 Hz to 2 MHz under a 10 mV AC perturbation condition. The analysis was performed between the temperature ranges of 300 °C to 700 °C in a high-temperature tube furnace and measured at each 50 °C interval step. All the data were recorded at the heating condition, and the thermal equilibrium of the samples was taken into account. Both sides of the pellets were coated with silver paste, and then the contact silver wire leads were attached.

3. Results and Discussion

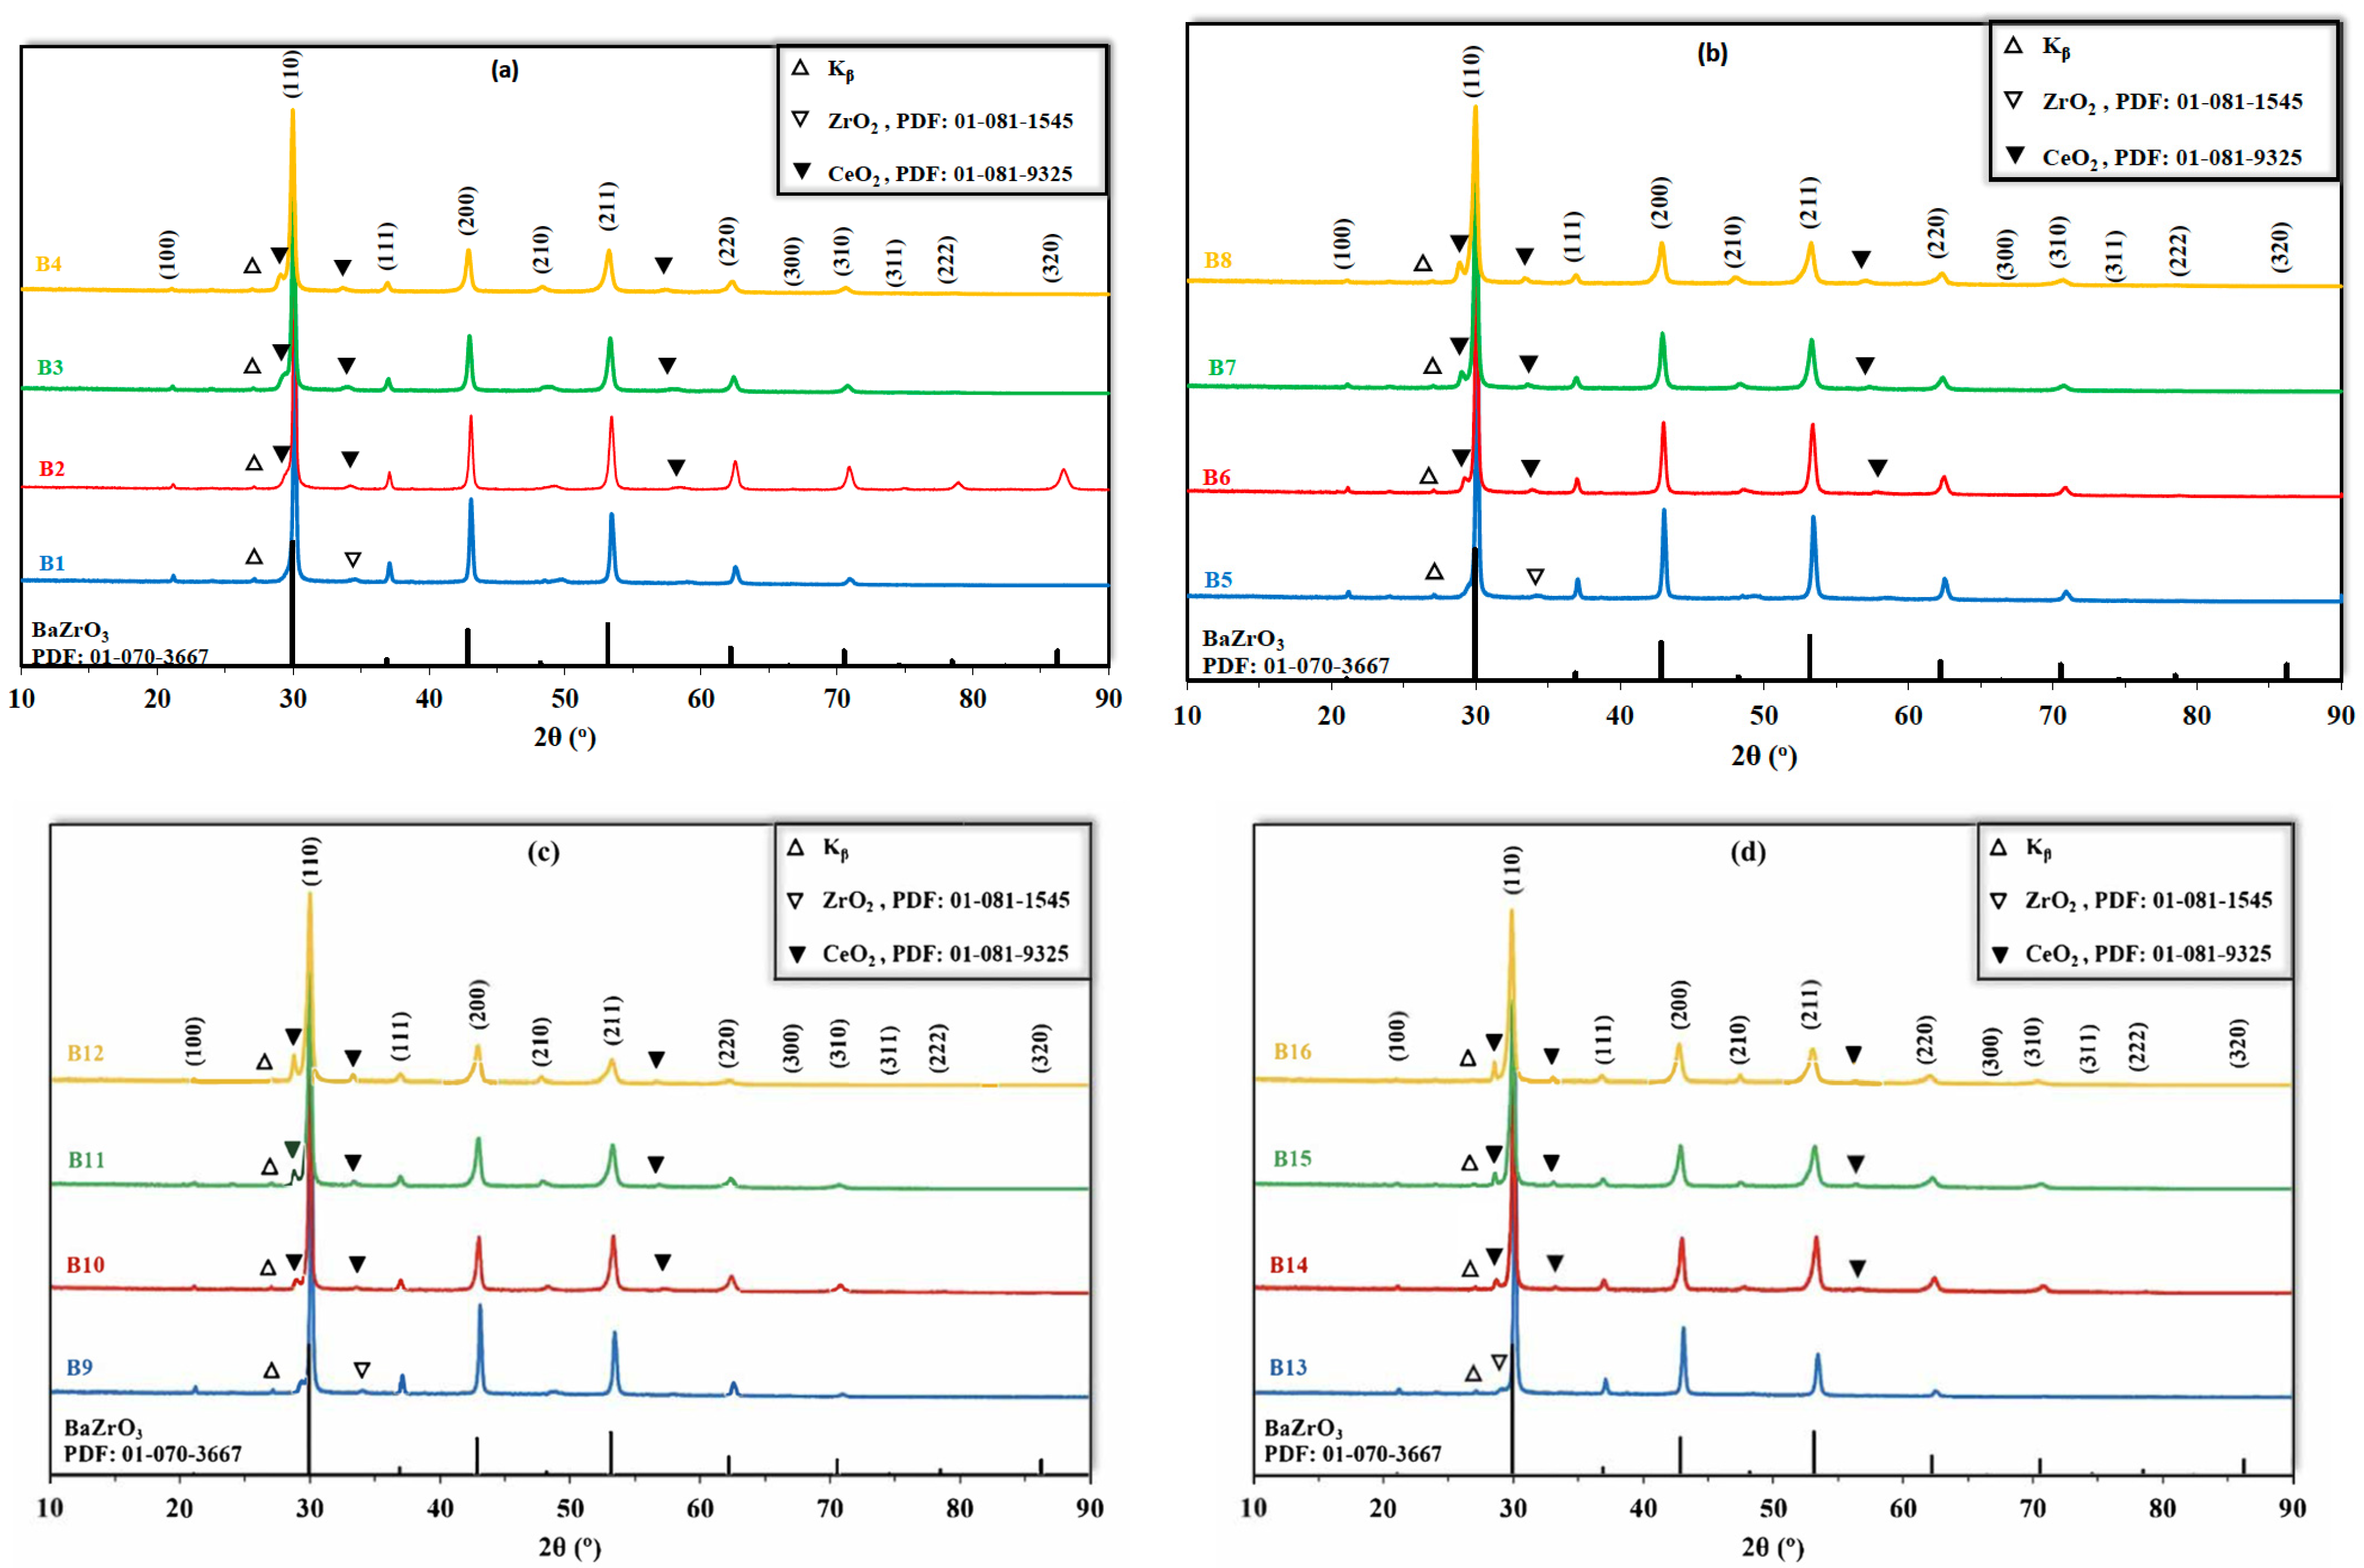
3.1. Structural Analysis

The prominent XRD peaks of BaZrO3 (PDF card no. 01-070-3667) perovskite cubic crystal system were matched with all the developed BZCNYYO compounds. In addition, the secondary phase of CeO2 (PDF card no. 01-081-9325) and ZrO2 (PDF card no. 01-081-1545) peaks with minor intensity were observed for all the BZCNNYO samples, as shown in Figure 1a–d. In particular, the Nd-free BZCNYYO (y = 0) samples (B1–B4) present an increase in the CeO2 peak intensities, which correspond to the increase in Ce molar amount. A similar observation was inferred from the other BZCNYYO compounds (B5–B16) Figure 1b–d. It is assumed that the humidity and the ambient atmosphere conditions, during the sample preparation process, readily oxidize the surface layer of Ce atoms and thus favours the formation of CeO2. The chemical reaction between BaCeO3 and CO2 in the air is well known, which results in the formation of CeO2 at the surface of the bulk powder [7]. In addition, the XRD patterns of the control samples were also examined, as shown in Figure 2. The XRD peaks of A1 (BaZrO3) and A2 (BaZr0.80Y0.20O3) compounds exhibited only the BaZrO3 phase. The most significant XRD peaks of the compounds A3 (BaZr0.10Ce0.70Y0.20O3) and A4 (BaZr0.10Ce0.70Y0.10Yb0.10O3) were matched with BaZrO3. In addition, a minor peak observed at 2θ of ~32.5° relates to the CeO2. The A5 (BaZr0.40Ce0.40Y0.10Yb0.10O3) compound displays both BaZrO3 and BaCeO3 phases as similar to the BZCNYYO compounds.
Further, to investigate the dopant influence on the lattice parameters (a) and lattice strains (ε) of the BZCNYYO compounds the Williamson–Hall equation was adopted. In general, the physical broadenings of the spectral lines are produced by either lattice strains or with the combined role of lattice strains and small particle size [23]. According to the Williamson–Hall equation, the total spectral line—having a hkl value—broadening βhkl is the sum of the contributions of the average particle size D and the lattice micro-strain ε on the total breadth (Equation (1)). These contributions are defined by the Williamson–Hall analysis using the corrected physical broadenings (βD and βε) of X-ray diffraction peaks defined in the Debye–Sherrer equation for D and the Stokes–Wilson equation for ε.
β h k l = β D + β ε = K λ D cos θ + 4 ε tan θ
The above Equation (1) is derived by applying the Williamson–Hall equation of a straight line and is known as the uniform deformation model (UDM) equation, which considers the isotropic nature of the crystals [24,25]. In Equation (1), K, λ, and θ are the shape factor (~0.9), the wavelength of CuKα1 (~1.54056 Å), and the Bragg angle in radian unit; βhkl is the full width at half of the maximum intensity for different diffraction planes [24]. Using this equation, the parameter ε can be obtained from the linear relation.
Using the XRD experimental data and the obtained crystal parameters, the values of a and ε are determined and listed in Table 3. To understand the influence of dopants on the lattice parameters in each compound, the linear relationship of lattice parameters as the functions of varying Ce-doping amount and constant Nd-doping amount was plotted. As shown in Figure 3a, the a value increased linearly with increasing Ce-doping content. For instance, the a value of B4, B8, B12, and B16 showed the highest values for the Ce-doping mole amount of 0.15. It is reasoned to the difference in the dopant ionic radii; the ionic radii of Ce4+ (0.870 Å) and Nd3+ (0.983 Å) are found to be bigger than the Zr4+ (0.720 Å) ion [18,26,27]. The values of the lattice parameter a were found to be increased by increasing the loading fraction of Ce4+, while this was not observed for all samples containing the Nd3+ dopants. It is also noted that the presence of Nd-concentration in the lattice parameter showed no straight correlation, as likely expected for the Ce-dopant examination (Figure 3b).
Similarly, the relationship between ε and dopant concentration was examined, as shown in Figure 3c. The ε parameter was calculated based on Equations (1) and (2). Evidently, the linear relationship of ε as the function of Ce-doping and constant Nd-doping shows an increase in the lattice strain value with an increment in the Nd-doping molar amount.
β h k l cos θ = ε 4 sin θ + K λ D
Thus, similar to the reasoning of the lattice parameter expansion, Nd3+ doping could result in more strain as compared to Ce4+ doping. It is noted that the highest ε values of 0.30%, 0.54%, and 0.72% were achieved, respectively, for the samples B14, B15, and B16, when the Nd co-doping reaches the stoichiometric mole amount of 0.15, as shown in Table 3 and Figure 3c. This is attributed to the fact that the crystal strain can be originated from the lattice imperfection and distortion resulting from the impurities and/or dopant elements located in the lattice. Therefore, as a result, the doping of foreign elements could result in an expansion of lattice parameters, which further aggravates the crystal deformation. Thus, co-doping of Nd at the maximum stoichiometric mole (0.15) leads to lattice deformation, which eventually causes the major lattice strain.

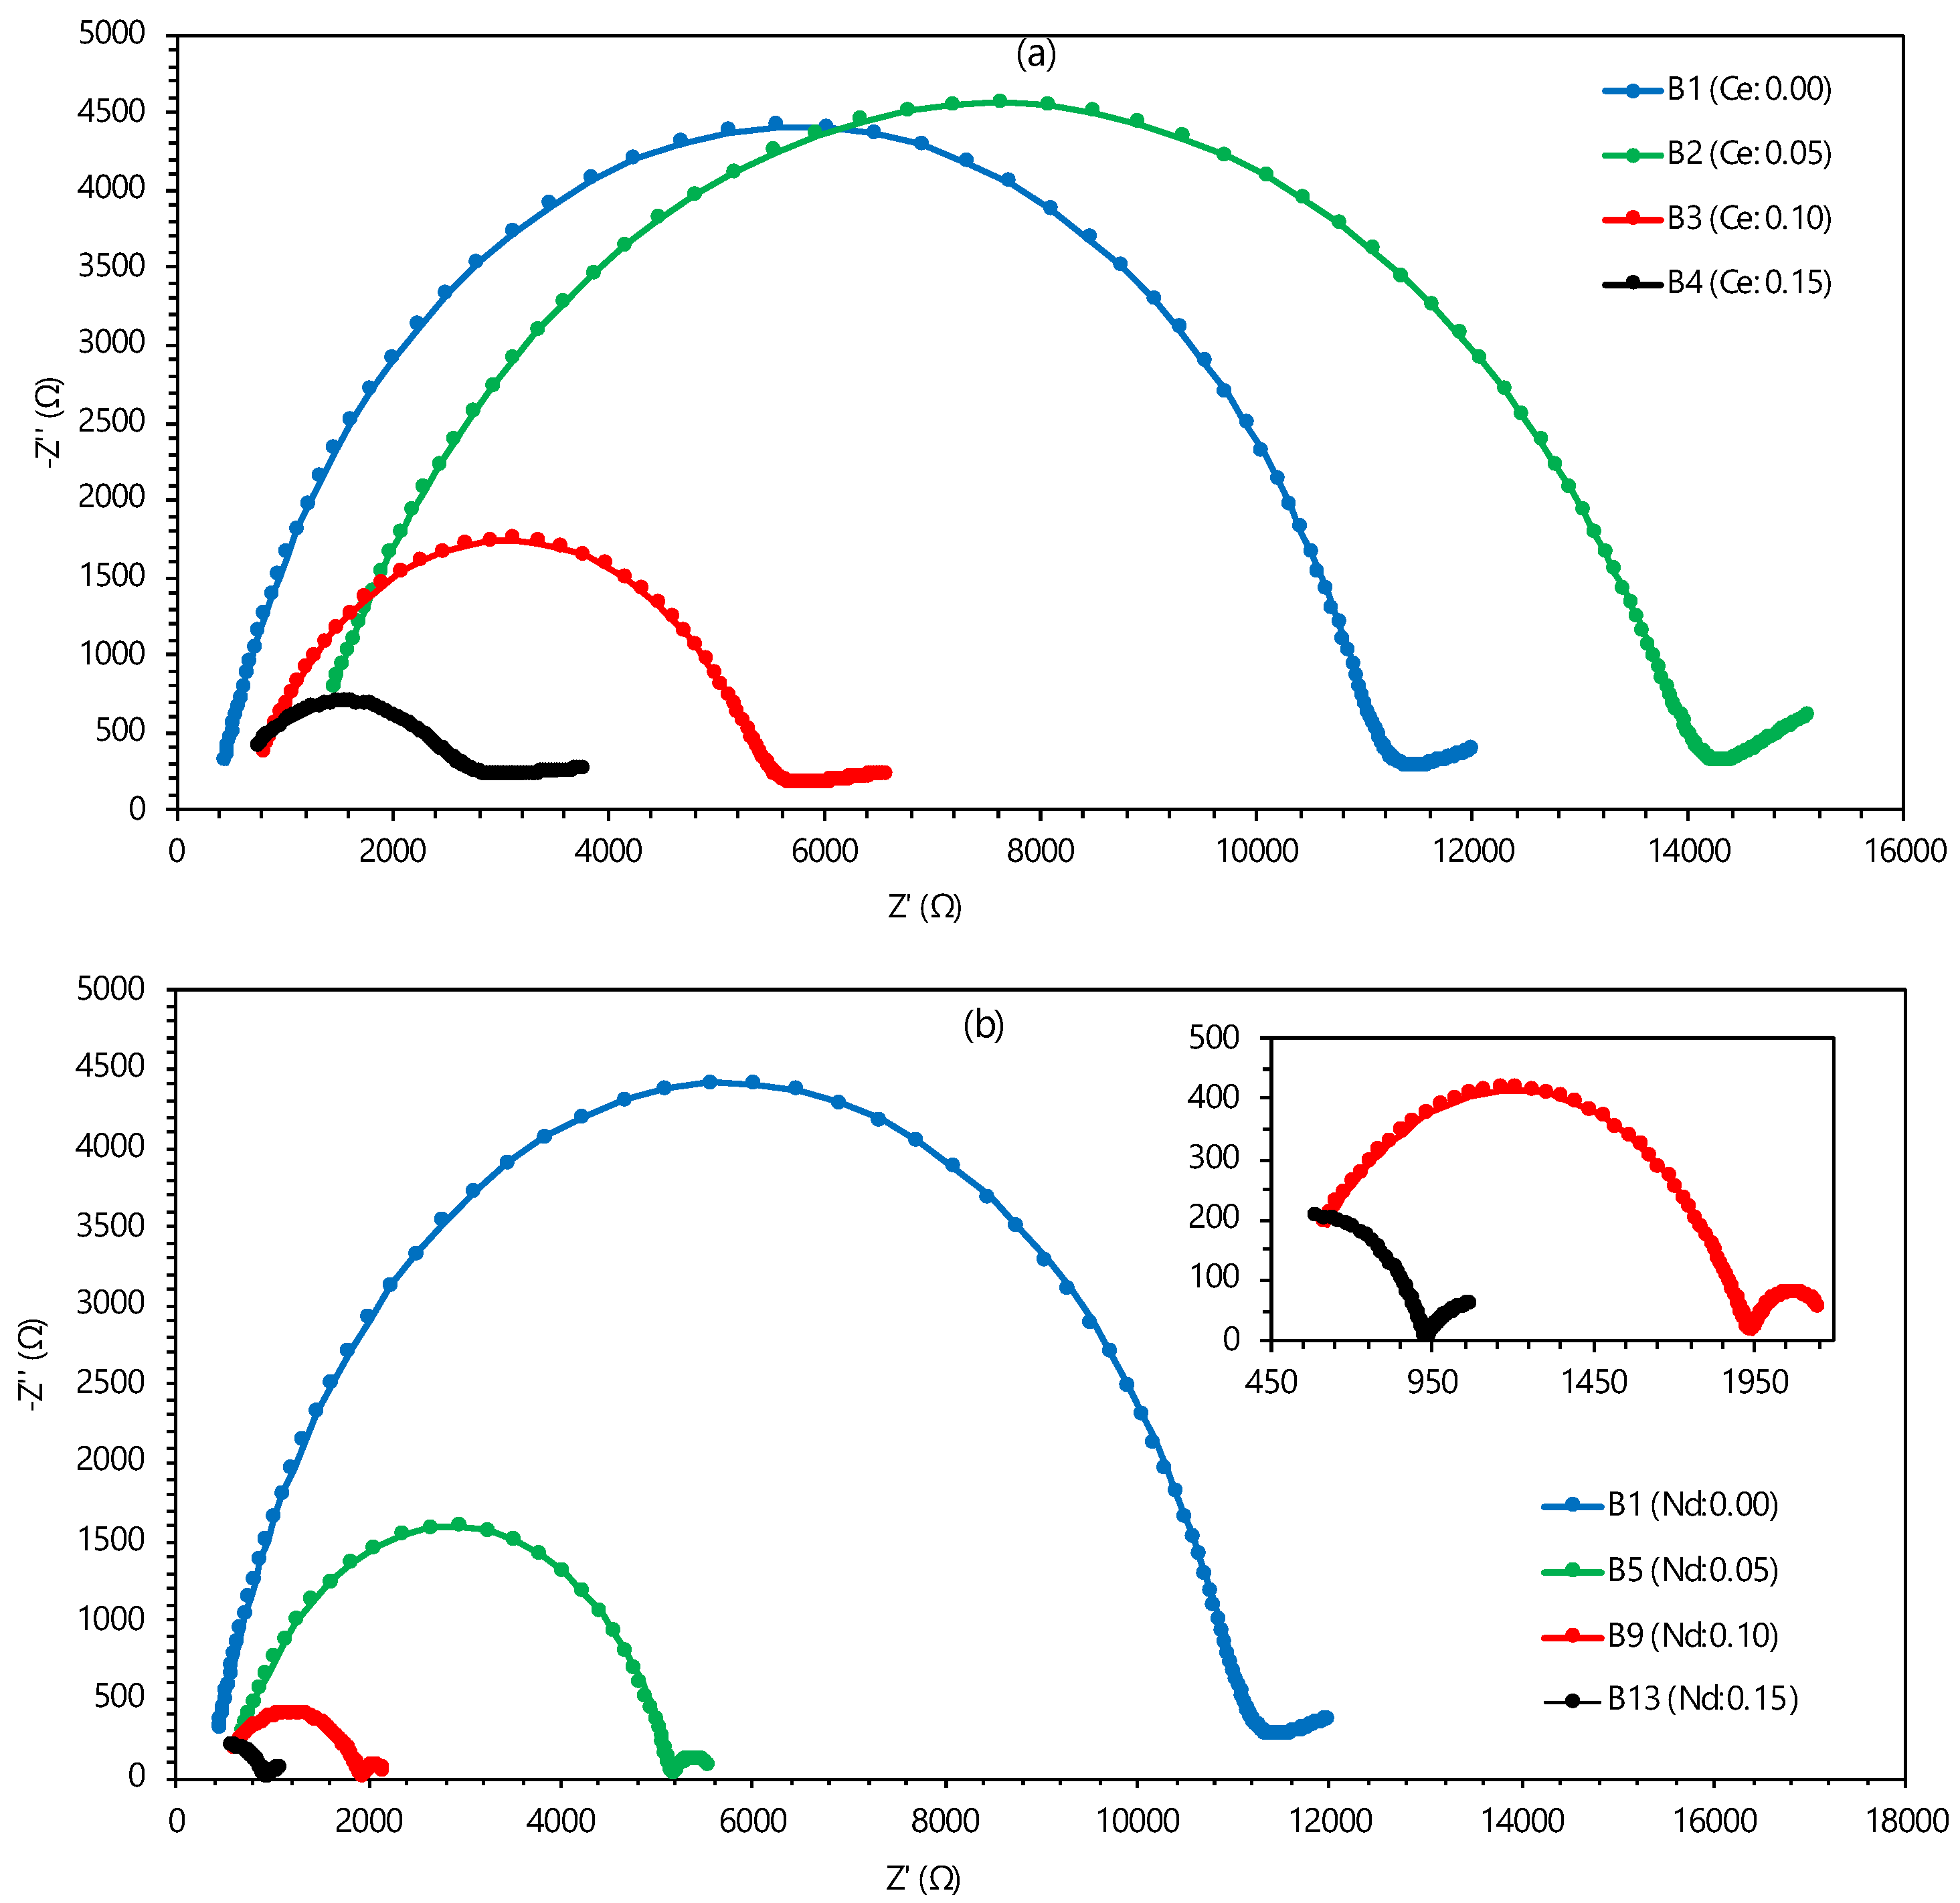
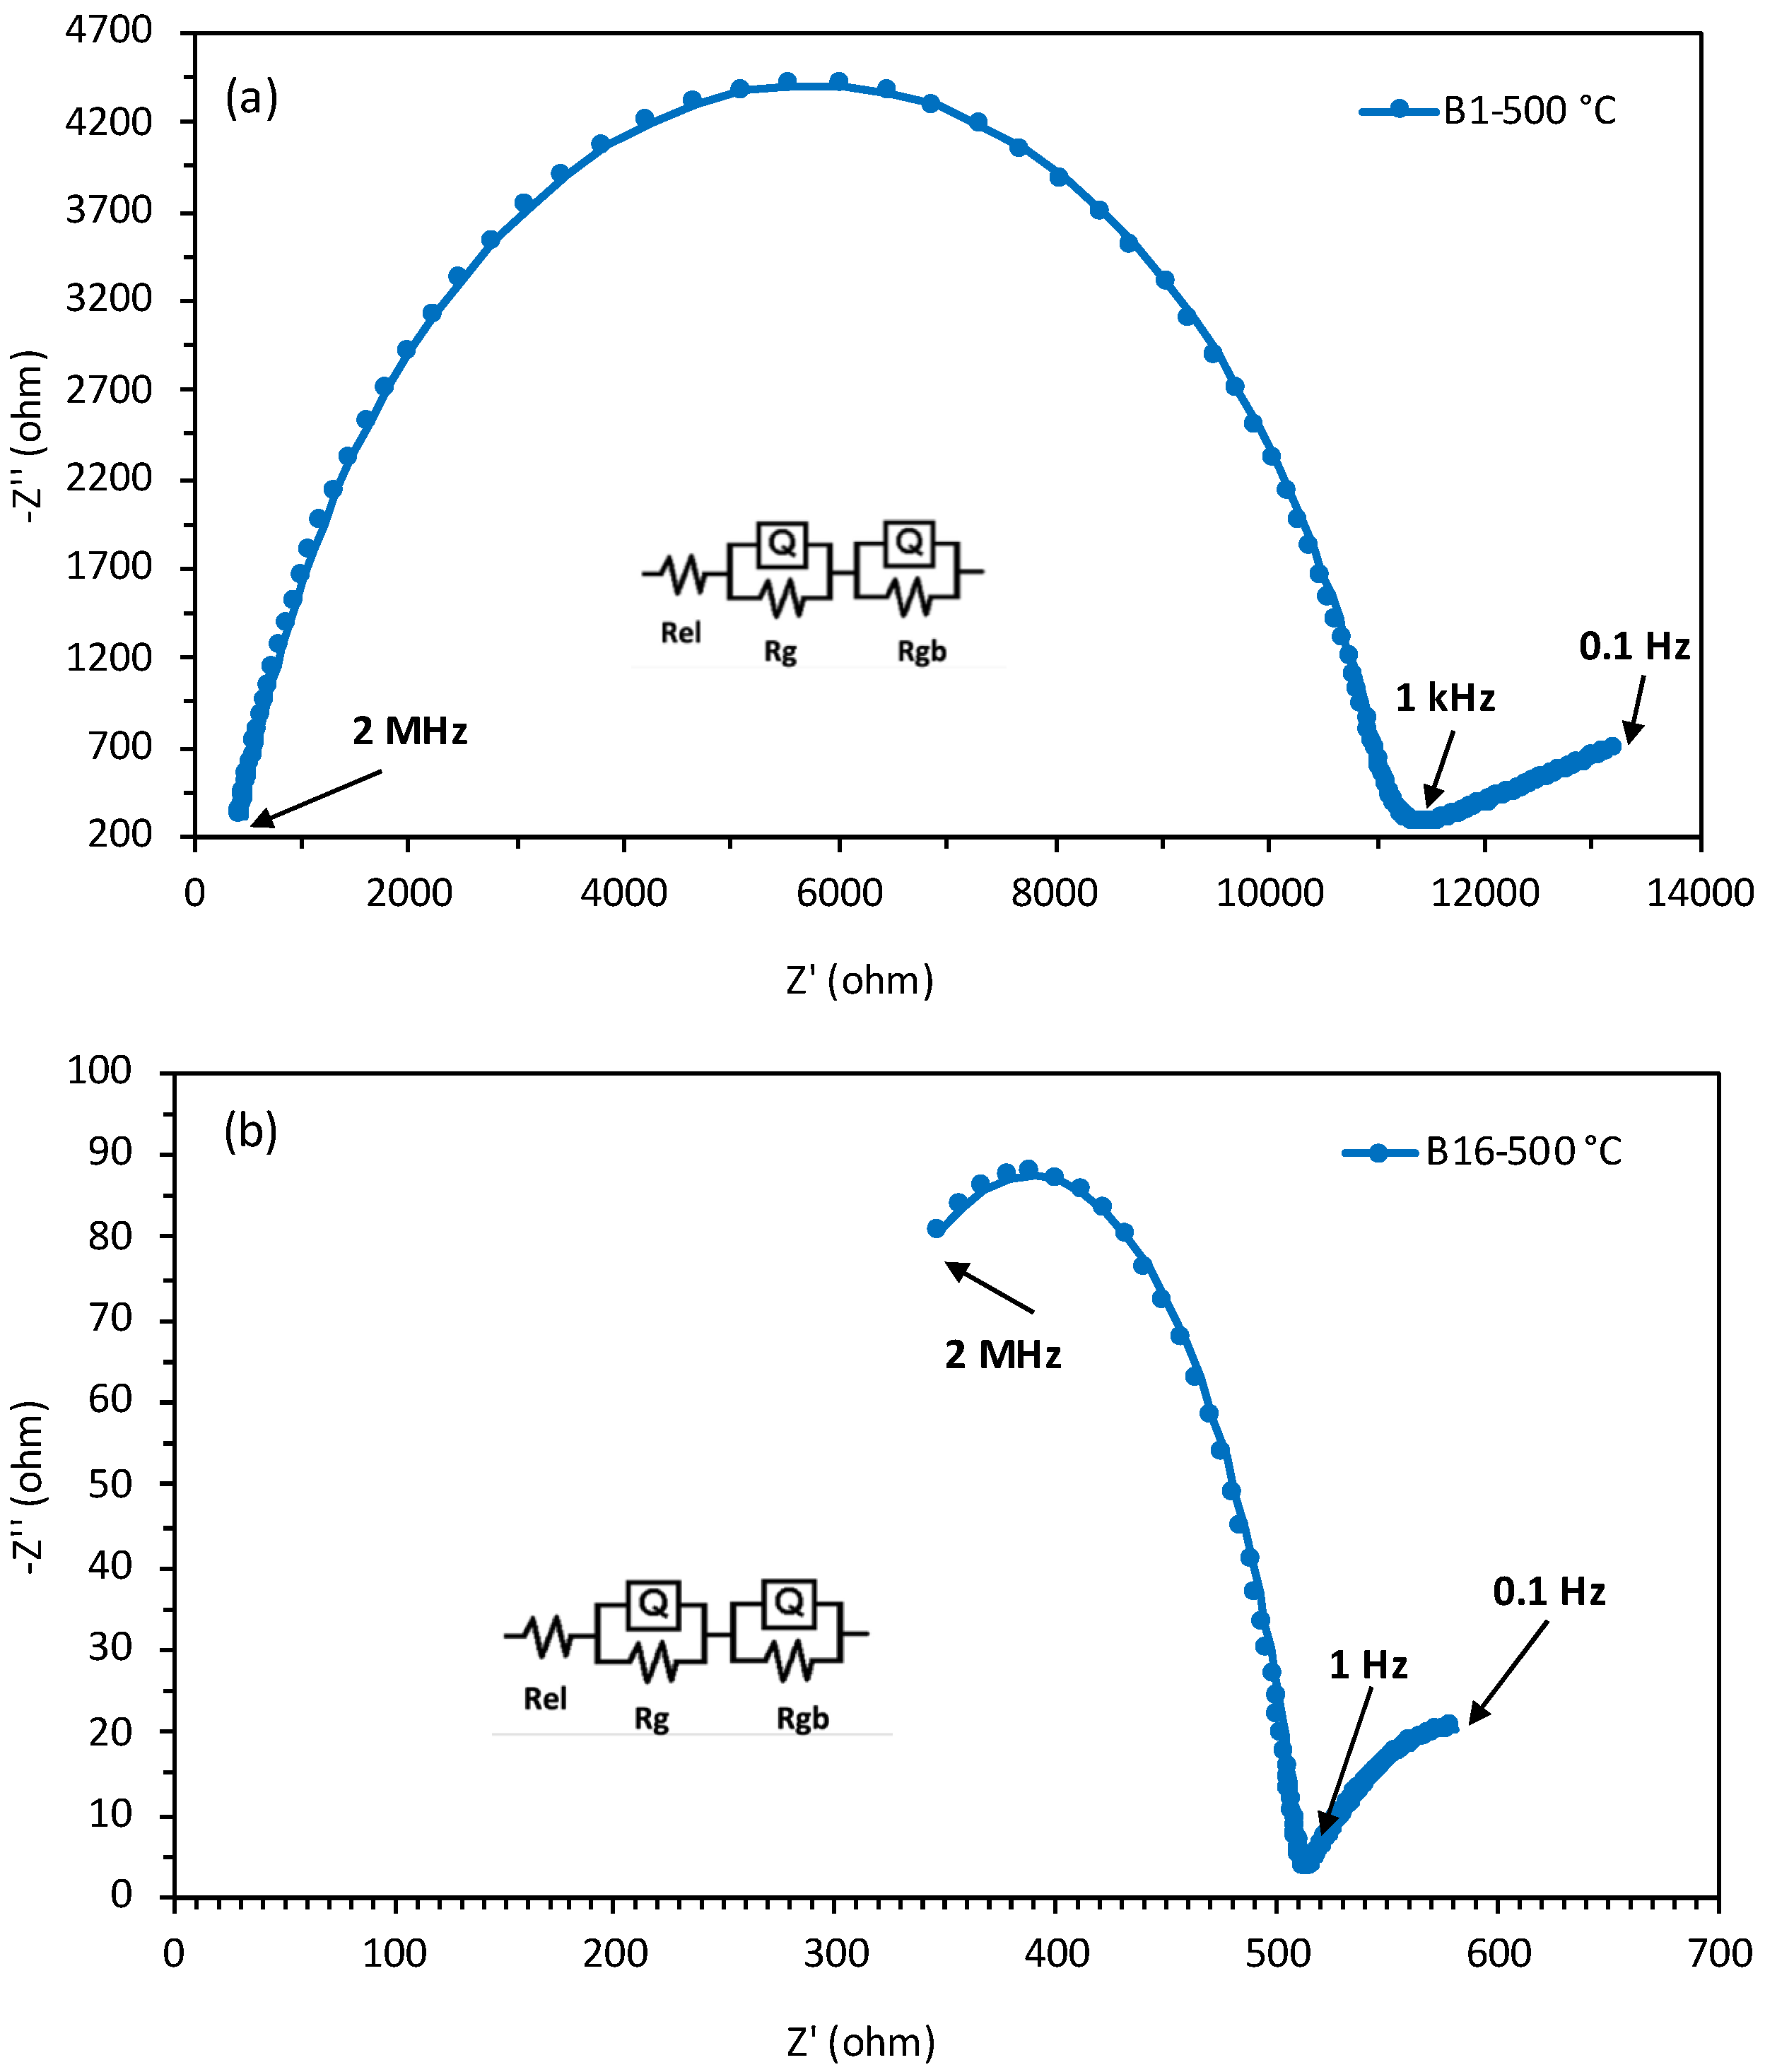
3.2. Conductivity and Activation Energy Analysis

The Nyquist-plots profiles were collected for each sample and modelled with the suitable equivalent circuit; the circuit elements include the contact silver paste resistance (Rel), the grain resistance (Rg), and the grain boundary resistance (Rgb). The ionic conductivities (σ) of each sample were calculated using the following Relation (3):
σ = 1 R t o t t S
where, Rtot, t, and S represent the total impedance, pellet thickness (cm), and active surface area (cm2) of silver electrodes, respectively. It is noted that the Rtot is the sum of the grain impedance (Rg) and grain boundary impedance (Rgb) of the subject sample. It is noteworthy that this study mostly emphasizes the conductivity evaluation of the synthesized samples at the intermediate temperatures where the capacitance of the samples was of no significance.
To understand the dopants (Nd and Ce elements) influence towards the improvement of σ values in the BaZrO3 system, three different cases were studied at an intermediate temperature condition of 500 °C: case (i) where the Ce-dopant elements (samples B1 to B4) is varied with a constant Nd-content; case (ii) where the Nd-dopant elements (B1, B5, B9, and B13) is varied with a constant Ce-content; case (iii) where both the Ce- and Nd-dopant elements (B1, B6, B11, and B16) varied at an equiproportional ratio. Notably, both case studies (i) and (ii) exhibited a decrement in the overall impedance with respect to the increment in the dopant element, as shown in Figure 4a,b. The σ values calculated for each case are listed in Table 4. In case (iii), the increment in σ value was observed for the maximum equiproportion of Ce- and Nd-doping concentration (0.15). In all the cases, sample B16 delivered the highest σ value of 3.77 × 10⁻⁴ Scm−1 than the other BZCNYYO samples.
For a vivid understanding of the variation of σ value with respect to the dopant ratio of the BZCNYYO series, firstly, the Nyquist spectra of the least dopant-supported sample B1 (Figure 5a) was compared with the maximum dopant-supported sample B16 (Figure 5b). As expected, a significant difference in their Rg and Rgb profile was observed that result in the σ values of 2.16 × 10⁻⁵ Scm−1 (B1) and 3.77 × 10⁻⁴ Scm−1 (B16). This result suggests that the co-doping of Ce and Nd elements could significantly improve the σ value, and the reason could be attributed to the defects in the crystal lattice as reported in the earlier studies [28]. Secondly, the σ values at 500 °C of the other BZCNYYO dopant samples and the counter samples (A–A5) were examined, and the calculated values are listed in Table 5. Overall, the co-doping of Ce and Nd elements in the BZCNYYO compound influenced the conductivities to range about 10–105 times at 500 °C.
Further, to understand the temperature influences on the σ values of BZCNYYO and counter samples, the EIS analysis was investigated at various temperature conditions (300, 350, 400, 450, 550, 600, 650, and 700 °C). It is to note that all the experiments were analyzed under humid conditions, which means the hydroxyl ions (O-H) could be expected to contribute proton conductivity of the examined samples.
The extrapolation of the Nyquist plot results in the corresponding σ values of each sample, as shown in Table 5. Interestingly, the counter sample A3 exhibited the highest σ value of 4.05 × 10⁻⁵ Scm−1 at the lowest temperature of 300 °C than any other samples; the other counter sample A4 showed outstanding σ values at 450 °C (2.45 × 10⁻⁴ Scm−1), 500 °C (4.04 × 10⁻⁴ Scm−1), and 550 °C (6.13 × 10⁻⁴ Scm−1) compared to all other samples. Among the BZCNYYO compounds, the B16 displayed the highest σ values at the wide temperature as well as outperformed the best counter sample (A4) at above 550 °C temperature condition, as shown in Table 5. Particularly, the best-performed sample B16 influenced under the dry air conditions of 500 °C and 700 °C showed the σ values 3.77 × 10⁻⁴ Scm−1 and 1.82 × 10⁻³ Scm−1, and these σ values are comparatively higher than the σ values inferred for the reference A4 sample at 500 °C (4.04 × 10⁻⁴ Scm−1) and 700 °C (1.58 × 10⁻³ Scm−1) under the same atmospheric condition. Thus, the Nd and Ce additives in the BZCNYYO compounds clearly support the σ value enhancement and as the amount of the additive increased to an extent.
It is clear from the above EIS studies that all these materials exhibited a strong temperature dependence in the conductivity behaviour. To illustrate this, the Arrhenius plot was defined using the following Relation (4):
σ = σ 0 e E a / k T
where σ0, Ea, k, and T are pre-exponential factors, thermal activation energy (eV), Boltzmann constant (8.6173 × 10⁻⁵ eVK−1), and temperature (K), respectively. By applying Relation (4), the logarithmic conductivity values were plotted against the inverse of temperature (K−1) for each sample. Then, the y-intercept and slope values of Ce-doped (Figure 6a) and Nd-doped (Figure 6b) BZCNYYO compounds were extrapolated to determine the Ea. The obtained Ea values are shown in Table 6. The Ea values were found to be lower for each case of dopant (Ce or Nd) or co-dopant increment. A similar observation was carried out for the counter samples (A1–A5), and their calculated Ea values are shown in Table 4. Evidently, the Ea values of B1-B12 BZCNYYO compounds (0.90–0.53 eV) outperformed the A1–A2 reference samples; the B13-B16 (BZCNYYO) compounds (0.45–0.47 eV) exhibited near to the close Ea values of A3-A5 (0.40 to 0.45 eV) reference samples. Among the BZCNYYO compounds, the B16 compounds delivered the lowest activation thermal energy along with the B13, which means a lesser kinetic barrier for the conductive pathway compared to the other BZCNYYO compounds.

4. Conclusions

In this study, the BZCNYYO series of compounds composed of fixed (Y and Yb) and various (Nd and Ce) stoichiometric amounts were successfully developed using the Pechini method. The structural analysis confirmed that doping Nd and Ce additives resulted in a significant lattice strain in the BZCNYYO structure; the B16 sample exhibited the highest lattice strain (4.2296 Å) and stress (0.72%). The conductivity and the activation energy studies revealed that sample B16 exhibited the highest performance compared to the counter samples at the dry air conditions of 500 °C and 700 °C. This Ce and Nd co-doped BaZrO3-based new-type of protonic ceramic powder electrolytes can be considered a promising candidate for low-temperature PCFC applications and will pave the way for the broad scientific reader of interest in replacing the conventional zirconia-based SOFCs.

Author Contributions

Conceptualization, S.Y. and B.A.H.; Validation, P.R.; Formal analysis, B.K. and C.C.; Investigation, B.K., P.R. and C.C.; Writing—original draft, B.K., P.R.; Writing—review & editing, S.Y. and B.A.H.; Funding acquisition, S.Y. and B.A.H.; Supervision, S.Y. and B.A.H.; Project administration, S.Y. and B.A.H. All authors have read and agreed to the published version of the manuscript.

Funding

This research was funded by Mersin University grant number 2019-1-TP3-3424 and 2019-1-TP3-3425 and the research visit fund by the University of Surrey.

Conflicts of Interest

The authors declare no conflict of interest.

References

  1. Bonanos, N. Transport properties and conduction mechanism in high-temperature protonic conductors. Solid State Ion. 1992, 53–56, 967–974. [Google Scholar] [CrossRef]
  2. Fabbri, E.; Bi, L.; Pergolesi, D.; Traversa, E. Towards the next generation of solid oxide fuel cells operating below 600 °C with chemically stable proton-conducting electrolytes. Adv. Mater. 2012, 24, 195–208. [Google Scholar] [CrossRef] [PubMed]
  3. Savchyn, V.; Popov, A.; Aksimentyeva, O.; Klym, H.; Horbenko, Y.Y.; Serga, V.; Moskina, A.; Karbovnyk, I. Cathodoluminescence characterization of polystyrene-BaZrO3 hybrid composites. Low Temp. Phys. 2016, 42, 597–600. [Google Scholar] [CrossRef]
  4. Gupta, S.K.; Abdou, H.; Segre, C.U.; Mao, Y. Excitation-Dependent Photoluminescence of BaZrO3: Eu3+ Crystals. Nanomaterials 2022, 12, 3028. [Google Scholar] [CrossRef]
  5. Medvedev, D.; Murashkina, A.; Pikalova, E.; Demin, A.; Podias, A.; Tsiakaras, P. BaCeO3: Materials development, properties and application. Prog. Mater. Sci. 2014, 60, 72–129. [Google Scholar] [CrossRef]
  6. Matsumoto, H.; Kawasaki, Y.; Ito, N.; Enoki, M.; Ishihara, T. Relation between electrical conductivity and chemical stability of BaCeO3-based proton conductors with different trivalent dopants. Electrochem. Solid-State Lett. 2007, 10, 77–80. [Google Scholar] [CrossRef]
  7. Ryu, K.H.; Haile, S.M. Chemical stability and proton conductivity of doped BaCeO3–BaZrO3 solid solutions. Solid State Ion. 1999, 125, 355–367. [Google Scholar] [CrossRef]
  8. Bae, K.; Jang, D.Y.; Choi, H.J.; Kim, D.; Hong, J.; Kim, B.K.; Lee, J.H.; Son, J.W.; Shim, J.H. Demonstrating the potential of yttrium-doped barium zirconate electrolyte for high-performance fuel cells. Nat. Commun. 2017, 8, 14553. [Google Scholar] [CrossRef]
  9. Yilmaz, S.; Cobaner, S.; Yalaz, E.; Amini Horri, B. Synthesis and Characterization of Gadolinium-Doped Zirconia as a Potential Electrolyte for Solid Oxide Fuel Cells. Energies 2022, 15, 2826. [Google Scholar] [CrossRef]
  10. Fabbri, E.; D’Epifanio, A.; Di Bartolomeo, E.; Licoccia, S.; Traversa, E. Tailoring the chemical stability of Ba(Ce0.8−xZrx)Y0.2O3−δ protonic conductors for Intermediate Temperature Solid Oxide Fuel Cells (IT-SOFCs). Solid State Ion. 2008, 179, 558–564. [Google Scholar] [CrossRef]
  11. Kreuer, K.D. Proton-Conducting Oxides. Annu. Rev. Mater. Res. 2003, 33, 333–359. [Google Scholar] [CrossRef]
  12. Bae, K.; Noh, H.S.; Jang, D.Y.; Hong, J.; Kim, H.; Yoon, K.J.; Lee, J.H.; Kim, B.K.; Shim, J.H.; Son, J.W. High-performance thin-film protonic ceramic fuel cells fabricated on anode supports with a non-proton-conducting ceramic matrix. J. Mater. Chem. A 2016, 4, 6395–6404. [Google Scholar] [CrossRef]
  13. Bae, K.; Kim, D.H.; Choi, H.J.; Son, J.W.; Shim, J.H. High-Performance Protonic Ceramic Fuel Cells with 1 µm Thick Y:Ba(Ce, Zr)O3 Electrolytes. Adv. Energy Mater. 2018, 8, 1801315. [Google Scholar] [CrossRef]
  14. Choi, S.; Kucharczyk, C.J.; Liang, Y.; Zhang, X.; Takeuchi, I.; Ji, H.I.; Haile, S.M. Exceptional power density and stability at intermediate temperatures in protonic ceramic fuel cells. Nat. Energy 2018, 3, 202–210. [Google Scholar] [CrossRef]
  15. Lyagaeva, J.; Danilov, N.; Vdovin, G.; Bu, J.; Medvedev, D.; Demin, A.; Tsiakaras, P. A new Dy-doped BaCeO3-BaZrO3 proton-conducting material as a promising electrolyte for reversible solid oxide fuel cells. J. Mater. Chem. A 2016, 4, 15390–15399. [Google Scholar] [CrossRef]
  16. Duan, C.; Kee, R.; Zhu, H.; Sullivan, N.; Zhu, L.; Bian, L.; Jennings, D.; O’Hayre, R. Highly efficient reversible protonic ceramic electrochemical cells for power generation and fuel production. Nat. Energy 2019, 4, 230–240. [Google Scholar] [CrossRef]
  17. Wang, S.; Zhao, F.; Zhang, L.; Chen, F. Synthesis of BaCe0.7Zr0.1Y0.1Yb0.1O3-δ proton conducting ceramic by a modified Pechini method. Solid State Ion. 2012, 213, 29–35. [Google Scholar] [CrossRef]
  18. Shannon, R.D. Revised effective ionic radii and systematic studies of interatomic distances in halides and chalcogenides. Acta Crystallogr. Sect. A 1976, 32, 751–767. [Google Scholar] [CrossRef]
  19. Liu, Y.; Guo, Y.; Ran, R.; Shao, Z. A new neodymium-doped BaZr0.8Y0.2O3−δ as potential electrolyte for proton-conducting solid oxide fuel cells. J. Membr. Sci. 2012, 415–416, 391–398. [Google Scholar] [CrossRef]
  20. Su, X.T.; Yan, Q.Z.; Ma, X.H.; Zhang, W.F.; Ge, C.C. Effect of co-dopant addition on the properties of yttrium and neodymium doped barium cerate electrolyte. Solid State Ion. 2006, 177, 1041–1045. [Google Scholar] [CrossRef]
  21. Lyagaeva, Y.G.; Medvedev, D.A.; Demin, A.K.; Yaroslavtseva, T.V.; Plaksin, S.V.; Porotnikova, N.M. Specific features of preparation of dense ceramic based on barium zirconate. Semiconductors 2014, 48, 1353–1358. [Google Scholar] [CrossRef]
  22. Boultif, A.; Louër, D. Powder pattern indexing with the dichotomy method. J. Appl. Crystallogr. 2004, 37, 724–731. [Google Scholar] [CrossRef]
  23. Williamson, G.K.; Hall, W.H. X-ray line broadening from filed aluminium and wolfram. Acta Metall. 1953, 1, 22–31. [Google Scholar] [CrossRef]
  24. Nath, D.; Singh, F.; Das, R. X-ray diffraction analysis by Williamson-Hall, Halder-Wagner and size-strain plot methods of CdSe nanoparticles- a comparative study. Mater. Chem. Phys. 2020, 239, 122021. [Google Scholar] [CrossRef]
  25. Mote, V.; Purushotham, Y.; Dole, B. Williamson-Hall analysis in estimation of lattice strain in nanometer-sized ZnO particles. J. Theor. Appl. Phys. 2012, 6, 6. [Google Scholar] [CrossRef]
  26. Gazda, M.; Jasinski, P.; Kusz, B.; Bochentyn, B.; Gdula-Kasica, K.; Lendze, T.; Lewandowska-Iwaniak, W.; Mielewczyk-Gryn, A.; Molin, S. Perovskites in solid oxide fuel cells. Solid State Phenom. 2012, 183, 65–70. [Google Scholar] [CrossRef]
  27. Ishihara, T. Development of new fast oxide ion conductor and application for intermediate temperature Solid Oxide Fuel Cells. Bull. Chem. Soc. Jpn. 2006, 79, 1155–1166. [Google Scholar] [CrossRef]
  28. Imashuku, S.; Uda, T.; Nose, Y.; Taniguchi, G.; Ito, Y.; Awakura, Y. Dependence of Dopant Cations on Microstructure and Proton Conductivity of Barium Zirconate. J. Electrochem. Soc. 2009, 156, B1. [Google Scholar] [CrossRef]
Figure 1. The XRD patterns of the BZCNYYO samples with various Ce dopants (Cex = 0, 0.05, 0.10, 0.15 mol) and Ndy dopant concentration for (a) y = 0 mol, (b) y = 0.05, (c) y = 0.10, and (d) y = 0.15 mol.
Energies 16 04318 g001
Figure 2. The XRD patterns of the reference samples: (a) A1 and A2; (b) A3, A4, and A5.
Energies 16 04318 g002
Figure 3. Relationship between lattice parameters and (a) Ce-dopant concentration and (b) Nd-dopant concentration and (c) Ce-dopant concentration and lattice strain ε.
Energies 16 04318 g003
Figure 4. The Nyquist impedance plots of various compositions of BZCNYYO samples at 500 °C: (a) Cex (x = 0, 0.05, 0.10, 0.15 mol) without Ndy-dopant (y = 0 mol); (b) Ndy (y = 0, 0.05, 0.10, 0.15 mol) without Cex-dopant (x = 0 mol); and (c) Cex and Ndy co-doped samples (x:y = 1 molar ratio).
Energies 16 04318 g004aEnergies 16 04318 g004b
Figure 5. The Nyquist impedance plots of B1 (a) and B16 (b) samples at 500 °C and their equivalent circuit.
Energies 16 04318 g005
Figure 6. The Arrhenius plots of Nd-dopant (Ndy: 0 mol) (a) and Ce-dopant (Cex: 0 mol) (b) BZCNNYO samples.
Energies 16 04318 g006
Table 1. The developed BZCNYYO and the counter compounds stoichiometry ratios.
NotationsBaZr(0.80-x-y-z)CexYyYbzO3-δCex
(mol)
Yy
(mol)
Ybz
(mol)
Counter samplesA1BaZrO3
A2BaZr0.80Y0.20O3 0.20
A3BaZr0.10Ce0.70Y0.20O30.70 0.20
A4BaZr0.10Ce0.70Y0.10Yb0.10O30.70 0.100.10
A5BaZr0.40Ce0.40Y0.10Yb0.10O30.40 0.100.10
NotationsBaZr(0.80-x-y)CexNdyY0.10Yb0.10O3-δCex
(mol)
Ndy
(mol)
Y0.10
(mol)
Yb0.10
(mol)
BZCNYYOB1BaZr0.80(Y0.10Yb0.10)O3000.100.10
B2BaZr0.75(Ce0.05Y0.10Yb0.10)O30.05
B3BaZr0.70(Ce0.10Y0.10Yb0.10)O30.10
B4BaZr0.65(Ce0.15Y0.10Yb0.10)O30.15
B5BaZr0.75(Nd0.05Y0.10Yb0.10)O300.050.100.10
B6BaZr0.70(Ce0.05Nd0.05Y0.10Yb0.10)O30.05
B7BaZr0.65(Ce0.10Nd0.05Y0.10Yb0.10)O30.10
B8BaZr0.60(Ce0.15Nd0.05Y0.10Yb0.10)O30.15
B9BaZr0.70(Nd0.10Y0.10Yb0.10)O300.100.100.10
B10BaZr0.65(Ce0.05Nd0.10Y0.10Yb0.10)O30.05
B11BaZr0.60(Ce0.10Nd0.10Y0.10Yb0.10)O30.10
B12BaZr0.55(Ce0.15Nd0.10Y0.10Yb0.10)O30.15
B13BaZr0.65(Nd0.15Y0.10Yb0.10)O300.150.100.10
B14BaZr0.60(Ce0.05Nd0.15Y0.10Yb0.10)O30.05
B15BaZr0.55(Ce0.10Nd0.15Y0.10Yb0.10)O30.10
B16BaZr0.50(Ce0.15Nd0.15Y0.10Yb0.10)O30.15
Table 2. The fabrication process steps.
First StepSecond StepThird Step
PVAsol
(g)
Water
(mL)
Time
(min)
T
(°C)
n-Prop.
(mL)
Time
(min)
T
(°C)
Powder
(g)
Time
(h)
T
(°C)
Proper Amount101585203085BZCNYYO2room
Table 3. The crystal and microstructural parameters of all the BZCNYYO compounds.
Samplea (Å)ε (%)
B14.19890.19
B24.20240.23
B34.21150.26
B44.22650.38
B54.20160.17
B64.21150.26
B74.21500.32
B84.21900.53
B94.19380.20
B104.20200.25
B114.20710.30
B124.21900.69
B134.19340.19
B144.21480.30
B154.22690.54
B164.22960.72
Table 4. The geometry and conductivity data for the BZCNNYO pellets at different temperatures.
B1B2B3B4B5B6B7B8B9B10B11B12B13B14B15B16
t (mm)1.21.21.11.21.21.210.910.81.51.11.21.11.21
S (cm2)0.4780.4990.5090.4480.5010.4720.460.4350.4660.4030.4090.4750.8560.6260.5370.513
T (°C)Conductivity, σ (Scm−1)
7003.47 × 10−43.78 × 10−44.40 × 10−45.80 × 10−45.51 × 10−46.11 × 10−46.66 × 10−41.08 × 10−38.87 × 10−41.16 × 10−31.35 × 10−31.59 × 10−37.62 × 10−48.47 × 10−41.12 × 10−31.82 × 10⁻³
6502.02 × 10−42.32 × 10−42.34 × 10−43.66 × 10−43.14 × 10−43.74 × 10−44.14 × 10−46.84 × 10−45.48 × 10−47.60 × 10−49.78 × 10−41.13 × 10−35.08 × 10−45.64 × 10−47.48 × 10−41.24 × 10⁻³
6001.02 × 10−41.22 × 10−41.33 × 10−42.37 × 10−41.74 × 10−42.13 × 10−42.45 × 10−44.27 × 10−43.33 × 10−44.77 × 10−46.61 × 10−47.81 × 10−43.36 × 10−43.79 × 10−44.97 × 10−48.43 × 10⁻⁴
5504.93 × 10−55.72 × 10−56.90 × 10−51.40 × 10−48.72 × 10−51.18 × 10−41.48 × 10−42.50 × 10−41.95 × 10−42.97 × 10−44.37 × 10−45.34 × 10−42.25 × 10−42.51 × 10−43.23 × 10−45.62 × 10⁻⁴
5002.16 × 10−52.72 × 10−53.66 × 10−57.54 × 10−54.64 × 10−56.69 × 10−58.39 × 10−51.60 × 10−41.12 × 10−41.77 × 10−42.71 × 10−43.26 × 10−41.49 × 10−41.70 × 10−42.10 × 10−43.77 × 10⁻⁴
4508.14 × 10−61.08 × 10−51.67 × 10−53.67 × 10−52.09 × 10−53.41 × 10−54.55 × 10−57.81 × 10−55.82 × 10−59.98 × 10−51.55 × 10−41.82 × 10−49.66 × 10−51.09 × 10−41.30 × 10−42.40 × 10⁻⁴
4002.83 × 10−63.62 × 10−67.85 × 10−62.17 × 10−68.74 × 10−61.51 × 10−52.07 × 10−54.24 × 10−52.83 × 10−55.26 × 10−58.84 × 10−51.03 × 10−46.20 × 10−56.86 × 10−58.05 × 10−51.39 × 10⁻⁴
3508.85 × 10−78.49 × 10−73.06 × 10−68.01 × 10−62.76 × 10−65.78 × 10−68.25 × 10−61.64 × 10−51.15 × 10−52.47 × 10−54.07 × 10−54.63 × 10−53.39 × 10−53.66 × 10−54.08 × 10−57.08 × 10⁻⁵
3001.96 × 10−71.88 × 10−78.98 × 10−72.10 × 10−71.87 × 10−71.99 × 10−71.70 × 10−71.62 × 10−71.68 × 10−71.55 × 10−71.44 × 10−51.67 × 10−51.42 × 10−51.49 × 10−51.49 × 10−52.68 × 10⁻⁵
Table 5. The observed geometry, conductivity, and thermal activation energy Ea values measured for the reference sample at different temperatures.
A1A2A3A4A5
t (cm)0.160.1550.1150.160.095
S (cm2)0.5310.5630.7540.5030.554
T (°C)Conductivity, σ (Scm−1)
7008.57 × 10−73.64 × 10−51.49 × 10−31.58 × 10−38.41 × 10−4
6503.73 × 10−71.62 × 10−51.07 × 10−31.04 × 10−35.58 × 10−4
6001.52 × 10−78.18 × 10−67.11 × 10−46.75 × 10−43.55 × 10−4
5508.23 × 10−83.79 × 10−65.03 × 10−46.13 × 10−42.32 × 10−4
5002.70 × 10−81.63 × 10−63.77 × 10−44.04 × 10−41.54 × 10−4
4504.28 × 10−96.90 × 10−72.99 × 10−42.45 × 10−41.45 × 10−4
4009.18 × 10−102.37 × 10−71.83 × 10−41.35 × 10−47.78 × 10−5
3501.86 × 10−107.43 × 10−89.32 × 10−56.84 × 10−53.68 × 10−5
3002.97 × 10−111.64 × 10−94.05 × 10−53.08 × 10−51.66 × 10−5
Ea (eV)1.251.070.450.40.44
Table 6. The Ea (eV) values of all the BZCNYYO samples.
MolNd:0Nd:0.05Nd:0.10Nd:0.15
Ce:0B10.90 eVB50.78 eVB90.64 eVB130.45 eV
Ce:0.05B20.77 eVB60.69 eVB100.57 eVB140.46 eV
Ce:0.10B30.73 eVB70.65 eVB110.53 eVB150.48 eV
Ce:0.15B40.63 eVB80.61 eVB120.53 eVB160.47 eV
Disclaimer/Publisher’s Note: The statements, opinions and data contained in all publications are solely those of the individual author(s) and contributor(s) and not of MDPI and/or the editor(s). MDPI and/or the editor(s) disclaim responsibility for any injury to people or property resulting from any ideas, methods, instructions or products referred to in the content.

