Article

Simulation Study on Heating Stability of PV/T-GSHP Automatic Control Heating System Based on TRNSYS

Civil Engineering, Energy College, Xi’an University of Science and Technology, Xi’an 710054, China
*
Author to whom correspondence should be addressed.
Energies 2023, 16(11), 4341; https://doi.org/10.3390/en16114341
Submission received: 9 March 2023 / Revised: 28 April 2023 / Accepted: 16 May 2023 / Published: 26 May 2023
(This article belongs to the Section A2: Solar Energy and Photovoltaic Systems)

Abstract

:
The PV/T-GSHP heating control system is proposed to address the energy consumption problem of building heating in northern China. By using TRNSYS to establish an automatic control model, the control of the heat pump start/stop, water supply temperature on the load side of the tank, and high temperature water return to the building can achieve the purpose of being energy saving, providing stable heating, and providing control of high temperature heating. The results show that the PV/T-GSHP control system has an annual fluctuation range of 0.01~0.17 kW in the heating period for a typical building heat supply and building heat load, and the system energy efficiency and energy consumption are increased by 14.5% and 33.91%, respectively, compared with the GSHP system, and the annual value of cost is reduced by 8.49% and 19.09% compared with the GSHP and traditional coal-fired boiler system, which shows that the PV/T-GSHP control system is more economical. It can be seen that the PV/T-GSHP control system has better heating stability, energy efficiency, and economy, and it provides theoretical significance for the current clean heating automatic control scheme in Chinese northern areas.

1. Introduction

Global warming is considered one of the most severe events of the 21st century, and it has already become the general agreement of the global social community to slow down the process of global warming by controlling the emission of carbon dioxide [1]. As of 2018, China’s energy consumption in buildings has accounted for up to 30% of the overall energy consumed by society [2]; the winter heating energy consumption in northern areas accounts for the largest proportion, so it is necessary to carry out clean heating projects in northern rural areas for the energy revolution and atmospheric environment management [3]. Therefore, Wang. J. et al. [4] proposed to combine PV/T (photovoltaic photothermal integration) technology with GSHP (ground source heat pump) technology to provide users with year-round cooling and heating energy.
Due to the high cost of experimental studies of this system, the performance was tested mainly using simulated operational systems such as TRNSYS [5]. The performance of PV/T-GSHP systems is studied by more and more scholars, and the operation mode optimization is mainly studied to optimize the heating mode of the system [6]. A solar photovoltaic and solar thermal system coupled with ground source heat pump is proposed by Zhao. X.L. [7], and the system is simulated dynamically based on a simulation model and its operational performance is analyzed. The system can meet the thermal load of the building object with electrical energy output and store the heat collected by the PV/T collector in the form of geothermal energy in the shallow subsoil to improve the thermal imbalance of the soil, which has considerable engineering value. Canelli et al. [8] analyzed the performance of two different systems in a load sharing scenario. Energy analysis results show that using the PV/T-GSHP cogeneration system is 53.1% more energy efficient than heating with a conventional coal-fired boiler for the same building load. Xu. P. et al. [9] proposed a new solar photovoltaic–thermal pump composite building energy supply system. The system can fully utilize the respective benefits of solar energy and heat pumps, improve the overall utilization efficiency of the system by complementing energy, and meet various energy needs of the building, which is of significant importance in promoting the utilization of renewable energy and building with energy conservation in mind. Sommerfeldt et al. [10] compared simulations of PV/T-GSHP heating systems with conventional GSHP heating systems and concluded that the former can reduce the length of buried pipes by 18% or reduce the buried pipe footprint by 50% relative to the latter.
The optimization mainly focuses on the evaporator temperature, heat storage tank, buried pipe length, etc. [11,12]. There is little research on the system control strategy, but the system control is essential [13]. The most used methods for optimizing the operation control strategy in PV/T-GSHP systems are the load domain method, time domain method, and temperature difference control method [14]. Bertram et al. [15] developed a control model to evaluate the effect of collectors on the inlet temperature of heat pumps. The results show that unglazed photovoltaic thermal (PV/T) collectors have better results compared to conventional heat pump systems. Fine et al. [16] modeled the minimum collector area for controlling different building cooling and heating load ratios. Zhang C.X. et al. [17] used a water pump start-stop control to compare the complementary advantages of coupled systems by establishing a mathematical model of PV/T-GCHPs; the performance of PV/T-GCHPs was compared with that of the corresponding PV system and soil source heat pump system based on the simulation study of the system operation characteristics. The life-cycle cost of PV/T-GCHPs is CNY 77,192.45 less than that of the corresponding GCHPs. Emmi et al. [18] used numerical simulation to control the buried pipe loop’s start-stop using the tank temperature. To study solar-assisted GSHP, simulations were performed in cold regions using TRNSYS software, v18.0 to analyze the effect of buried pipe length on system energy efficiency.
From a large amount of literature, it can be seen that most of the studies on the same type of system are on the performance of a certain structure of the system or on the overall system performance, while there are few studies on the stability of the water supply temperature at the heating end due to particularly strong solar radiation. Thus, this paper uses TRNSYS to establish the PV/T-GSHP heating automatic control system model, which can realize the self-sufficiency of building heating heat by automatic control, stabilize the system water supply temperature in cold areas, and reduce the energy consumption of building heating. The system adopts the automatic control of temperature difference, temperature and flow rate, and simulates the system water supply temperature, heat supply, and energy-saving efficiency of the building under the working condition of the heating period.

2. System Description

2.1. Operating Principle of the System

The PV/T-GSHP heating control system model is shown in Figure 1. The system mainly includes the following: PV/T collectors, GSHP, U-tube ground heat exchanger, thermal storage tank, heating ending, and pump and auxiliary equipment such as an electronic controller and temperature sensor (ST). The system principle is that when the collector collects sufficient heat, the solar collector system runs to bear all the building heat load; and when the heat of the storage tank is not enough to supply the building heating at night or under cloudy conditions, the ground source heat pump coupling heating is activated, and the system is in pure ground source heat pump heating mode at this time, and all the building heat is provided by the ground source heat pump.
Based on the schematic diagram, the PV/T-GSHP heating system can realize four operation modes, and the auxiliary control valve can be used for mode switching to select different operation modes at different times and under different weather conditions.
Mode 1: PV/T collector mode. This mode operates when there is enough solar collector heat to deposit the heat inside the collector into the thermal storage tank for heating during the heating period as well as thermal storage during the non-heating period.
Mode 2: PV/T soil thermal storage mode. The PV/T collector absorbs solar radiation and uses part of it to generate electricity, while the other part is injected into the ground as heat with the circulating fluid, and then the heat is stored in the soil through the buried tube heat exchanger.
Mode 3: GSHP heating mode. During the heating period, the heat stored in the soil across seasons is sent to the evaporator of the heat pump unit for exchange through the buried tube heat exchanger, and the low-temperature and low-pressure heat exchanger is worked by the compressor to obtain a high-temperature and high-pressure fluid, which is exchanged in the condenser of the heat pump unit to provide heat to the end of the load.
Mode 4: Direct solar energy supply mode. In the heating period, when the heat stored in the water tank by solar energy reaches the design standard of the heating system, the system uses the water tank heat directly for heating.
The main advantage of this system is that they can be coupled to complement each other’s energy. Although the PV/T system alone can generate heat and electricity, it does not have stable energy supply capacity because of weather conditions. The GSHP system can provide stable heating, but not only does it require a lot of initial cost to drill wells and install buried tube heat exchangers in the early stage, but also the underground soil average temperature decreases year by year as the system runs, which affects the heating effect and reduces the operating life of the system (which has been verified in Section 2.5.3 of reference [19]). Coupling the two can generate electricity and stabilize thermal energy while also depositing PV/T collector heat underground in summer to enhance power generation and soil average temperature and stabilize the soil heat balance.
The heating object is a two-story residential building in rural Beijing with a heating area of 180 m2. The interior design temperature is 20 °C during the heating period, and the heating period is from 15 November to 15 March. In this paper, the heating time is considered as all-day heating. The circulating mass of the system is water, and the heating end is selected from floor heating coils. The system is modeled by Sketchup combined with TRNBuild, and the “.idf” file is imported into TRNSYS transient simulation to run the heating period heat load and supply heat reasonably according to the heat demand of the building.

2.2. Automatic Control Strategy

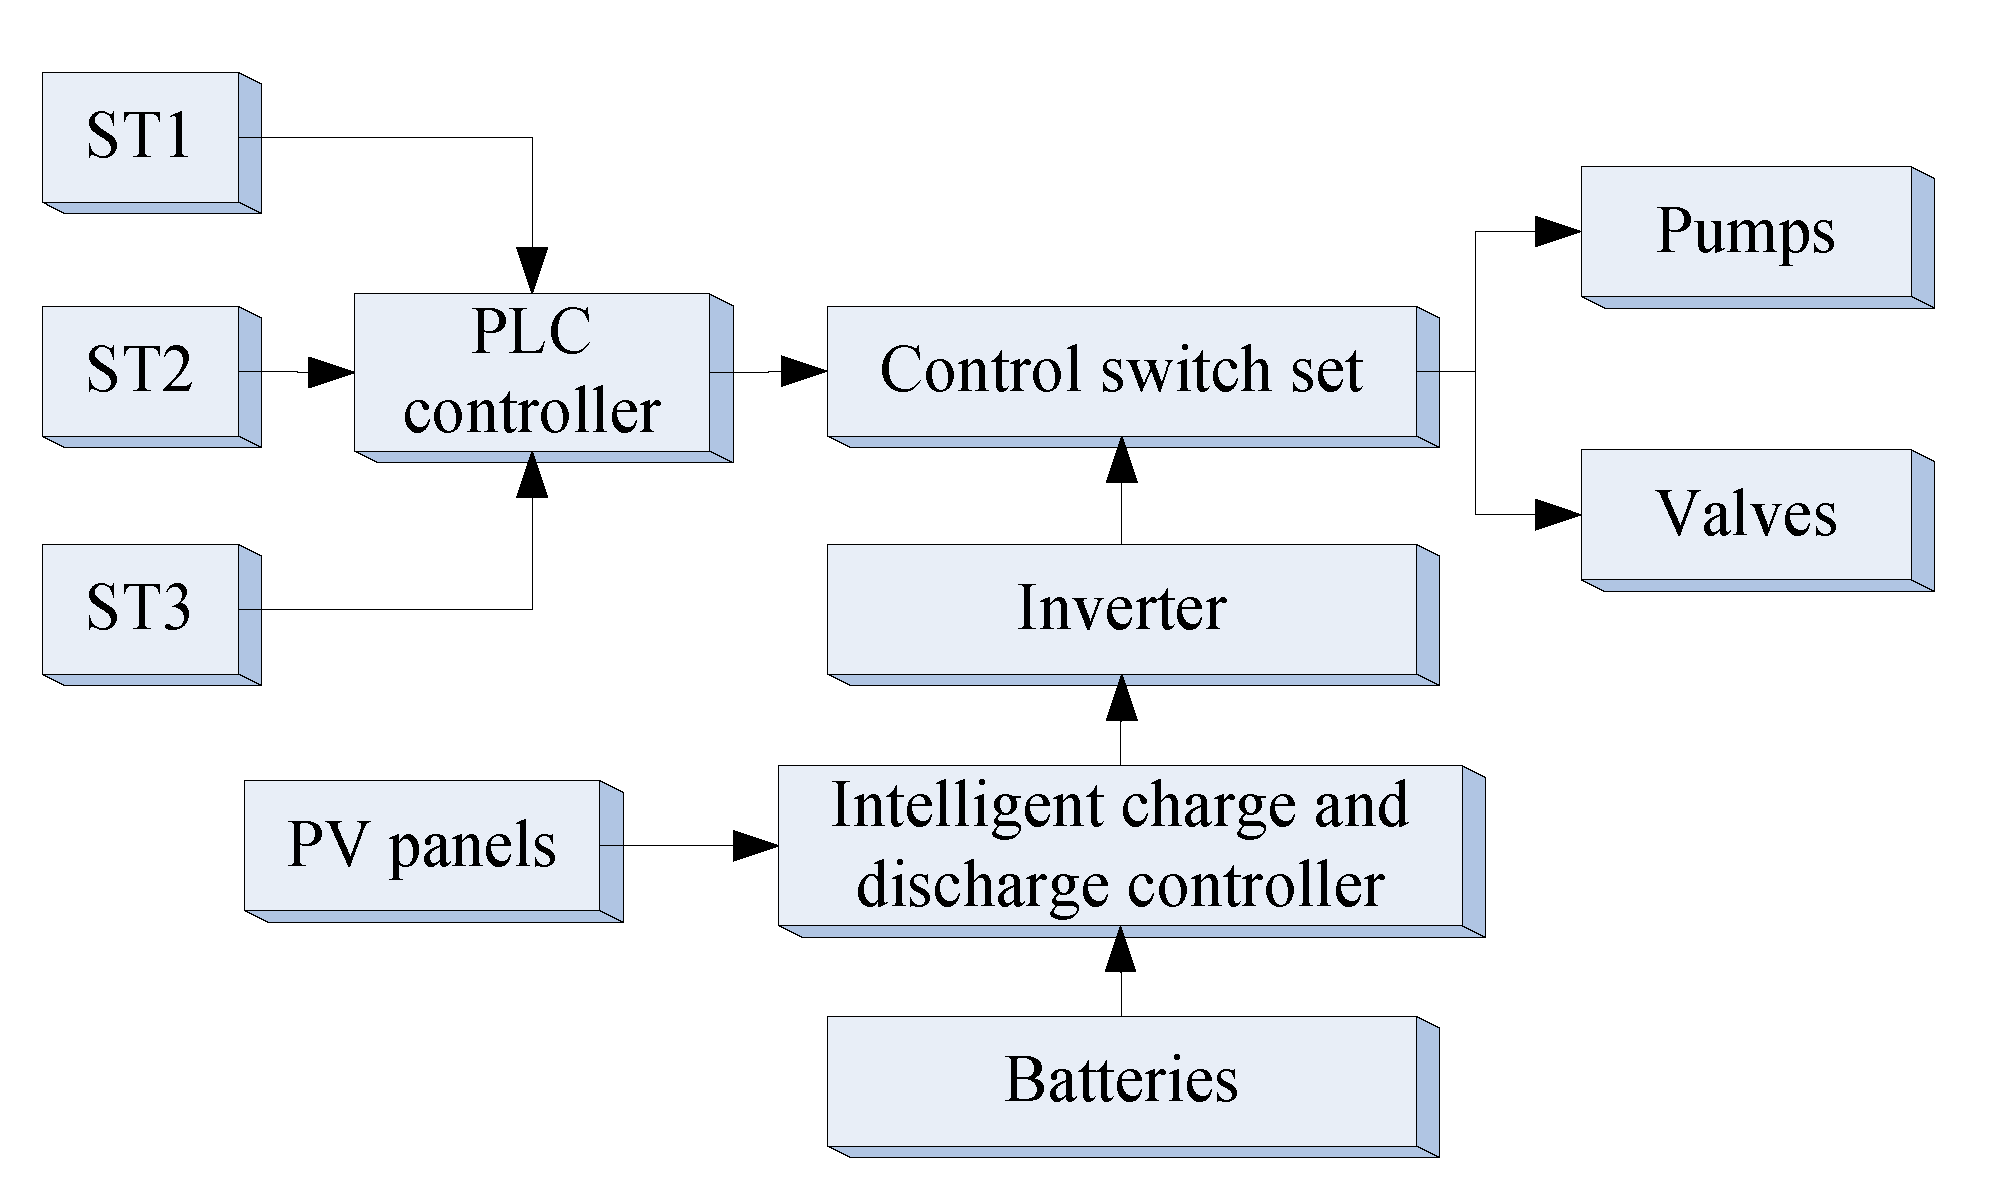
The PV/T-GSHP heating system involves different seasons, different working conditions, and different operation modes, and the following control methods are listed under this condition. (1) The control of temperature difference. This is controlled mainly through the temperature sensor transmission temperature; the controller processing temperature difference value will signal to the pump, diverter valve, etc., to control the pump start and stop and fluid direction and thus control the system operation. (2) The control of temperature. Through the temperature sensor, the temperature signal is transmitted to the temperature controller, which controls the temperature of the water tank within a reasonable range of the heating design water supply temperature. (3) The control of time. By setting a fixed heating and non-heating period energy supply time, when the time is within the fixed time, the output signal is sent to control heating or heat storage. (4) The control of heating load. When the load rate is less than the set value (generally taken as 0.1), the unit is prevented from starting and stopping frequently, and the unit is turned off. Its operation schematic diagram is shown in Figure 2, in different conditions of different modes of operation, showing the need for automatic control of the system conditions. Devices are selected with the intelligent charge and discharge controller, control switch group, PLC programmable controller, etc., so that the system can both intelligently adjust the working voltage of solar panels to a greater extent to improve the power generation of the panels and also the logic control of the system.
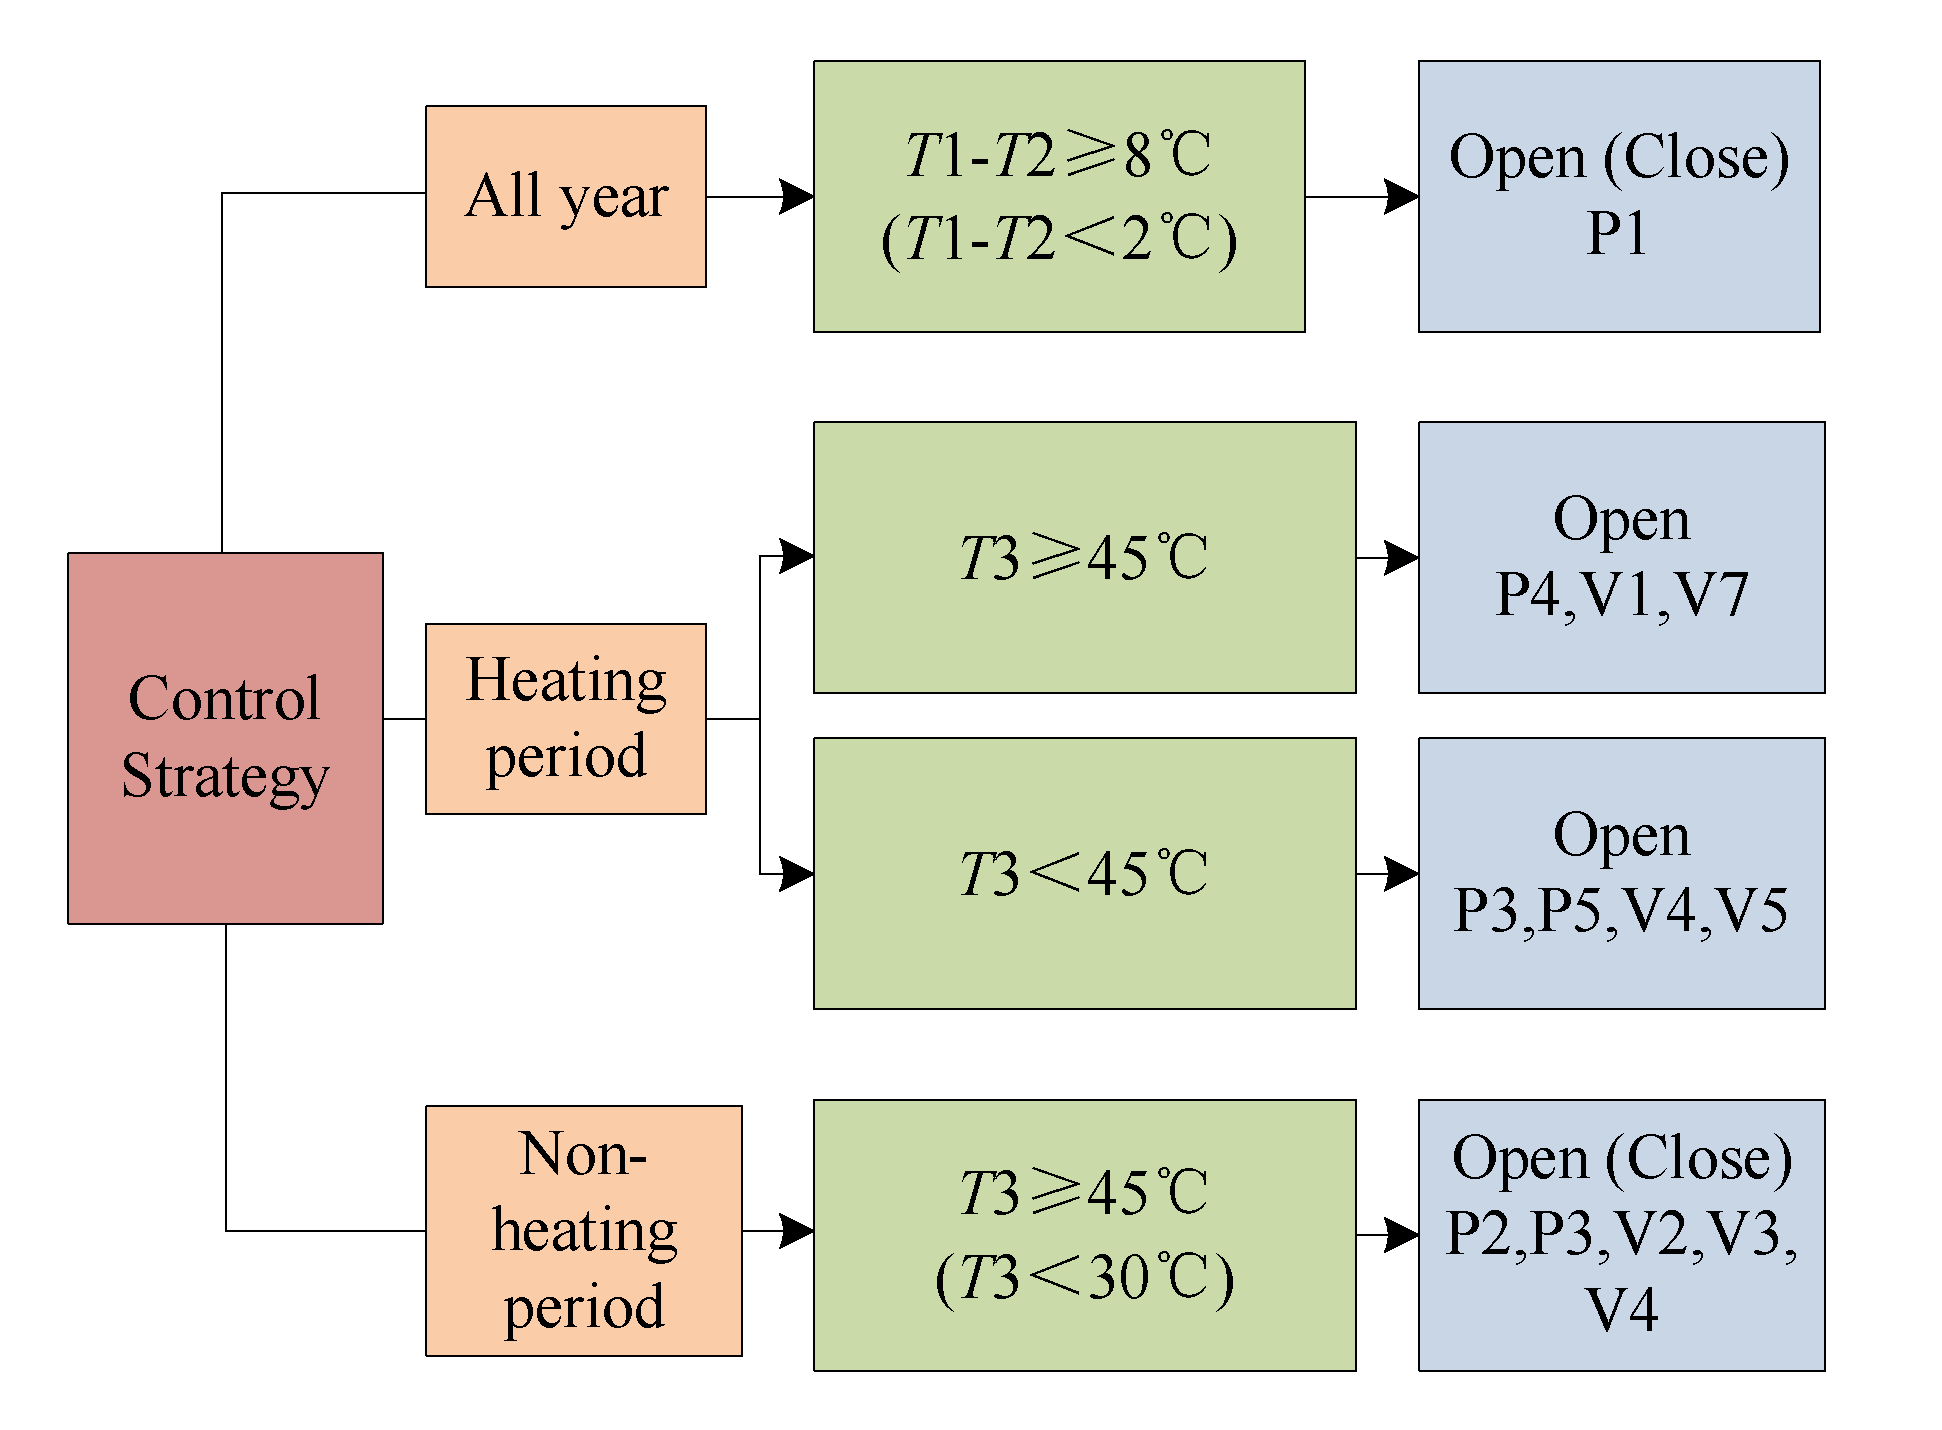
According to the control logic block diagram of system operation, the automatic control strategy of the coupled system is determined. Figure 3 shows the control strategy diagram of the PV/T system coupled with a ground source heat pump heating system in operation. The heat collection system uses a temperature difference controller (type 2b) to control the start and stop of the pump (type 114), thus achieving the purpose of reducing unnecessary energy consumption. Temperature difference controller output “1” means start the pump, and output “0” means shut down the pump. When the temperature difference between T1 and T2 is greater than or equal to 8 °C, the system controller receives a signal to turn on pump 1 and the tank starts collecting heat from the collector; when the temperature difference between T1 and T2 is less than 2 °C, the system controller signals to turn off the pump and the system stops running. In the non-heating period, when the monitoring temperature of T3 is greater than 45 °C, the system controller signals to turn on pump 2 and 3 as well as valves 2, 3, and 4 to start soil heat storage; when the monitoring temperature of T3 is less than 30 °C, the equipment is turned off and the system stops operation. When there is a heat load demand during the heating period, if T3 is greater than or equal to 45 °C, pump 4 is turned on as well as valves 1 and 7, making the load-side demand all borne by the solar collector; if the solar heat supply is insufficient and the T3 is less than 45 °C, the control turns off pump 4 as well as valves 1 and 7, turns on pumps 3 and 5 as well as valves 4 and 5, and the soil source heat pump supplies the heat load.

2.3. Simulation Modeling

In the PV/T-GSHP heating system, it is required to both heat during the heating period and store heat to the soil during the non-heating period, so the system will have multiple modules and pipes, the actual system composition is intricate and complex, and the simulation is carried out with the general situation of the actual project as a reference, which has many influencing factors. In order to simulate the actual operation of the system more accurately with TRNSYS software, the simulation settings need to match the design working conditions, under which the key conditions and criteria are grasped and the factors that have a relatively small impact on the system are ignored, so the following assumptions are made for the simulation system.
(1)
In all pipelines, ignore all pipeline fluid flow thermal resistance and heat loss cases according to TRNSYS software features.
(2)
Ignore the physical changes due to fluid temperature changes.
(3)
The weather conditions should use the actual real-time data of Beijing city, but because TRNSYS uses the parameters of a typical year, this simulation system ignores this effect.
(4)
Water is single-phase, homogeneous, and incompressible, and its thermophysical properties do not change with temperature.
(5)
It is considered a constant liquid flow with a constant specific heat capacity.
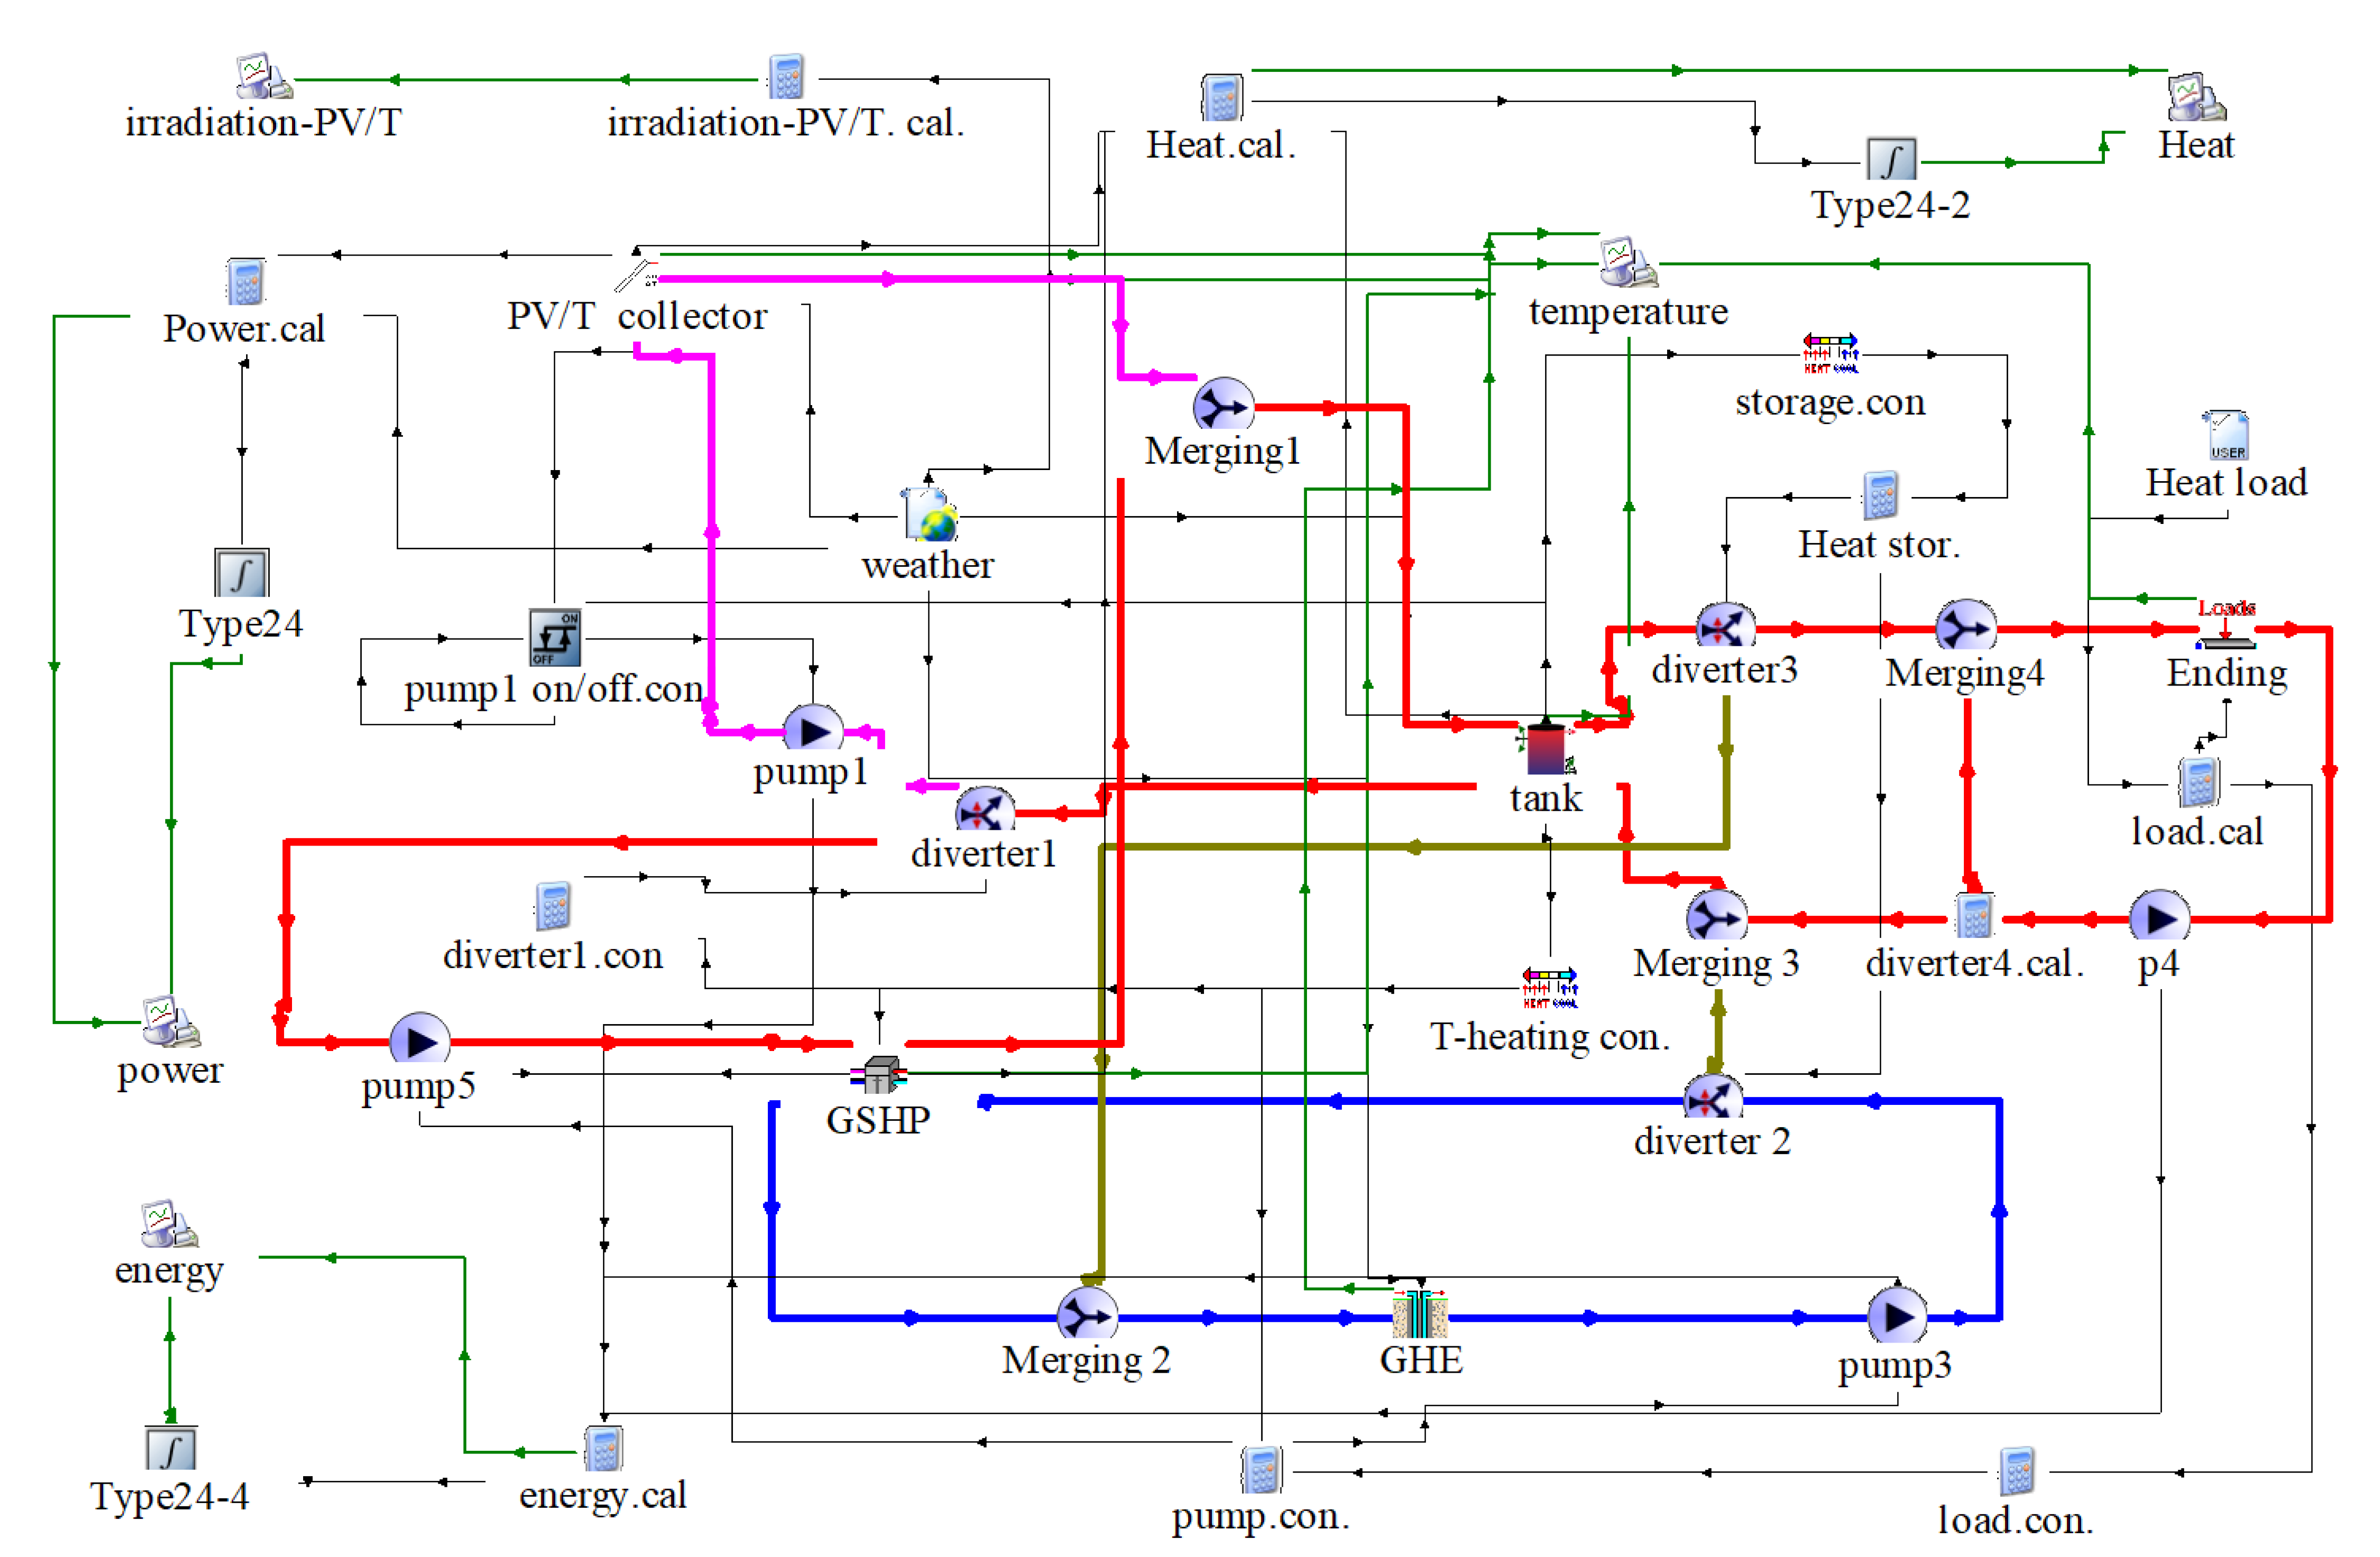
Using TRNSYS software, the simulation model of the system is established through reasonable module selection, as shown in Appendix A. The simulation runs only during the heating period and the time step is chosen to be one hour. According to the heating time in Beijing, the simulation time is set to 7632–10,536 h. A Typical day data are chosen according to the principle of the heat load maximum for 14 January, which is 9072–9096 h.
To maximize the use of solar energy, the temperature difference controller needs to conduct self-feedback control. Therefore, the temperature difference controller’s (type 2b) control equation is
When γ in = 1
γ out = 0 ,   T 1 T 2 < 2 1 ,   T 1 T 2 > 8
γ in = 0
γ out = 0 ,   T 1 T 2 < 8 1 ,   T 1 T 2 > 8
where γ in and γ out are the temperature difference controller input and output signals, respectively.
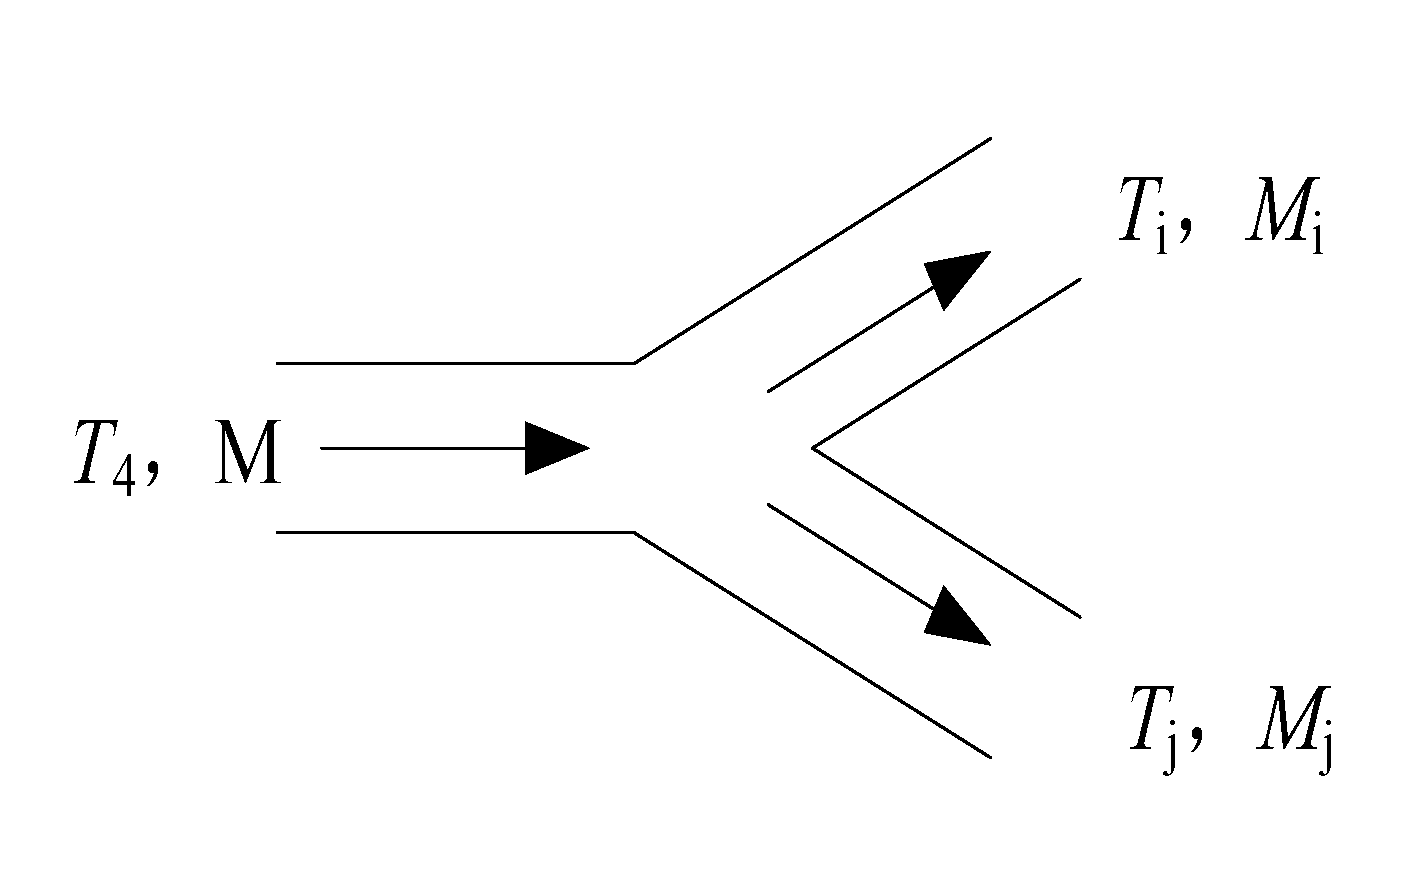
The core control point of this paper is the stability of heating temperature. The return water control uses diverter valve 4 (type 11f). On the one hand, when the collector heat is too high, making the water supply temperature on the load side of the tank too high, it will cause the heating room temperature to be higher. When the return water diversion control is used, the low-temperature return water is combined with the high-temperature water supply to reduce the water supply temperature and improve the thermal comfort of the building. On the other hand, if the high-temperature return water flows back to the tank again, it will cause the water circulation route to become longer. At this time, after all the return water is reheated, the energy consumption of the pump that saves the high-temperature return water flowing back to the tank is saved. For the diverter valve, using an equation function to edit the calculation equation, the diverter valve’s control of water flow and temperature is as shown in Figure 4.
According to the heat balance equation, the shunt calculation equation is as follows.
When T 3 > T s and T 4 < T s
M i = T 3 T s T 3 T 4 M
M j = M M i
When T 4 T s
M i = M
M j = 0
The thermal storage tank (type 4c) is controlled by a temperature controller (type 108), which monitors the temperature input to the water supply temperature on the load side of the tank and sets the first step temperature of the temperature controller to 50 ± 2 °C. When the water temperature at the outlet of the load side of the tank is lower than 49 °C, the temperature controller issues a signal “1” to control the diverter valve to close the heat collection system, and the circulating water only passes through the ground source side, and the ground source side equipment starts to work to bring the underground heat into the building for heating through the circulating water. When the temperature of the load side of the heat storage tank exceeds 51 °C, the temperature controller outputs the signal “0” and all the equipment on the ground source side is shut down.
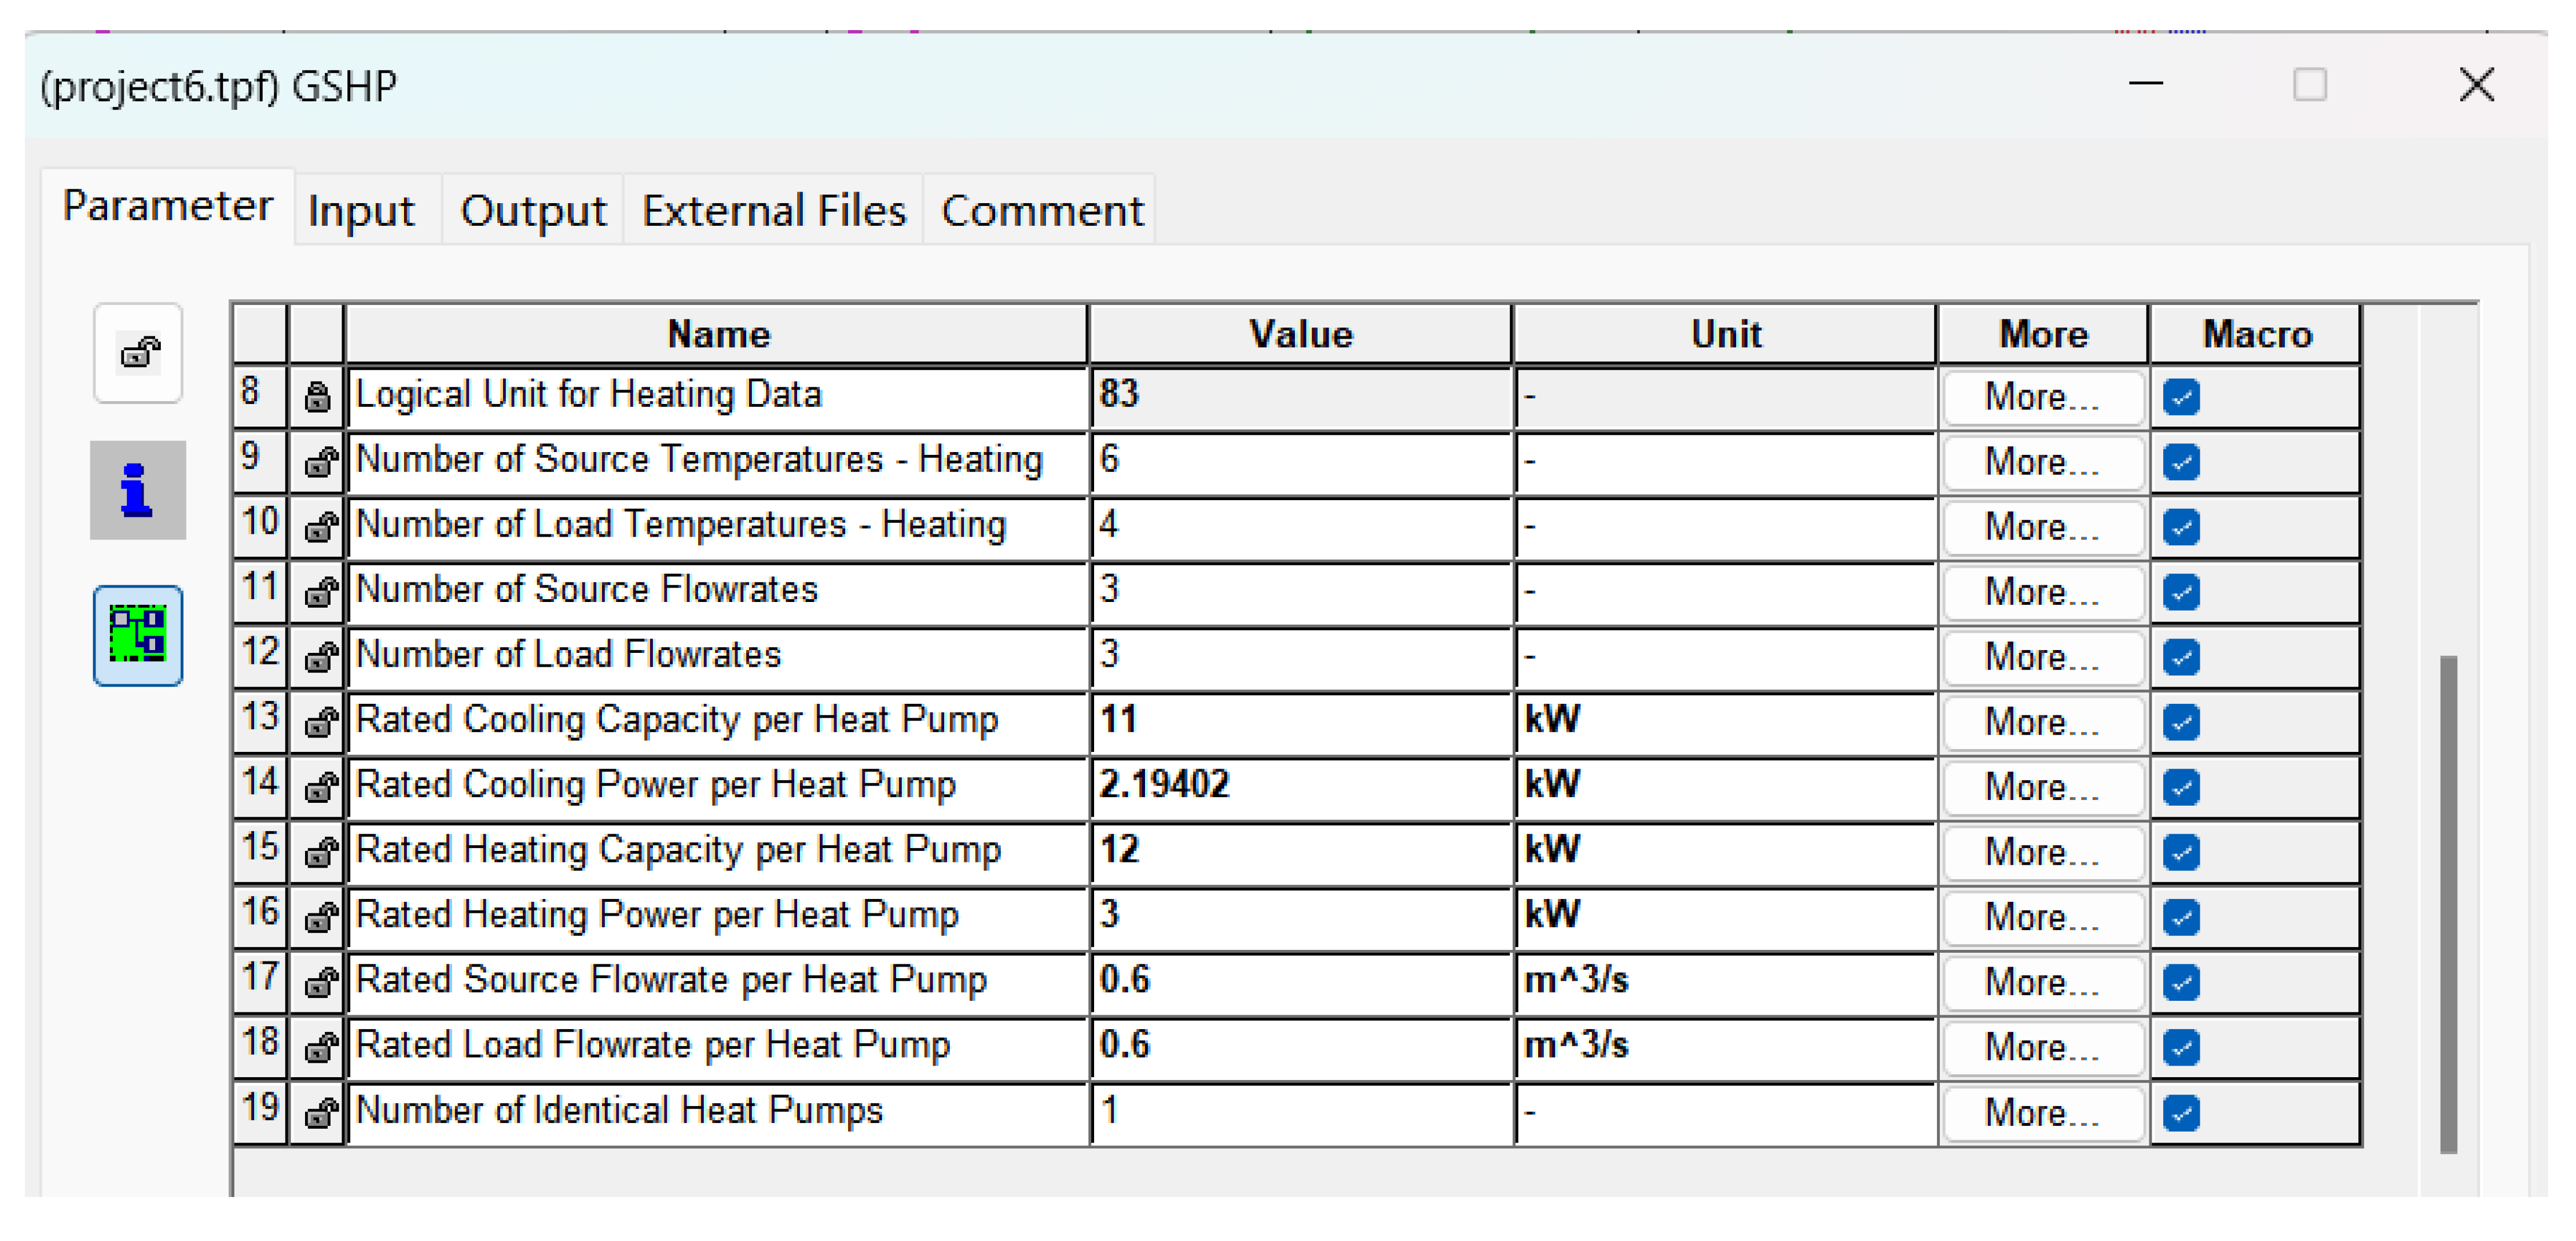
Regarding the calculated parameters of the U-tube GHE, PV/T collector, thermal storage tank. and GSHP, the paper does not specify the equipment selection calculation instructions, and the parameters are placed in Appendix B. The system performance parameters are mainly the heat supply and temperature of the PV/T collector (type 50b), GSHP (type 927), and thermal storage tank (type 4c), which determines the stability of system heating and the effectiveness of control technology. In addition, the system energy efficiency and the percentage of direct solar supply are also important performance parameters.
The efficiency of a PV/T system is an important concept in the field of photovoltaics, which directly determines whether a PV plant is worthy of investment and operation. The expression of PV efficiency is
η PV = η stc 1 β ( T PV T stc )
The electric power output at the effective area is calculated as
P p o w e r = ( τ α ) n IAM G T A PV / T η PV
The useful heat collection capacity of the PV/T collector is
Q J = m dot c p ( T 2 T in )
The GSHP in heating mode takes heat from the soil source as
Q ˙ abs = C a p heating P ˙ heating
At this point, the temperature of the water supply to the load-side outlet of the heat pump unit is calculated as
T load , out = T l o a d , i n + C a p h e a t i n g m ˙ load c p
The percentages of direct solar energy supply and energy efficiency are used to evaluate the percentage of the system, calculated as
ε = Q J C a p heating + Q J
C O P sy = C a p heating + Q J P heating + P pump

2.4. Simulation Validation

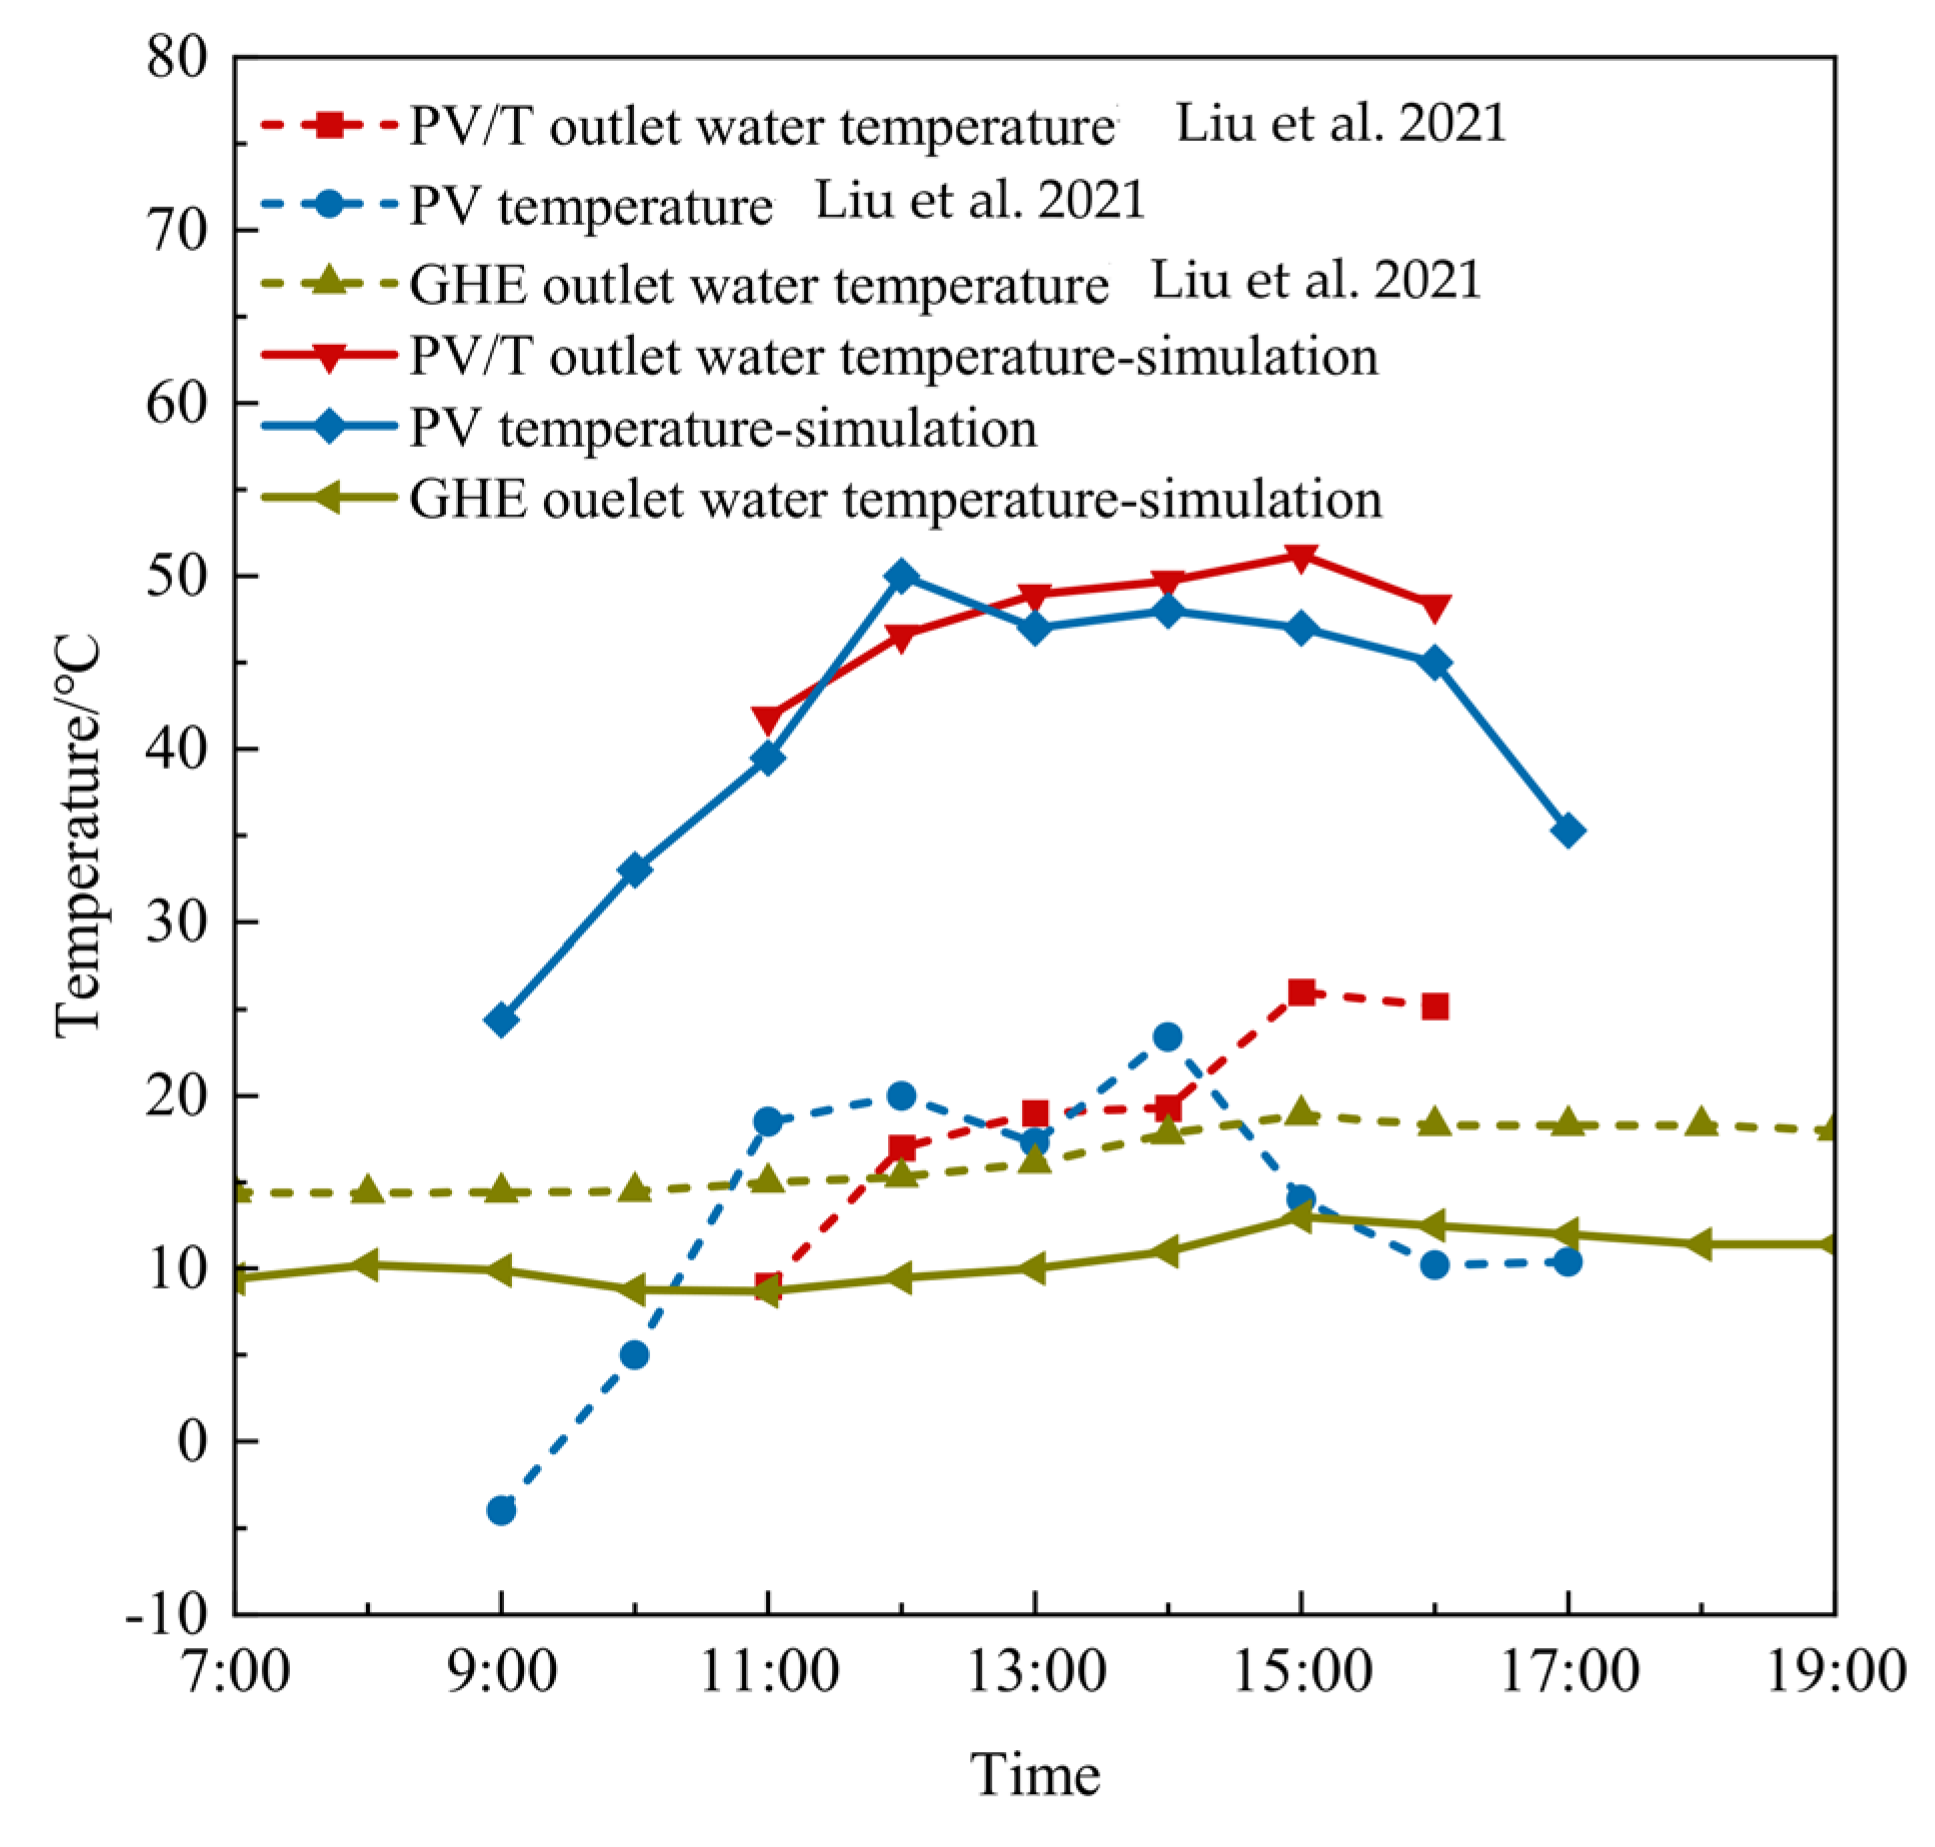
The use of TRNSYS software in the field of solar energy combined with the heat pump energy supply system is now mature internationally and its data are convincing. In this paper, the data of reference [20] are chosen as the simulation verification object. Reference [20] is a study of the performance of a combined PV/T-GSHP heating system under climatic conditions in Changsha, China. The rated heat production capacity of the heat pump unit of this system is 646 kW, the power is 184 kW, and the PV/T module area is 900 m2. The three parameters, PV/T outlet water temperature, PV temperature, and GHE outlet water temperature, derived from the system in the reference [20] were selected on 22 January, the second year of operation, and compared with the three parameters derived from the system in this paper at the same time of operation, and the results are shown in Figure 5.
It can be seen from Figure 5 that the graphical trends of the corresponding parameters are similar to those of the Liu. X.P. (2021) [20]. The large differences between the values of PV/T outlet water temperature and PV temperature and those of the reference [20] are due to the differences caused by the differences in operating systems, ambient temperatures, solar radiation, etc. Based on the variation trend of the same parameter within the same day, the simulation results of this paper can be considered reliable.

3. Results and Discussion

3.1. Outdoor Meteorological Parameters

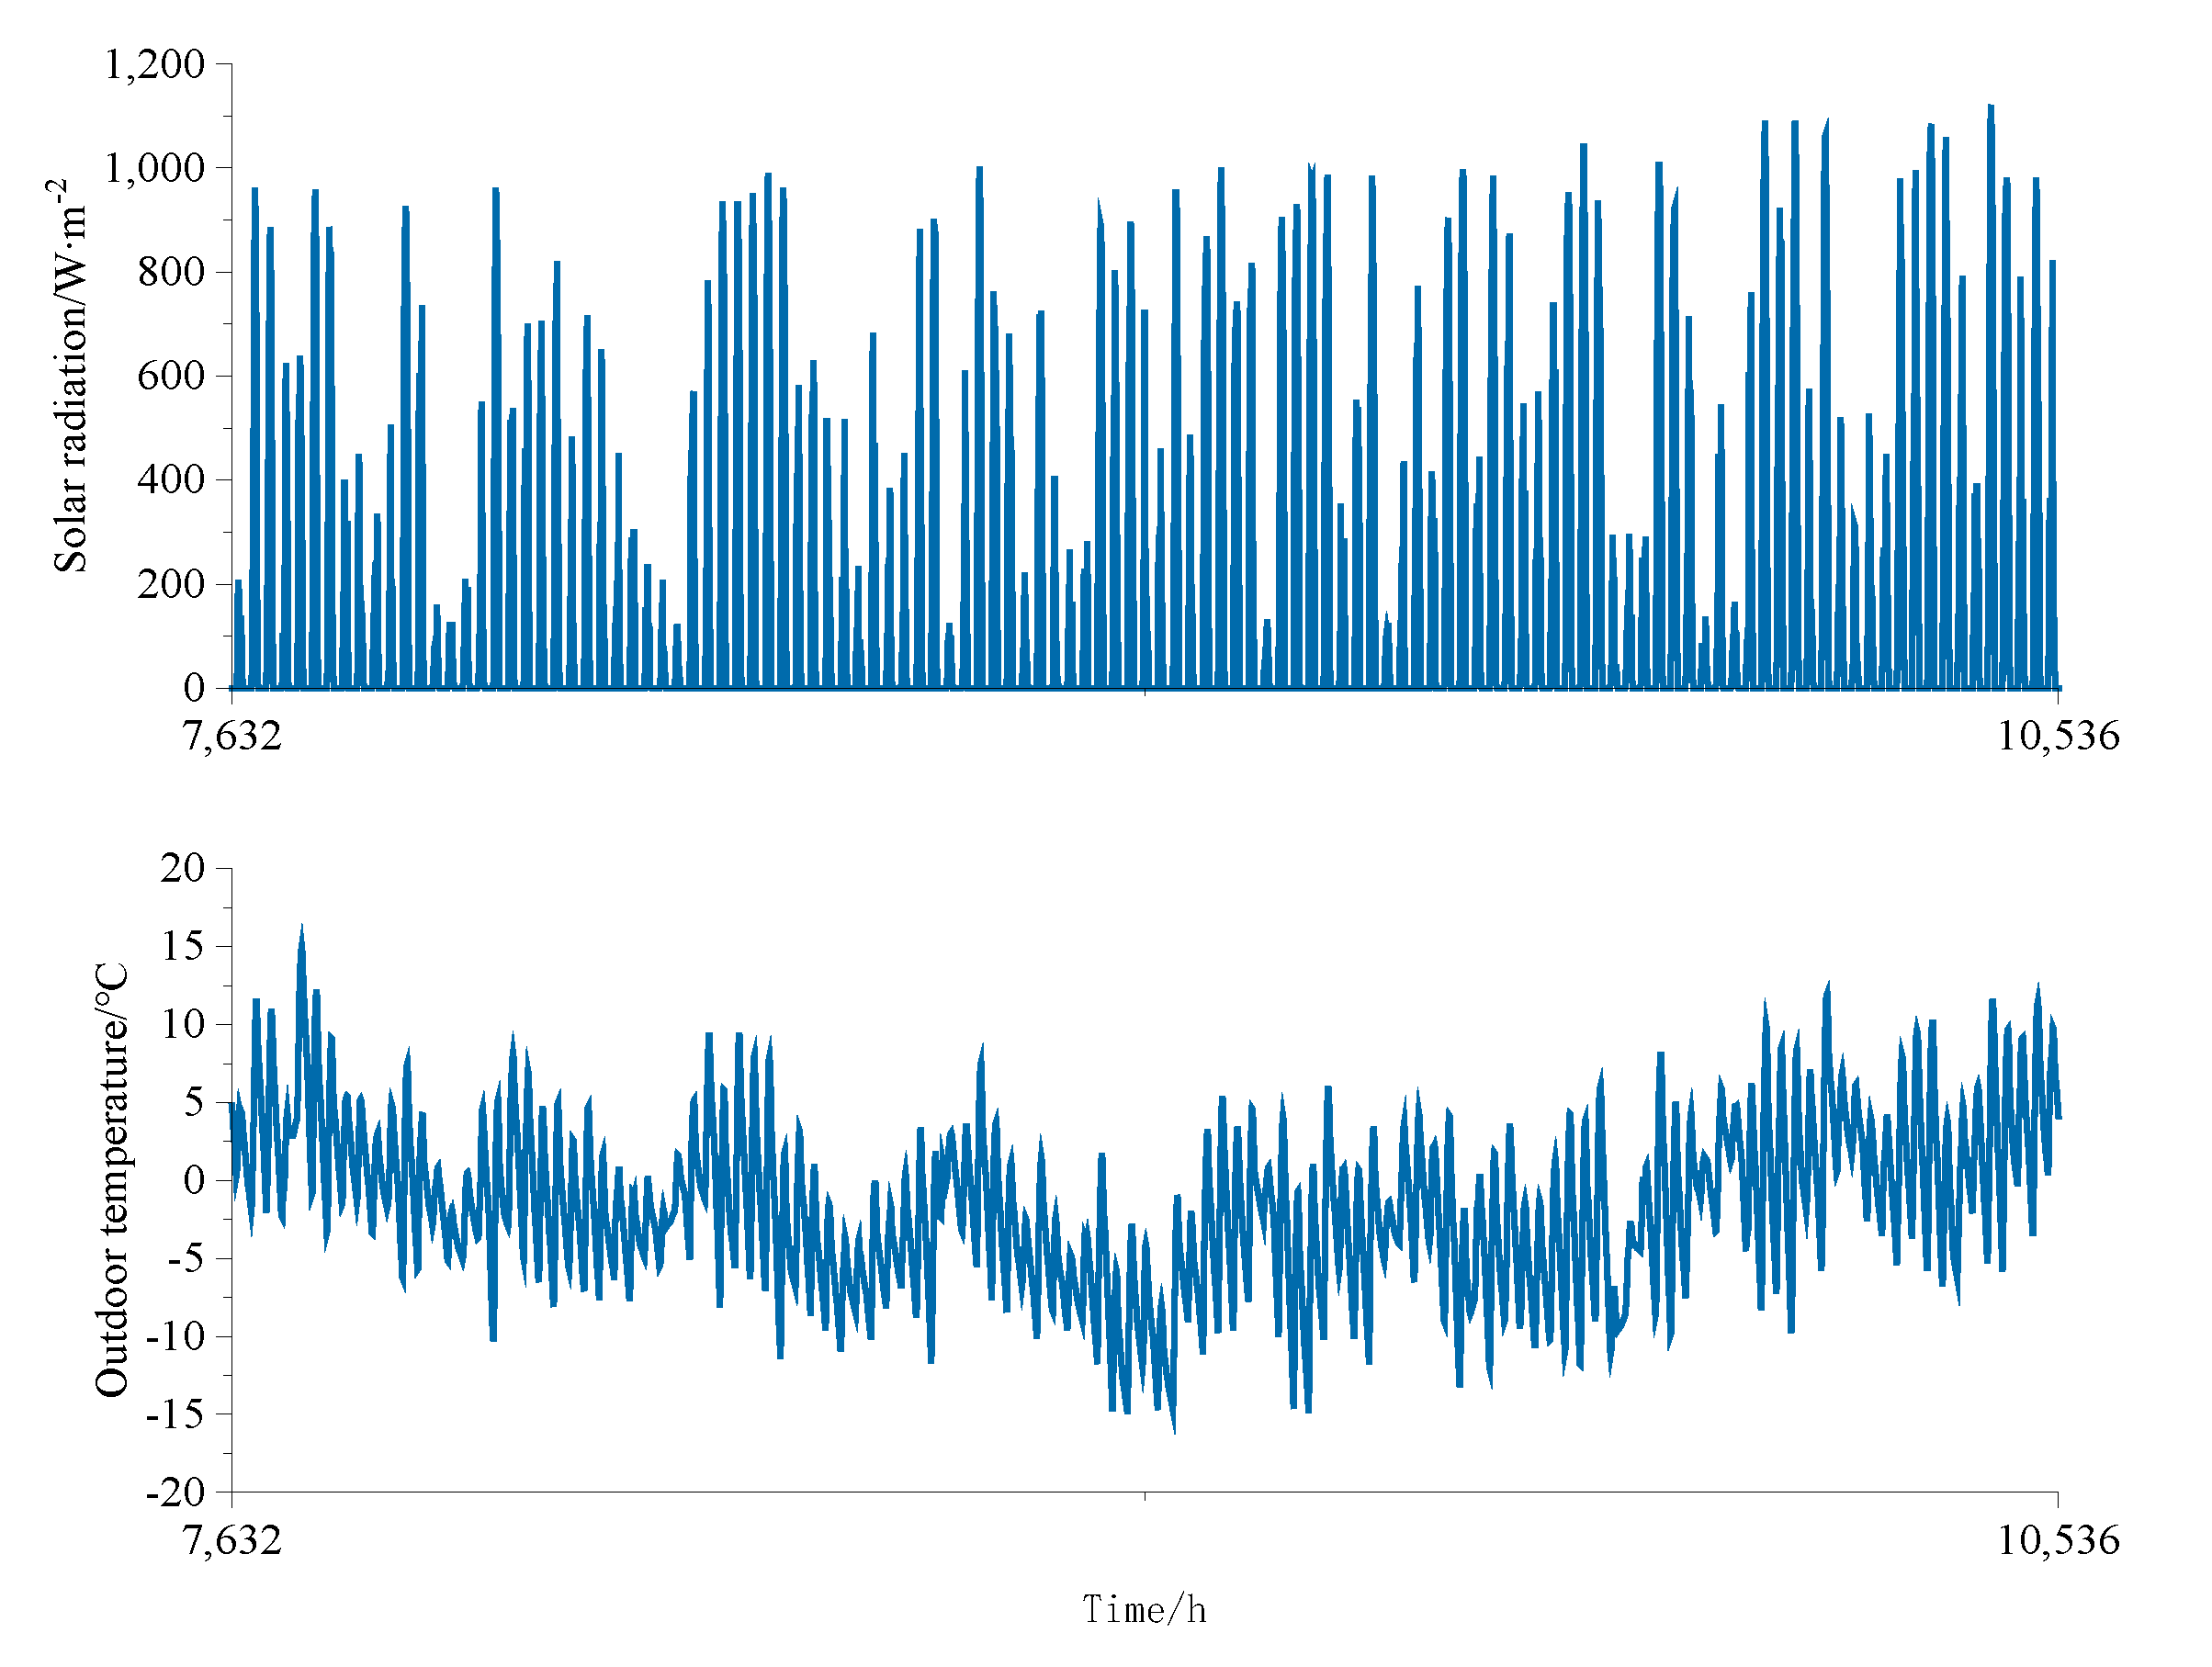
The simulation period was taken from 15 November of a typical year to 15 March of the following year, and the Type15-2 external file was used to read the outdoor temperature and solar radiation dynamics of Beijing in winter. This is shown in Figure 6. From Figure 6, it can be seen that Beijing has a low outdoor temperature in winter, and a heating system is needed to heat the room temperature in winter to meet the comfort of human living; the solar radiation intensity in winter is 0~1200 W/m2, and the solar radiation is widely distributed, which is suitable for the arrangement of a PV system.

3.2. Soil Average Temperature

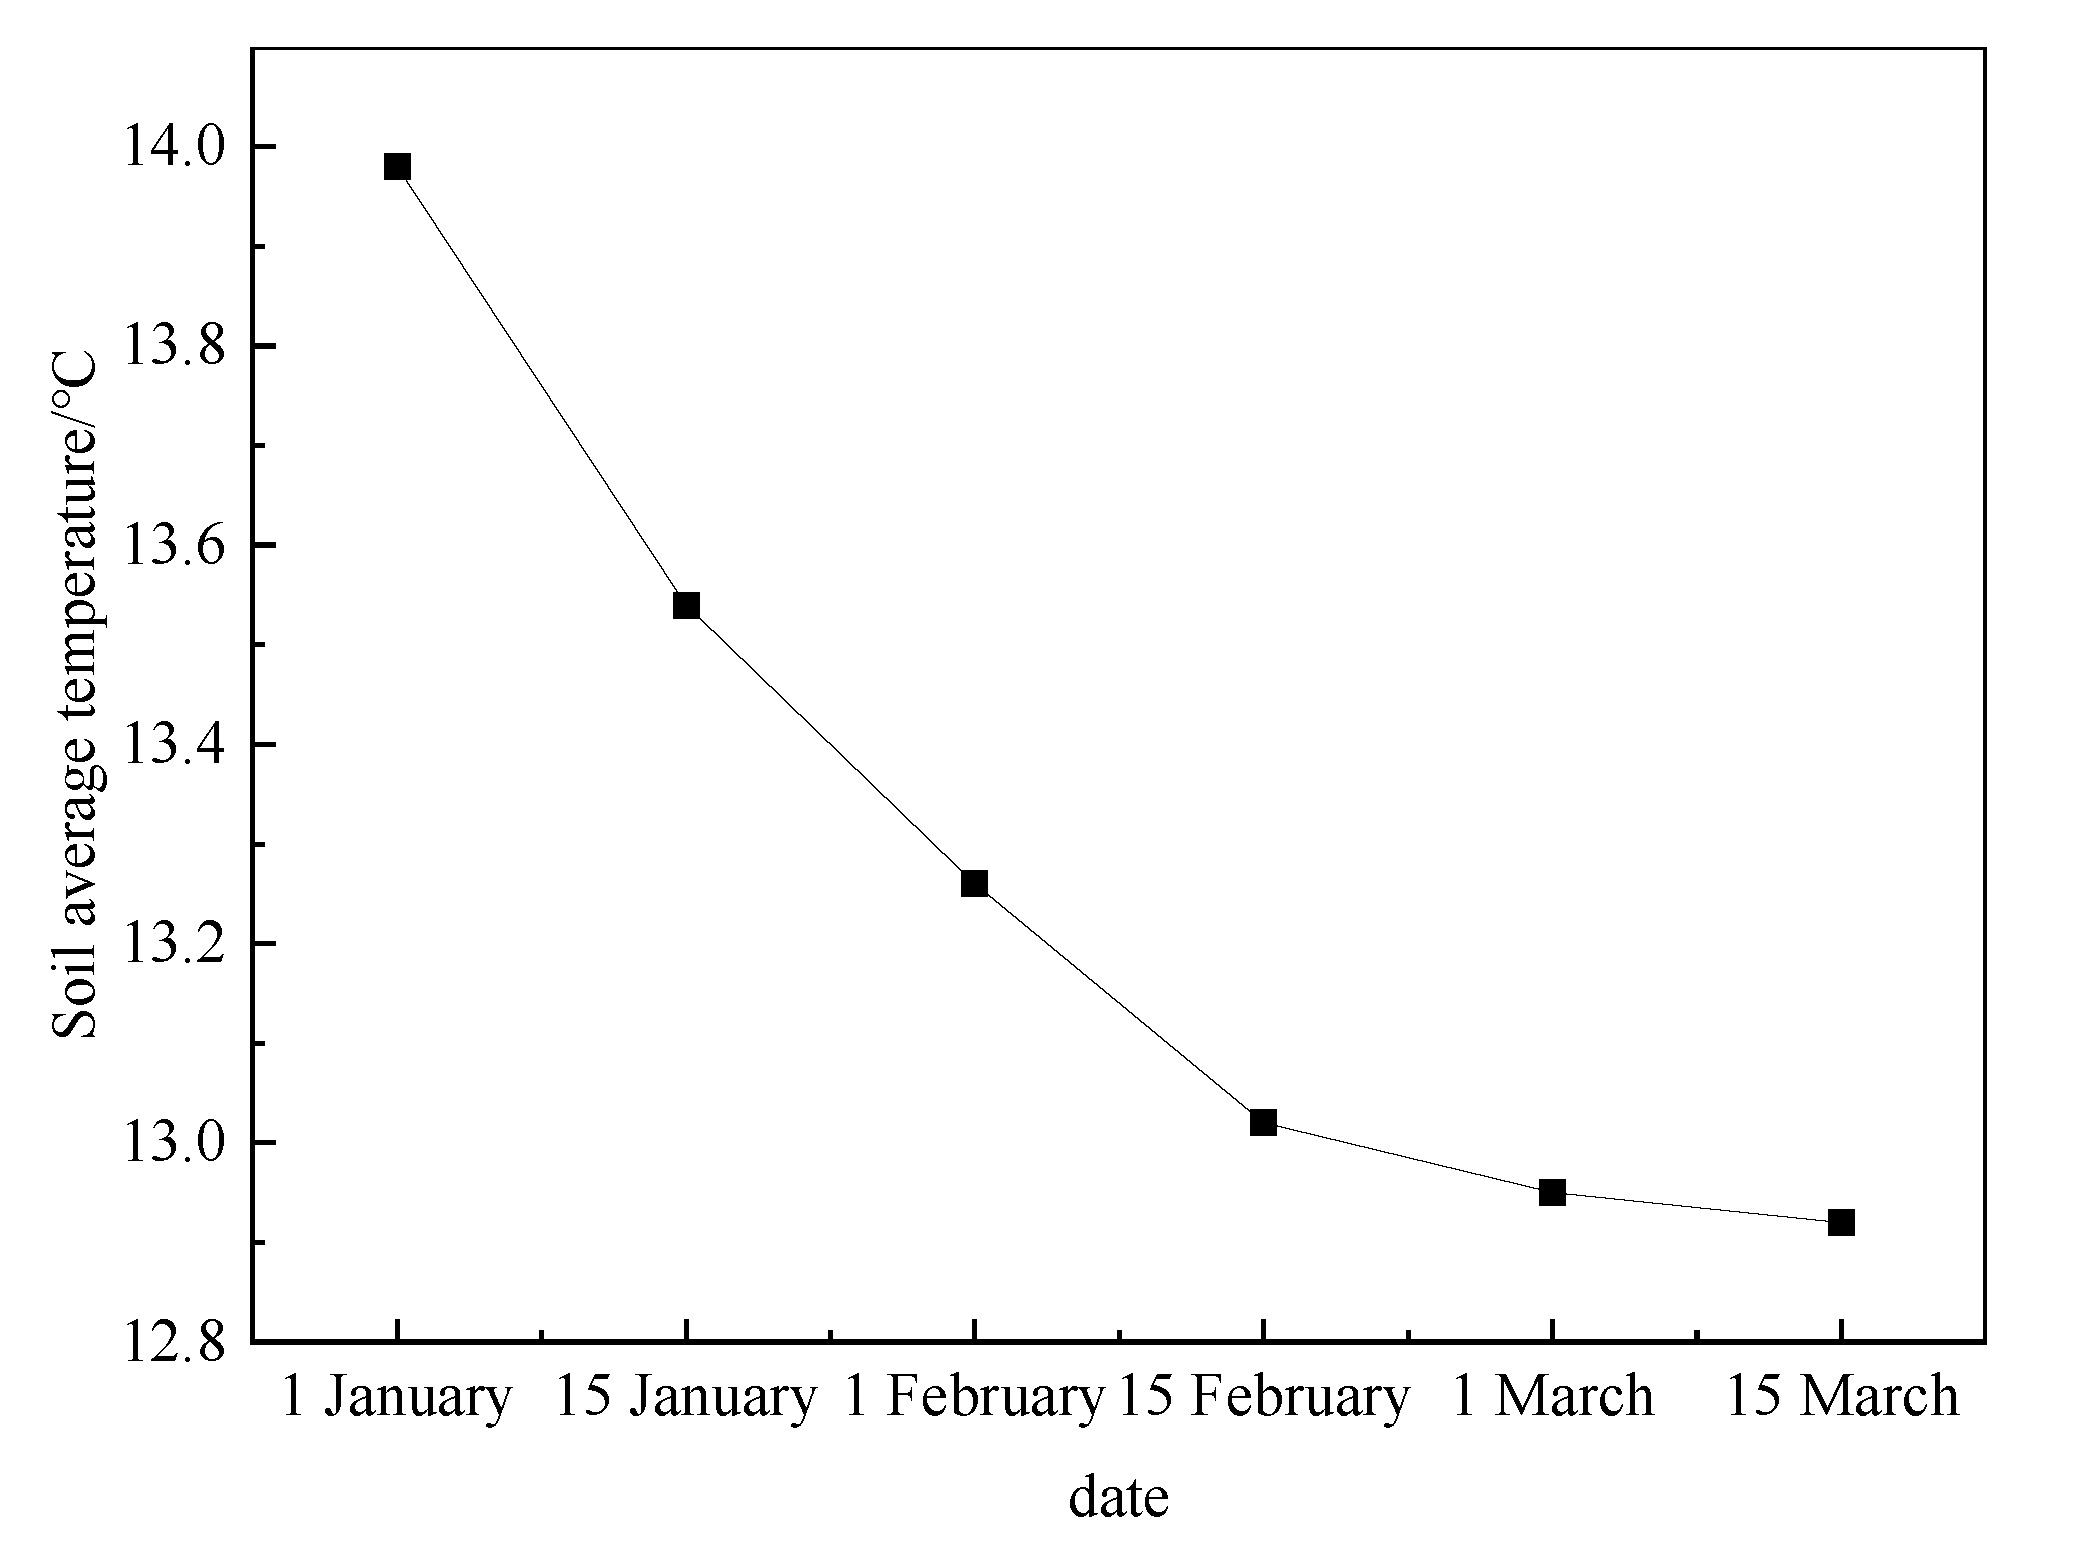
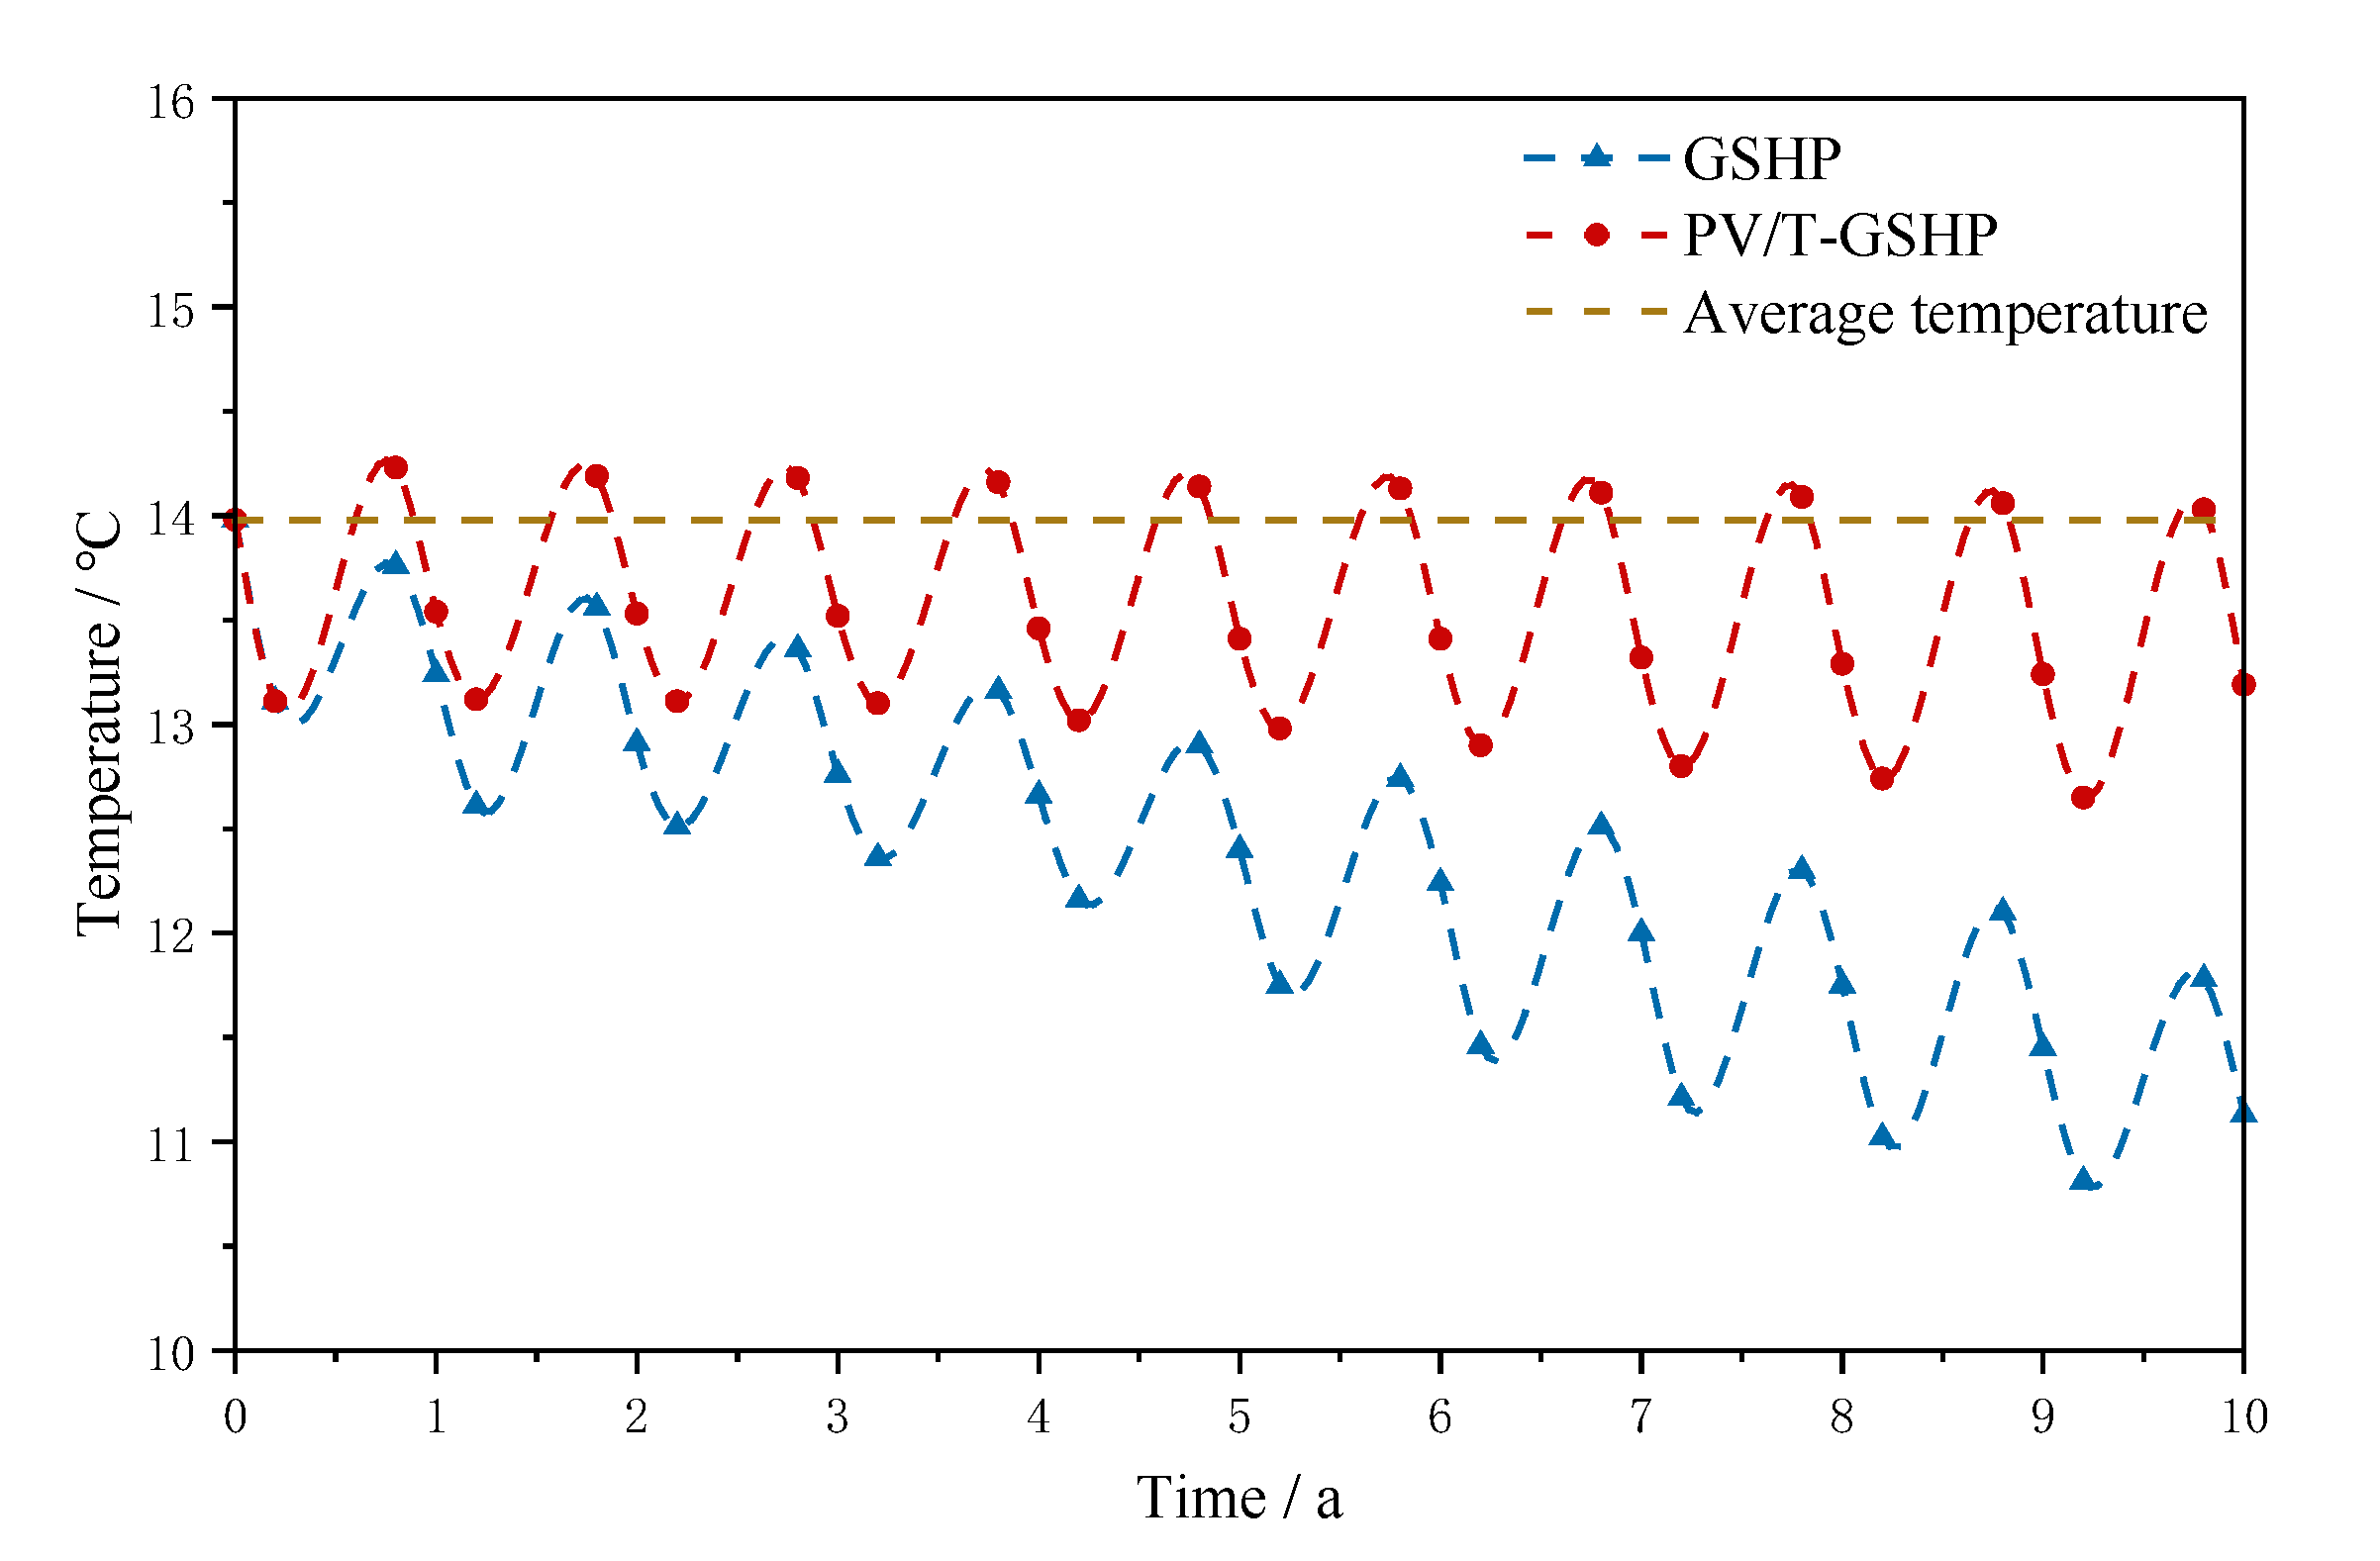
The soil average temperature is the most important parameter to verify the simulation results during the operation of the PV/T-GSHP system in winter, and it becomes lower and lower as the system operates. Figure 7 shows the variation of soil average temperature with time for the corresponding time point of the GSHP heating system; as can be seen, the soil average temperature gradually decreases with system operation during the heating period. Figure 8 shows the variation of soil average temperature with 10a for GSHP and PV/T-GSHP system operation. We can see that the GSHP heating system corresponds to the soil average temperature of the GSHP heating system, showing a wavy decreasing trend year by year, and the soil average temperature in the 10th heating period decreased by 3.17 °C compared with the initial soil average temperature, and the decrease was obvious. This is because the system has no supplementary heat measures. The soil average temperature of the PV/T-GSHP heating system decreased by 1.33 °C in the 10th heating period compared with the initial soil average temperature, which was higher than the GSHP heating system by 1.84 °C. The temperature of the GSHP heating system was still lower than the initial soil average temperature after natural recovery. After natural recovery, the temperature of the GSHP heating system was still lower than the initial soil average temperature of 2.2 °C, while in the PV/T-GSHP heating system after inter-seasonal solar thermal storage, the soil average temperature was raised to slightly higher than the initial soil average temperature. This indicates that the soil thermal imbalance of GSHP for building heating was effectively solved.

3.3. Automatic Control Benefits

3.3.1. Water Supply Temperature

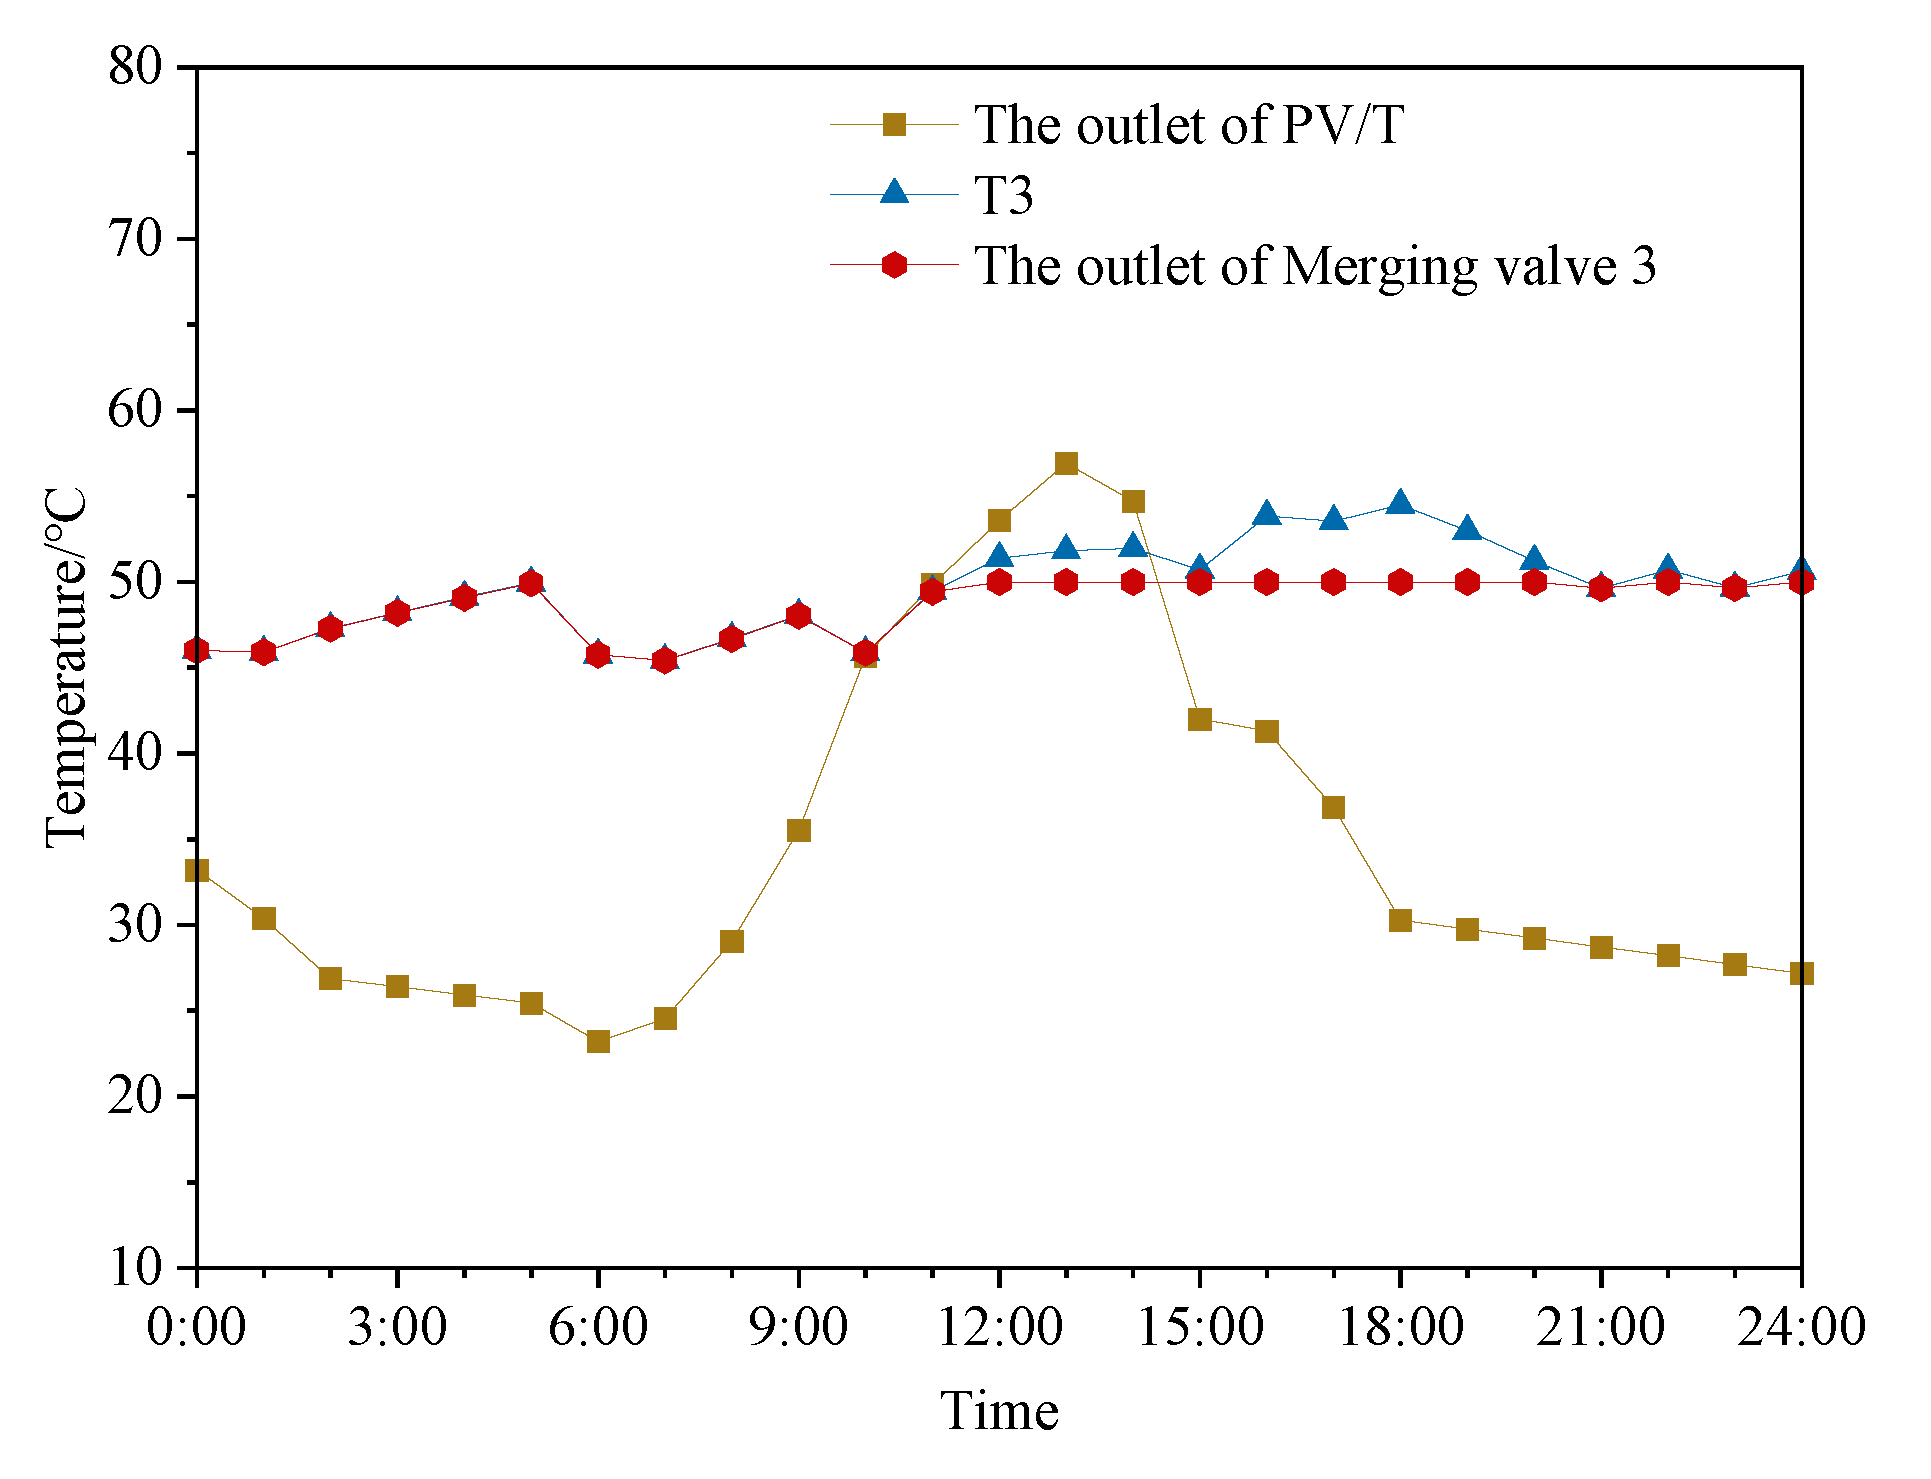
A typical year component outlet temperature of the heating period was selected to analyze the continuous heating performance of the PV/T-GSHP control system. The variation of the PV/T-GSHP control system component outlet water temperature is shown in Figure 9, from which it can be obtained that the outlet water temperature of the merging valve 3 is 45.43~50 °C, relatively stable relative to the PV/T collector and tank load side, indicating that the typical day heating water temperature control is good.
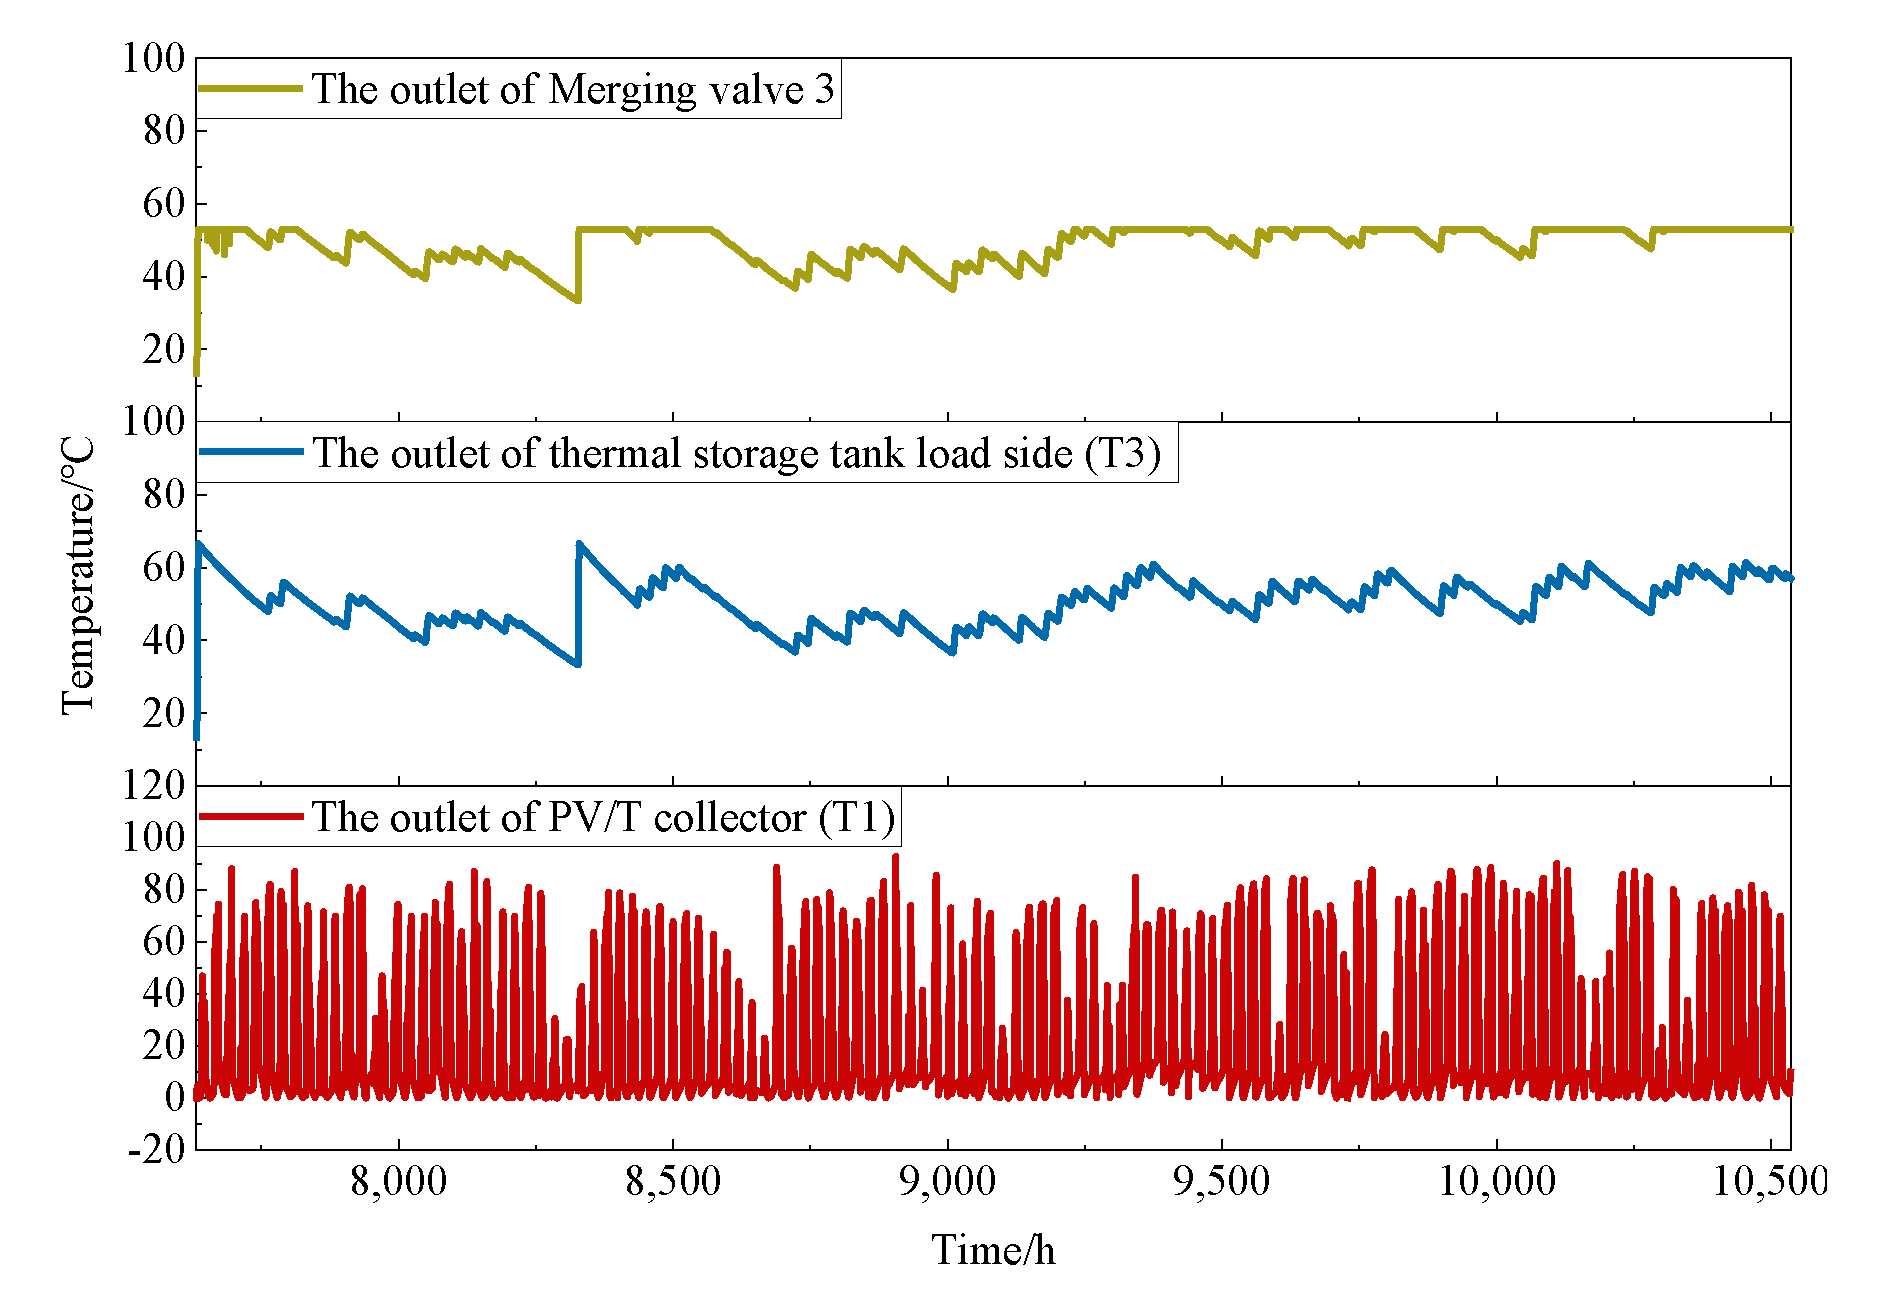
To verify the long-term operational effectiveness of the PV/T-GSHP system, the continuous heating performance of the PV/T-GSHP system was analyzed by selecting the outlet water temperature of each component in a typical year of the heating period, as shown in Figure 10. From the figure, it can be obtained that the outlet water temperature of the mixer is more stable relative to the PV/T collector and tank load side, and the outlet water temperature of the merging valve 3 ranged from 45.43 to 50 °C, indicating that the heating water temperature control is good in a typical year. During the long-term operation of the system, the PV/T collector heat is higher when the solar radiation is strong, resulting in high collector outlet water temperature, which affects the storage tank’s temperature. From the data, we can obtain that the water supply temperature on the load side of the water tank even exceeds 80 °C at some times, which seriously affects the indoor thermal comfort of the building. After the building’s high-temperature return water control, the maximum value of the heating water supply temperature is 50 °C and the minimum value is 45.43 °C, and the building heating temperature is close to the design temperature.

3.3.2. Heat Supply

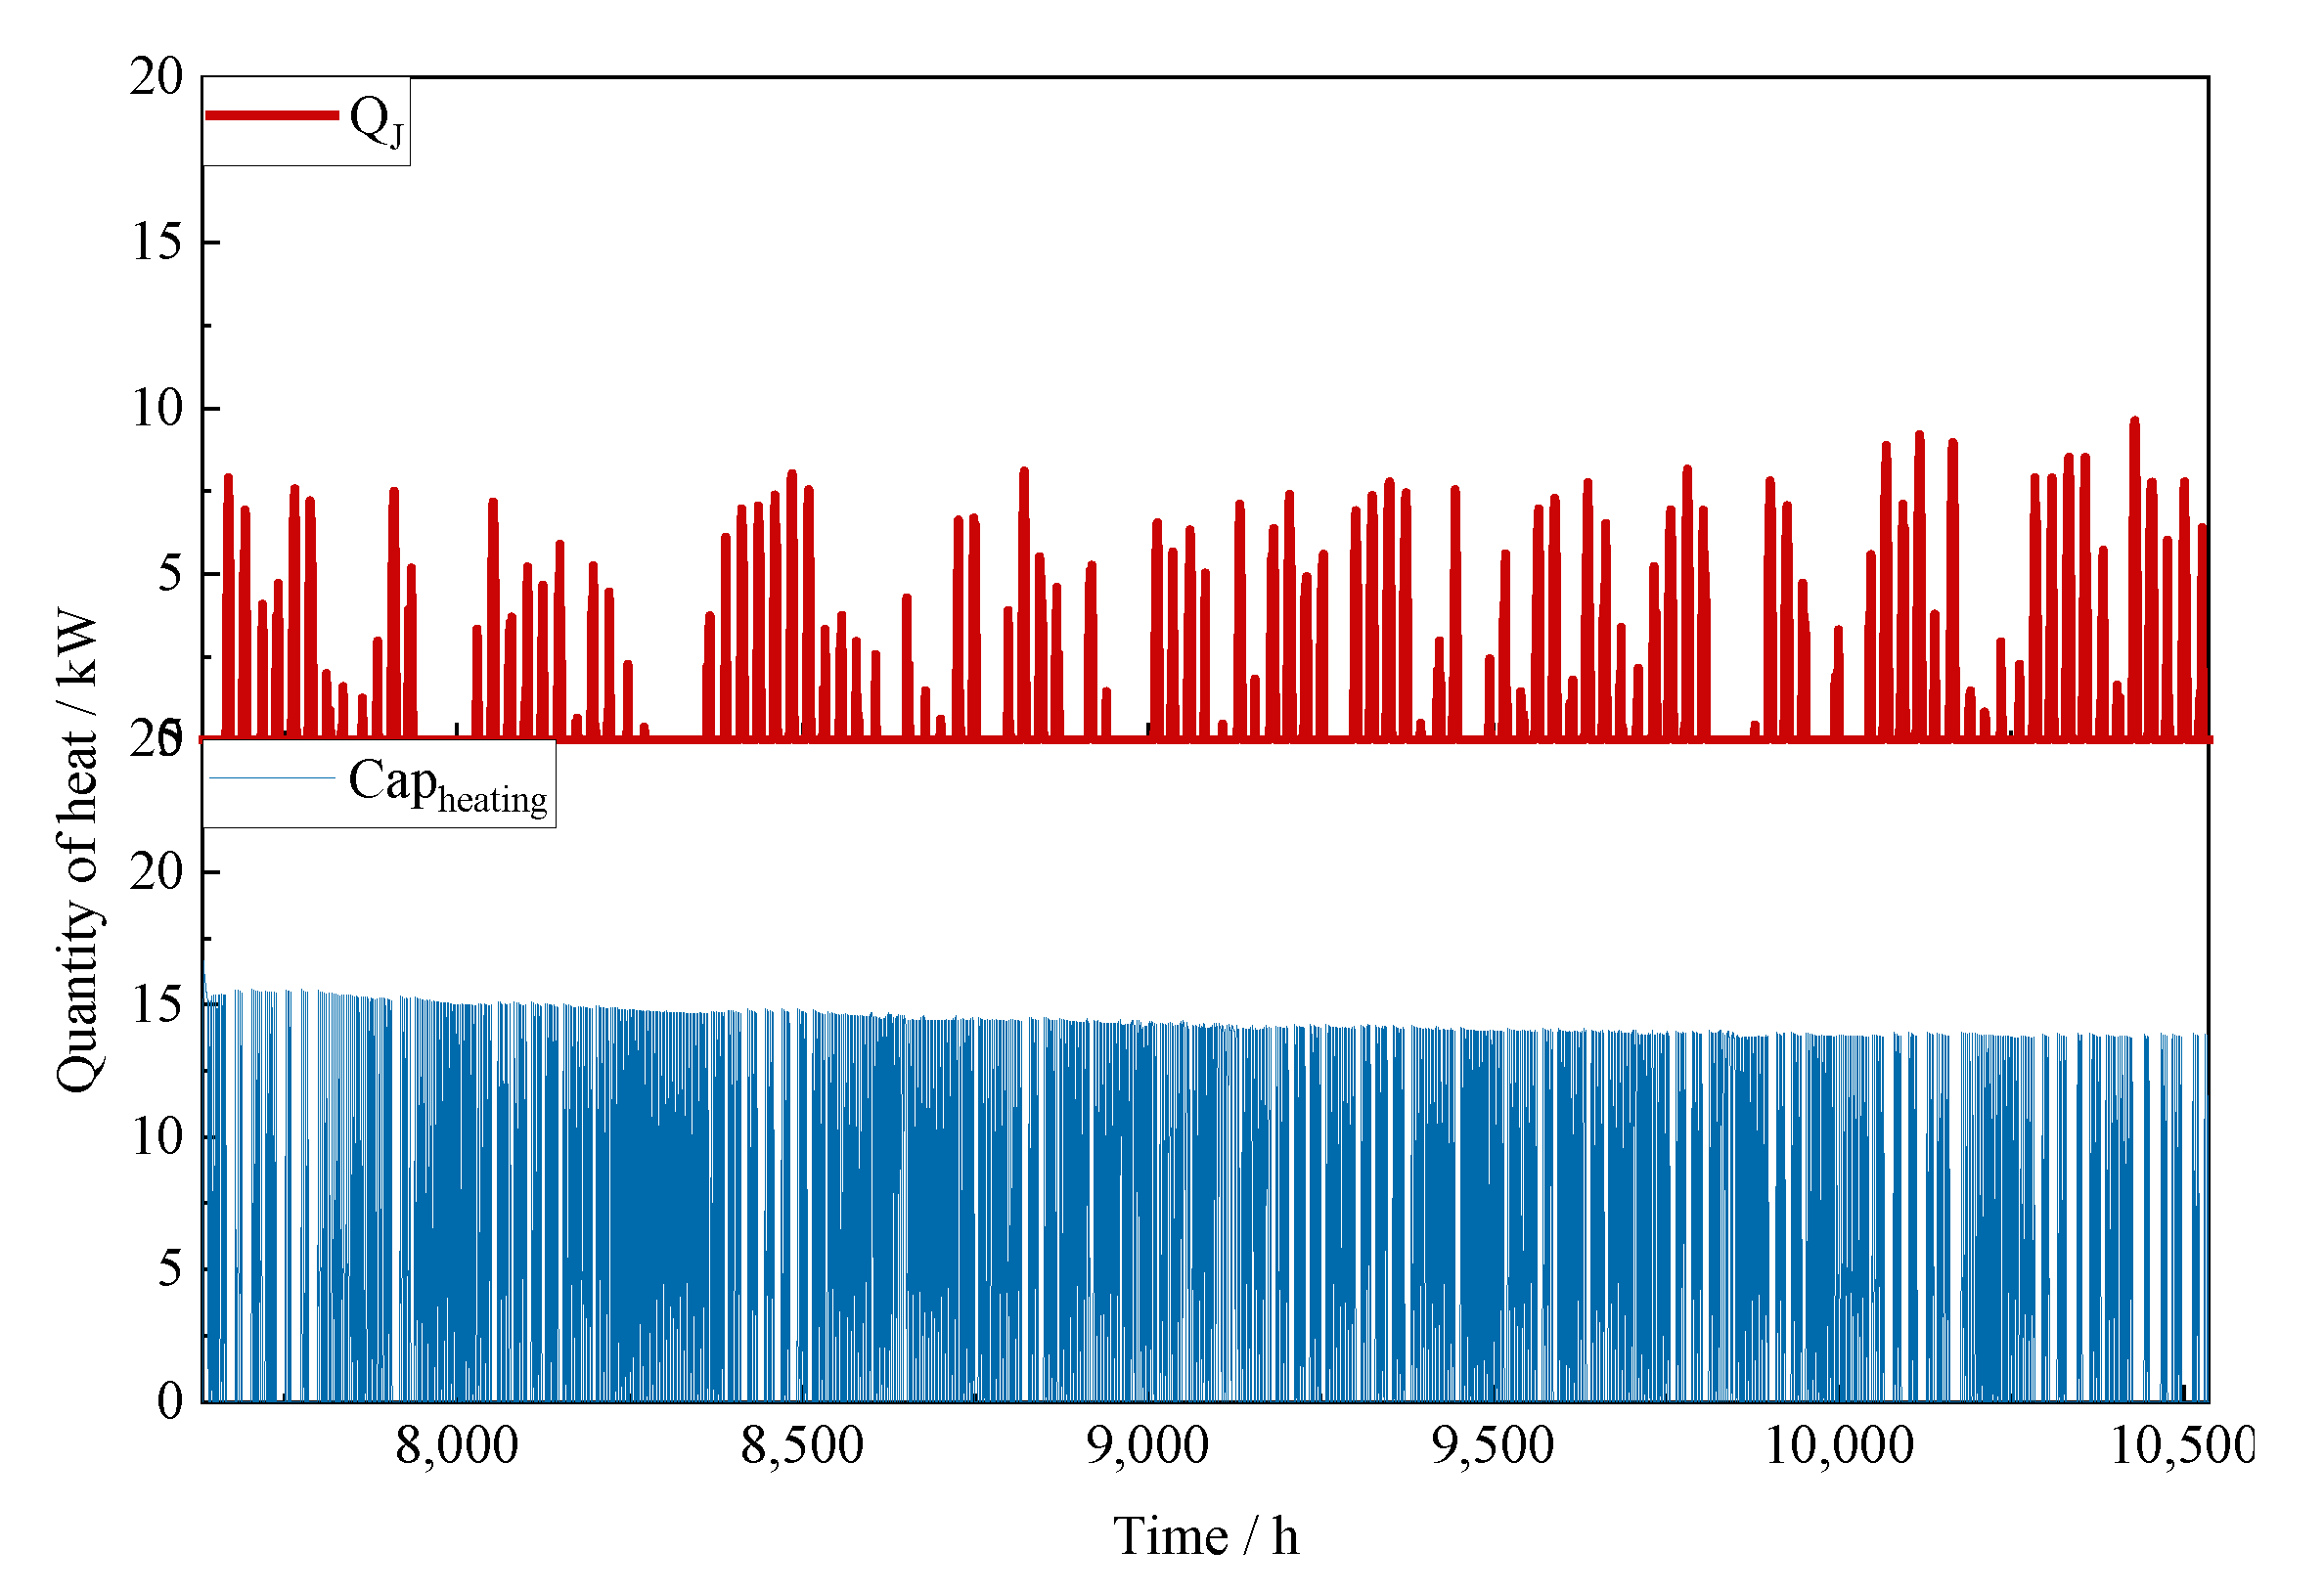
The hour-by-hour quantity heat supply from PV/T collectors and GSHP in a typical year is shown in Figure 11. It can be seen that in most cases, the collector’s heat collection does not reach the demand of building heat load, which explains the reasonableness of the system coupling GSHP. According to the statistical results, the total heat supply of PV/T modules in a typical year is 2152.54 kW, accounting for 11.54% of the total building heat supply in a typical year, and the remaining 88.46% of the heat is provided by the GSHP.
The heating control effect of the PV/T-GSHP system is expressed by comparing the heat supply of the storage tank and building heat load hour by hour in a typical year of the heating period, and the results are shown in Figure 12. The difference between the two is in the range of 0.01~0.17 kW, and the heat supply basically meets the building heat load demand and the building thermal comfort is good. It indicates that the system control effect is good and verifies the feasibility and reasonableness of this control system.

3.3.3. Impact of ε on COPsy

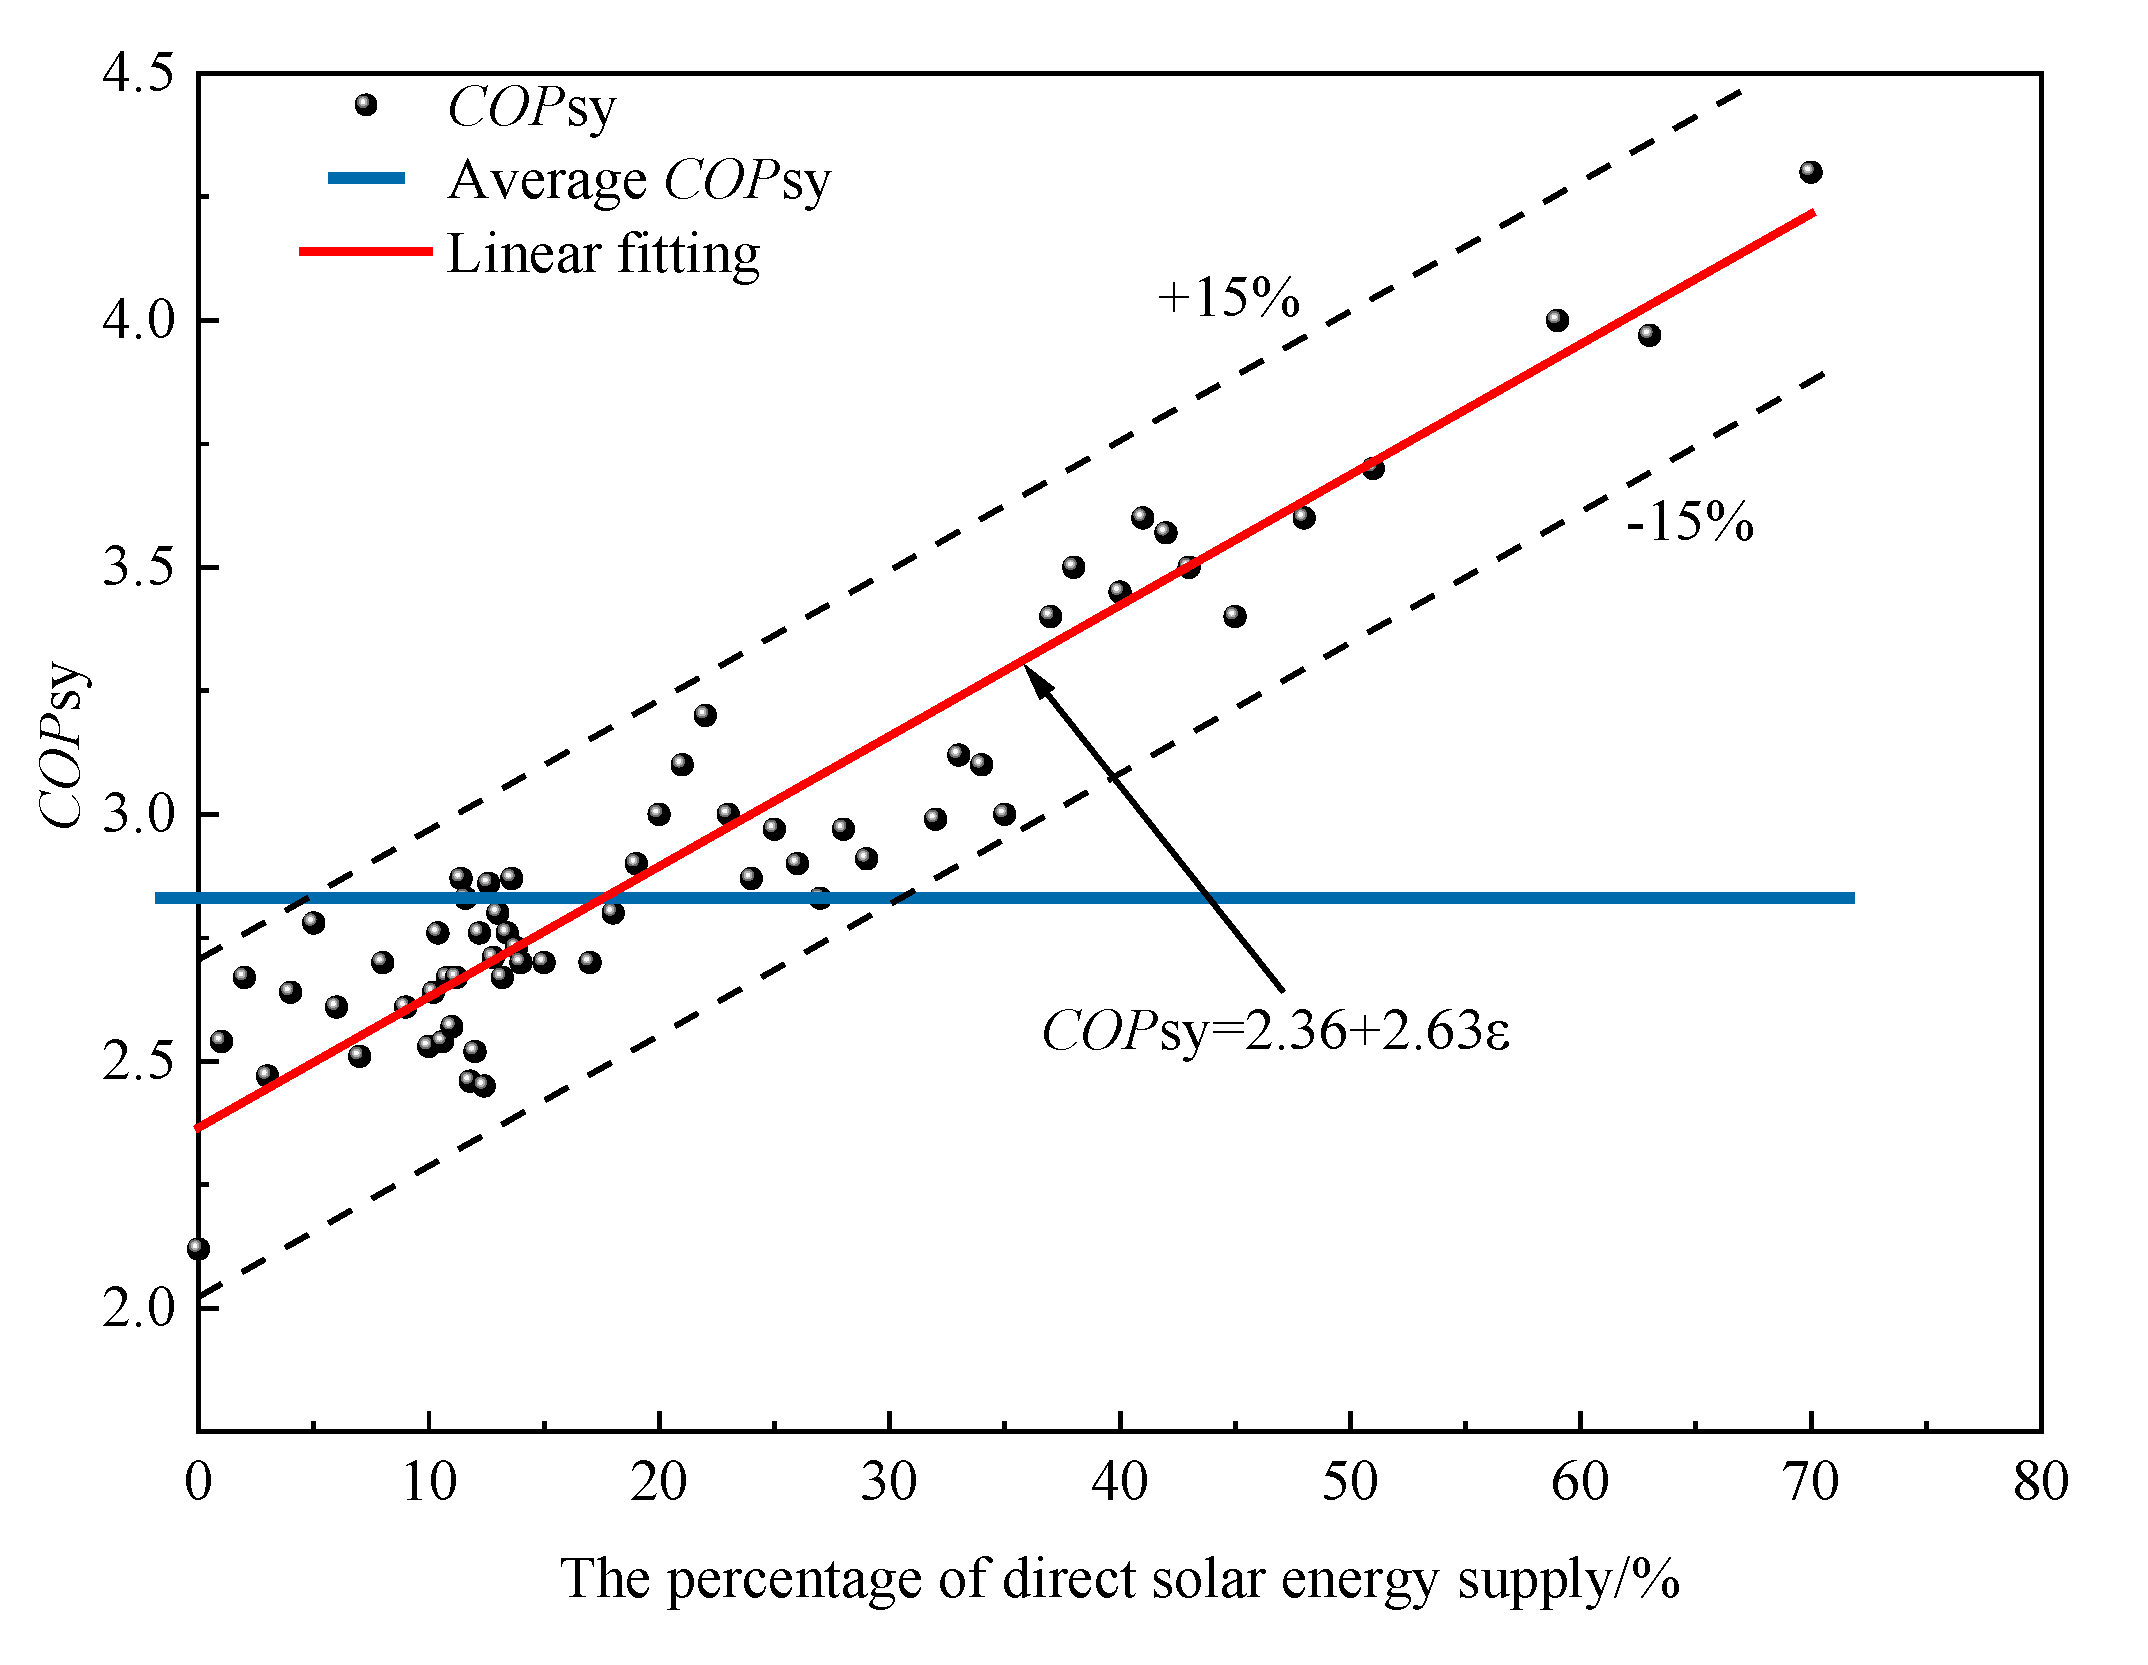
In this paper, we take the effect of the impact of ε on COPsy on a typical day for the PV/T-GSHP heating system operation in a typical year, as shown in Figure 13. It can be seen that the COPsy increases with the increase in ε. When ε is 0, that is, the system adopts GSHP for heating, the COPsy is about 2.36; when ε is 58%, the COPsy improves to 4.16. Throughout the heating period, ε is concentrated at about 12%, corresponding to a COPsy of about 2.76, which is about 14.5% higher than that of the pure GSHP heating system. It indicates that adding solar energy can significantly improve the comprehensive energy efficiency of the system, and the relationship equation of ε on COPsy is COPsy = 2.36 + 2.63ε. All points are within ±15% error from the liner fitting.

3.4. Benefits Analysis of PV/T-GSHP System

3.4.1. Energy-Saving Benefits

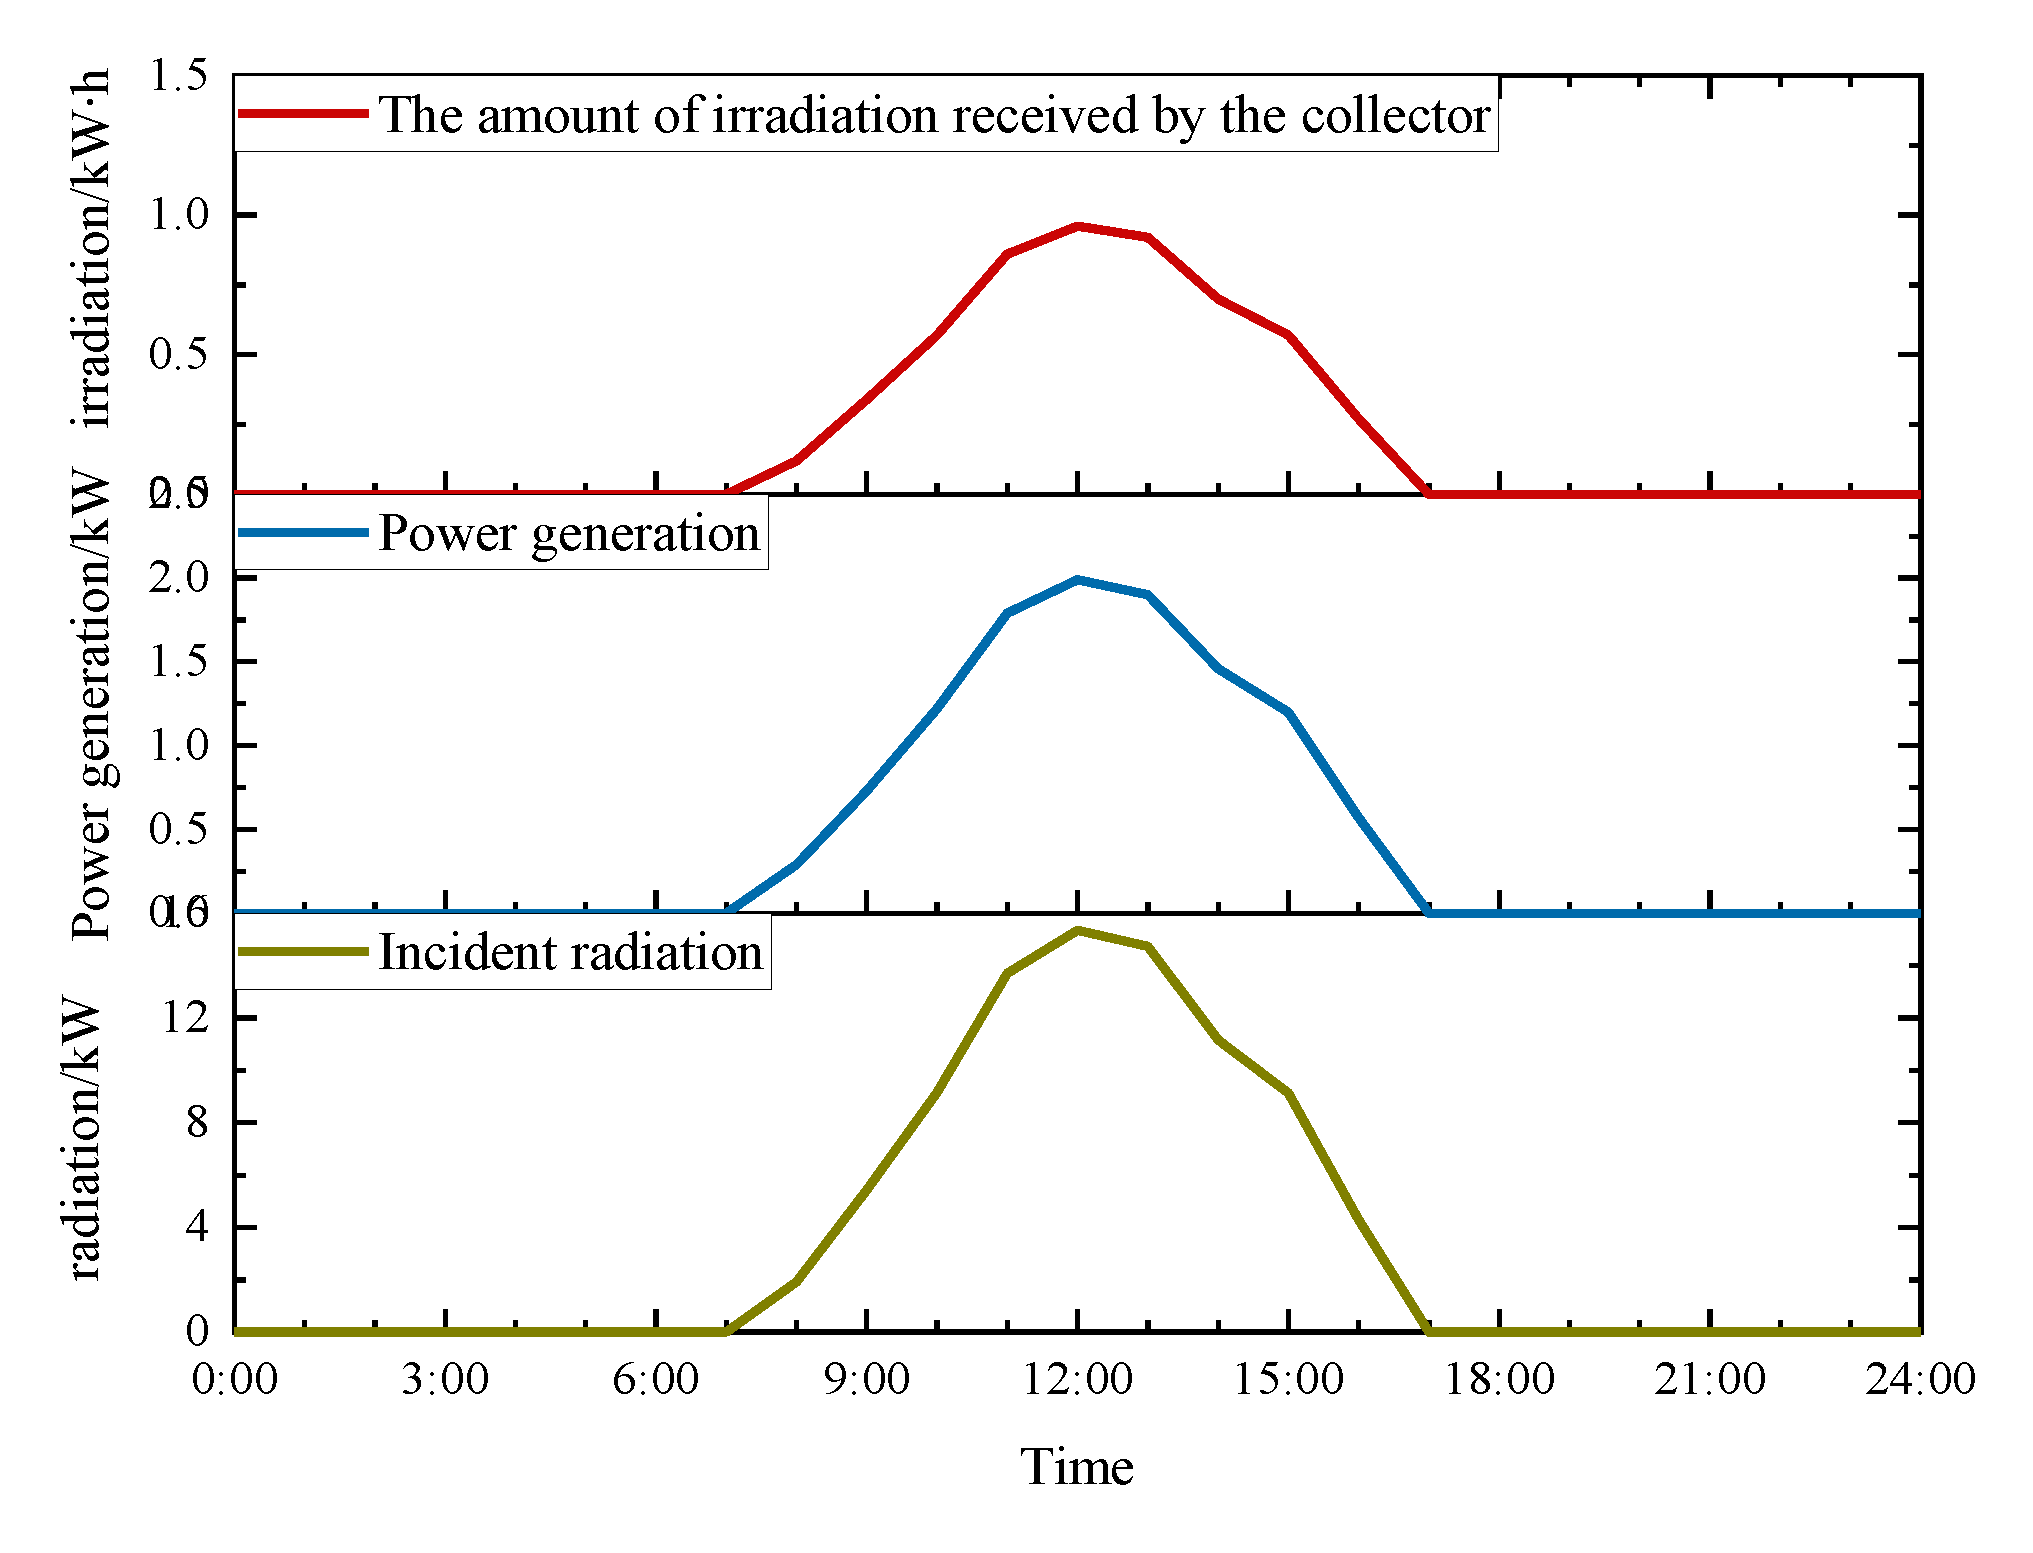
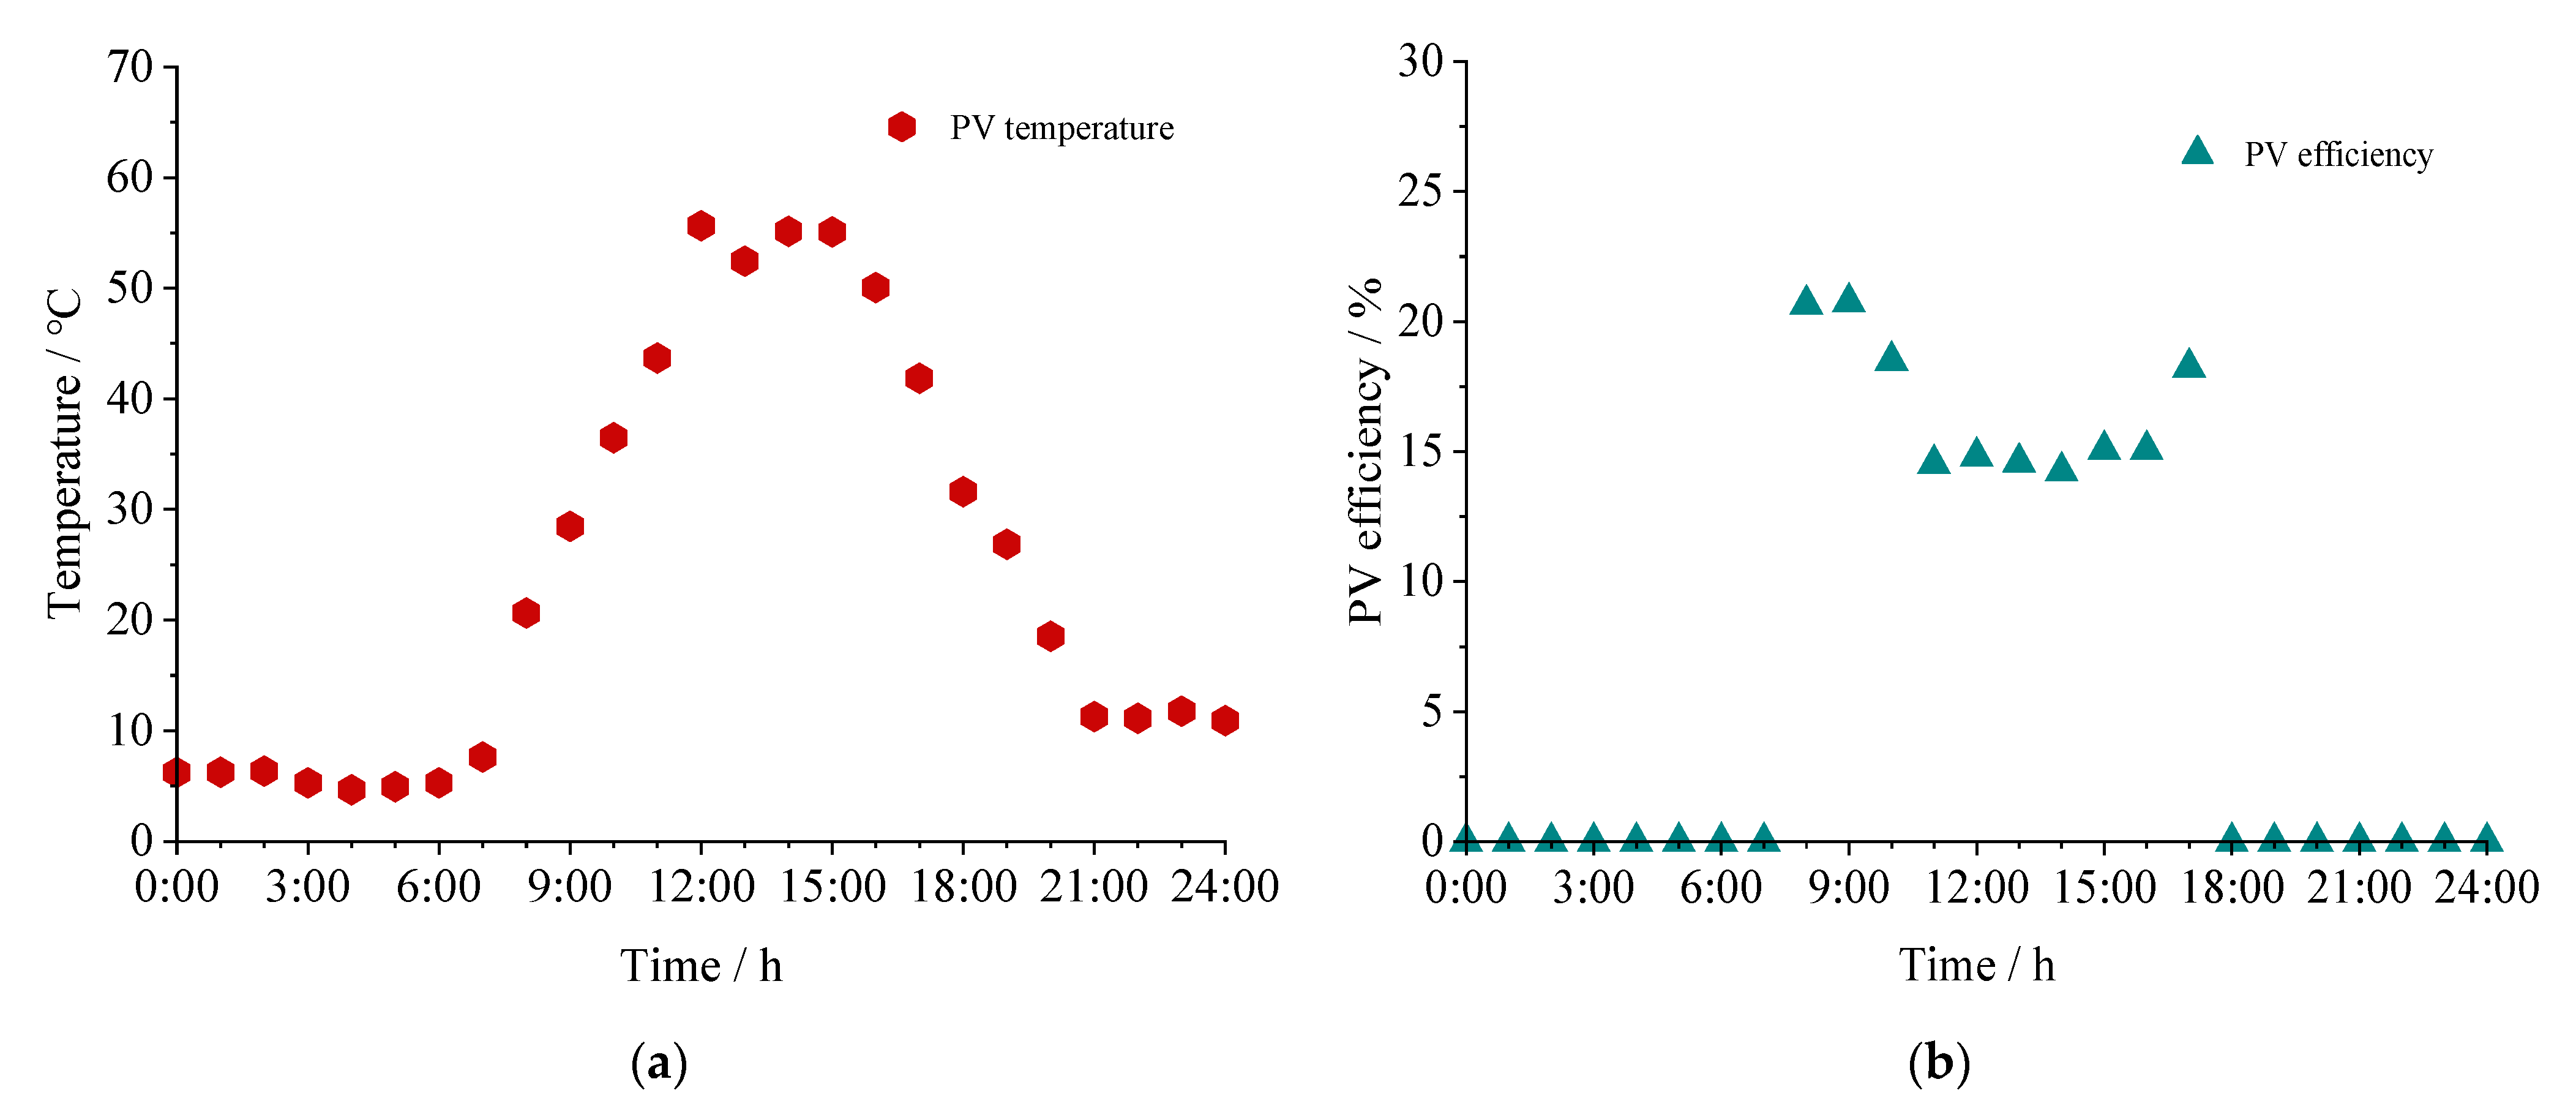
The energy efficiency of the PV/T-GSHP system is mainly in the PV power generation bearing part of the consumption, so PV power generation is the main factor of energy efficiency. In this paper, typical day data are selected for the PV power generation performance analysis. Figure 14 shows the incident solar radiation, power generation, and irradiation received by the collector on a typical day, all showing an increasing and then decreasing trend, which is related to solar radiation. Figure 15 shows the PV panel surface temperature and PV efficiency, which are inversely proportional to the strong incident radiation. It can be seen that the highest PV panel temperature is 56.16 °C, and the PV efficiency is well controlled throughout the day on a typical day, ranging from 14.24% to 20.74%.
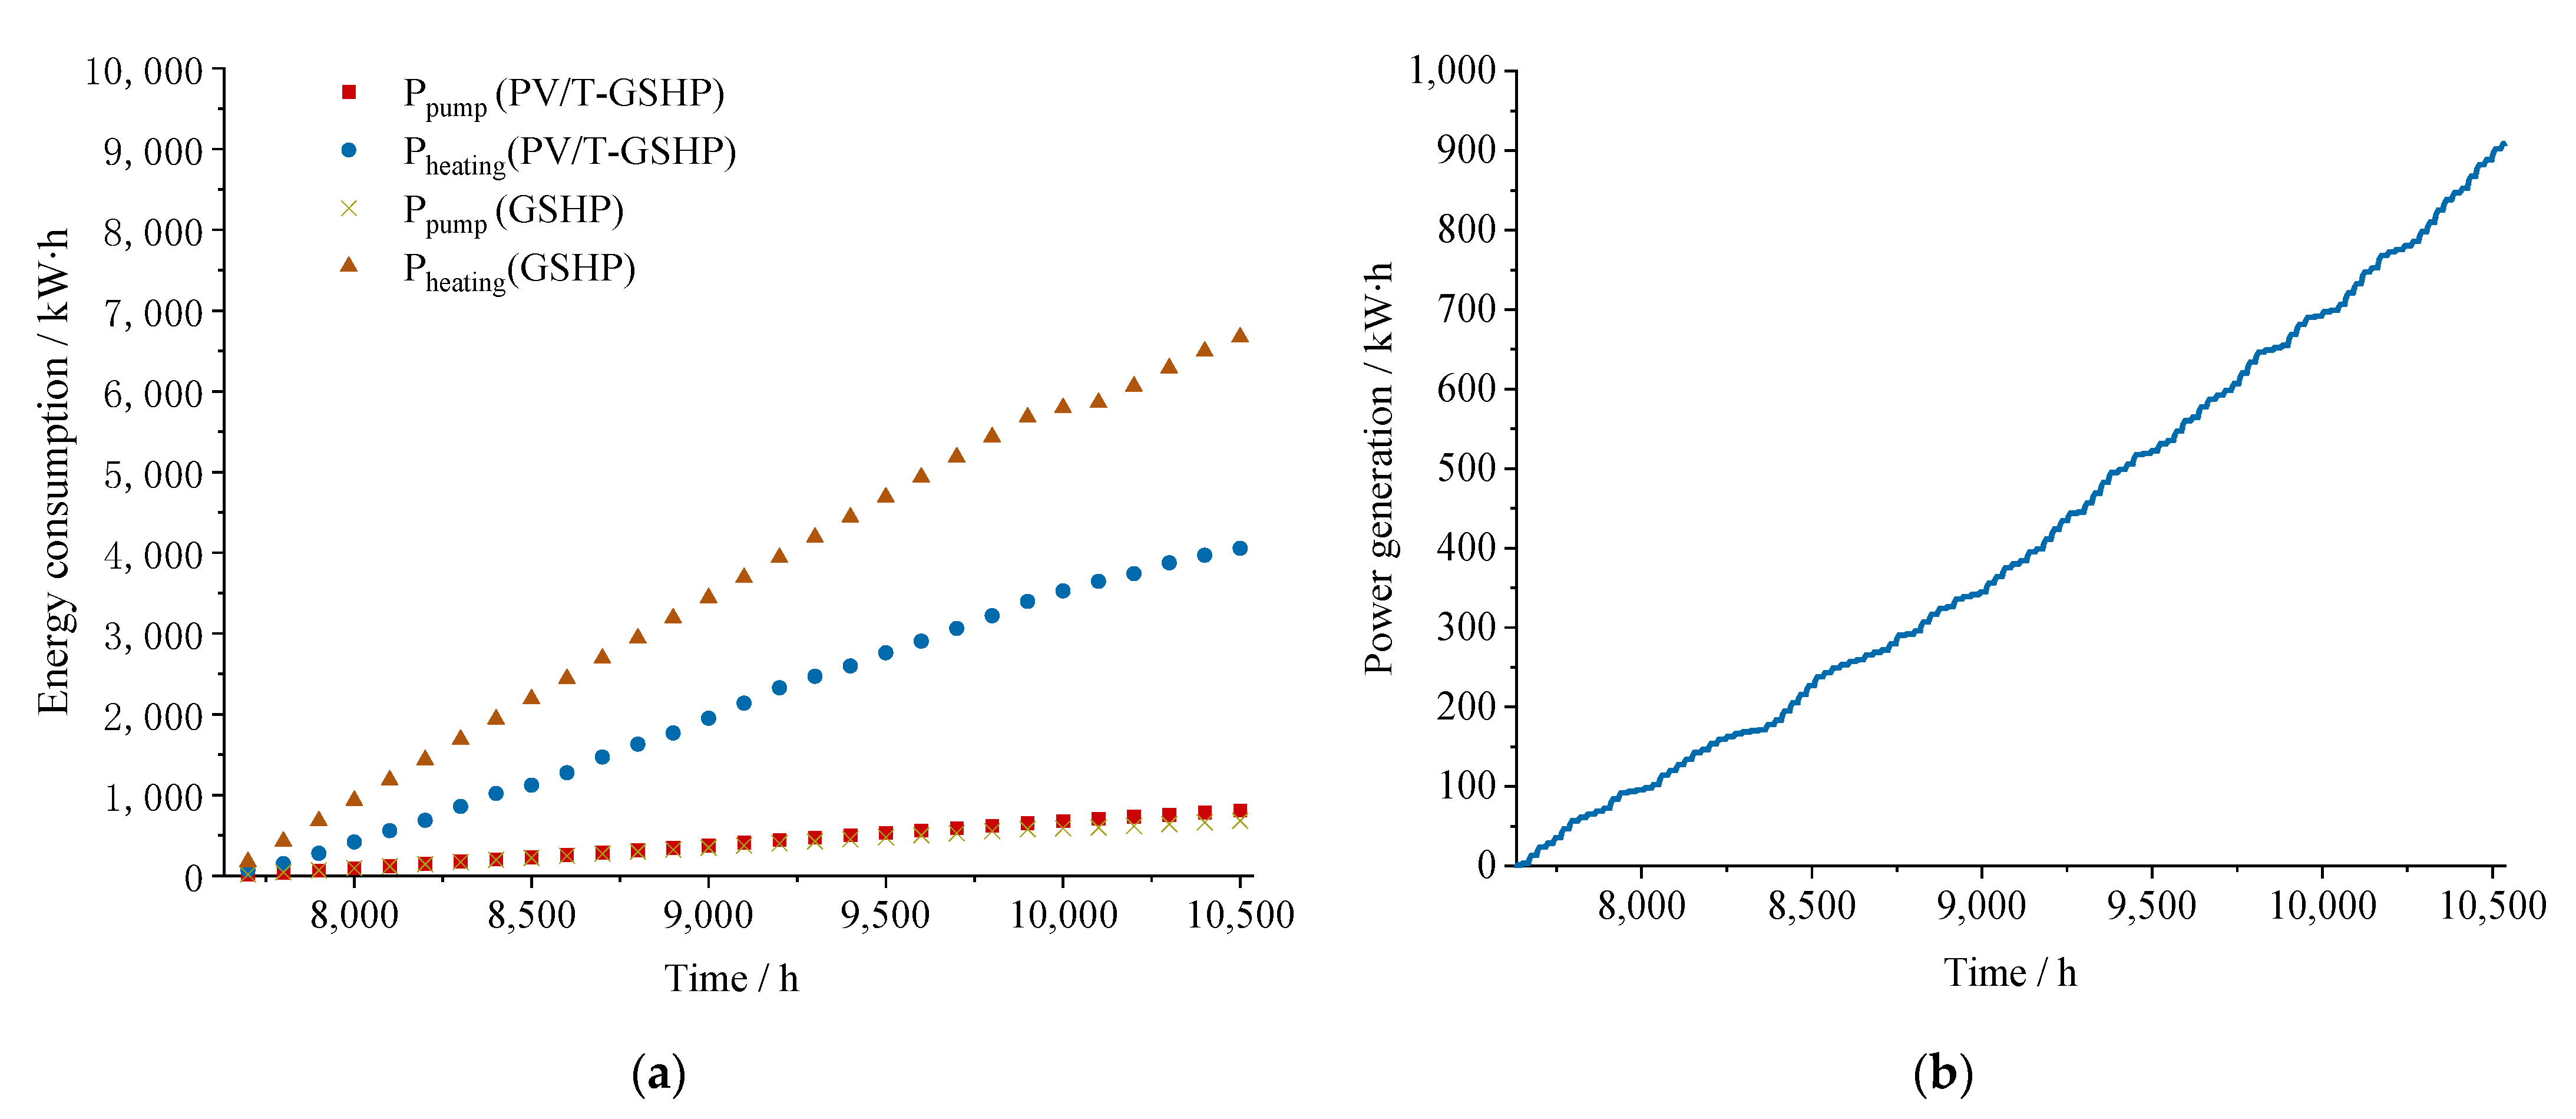
If the PV/T system is turned off and the system is adjusted to a GSHP heating system, the energy consumption data obtained for a typical year of operation during the heating period are as shown in Figure 16a. Ppump of the GSHP system is slightly lower than that of the PV/T-GSHP control system, while the Pheating is 6720.58 kW∙h, which is much higher than that of the PV/T-GSHP control system of 4077.57 kW∙h. This is because the former unit produces heat to cover all the building heat load, while the latter solar collector makes up for part of the heat load demand and photovoltaic power generation covers part of the energy consumption, resulting in better energy efficiency of the system. Figure 16b shows the typical annual PV power generation during the heating period, with an annual total of 908.02 kW∙h. The calculated energy consumption of the PV/T-GSHP system is 33.91% less than that of the GSHP system.

3.4.2. Economic Benefits

The annual value of costs is an efficient method to evaluate the economic performance of the system, and this paper uses the annual value of costs to analyze the economics of the heating period in comparison between the PV/T-GSHP system and the conventional coal-fired boiler heating system.
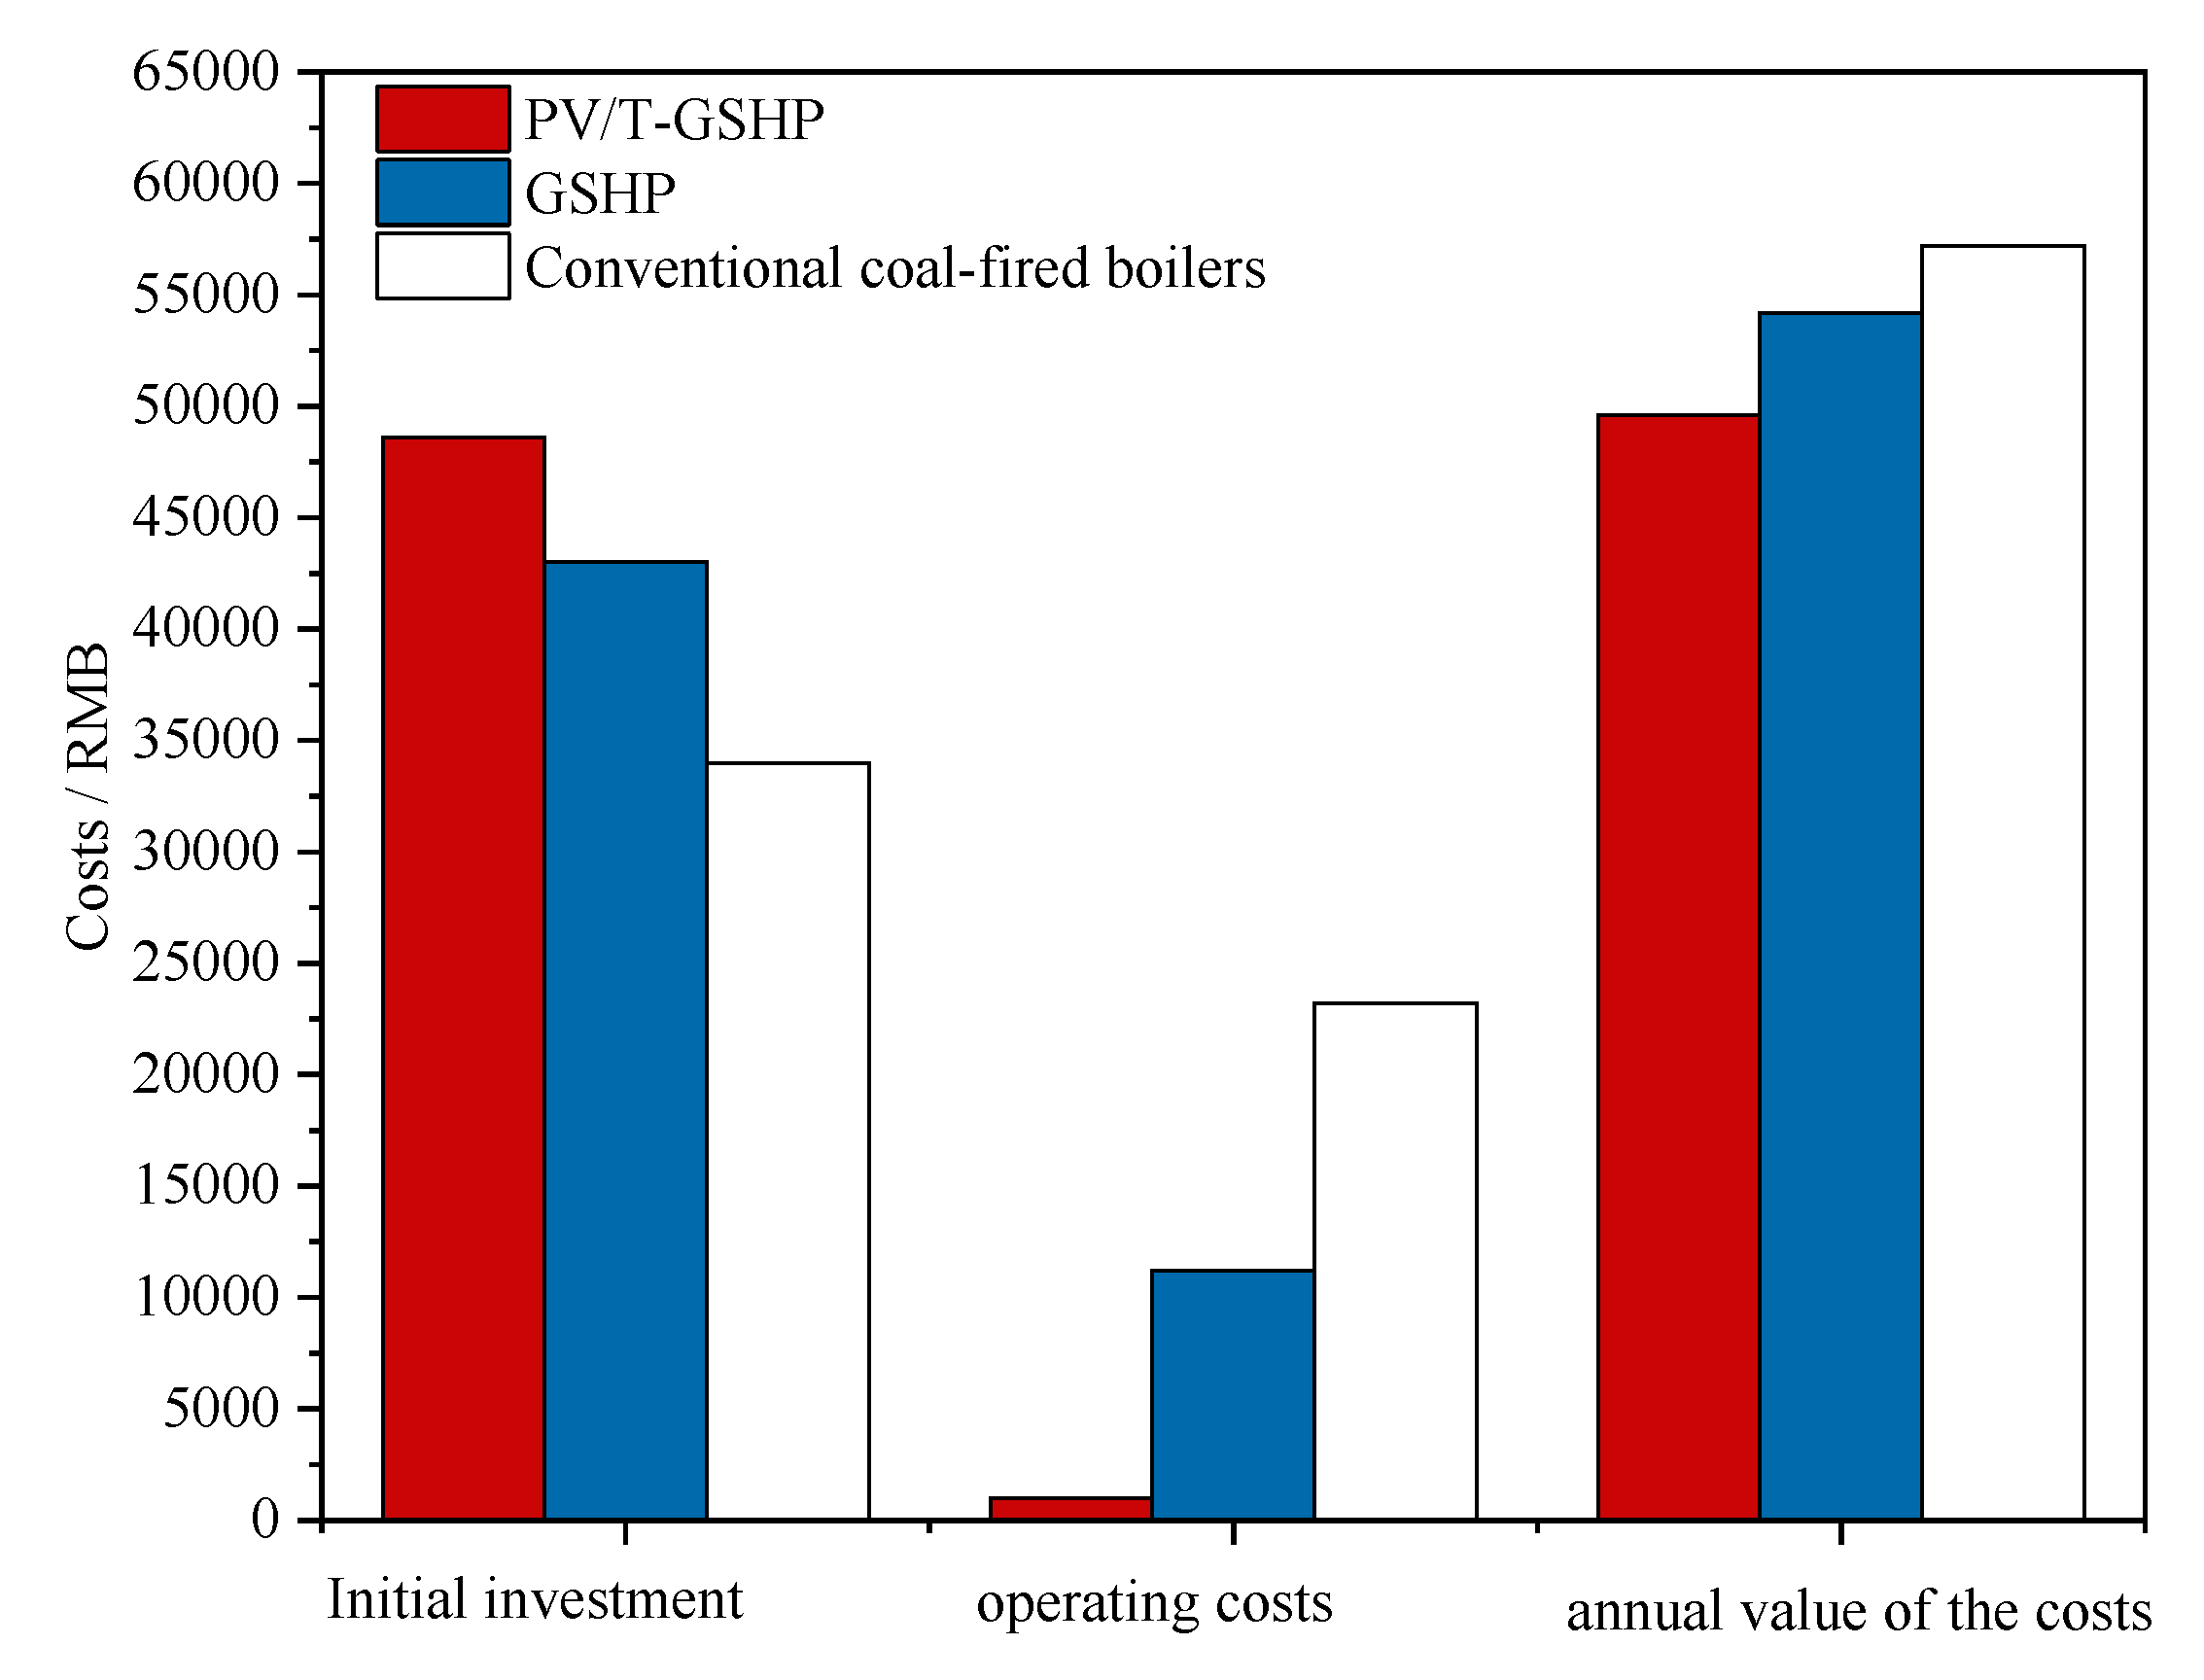
Compared with conventional coal-fired boilers, the PV/T-GSHP system has better heating economics. According to the survey from market, the market costs of main components in PV/T-GSHP system are 600 CNY/m2 for a PV panel, 400 CNY/m2 for a flat plate type collector, 500 CNY/m3 for a water tank, and CNY 1600 for a U-tube pipe. The other equipment, such as the pump, is calculated to CNY 10,000, and the service age of equipment is 20a. The initial investment of a coal-fired boiler is 200 CNY/m2, and the operation cost is 37.5 CNY/m2. The operating cost is 37.5 CNY/m2, and each unit of electricity is calculated according to CNY 0.5. We calculated the initial investment, operating cost, and annual value of the costs of the system, as shown in Figure 17. It can be seen that although the initial investment of the PV/T-GSHP control system is the highest, due to the automatic control of the system saving most of the operating costs, only the remaining required energy consumption of the system in addition to power generation brings a cost. From the final data, it can be obtained that the annual value of the costs of a PV/T-GSHP system is reduced by 8.49% and 13.29% compared to the GSHP and conventional coal-fired boiler system. This proves that the PV/T-GSHP system is more economical.

4. Conclusions

In this paper, we proposed the PV/T-GSHP system and established the simulation model of the PV/T-GSHP control system by using TRNSYS software. Through the automatic control, we can simulate the operation in a typical year. The system can realize the benefits of a stable heating water supply temperature in winter and good energy saving and economy. The study takes a rural two-story independent house in Beijing as the heating object, and simulates the hourly temperature of water, power generation, quantity of heat supply, energy consumption, and energy efficiency of each component of the system for the whole heating period in a typical year and draws the following conclusions.
(1)
The PV/T-GSHP system has good stability, the typical annual water supply temperature is maintained at 45.43~50 °C, which is close to the building heating design temperature, the fluctuation range of hour-by-hour building heat supply and building heat load during the operation period is 0.01~0.17 kW, the heat supply basically meets the building heat load demand at each time, and the automatic control effect of the system is good.
(2)
In a typical year of the whole heating period, the data shows that the PV/T collector heat accounts for 11.54% of the total building heat supply, and the remaining 88.46% is all borne by the ground source heat pump unit. The energy efficiency of the PV/T-GSHP system is 14.5% higher than that of the GSHP system for heating operation, and the linear relationship of the effect of the ε on the COPsy is COPsy = 2.36 + 2.63ε.
(3)
The PV/T-GSHP system has good control of PV power generation performance, and the PV efficiency ranges from 14.24% to 20.74%. The total annual energy consumption of the system is reduced by 33.91% compared to the GSHP system operation heating due to equipment start/stop control and power generation, and the annual value of costs is reduced by 8.49% and 13.29% compared to the GSHP and traditional coal-fired boiler system, which provides some theoretical significance and reference for the larger energy consumption problem of heating in northern rural areas.
(4)
For the simulation class, the article needs to be verified by actual engineering at a later stage. Additionally, in future research, actual measurements of room temperature and comfort need to be conducted for better application in future projects.

Author Contributions

Conceptualization, J.Z. and J.C.; methodology, J.Z.; software, J.C.; validation, J.Z., J.C. and P.L.; formal analysis, J.C.; investigation, J.C.; resources, J.C.; data curation, J.C.; writing—original draft preparation, J.C.; writing—review and editing, J.C. and J.Z.; visualization, J.Z.; supervision, J.Z.; project administration, J.Z.; funding acquisition, J.Z. All authors have read and agreed to the published version of the manuscript.

Funding

This research was funded by Xiaoyan Zhang, grant number 51974225.

Data Availability Statement

Data is contained within the article.

Acknowledgments

Thanks to everyone in the division and all the professional teachers for providing technical as well as data references.

Conflicts of Interest

The authors declare no conflict of interest.

Nomenclature

T1–T4temperature value of the temperature sensor
Tsdesign value of heating water supply temperature
Mbuilding return water flow
Mibuilding return water into the mixing valve flow
Mjbuilding return water back to the tank flow
ηPVPV efficiency
ηstcPV efficiency of PV module under standard test conditions
TPVPV panel temperature
βtemperature coefficient of PV efficiency
Ppowerelectric power output at effective area
(ατ)neffective projected absorption product of direct radiation under normal incidence
IAMincidence angle correction factor
GTtotal solar radiation
APV/TPV/T collector area
DJuseful collector heat
mdotmass flow rate through the collector
cpfluid specific heat capacity
Tincollector inlet fluid temperature
Q.abssoil heat extraction
Capheatingactual heat production of GSHP
P.heatingactual power of the compressor of the heat pump
Tload,out, Tload,inoutlet/inlet of water temperature of the load side of the GSHP
m.loadwater flow rate of the load side of GSHP
εpercentage of direct solar energy supply
COPsysystem energy efficiency
Pheatingunit compressor energy consumption
Ppumppump energy consumption

Appendix A

Figure A1. Simulation Modeling of the PV/T-GSHP automatic control heating system in TRNSYS.
Energies 16 04341 g0a1

Appendix B

Figure A2. Equipment Parameters of PV/T collector, Tank, Storage volume, Borehole geometry, GSHP.
Energies 16 04341 g0a2aEnergies 16 04341 g0a2b

References

  1. Qu, F.T.; Lu, N.; Feng, S.Y. Impact of land use change on carbon emissions. China Popul. Resour. Environ. 2011, 21, 76–83. [Google Scholar]
  2. Xu, W.; Sun, D.Y.; Lu, F.; Yu, Z.; Wang, J. Research progress on the definition and index system of near-zero energy buildings. Build. Sci. 2018, 34, 1–9. [Google Scholar]
  3. Yi, J.; Yi, J. Academician: Preface to the Annual Development Study Report on Building Energy Efficiency in China 2020. Build. Energy Effic. 2020, 48, 166. [Google Scholar]
  4. Wang, J.; Zha0ng, M.L.; Xu, Y.Q. Applicability of PV/T photovoltaic solar thermal system combined with ground source heat pump. Mod. Electron. Technol. 2013, 36, 168–170. [Google Scholar]
  5. Dai., L.; Li, S.; DuanMu, L.; Li, X.; Shang, Y.; Dong, M. Experimental performance analysis of a solar assisted ground source heat pump system under different heating operation modes. Appl. Therm. Eng. 2015, 75, 325–333. [Google Scholar] [CrossRef]
  6. Du, W.; Li, S.S. Introduction to the research and development of solar-soil source heat pump. Build. Energy Effic. 2012, 40, 30–32+61. [Google Scholar]
  7. Zhao, X.L. Study on Dynamic Simulation and Performance of Solar Photovoltaic Photothermal Coupled Heat Pump Heating System. Master’s Thesis, North China Electric Power University, Beijing, China, 2020. [Google Scholar]
  8. Canelli, M.; Entchev, E.; Sasso, M.; Yang, L.; Ghorab, M. Dynamic simulations of hybrid energy systems in load sharing application. Appl. Therm. Eng. 2015, 78, 315–325. [Google Scholar] [CrossRef]
  9. Xu, P.; Quan, Z.H.; Zhao, Y.H.; Sun, C.; Wang, G. Experimental Study on New Solar photovoltaic Heat Pump Compound Building Energy Supply System and its Performance. Archit. Sci. 2015, 31, 99–105. [Google Scholar]
  10. Sommerfeldt, N.; Madani, H. In-depth techno-economic analysis of PV/Thermal plus ground source heat pump systems for multi-family houses in a heating dominated climate. Sol. Energy 2019, 190, 44–62. [Google Scholar] [CrossRef]
  11. Pärisch, P.; Mercker, O.; Warmuth, J.; Tepe, R.; Bertram, E.; Rockendorf, G. Investigations and model validation of a ground-coupled heat pump for the combination with solar collectors. Appl. Therm. Eng. 2014, 62, 375–381. [Google Scholar] [CrossRef]
  12. Niu, S. Research on Composite Ground Source Heat Pump Heating with PV/T System in New Heat Collection Structure. Master’s Thesis, North China Electric Power University, Beijing, China, 2021. [Google Scholar]
  13. Li, H.; Peng, X.Y.; Jia, Y. Application and simulation of photovoltaic technology in building electrical energy efficiency. Comput. Simul. 2022, 39, 96–100. [Google Scholar]
  14. Wang, S.Q.; He, S.J.; Ma, K.Y. Study on the operation strategy of soil source heat pump system in severe cold region. Renew. Energy 2016, 34, 900–907. [Google Scholar]
  15. Bertram, E.; Glembin, J.; Rockendorf, G. Unglazed PVT collectors as additional heat source in heat pump systems with borehole heat exchanger. Energy Procedia 2012, 30, 414–423. [Google Scholar] [CrossRef]
  16. Fine, J.P.; Nguyen, H.V.; Friedman, J.; Leong, W.H.; Dworkin, S.B. A simplified ground thermal response model for analyzing solar-assisted ground source heat pump systems. Energy Convers. Manag. 2018, 165, 276–290. [Google Scholar] [CrossRef]
  17. Zhang, C.X.; Xu, H.; Lu, J.H.; Liu, Y.; Peng, D. Operational characteristics of solar PV/T collector coupled soil source heat pump composite system. J. Agric. Eng. 2021, 37, 215–222. [Google Scholar]
  18. Emmi, G.; Zarrella, A.; De Carli, M.; Galgaro, A. An analysis of solar assisted ground source heat pumps in cold climates. Energy Convers. Manag. 2015, 106, 660–675. [Google Scholar] [CrossRef]
  19. Li, K.F. Simulation Study of PV/T Coupled Ground Source Heat Pump Cooling, Heating and Power Trigeneration System. Master’s Thesis, Northeastern Electric Power University, Jilin, China, 2022. [Google Scholar]
  20. Liu, X.P.; Lei, Y.H.; Tian, D.; Hao, X.; Liao, S. Simulation of operational performance of solar photovoltaic/photothermal-ground source heat pump combined heating system in hot summer and cold winter regions. J. Cent. South Univ. Nat. Sci. Ed. 2021, 52, 1892–1900. [Google Scholar]
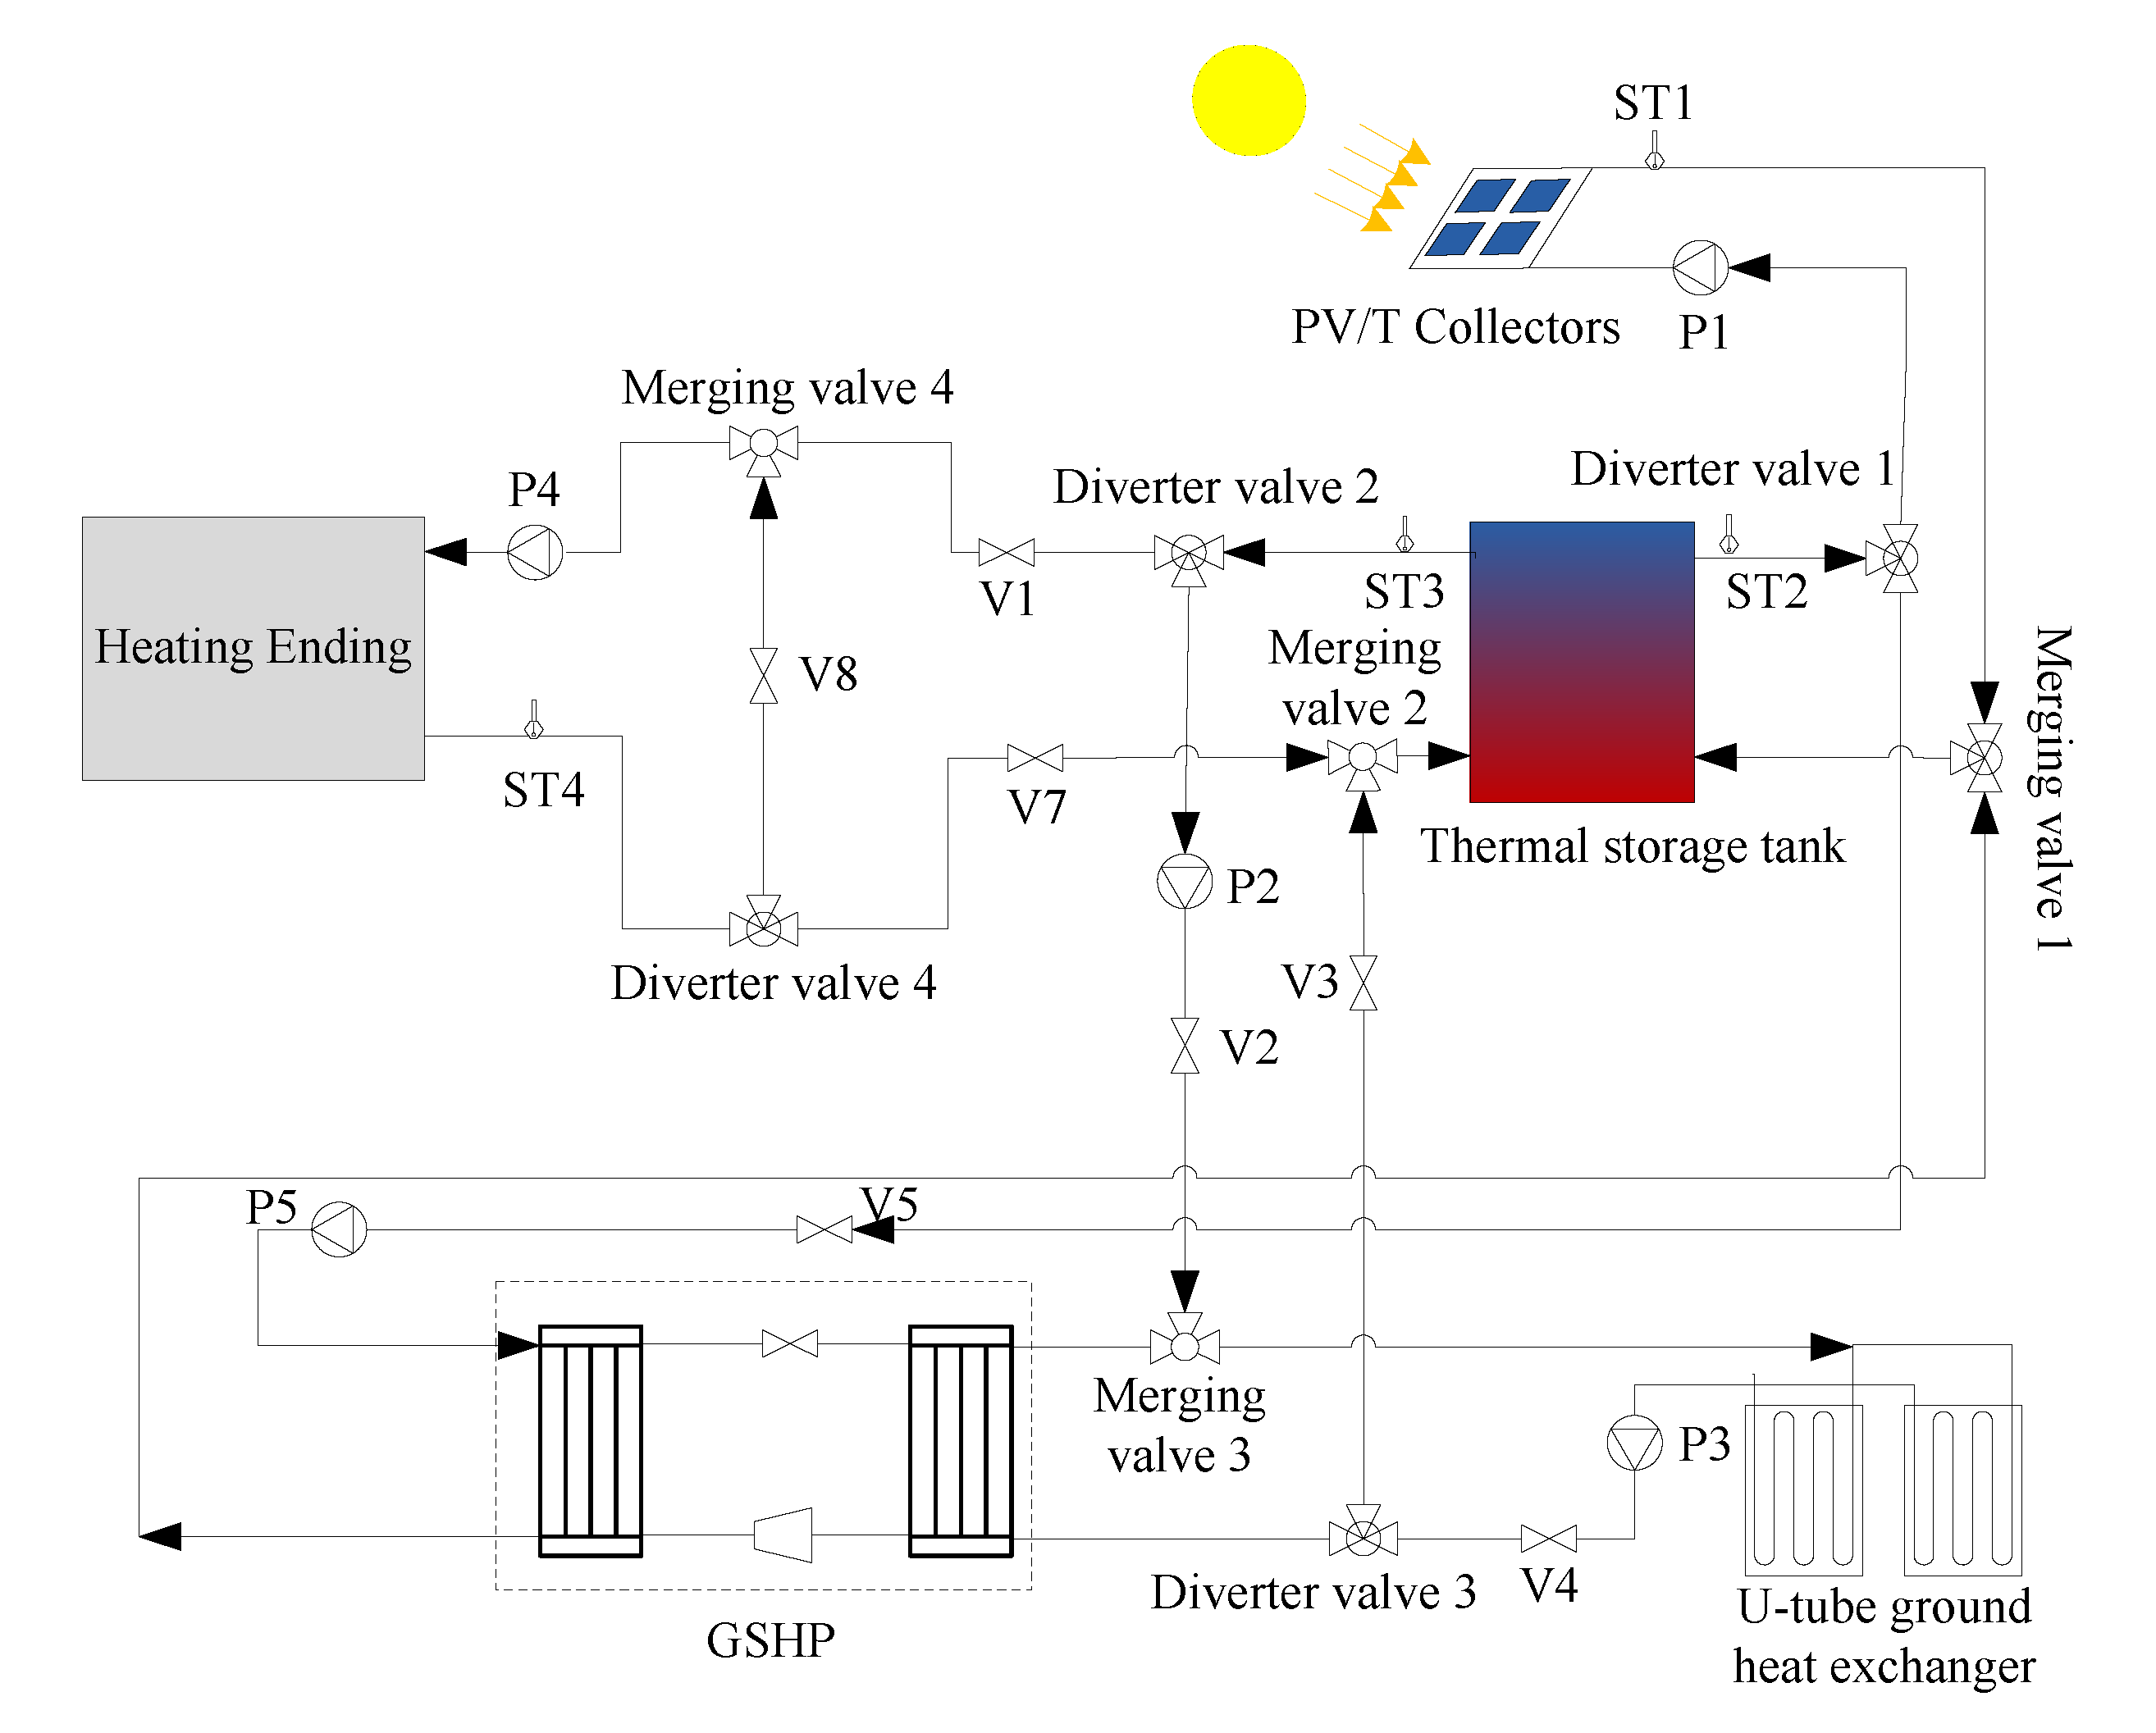
Figure 1. The schematic diagram of PV/T-GSHP heating system.
Energies 16 04341 g001
Figure 2. The control logic block diagram of PV/T-GSHP heating system.
Energies 16 04341 g002
Figure 3. The control strategy diagram of PV/T-GSHP heating system.
Energies 16 04341 g003
Figure 4. The directional control of diverter valve 4 fluid flow.
Energies 16 04341 g004
Figure 5. PV/T outlet water temperature, PV temperature, and GHE outlet water temperature in reference [20] and the simulation of PV/T-GSHP automatic control heating system.
Energies 16 04341 g005
Figure 6. The outdoor temperature and solar radiation dynamics of Beijing in the heating period.
Energies 16 04341 g006
Figure 7. Variation of soil average temperature with time for the corresponding time point of the GSHP heating system.
Energies 16 04341 g007
Figure 8. Variation of soil average temperature with 10a for GSHP and PV/T-GSHP system operation.
Energies 16 04341 g008
Figure 9. The outlet water temperature of each component in a typical day of the heating period.
Energies 16 04341 g009
Figure 10. The outlet water temperature of each component in a typical year of the heating period.
Energies 16 04341 g010
Figure 11. The quantity of heat supply of PV/T collector and GSHP.
Energies 16 04341 g011
Figure 12. Comparison chart of building heat load and quantity of heat supply for storage tank.
Energies 16 04341 g012
Figure 13. Linear fitted plot of COPsy versus ε.
Energies 16 04341 g013
Figure 14. PV panel temperature on a typical day.
Energies 16 04341 g014
Figure 15. PV panel temperature and PV efficiency on a typical day. (a) PV panel temperature on a typical day; (b) PV efficiency on a typical day.
Energies 16 04341 g015
Figure 16. Energy consumption data for a typical year of operation during the heating period. (a) Energy consumption of system for a typical year of operation during the heating period; (b) The typical annual PV power generation during the heating period.
Energies 16 04341 g016
Figure 17. Initial investment, operating costs, and annual value of the costs of the PV/T-GSHP system.
Energies 16 04341 g017
Disclaimer/Publisher’s Note: The statements, opinions and data contained in all publications are solely those of the individual author(s) and contributor(s) and not of MDPI and/or the editor(s). MDPI and/or the editor(s) disclaim responsibility for any injury to people or property resulting from any ideas, methods, instructions or products referred to in the content.