Article

Influences of the Introduced O-Containing Functional Groups on the Gaseous Pyrolysis Product of Superfine Pulverized Coal

1
Department of Thermal Engineering, Shandong Jianzhu University, Jinan 250101, China
2
School of Mechanical Engineering, Shanghai Jiao Tong University, Shanghai 200240, China
*
Author to whom correspondence should be addressed.
Energies 2023, 16(11), 4418; https://doi.org/10.3390/en16114418
Submission received: 5 May 2023 / Revised: 22 May 2023 / Accepted: 29 May 2023 / Published: 30 May 2023
(This article belongs to the Section H3: Fossil)

Abstract

:
An O-containing structure in coal can affect the pyrolysis process; however, the influence of the introduced O-containing functional groups has rarely been investigated. To study this issue, two kinds of representative coal were selected for superfine pulverization and chemical oxidation. The 13C-NMR and FTIR experiments demonstrated that O-containing functional groups, such as carboxyl, could be added into the carbon skeleton after 5 wt% peracetic acid modification. It was found that 1 wt% and 5 wt% hydrogen peroxide solutions had no such ability, but the 1 wt% solution could expand the pore structure and increase the specific surface area. Thermogravimetric experiments in the air showed that peracetic acid oxidation could increase the weight loss rate below 400 °C and reduce ignition temperatures. Pyrolysis experiments in the tube furnace proved that the amount of CO released increased and the commencing temperature decreased by 50 °C after the modification of peracetic acid. The generation paths of C2H4 and C6H6 changed; new generation peaks appeared near 200 °C. It has been strongly confirmed that superfine pulverization and chemical oxidation modification has obvious synergistic effects on the introduction of O-containing functional groups, especially for anthracite samples.

1. Introduction

Coal continues to account for a large proportion of energy consumption in the world [1]. The study of the utilization of coal is still of significant practical value. Organic oxygen is an indispensable component in coal, which mainly exists in the form of phenolic hydroxyl, carboxyl or carbonyl groups, aryl–aryl or alkyl–aryl ether bridges, and ring oxygen, chiefly in furan-type structures [2].
O-containing functional groups can exert influences on the adsorption characteristics of coal [3,4]. Guorui Feng et al. [3] discovered that in upgraded brown coal, O-containing functional groups and 5–10 nm pores had a synergistic effect on the readsorption of water. Additionally, the monolayer water concentration was mainly controlled by the oxygen content. -COOH and -OH on the coal surface had strong hydrophilicity, meaning it was proven that these two functional groups reduced the coal flotation performance when hydrocarbon oily collectors were used [4].
More importantly, O-containing functional groups are able to affect the thermal conversion process of coal. The pyrolysis reaction in the primary devolatilization phase mainly derives from the decomposition of functional groups containing hydrogen, while the secondary phase at a higher temperature is closely related to the decomposition of O-containing function groups in the coal matrix [5]. It was shown that both alkyl- and O-containing groups attached on the benzene rings could reduce the peak temperatures of the evolution of the main products in pyrolysis, with the effect of the latter being stronger [6]. O-containing functional groups underwent thermal polycondensation through cross-linking in pyrolysis [7]. Additionally, they were also in tar in various forms, such as phenols and C=O bonds [8,9], profoundly affecting the process of coal pyrolysis and combustion. Xizhuang Qin et al. [10] studied the retorting process of four kinds of low-rank coal and reported that the thermal decomposition of coal macromolecules would form larger fragments if more aromatic ether bonds existed. The pyrolysis of organic oxygen in coal generated active sites, which led to the production of gas products, such as CO and CO2, and promoted the formation of new O-containing functional groups [11]. Deng Zhao et al. [12] discovered that O-containing functional groups formed via pre-oxidation improve the gasification reactivity of Zhundong coal. Further studies by means of the model compounds and quantum calculation indicated that the carbonyl group could combine with the metal atom to form more catalytic active C–O–M centers, which strengthened the link between the metal and carbon matrix, thus promoting catalytic gasification. Jun Xu et al. [13] conducted experiments on 32 kinds of coal and pointed out that with the decrease in the volatile content, the content of the carbonyl functional group in coal decreased, which worsened the combustion characteristics. Zhuozhi Wang et al. [14] studied the combustion process of coal powder and coke in an O2/H2O atmosphere and demonstrated that an increase in the C(O) structure content on the surface of the coal coke led to stronger reactivity.
The available literature, which focuses on O-containing issues, mainly investigates the functional groups that already exist in coal. In the existing literature, the most common method is to select several kinds of coal in order to study and analyze various oxygen contents. In addition, experiments using O-containing model compounds [12,15] and a simulation calculation [12,16] have also been reported. Chemical oxidation can transform a portion of the structure in coal into O-containing functional groups; however, there is a lack of research related to the influence of these structures on coal utilization.
Superfine pulverized coal, with an average particle size of around or below 20 μm, is, in essence, a kind of product that is produced after mechanochemical modification, which has a larger specific surface area and better pyrolysis features [17]. Due to its smaller size, the chemical properties of superfine coal powder are active [18], making it easier to react with oxidation reagents; therefore, superfine pulverized coal powder was selected to be modified by the representative chemical reagents. Subsequently, the alteration of organic oxygen in coal was obtained and analyzed. Then, pyrolysis experiments were conducted using these modified samples. The novelty of this study lies in the fact that the influences of the introduced O-containing functional groups on gaseous pyrolysis products were discovered. This study enriches the theory of coal pyrolysis from a new perspective.

2. Materials and Methods

Two kinds of representative coal in China were selected: bituminous and anthracite coal. Bituminous coal was produced in the Inner Mongolia Autonomous Region, which is labeled as NMG, while the anthracite coal was derived from Henan Province, which is marked as HN. The raw coal was crushed and ground to superfine pulverized powder of various sizes. Afterwards, the raw samples were modified, and a series of experiments were conducted.

2.1. Samples and Modified Methods

The particle size distribution of the samples was carried out on a Malvern MAM5004 laser particle size analyzer. The median diameter D50 value was taken as the average particle size. All the particle sizes mentioned in the manuscript are D50 values.
Ultimate analysis, including moisture (M), fixed carbon (FC), volatile matter (V), and ash (A), were measured using a muffle furnace, of which all the values were based on a received basis (as received (ar)). The proximate analysis of the coal powder, including carbon (C), hydrogen (H), oxygen (O), nitrogen (N), and sulfur (S), were acquired using the Vario ELIII elemental analyzer from Elementaler Co., Frankfurt, Germany, of which all the values were based on a dry ash-free (daf) basis. Detailed information regarding the samples is listed in Table 1 and Table 2.
Hydrogen peroxide and peracetic acid are the most representative and commonly used peroxide reagents as they are cheap and do not contain other types of elements except for C, H, and O. Hydrogen peroxide and peracetic acid were chosen for oxidation. The experimental conditions are summarized in Table 3. The concentrations of the H2O2 solution were set as 1 and 5 wt%, respectively. Based on the preliminary experiment, the oxidation effect of peroxyacetic acid with a concentration under 3 wt% was not obvious. Therefore, the concentration of peracetic acid solution was set as 5 wt%. Before chemical oxidation, NMG and HN samples were dried at 105 °C for 12 h in a drying oven.
Subsequently, coal powder was mixed with solution in a ratio of 1 g:30 mL in beakers that were put into water bath containers with an electromagnetic agitator. The reaction lasted for 6 h at a constant temperature of 40 °C. Under these conditions, the oxidation process was retained in a mild form, which guaranteed that there were no great changes in the carbon skeleton. Meanwhile, functional groups could be transformed and introduced. After the reaction, the samples were filtered, gathered, and dried. The drying process was in accordance with the raw samples. The particle sizes and weight of the samples before and after the reaction were both measured.

2.2. Characterization of the Carbon Skeleton

The NMR 13C-CP/MAS/TOSS technique was employed, which was performed on a Bruker Advance 400 MHz NMR spectrometer (Germany). The resonant frequency of 13C was 100.63 MHz. The cross-polarization contact time was 1 ms. The cycle delay time was 4 s. Additionally, the MAS speed was 5 KHz. Before collecting 13C data, four π pulses with different intervals were added to constitute the TOSS sequence to eliminate the rotating side band of the aromatic carbon signal.
An in situ FTIR technique was applied to identify the functional groups on the surfaces. A 1 mg coal sample was mixed with 200 mg of spectroscopic-grade KBr. Afterwards, the mixture of coal and KBr was pressed into the pellets for FTIR measurements to be taken. The experiments were conducted on Nicolet 6700 apparatus (Thermo Fisher Scientific, Waltham, MA, USA). A Linkman heating module was adopted to control the temperature, which was programmed from 25 to 300 °C at a rate of 10 °C/min in the air atmosphere. Six temperature points were selected for analysis, namely 25, 150, 250, 350, 450, and 550 °C. Each temperature point paused for 2 min. Before each experiment, background scattering caused by quartz glass was measured. The background scattering was deducted from the obtained FTIR curves of each experiment. Subsequently, the FTIR curves were smoothed.

2.3. Characterization of the Pore Structure

All the data relevant to the pore structure were recorded on ASAP 2460 apparatus (Micromeritics Instrument Corporation, Norcross, GA, USA). The measuring range of the pore radius was between 0.35 and 500 nm.

2.4. Thermogravimetry and Pyrolysis

According to the preliminary experiments, the heating rate for both the thermogravimetry and the tube furnace was set as 20 °C/min.
A Netzsch STA449F thermal gravimetric analyzer was utilized for the thermogravimetric analysis. The atmosphere was an air atmosphere with a flow rate of 40 mL/min. Additionally, the temperature range was from 25 to 1200 °C. The mass of the sample was 10 mg.
The pyrolysis experiments were performed on a horizontal tube furnace. A 0.8 g coal sample was put into the porcelain boat, which could ensure that coal powder exists as a single layer. The gas flow of Ar was set as 4 L/min. The composition and content of the volatile were acquired using a Gasmet DX-4000 FTIR.

2.5. Naming Rules for Samples

The modified samples were named “coal type–reacting condition” or “coal type–particle size–reacting condition”. For example, NMG bituminous coal powder modified by 5 wt% peracetic acid was named NMG–gy5. NMG samples with an average particle size (D50) of 18.7 μm which was modified by in 5 wt% H2O2 solution were labeled as NMG–18.7–s5. All the samples were labeled based on these naming rules.

3. Results and Discussion

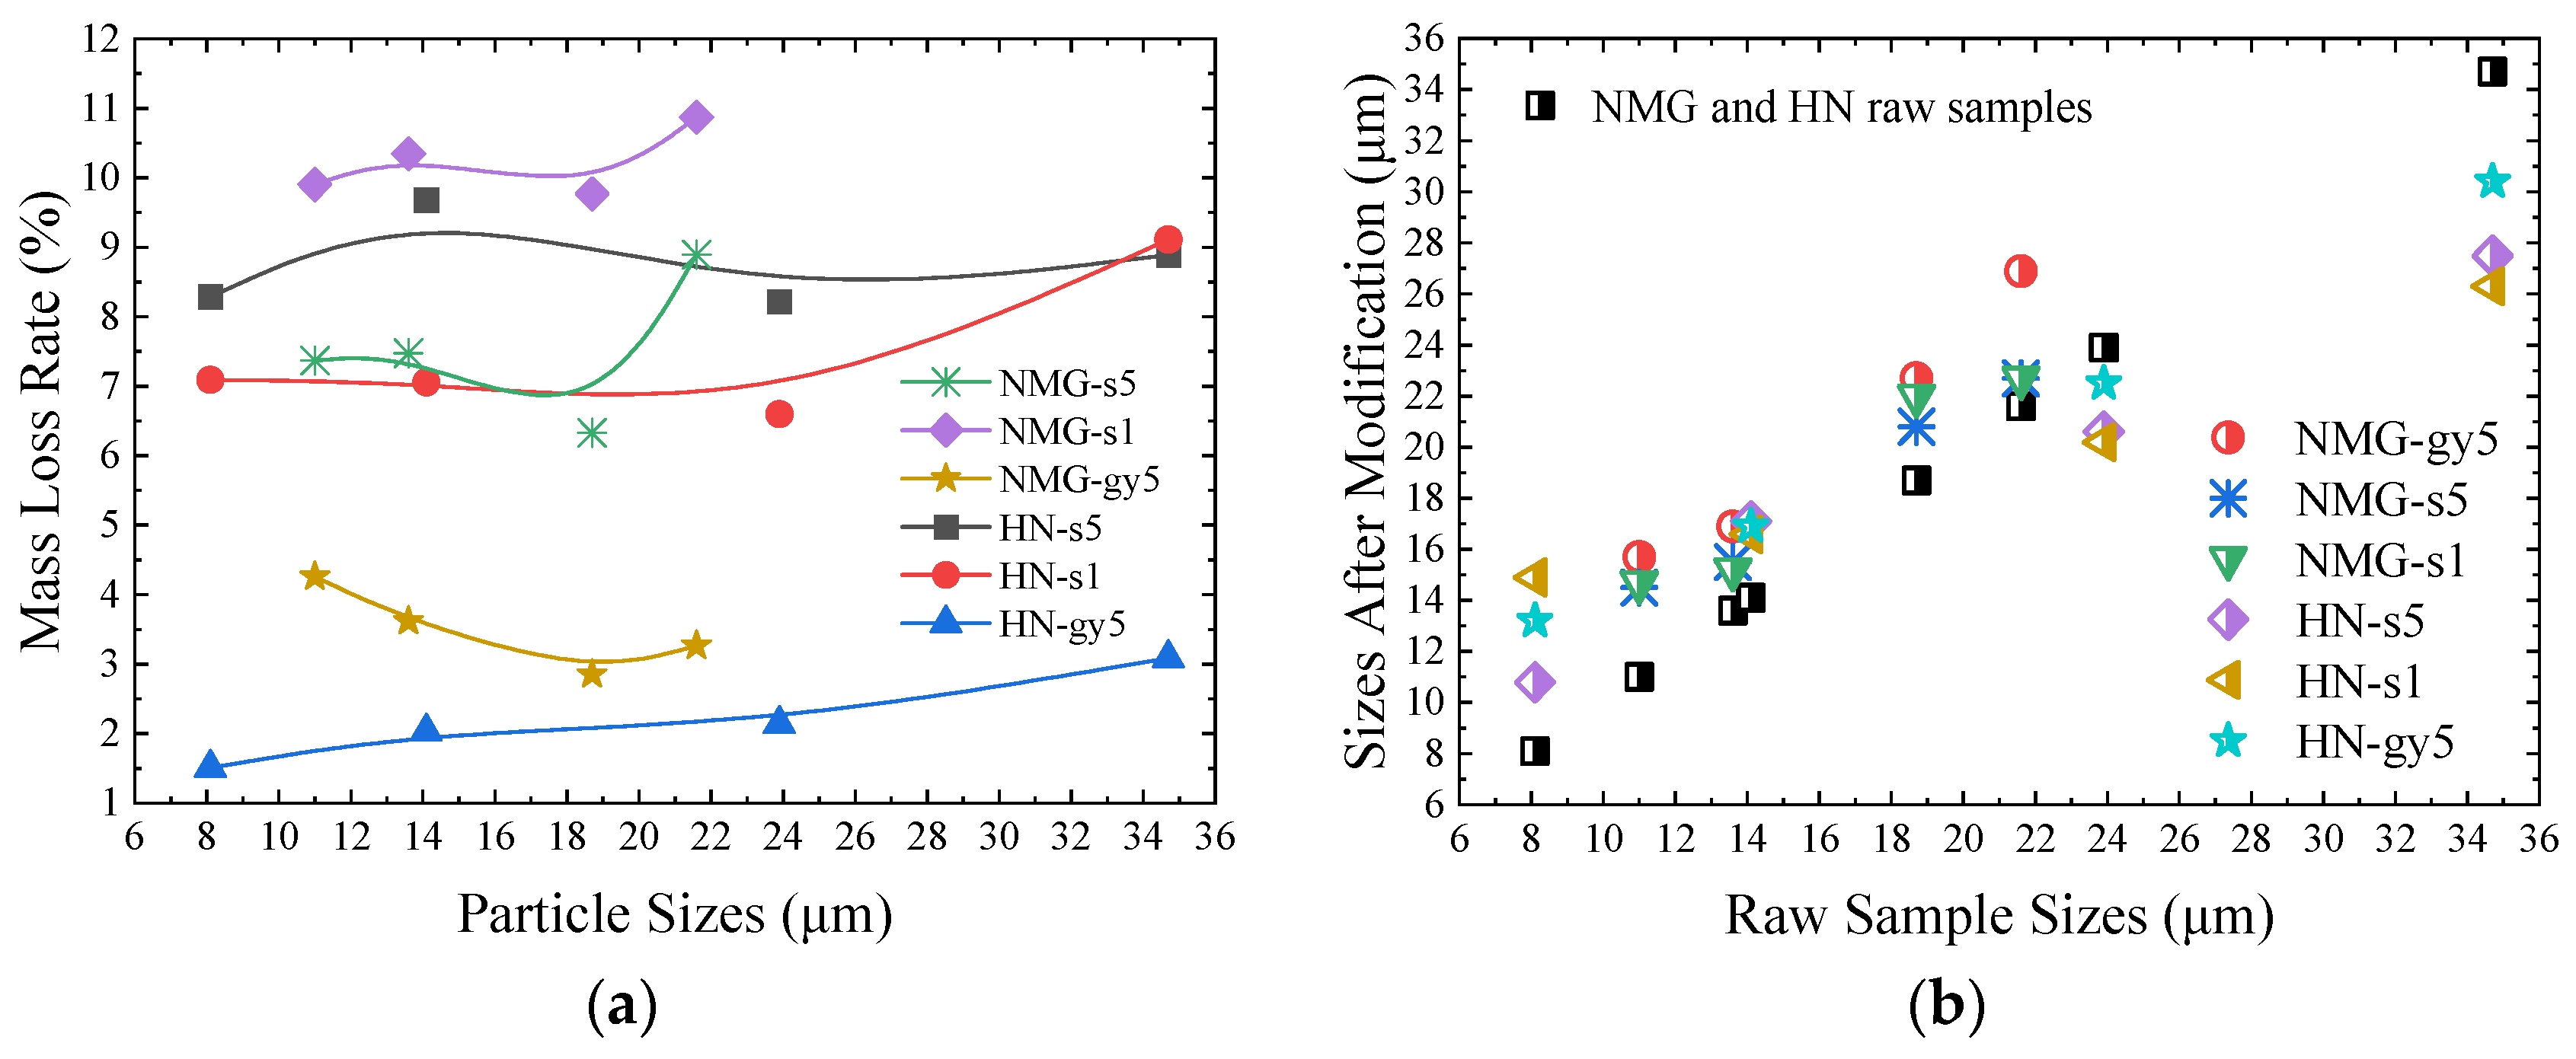
3.1. Mass and Particle Sizes Variation

The variations in the mass and particle sizes after modification are exhibited in Figure 1. After chemical oxidation modifications, the weight loss rates are within 12% generally. During the process of soaking, filtration, and drying, the samples inevitably stuck to the beaker or filter paper. Given these unavoidable losses, the mass loss being less than 12% is a satisfying result, which also indicates that the oxidation process is relatively mild. Only a small part of the coal macromolecules was transformed into soluble substances.
The weight loss of NMG is greater than that of the HN samples. Compared with anthracite, the chemical structures of bituminous coal have a higher degree of disorder, more bridge bonds, and more functional groups, resulting in a more active chemical reactivity. It is worth noting that the mass loss of NMG–gy5 and HN–gy5 is smaller than that of NMG–s5 and HN–s5, respectively. The reasons for this will be outlined later in this paper.
The average particle sizes changed slightly after modification. Additionally, the orders of the coal particle size in each group did not change. Due to agglomeration, the particle sizes of all NMG modified samples increased. There are comparatively abundant functional groups in bituminous coal, meaning it is easier to cross-link functional groups. In addition, hydrogen bonds and other interactions are likely to occur on the surface of superfine pulverized coal. Under these conditions, agglomeration is inevitable. Compared with the bituminous modified samples, HN anthracite coal particles tend to exist in an independent form due to inactive chemical properties. Hence, the particle sizes of the modified samples are not significantly different from the raw samples.

3.2. Change in the Carbon Structure

The information of the carbon structure of the samples was obtained using 13C-NMR and FTIR.

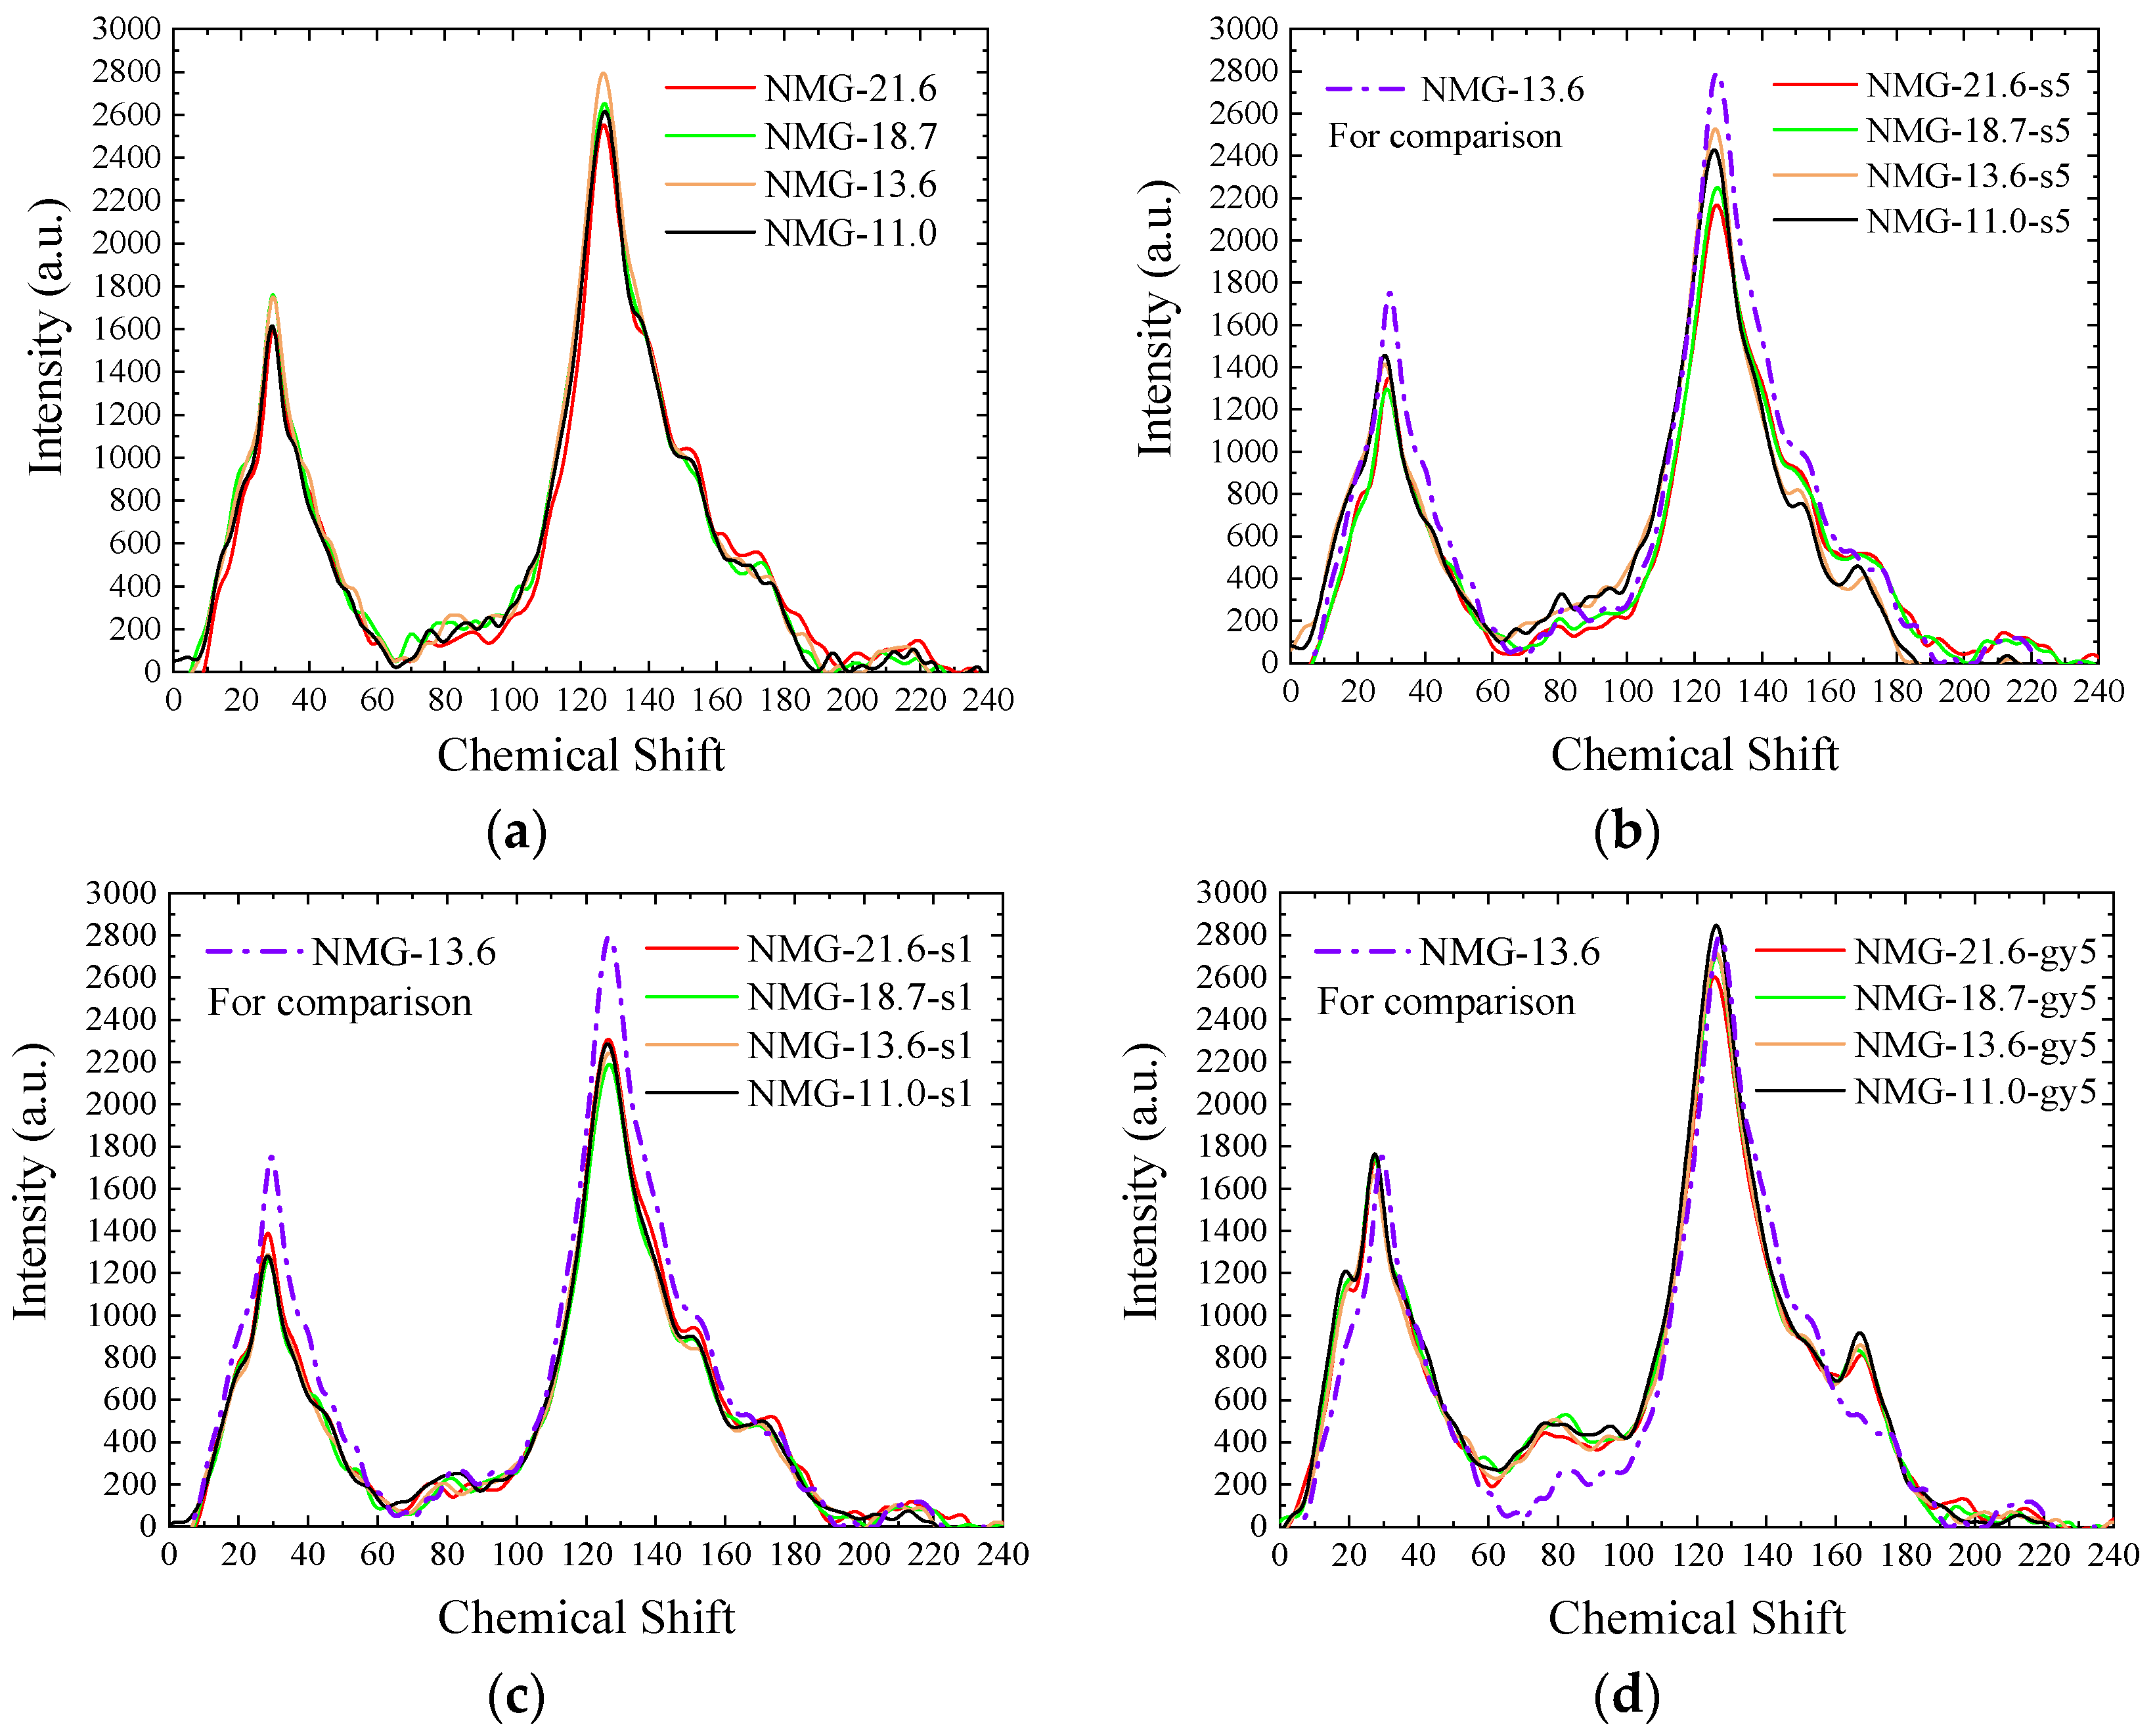
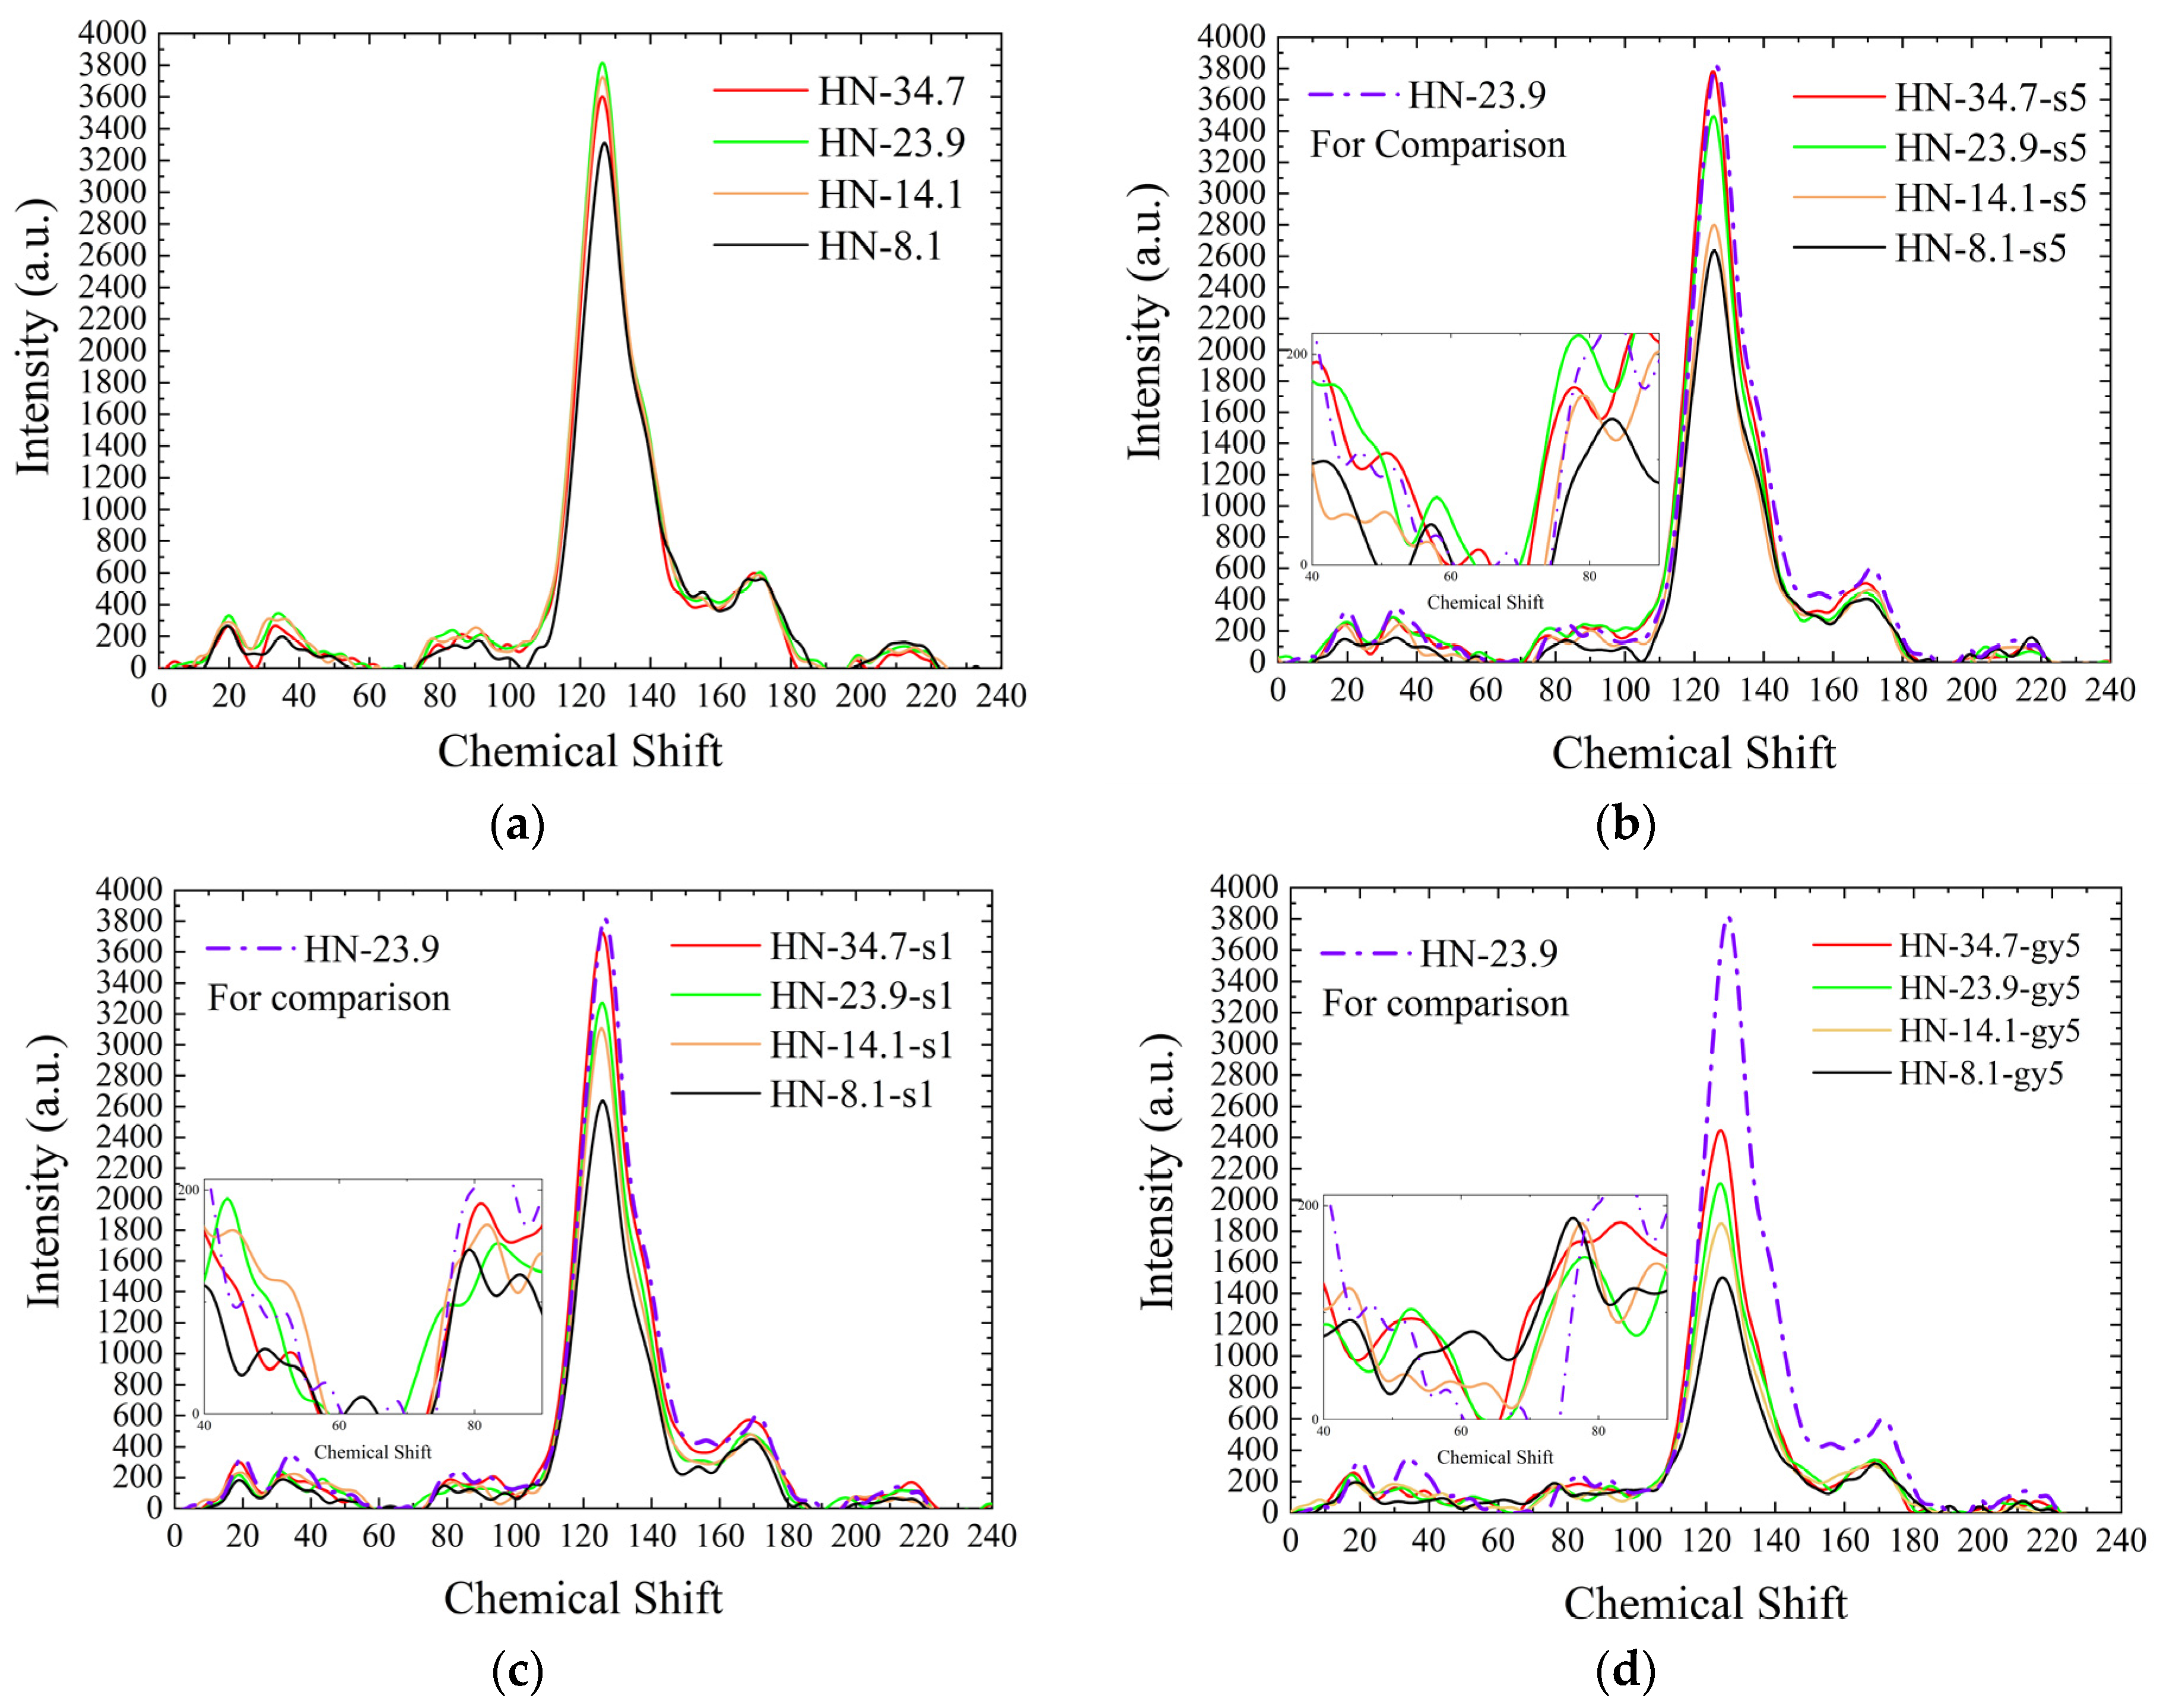
3.2.1. Analysis of 13C-NMR Spectra

Based on prior research, the chemical shift zones of O-containing structures in the coal matrix are in three parts, namely 60–90, 135–165, and 165–185 ppm [19,20], which receive special attention.

NMG Samples

The 13C-NMR spectra of NMG raw and modified samples are demonstrated in Figure 2. For comparison and analysis, the 13C-NMR spectra of NMG-13.6 are added into Figure 2b–d. The 22–36 ppm part corresponds to the methylene structure; quaternary carbon or α-C in an aromatic ring are in the 36–50 ppm part [19]. The signal intensity between 22 and 50 ppm decreases after 1 wt% and 5 wt% H2O2 solution modification. It has been proven that in an oxidizing environment, methylene -CH2- is easily broken [21], and α-C connected with an aromatic ring are the most susceptible structures to oxidation [22]. Therefore, our experimental results are consistent with former research.
Different from H2O2 solution, peracetic acid is both a kind of strong oxidant and acid solution. In an acidic solution, peracetic acid can generate hydroxyl radical ∙OH, which is a very strong electrophile and can selectively react with nucleophilic or electron-rich centers [23]. α-C structures in ether and alcohol are in the 56–75 ppm zone; the 75–90 ppm zone represents C-O structures in carbohydrates [19]. As demonstrated in Figure 2d, the signal strength of these two regions is obviously higher than that of raw coal. Under certain conditions, peroxides can break covalent bonds in coal by oxidation and generate -OH structures [24]. Ether bonds are susceptible to an oxidizing environment [25]. Therefore, the signal increment between 60 and 90 ppm derives from the introduction of alcoholic hydroxyl groups due to the modification of peracetic acid.
The chemical shift between 137 and 148 ppm belongs to the alkyl aromatic carbon structure in coal [19], which declines in NMG–s5, NMG–s1, and NMG–gy5 groups. This indicates that the structure is broken due to oxidation, which lowers the polymerization degree in the coal aromatic nucleus.
The signal of the carboxylic carbon structure is between 165 and 185 ppm. In Figure 2d, the intensity of the NMR spectra in this range is evidently stronger than that of raw coal, which reveals that carboxyl functional groups are introduced into the coal macromolecule. This is also confirmed by the results from the in situ FTIR. Furthermore, with the particle sizes decreasing, the intensity of the carboxyl signal ascends gradually, which means that more carboxyl functional groups are introduced. This also proves that peracetic acid and superfine pulverized coal have a synergistic effect on the introduction of O-containing functional groups.

HN Samples

The 13C-NMR spectra of HN raw and modified samples are exhibited in Figure 3. For comparison and analysis, the 13C-NMR spectra of HN–23.9 are added into Figure 3b–d. As a high-rank coal, the aromaticity of HN samples is relatively high; therefore, there is an evident peak in all the spectra. The signal intensity of aromatic peaks shows a downward trend in all three kinds of modified samples. With the decrease in the particle sizes, the intensity of the aromatic signal drops gradually. Compared with bituminous coal, more condensation rings and less side chains exist in anthracite coal. Additionally, the most common bridge bonds in anthracite coal are ether bonds [26], which are liable to be oxidized and broken [21,25]. With reducing particle sizes, the reaction area between the coal and reagent increases. Hence, the reaction degree deepens, which leads to the disintegration of a more aromatic nucleus and a weaker signal intensity.
The chemical shifts between 164 and 188 ppm mainly represent carboxyl groups [26]. In Figure 3d, the signal intensity of these parts does not change as the particle sizes decrease; however, the overall signal intensity of the HN–gy5 aromatic peak 90–160 ppm declines as there is a reduction in the particle sizes. This indicates that the ratio of the carboxyl group to the overall carbon structure increases, which is consistent with the conclusions made from the NMG groups.
In Figure 3, the spectra between 50 and 80 ppm are enlarged. In this range, the spectrum intensity of NMG–s1 and NMG–s5 are generally identical to that of raw coal, while HN–gy5 is significantly higher than the raw samples. Chemical shifts between 50 and 80 ppm belong to the α-C structures attached to either the alcoholic hydroxyl or ether group [19]. As discussed above, ether groups are unable to be introduced by oxidation; therefore, this indicates that alcoholic hydroxyl structures are introduced, which also matches the results of NMG–gy5. Additionally, this is the reason why the weight loss of NMG–gy5 and HN–gy5 is less than the samples modified by H2O2.
To summarize, the modification effects of the two reagents are inconsistent. Only peracetic acid solution can introduce alcoholic hydroxyl and carboxyl groups into the coal matrix by oxidation. Compared with H2O2, peracetic acid solution has a higher oxidation potential with low pH values, resulting in different chemical oxidation paths [27].

3.2.2. The Change in the Surface Structure

A part of the FTIR spectra of the NMG raw samples are demonstrated in Figure 4. Carboxyl functional groups are in the position around 1700 cm−1, C=C in aromatic ring is around 1600 cm−1, and 1733–1772 cm−1 represents C=O in esters [28,29]. Compared with the raw samples, the peaks of the carboxyl groups in NMG–gy samples are more evident. Carboxyl functional groups will decompose into CO2 and H2O around 200 °C [17]. Therefore, the spectral intensity around 1700 cm−1 drops promptly between 150 and 250 °C.
After the modification of peracetic acid, FTIR also strongly confirms that carboxyl functional groups are introduced. The FTIR results of HN–gy5 samples are consistent, which are not displayed here due to limited space.

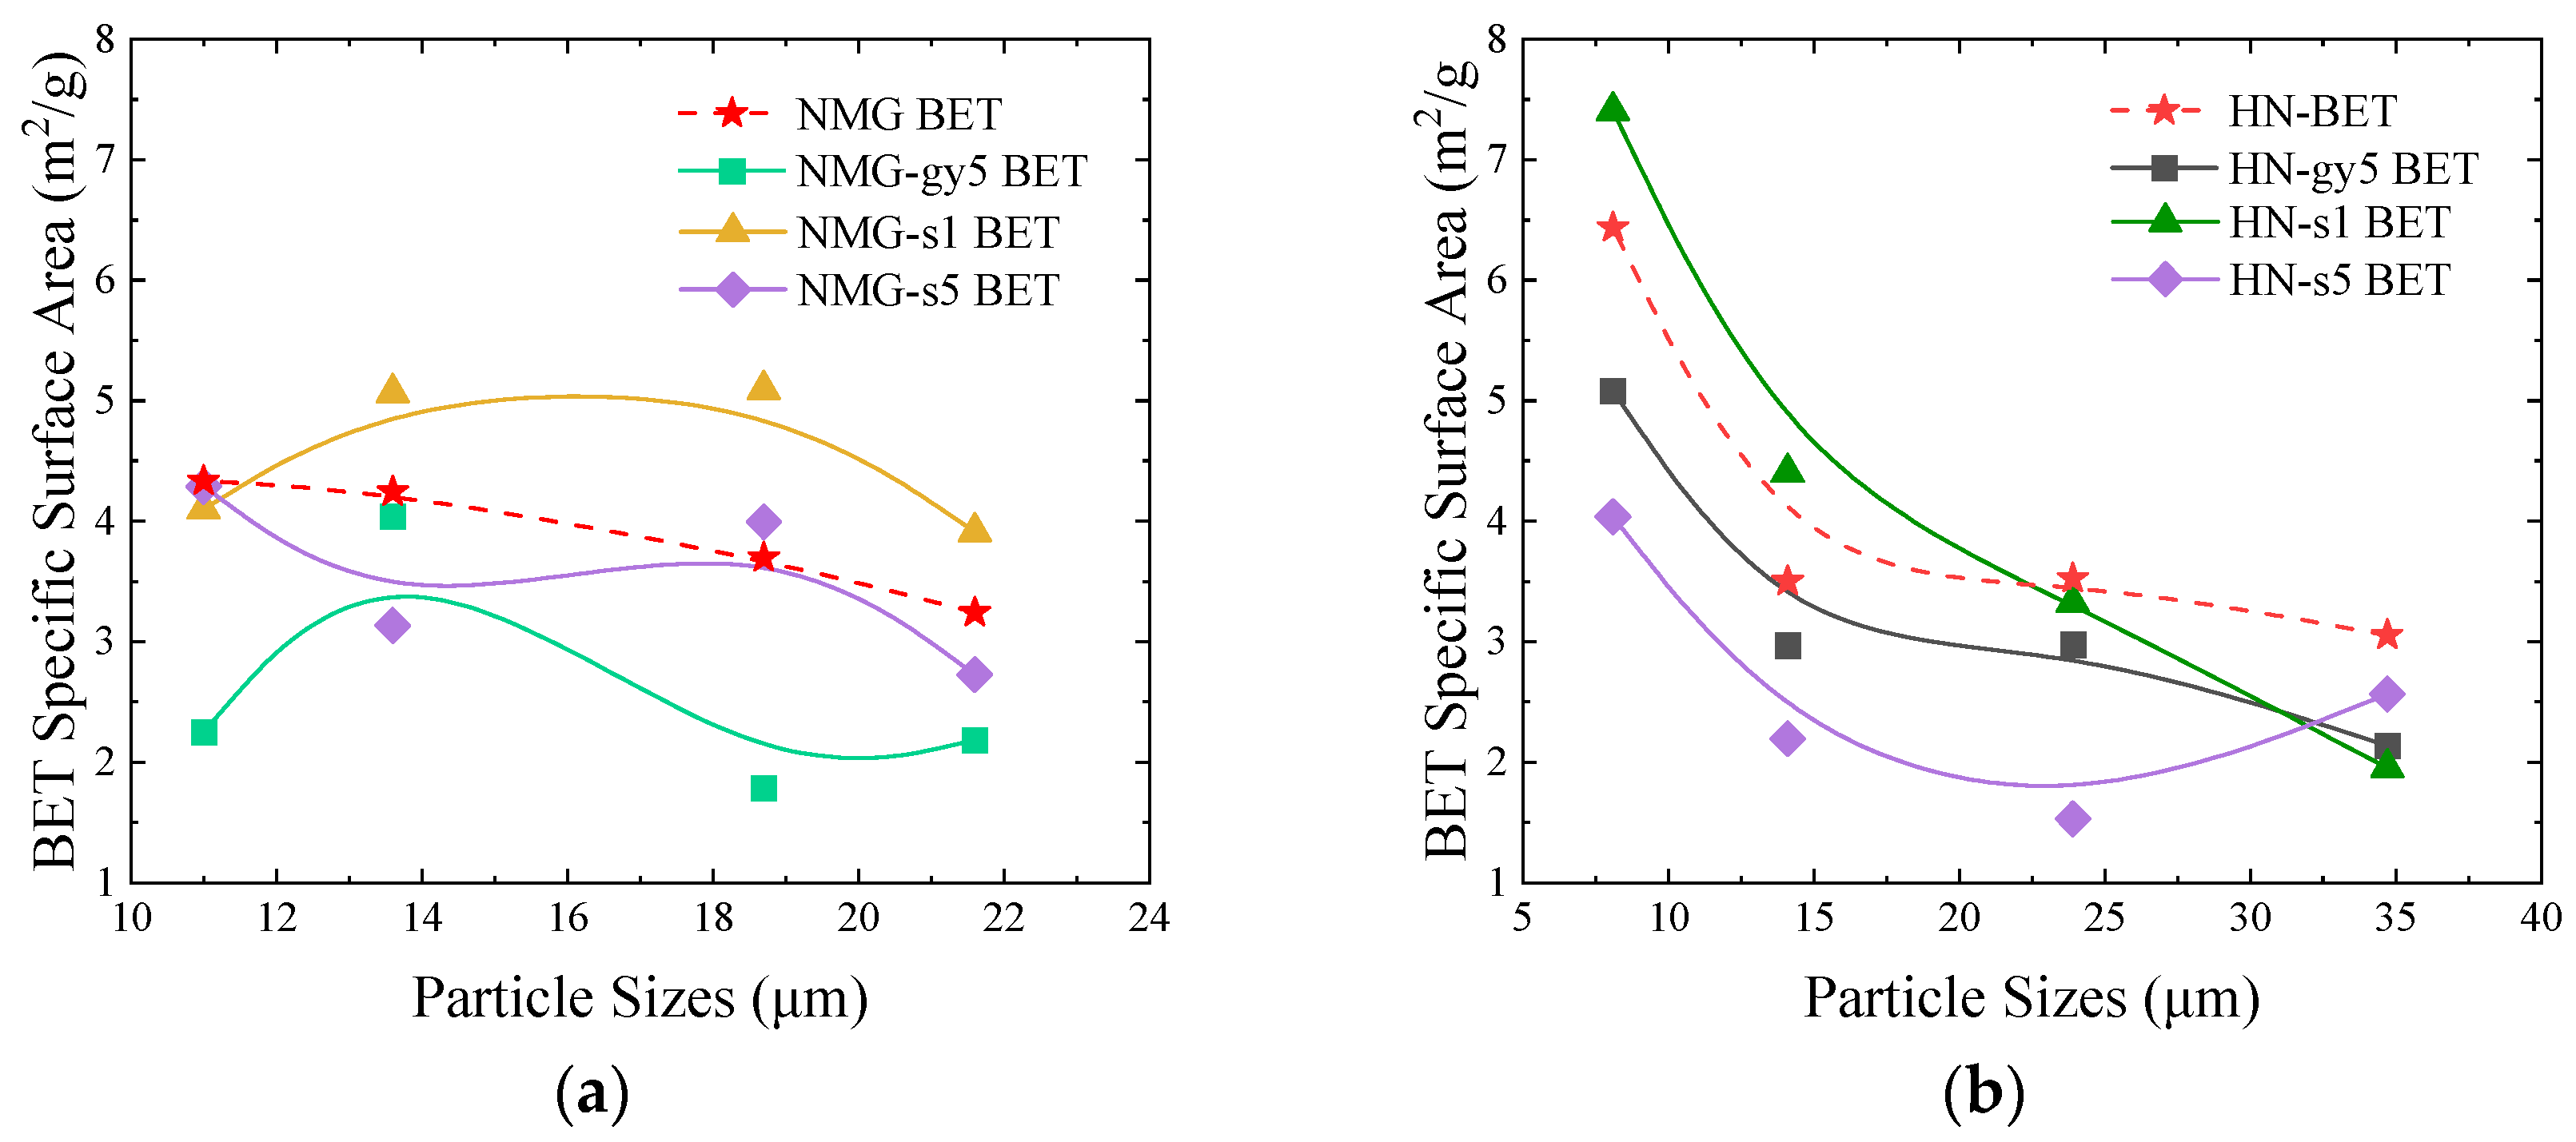
3.3. Pore structure Analysis

The BET specific area of all the raw and modified samples versus the particle sizes is depicted in Figure 5. The values of the BET specific surface area are connected in a line to reflect the trend of the change. In Figure 5a,b, the specific area of NMG and HN raw samples increases as the particle sizes decrease. The mesoscopic properties of raw samples are altered slightly by the chemical modification. Compared to raw samples, the specific surface areas of both NMG–s1 and HN–s1 rise slightly. Some covalent bonds in the coal matrix are oxidized and fractured in 1 wt% H2O2 solution. Due to the removal of cross-linked bridge bonds and functional groups, the pores inside the coal may be further extended and developed. As a result, the specific surface areas develop generally.
The pore structure is largely composed of the irregular arrangement of microcrystalline lamellae and functional groups [18]. Due to the stronger chemical oxidation, ether bonds, methylene, and other functional groups are oxidized and fractured in both 5 wt% H2O2 and peracetic acid solution, which may lead to coalescence and the collapse of the pore structures. As shown in Figure 5, the BET specific surface area of all NMG–s5, NMG–gy, HN–s5, and HN–gy5 samples declines compared to raw coal. The pore structure may affect the pyrolysis and combustion process.

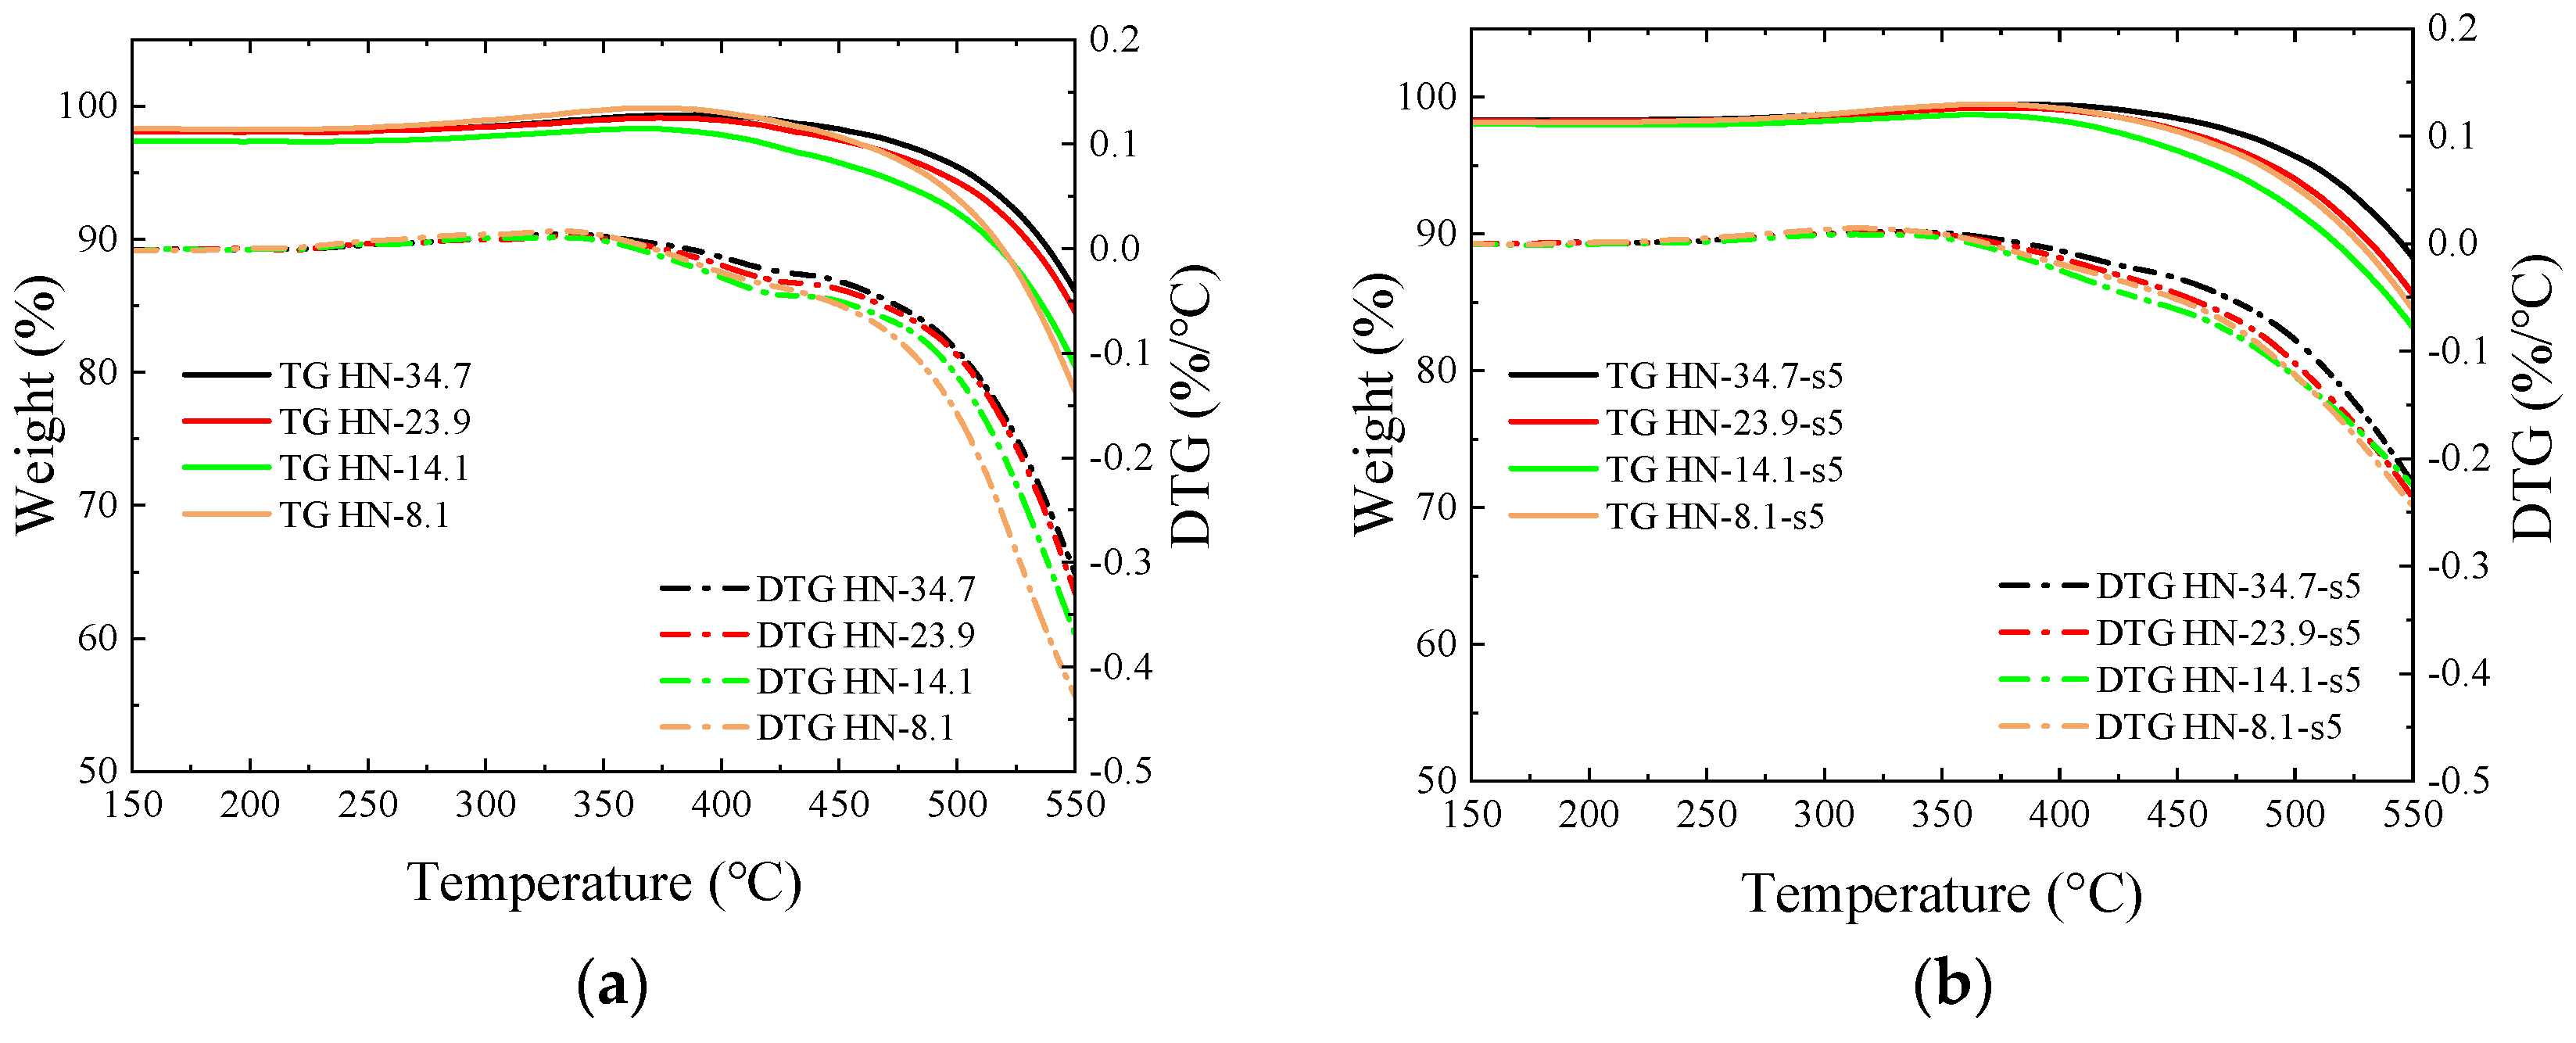
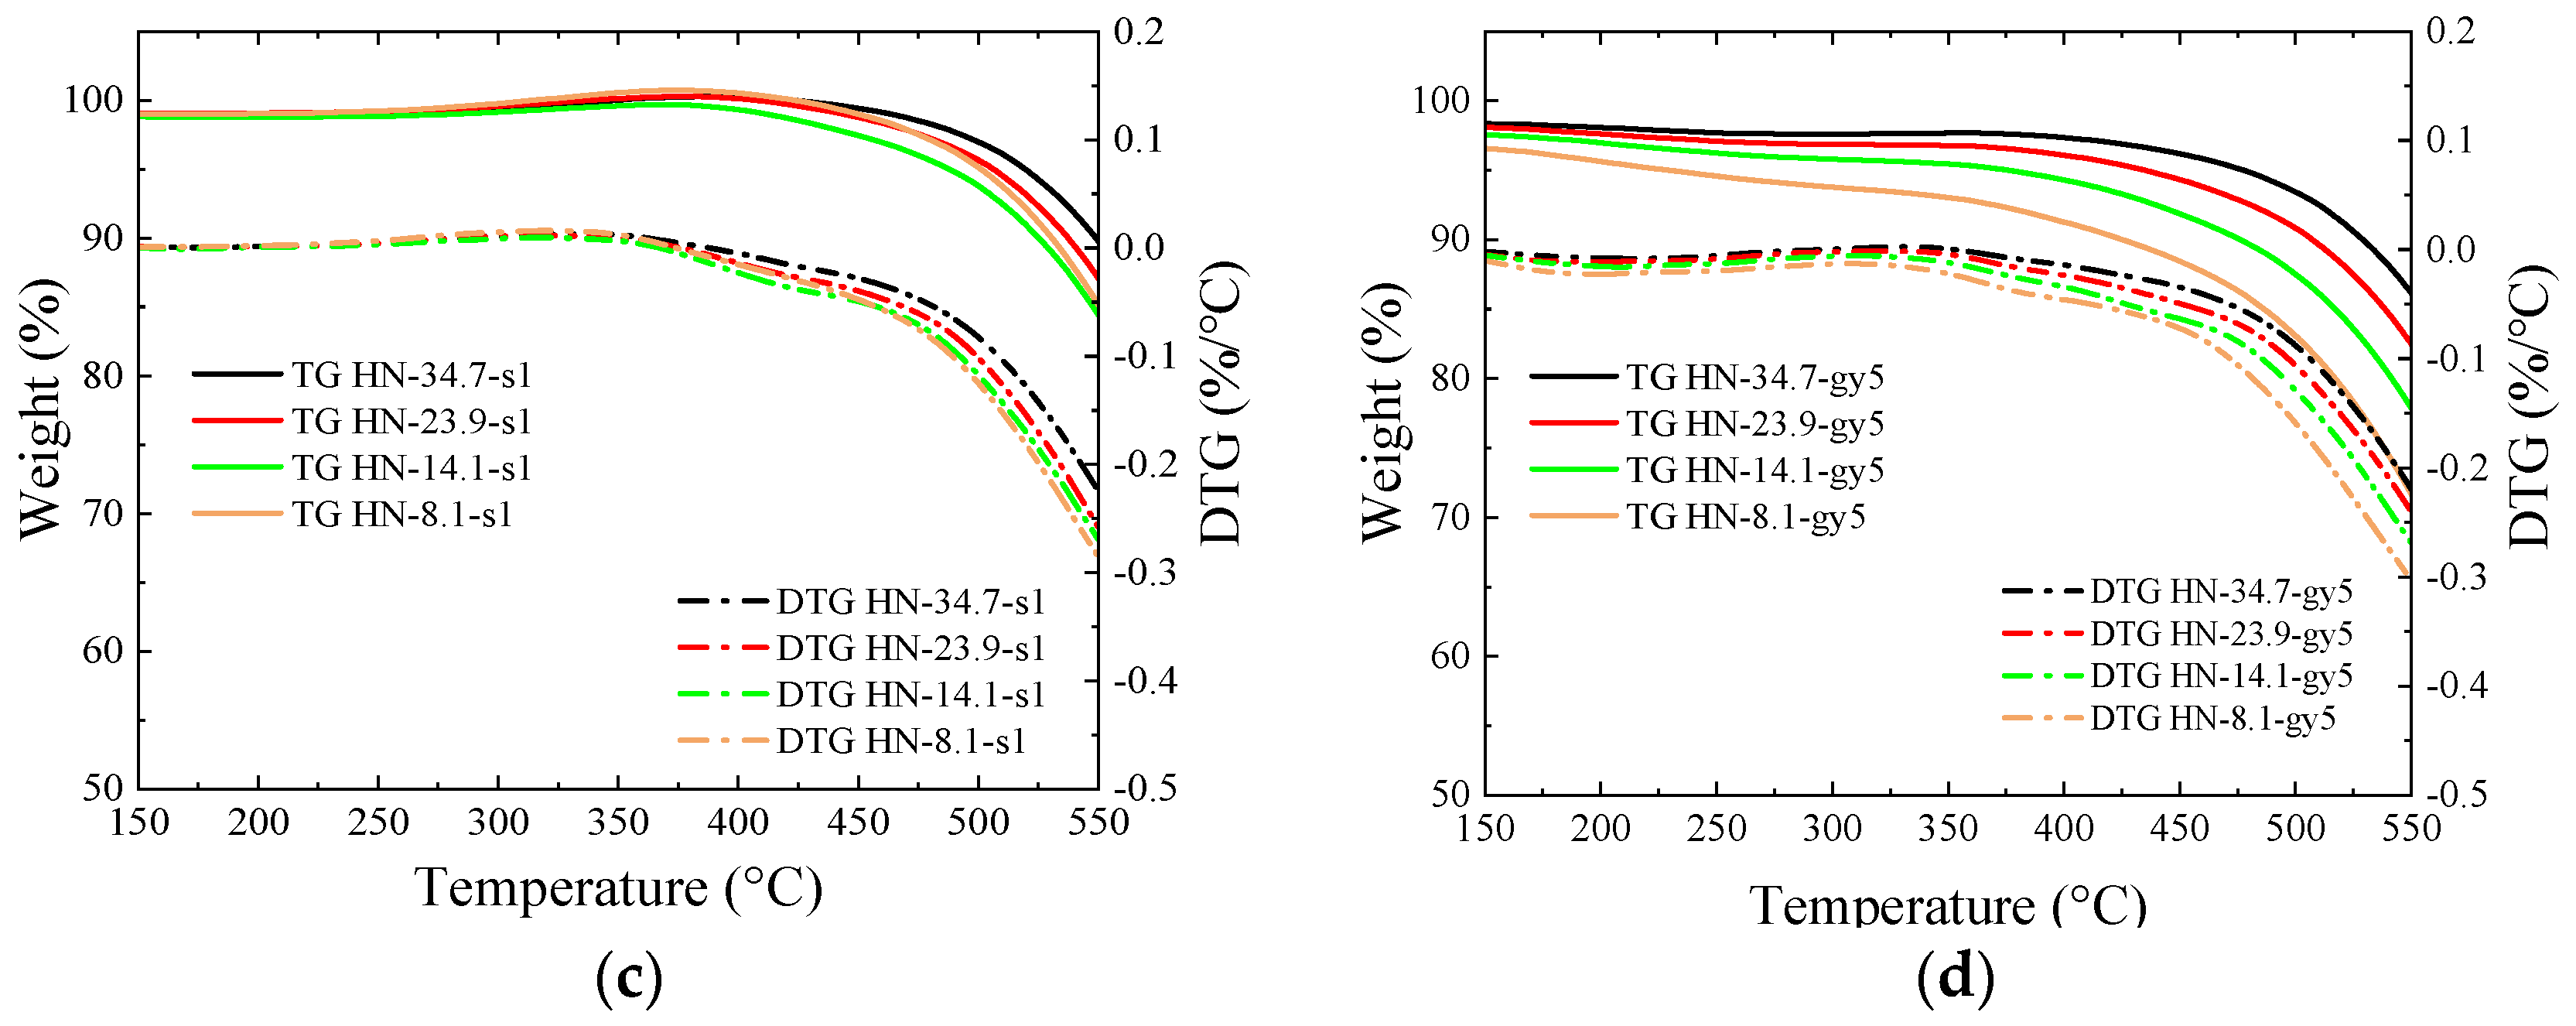
3.4. Thermogravimetric Analysis
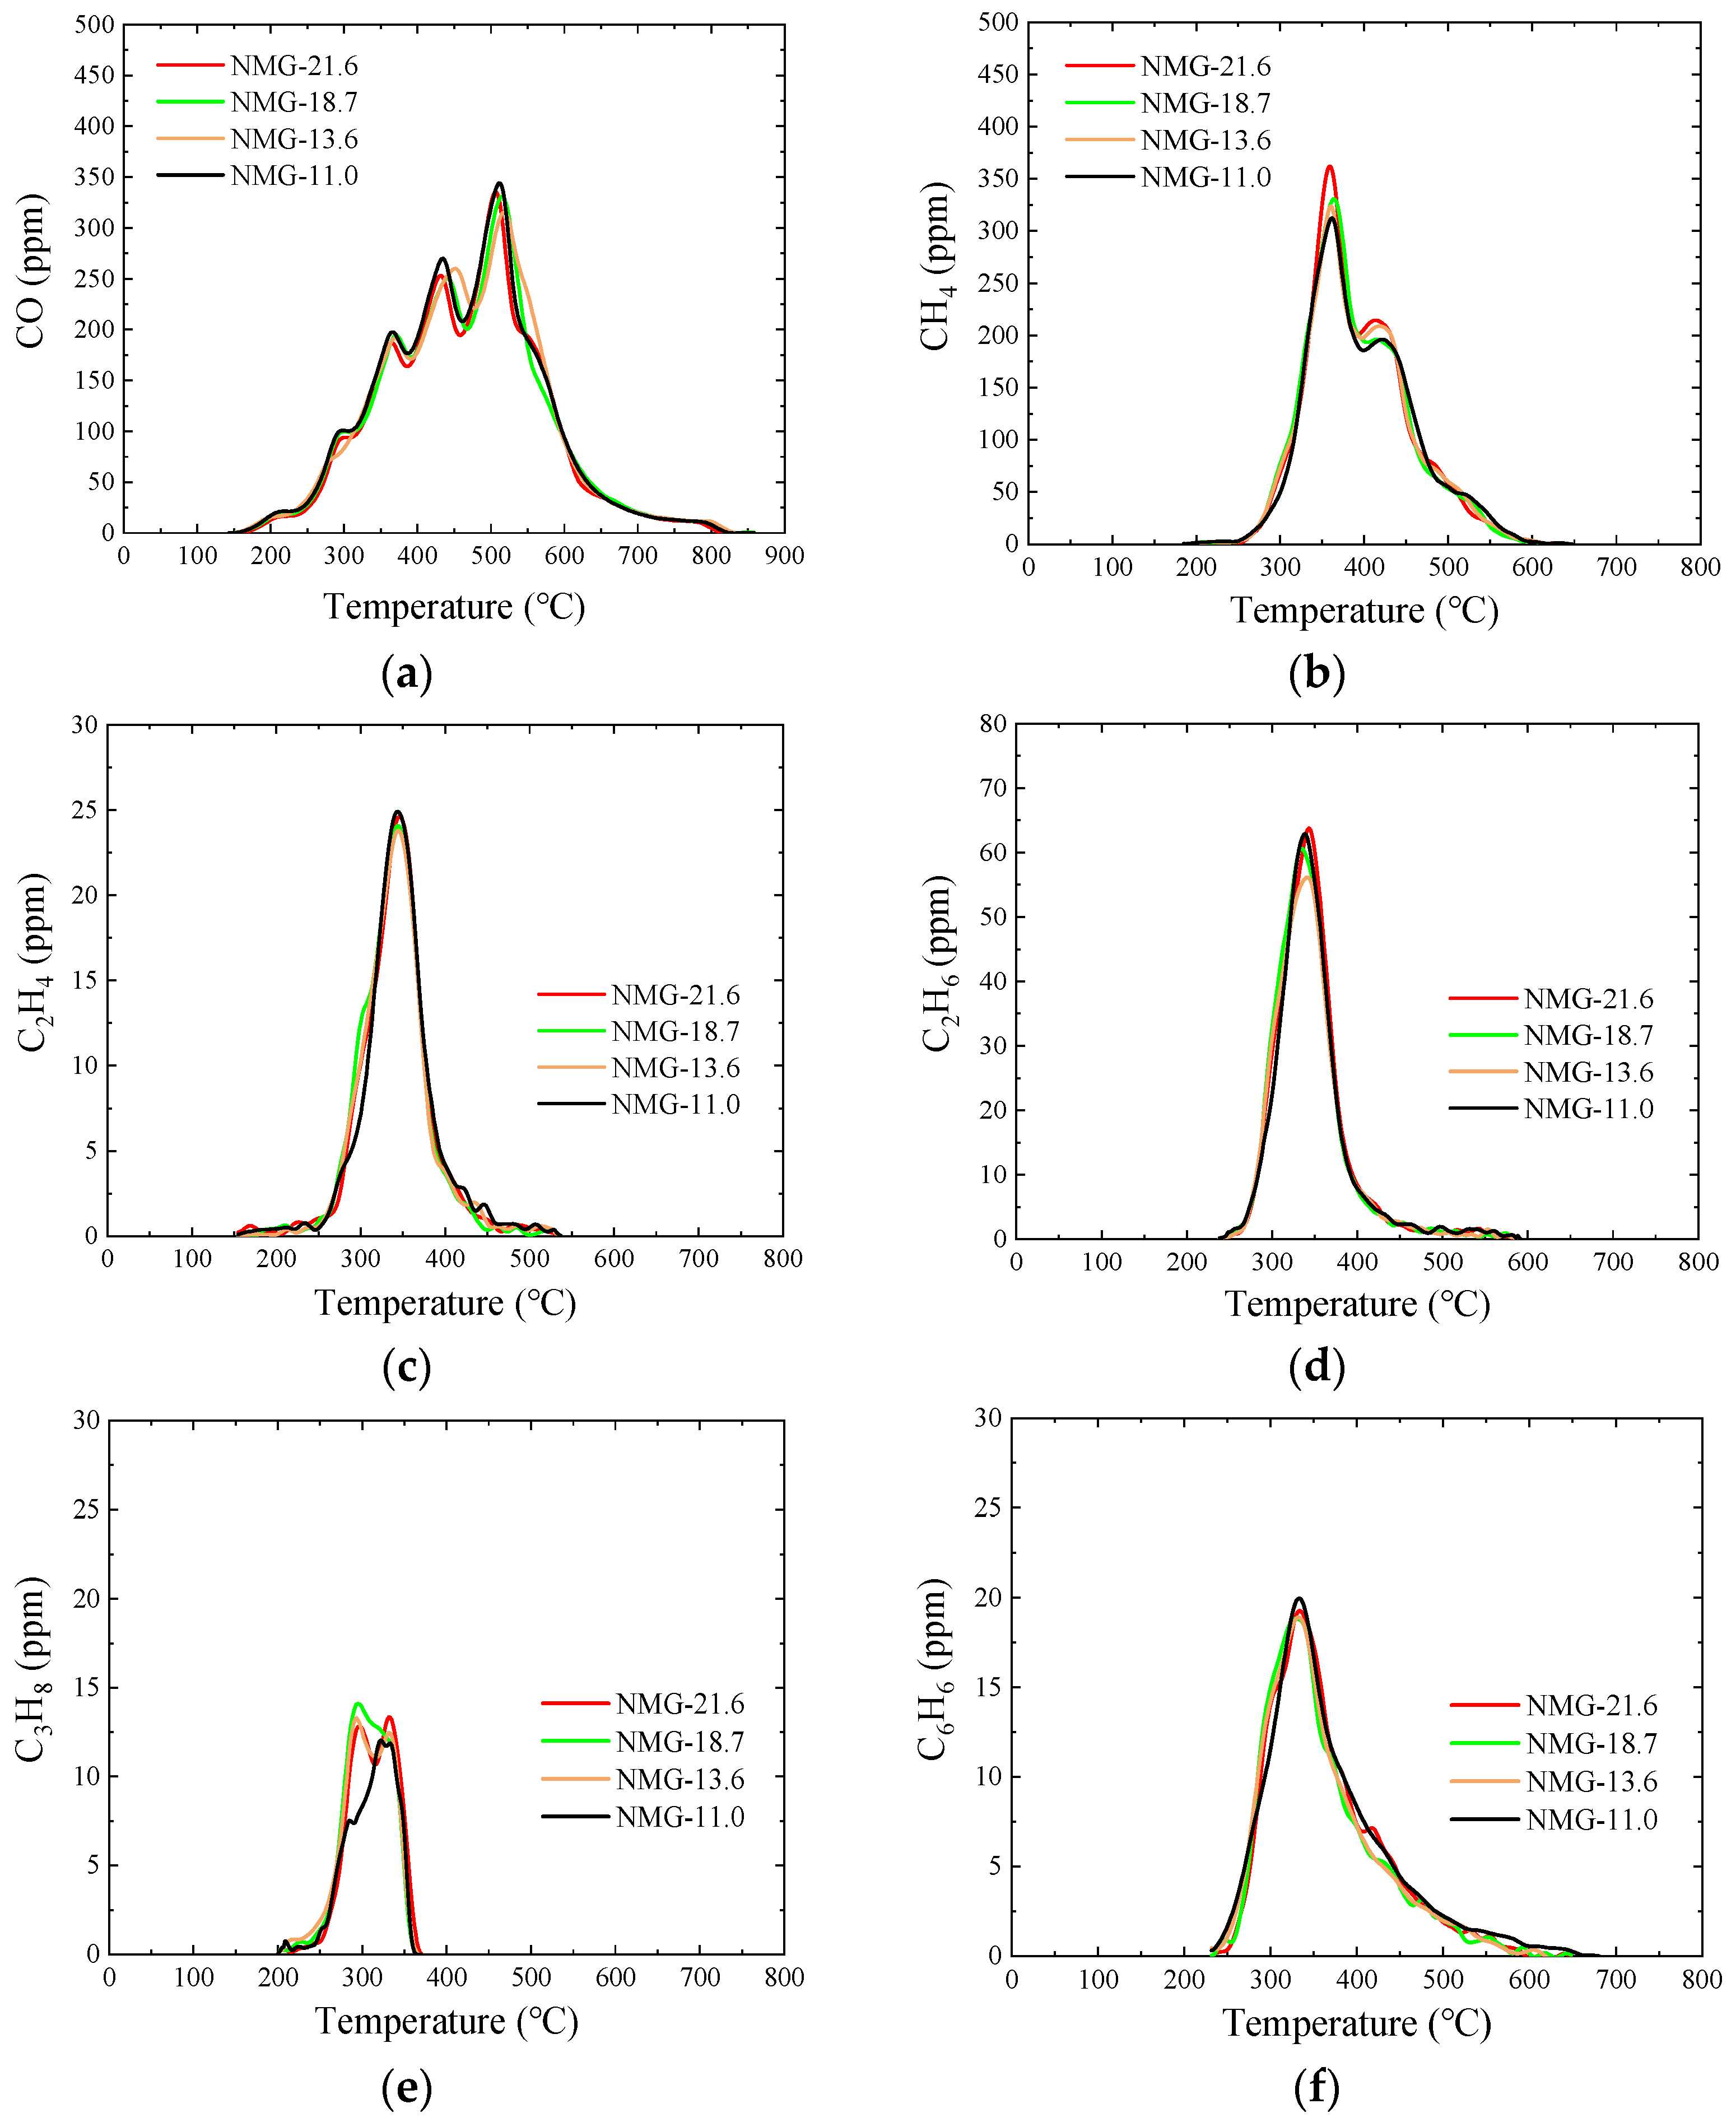
The TG-DTG curves of NMG raw and modified coal samples between 150 and 400 °C are depicted in Figure 6. In this stage, the TG curves of NMG–gy5 demonstrate a noticeable downward trend, while the curves in the other three groups are flat. From 150 to 300 °C, on the one hand, part of the carbon chain structure in coal breaks and oxidizes, resulting in a reduction in weight; on the other hand, the active sites in the coal structure continuously combine with the oxygen in the air, leading to an increase in the mass. The two trends are balanced; therefore, flat curves appear. In NMG–gy5 samples, O-containing functional groups are introduced, which is essentially part of the oxidation process. It reduces the active sites for the chemical adsorption of oxygen. In addition, carboxyl functional groups have a low thermal stability [29] and are able to decompose below 200 °C [17]. The trend of weight gain disappears. TG curves demonstrate a continuous decreasing tendency in this temperature segment.
The TG-DTG curves of HN raw and modified coal samples between 150 and 550 °C are demonstrated in Figure 7. Between 150 and 400 °C, compared to NMG samples, the chemical oxygen adsorption is much more evident in HN raw samples, as well as HN–s5 and s1 modified groups. As illustrated in Figure 7d, the DTG values of HN–gy5 samples gradually grow in the low temperature stage as the particle sizes decrease, which is also consistent with the conclusions of the NMG samples.
Based on the calculation method used in the existing research [30], the ignition temperatures of raw and peracetic-acid-modified samples are listed in Table 4. After peracetic acid modification, the ignition temperatures of the HN samples are lowered by more than 20 °C. Both superfine pulverization and peracetic acid modification can lower ignition temperatures. Additionally, the effect of this is much more obvious in the case of anthracite.
In brief, due to the introduction of carboxyl and other O-containing functional groups, in the low temperature range, the weight loss of the peracetic-acid-modified samples is accelerated, which implies that the combustion characteristic in this temperature zone is promoted. For anthracite, there is an ideal synergistic effect between peracetic acid modification and superfine pulverization.

3.5. Pyrolysis Gas

In this research, the formation of representative volatiles, namely CO, CH4, C2H2, C2H6, C3H8, and C6H6, is discussed and analyzed in detail.

3.5.1. NMG Raw Samples

The volatile formation curves of NMG raw samples in an Ar atmosphere are shown in Figure 8. The CO formation reaction is closely related to the O-containing groups in coal [17]. The orders of the thermal stability of the O-containing structures from low to high are -OCH3, carboxyl, carbonyl, heterocycle, and hydroxyl groups [31]. As shown in Figure 8a, there are three evident peaks in the CO formation curves, which can be attributed to the pyrolysis of -OCH3, along with carboxyl (below 350 °C), carbonyl (about 450 °C), and an O-containing heterocyclic ring (about 550 °C), respectively. There are also transformation channels among the O-containing structures. Carboxyl functional groups can be converted to carbonyl groups [31]; O-containing heterocycles can be formed through the polycondensation of the carbon skeleton [7]. The temperature range of CO formation is wide, covering all three stages of coal pyrolysis from 200 to 800 °C.
CH4, C2H4, C2H6, and C3H8 are light hydrocarbons, which mainly result from the fracture of aliphatic chains in coal [32]. As shown in Figure 8b–e, there are generation peaks around 340 °C in all four kinds of light hydrocarbons. This indicates that around this temperature, a large number of aliphatic side chains are broken. The formation of methane is closely associated with methyl groups. To be specific, it includes the fracture of an aliphatic C-O structure, the breaking of short aliphatic chains, the secondary cracking of a long-chain aliphatic structure, the rupture of methyl groups directly bonded with the aromatic nucleus, and the aromatization of aliphatic structures [33]. There is also a peak in the curve of methane near 430 °C, which arises from the secondary cracking of aliphatic side chains [34]. Except for methane, the other three kinds of light hydrocarbons no longer form over 550 °C, which implies that pyrolysis has entered a stage dominated by condensation polymerization. As shown in Figure 8f, the formation process of C6H6 largely finishes at 600 °C. At a lower temperature, most benzene and polycyclic aromatic hydrocarbons stem from the depolymerization of a coal macromolecular structure [35]. The formation curve of C6H6 reaches its peak at 340 °C, which is consistent with the other four kinds of light hydrocarbons. This suggests that the depolymerization of carbon skeleton and the cleavage of aliphatic side chains advance rapidly around this temperature.

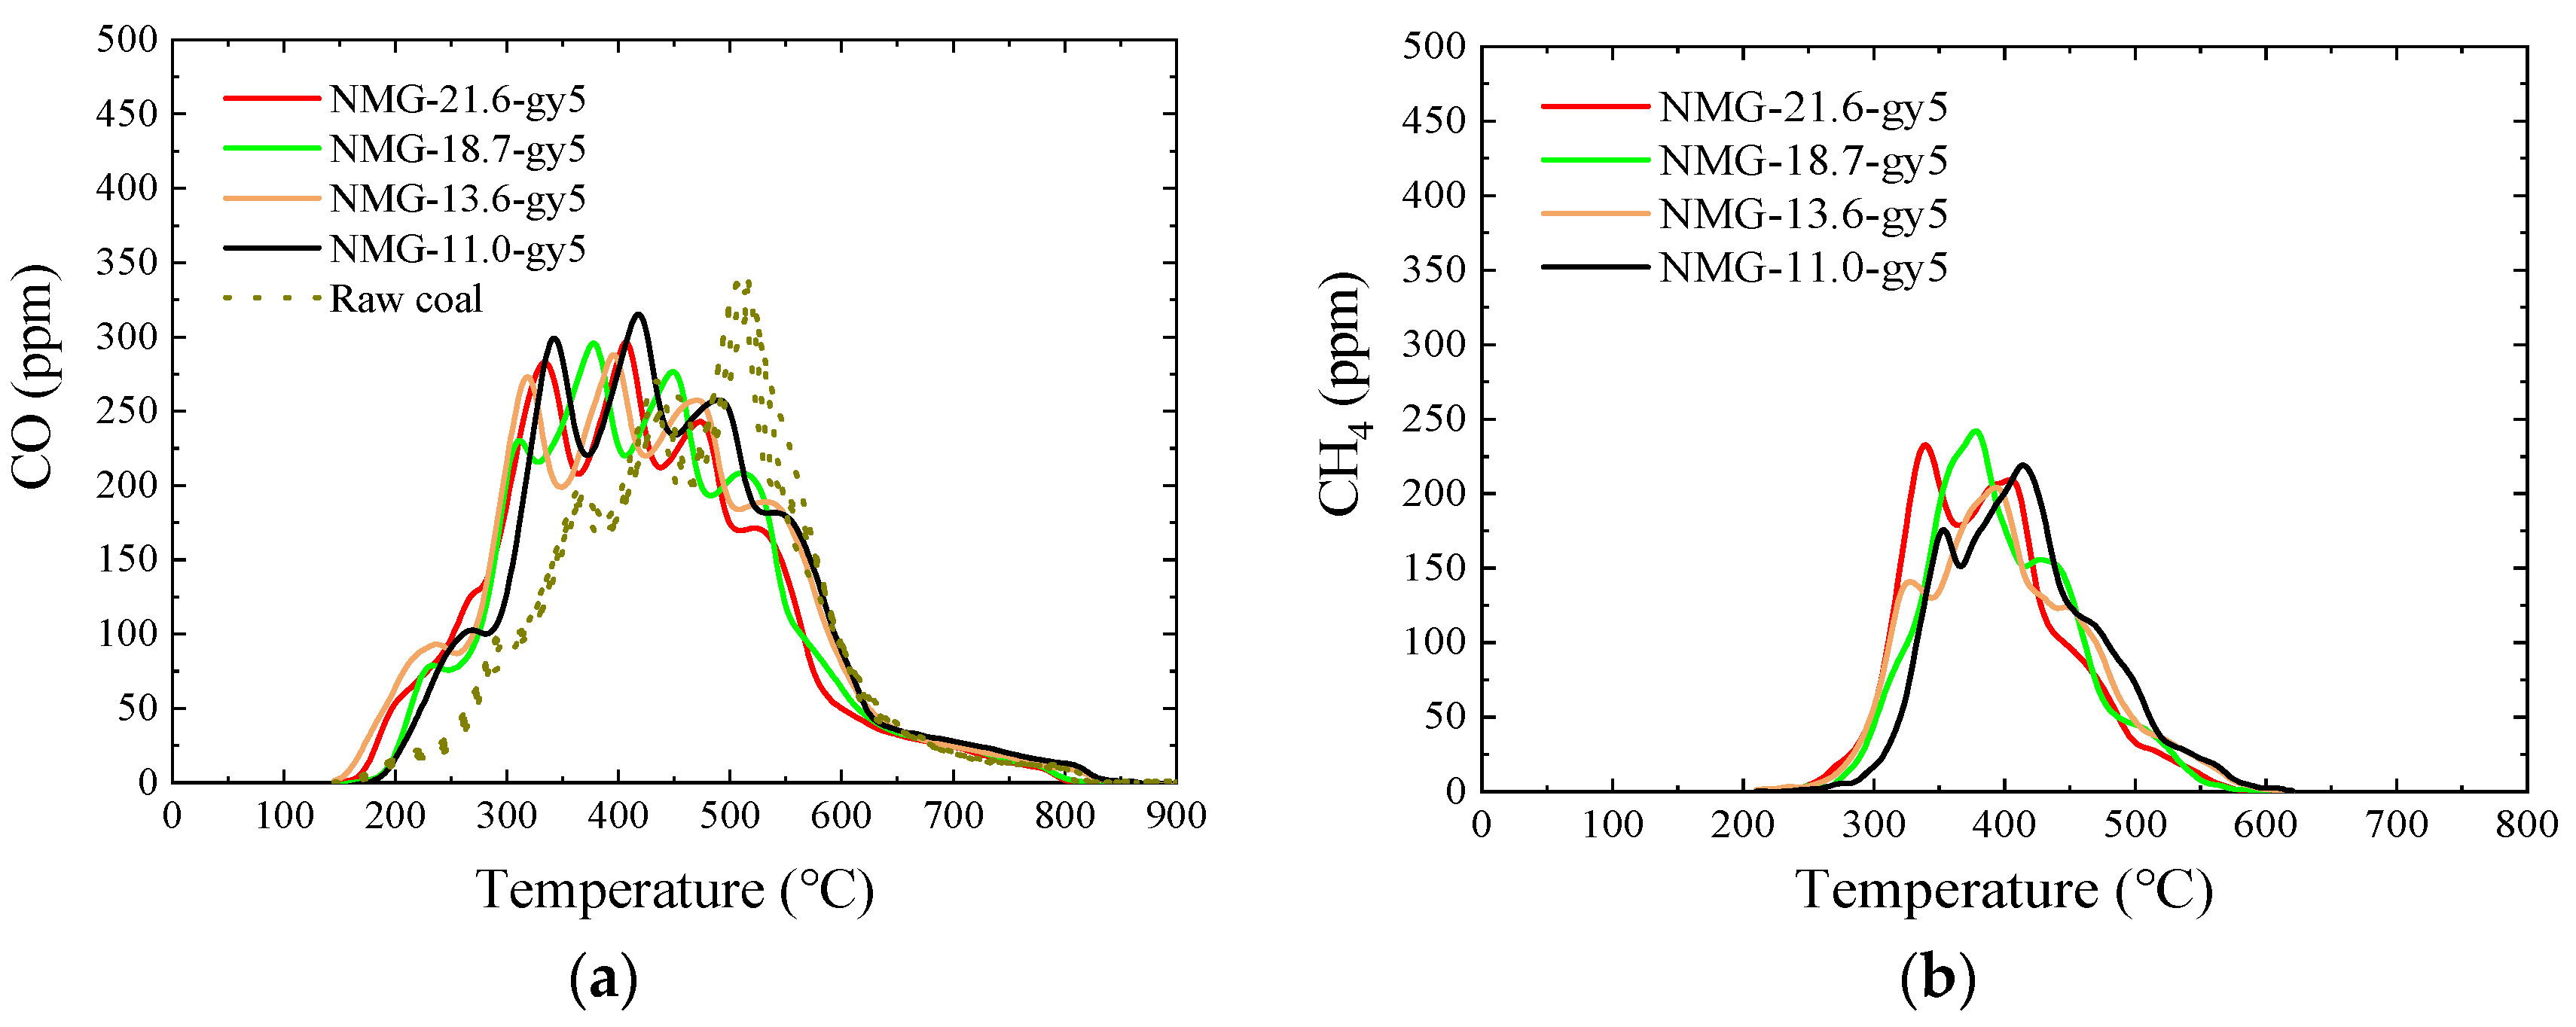
3.5.2. NMG–gy5 Samples

Pyrolysis gas formation curves of NMG–gy5 are demonstrated in Figure 9. The amount of gas production is integrated for a further analysis. Due to the emergence of new peaks, the generation curves of raw samples have been added in Figure 9a,f for comparison. Compared with the raw samples, the overall CO formation temperature of the NMG–gy5 samples is lower. Additionally, the generation amount increases between 5.12 and 15.50%. After peracetic acid modification, carboxyl functional groups are introduced. These structures will decompose into CO, CO2, and H2O when over 200 °C [32]. Hence, the initial releasing temperature of CO is lowered. As shown in Figure 9g, the release of CO2 is also clearly detected in NMG–gy5 groups due to the introduction of carboxyl groups [11], while there is no explicit CO2 signal in raw samples. Former investigations prove that CO2 derives from the decomposition of carboxyl groups and carboxylic acid at low temperatures and is related to the thermal decomposition of ethers, quinones, and O-containing heterocycles at high temperatures [36]. In addition, the position of the carboxyl group in the coal matrix and the surrounding functional groups can determine the integral thermal stability [6], which explains the overall CO generation curve moving to the low temperature section. Additionally, all the temperatures of the CO releasing peaks reduced by about 50 °C.
Compared to raw samples, the amount of CH4, C2H4, and C2H6 decreases (Figure 9b–d), while the amount of C3H8 shows an upward trend in Figure 9e. Modified by peracetic acid, aliphatic side chains and ether bonds in coal are ruptured, and part of the carboxyl groups are introduced to the end of alkyl side chains. With the temperature increasing, C atoms near and in carboxyl groups tend to be released as CO or CO2, which inhibits the transformation from alkyl side chains to CH4 and C2 substances. Additionally, from the analysis detailed in Section 3.2.1, a part of the methyl groups in the coal matrix is transformed due to the oxidation of peracetic acid, which can also cause the formation amount of CH4 to decrease. In Figure 9c, there is a double peak structure in the formation curve. The first peak accounts for 21.60 to 30.84% of the total amount, and the initial formation temperature is around 200 °C, which strongly proves that reaction paths are indeed changed by the introduced carboxyl groups. Simultaneously, parts of long side chains are inclined to separate from aromatic structures integrally and are converted to C3H8 and other hydrocarbons.
As depicted in Figure 9f, the initial formation temperatures of C6H6 decrease markedly. Compared with raw samples, a new curve appears in the range between 200 and 250 °C, which is consistent with the temperature range of the first peak in C2H4 curves. Additionally, the total yield of C6H6 rises between 3.67 and 12.41%. Peracetic acid breaks the O-substituted aromatic structures in carbon skeletons. Additionally, parts of the aromatic structures undergo depolymerization. Consequently, this lowers the initial formation temperature and augments the formation amount of C6H6. The release of CO, CO2, C2H4, and C6H6 at low temperature is consistent with the thermogravimetric results.
The pyrolysis gas of NMG–s5 and s1 samples is analyzed in the Supplementary Materials. Generally speaking, there is no fundamental change in the gas generation paths compared with the raw samples.

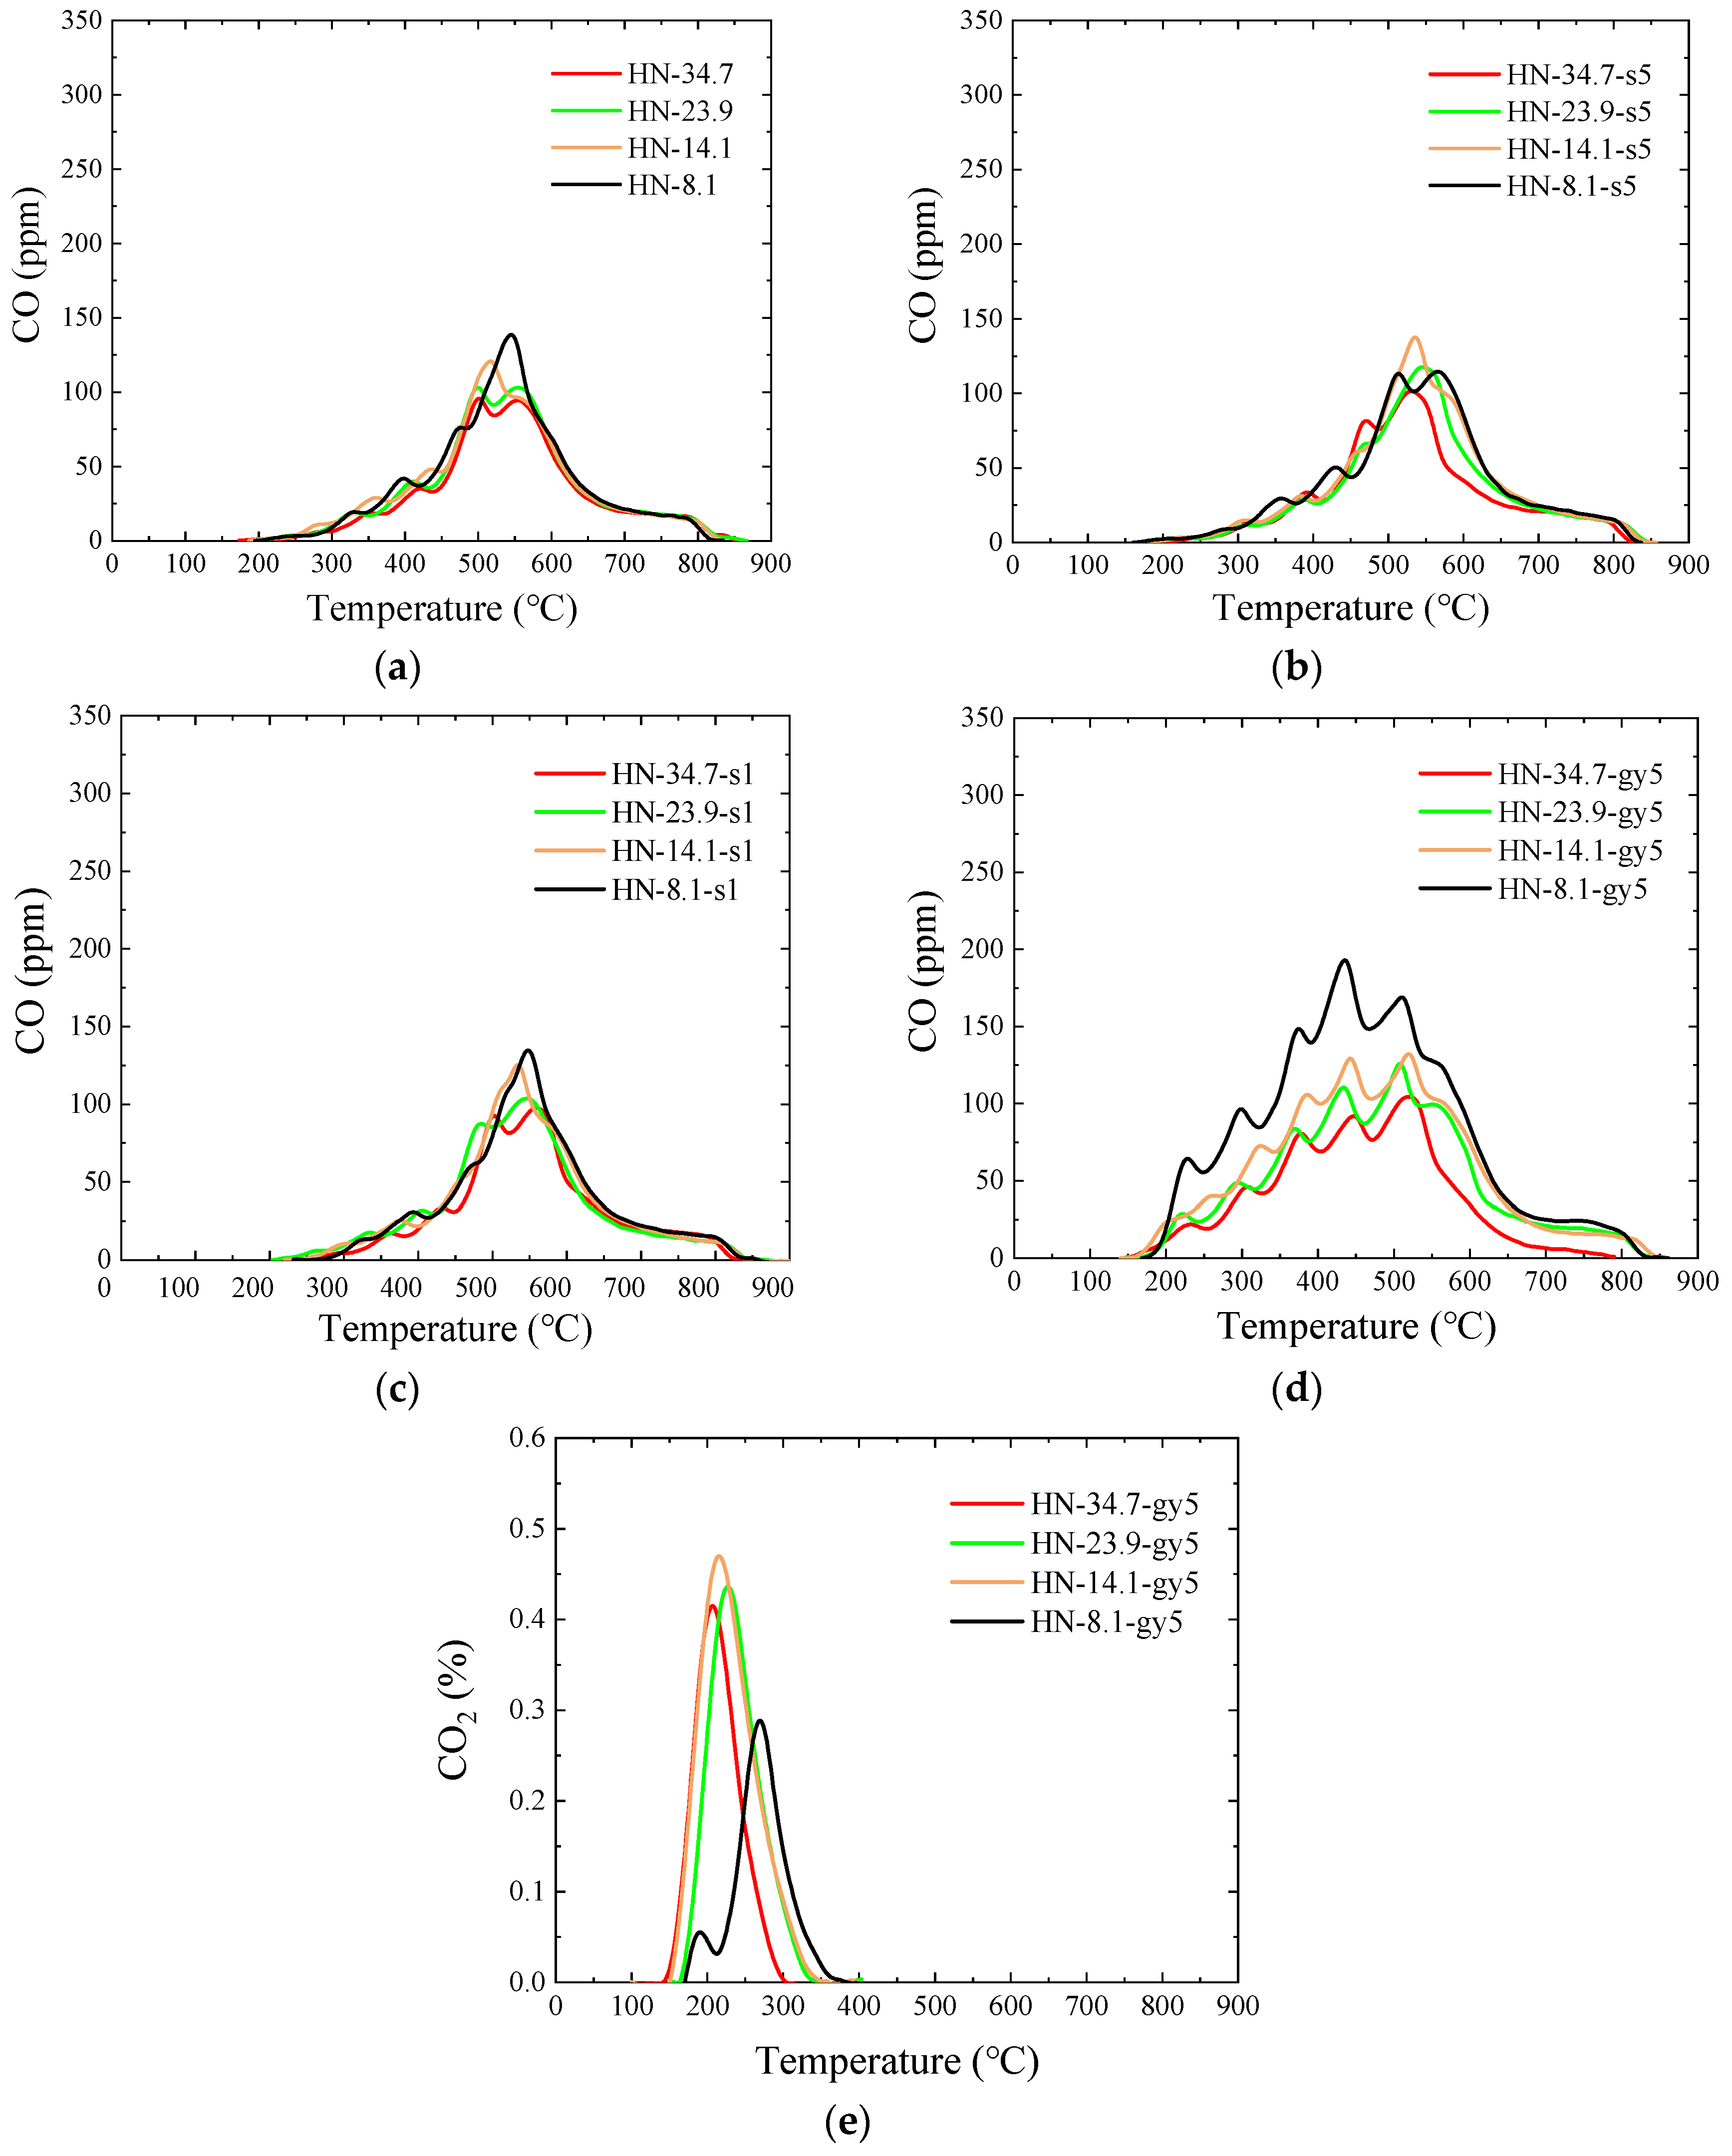
3.5.3. HN Raw and Modified Samples

CO and CO2 formation curves of the HN raw and modified samples are demonstrated in Figure 10. Due to the more orderly structure, HN anthracite has an exceptionally low reactivity. During pyrolysis, the content of C2 and other complex hydrocarbons in volatile is so small that no clear signal can be acquired. Hence, only the content of CO and CO2 is discussed.
As demonstrated in Figure 10a–c, the CO curves of HN–s5 and HN–s1 are generally the same as raw samples, proving that no O-containing structures are introduced, which is consistent with the conclusion of NMG–s5 and NMG–s1.
As illustrated in Figure 10d, the CO yield of HN–gy5 samples is higher than that of raw samples. Additionally, the initial formation temperatures turn lower. Additionally, the formation amount of CO has a synergistic effect with particle sizes. As the particle size becomes smaller, the content of carboxyl functional groups rises gradually in the HN–gy5 group. Accordingly, compared with HN–34.7–gy5, the CO production of HN–23.9–gy5, HN–14.1–gy5, and HN–8.1–gy5 grows by 33.80, 53.37, and 109.60%, respectively. In Figure 10e, there are also clear CO2 generation curves in the HN–gy5 group, mainly deriving from the pyrolysis of carboxyl functional groups, which is consistent with the experimental results of NMG–gy5 as well.
In short, after the modification of peracetic acid, the commencing temperature of pyrolysis decreases; the CO generation amount increases; and coal macromolecules break more thoroughly. Based on a previous study [37], these characteristics, along with superfine pulverization, may have the possibility to make the modified samples an ideal reburning fuel.

4. Conclusions

The following conclusions have been obtained through this research:
  • Peracetic acid of 5 wt% can introduce O-containing functional groups, such as a carboxyl groups and alcoholic hydroxyl groups, into the carbon molecular chain of coal, while 1 and 5 wt% H2O2 have no such effects.
  • The introduced O-containing functional groups reduce the binding sites with oxygen in coal and accelerate combustion. During the thermogravimetric test in the air atmosphere, weight gain disappears at temperatures below 400 °C, and the ignition temperature decreases.
  • After peracetic acid modification, the carboxyl functional groups introduced into the coal increase the amount of CO generated in the pyrolysis process. Additionally, the commencing temperatures of CO are lowered by about 50 °C. In addition, the formation pathways and amounts of C2H4 and C6H6 have changed. After modification, a new generation peak appears at a low temperature. Due to the introduction of the carboxyl group, a CO2 generation curve appears distinctly in the pyrolysis process of peracetic-acid-modified samples.
  • A 1 wt% H2O2 solution can expand the pore structure and increase the specific surface area of the coal powder by a small margin; however, these changes essentially cannot alter the generation path of pyrolysis products. Additionally, the influence of a variation in the pore structure on the pyrolysis products is far less than the introduced O-containing functional groups.
  • The superfine pulverized coal has a synergistic effect on the modification of peracetic acid. More O-containing functional groups are introduced as the particle sizes become smaller. For anthracite, this phenomenon is more obvious.

Supplementary Materials

The following supporting information can be downloaded at: https://www.mdpi.com/article/10.3390/en16114418/s1, the analysis of the pyrolysis gas of NMG–s5 and s1 samples.

Author Contributions

Experiments, data analysis, writing, editing, Y.M.; editing, review, Y.G.; funding acquisition, X.J. All authors have read and agreed to the published version of the manuscript.

Funding

This research was funded by the Natural Science Foundation of China (51776123).

Data Availability Statement

The data presented in this study are available upon request from the corresponding author.

Acknowledgments

All the authors express sincere thanks to the editors for their enthusiasm, patience, and tireless efforts. The authors thank the reviewers for their constructive suggestions on how to improve the paper.

Conflicts of Interest

The authors declare no conflict of interest.

References

  1. Li, X.; Zheng, M.; Ren, C.; Guo, L. ReaxFF molecular dynamics simulations of thermal reactivity of various fuels in pyrolysis and combustion. Energy Fuels 2021, 35, 11707–11739. [Google Scholar] [CrossRef]
  2. Zou, C.; Li, X.; Ren, M.; Wang, W.; Wu, H. Thermal behavior and kinetics of Shenmu coal pyrolyzed under hydrogen-rich or methane-gas-rich atmosphere. Energies 2023, 16, 2339. [Google Scholar] [CrossRef]
  3. Feng, G.; Cui, J.; Niu, X.; Liao, J.; Li, W.; Bai, Z.; Han, Y. Effect of O-containing functional groups and meso- and micropores on content and re-adsorption behavior of water in upgraded brown coal. Fuel 2019, 257, 116100. [Google Scholar] [CrossRef]
  4. Wan, H.; Hu, X.; Luukkanen, S.; Qu, J.; Zhang, C.; Xue, J.; Li, H.; Yang, W.; Yang, S.; Bu, X. Effect of the oxygen-containing functional group on the adsorption of hydrocarbon oily collectors on coal surfaces. Physicochem. Probl. Miner. Process. 2022, 58, 149937. [Google Scholar] [CrossRef]
  5. Wang, J.; Du, J.; Chang, L.; Xie, K. Study on the structure and pyrolysis characteristics of Chinese western coals. Fuel Process. Technol. 2010, 91, 430–433. [Google Scholar] [CrossRef]
  6. Zhou, Y.; Li, L.; Jin, L.; Zhu, J.; Li, J.; Li, Y.; Fan, H.; Hu, H. Effect of functional groups on volatile evolution in coal pyrolysis process with in situ pyrolysis photoionization time-of-flight mass spectrometry. Fuel 2020, 260, 116322. [Google Scholar] [CrossRef]
  7. Zhao, R.; Wu, Y.; Huang, S.; Wu, S.; Gao, J. Effect of decomposition of oxygen-containing structures on the conversion of lignite in the presence of hydrogen donor solvent. J. Anal. Appl. Pyrolysis 2020, 145, 104743. [Google Scholar] [CrossRef]
  8. Zhu, Y.; Guo, Y.; Teng, H.; Liu, J.; Tian, F.; Cui, L.; Li, W.; Liu, J.; Wang, C.; Li, D. Analysis of oxygen-containing species in coal tar by comprehensive two-dimensional GC×GC-TOF and ESI FT-ICR mass spectrometry through a new subfraction separation method. J. Energy Inst. 2022, 101, 209–220. [Google Scholar] [CrossRef]
  9. Gao, H.; Zong, Z.; Li, J.; Wei, X.; Guo, Q.; Zhao, T.; Bai, H. Characterization of oxygen-containing aromatics in a low-temperature coal tar. Energy Fuels 2021, 35, 283–289. [Google Scholar] [CrossRef]
  10. Qin, X.; Yang, T.; Liu, Z.; Liu, Q. Molecular structure, bond cleavage and their relation of four low rank coals. Fuel Process. Technol. 2022, 236, 107391. [Google Scholar] [CrossRef]
  11. Li, J.; Li, Z.; Yang, Y.; Wang, C. Study on oxidation and gas release of active sites after low-temperature pyrolysis of coal. Fuel 2018, 233, 237–246. [Google Scholar] [CrossRef]
  12. Zhao, D.; Liu, H.; Zhu, D.; Qin, M. Effect of O-containing functional groups produced by preoxidation on Zhundong coal gasification. Fuel Process. Technol. 2020, 206, 06480. [Google Scholar] [CrossRef]
  13. Xu, J.; Tang, H.; Su, S.; Liu, J.; Xu, K.; Qian, K.; Wang, Y.; Zhou, Y.; Hu, S.; Zhang, A.; et al. A study of the relationships between coal structures and combustion characteristics: The insights from micro-Raman spectroscopy based on 32 kinds of Chinese coals. Appl. Energy 2018, 212, 46–56. [Google Scholar] [CrossRef]
  14. Wang, Z.; Zhao, Y.; Sun, R.; Li, Y.; Ren, X.; Xu, J. Effect of reaction conditions on the evolution of surface functional groups in O2/H2O combustion process of demineralized coal char. Fuel Process. Technol. 2019, 195, 106144. [Google Scholar] [CrossRef]
  15. Mochizuki, Y.; Naganuma, R.; Tsubouchi, N. Influence of inherently present oxygen-functional groups on coal fluidity and coke strength. Energy Fuels 2018, 32, 1657–1664. [Google Scholar] [CrossRef]
  16. Zhang, L.; Han, Y.; Xu, D.; Jiang, Q.; Xin, H.; Fu, C.; He, W. Study on the reaction path of -CH3 and -CHO functional groups during coal spontaneous combustion: Quantum chemistry and experimental research. Energies 2022, 15, 4891. [Google Scholar] [CrossRef]
  17. Shen, J.; Liu, J.; Xing, Y.; Zhang, H.; Luo, L.; Jiang, X. Application of TG-FTIR analysis to superfine pulverized coal. J. Anal. Appl. Pyrolysis 2018, 133, 154–161. [Google Scholar] [CrossRef]
  18. Luo, L.; Yao, W.; Liu, J.; Zhang, H.; Ma, J.; Jiang, X. The effect of the grinding process on pore structures, functional groups and release characteristic of flash pyrolysis of superfine pulverized coal. Fuel 2019, 235, 1337–1346. [Google Scholar] [CrossRef]
  19. Yao, Q.; Ma, M.; Liu, Y.; Ma, D.; Chen, H.; Hao, Q.; Sun, M.; Ma, X. The structural and pyrolysis characteristics of vitrinite and inertinite from Shendong coal and the gasification performance of chars. J. Anal. Appl. Pyrolysis 2022, 164, 105519. [Google Scholar] [CrossRef]
  20. Kim, D.; Yoshikawa, K.; Park, K. Characteristics of biochar obtained by hydrothermal carbonization of cellulose for renewable energy. Energies 2015, 8, 14040–14048. [Google Scholar] [CrossRef]
  21. Chen, S.; Tang, L.; Tao, X.; Chen, L.; Yang, Z.; Li, L. Effect of oxidation processing on the surface properties and floatability of Meizhiyou long-flame coal. Fuel 2017, 210, 177–186. [Google Scholar] [CrossRef]
  22. Sun, W.; Bai, L.; Chi, M.; Xu, X.; Chen, Z.; Yu, K. Study on the evolution pattern of the aromatics of lignin during hydrothermal carbonization. Energies 2023, 16, 1089. [Google Scholar] [CrossRef]
  23. Yu, J.; Jiang, Y.; Tahmasebi, A.; Han, Y.; Li, X.; Lucas, J.; Wall, T. Coal oxidation under mild conditions: Current status and applications. Chem. Eng. Technol. 2014, 37, 1635–1644. [Google Scholar] [CrossRef]
  24. Mae, K.; Maki, T.; Araki, J.; Miura, K. Extraction of low-rank coals oxidized with hydrogen peroxide in conventionally used solvents at room temperature. Energy Fuels 1997, 11, 825–831. [Google Scholar] [CrossRef]
  25. Liu, F.; Wei, X.; Zhu, Y.; Wang, Y.; Li, P.; Fan, X.; Zhao, Y.; Zong, Z.; Zhao, W.; Wei, Y. Oxidation of Shengli lignite with aqueous sodium hypochlorite promoted by pretreatment with aqueous hydrogen peroxide. Fuel 2013, 11, 211–215. [Google Scholar] [CrossRef]
  26. Sun, S.; Xu, D.; Wei, Y.; Zhi, Y.; Jiang, G.; Guo, Y. Influence laws of operating parameters on coal pyrolysis characteristics. J. Anal. Appl. Pyrolysis 2022, 167, 105684. [Google Scholar] [CrossRef]
  27. Pechacek, N.; Osorio, M.; Caudill, J.; Peterson, B. Evaluation of the toxicity data for peracetic acid in deriving occupational exposure limits: A minireview. Toxicol. Lett. 2015, 233, 45–57. [Google Scholar] [CrossRef]
  28. Jiao, A.; Tian, S.; Lin, H. Analysis of outburst coal structure characteristics in Sanjia coal mine based on FTIR and XRD. Energies 2022, 15, 1956. [Google Scholar] [CrossRef]
  29. Xiong, G.; Li, Y.; Jin, L.; Hu, H. In situ FT-IR spectroscopic studies on thermal decomposition of the weak covalent bonds of brown coal. J. Anal. Appl. Pyrolysis 2015, 115, 262–267. [Google Scholar] [CrossRef]
  30. Benfell, K.; Beamish, B.; Rodgers, K. Thermogravimetric analytical procedures for characterizing New Zealand and eastern Australian coals. Thermochim. Acta 1996, 286, 67–74. [Google Scholar] [CrossRef]
  31. Cui, X.; Li, X.; Li, Y.; Li, S. Evolution mechanism of oxygen functional groups during pyrolysis of Datong coal. J. Therm. Anal. Calorim. 2017, 129, 1169–1180. [Google Scholar] [CrossRef]
  32. Lin, X.; Luo, M.; Li, S.; Yang, Y.; Chen, X.; Tian, B.; Wang, Y. The evolutionary route of coal matrix during integrated cascade pyrolysis of a typical low-rank coal. Appl. Energy 2017, 199, 335–346. [Google Scholar] [CrossRef]
  33. Niu, Z.; Liu, G.; Yin, H.; Zhou, C.; Wu, D.; Tan, F. A comparative study on thermal behavior of functional groups in coals with different ranks during low temperature pyrolysis. J. Anal. Appl. Pyrolysis 2021, 158, 105258. [Google Scholar] [CrossRef]
  34. Arenillas, A.; Rubiera, F.; Pis, J.J. Simultaneous thermogravimetric–mass spectrometric study on the pyrolysis behaviour of different rank coals. J. Anal. Appl. Pyrolysis 1999, 50, 31–46. [Google Scholar] [CrossRef]
  35. Shi, Z.; Jin, L.; Zhou, Y.; Li, Y.; Hu, H. Online analysis of initial volatile products of Shenhua coal and its macerals with pyrolysis vacuum ultraviolet photoionization mass spectrometry. Fuel Process. Technol. 2017, 163, 67–74. [Google Scholar] [CrossRef]
  36. Li, G.; Zhang, S.; Jin, L.; Tang, Z.; Hu, H. In situ analysis of volatile products from lignite pyrolysis with pyrolysis-vacuum ultraviolet photoionization and electron impact mass spectrometry. Fuel Process. Technol. 2015, 133, 232–236. [Google Scholar] [CrossRef]
  37. Ma, Y.; Yan, M.; Jiang, X. Nitrogenous gas formation mechanisms of chemically modified superfine pulverized coal during pyrolysis. Energy Sources Part A 2022, 44, 3544–3554. [Google Scholar] [CrossRef]
Figure 1. Variations in the mass and particle sizes after modification. (a) Mass variation. (b) Particle sizes variation.
Energies 16 04418 g001
Figure 2. 13C-NMR spectra of NMG raw and modified samples. (a) Raw coal samples. (b) NMG–s5. (c) NMG–s1. (d) NMG–gy5.
Energies 16 04418 g002
Figure 3. 13C-NMR spectra of HN raw and modified samples. (a) Raw coal samples (b) HN–s5. (c) HN–s1. (d) HN–gy5.
Energies 16 04418 g003
Figure 4. In situ FTIR spectra of NMG coal samples. (a) NMG−21.6. (b) NMG−18.7. (c) NMG−13.6. (d) NMG−21.6−gy5. (e) NMG−18.7−gy5. (f) NMG−13.6−gy5.
Energies 16 04418 g004
Figure 5. BET specific surface area of NMG samples. (a) NMG. (b) HN.
Energies 16 04418 g005
Figure 6. TG-DTG curves of NMG raw and chemically modified samples. (a) NMG raw samples. (b) NMG−s5. (c) NMG−s1. (d) NMG−gy5.
Energies 16 04418 g006
Figure 7. TG-DTG curves of HN raw and chemically modified samples. (a) HN raw samples. (b) HN−s5. (c) HN−s1. (d) HN−gy5.
Energies 16 04418 g007aEnergies 16 04418 g007b
Figure 8. The gas formation of NMG raw samples during pyrolysis. (a) CO. (b) CH4. (c) C2H4. (d) C2H6. (e) C3H8. (f) C6H6.
Energies 16 04418 g008
Figure 9. The gas formation of NMG–gy5 samples during pyrolysis. (a) CO. (b) CH4. (c) C2H4. (d) C2H6. (e) C3H8. (f) C6H6. (g) CO2.
Energies 16 04418 g009aEnergies 16 04418 g009b
Figure 10. The gas formation of HN raw and modified samples during pyrolysis. (a) HN raw samples CO. (b) HN-s5 CO. (c) HN-s1 CO. (d) HN-gy5 CO. (e) HN-gy5 CO2.
Energies 16 04418 g010
Table 1. Ultimate and proximate analysis of NMG bituminous coal samples.
Proximate Analysis (wt%)Ultimate Analysis (wt%)
Particle Sizes
D50 (µm)
MarFCarVarAarCdafHdafOdafNdafSdaf
11.06.556.231.06.372.64.721.40.90.4
13.68.356.430.25.173.34.720.70.90.4
18.78.156.629.55.872.44.721.60.90.4
21.68.956.229.675.372.84.621.30.90.4
Table 2. Ultimate and proximate analysis of HN anthracite coal samples.
Proximate Analysis (wt%) Ultimate Analysis (wt%)
Particle
Sizes
D50 (µm)
MarFCarVarAarCdafHdafOdafNdafSdaf
8.11.575.69.413.588.53.85.91.40.4
14.12.375.79.112.988.43.95.91.40.4
23.92.576.68.312.688.94.05.31.40.4
34.72.876.28.512.589.03.75.51.40.4
Table 3. The specifications and manufacturers of the reagents.
ReagentsSpecificationsConcentrationTabs
1Hydrogen peroxideAR solution (30 wt%)5 wt%s5
21 wt%s1
3Peracetic acidAR solution (20 wt%)1 wt%gy5
Table 4. The ignition temperature of four samples.
Ignition Temperature (°C)21.6 (μm)18.7 (μm)13.6 (μm)11.0 (μm)
NMG–raw samples271.3264.8262.3257.5
NMG–gy5264.9258.5254.5249.1
HN–raw samples345.5342.4339.1338.8
HN–gy5322.0317.1302.5297.9
Disclaimer/Publisher’s Note: The statements, opinions and data contained in all publications are solely those of the individual author(s) and contributor(s) and not of MDPI and/or the editor(s). MDPI and/or the editor(s) disclaim responsibility for any injury to people or property resulting from any ideas, methods, instructions or products referred to in the content.

