Article

Thermal-Mass and Microbiological Analysis of Forced Air Flow through the Stone Heat Accumulator Bed

by
Sławomir Kurpaska
1,
Katarzyna Wolny-Koładka
2,
Mateusz Malinowski
1,*,
Klaudia Tomaszek
3 and
Hubert Latała
1
1
Department of Bioprocess Engineering, Power Engineering and Automation, Faculty of Production and Power Engineering, University of Agriculture in Krakow, ul. Balicka 116b, 30-149 Krakow, Poland
2
Department of Microbiology and Biomonitoring, Faculty of Agriculture and Economics, University of Agriculture in Krakow, al. Mickiewicza 24/28, 30-059 Krakow, Poland
3
Department of Mechanical Engineering and Agrophysics, Faculty of Production and Power Engineering, University of Agriculture in Krakow, ul. Balicka 116b, 30-149 Krakow, Poland
*
Author to whom correspondence should be addressed.
Energies 2023, 16(11), 4456; https://doi.org/10.3390/en16114456
Submission received: 3 March 2023 / Revised: 14 May 2023 / Accepted: 28 May 2023 / Published: 31 May 2023

Abstract

:
Heat storage in systems integrated with renewable energy sources in facilities can reduce the consumption of fossil fuels, cut maintenance costs, and decrease greenhouse gas emissions from buildings and other objects. One of the possible solutions is the use of a stone heat accumulator for short-term heat storage and the use of this deposit in the ventilation process of the facility. During short-term air flow through the porous material from which an accumulator bed is made, there is an exchange of heat and mass between the flowing air and the bed particles. In the long term, the use of an accumulator can lead to an increase in dust and the development of pathogenic microorganisms, endangering human life and health. Therefore, understanding the factors influencing the efficient use of a stone deposit is very important. The aim of this study is to calculate the changes in thermal-mass parameters in the air flowing out of the stone accumulator and to assess the effect of long-term stone accumulator use on the content of microorganisms and dust concentration in bioaerosol. The application of the heat storage system in the stone bed leads to the formation of strictly controlled microclimatic conditions, and the tested air does not constitute a threat to the people staying in the object. The concentration standards of PM10 and PM2.5 exceeded the limit values (PM2.5 = 20 μg∙m−3 and PM10 = 40 μg∙m−3), and, thus, the air in the studied greenhouse was classified as polluted. The analysis also showed that, for the analyzed conditions, a 20% increase in the initial temperature of the accumulator bed results in a nearly 20% increase in the outlet air temperature.

1. Introduction

The primary goal of the circular economy (CE), a new economic model that is currently being implemented in all European Union (EU) countries, is to build and develop a sustainable, resource-efficient, low-carbon, and competitive economy [1]. This is achieved when products, materials, and resources (including energy) often included in the value function are kept as long as possible and energy consumption and waste generation are minimized. This objective is supported by the global trend to minimize the consumption of fossil fuels, increase the importance of environmentally friendly energy carriers, and, consequently, reduce the emission of hazardous substances to the environment [2]. Tripathi et al. [3] point out that harnessing the potential of renewable energy sources (RES) and energy storage in heat accumulator (HA) systems is becoming the need of the era, especially in countries characterized by a high share of thermal energy in the energy consumption structure, including for heating residential and production buildings (e.g., greenhouses). Households in all EU countries are the most important link in the process of improving energy efficiency [4,5]. For example, in Poland, more than 45% of the heat consumed in households (generated from the chemical energy of fossil fuels and wood) is used for heating buildings [6]. The heating needs include not only the heat transferred by the heating system but also the ventilation process of the building. Research conducted by Pater and Magiera [7] has shown that in a building with an area of approximately 200 m2 located in a climatic zone where a minimum temperature of −20 °C is assumed for calculations, approximately 35% of the total heat is consumed for ventilation during the heating season. Thus, the search for alternative sources of thermal energy supply to different types of facilities is one of the main challenges of CE implementation. This applies both to meeting the technological needs of the production process and to the municipal sector and includes energy conversion into heat and energy storage [8].
The implementation of integrated energy systems using RES and HA systems in industrial plants, agriculture, and utilities contributes to a significant reduction in greenhouse gas (GHG) emissions [9,10,11,12]. Sacharczuk and Taler [13], as well as Sarbu and Sebarchievici [14], indicate that HA systems, through their collaboration with solar collectors, are an important part of RES technology. Stanisz and Gomula [15] carried out a study on the efficiency of a heat pump where its lower source used a liquid accumulator, concluding that such a system configuration significantly improves system efficiency. At present, heat storage uses accumulators of three basic types [16,17]: sensible heat (water, soil, rocks), latent heat (stored based on phase change materials—heat of phase transition: solid—liquid), and thermochemical methods of heat storage (stores using chemical reactions: sorption storage, chemical reactions: synthesis, decomposition, hydration, and dehydration). In the field of storage effects, Mania and Kawa [18] presented the results of a centralized solar system from dozens of single-family buildings using garage roof-mounted flat plate solar collectors with a simultaneous Borehole Thermal Energy Storage (BTES) system, stating that this system (located in Canada) reduced heating and hot water demand by 90%. Jastrzębski and Saługa [10] simulated the use of a heat accumulator in a thermal power plant. Using the Monte Carlo method, they optimized the performance of the thermal storage systems already at the design stage of the installation, resulting in better and more efficient operations of the storage facilities. Similar studies, using solar radiation (concentric solar panels) and the effects of heat storage in a liquid accumulator along with the use of the resulting steam to drive electric turbines, were carried out by Ma et al. [19]. Krasnov et al. [20] conducted a study on the use of heat accumulators in passenger and freight transport for cooling the air inside the car, concluding that the integrated use of the analyzed system combined with stationary charging systems increases the energy efficiency of the entire transport system.
Heat storage and air preparation in building ventilation (using recuperation systems) is a promising area of application for heat accumulators. The European Green Deal legislation adopted in EU countries assumes that the share of renewable energy in meeting energy demand will be 32% in 2030, rising to 50% in 2050 [21]. As a result of this, solutions are being sought to minimize the energy expenditure for heating buildings, including ventilation. For example, Lim et al. [22] presented a study on the use of hybrid ventilation (mechanical and natural), achieving (depending on the internal parameters assumed) from 19 to over 41% energy savings compared to natural ventilation. Knissel and Peußner [23] analyzed the effect of a modified diaphragm exchanger design in a forced ventilation system, finding that the radial exchanger used allows a fan with lower motor power to be installed. The authors also recommend this design, in addition to ventilation, for low-temperature heating systems. Chen et al. [24] carried out an analysis of the use of a heat accumulator filled with phase-change material to meet the needs of office space air conditioning. A comparative analysis of a similar system (without the use of an accumulator) showed nearly double the energy savings in the air conditioning process. Lapertot et al. [25] analyzed the effects of using a diaphragm exchanger in which outside air was supplied to the air conditioning unit of a residential building. They determined the influence of the construction and operation parameters on the energy efficiency of the system under consideration, and after applying a multi-criteria optimization procedure, they determined the optimum construction and operation parameters for the analyzed system. Gun [26] presented the results of a study on the use of an air-to-earth membraneless exchanger in a building ventilation system. For the exchanger design analyzed, the author developed a computer model of heat and mass exchange in the soil which he used to carry out simulation experiments, concluding on its suitability. The model constructed allowed the heat transfer rate to be analyzed as a function of forcing forces (ambient conditions, air flow velocity).
Another alternative type of heat accumulator besides the air-soil one described above is a system consisting of a natural stone bed placed in an insulated space, a set of perforated tubes to evenly distribute the sucked air (placed at the bottom of the bed), and a system of perforated tubes placed at the top of the bed. The air drawn in by the fan is forced through a system of tubes fixed at the bottom of the accumulator, and then, after flowing through the inter-grain spaces in the bed, it flows out through porous tubes located in the upper part and is directed outside the accumulator [27]. The air flowing out of the accumulator is supplied to the room and, through changes in temperature and water vapor content (relative to the pumped air), causes a modification of the room microclimate [28,29]. Figure 1 illustrates the exemplary energy system for the building, consisting of an earth–air heat exchanger and heat recovery ventilation.
Two processes occur when air flows through the accumulator bed: heat exchange and mass exchange. The change in the thermodynamic state of the air flowing through the porous bed (temperature, water vapor content) is an important process from the point of view of applications in facility ventilation. The change in temperature of the flowing air is a consequence of heat exchange between the air and the surface of the accumulator particles, while the change in the concentration of water vapor occurs as a result of condensation or evaporation of the water vapor contained in the pumped air. Thus, if the temperature of the bed particles is above the dew point temperature, the water vapor content of the outgoing air is increased through evaporation, otherwise, the outgoing air is dehumidified through condensation. In addition to thermal-mass issues, conditions in the accumulator bed can be conducive to microbial growth and, thus, the contamination of the air flowing out of the accumulator. The heat storage system described in the article is used in facilities under covers (greenhouses, foil tunnels), and, after fulfilling hygienic requirements, it can also be used in building ventilation systems (recuperation system), which makes this solution universal. In this application, the air flowing out of the accumulator can be directed to an air handling unit or directly to the rooms to be ventilated, provided that the quantitative and qualitative composition of microorganisms in the air flowing out of the accumulator and the concentration of dust are at an acceptable level.
As studies have shown [30], the population of microorganisms in the air filling a specific room depends on the construction of the building, the number of inhabitants/users, and the amount of air supplied. The use of mechanical ventilation can affect the types and abundance of airborne microbes. Sharpe et al. [30], in their study conducted on a sample of 100 buildings with older construction and gravity ventilation, showed a statistically significant change in the microbial population. Thus, it can be concluded that such changes can also occur in buildings with controlled ventilation, and such constructions currently dominate the construction industry. This is because the factors affecting the abundance and biodiversity of microbial aerosol in enclosed spaces are the type of ventilation, the presence of air conditioning, the construction and finishing materials, and the age of the building [31]. The factor determining changes in population structure is air temperature, which may be optimal or lethal for microorganisms [32]. There is a widely accepted classification [33] that distinguishes between psychrophilic (cold-loving), mesophilic, and thermophilic microorganisms, depending on the temperature.
It is interesting to know the temperature limits that have a direct effect on changes in the microbial population under the influence of airflow through the bed of a stone heat accumulator. According to a study by Frąk et al. [34], the concentration of PM, which is the main transport medium for biological particles, is also a factor influencing microbial abundance in the air. Microorganisms are adsorbed on the surface of the dust, and they pose a threat to human health by penetrating the human respiratory system. Similar conclusions were reached as a result of the study by Wolny-Koładka and Malinowski [35] that compared the composition and abundance of microorganisms in bioaerosols in the buildings of a company processing municipal solid waste and outside the facilities at different times of the year. High dust concentrations (especially in buildings where standards were exceeded) favored an increased number of microorganisms.
Wolny-Koładka et al. [36] carried out a study in which they analyzed microbial contamination on the premises of a university in Kraków (Poland). In contrast, Adam et al. [37] investigated bioaerosol in a chamber, identifying and validating sources of population growth for microorganisms. The analyses cited above show that the level of microbial contamination of indoor air is higher, and the microbial species composition is more stable than in the outdoor environment. This is due to a number of factors including the higher concentration and activity of the population, the function of the buildings, cleaning and washing procedures, higher dust levels, less ultraviolet radiation, limited air exchange, and higher indoor air temperature compared to ambient air.
An alternative use for the stone accumulator Is to assist in the heating of horticultural facilities, thereby reducing the fossil fuels required to maintain the recommended temperature in the facility. Konopacki et al. [38] conducted analyses for heat accumulation in a stone bed and its reuse when growing plants in a production plastic garden tunnel. The results obtained show that in countries located at a comparable latitude to Poland, there is an energy potential of this storage method, and using only one section of the accumulator (the accumulator during the research was divided into several sections), the heat from inside the foil tunnel stored (during the day) in half of the capacity of the bed in October resulted in a tunnel temperature increase during the night period by at least 1.5 °C. The laboratory accumulator used in this study had a 0.7-meter-high storage layer and a surface area of about 60% of that of a plastic garden tunnel. The use of an accumulator in production under covers (greenhouses, foil tunnels) may carry the risk of supplying microorganisms to the interior of the object (developing during the production as well as during technological breaks—seasoning of the object), constituting a danger to the plants grown within.
The issue of the quality of air pumped into the object (residential houses, sheltered objects) using a membraneless heat exchanger is a new one as, to the best of the authors’ knowledge, there are no results of such research in the available literature. Only some information is available on greenhouses already in operation and how the presence of the substrate used in plant cultivation, the irrigation process, and the type of plants grown affect bioaerosol abundance and species composition [39,40,41,42]. Having considered the foregoing, in addition to thermal-mass issues, answering the questions of how the use of an accumulator (in its cycles of operation: air flow—interval period) will affect the quality of the air supplied to the interior of the room is an important scientific problem. The pause period results from the seasonality of operation in the case of such an accumulator and the assumed algorithm of air blow control in the aspect of facility heating support. Information as such, obtained only through research, is also necessary for any construction of this type involving a stone heat accumulator and should be regarded as monitoring research prior to the start of plant cultivation. Such an arrangement of tests performed in a real object makes them universal, as the results of the tests can be applied not only to greenhouse crops but also to other objects, e.g., offices, houses, and production and storage halls.
The main aim of this study was to determine the thermal-mass effects of using a stone heat accumulator in a direct ventilation system and the changes in microbiological air parameters. Since one of the factors affecting microbial abundance is the concentration of particulate matter in the air, the analysis quantified changes in the concentration of particulate matter contained in the air flowing through the accumulator. Based on particle size (diameter equal to or less than 10 μm, 4 μm, 2.5 μm, and 1 μm), dust is classified as PM10 PM4, PM2.5, and PM1 [43]. The standards containing the limit values (permissible) are included in the Regulation [44] and apply only to PM10 and PM2.5; therefore, only these particle sizes were analyzed in this paper.
Microbiological analysis was performed for the following: bacteria, fungi, actinomycetes, and staphylococci. The novelty of this study arises from learning more about the factors that allow for the efficient use of a stone deposit while ensuring safety at work.

2. Materials and Methods

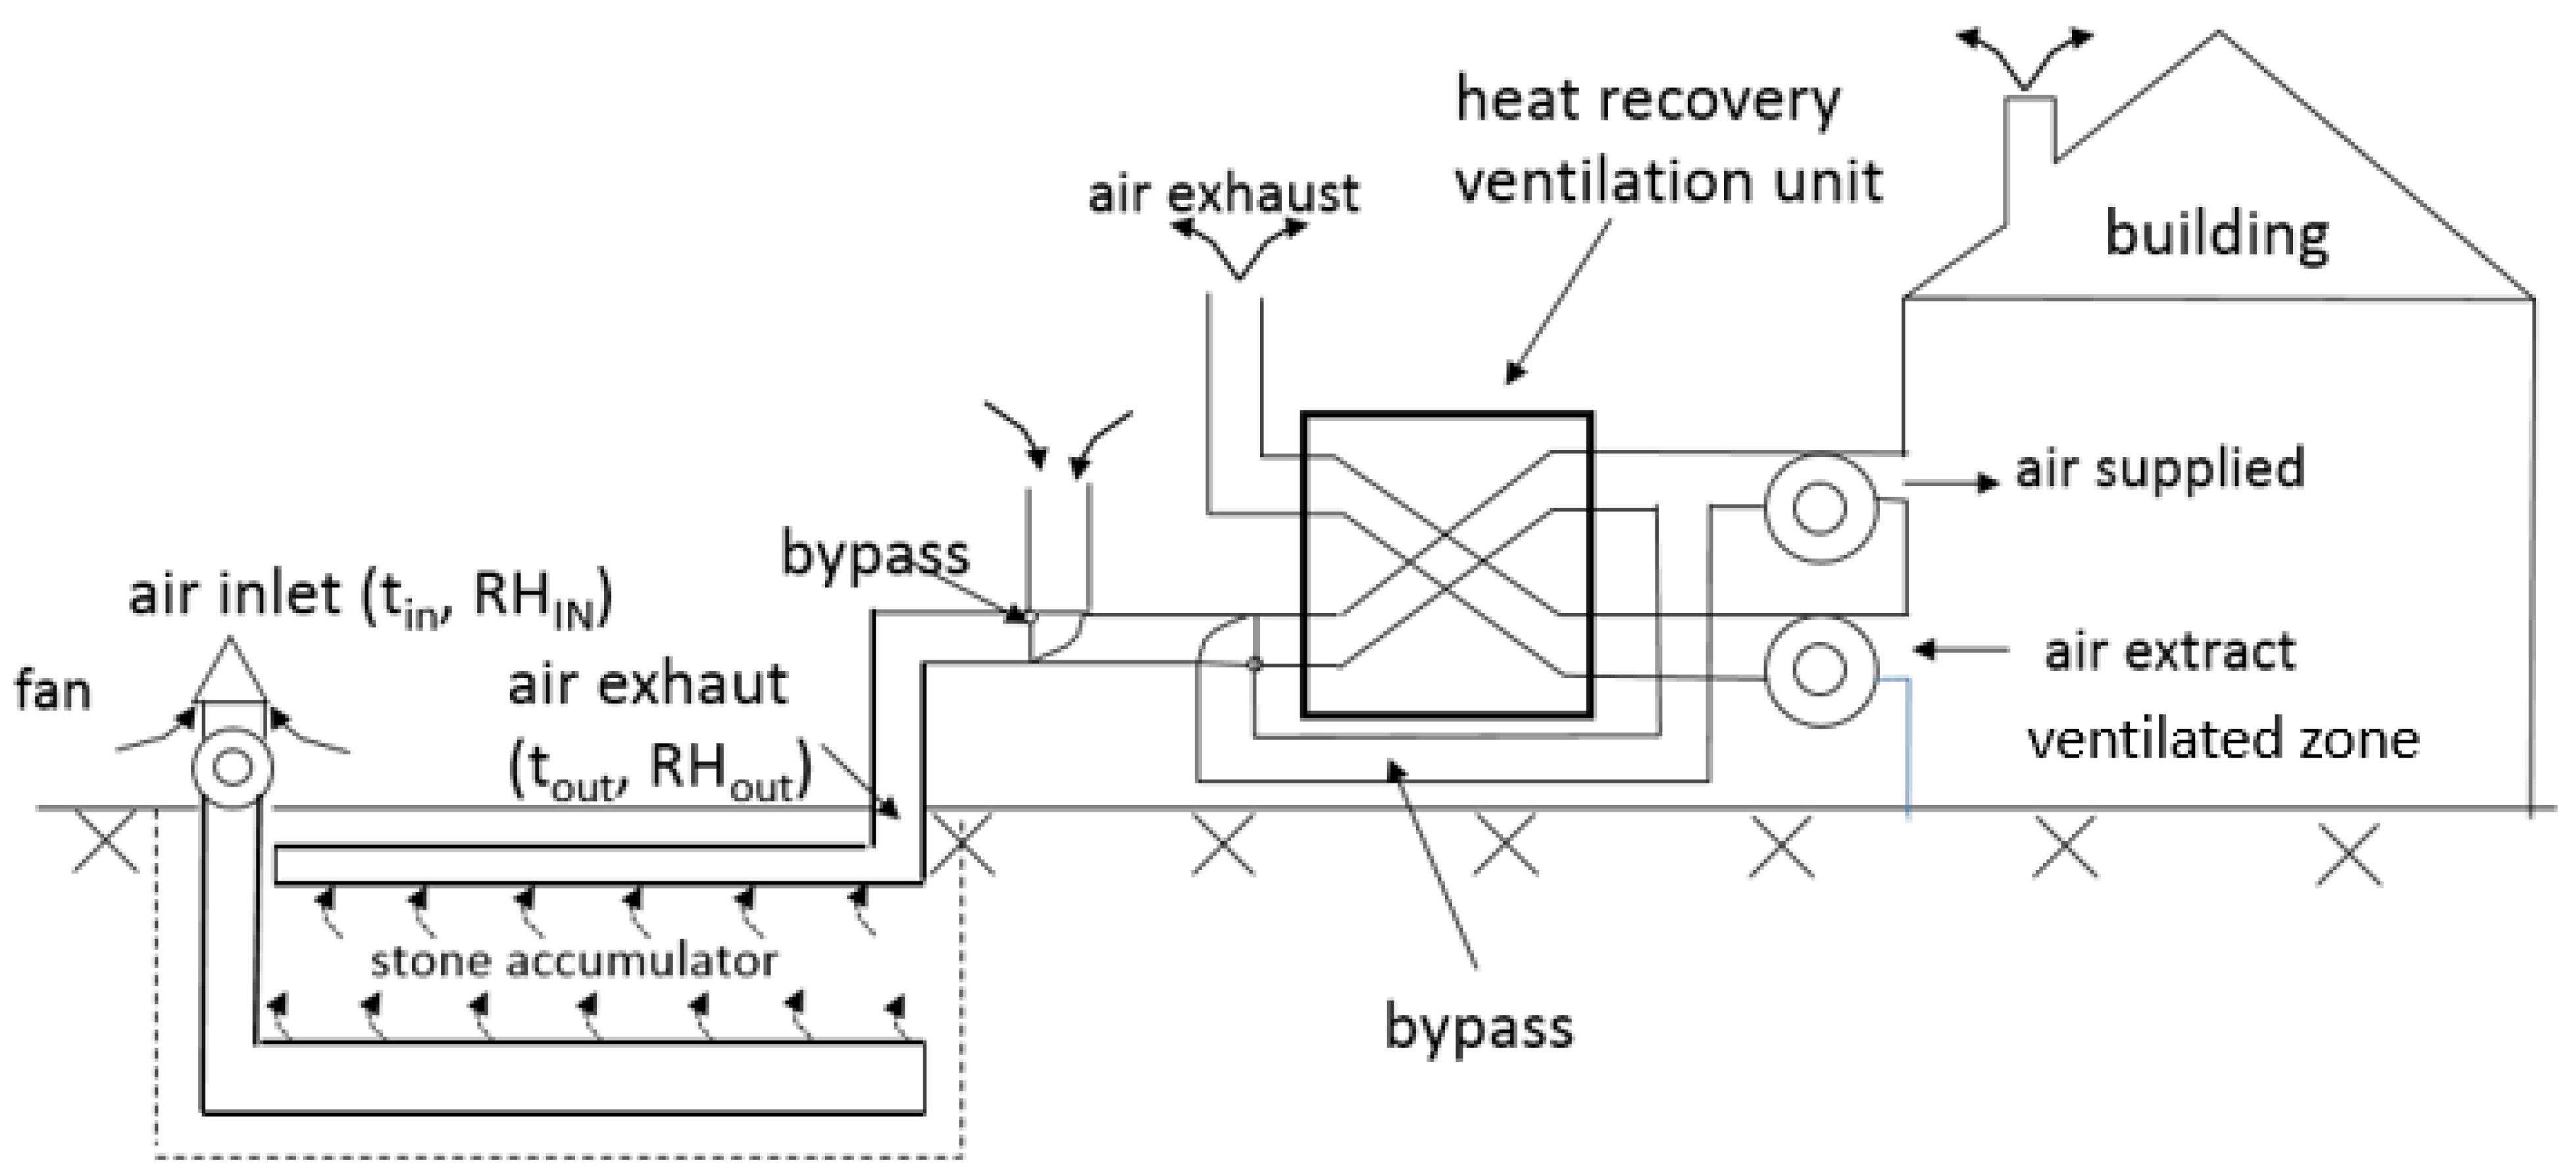
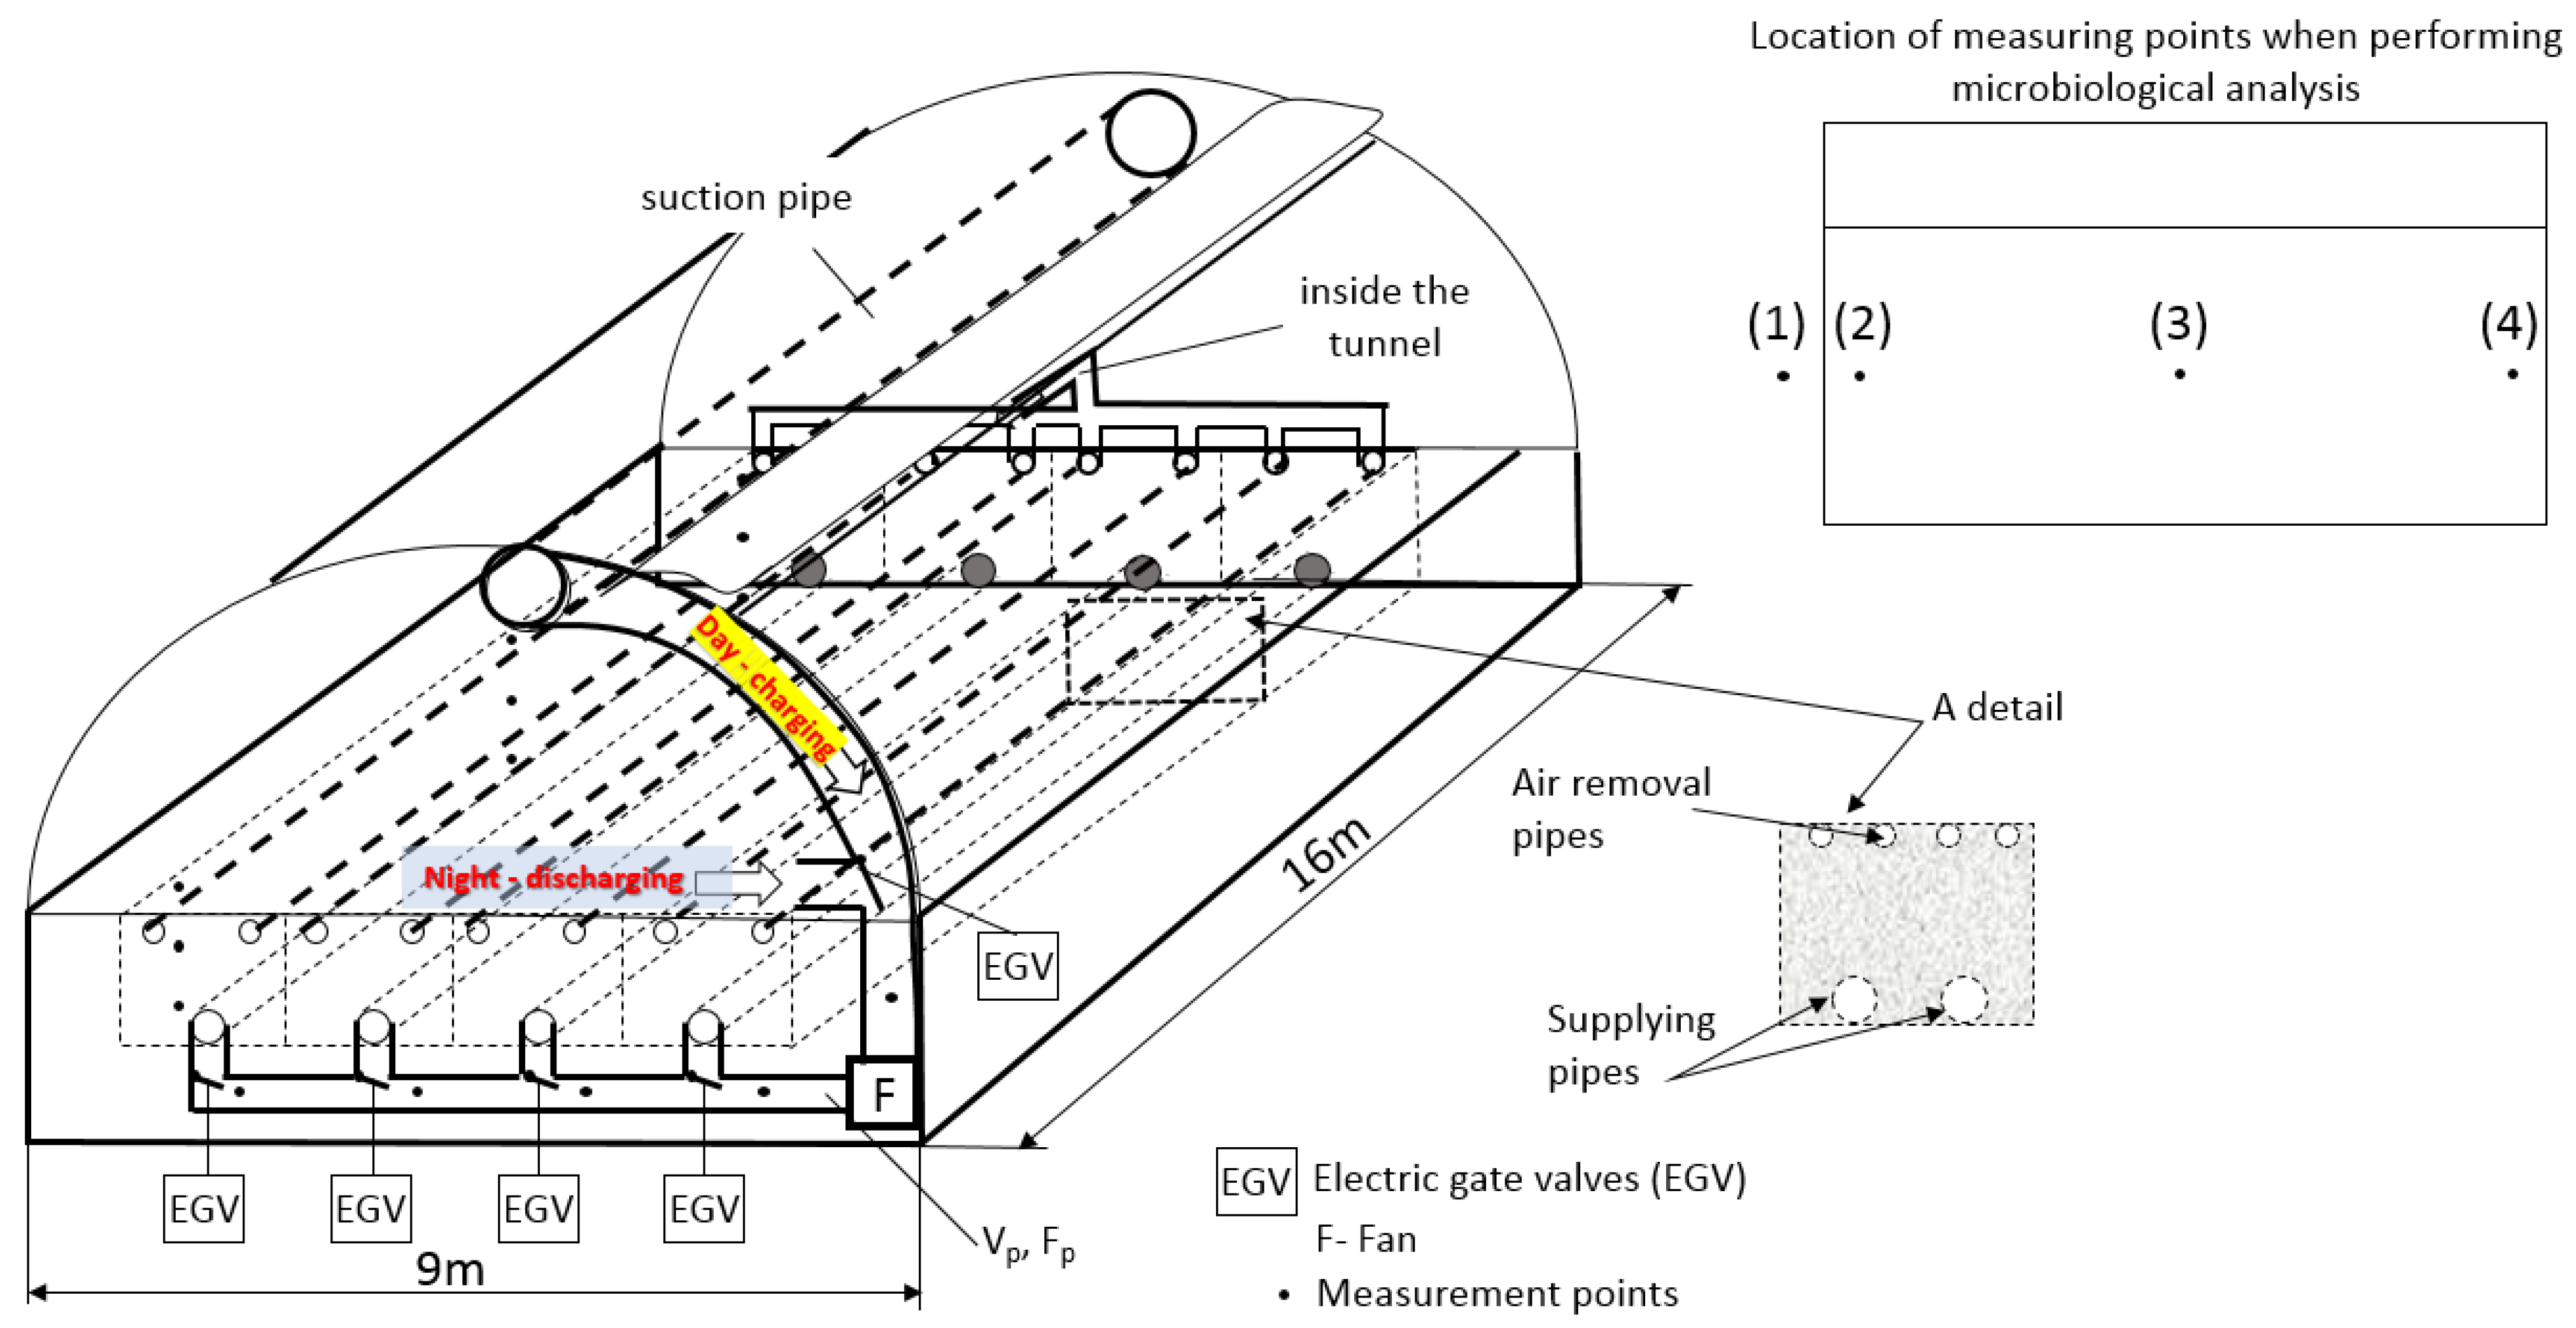
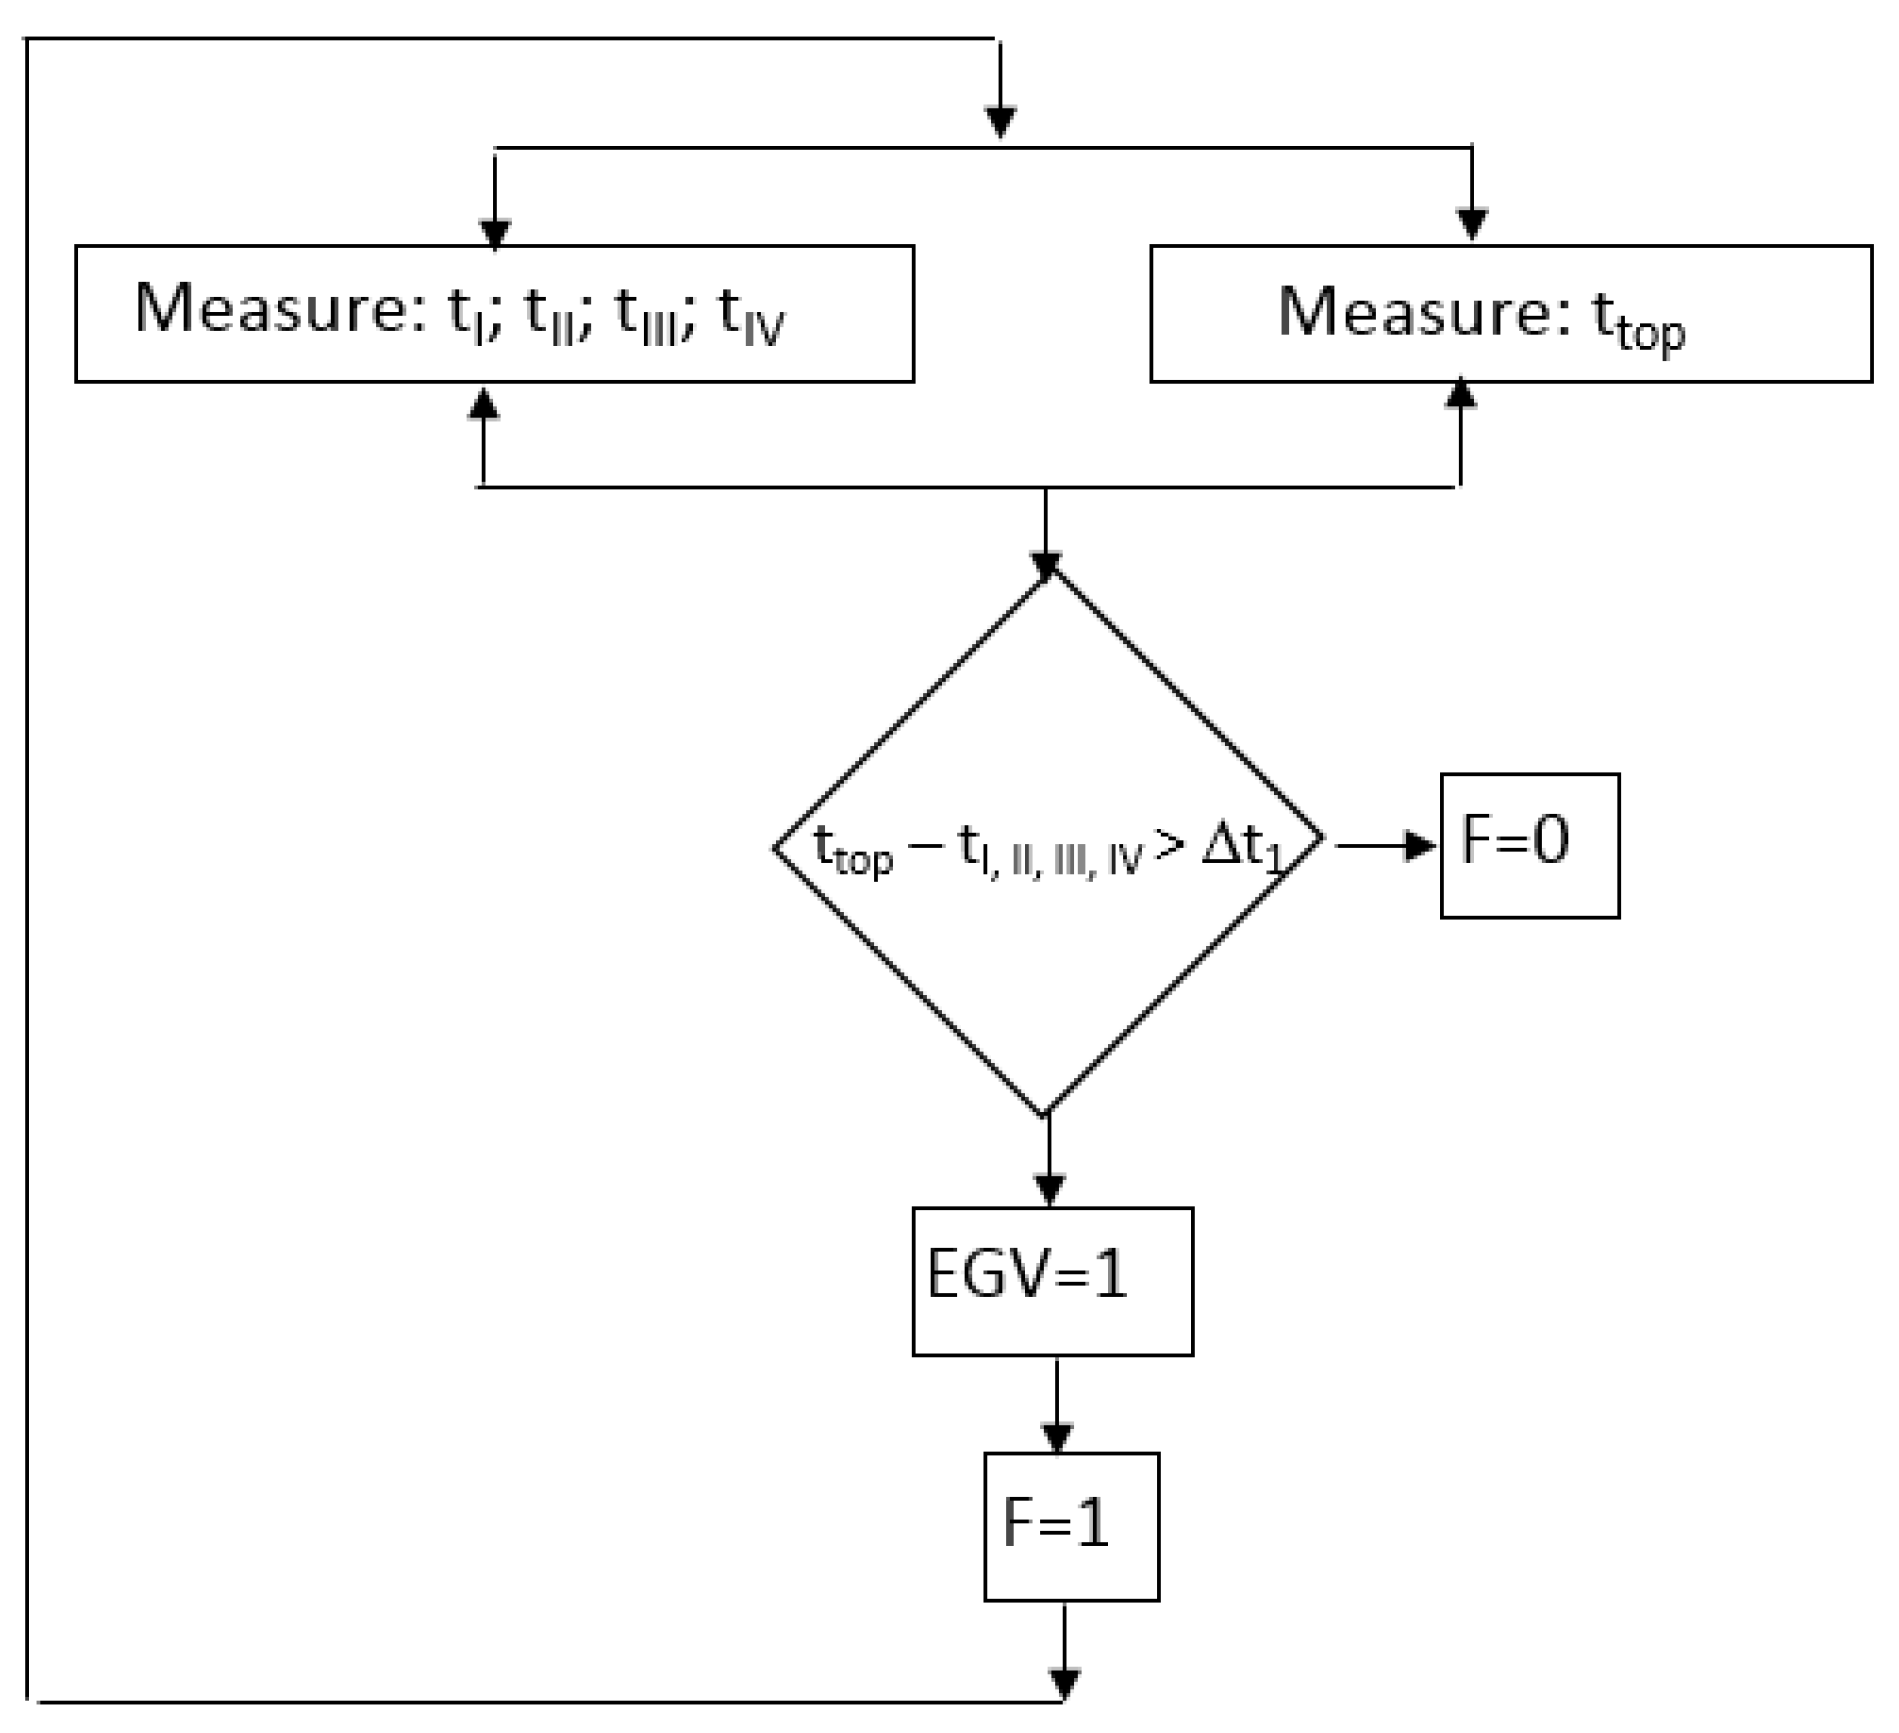
2.1. Experimental Bench in a Greenhouse—Construction and Principle of Operation of a Stone Accumulator

The tests were carried out on a real-scale laboratory bench in an object equipped with a stone heat accumulator bed (Figure 2). Figure 2 also shows air sampling points for microbiological analyses and dust concentrations (designations: 1, 2, 3, 4).
The experimental system in which the experiments were conducted was equipped with a stone heat accumulator. A perforated duct is installed in the upper part of the foil tunnel. The air from this space is sucked in by the fan (F) and pushed into the 4-section stone heat accumulator (detail A). The research was conducted in Kraków (Poland) in the foil tunnel over a one-month period. The research was conducted in the spring because then the stone accumulator goes from the standby to the active phase.
In the accumulator, each section (separated by a layer of insulation) has the dimensions of 11 × 1.7 m (length/width) and a layer height of 0.7 m. A 10 cm layer of foamed polystyrene insulation was applied to the bottom, sides, and top of the bed layer. The stone accumulator bed consisted of porphyry particles (30–60 mm granules). The choice of porphyry as an element of the accumulator bed, despite the low value of its specific heat, was caused by the widespread availability of this stone. This material is characterized by the following parameters: a thermal conductivity coefficient of 1.67 W·m−1K−1, a specific heat of 880 J∙kg−1 K−1, and a solid density of 2550 kg m−3. There are perforated tubes (two for each section) and four accumulator air collection tubes at the bottom of each section. These tubes were connected to the fan (F) via a measuring section. The air flowing out of the accumulator was pumped into the foil tunnel from pipes located at the top of the stone heat accumulator. It is important that, during the day, the accumulator is charged with warm air accumulated in the greenhouse while, at night, the battery is discharged (supplying the stored heat to the greenhouse when it is needed).
The analyzed system was not equipped with any additional filters to ensure the most transparent conditions of the process. For this reason, air conditions outside the facility were also monitored. The experiments were carried out for the entire volume of the accumulator surface deposit, measuring the following parameters: air velocity (Vp) (measured in a measuring section with a diameter of 300 mm) using Mini Air64 vane anemometers for air and gas flows (Schiltknecht Messtechnik AG, Schaffhausen, Switzerland, www.omniinstruments.co.uk, accessed on 4 April 2020), air temperature using PT 1000 resistance temperature meters (www.ti.com/sensors, accessed on 4 April 2020), and relative air humidity using an HD4917T meter (ACSE, Kraków, Poland, www.acse.pl, accessed on 1 April 2020). The measurement accuracy was from ±0.35 to ±0.55 K for temperature and ±1.5% for humidity and air velocity. Measurement sensors were installed at the accumulator air inlet and outlet (humidity and air temperature). Humidity and air temperature were measured in each stone accumulator section at the beginning, middle, and end at varying depths and distances from the symmetry axis of the section.
A proprietary control algorithm (Figure 3) was used to control the operation of the accumulator. The air injection control algorithm assumes that the execution of the injection process takes place at the assumed differences between the temperature of the pumped air and the temperature of the air inside the accumulator section.
The system operation idea is the following: As soon as the set values are reached (Δt1), the throttle (EGV) is overridden to enable the charging process: EGV = 1. The adopted Δt1 symbol means the temperature difference between the temperature above the shade (ttop) and the average air temperature inside the accumulator section is tI, tII, tIII, and tIV. If this condition is fulfilled (Δt1 > 2 K), the fan is switched on (F = 1), and, consequently, this leads to airflow through all sections of the accumulator, thus, charging it (warm air). The analysis of the processes taking place was carried out macroscopically, i.e., by averaging the air temperature and humidity at the measured points to a single value. All parameters were monitored by a computerized measurement system with a recording frequency of every 60 s.

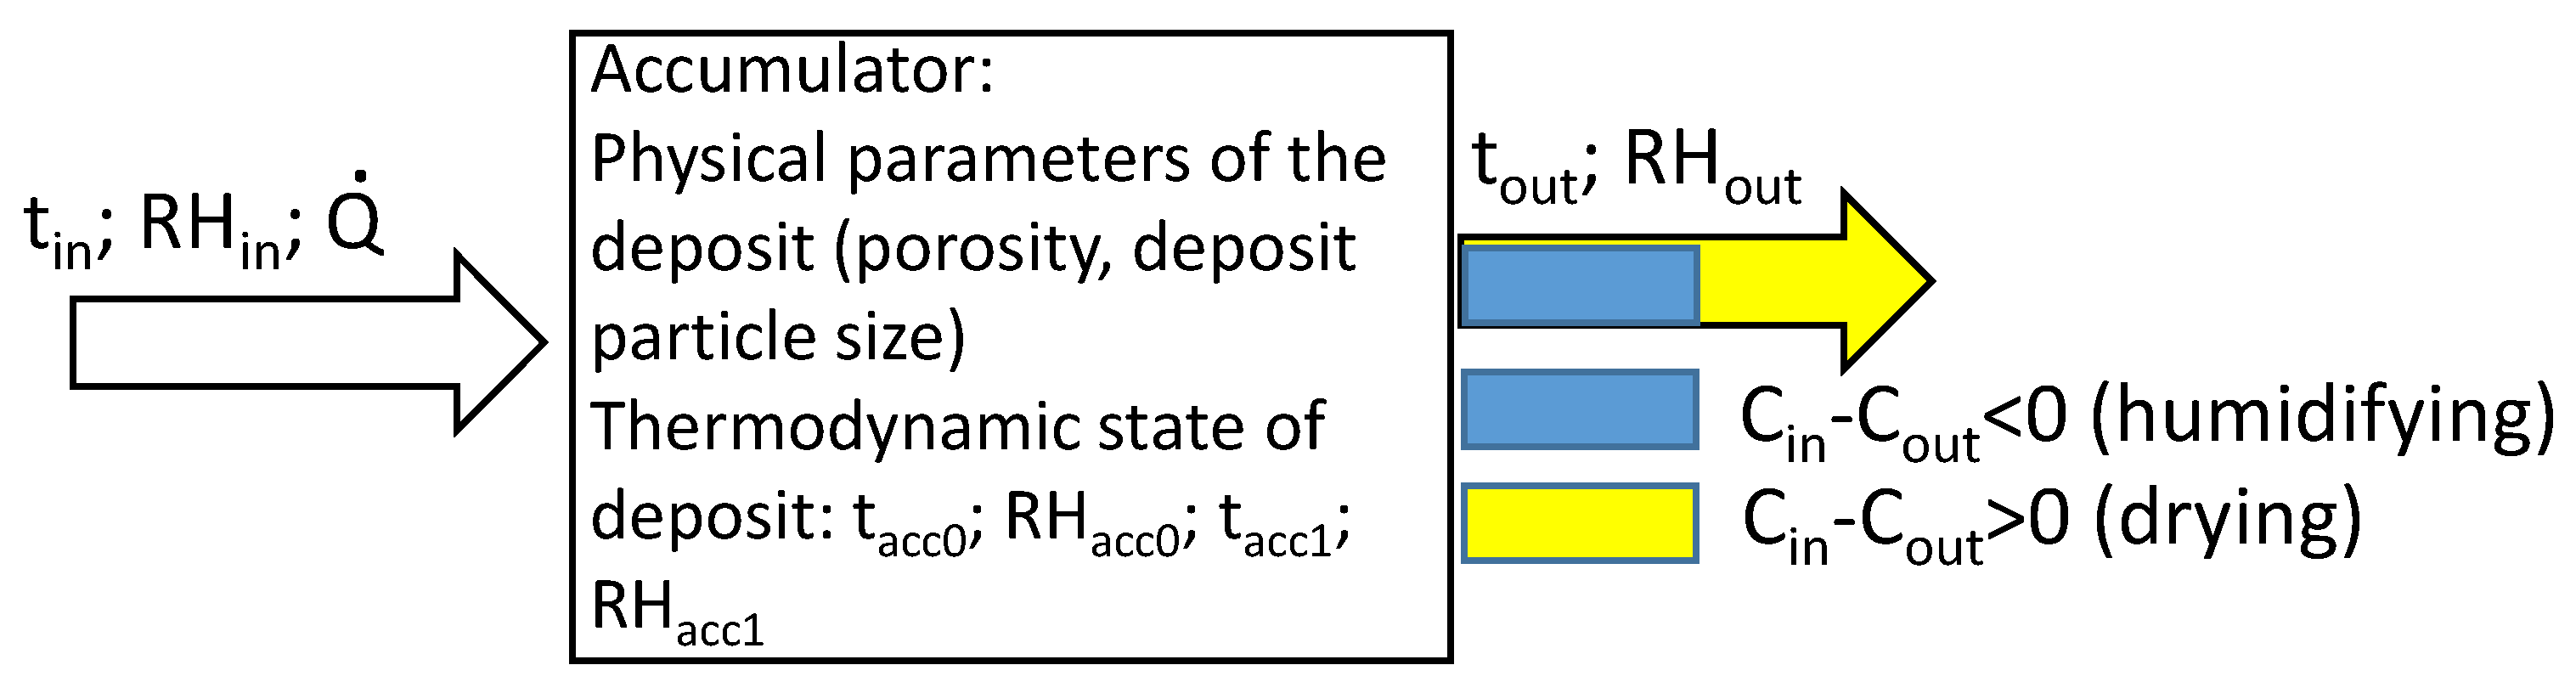
2.2. Thermal-Mass Analyses and Calculations

To generalize the results, the average values of the measured air parameters (Wavg) determining the changes in heat and water mass in the stone heat accumulator bed during successive cycles of fan operation were calculated. These values in the analyzed cycles in the interval (τ1, τ2) were calculated based on their instantaneous values according to the relation (1):
W a v g = 1 τ τ 1 τ 2 w τ d τ
During the airflow, either dehumidification or humidification can occur. Schematically, the analyzed problem, along with other elements, is shown in Figure 4.
The amount of air pumped into the accumulator was calculated from the formula (2):
Q = V p π · d 2 4 · τ
where Vp is the speed in the measuring section, m∙s−1; d is the diameter of the measuring section; and τ is process time.
The water vapor content of the air was calculated from a standard psychrometric relationship (3a):
C = 0.622 · p s a t · R H R s , d a · T
and the saturation pressure (pnas) from the Magnus formula as (3b):
p s a t = 10 2.7857 + 7.5 · t 237.3 + t
where psat is the saturation pressure of water vapor in the air, Pa; RH is the relative humidity of the air, [-]; Rs,da is the specific gas constant for dry air, Rs,da = 287.01 J∙kg−1 K−1; t is the air temperature, °C; and T = 273.15 + t.
The total amount of heat (Qacc) in differential time d   τ exchanged between the flowing air and the stone accumulator bed is described by the following Equation (4) [2]:
d Q a c c = d Q h ± d Q L
  • Qh—heat in the accumulator as a result of the difference in air enthalpy (J)
  • QL—heat in the battery as a result of water phase transition (J)
The (+) sign refers to the steam condensation process (bed humidification), and the (−) sign refers to the evaporation process (bed drying). In the calculations, this condition was identified by comparing the concentration of water vapor that flowed out of the bed (Cout) with the concentration of steam in the air injected into the bed (Cin). If Cin > Cout, then the air-drying process took place in the bed, otherwise the humidification process took place. The individual components can be calculated from Equations (5) and (6a) [2]:
d Q h = V ˙ a i r · ρ a H o u t H i n d τ
d Q L = m ˙ a c c · L d τ
and a stream of water ( m ˙ a c c ) in the considered differential time is calculated from these Equations (6b) [2]:
d m ˙ a c c = V ˙ a i r C o u t C i n
  • m ˙ a c c —mass flow of water exchanged in the accumulator (kg·s−1)
  • ρa—air density (kg·m−3)
  • Hin, Hout—enthalpy of injected air (inlet air) (Hin) and air flowing out of the accumulator (outlet air) (Hout) (J·kg−1)
  • Vair—inlet airflow (m3·s−1)
  • Cin, Cout—absolute humidity of inlet (Cin) and outlet air (Cout) (kg·m−3)
In both analyzed cases of the accumulator operation states, the total amount of heat ( Q a c c ) stored in the accumulator bed (or delivered to the tunnel interior) in the cycle time interval (τ1, τ2) is equal to (7):
Q a c c = V ˙ a i r · ρ a τ 1 τ 2 H o u t H i n d τ
and the water mass ( m a c c ) transferred in the case of humidifying or drying the flowing air can be calculated as follows:
m a c c = V ˙ a i r τ 1 τ 2 C o u t C i n d τ
The porous material (natural stones) used to build the accumulator was characterized by a negligible water absorption value. Any changes in the mass content in the outgoing air are a consequence of only the processes of condensation/evaporation of water from the surface of individual particles of the stone bed.
The mean root square error was used in the comparison of measured and calculated values:
σ = i = 1 n u c a l c , i u m e a s , i 2 n 0.5
where ucalc and umeas are the values from calculations and measurements, respectively, and n is the number of comparisons.

2.3. Dust Concentration Analysis and Microbiological Analyses

Particulate matter concentrations resulting from fan operations were carried out using the impactor method with an MAS-100 impactor (Merck, Switzerland). The concentration of particulate matter was measured using a DustTrak II model 8530 dust meter (TSI Inc., Shoreview, MN, USA). The air quality assessment was determined by performing microbiological analyses of the abundance of microorganisms comprising the bioaerosol present in the tunnel, as well as determining the dustiness of the air generated by the fan operation. Based on this, an assessment was made as to whether the microbial aerosol poses a health risk to greenhouse occupants.
The air was sampled 6 times from 3 points located in the greenhouse (points 2 and 4—successively at the greenhouse entrance and at the back wall of the tunnel, point 3—in the middle of the site) and from point 1 (control) located outside the building in the open air. The air was taken in the following arrangement (Table 1).
Measurements were made in triplicate, drawing 0.1 m3 of air each time, over 1 min. During the measurement, the impactor was located at the height of the human respiratory zone, i.e., approximately 1.5 m. The analyses were performed in accordance with the recommendations of the Polish Standard [45]. The number of fungi (Malt Extract Agar, BTL, Warszawa, Poland), mesophilic bacteria (Trypticasein Soy Lab Agar, BTL, Poland), staphylococci (Chapman agar, BTL, Poland), and actinomycetes (Actinomycete Isolation Lab Agar, BIOCORP, Warszawa, Poland) were determined. After sampling, the cultures were incubated under the following conditions: mesophilic bacteria and staphylococci at 37 °C for 24–48 h, fungi at 28 °C for 3–5 days, and actinomycetes at 28 °C for 5–7 days. Air temperature (digital thermometer, Biowin, Łódź, Poland), relative humidity (Kestrel 4000, Nielsen-Kellerman, Boothwyn, PA, USA), and particulate matter concentration (PM10, PM2.5) (dust meter, DustTrak, TSI, Shoreview, MN, USA) were measured at each sampling point. After incubation, the characteristic colonies of microorganisms were counted, and the results were given as the number of colony-forming units (ctu) per cubic meter of air (CFU∙m−3) [46]. Identification of the microorganisms cultured on the plates was performed using the MALDI-TOF MS technique (Bruker Daltonik, Bremen, Germany) according to the manufacturer’s recommended methodology and guidelines provided in publications by other authors [47,48,49,50]. A score ≥ 1.7 and <2.0 indicated identification to the genus level, while a score ≥ 2.0 indicated identification to the species level. The experiment was planned and carried out in such a way that the presented facilities in the discussed circuit operated in a representative way (from the standby phase to the full activity phase). In addition, the time needed for the start-up and achievement of all expected parameters was taken into account.

2.4. Statistical Analysis

The statistical analysis was conducted in Statistica v. 13 software (StatSoft, Tulsa, OK, USA). A two-way ANOVA test was performed to determine the statistical significance of temporal and spatial variation in the bioaerosol.

3. Results and Discussion

3.1. Thermo-Mass Analysis

The research was conducted between 18 April and 16 May. During the tests, the range of variation of the input quantities was 0.67 ≤ Va ≤ 2.53 m∙s−1; 5.6 ≤ Q   ˙ ≤ 74.9 m3∙m−2; 33,122 ≤ τ ≤ 225,481 s; 25.2 ≤ tin ≤ 49.4 °C; 0.086 ≤ RHin ≤ 0.49 [-]; 12.57 ≤ tacc0 ≤ 22.49 °C; and 0.18 ≤ RHacc0 ≤ 0.52 [−].
Figure 5 shows the unit amount of heat in individual cycles (both total heat (Qacc) and phase change (QL)), which is a consequence of thermodynamic changes in the flowing air and the contact between the flowing air and the intergrain space of the accumulator.
The enthalpy in the flowing air was used for thermal processes in the stone accumulator (heat storage and discharging of the accumulator). In the vast majority of cycles, the enthalpy was used to evaporate water from the inter-grain space of the accumulator (Figure 5). The range of the unit amount of heat exchanged in the stone accumulator is from −145 to 2916 kJ·m−2, while the heat flux used for water conversion is within the range of from −434 to 677 kJ·m−2. Negative values (in the case of the amount of heat exchanged in the stone accumulator) mean the process of its discharging, and for the mass flow, the state in which the exhaust air was humidified.
Due to the fact that the duration of the airflow process through the accumulator bed was varied, Figure 6 shows the calculation of the heat flux by the difference in enthalpy (qH) and phase change (qL). As can be seen in Figure 6, the initial (maximum value) is a consequence of the start of the air-blowing operation. The accumulator, after about 1.5 years of stagnation, was characterized by a low value of the bed temperature, hence the flux value (qH) of about 114 W·m−2. In the following days of the experiment, the flux value decreased and, starting from the eighth day, oscillated around the value of approx. 15 W·m−2. The flux used for water evaporation (qH) ranged from −10.2 W·m−2 (evaporation process) to 15.5 W·m−2 (condensation process) of water vapor.
Among the analyses that could be obtained for the thermal-mass issues, those that are useful at the stage of starting up a stone accumulator have been selected, limiting them to changes in temperature and water vapor concentration in the analyzed system elements (outlet air, accumulator bed). Thus, Figure 5 shows the change in outlet air temperature as a function of the total amount of air pumped into the accumulator (relative to the unit area of the accumulator) and its temperature, as well as the accuracy of modeling its value.
The term “accumulated amount of air” used in Figure 7 means the total amount of air injected from the beginning of the analyzed cycle (no overpressure was generated in the stone bed, which means that the same amount of air was supplied to the interior of the facility where the accumulator was installed). Air temperature was defined as the weighted average from the measurement points.
As the total amount of air pumped into the accumulator increases, the outlet air temperature increases, which is a consequence of heat storage in the accumulator bed. However, there is no clear indication that, over the entire range of the pumped air temperature, its increase also results in an increase in the outlet air temperature. This is a direct consequence of the processes taking place in the stone bed. The higher the air temperature, the more intensive the evaporation process and, thus, the lower the outlet air temperature.
Based on the results obtained, in terms of the specified initial accumulator variables, the correlation equation takes the form:
t c a l c = 2323.1 · Q 0.0022 2347.4 · t 0.0025 ;   R 2 = 0.89
in terms of the application, 11 ≤ Q ≤ 1575 m3/m2; 25.2 ≤ tin ≤ 49.4 °C.
The results of comparing the calculated and measured values are shown in Figure 7b. Both the value of the R2 coefficient and the error σ indicate a high agreement between the measured and calculated outlet air temperature values from this equation. Therefore, this equation can be used to approximate the outlet air temperature; thus, its value can be predicted from the variables: the total amount of pumped air and its temperature. The air volume (m3) refers to the unit area (m2) of the stone accumulator.
Figure 8 illustrates the effect of the airflow and the initial temperature of the accumulator bed on the change in the outlet temperature of the air from the accumulator. This graph was constructed by averaging the values from the measurement cycles performed. In this case, a clear trend can be observed: as both the flux and the initial temperature of the bed increase, the outlet air temperature increases.
The correlation equation (in terms of using the specified input variables) takes the form of:
Δ t c a l c = 9.55 · Q 0.36 + 1.75 · t a c c 0 ;   R 2 = 0.83
The results of comparing the calculated and measured values are shown in Figure 6b. A detailed analysis based on this equation has shown that, for example, a 20% increase in the initial temperature of the accumulator bed causes a nearly 20% increase in the outlet air temperature. On the other hand, a 20% increase in the pumped air flow rate causes only an approx. 0.5% increase in the outlet air temperature.
Since there is a close relationship between the outlet air temperature and the initial temperature of the bed, Figure 9 graphically illustrates the effect of the flow rate and the temperature of the pumped air on the final temperature of the bed. The end temperature of the bed of the previous cycle, with insulation applied, is approximately the start temperature of the next cycle in the periodic operation of the accumulator. As can be seen, as the temperature of the pumped air increases, there is an increase in the temperature of the accumulator bed, while there is a slight decrease in the pumped air stream.
Based on the measured values, the equation for calculating the final temperature of the bed takes the form of:
t a c c 1 = 3.42 · Q 0.07 + 0.85 · t a c c 0 1.02 ;   R 2 = 0.97
in terms of application:
11 ≤ Q ≤ 1575 m3/m2; 11.5 ≤ tacc0 ≤ 22.1 °C
The results of comparing the calculated and measured values are shown in Figure 9b. As before, the scope of application is closely related to the given range of magnitude changes when performing the experiments. As can be seen, both the coefficient of determination and the error value σ = 0.9 K show that the approximated results are highly consistent with the measured values.
The last issue of the conducted experiments from the area of thermal issues is the course of the curves illustrated in Figure 10. It shows the increase in bed temperature as a function of the amount of air pumped and its temperature. There are no apparent trends (Figure 10a) because, up to a certain temperature range and injection air flow rate, the bed temperature increases, and when certain values are exceeded, the opposite occurs. This is also reflected in the form of the correlation equation found (the results of comparing calculated and measured values are shown in Figure 10b), as evidenced by the low value of the coefficient of determination (R2 = 0.33).
A closely related issue during the flow of air through the porous accumulator bed involves the issue of changing the water vapor concentration in the bed. Having considered the foregoing, Figure 11 illustrates the effect of temperature and pumped airflow on the water vapor content of the exhaust air (Figure 11a) and the change in content (calculated as content in the pumped air and the exhaust air) in the exhaust air.
The presented graphic dependencies show that an increase in the airflow rate (Figure 11a) results in an increase in the vapor content of the outlet air, while no such unambiguous tendencies are observed in the case of the pumped air temperature. There are also no visible trends showing a change in concentration (Figure 11b) as a function of temperature and pumped airflow. This is a direct result of the processes involved: evaporation/condensation of the vapor contained in the air on the surface of the bed particles.
The effect of the temperature and water vapor content of the pumped air on the change in vapor concentration in the outlet air is definitely unambiguous, as shown graphically in Figure 12a. It can be clearly seen that as the temperature increases, the vapor content of the exhaust air decreases, while the opposite trend occurs as the vapor content of the inlet air increases.
A global summary of the relationships obtained is a comparison between the changes in concentration which are measured and those which are calculated from the proposed correlation equation in the form of:
Δ C a c c = 0.14 · Q 0.019 0.74 · t a c c 0 0.02 + 0.073 · t 0.03 32.39 · C 2.03 ;   R 2 = 0.97
The results of comparing the calculated and measured values are shown in Figure 12b. The high value of the determination coefficient (R2 = 0.97) and the error values σ (less than 0.5 g∙m−3) prove the high consistency of the approximated difference in vapor content of the outlet air (calculated as the difference between the concentration at the inlet and outlet of the air from the accumulator). This equation has both cognitive and application values.
The research results and their analysis presented in this paper indicate significant relationships between the air feeding the stone heat accumulator and the amount of energy stored in it, as well as the effect on the parameters of the exhaust air. At the outlet, the heated air is the carrier of supportive energy for the heating system. It can also be a sufficient source of heat under favorable conditions. As an example, storing the excess heat contained in the greenhouse air on a daily basis and storing it in a solar energy reservoir allows the pepper crop to reach the right temperature at nighttime [51]. A different example includes using a heat exchanger (UAT—underground air tunnel) in the form of a metal pipe placed in the ground [52].
In the future, it will be possible to use Thermal Energy Storage (TES) systems in greenhouses as an energy source for heating nearby buildings. TES solutions can combine heating, cooling, and dehumidification functions in future greenhouses. However, further research is needed to analyze the possibility of thermochemical energy storage and the better development of phase transition materials for this option [53]. In contrast, the authors of one publication [54] found that the PCM accumulator has the potential to reduce the environmental impact of heating systems.
Comparing the stone bed heat storage system proposed in this work to examples analyzed in the literature, it appears that the stone accumulator is a satisfactory solution. In addition, the innovative design of the exchanger ensures much better utilization of the heat and mass exchange surface area. This refers to the penetration of the air stream into the porous space of the stone bed. The analysis showed that a 20% increase in the initial temperature of the accumulator bed results in a nearly 20% increase in the outlet air temperature. In addition, the stone bed provides a steam reservoir as it absorbs the water contained in the air, thus drying the outlet air stream or humidifying it. This depends on the parameters of the air flowing through the accumulator. However, taking into account the air flow rate through the stone bed, a 20% increase in the injection air flow rate results in only a 0.5% increase in the outlet air temperature. The presented results discuss the macroscopic changes in the real system in which the stone accumulator is used. The theoretical details have been extensively discussed in the author’s previous work [55] where it was shown that the average value of the stored heat in the charging cycle of the stone heat accumulator (calculated as the difference between the enthalpy of the inlet and outlet air) amounted to approx. 9.4 MJ·m−2 of the accumulator surface.

3.2. Dust Concentration Analysis and Microbiological Analysis of the Air in the Facility

Due to the lack of legal Polish standards defining the acceptable level of microbiological air pollution, the results obtained in this research were related to the repealed criteria proposed by the National Hygiene Institute from 1989 [56,57] shown in Table 2 and, in the case of staphylococci, to the publications [58,59,60,61]. The results of the tests concerning the abundance of particular groups of microorganisms included in the microbial aerosol are presented in Table 3.
The air pollution standards for fungi and bacteria were not exceeded at any measuring point. The standards for air contamination by actinomycetes were exceeded only at points 3 and 4 after the greenhouse fans were started up and reached their full capacity (B). On this basis, the air was classified as moderately contaminated by these microorganisms only at these points and at this specific moment. Staphylococci were present in low abundance in the air analyzed. At all measurement points, microorganisms were present at similar levels, thus no differences were found between bioaerosol concentrations in the indoor (tunnel) and outdoor environment (control point 1, outdoors) (Table 3). Based on the results collected, it should be concluded that the numbers of bioaerosol-forming microorganisms are low and do not threaten the health of greenhouse occupants. Wolny-Koładka et al. [36], in a study conducted in rooms intended for students and employees of the University of Agriculture in Krakow (Poland), determined concentrations as high as 4800 CFU∙m−3 for bacteria, 3360 CFU∙m−3 for fungi, and 20 cfu∙m−3 for actinomycetes, while PM10 and PM2.5 concentration values oscillated between 58 and 147 μg∙m−3. Comparing the results obtained in the present study with the results of studies on microbiological purity of air in laboratory and office-teaching rooms of the University of Agriculture in Krakow (Poland), it should be concluded that bioaerosols in the studied tunnel do not pose a threat to the people staying inside [36].
Qualitative bioaerosol analyses identified the following fungi: Mucor plumbeus, Fusarium solani, Aspergillus niger, Aspergillus versicolor, Alternaria alternata, Rhizopus oryzae, Cladosporium herberum, Cladosporium cladosporioides, Penicillium chrysogenum, and Penicillium citrinum. Among the bacteria, the following species were identified: Micrococcus luteus, Micrococcus roseus, Staphylococcus capitis, Staphylococcus auricularis, Staphylococcus hominis, Staphylococcus haemolyticus, Staphylococcus warneri, Arthrobacter crystallopoietes, Arthrobacter woluwensis, Bacillus cereus, Bacillus firmus, Microbacterium liguefaciens, Pseudomonas lundensis, as well as actinomycetes of the genera: Actinomyces, Nocardia, Rhodococcus, and Streptomyces. Thus, it should be considered that typical air microflora were found in the studied samples [62,63].
Based on the collected results, it should be stated that in the analyzed points, over the entire study period, there were significantly excessive values in terms of the air dust standards: 20 μg∙m−3 and 40 μg∙m−3 for PM2.5 and PM10, respectively [44] (Table 4). The reason for exceeding the standards is both the smog phenomenon occurring in Krakow and the idea of the storage system operating by sucking air into the accumulator bed. The forced convection that occurs causes dust particles to rise and move [36]. It should be noted at this point that the dustiness of the air was small at the first stage (before the start of the fan—A) and then increased rapidly (after 1 week—C), decreasing significantly at the final stage (after one month of fan operation—F). An analogous situation occurred in the context of changes in air humidity. Before the start of the fan (A), the humidity was at an extremely low level, also compared to the external environment. After 1 week (C) of fan operation, the humidity increased to an average level; however, at the end of the experiment (4th week of fan operation—F), it decreased again, but not to such low values as at the beginning. The analysis of temperature changes in the examined period allows us to state that the highest average value was reached after 3 weeks of fan (E) operation in the tunnel at point 2–36.9 °C and the lowest at the control point (1) located outdoors at 15.1 °C. The highest temperature amplitude of 11.4 °C was found at point 2, and the lowest, 6.2 °C, was found at point 3. The temperature amplitude for ambient air at the control point (1) was 14.4 °C. All parameters controlled in the greenhouse (dust, temperature, and humidity) differed from those found at the control point (1) outdoors (Table 4). The dustiness of both dust fractions and the air temperature were higher in the greenhouse than outside, while the opposite situation was observed for relative humidity.
Kozdrój et al. [64] assessed bioaerosol concentrations in the greenhouse of the Kraków Botanical Garden. The dustiness of both PM10 and PM2.5 fractions in their study oscillated successively at 108–125 μg∙m−3 and 108–126 μg∙m−3, an air temperature of 3.8–24.0 °C, and relative humidity at 54.8–96.7%. However, it should be noted that Kozdrój et al. [63] conducted their research in the greenhouse of a botanical garden, where there are numerous plant species grown, and the microclimate conditions are strictly controlled. A broader range of tests was performed in our study compared to the analyses in numerous experiments. Bioaerosol quality parameters were also monitored prior to the commencement of plant cultivation, allowing the assessment of the technological solutions applied in the tunnel and their impact on air quality. Based on the collected results, it was concluded that from a microbiological point of view, the air tested does not pose a threat to the occupants of the facility. On the other hand, the concentration standards of particulate matter PM10 and PM2.5 exceeded the limit values, and, thus, the air was classified as polluted. The results obtained show that the system proposed in this way cannot be used for the direct ventilation of residential buildings due to the significantly exceeded dust concentration. Therefore, the air handling unit of the building cooperating with the described accumulator should be equipped with filters to stop the analyzed particle size (PM10 and PM2.5), which will be an element of further research in the analyzed greenhouse facility.

4. Conclusions

Studies have shown that the use of a heat storage system in a plastic garden tunnel leads to strictly controlled microclimate conditions. These conditions result from the operation of the entire system, which relies on the forced flow of air through the porous bed of the stone accumulator. Such a system installed inside the building ensures good air circulation. Based on the microbiological analysis, it was concluded that the airflow through the stone accumulator bed does not cause an increase in the population of bacteria, fungi, actinomycetes, and staphylococci. Hence, it should be concluded that bioaerosols in the analyzed tunnel do not pose a risk to the occupants. In the case of analyzing dust concentrations, the air handling units should be fitted with filters. However, it is important to be aware that indoor air often does not meet acceptable parameters (standards).
The study also quantified changes in the analyzed parameters and quantified relationships between the temperature and amount of pumped air and the outlet air temperature. In the tested measurement cycles (for the same stream of injected air), it has been found that the increase in air temperature from 31.8 to 38.1 °C resulted in an increase in outlet air temperature from 29.4 to 35.3 °C. The same calculations (for the same temperature of the injected air) showed that the increase in the amount of injected air from 35.1 to 42.1 m3·m−2 resulted in an increase in the outlet air temperature from 32.7 to 34.3 °C.
The results presented in this paper extend the knowledge on the use of stone accumulators in greenhouse facilities and are important for the designers and users of such a stone accumulator heat storage system.
Studies should continue after the plants are brought into the greenhouse tunnel in order to assess the performance of the installation under the new conditions. In the future, employees and visitors to the greenhouse may be exposed to bioaerosol particles originating mainly from the plants collected there, as well as their growing medium.

Author Contributions

Conceptualization, S.K., K.W.-K. and M.M.; methodology, S.K. and K.W.-K.; software, S.K., K.W.-K. and H.L.; validation, S.K. and K.W.-K.; formal analysis, S.K. and K.W.-K.; investigation, S.K., K.W.-K., M.M. and H.L.; resources, S.K., K.W.-K. and H.L.; data curation, S.K. and K.W.-K.; writing—original draft preparation, S.K., K.W.-K., M.M., K.T. and H.L.; writing—review and editing, S.K., K.W.-K., M.M., K.T. and H.L.; visualization, S.K.; supervision, S.K., K.W.-K. and M.M.; project administration, S.K. and M.M.; funding acquisition, S.K. and M.M. All authors have read and agreed to the published version of the manuscript.

Funding

The APC is financed by the University of Agriculture in Krakow.

Data Availability Statement

All data derived during the experiments are available in the text of this article.

Acknowledgments

This work was supported by the Ministry of Science and Higher Education of the Republic of Poland.

Conflicts of Interest

The authors declare no conflict of interest and declare that the funders had no role in the design of the study; in the collection, analyses, or interpretation of data; in the writing of the manuscript, or in the decision to publish the results.

References

  1. Głowacki, J.; Kopyciński, P.; Mamica, Ł.; Malinowski, M. Identyfikacja i delimitacja obszarów gospodarki o obiegu zamkniętym w ramach ”zrównoważonej konsumpcji”. In Gospodarka o Obiegu Zamkniętym w Polityce i Badaniach Naukowych; Kulczycka, J., Ed.; Wyd. Inst. GSMiE PAN: Kraków, Poland, 2019; pp. 167–179. ISBN 978-83-955544-5-2. (In Polish) [Google Scholar]
  2. Kurpaska, S.; Knaga, J.; Latała, H.; Cupiał, M.; Konopacki, P.; Hołownicki, R. The comparison of different types of heat accumulators and benefits of their use in horticulture. Sensors 2020, 20, 1417. [Google Scholar] [CrossRef]
  3. Tripathi, L.; Mishra, A.K.; Dubey, A.K.; Tripathi, C.B.; Baredar, P. Renewable energy: An overview on its contribution in current energy scenario of India. Renew. Sustain. Energy Rev. 2016, 60, 226–233. [Google Scholar] [CrossRef]
  4. Bottero, M.; Dell’Anna, F.; Morgese, V. Evaluating the Transition Towards Post-Carbon Cities: A Literature Review. Sustainability 2021, 13, 567. [Google Scholar] [CrossRef]
  5. Kania, G.; Kwiecień, K.; Malinowski, M.; Gliniak, M. Analyses of the Life Cycles and Social Costs of CO2 Emissions of Single-Family Residential Buildings: A Case Study in Poland. Sustainability 2021, 13, 6164. [Google Scholar] [CrossRef]
  6. Księżopolski, K.; Drygas, M.; Pronińska, K.; Nurzyńska, I. The Economic Effects of New Patterns of Energy Efficiency and Heat Sources in Rural Single-Family Houses in Poland. Energies 2020, 3, 6358. [Google Scholar] [CrossRef]
  7. Pater, S.; Magiera, J. Ocena zapotrzebowania na energię budynku mieszkalnego przy wykorzystaniu dwóch niezależnych programów obliczeniowych. Tech. Chem. 2011, 108, 165–184. (In Polish) [Google Scholar]
  8. Agarwal, M.; Agarwal, G.D. Heat storage materials, geometry and applications: A review. J. Energy Inst. 2017, 90, 1–11. [Google Scholar] [CrossRef]
  9. Misztal, K. Odnawialne źródła energii na terenie Polski. In W kierunku Gospodarki o Obiegu Zamkniętym. Perspektywa miast; Kulczycka, J., Ed.; Wyd. MSAP: Kraków, Poland, 2017; pp. 125–135. ISBN 978–83–89410–38–2. [Google Scholar]
  10. Jastrzębski, P.; Saługa, P.W. Simulation of the use of a heat accumulator in combined heat and power plants. Energy Pol. J. 2018, 21, 75–88. [Google Scholar] [CrossRef]
  11. Gielen, D.; Boshell, F.; Saygin, D.; Bazilian, M.; Wagner, N.; Gorini, R. The role of renewable energy in the global energy transformation. Energy Strategy Rev. 2019, 24, 38–50. [Google Scholar] [CrossRef]
  12. Khan, M.I.; Khan, I.A.; Chang, Y.-C. An overview of global renewable energy trends and current practices in Pakistan—A perspective of policy implications. Renew. Sustain. Energy Rev. 2020, 12, 056301. [Google Scholar] [CrossRef]
  13. Sacharczuk, J.; Taler, D. A concrete heat accumulator for use in solar heating systems—A mathematical model and experimental verification. Arch. Thermodyn. 2014, 35, 281–295. [Google Scholar]
  14. Sarbu, I.; Sebarchievici, C. A Comprehensive Review of Thermal Energy Storage. Sustainability 2018, 10, 191. [Google Scholar] [CrossRef]
  15. Stanisz, K.; Gomuła, S. Evolution of the coefficient of performance of the heat pump in conjunction with heat batteries of different capacities. JCEEA 2015, 32, 419–427. [Google Scholar] [CrossRef]
  16. Dinker, A. Statistical Analyses. Energy Consumption in Households in 2018; Zakł Wyd Stat GUS: Warszawa, Poland, 2019; ISSN 2084-8137. (In Polish) [Google Scholar]
  17. Jastrzębski, P.; Saługa, P.W. Innovative methods of heat storage. Zesz Nauk. Inst. Gosp. Sur. Min. Energ. PAN 2018, 105, 225–232. (In Polish) [Google Scholar] [CrossRef]
  18. Mania, T.; Kawa, J. Inżynieria Instalacji Magazynowania Energii Ciepła; Mroziński, A., Ed.; Wyd Grafpol: Bydgoszcz, Poland, 2016; ISBN 978-83-64423-37-6. (In Polish) [Google Scholar]
  19. Ma, Z.; Glatzmaier, G.C.; Kutscher, C.F. Thermal Energy Storage and its Potential Applications in Solar Thermal Power Plants and Electricity Storage. In Proceedings of the ASME 5th International Conference on Energy Sustainability, Washington, DC, USA, 7–10 August 2011; pp. 447–456. [Google Scholar] [CrossRef]
  20. Krasnov, A.S.; Zimenkova, T.S.; Kaznacheev, S.A.; Aksenov, N.A. Application of thermal accumulator with solid heat accumulating material as a method of cooling of life support and freight protection systems for vacuum magnetic levitation transport. Transp. Syst. Technol. 2018, 4, 43–57. [Google Scholar] [CrossRef]
  21. COM 640 Final. Communication from the Commission to the European Parliament, the European Council, the Council, the Economic and Social Committee and the Committee of the Regions. 2019. Available online: https://eur-lex.europa.eu/legal-content/PL/TXT/?uri=CELEX%3A52019DC0640 (accessed on 11 July 2021).
  22. Lim, Y.-H.; Yun, H.-W.; Song, D. Indoor Environment Control and Energy Saving Performance of a Hybrid Ventilation System for a Multi-residential Building. 6th International Building Physics Conference. Energy Procedia 2015, 78, 2863–2868. [Google Scholar] [CrossRef]
  23. Knissel, J.; Peußner, D. Energy efficient heat exchanger for ventilation systems. Energy Build. 2017, 159, 246–253. [Google Scholar] [CrossRef]
  24. Chen, X.; Zhang, Q.; Zhai, Z.J.; Ma, X. Potential of ventilation systems with thermal energy storage using PCMs applied to air conditioned buildings. Renew. Energy 2019, 138, 39–53. [Google Scholar] [CrossRef]
  25. Lapertot, A.; Cuny, M.; Kadoch, B.; Le Métayera, O. Optimization of an earth-air heat exchanger combined with a heat recovery ventilation for residential building needs. Energy Build. 2021, 235, 110702. [Google Scholar] [CrossRef]
  26. Gun, G. Dynamic interactions between the ground heat exchanger and environments in earth–air tunnel ventilation of buildings. Energy Build. 2014, 85, 12–22. [Google Scholar] [CrossRef]
  27. Hołownicki, R.; Konopacki, P.; Kurpaska, S.; Latała, H.; Broniarek, R.; Rutkowski, K.; Treder, W.; Nowak, J. A Way of Using Natural Heat Energy in a Heat Accumulator and a Heat Accumulator. Patent PL 220435 B1, 7 September 2012. Available online: https://ewyszukiwarka.pue.uprp.gov.pl/search/pwp-details/P.400690 (accessed on 1 April 2020). (In Polish).
  28. Kurpaska, S.; Kiełbasa, P.; Sobol, Z.; Tabor, S.; Gliniak, M.; Bojdo, K. Analysis of air flow resistance through a porous stone bed. Biosyst. Eng. 2020, 198, 323–337. [Google Scholar] [CrossRef]
  29. Kurpaska, S.; Latała, H.; Rutkowski, K.; Hołownicki, R.; Konopacki, P.; Nowak, J.; Treder, W. Storing heat surplus from a plastic tunnel in a rock—Bed storage. Inż. Roln. 2012, 2, 157–167. [Google Scholar]
  30. Sharpe, T.; McGill, G.; Dancer, S.J.; King, M.F.; Fletcher, L.; Noakes, C.J. Influence of ventilation use and occupant behaviour on surface microorganisms in contemporary social housing. Sci. Rep. 2020, 10, 11841. [Google Scholar] [CrossRef] [PubMed]
  31. Sivasubramani, S.K.; Niemeier, R.T.; Reponen, T.; Grinshpun, A. Fungal spore source strength tester: Laboratory evaluation of a new concept. Sci. Total. Environ. 2004, 329, 75–86. [Google Scholar] [CrossRef] [PubMed]
  32. Augustynowicz, J.; Nierebiński, M.; Jóźwiak, A.; Prędecka, A.; Russel, S. Wpływ podstawowych parametrów fizykochemicznych na liczbę bakterii psychofilnych i mezofilnych w wodach rzeki Wisły. Woda-Sr.-Obsz. Wiej. 2017, 17, 5–13. (In Polish) [Google Scholar]
  33. Brock, T.D.; Rose, A.H. Chapter VII Psychrophiles and Thermophiles. In Methods in Microbiology; Norris, J.R., Robbons, D.W., Eds.; Academic Press: Cambridge, MA, USA, 1969; Volume 3B, pp. 161–168. [Google Scholar] [CrossRef]
  34. Frąk, M.; Majewski, G.; Zawistowska, K. Analysis of the quantity of microorganisms adsorbed on particulate matter PM10. Sci. Rev. Eng. Environ. Sci. 2014, 64, 140–149. [Google Scholar]
  35. Wolny-Koładka, K.; Malinowski, M. Assessment of the microbiological contamination of air in a municipal solid waste treatment company. Ecol. Chem. Eng. Ser. A 2015, 22, 175–183. [Google Scholar] [CrossRef]
  36. Wolny-Koładka, K.; Malinowski, M.; Pieklik, A.; Kurpaska, S. Microbiological air contamination in university premises and the evaluation of drug resistance of staphylococci occurring in the form of a bioaerosol. Indoor Built. Environ. 2019, 28, 235–246. [Google Scholar] [CrossRef]
  37. Adam, R.I.; Bhangar, S.; Pasut, W.; Arens, E.A.; Taylor, J.W.; Lindow, S.E.; Nazaroff, W.W.; Bruns, T.D. Correction: Chamber Bioaerosol Study: Outdoor Air and Human Occupants as Sources of Indoor Airborne Microbes. PLoS ONE 2015, 10, e0133221. [Google Scholar] [CrossRef]
  38. Konopacki, P.; Hołownicki, R.; Sabat, R.; Kurpaska, S.; Latała, H. Storage of heat in a stone battery. Inż. Roln. 2012, 2, 113–121. [Google Scholar]
  39. Hansen, V.M.; Winding, A.; Madsen, A.M. Exposure to bioaerosols during the growth season of tomatoes in an organic greenhouse using Supresivit (Trichoderma harzianum) and Mycostop (Streptomyces griseoviridis). Appl. Environ. Microbiol. 2010, 76, 5874–5881. [Google Scholar] [CrossRef] [PubMed]
  40. Monso, E.; Magarolas, R.; Badorrey, I.; Radon, K.; Nowak, D.; Morera, J. Occupational asthma in greenhouse flower and ornamental plant growers. Am. J. Respir. Crit. Care Med. 2002, 165, 954–960. [Google Scholar] [CrossRef] [PubMed]
  41. Madsen, A.M.; Tendal, K.; Thilsing, T.; Frederiksen, M.W.; Baelum, J.; Hansen, J.V. β-glucan, and bacteria in nasal lavage of greenhouse workers and their relation to occupational exposure. Ann. Occup. Hyg. 2013, 57, 1030–1040. [Google Scholar] [CrossRef] [PubMed]
  42. Kozdrój, J. Metagenoms—A source of new information on soil micro-organisms. Post. Mikrobiol. 2013, 52, 185–200. (In Polish) [Google Scholar]
  43. Marcazzan, G.M.; Vaccaro, S.; Valli, G.; Vecchi, R. Characterisation of PM10 and PM2.5 particulate matter in the ambient air of Milan, Italy. Atmos. Environ. 2001, 35, 4639–4650. [Google Scholar] [CrossRef]
  44. The Polish Government. Regulation of the Minister of the Environment on the concentrations of selected substances in ambient air. J. Laws. 2012; 1031. Available online: https://isap.sejm.gov.pl/isap.nsf/download.xsp/WDU20120001031/O/D20121031.pdf (accessed on 31 March 2020). (In Polish)
  45. PN-Z-04008-08; Ochrona Czystości Powietrza. Pobieranie Próbek. Pobieranie Próbek Powietrza Atmosferycznego (imisja) do Badań Mikrobiologicznych Metodą Aspiracyjną i Sedymentacyjną. Polski Komitet Normalizacyjny: Warszawa, Poland, 1989. (In Polish)
  46. Operator’s Manual MAS-100TM professional Microbial Air Monitoring System for the Microbiological Testing of Air. Brussels, Belgium. Available online: https://archive-resources.coleparmer.com/Manual_pdfs/39182-90,-82.pdf (accessed on 31 March 2020).
  47. Bohme, K.; Fernandez-No, I.C.; Barros-Velazquez, J.; Gallardo, J.M.; Calo-Mata, P.; Cañas, B. Species differentiation of seafood spoilage and pathogenic Gram-negative bacteria by MALDI-TOF mass fingerprinting. J. Proteome. Res. 2010, 9, 3169–3183. [Google Scholar] [CrossRef]
  48. Seng, P.; Rolain, J.M.; Fournier, P.E.; La Scola, B.; Drancourt, M.; Raoult, D. MALDI-TOF-mass spectrometry applications in clinical microbiology. Future Microbiol. 2010, 5, 1733–1754. [Google Scholar] [CrossRef]
  49. Croxatto, A.; Prod’hom, G.; Greub, G. Applications of MALDI-TOF mass spectrometry in clinical diagnostic microbiology. FEMS Microbiol. Rev. 2012, 36, 380–407. [Google Scholar] [CrossRef]
  50. Kosikowska, U.; Stępień-Pyśniak, D.; Pietras-Ożga, D.; Andrzejczuk, J.; Juda, M.; Malm, A. Application of MALDI-TOF MS for identification of clinical isolates of bacteria from humans and animals. Diagn. Lab. 2015, 51, 23–30. (In Polish) [Google Scholar] [CrossRef]
  51. Attar, I.; Naili, N.; Khalifa, N.; Hazami, M.; Lazaar, M.; Farhat, A. Experimental study of an air conditioning system to control a greenhouse microclimate. Energy Convers. Manag. 2014, 79, 543–553. [Google Scholar] [CrossRef]
  52. Ozgener, L.; Ozgener, O. Energetic performance test of an underground air tunnel system for greenhouse heating. Energy 2010, 35, 4079–4085. [Google Scholar] [CrossRef]
  53. Paksoy, H.; Beyhan, B. Thermal energy storage (TES) systems for greenhouse technology. In Advances in Thermal Energy Storage Systems: Methods and Applications; Elsevier Inc.: Amsterdam, The Netherlands, 2014; pp. 433–548. [Google Scholar] [CrossRef]
  54. Llorach-Massana, P.; Peña, J.; Rieradevall, J.; Montero, J.I. Analysis of the technical, environmental and economic potential of phase change materials (PCM) for root zone heating in Mediterranean greenhouses. Renew. Energy 2017, 103, 570–581. [Google Scholar] [CrossRef]
  55. Kurpaska, S.; Latała, H.; Kiełbasa, P.; Sporysz, M.; Gliniak, M.; Famielec, S.; Łapczyńska-Kordon, B. Experimental and modeling approach to heat and mass transfer in a porous bed of a rock-bed heat accumulator. Int. J. Heat Mass. Transfer. 2021, 179, 121654. [Google Scholar] [CrossRef]
  56. PN-89/Z-04111/02; Ochrona Czystości Powietrza. Badania Mikrobiologiczne. Oznaczanie Liczby Bakterii w Powietrzu Atmosferycznym (Imisja) Przy Pobieraniu Próbek Metodą Aspiracyjną i Sedymentacyjną. Polski Komitet Normalizacyjny: Warszawa, Poland, 1989. (In Polish)
  57. PN-89/Z-04111/03; Ochrona Czystości Powietrza. Badania Mikrobiologiczne. Oznaczanie Liczby Grzybów Mikroskopowych w Powietrzu Atmosferycznym (Imisja) Przy Pobieraniu Próbek Metodą Aspiracyjną i Sedymentacyjną. Polski Komitet Normalizacyjny: Warszawa, Poland, 1989. (In Polish)
  58. Gandara, A.; Mota, L.C.; Flores, C.; Perez, H.R.; Green, C.F.; Gibbs, S.G. Isolation of Staphylococcus aureus and antibiotic-resistant Staphylococcus aureus from residential indoor bioaerosols. Environ. Health Perspect. 2006, 114, 1859–1864. [Google Scholar] [CrossRef] [PubMed]
  59. Kim, K.Y.; Kim, C.N. Airborne microbiological characteristics in public buildings of Korea. Build Environ. 2007, 42, 2188–2196. [Google Scholar] [CrossRef]
  60. Zhou, F.; Wang, Y. Characteristics of antibiotic resistance of airborne Staphylococcus isolated from metro stations. Int. J. Environ. Res. Public Health 2013, 10, 2412–2426. [Google Scholar] [CrossRef]
  61. Li, X.; Qiu, Y.; Yu, A.; Shi, W.; Chen, G.; Zhang, Z.; Liu, D. Characteristics of airborne Staphylococcus aureus (including MRSA) in Chinese public buildings. Aerobiologia 2015, 31, 11–19. [Google Scholar] [CrossRef]
  62. Górny, R.L.; Dutkiewicz, J. Bacterial and fungal aerosols in indoor environment in Central and Eastern European countries. Ann. Agric. Environ. Med. 2002, 9, 17–23. [Google Scholar]
  63. Lee, J.H.; Jo, W.K. Characteristics of indoor and outdoor bioaerosols at Korean high-rise apartment buildings. Environ. Res. 2006, 101, 11–17. [Google Scholar] [CrossRef]
  64. Kozdrój, J.; Fraczek, K.; Ropek, D. Assessment of bioaerosols in indoor air of glasshouses located in a botanical garden. Build Environ. 2019, 166, 106436. [Google Scholar] [CrossRef]
Figure 1. Structure of the ventilation system with heat recovery integrated with the building.
Energies 16 04456 g001
Figure 2. The functional diagram of the experimental heat exchanger placed in a semi-cylindrical foil tunnel. Source: own elaboration based on Kurpaska et al. [2].
Energies 16 04456 g002
Figure 3. Diagram of control algorithm of the stone accumulator charging and discharging processes.
Energies 16 04456 g003
Figure 4. Input and output streams together with processes in the stone heat accumulator bed.
Energies 16 04456 g004
Figure 5. Unit amount of heat in separate experimental cycles together with the parameters of the air supplied to the accumulator.
Energies 16 04456 g005
Figure 6. Unit heat stream in separate experimental cycles.
Energies 16 04456 g006
Figure 7. Accumulator outlet temperature as a function of the decisive variables (a) and the accuracy of its modeling calculated from the correlation equation and determined experimentally (b).
Energies 16 04456 g007
Figure 8. Accumulator outlet air temperature as a function of airflow and initial accumulator bed temperature (a) and the accuracy of modeling this change calculated from the correlation equation and determined experimentally (b).
Energies 16 04456 g008
Figure 9. Final accumulator bed temperature as a function of airflow and initial accumulator bed temperature (a) and the accuracy of modeling this change calculated from the correlation equation and determined experimentally (b).
Energies 16 04456 g009
Figure 10. Change in the final temperature of the accumulator bed (a) and the accuracy of modeling this change calculated from the correlation equation and determined experimentally (b).
Energies 16 04456 g010
Figure 11. Influence of the injection airflow rate and initial bed temperature on the final water vapor content of the outlet air (a) and the difference in vapor concentration between the pumped air and the outlet air from the accumulator (b).
Energies 16 04456 g011
Figure 12. The effect of the temperature of the air pumped into the accumulator and its water vapor content on the difference in water vapor concentration (a) and the accuracy of modeling this change calculated from the correlation equation and determined experimentally (b).
Energies 16 04456 g012
Table 1. Sampling scheme.
SymbolDescriptionDay of Sampling
A Before starting up the greenhouse0
B After start-up and achieving maximum fan efficiency0
C After 1 week of fan operation7
D After 2 weeks of fan operation15
E After 3 weeks of fan operation21
FAfter one month (4 weeks) of continuous operation of the greenhouse fans28
Table 2. Limit values (CFU∙m−3) for air pollution by microorganisms.
BacteriaFungiActinomycetesDegree of Air Pollution
<1000 3000–5000<10unpolluted
1000–3000 5000–10,000 10–100moderately polluted
>3000 >10,000>100heavily polluted
Author’s own elaboration based on standards [56,57].
Table 3. Microbial counts (CFU∙m−3) of microbial aerosols.
Date of SamplingSampling Point
1 (Control)234
Bacteria
A23 ab50 ab67 ab113 abc
B7 a37 ab43 ab80 ab
C170 abc97 ab180 abc260 abc
D30 ab60 ab88 ab129 abc
E15 a47 ab67 ab90 ab
F155 abc107 ab210 abc273 abc
Fungi
A1227 a670 a740 a980 a
B1660 ab983 a1567 ab1963 ab
C2543 ab1040 a1747 ab1273 a
D2003 ab980 a1940 ab1503 ab
E1567 ab940 a800 a1010 a
F1789 ab983 a1090 a1665 ab
Actinomycetes
A3 a0 a0 a3 a
B0 a3 a23 * ab17 * ab
C7 a7 a7 a7 a
D0 a8 a4 a0 a
E0 a5 a0 a3 a
F5 a0 a3 a5 a
Staphylococci
A3 a37 ab7 a0 a
B0 a0 a7 a13 a
C10 a3 a13 a47 ab
D4 a41 ab7 a54 ab
E0 a6 a7 a11 a
F8 a3 a15 a0 a
* limit values exceeded [55]. A—Before greenhouse start-up (18 April 2020); B—After start-up and reaching maximum fan efficiency (18 April 2020); C—After 1 week (25 April 2020); D—After 2 weeks (2 May 2020); E—After 3 weeks (9 May 2020); F—After one month (4 weeks) of continuous fan operation in the greenhouse (16 May 2020). The different letters within a column indicate a significant difference at p < 0.05 according to Tukey’s test.
Table 4. Physical characteristics of the greenhouse and outdoor air.
Date of SamplingSampling Point
PM101 (control)234
A22 a45 * ab42 * ab47 * ab
B32 a62 * ab58 * ab57 * ab
C37 a51 * ab53 * ab48 * ab
D25 a41* ab43* ab45* ab
E30 a38 a37 a39 a
F26 a29 a33 a32 a
PM2.51 (control)234
A21 * a32 * a37 * a33 * a
B30 * a46 * ab46 * ab43 * ab
C33 * a52 * ab49 * ab48 * ab
D37 * a37 * a40 * ab45 * ab
E33 * a33 * a30 * a29 * a
F30 * a29 * a28 * a30 * a
T (°C)1 (control)234
A15.1 a27 a29.7 a33.3 a
B24.7 b30.5 a27.6 a27.7 b
C19.6 a26.5 a28.5 a29.4 b
D28 b31.9 b30.5 b31.2 b
E29.5 b36.9 b35 b34.5 b
F22.4 a25.5 a24.3 a23.2 a
T (°C) mean23.2 a29.7 b29.3 b29.9 b
RH (%)1 (control)234
A70 a9 b11 a12 a
B60 a12 b15 a17 a
C49 a42 a 38 b45 b
D58 a28 b30 b31 b
E74 a26 b27 b24 a
F80 a19 a20 a22 a
RH (%) mean65.222.623.525.2
PM2.5 and PM10—particulate matter particles with an aerodynamic diameter of 2.5 and 10.0 μm (μg∙m−3). T (°C) and RH (%), temperature and relative humidity, respectively. A—Before greenhouse start-up (18 April 2020); B—After start-up and reaching maximum fan efficiency (18 April 2020); C—After 1 week (25 April 2020); D—After 2 weeks (2 May 2020); E—After 3 weeks (9 May 2020); F—After one month (4 weeks) of continuous fan operation in the greenhouse (16 May 2020). * exceeded limit values specified in the Regulation of the Minister of Environment of 24 August 2012 on levels of certain substances in the air (PM2.5 = 20 μg∙m−3 and PM10 = 40 μg∙m−3). The different letters within a column indicate a significant difference at p < 0.05 according to Tukey’s test.
Disclaimer/Publisher’s Note: The statements, opinions and data contained in all publications are solely those of the individual author(s) and contributor(s) and not of MDPI and/or the editor(s). MDPI and/or the editor(s) disclaim responsibility for any injury to people or property resulting from any ideas, methods, instructions or products referred to in the content.

