Article

The Use of Methanol Vapour for Effective Drying of Cellulose Insulation

Institute of Electric Power Engineering, Faculty of Environmental Engineering and Energy, Poznan University of Technology, 60-965 Poznan, Poland
*
Author to whom correspondence should be addressed.
Energies 2023, 16(11), 4465; https://doi.org/10.3390/en16114465
Submission received: 4 May 2023 / Revised: 24 May 2023 / Accepted: 30 May 2023 / Published: 31 May 2023
(This article belongs to the Special Issue Design and Optimization of Power Transformer Diagnostics II)

Abstract

:
The paper deals with a new method of drying cellulose insulation, which uses methanol vapour present in nitrogen as a drying medium. Compared to the insulation drying methods currently used in the industry, the method presented in the article has the following advantages: there is no cellulose depolymerization because there is no need to heat the insulation, there is no need to use large-size and energy-intensive dryers because the whole process takes place in the tank of the transformer. Important parameters of the drying process, such as methanol concentration in the nitrogen, flow rate, and process duration, were determined in four separate experiments. For the purposes of these experiments, a special system was constructed to control and measure the flow of drying medium. Controlling the flow rate of the carrier gas (nitrogen) made it possible to obtain different concentrations of methanol in nitrogen. Such values of concentration and flow rate were determined that allow drying of pressboard and paper in less than 144 h to a level lower than 1%.

1. Introduction

The ability of the insulation systems based on impregnated cellulose materials to work reliably depends on their current degree of aging. If the degree of polymerization of cellulose, which correlates with mechanical strength [1], is taken as the measure of aging, then in the case of typical exposures occurring in the transformer (temperature, electric field strength, and mechanical stresses), the aging process will depend on the combination of these exposures [2]. By reproducing thermal and electrical exposures in laboratory conditions, it can be proved that thermal exposures are dominant [3]. In this case, the most important factor that affects the speed of the aging process of cellulose is its moisture, because water causes intensification of aging, especially at elevated temperatures [4,5,6]. Therefore, maintaining a low value of water content in the insulation is one of the most important aspects affecting the life of the insulation [7,8,9,10].
In order to keep the water content in the transformer insulation system low, it is necessary to dry it properly during the production of the device. However, effective and at the same time safe for insulation removal of water from cellulose is one of the most important technological challenges [11,12].
The methods of drying cellulose insulation currently used in the industry consist in heating it to a temperature that allows water to evaporate. Because the high temperature of the drying process accelerates the cellulose depolarization reaction, the process is carried out at reduced pressure in the drying chamber, thanks to which the temperature of water release from the insulation is lowered and the drying process efficiency is increased.
The conventional method of drying involves placing the insulation system in a large-scale vacuum dryer, where the temperature is raised to approximately 85 °C–130 °C. After heating the insulation, the pressure is lowered to the value below 1 mbar. The heating and pressure reduction cycle is repeated many times to achieve a satisfactory level of insulation drying [13,14]. Providing heat to the insulation in this way is relatively inefficient, which is why the heat released during the condensation of solvent vapour is often used. Solvent vapour (e.g., kerosene) with a high temperature of about 130 °C are fed into a dryer where the pressure is reduced to 7 hPa. In this way, the effect of immediate condensation of the solvent on the surface of the insulation system is obtained, which allows for quick heating of the insulation.
Another way of supplying heat to the transformer insulation is heating the windings with direct current or low-frequency current [15,16]. As in the previous method, the drying process takes place at reduced pressure, while the insulation is heated by spraying hot oil (patent DE 195 01 323 A1).
Similar, though differing in details, methods of drying were presented at the symposium “LFH-Trockung: Erfahrung und Trends” in Stuttgart in 1999 [17] and in patent solution no. PL 199386 (US 6,634,117 B2). This solution applies to transformers at the place of their installation, which are filled with oil. The presented method of drying is based on heating the transformer windings with low-frequency current (LFH—Low Frequency Heating method). In addition, the transformer oil is dried using an oil treatment system [16]. In the patent description No. PL 199386 (US 6,634,117 B2) a compilation of the two methods described above is presented. This solution uses both heating the windings with the LFH method and by spraying the solid insulation with hot oil. The water is drained from the transformer tank by a vacuum system.
Regardless of the thermal-vacuum method used, there is a side effect in the form of a decrease in the degree of cellulose polymerization. The new cellulose insulation has a polymerization degree ranging from 1200 to 1450 [18,19]. As a result of drying the insulation at the transformer production stage, the degree of polymerization may drop even to the value of 1000 [1,18]. To eliminate the problem of lowering the degree of cellulose polymerization during drying, the authors proposed a new drying method. In this method, a gas mixture of nitrogen and methanol vapour is used as a drying medium.
The paper presents the results of research aimed at developing a methodology for drying insulation, and in particular: determining the dynamics of the drying process for pressboard samples of various thicknesses, determining the necessary drying time, and determining the final content of methanol in the samples.

2. The Concept of Using Methanol for Drying Cellulose Materials—State of Art

To eliminate the problem associated with a decrease in the degree of cellulose polymerization during its drying, an alternative method was proposed that does not require the use of high temperature. This method involves immersing the cellulose material in methyl or ethyl alcohol. Both of these alcohols are characterized by high polarity and the ability to attach water molecules using hydrogen bonds. The authors of paper [20] carried out initial research, to answer the question of which of these alcohols would be more effective in removing water from cellulose materials. Figure 1 shows the drying dynamics of 5 mm thick pressboard using methanol and ethanol with an initial water content of 0.1%. The initial water content of the pressboard was equal to 6.5%.
Analyzing the results presented in Figure 1, it can be stated that the effectiveness of drying pressboard using methanol is much higher than in the case of ethanol. The electric permittivity of methanol and ethanol for a temperature of 20 °C is 33.0 and 25.3, respectively. The high polarity of methanol positively affects its ability to extract highly polar water (εr = 80.1) from the cellulose material. The solubility of water in alcohol depends on its molecular weight. The higher the molecular weight, the lower the water solubility. The molecular weight of methanol is 30% lower than that of ethanol. As shown in Figure 1, both the final drying effect and the drying dynamics are much better in the case of methanol. For this reason, the new drying method was based on this alcohol.
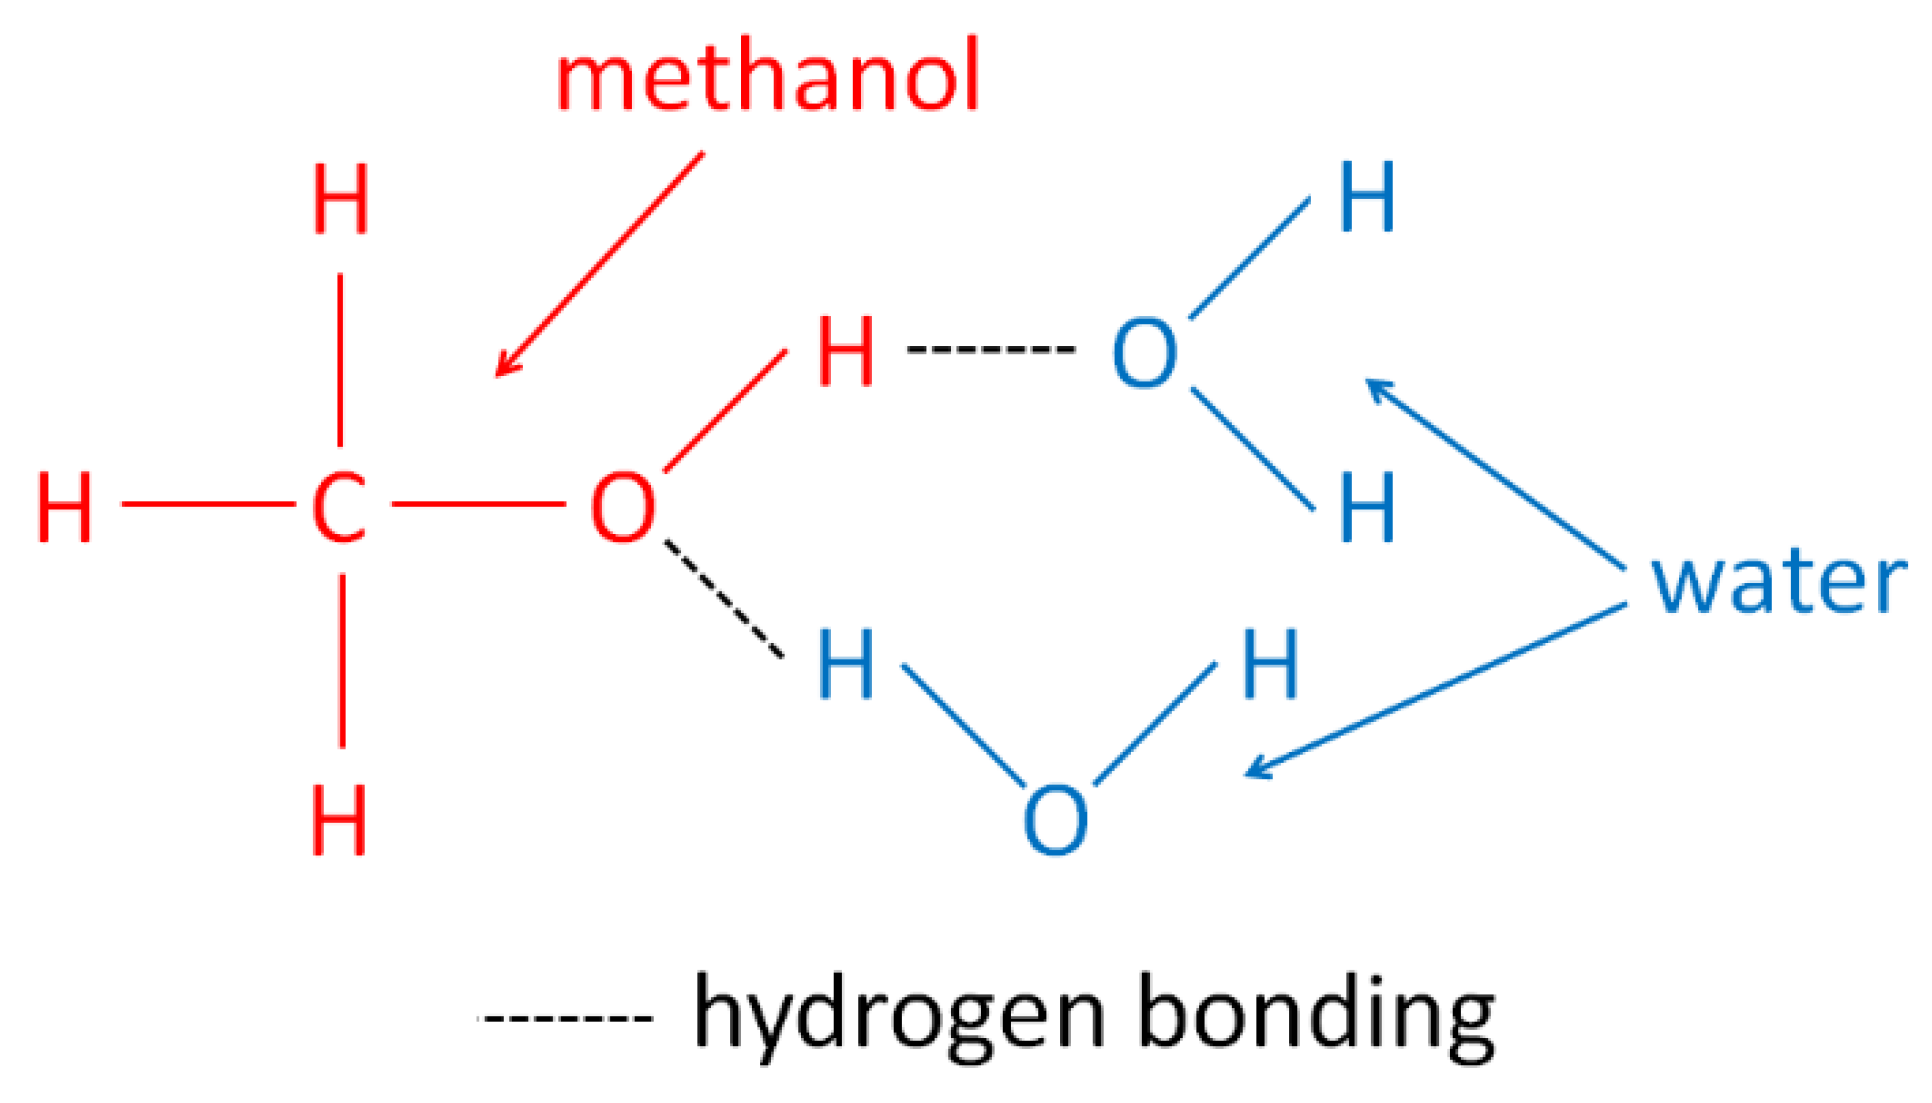
This method has been discussed in detail in publications [21,22]. It is based on the use of methanol in the liquid phase to extract water from the cellulose materials. Extraction of water from cellulose materials by immersion in methanol is also used in the methods of measuring water content using Karl Fischer titration [23] and using near-infrared spectrophotometry [24]. The research presented in paper [21] showed that effective extraction of water using methanol is possible in the case of relatively thick cellulose materials. According to the test results presented in [21], the time needed to reduce the water content from 5.5% to 0.5% in pressboard materials with a thickness of 0.5 mm, 1 mm, 2 mm, and 3 mm is equal to 25 min, 65 min, 90 min, and 209 min, respectively. The high efficiency of this drying method results from the high solubility of water in methanol. Hydrogen bonds with a stronger strength than between water molecules are formed between water and methanol molecules [25]. This hydrogen bond occurs between the oxygen atom of negative charge belonging to water or methanol molecule and hydrogen atom of positive charge belonging to one of these molecules (Figure 2). The occurrence of hydrogen bonds between water and methanol molecules has been described, among others in [25,26,27]. The authors of [27] used Raman spectroscopy to confirm the presence of hydrogen bonds between molecules of water and methyl alcohol.
The biggest advantage of drying cellulose insulation by immersing it in methanol is the elimination of the problem of cellulose depolymerization at the device production stage. Unfortunately, the test results presented in [20] showed that as a result of saturation of thick pressboards with methanol, their swelling occurs, which results in their delamination (Figure 3).
The delamination phenomenon disqualifies this drying method in the case of devices whose insulation system is made of, among others, thick pressboards, which takes place, for example, in power transformers. In the delaminated pressboard, the electric field may be locally strengthened, which may result in the appearance of dangerous partial discharges. Therefore, to eliminate this problem, the authors of this paper proposed the use of methanol vapour as a drying medium for cellulose materials.

3. Drying of Cellulose Materials Using Methanol Vapour

3.1. The Aim of the Research

The main aim of the research was to check the effectiveness of drying cellulose materials with the use of methanol vapour, whose carrier gas is nitrogen. The conducted research was intended to answer the following questions:
  • What is the difference in the effectiveness of drying cellulose materials using nitrogen and methanol vapour whose carrier gas is nitrogen?
  • Is there delamination after drying the pressboard with methanol vapour? Such a problem has been found in the case of drying cellulose materials by directly immersing them in methanol.
  • What is the influence of pressboard drying time using methanol vapour on the effectiveness of this process?
  • Is it possible to dry cellulose materials to a satisfactory level of water content below 1%?
  • What is the influence of the thickness of cellulose materials on the effectiveness of their drying using methanol vapour?
  • What is the methanol residue in cellulose materials after their drying?
To answer the above questions, four stages of research have been planned, the results of which are presented in Section 3.3.

3.2. Carrier Gas Flow Control Laboratory System

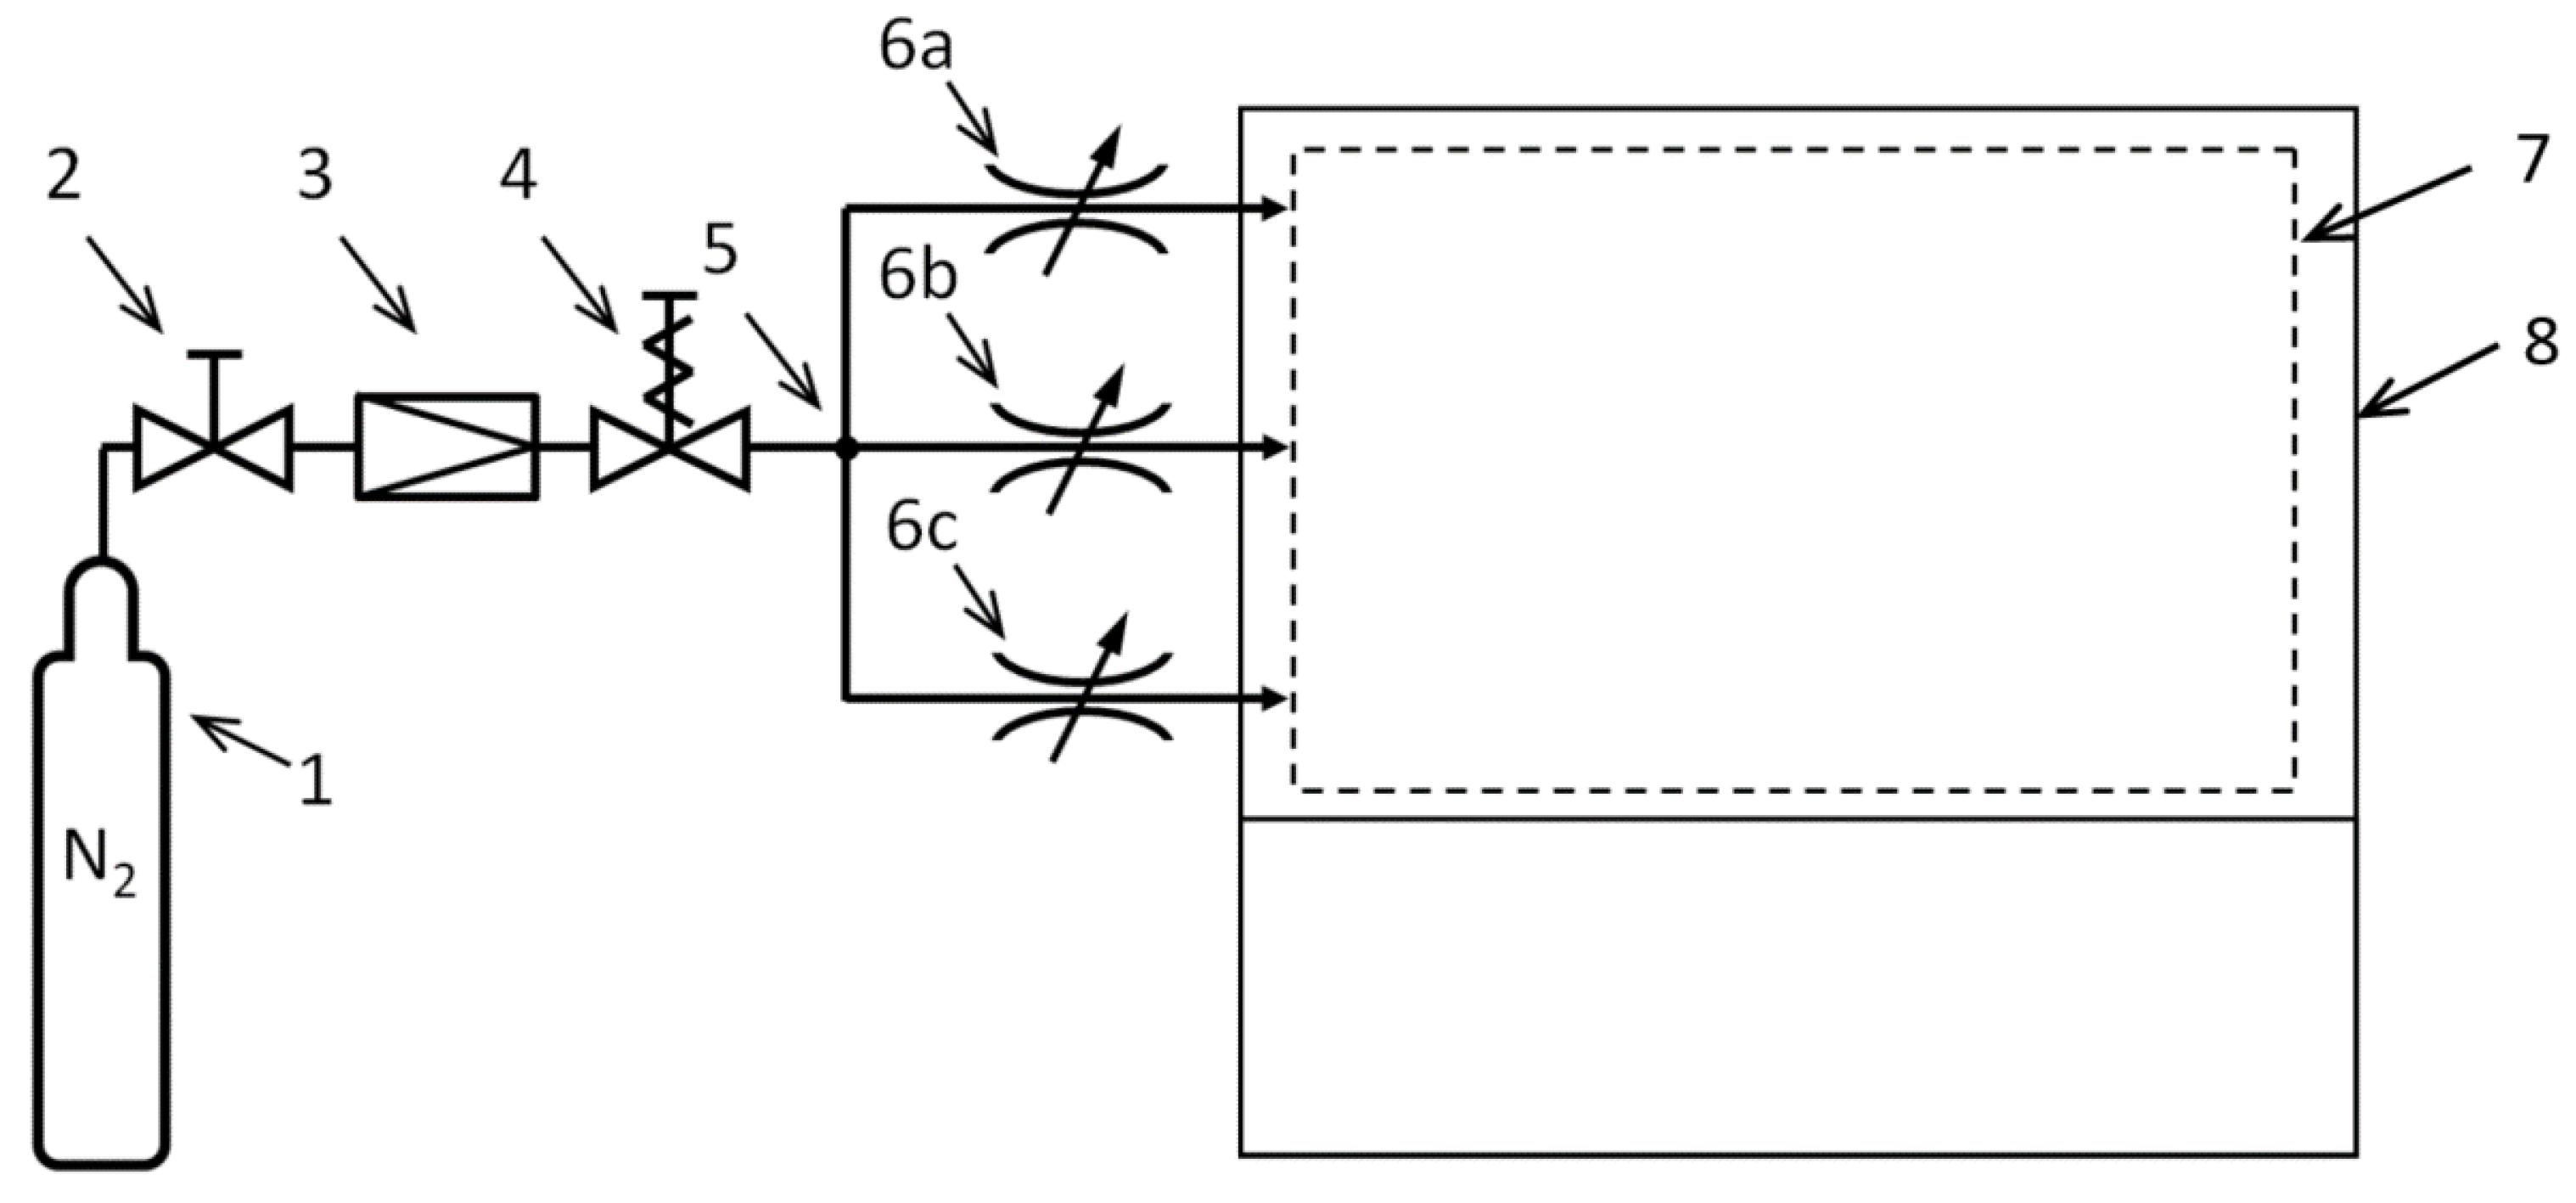
The main part of the laboratory systems used in all model tests was the dry nitrogen supply system. A diagram of this system is shown in Figure 4. The gas cylinder contains nitrogen 5.0 (purity ≥ 99.999%) at a pressure of 200 Bar. A cylinder valve was used to close and open the gas bottle, while the reducer allowed to limit the nitrogen pressure to a maximum value of 2 Bar. Another element of the system is the solenoid valve, which enables two-state control (on/off) used in the event of the need to sequentially supply the system with nitrogen. The solenoid valve can be controlled, for example, from a clock relay, which can give on/off signals at programmed time intervals. Behind the solenoid valve there is a distributor, thanks to which nitrogen is distributed evenly into three independent tracks (made of PVC pipes).
On each of the three tracks a flow meter with the possibility of flow adjustment was installed. The nitrogen flow in each pipes could be adjusted in resolution of 0.02 L/min up to a maximum of 0.5 L/min.
The pipes were led to a fume cupboard, where, depending on the needs of the experiments, nitrogen flow systems (through containers with methanol and tested samples) were configured. These systems are presented in the description of sub-sequent experiments in Section 3.3.

3.3. Test Results and Their Discussion

3.3.1. Stage 1

Test Objects and Measurement Procedure

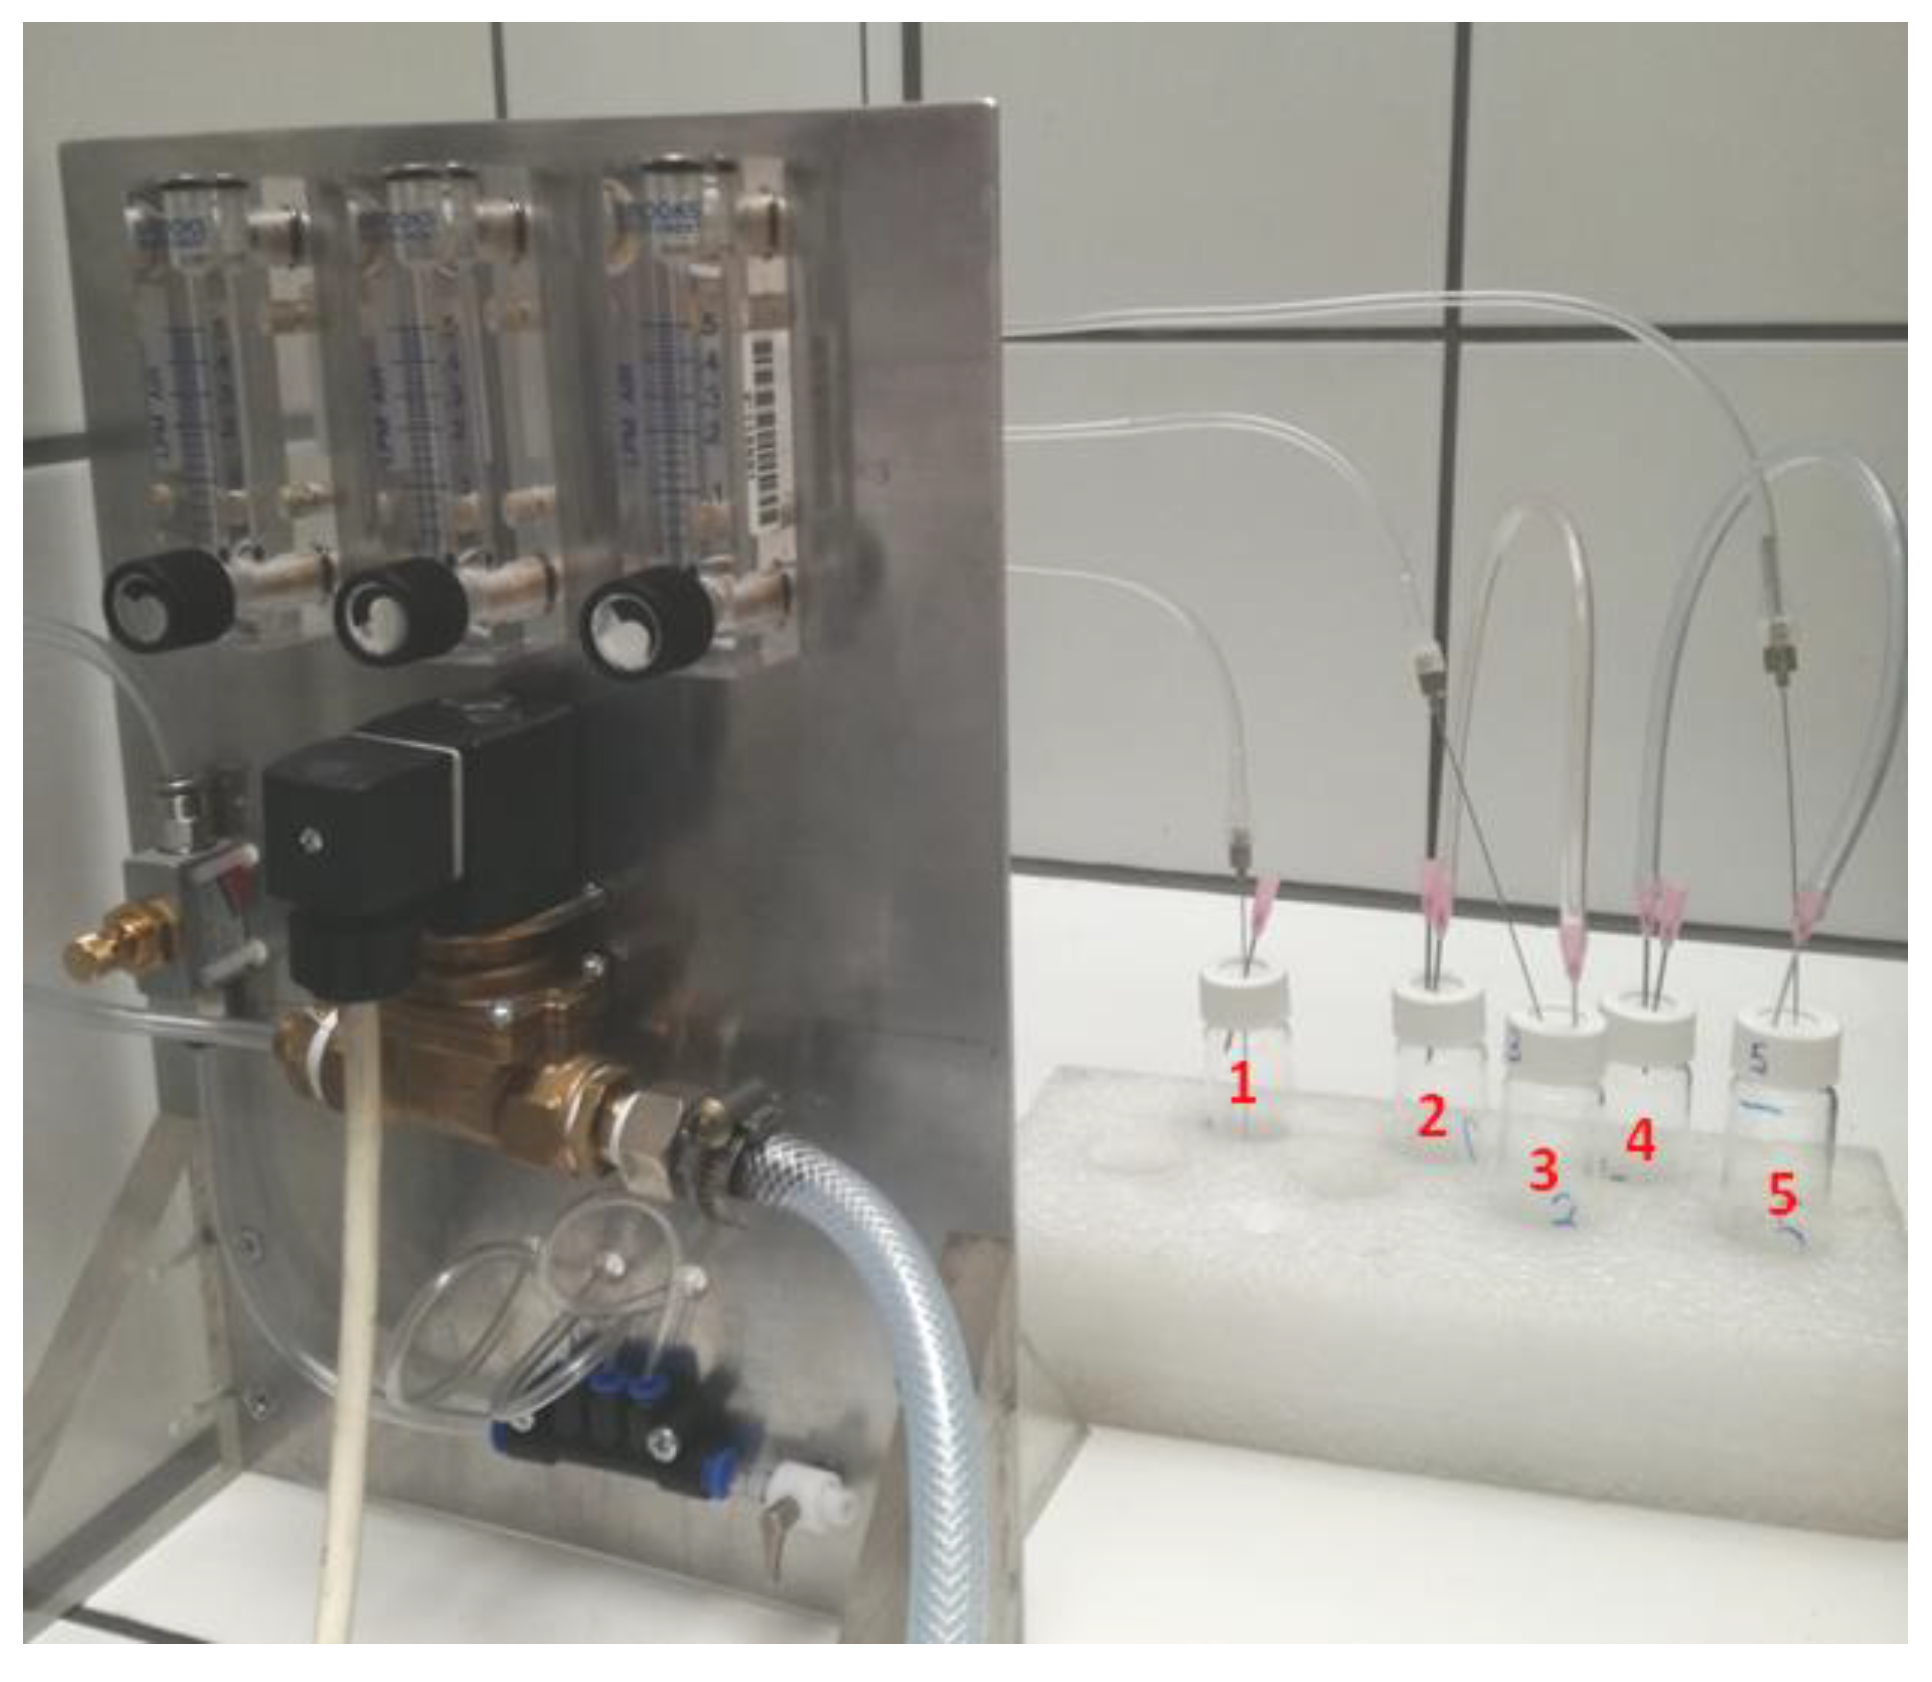
At the first stage of the research, three pressboard samples with dimensions of 40 mm × 15.7 mm × 5 mm were dried. Before drying, the samples were stored in the same conditions so that their initial moisture content was similar. Sample no. 1 was dried using pure nitrogen 5.0 only, while samples 2 and 3 were dried using methanol vapour with nitrogen as the carrier gas. The system used for drying the pressboard samples is shown in Figure 5. The system consisted of three carrier gas flow tracks described in detail in Section 3.2.
Pressboard sample no. 1 was used to check the effect of the carrier gas on the loss of water content in pressboard. Through the membrane placed in the cap of vial no. 1 (Figure 5) two needles were inserted, with the help of which nitrogen flow was forced through the vial with the pressboard sample. The nitrogen flow rate was about 1.8 L per hour.
Nitrogen carrier gas flowed through vial no. 3 partially filled with methanol. The resulting methanol vapour was transferred to vial no. 2, which contained a pressboard sample marked no. 2. The flow rate of nitrogen through vials 2 and 3 was approximately 1.8 L per hour.
In turn, pressboard sample no. 3 was placed in vial no. 4. The methanol vapour used to dry this sample was generated in vial no. 5. The flow rate of nitrogen through vials 4 and 5 was 6 L per hour.
In all three cases, the drying time was 70 h.

Research Results and Their Discussion

Table 1 shows the drying results of 5 mm thick pressboard samples. The initial water content in the tested samples (WCPi) was determined by oven drying method on the basis of the pressboard sample weight before and after drying in a vacuum dryer (24 h, 0.3 mbar, 90 °C).
The water content in the pressboard samples after the drying process (WCPd) was determined by the Karl Fischer titration method in accordance with the standard [23]. The loss of water content during the drying process expressed in percentage points (ΔWCP) was calculated by subtracting the WCPi value from the WCPd value.
The concentration of methanol in nitrogen (Cm) used in the process of drying the pressboard samples was calculated based on the nitrogen flow rate (Va), drying time and the mass of evaporated methanol.
Moreover, the percentage of methanol in the pressboard after its drying (WCM) was calculated based on the weight of methanol remaining in the sample and the weight of the dry pressboard.
Based on the obtained test results, the following statements were formulated:
  • In the case of sample no. 2 dried in the system with a lower nitrogen flow (1.8 L/h), a better drying efficiency was found than in the case of sample no. 3 dried in the system with a nitrogen flow of 6.0 L/h. The difference in water content in both samples after the drying process is 0.35 p.p. The explanation for this result is the higher concentration of methanol vapour in the nitrogen used for drying sample no. 2, which was obtained by using a lower nitrogen flow;
  • After the drying process, a lower methanol content was found in the pressboard sample no. 3, which was dried in a system with a higher nitrogen flow, than in the case of sample no. 2;
  • The applied drying procedures did not allow to reduce the water content in the 5 mm thick pressboard to a level below 1.0%. To achieve the assumed goal, it is necessary to extend the drying time and optimize the concentration of methanol vapour in nitrogen. In the case of currently used drying methods, the excessive residual moisture can also remain in some bulky insulating components. Typically, these are supports for leads, cylinders, core support insulation, etc. [28].
  • After drying, there was no problem with pressboard delamination as was the case in the method requiring immersion of the material in methanol.

3.3.2. Stage 2

Test Objects and Measurement Procedure

Four pairs of pressboard samples with dimensions of 69.7 mm × 14.8 mm × 2.1 mm were subjected to drying. Samples 1 and 2, 3 and 4, and 5 and 6 were dried with methanol vapour. Samples 7 and 8 were used to determine the initial water content. Before drying, the samples were stored in the same conditions to ensure a similar level of moisture. Samples 1 and 2 were placed in vial A, samples 3 and 4 were placed in vial B, samples 5 and 6 were placed in vial C, vials D, E and F were methanol tanks (Figure 6). Vial G contained samples 7 and 8 used to determine the initial water content.
Nitrogen flowed through vial D, which was partially filled with methanol. The methanol vapour generated in vial D was transferred to vial A, which contained samples of pressboard 1 and 2. The drying time of the samples was 22 h. Samples 3 and 4 as well as 5 and 6 were dried in a similar way, with the difference that the drying time in their case was 46 h and 70 h, respectively. In all cases, the flow rate of nitrogen through the vials was approximately 2.4 L per hour.
Samples 7 and 8 were dried in a vacuum chamber (90 °C, 0.3 mbar, 12 h). The weight of the samples after the drying process was used to determine the initial moisture content of the pressboard samples (WCPi).

Research Results and Their Discussion

Table 2 presents the results of drying pressboard samples with a thickness of 2.1 mm. The values given in the table were calculated in the same way as in the first stage of the research.
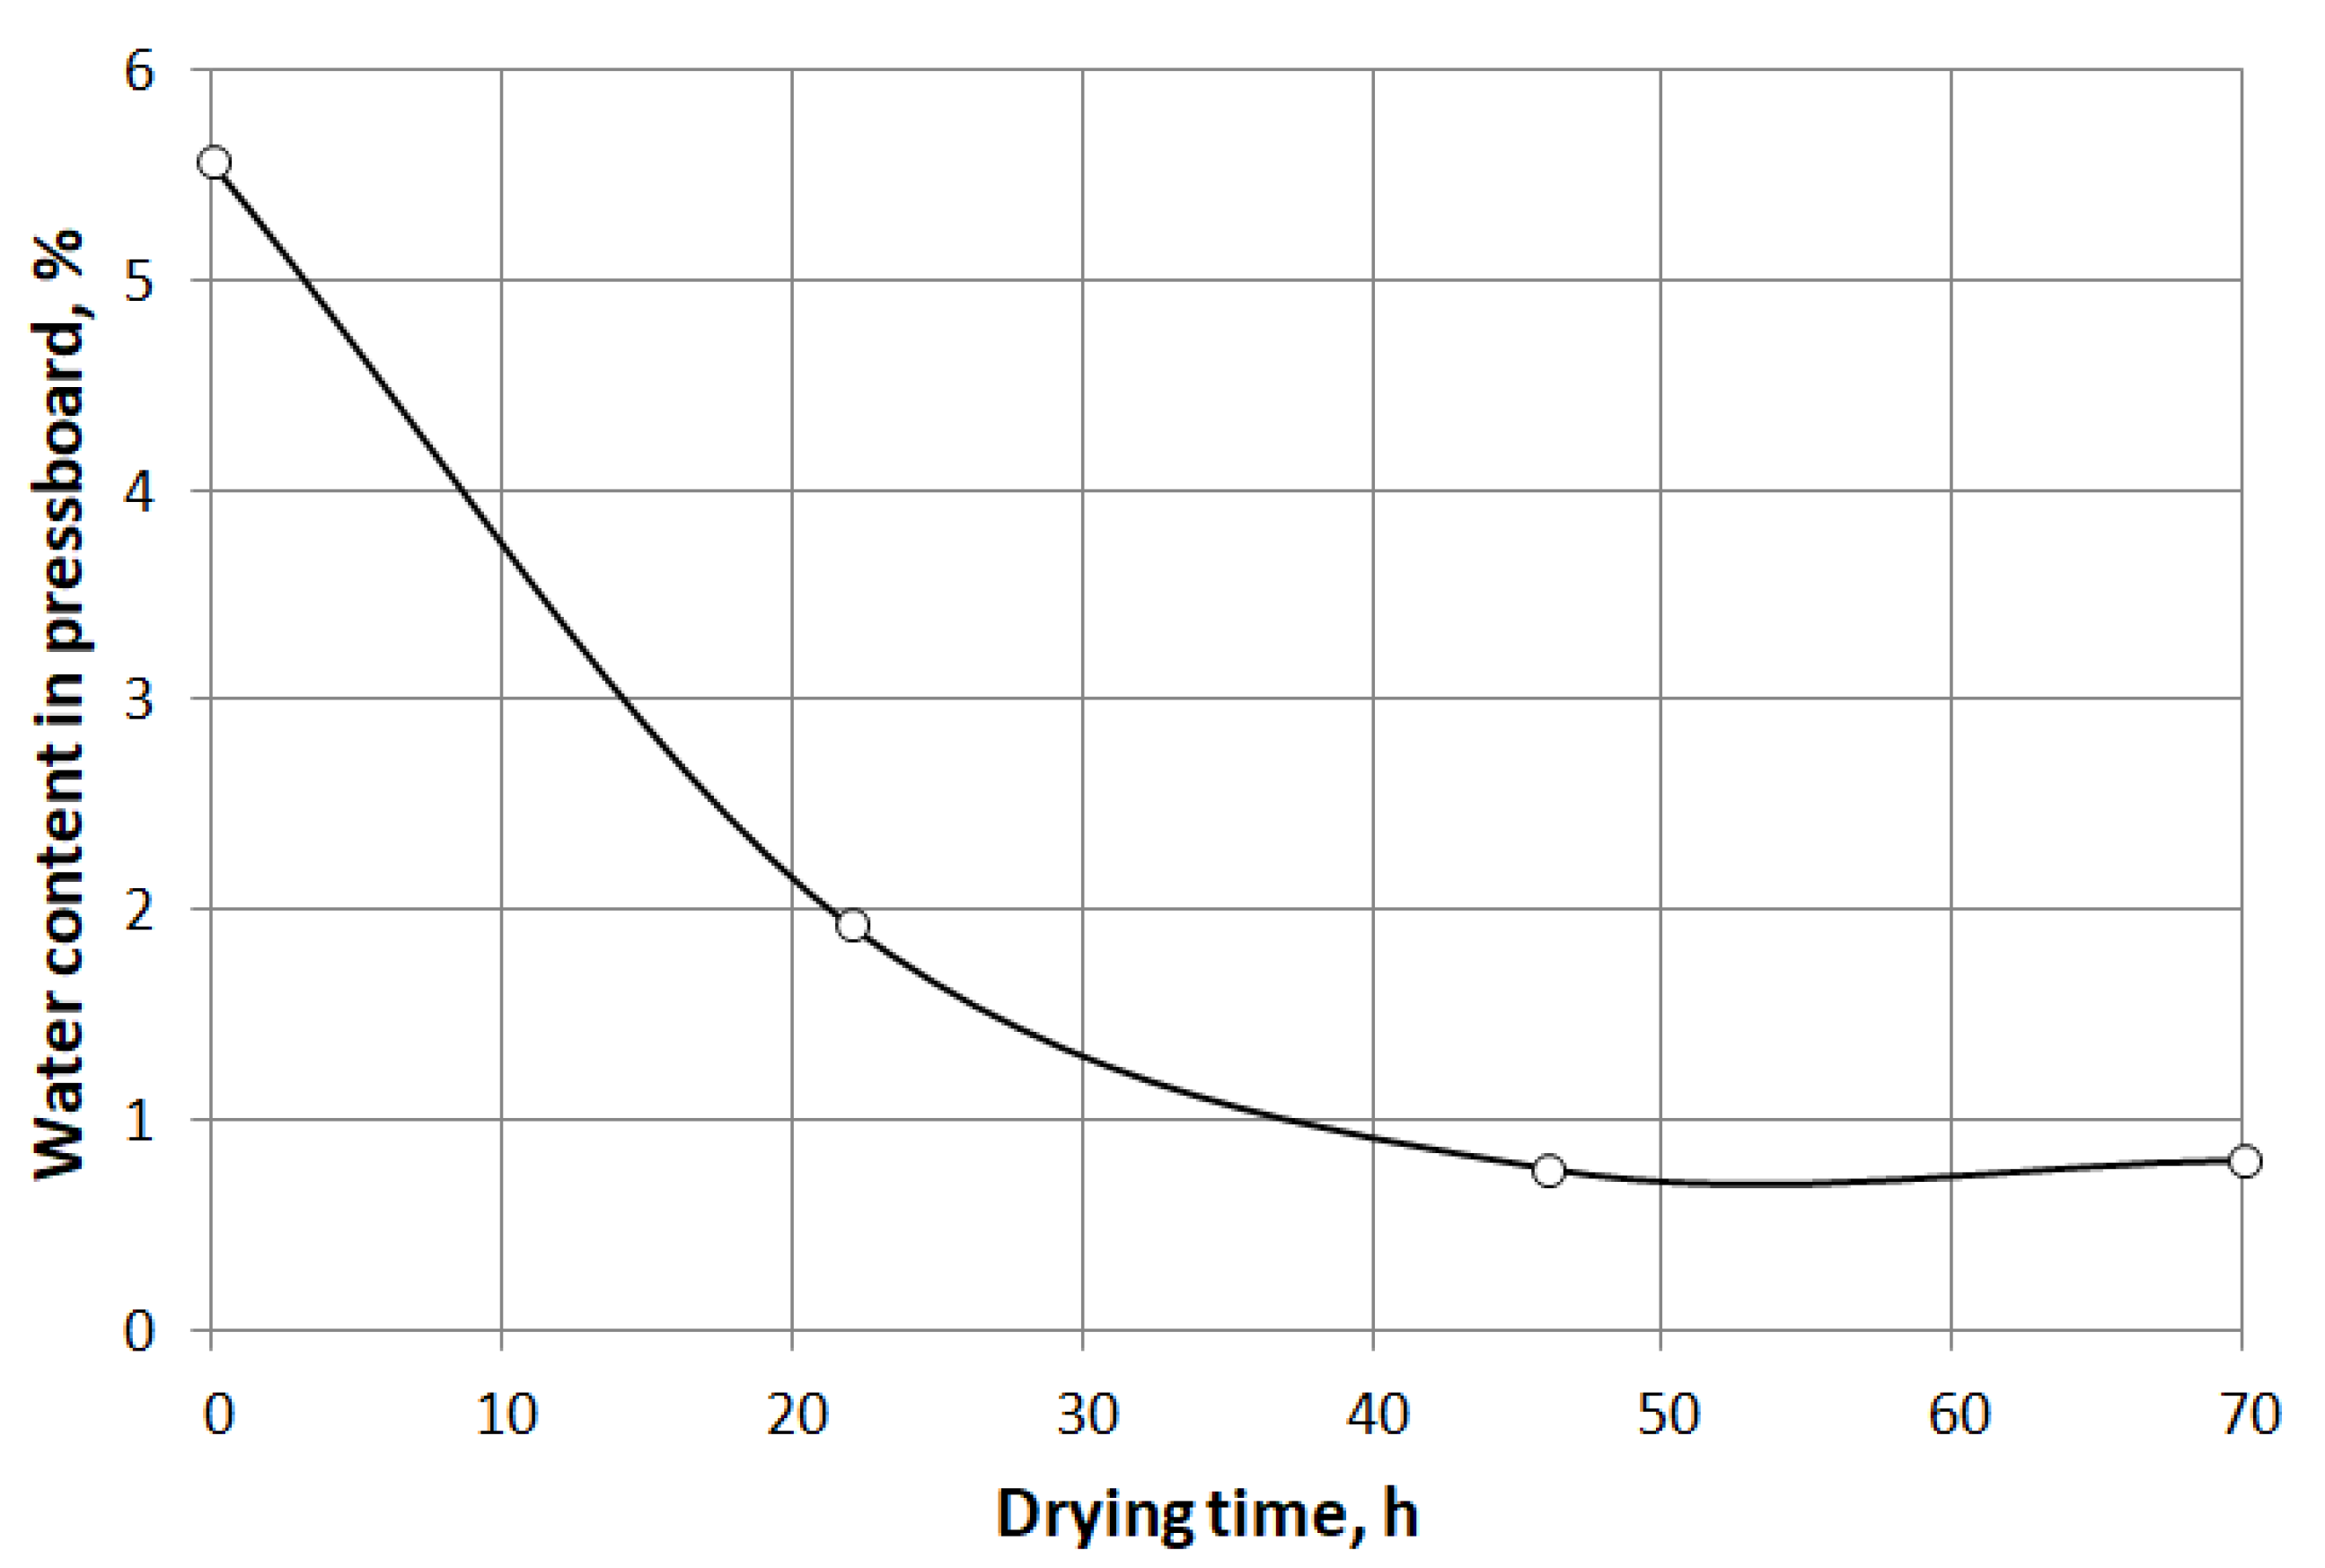
Figure 7 shows the dependence of the water content in pressboard on the time of its drying using methanol vapour.
Based on the obtained results, the following conclusions were drawn:
  • A significant influence of the drying time on the efficiency of this process was found.
  • The drying time of 46 h, used in the case of samples 3 and 4, allowed to reduce the water content to 0.77%. Extending the drying time to 70 h did not result in a further reduction of moisture content (Figure 7). The obtained moisture level is acceptable considering the water content levels usually obtained during the conventional drying method. The time it takes to get a moisture level below 1% is also satisfactory.
  • After drying, there was no problem with pressboard delamination.

3.3.3. Stage 3

Test Objects and Measurement Procedure

Three samples of paper with a thickness of 0.055 mm were subjected to drying. Before drying, the samples were stored in the same conditions to ensure a similar level of their initial moisture. The arrangement of the paper samples in the vials was analogous to that in the first stage of the research.
Sample 1 was used to find the effect of the carrier gas on the loss of water content in the paper. Through the membrane placed in the cap of vial no. 1 two needles were inserted, with the help of which nitrogen flow was forced through the vial with the paper sample. After drying, the water content in the sample was tested by oven drying method.
Nitrogen carrier gas flowed through vial no. 3 partially filled with methanol. The resulting methanol vapour was transferred to vial no. 2, which contained a paper sample marked no. 2. After drying, the sample was weighed and then purged with nitrogen. The purpose of this procedure was to reduce the methanol content in the sample after the drying process. The purging lasted 24 h (about 0.6 L/h). After its completion, the water content in the sample was tested using the KFT method.
In turn, pressboard sample no. 3 was placed in vial no. 4. The methanol vapour used to dry this sample were generated in vial no. 5. After drying, the sample was weighed and then the water content was measured using the KFT method. In this case, after the drying process, the paper was not blown with the carrier gas.
The drying time of all three paper samples was 70 h and the nitrogen flow rate was about 2.4 L per hour.

Research Results and Their Discussion

Table 3 presents the results of paper drying. The values given in the table were calculated in the same way as in the first and second stages of the research.
Based on the obtained research results, the following statements were formulated:
  • The use of methanol vapour for drying paper samples allowed to obtain a very low moisture level, not exceeding 0.5% (samples 2 and 3). This result was obtained after 70 h of drying;
  • In the case of sample 2, after the drying process, nitrogen purging was used to reduce the methanol content. This allowed for a lower methanol content in the sample (1.56%) compared to the methanol content in sample 3 (4.03%), which was not purged with nitrogen;
  • In the case of sample 2, a higher water content level was obtained (0.41%) than in the case of sample 3 (0.09%). This was caused by the secondary moisture of sample no. 2 during the process of its purging with nitrogen.

3.3.4. Stage 4

Test Objects and Measurement Procedure

In the last stage of the research, thick pressboard with the same dimensions as in stage 1 was dried. The aim of the study was to check whether extending the drying time would allow reducing the water content in the 5 mm thick pressboard to an acceptable value, i.e., below 1%. The second objective of the study was to check whether it is possible to eliminate methanol from the dried pressboard by applying reduced pressure.
In the test, one track of the measuring system presented in Figure 5 was used. The carrier gas flowed through vial partially filled with methanol. The generated methanol vapour was transferred to vial, which contained the pressboard sample. In this experiment, the drying time of the sample with methanol vapor was equal to 6 days. After the drying, the sample was placed in a vacuum chamber for 12 h. The pressure in the chamber was kept at 1 mbar. Table 4 shows the initial water content in the pressboard sample (WCPi), the water content in the pressboard samples after the drying process (WCPd), the loss of water content during the drying process expressed in percentage points (ΔWCP), the nitrogen flow rate (Va), the concentration of methanol in nitrogen (Cm), and methanol content in pressboard after vacuum application (WCM). Individual parameters were determined in the same way as in the previously described stages of research.
On the basis of the obtained test results, it was found that the doubling of the drying time, i.e., from three (Stage 1) to six days (Stage 4), allowed to reduce the water content in pressboard to the accepted value, i.e., below 1%. The time needed to achieve a moisture level below 1% is satisfactory. Depending on the drying procedure used and the dimensions of the insulation system, the drying time of the power transformer insulation using the conventional technique is even several days.
The study showed that even as a result of applying a pressure reduced to 1 mbar, it is not possible to completely eliminate methanol from the dried cellulose material. The use of low pressure reduced the methanol content from approximately 7% (Stage 1) to 1.4% (Stage 4). The inability to completely remove methanol in the described procedure indicates high bond energy between cellulose and methanol molecules. It is therefore reasonable to conduct research on the influence of the presence of methanol in cellulose in the range of 1.4% to 8.0% on the properties of cellulose materials, which are important from the point of view of transformer operation.

4. Conclusions and Direction of Further Research

The use of methanol vapour, whose carrier gas is nitrogen, allows for the effective drying of cellulose materials. In the case of paper and pressboard with a thickness of 2.1 mm, the water content was reduced within three days to the levels acceptable for new transformers after their production process, i.e., to values not exceeding 1%. In the case of a pressboard with a thickness of 5 mm, a water content of 1.26% was obtained. To improve this result, the drying time has been extended twice, which allowed to reduce the water content to an acceptable value equal to 0.75%.
Based on the inspection of pressboard samples after the drying process with methanol vapour, no delamination of the material was found, and therefore the problem occurring in the case of drying cellulose materials by direct immersion in methanol was eliminated.
The obtained test results revealed a significant methanol content in the samples of cellulose materials after the drying process—this is a serious problem that requires further research. Preliminary tests showed no negative effect of methanol remaining in the cellulose material on its physicochemical properties. However, these studies require supplementation.
Taking into account the above-mentioned conclusions, the following tests are planned to be performed:
  • Studies of dielectric properties of cellulose materials dried with methanol vapour;
  • Analysis of the influence of methanol residues in cellulose materials on the dynamics of their aging;
  • Analysis of the problem of methanol migration from cellulose material to mineral oil and assessment of the impact of methanol content in oil on its properties.

Author Contributions

Conceptualization, P.P. and J.G.; methodology, P.P. and J.G.; formal analysis, P.P. and J.G.; investigation, P.P. and J.G.; data curation, P.P. and J.G.; writing—original draft preparation, P.P. and J.G.; writing—review and editing, P.P. and J.G.; visualization, P.P. and J.G.; supervision, P.P. and J.G. All authors have read and agreed to the published version of the manuscript.

Funding

The research was financed by the Poznan University of Technology’s financial resources for statutory activity. The number of projects: 0711/SBAD/4560.

Data Availability Statement

Not applicable.

Conflicts of Interest

The authors declare no conflict of interest.

References

  1. Lundgaard, L.E.; Allan, D.; Atanasowa-Höhlein, I.; Clavreul, R.; Dahlund, M.O.; Gasser, H.P.; Heywood, R.; Krause, C.; Lessard, M.C.; Saha, T.K.; et al. Ageing of Cellulose in Mineral-Oil Insulated Transformers; Cigré Technical Brochure 323; International Council on Large Electric Systems (CIGRE): Paris, France, 2007. [Google Scholar]
  2. Muth, T.; Jenau, F.; Gasser, H.P. Ageing of thermally and electrically stressed mineral oil impregnated presspaper insulation systems. In Proceedings of the International Conference on High Voltage Engineering and Application (ICHVE), Poznan, Poland, 8–11 September 2014; pp. 1–4. [Google Scholar] [CrossRef]
  3. Fort, E.M.; Pietsch, H.E. Aging of Insulation by Thermal and Electrical Stresses, In Proceedings of the 12th Electrical and Electronics Insulation Conference. Boston, MA, USA, 11–14 November 1975; pp. 143–146. [Google Scholar] [CrossRef]
  4. Münster, T.; Werle, P.; Hämel, K.; Preusel, J. Thermally Accelerated Aging of Insulation Paper for Transformers with Different Insulating Liquids. Energies 2021, 14, 3036. [Google Scholar] [CrossRef]
  5. Höhlein, I.; Kachler, A.J. Aging of Cellulose at Transformer Service Temperatures. Part 2. Influence of Moisture and Temperature on Degree of Polymerization and Formation of Furanic Compounds in Free-breathing Systems. IEEE Electr. Insul. Mag. 2005, 21, 20–24. [Google Scholar] [CrossRef]
  6. N’cho, J.S.; Fofana, I.; Hadjadj, Y.; Beroual, A. Review of Physicochemical-based Diagnostic Techniques for Assessing Insulation Condition in Aged Transformers. Energies 2016, 9, 367. [Google Scholar] [CrossRef]
  7. Cybulski, M.; Przybylek, P. The application of a molecular sieve for drying the insulation system of a power transformer in terms of improving its perational reliability. Eksploat. I Niezawodn. Maint. Reliab. 2022, 24, 502–509. [Google Scholar] [CrossRef]
  8. Moser, H.P.; Dahinden, V. Transformerboard II; Printing Styria: Graz, Switzerland, 1987. [Google Scholar]
  9. Moser, H.P. Transformerboard; Special Print of Scientia Electrica; Weidmann AG: Rapperswil, Switzerland, 1979. [Google Scholar]
  10. Gielniak, J.; Graczkowski, A.; Moranda, H.; Przybylek, P.; Walczak, K.; Nadolny, Z.; Moscicka-Grzesiak, H.; Feser, K.; Gubanski, S.M. Moisture in Cellulose Insulation of Power Transformers-Statistics. IEEE Trans. Dielectr. Electr. Insul. 2013, 20, 982–987. [Google Scholar] [CrossRef]
  11. Pikus, I.F.; Gimpeleva, L.S.; Koshepavo, L.A. Basic Laws of the Vacuum Drying Process Applied to Cellulose Materials for Electrical Insulation. J. Eng. Phys. Thermophys. 1972, 22, 290–296. [Google Scholar] [CrossRef]
  12. Gasser, H.P.; Krause, C.; Prevost, T. Water Absorption of Cellulosic Insulating Materials Used in Power Transformer. In Proceedings of the IEEE International Conference on Solid Dielectrics (ICSD), Winchester, UK, 8–13 July 2007. [Google Scholar] [CrossRef]
  13. Betie, A.; Meghnefi, F.; Fofana, I.; Yeo, Z. Modeling the Insulation Paper Drying Process from Thermogravimetric Analyses. Energies 2018, 11, 517. [Google Scholar] [CrossRef]
  14. Hasterman, Z.; Mosinski, F.; Maliszewski, A. Electric Strength of Power Transformer; Wydawnictwo Naukowo-Techniczne: Warsaw, Poland, 1983. (In Polish) [Google Scholar]
  15. Rindlisbacher, G.; von Ah, M. Cut and Dry: Low Frequency Drying Process in Transformer Production Can Cut Energy Costs in Half. ABB Review 2005. Available online: https://library.e.abb.com/public/22f229958625da3ec125707b004c4466/66-69%203M557_ENG72dpi.pdf (accessed on 21 March 2023).
  16. Koestinger, P.; Aronsen, E.; Boss, P.; Rindlisbacher, G. Practical Experience with the Drying of Power Transformers in the Field, Applying the LFH Technology. CIGRE Session Papers & Proceedings, Reference: A2-205_2004, Paris, France. Available online: https://www.transform.ru/articles/pdf/sigre/a2-205.pdf (accessed on 3 May 2023).
  17. Muntener, W. LFH—Trocknung: Erfahrungen und Trends; Technical Paper; Symposium Stuttgart: Stuttgart, Germany, 1999; pp. 1–14. [Google Scholar]
  18. Lundgaard, L.E.; Hansen, W.; Linhjell, D.; Painter, T.J. Ageing of Oil-impregnated Paper in Power Transformers. IEEE Trans. Power Del. 2004, 19, 230–239. [Google Scholar] [CrossRef]
  19. Heywood, R.J.; Emsley, A.M.; Ali, M. Degradation of Cellulose Insulation in Power Transformers. Part 1: Factors Affecting the Measurement of the Average Viscometric Degree of Polymerization of New and Aged Electrical Papers. IEE Proc.–Sci. Meas. Technol. 2000, 147, 86–90. [Google Scholar] [CrossRef]
  20. Przybylek, P.; Gielniak, J. Opracowanie metody suszenia izolacji stałej transformatora energetycznego na etapie jego produkcji (Development of a method for drying the solid insulation of a power transformer at the stage of its production). 2019, unpublished work done within statutory activity; No. 04/41/SBAD/4413. (In Polish)
  21. Przybylek, P. A New Concept of Applying Methanol to Dry Cellulose Insulation at the Stage of Manufacturing a Transformer. Energies 2018, 11, 1658. [Google Scholar] [CrossRef]
  22. Przybylek, P. Sposób i Urządzenie do Suszenia Układów Izolacyjnych Urządzeń Elektroenergetycznych. Method and Device for Drying Insulation Systems of Power Equipment) Patent No. PL 226674, 2017. (In Polish).
  23. IEC 60814; Insulating Liquids—Oil-Impregnated Paper and Pressboard—Determination of Water by Automatic Coulometric Karl Fischer Titration. International Electrotechnical Commission (IEC): Geneva, Switzerland, 1997.
  24. Przybylek, P. A New Method for Indirect Measurement of Water Content in Fibrous Electro-insulating Materials Using Near-infrared Spectroscopy. IEEE Trans. Dielectr. Electr. Insul. 2016, 23, 1798–1804. [Google Scholar] [CrossRef]
  25. Zhang, N.; Shen, Z.; Chen, C.; He, G.; Hao, C. Effect of hydrogen bonding on self-diffusion in methanol/water liquid mixtures: A molecular dynamics simulation study. J. Mol. Liq. 2015, 203, 90–97. [Google Scholar] [CrossRef]
  26. Han, C.; Gao, J.; Sun, W.; Han, C.; Li, F.; Li, B. Structure Study of Water in Alcohol-Water Binary System Based on Raman Spectroscopy. J. Phys. Conf. Ser. 2022, 2282, 012021. [Google Scholar] [CrossRef]
  27. Yang, B.; Cao, X.; Lang, H.; Wang, S.; Sun, C. Study on Hydrogen Bonding Network in Aqueous Methanol Solution by Raman Spectroscopy. Spectrochem. Acta Part A Mol. Biomol. Spectrosc. 2020, 225, 117488. [Google Scholar] [CrossRef] [PubMed]
  28. Sokolov, V.; Aubin, J.; Davydov, V.; Gasser, H.P.; Griffin, P.; Koch, M.; Lundgaard, L.; Roizman, O.; Scala, M.; Tenbohlen, S.; et al. Moisture Equilibrium and Moisture Migration within Transformer Insulation Systems; Cigré Technical Brochure 349; International Council on Large Electric Systems (CIGRE): Paris, France, 2008. [Google Scholar]
Figure 1. Dependence of water content in pressboard on its drying time, for samples placed in ethanol and methanol with an initial water content of 0.1% [20].
Energies 16 04465 g001
Figure 2. Hydrogen bonds between water and methanol molecules.
Energies 16 04465 g002
Figure 3. Pressboard materials delaminated as a result of their drying by immersion in methanol.
Energies 16 04465 g003
Figure 4. System for controlling the flow of dry nitrogen; 1—compressed nitrogen cylinder, 2—cylinder valve, 3—pressure reducer, 4—solenoid valve, 5—three-way manifold, 6—flow regulators, 7—nitrogen flow systems (presented in Section 3), 8—fume cupboard.
Energies 16 04465 g004
Figure 5. The system used for drying cellulose materials.
Energies 16 04465 g005
Figure 6. Vials with pressboard samples and methanol.
Energies 16 04465 g006
Figure 7. Water content in pressboard as a function of its drying time.
Energies 16 04465 g007
Table 1. Test results obtained for samples of pressboard with a thickness of 5 mm.
No.WCPi, %WCPd, %ΔWCP,
p.p.
Va,
L/h
Cm,
g/L
WCM, %Sample Description
14.493.071.421.8--not delaminated
24.581.263.321.80.447.9not delaminated
34.481.612.876.00.206.2not delaminated
Table 2. Test results obtained for pressboard samples with a thickness of 2.1 mm.
No.WCPi, %WCPd, %ΔWCP,
p.p.
Va,
L/h
Cm,
g/L
WCM, %Sample Description
15.571.933.642.40.257.34not delaminated
25.570.774.802.40.252.04not delaminated
35.570.814.762.40.251.90not delaminated
Table 3. Test results obtained for paper samples.
No.WCPi, %WCPd, %ΔWCP,
p.p.
Va,
L/h
Cm,
g/L
WCM, %Sample Description
14.471.652.822.4---
24.370.413.962.40.251.56-
34.130.094.042.40.254.03-
Table 4. Test results obtained for paper samples.
No.WCPi, %WCPd, %ΔWCP,
p.p.
Va,
L/h
Cm,
g/L
WCM, %Sample Description
14.590.753.841.20.25 1.40not delaminated
Disclaimer/Publisher’s Note: The statements, opinions and data contained in all publications are solely those of the individual author(s) and contributor(s) and not of MDPI and/or the editor(s). MDPI and/or the editor(s) disclaim responsibility for any injury to people or property resulting from any ideas, methods, instructions or products referred to in the content.