Article

The Effect of Explosions on the Protective Wall of a Containerized Hydrogen Fuel Cell System

1
Research Institute of State Grid Zhejiang Electric Power Co., Ltd., Hangzhou 310014, China
2
Institute of Thermal Science and Technology (Institute for Advanced Technology), Shandong University, Jinan 250061, China
3
School of Mechanical Engineering, Shandong University, Jinan 250061, China
*
Author to whom correspondence should be addressed.
Energies 2023, 16(11), 4477; https://doi.org/10.3390/en16114477
Submission received: 10 April 2023 / Revised: 18 May 2023 / Accepted: 29 May 2023 / Published: 1 June 2023
(This article belongs to the Special Issue Hydrogen Economy and Advanced Energy Management Strategies)

Abstract

:
With the development of hydrogen energy, containerized hydrogen fuel cell systems are being used in distributed energy-supply systems. Hydrogen pipelines and electronic equipment of fuel cell containers can trigger hydrogen-explosion accidents. In the present study, Computational Fluid Dynamics (CFD) software was used to calculate the affected areas of hydrogen fuel cell container-explosion accidents with and without protective walls. The protective effects were studied for protective walls at various distances and heights. The results show that strategically placing protective walls can effectively block the propagation of shock waves and flames. However, the protective wall has a limited effect on the reduction of overpressure and temperature behind the wall when the protective wall is insufficiently high. Reflected explosion shock waves and flames will cause damage to the area inside the wall when the protective wall is too close to the container. In this study, a protective wall that is 5 m away from the container and 3 m high can effectively protect the area behind the wall and prevent damage to the container due to the reflection of shock waves and flame. This paper presents a suitable protective wall setting scheme for hydrogen fuel cell containers.

1. Introduction

Climate change, primarily caused by greenhouse gas emitted from fossil fuels, is one of humanity’s severe challenges [1]. As the global energy structure transforms to low-carbon energy, hydrogen is considered an ideal substance to replace traditional fossil energy and support the large-scale development of renewable energy. Hydrogen is essential for building a diversified energy-supply system led by clean energy.
Hydrogen is widely accessible, has a high calorific value, and emits no carbon dioxide during combustion. Hydrogen will be widely used in industry, transportation, and construction, and can help meet the demand for carbon reduction [2]. South Korea and China have seen the most significant growth in hydrogen fuel cell vehicles and refueling stations [3]. Some regions face the dual demands for renewable energy consumption and power-supply stability. A cogeneration system could be formed with renewable energy-based electrolytic hydrogen production and fuel cell systems to realize waste heat recovery. Containerized hydrogen fuel cell systems are already in use in hydrogen production plants, hydrogen refueling stations, and other places.
Hydrogen has a wide flammable range of 4% to 75%, with low ignition energy. Leakage of hydrogen can lead to the accumulation of combustible clouds, which can cause serious accidents such as fire and explosion. The reliability and safety of hydrogen energy infrastructure directly affect the public acceptance of hydrogen as an energy source. The hydrogen fuel cell cogeneration system uses a modular arrangement of containers with integrated components in a single container, which can be considered a confined space during operation. If an explosion occurs due to hydrogen leakage, the consequences of the accident will be more severe than one in an open space. Therefore, research on the hydrogen safety of hydrogen fuel cell containers can help develop safety standards and promote the large-scale application of containerized hydrogen fuel cell systems.
In addition to hydrogen-air cloud properties such as concentration, size, and heterogeneity, environmental factors, including ignition, ventilation, and obstacles, have been identified as significant influencers of the loading characteristics in hydrogen-air cloud explosions [4]. In the unconfined hydrogen premixed explosion accident, the peak premixed hydrogen explosion overpressure at sensors horizontally arranged was maximal when the ignition position was located in the center of the combustible cloud [5]. Unconfined hydrogen explosion experiments were conducted to analyze the flame propagation and overpressure characteristics, and an overpressure prediction model is proposed [6]. The explosive peak overpressure increased first and then decreased with the increase of the equivalence ratio [7]. The ignition location and hydrogen-volume fraction affected the overpressure from hydrogen-premixed explosions in pipelines and vessels [8,9,10,11,12,13,14]. Additionally, some researchers have studied hydrogen explosions in confined spaces such as skid-mounted hydrogen refueling stations, garages, and rooms. The results showed that venting significantly reduces internal overpressure. However, as the vent size increases, the area of high-temperature outside (above 800 K) first decreases and then increases, which can cause injury to humans and damage to equipment [15,16,17,18].
Protective walls are efficient for protecting infrastructures and people from overpressure effects from gaseous explosions. Overpressure and the corresponding negative and positive pulses are the most critical explosion characteristics causing human injuries [19]. Vertical barrier walls in hydrogen refueling stations can significantly reduce the peak overpressure behind the wall. The surface area of the flame grows after impinging on the barrier wall. Further wall-height increase cannot significantly promote the fire-resistance effect when the height difference between the barrier wall and the vent is larger than one m [20]. The blast-wave attenuation increases with increasing proximity to the back of the wall. The peak overpressure is slightly affected by the wall thickness and material. The wall height and distance are important factors for blast-wall design [21]. The blast shock-wave reflection and diffraction law at the protective wall should be considered in the design of the protective walls [22]. However, most existing experiments and simulations of hydrogen explosion accidents in confined spaces rarely consider both the height and the distance of the protective walls.
This paper modeled a hydrogen fuel cell container using FLACS, based on an actual situation, to study the consequences of hydrogen-premixed explosion accidents. The protective effects of protective walls with various distances (d) and heights (h) were summarized, where d is the distance from the container to the protective walls.

2. Simulation Methods

2.1. Governing Equations

Computational Fluid Dynamics (CFD) software (v9.0) is frequently utilized for modeling calculations in the consequence analysis of hydrogen leakage and explosion accidents. The numerical models used in this study have been validated in the literature [23,24,25] by comparing the FLACS simulation results to experimental data.
FLACS v9.0 uses a semi-implicit algorithm for the system of pressure-coupled equations (SIMPLE algorithm) in the calculation to solve the Navier-Stokes equations in a three-dimensional Cartesian coordinate system to obtain the values of the gas concentration, temperature, overpressure, and other variables. The conservation equations can be represented in general as [26]:
t ρ ϕ + x j ρ U j ϕ x j Γ Φ ϕ x j = S ϕ
Γ ϕ = μ eff σ ϕ
μ eff = μ 1 + C D ρ k 2 ε
where ϕ represents the generic solution variable; ρ is the gas density, k g / m 3 ; U j is the velocity in the j direction; x j is integral in the direction of j ; Γ ϕ is the diffusion coefficient; S ϕ is the source term; μ is the dynamic viscosity; μ eff is the effective viscosity; σ ϕ is the turbulent Prandtl-Schmidt number; k is the turbulent kinetic energy; ε is the dissipation of turbulent kinetic energy; C D is a constant taken to be 0.09.
In the calculation of premixed explosions, the gas mixture concentration is characterized by the equivalence ratio Φ , which is given by
Φ = F / O a c t u a l F / O s t o i c h
where F is the mass of combustible gas in the calculated area; O is the mass of oxygen in the calculated area; F / O a c t u a l is the mass ratio of gas to oxygen in the area for actual conditions; F / O s t o i c h is the stoichiometric ratio. The mass ratio of fuel to oxygen is for exactly complete reaction conditions.
FLACS simulation utilizes the k-ε model, a two-equation model for turbulence. It is an eddy-viscosity model that solves two additional transport equations; one for turbulent kinetic energy and one for dissipation of turbulent kinetic energy.
An explosion may occur when a premixed cloud of fuel and oxidant undergoes ignition. Prior to the occurrence of an explosion, a stable, non-turbulent premixture of fuel and oxidant will undergo combustion with a laminar burning velocity [27]:
S L 0 = S L 0 ( fuel , Φ )
where S L 0 is the laminar burning velocity. In FLACS, the flame zone is thickened by increasing the diffusion with a factor β and reducing the reaction rate with a factor 1/β. Hence, the flame model in FLACS is called the β-model. The flame model defines the criteria for combustion and the spatial distribution of the reaction rate across the numerical flame zone [27]:
t β v ρ Y f u e l + x j β j ρ u j Y f u e l = x j β j ρ D Y f u e l x j + R F                         c = 1 Y F F F 0 ;                   R F = C β R F S Δ ρ min c , 9 1 c
where D is the diffusion coefficient; RF is the reaction rate; S is the burning velocity; C β R F is a model constant; YF is the fuel mass fraction and YF0 is the fuel mass fraction that was initially available in the specific control volume; c is the progress variable; Δ is a constant on the order of the grid-cell size.

2.2. Geometry and Model Settings

The constructed container model of the hydrogen fuel cell cogeneration system is shown in Figure 1. This hydrogen fuel cell cogeneration system was implemented in Zhejiang Provence, China, and comprises a fuel cell power-generation system, a waste-heat recovery system, and electric control unit. The container contains a fuel cell stack, hydrogen system, air system, cooling system, power distribution management system, and controller. During fuel cell power generation, more than 50% of the energy is discharged as heat. A waste heat recovery system containing a hot water storage tank is configured in the container, and the hot water generated is available to the duty room. The fuel cell cogeneration system is integrated into a container with geometric dimensions of 6.06 m length, 2.50 m width, and 2.85 m height.
The hydrogen fuel cell container is equipped with hydrogen pipelines, and the working pressure of the fuel cell is 3 MPa, which could lead to leakage accidents. The hydrogen fuel cell may generate a static-electricity spark during operation, making it prone to hydrogen-explosion accidents. In this study, the ignition position was set between two groups of hydrogen fuel cells (the purple equipment in Figure 1). The hydrogen fuel cell container is divided into two rooms by partitions (Figure 1), namely the personnel operation room on the left and the fuel cell room on the right. To calculate the most dangerous scenario of an explosion after a leakage and to determine a relatively conservative protective wall layout, this study assumes that the leaked hydrogen gas uniformly fills the fuel cell room on the right side of the container during the initial stage, with a volume fraction of 30%. The ignition timing was set at 0.1 s, and the container door was opened at the time of the explosion. There was no wind inside the container, and the ambient temperature was 20 °C. According to the user manual [27], the CFLC (Courant-Friedrich-Levy number based on sound velocity) value of 5.0 should be set, and the CFLV (Courant-Friedrich-Levy number based on fluid flow velocity) value of 0.5 should be set.
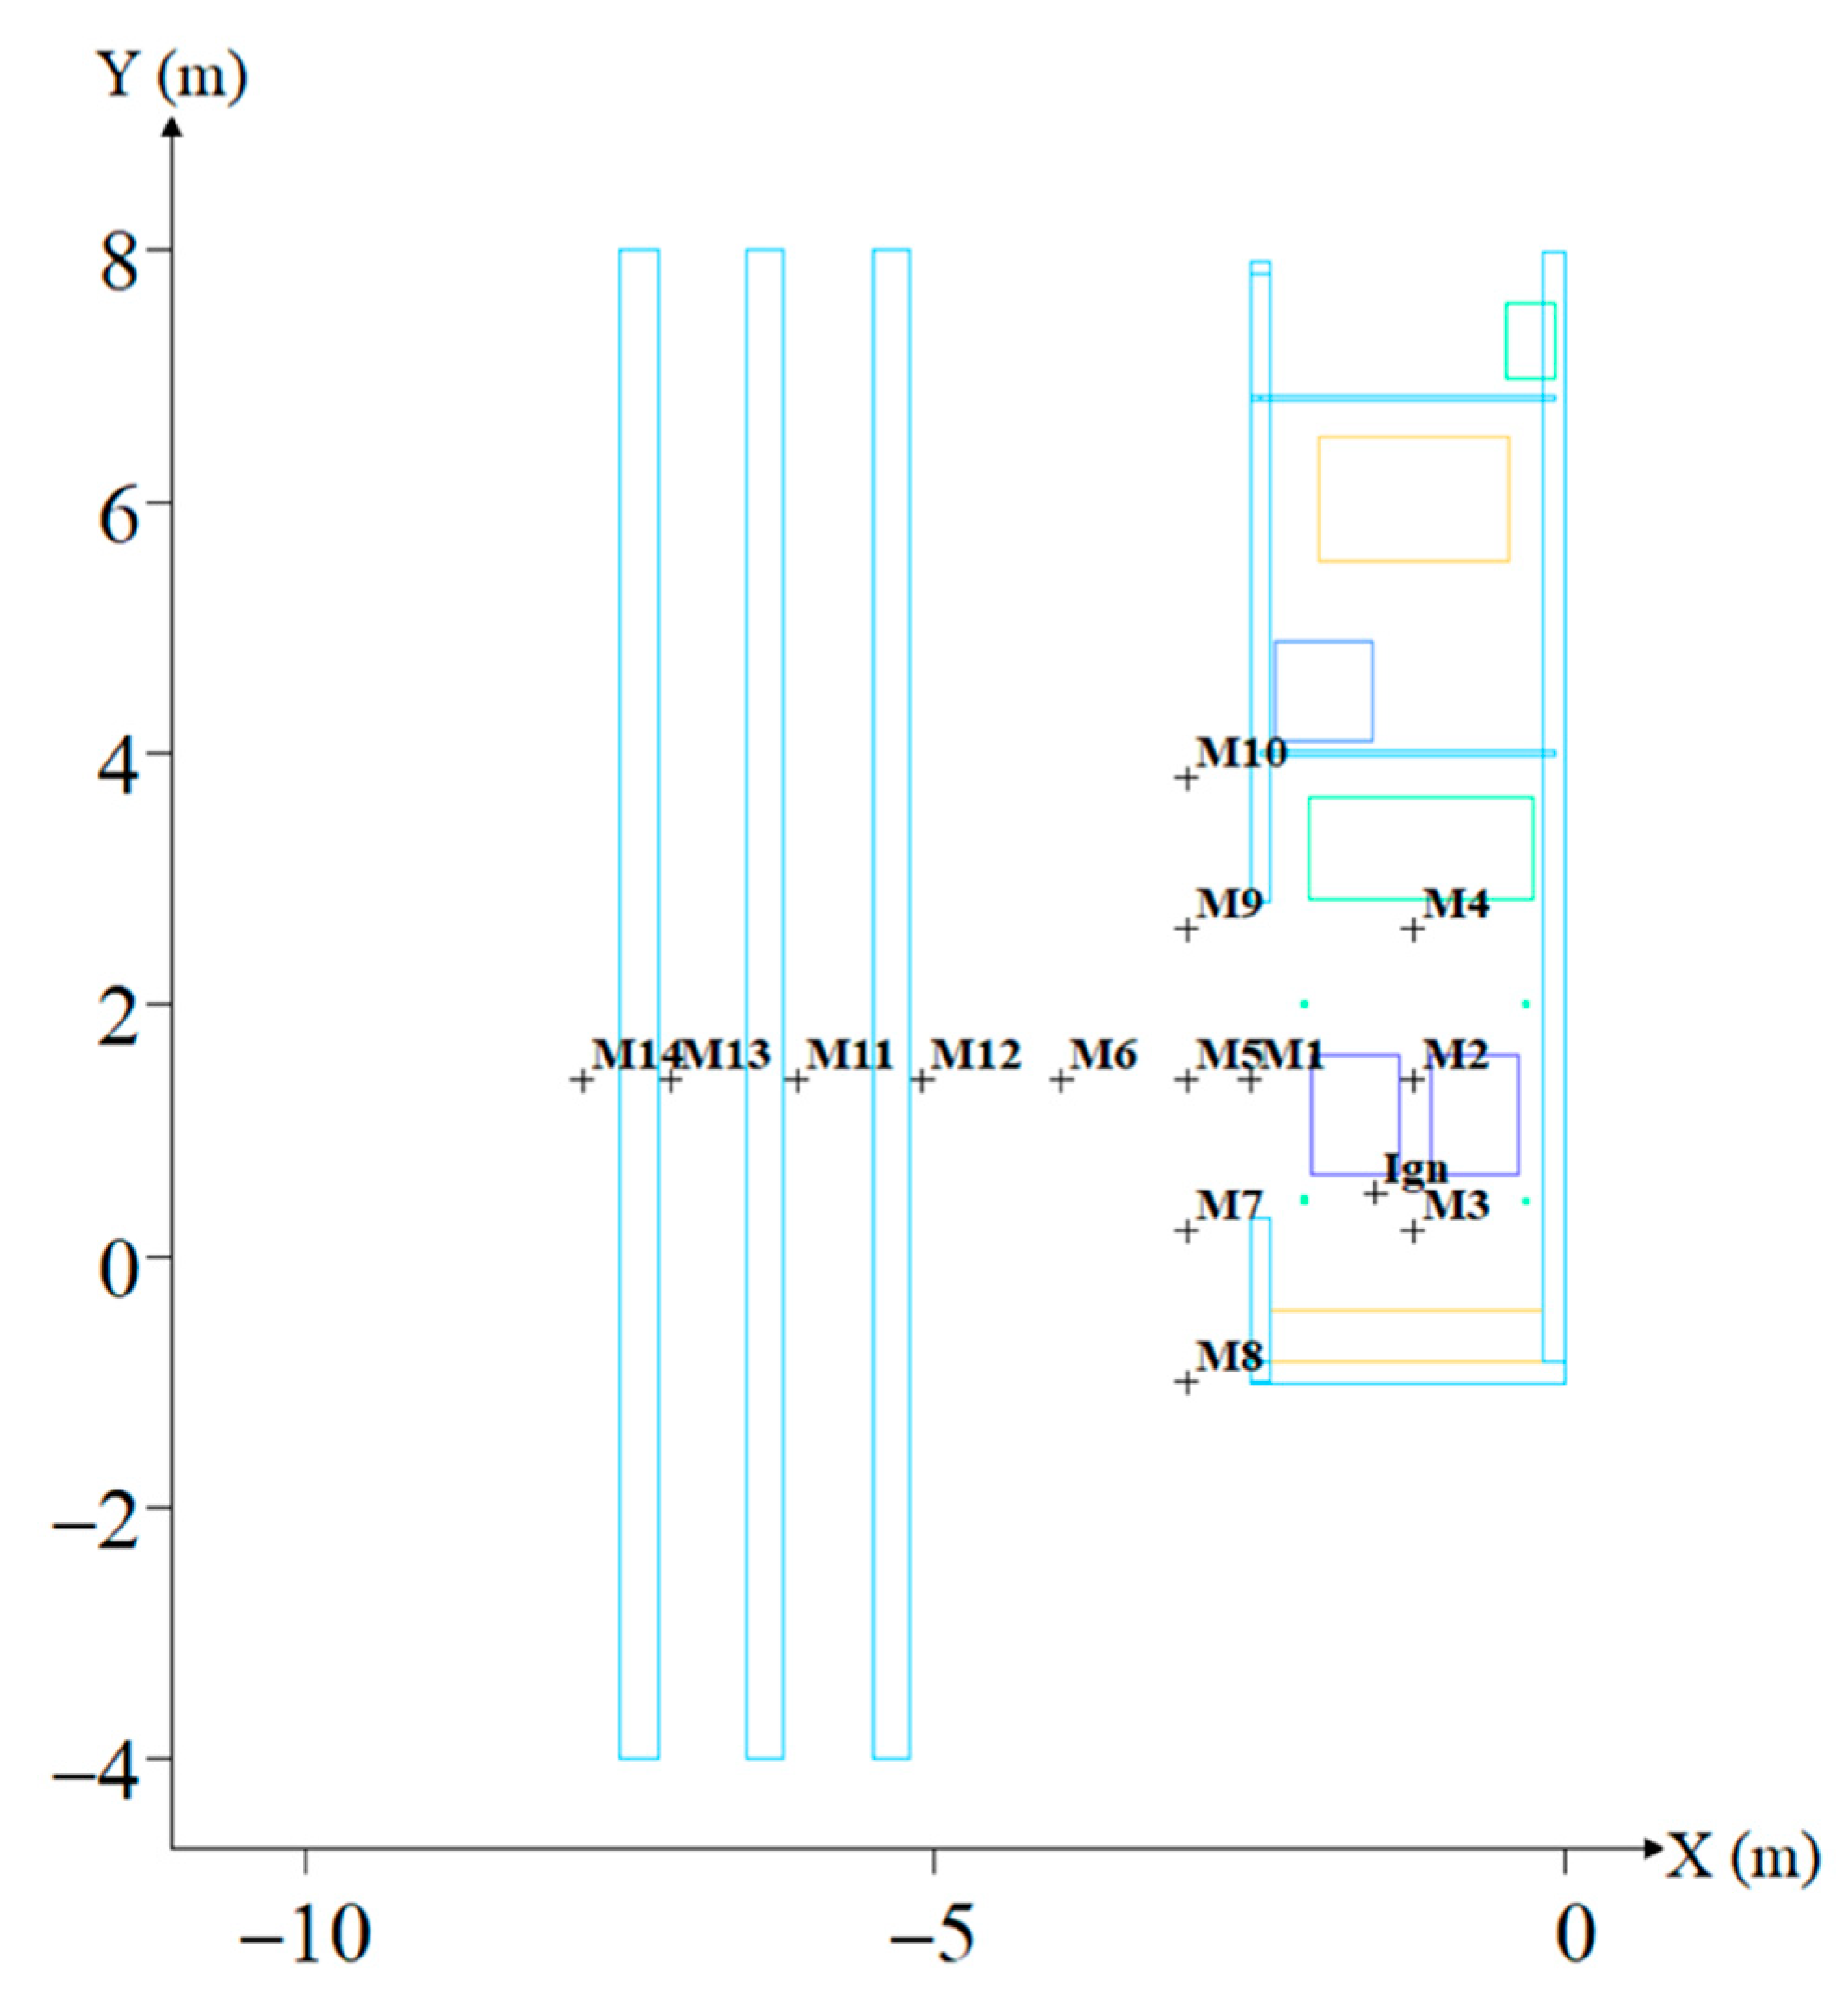
This study simulated the overpressure and temperature resulting from an explosion in the absence of a protective wall. The protective effects of the protective walls were analyzed at various distances and heights. Six scenarios were simulated as shown in Table 1. Fourteen monitoring points were set up to record the overpressure and temperature inside and outside the container. The locations of the monitoring points and protective walls are shown in Figure 2.
This study calculated the affected area of the accident to determine a reasonable protective wall layout. Human beings begin to feel pain when the temperature exceeds 315 K, and 453 K is the threshold temperature that causes serious injury to the human body; At 873 K, the steel structure can fail. People may be injured by flying glass and debris when the peak overpressure is over 0.13 bar [28]. The injury criteria of overpressure on the human body are shown in Table 2, while the damage criteria to buildings are shown in Table 3.

2.3. Grid Sensitivity Analysis

Six grids with 93,600 to 184,800 elements were used for grid-sensitivity analysis. At the initial stage, hydrogen gas was uniformly distributed in the room on the right side of the hydrogen fuel cell container. The ambient temperature was 20 °C. Hydrogen premix-explosion in a fuel cell container was simulated with a 30% hydrogen volume fraction. All grids used in this study were hexahedral. To ensure precise calculations, the inner space of the hydrogen fuel cell container and the corresponding external space of the outlet were refined. The Smooth function was implemented to smooth the transition of grid size. Different refinement levels were achieved by adjusting the number of grid nodes in the X, Y, and Z directions, resulting in the six grids mentioned previously. The 93,600 grids had a minimum grid size of 0.38 m, while the 184,800 grids had a minimum grid size of 0.30 m. The peak overpressure at monitoring point 3 was compared for six grid cases, as shown in Figure 3a. When the number of grids was larger than 152,100, the peak overpressure at monitoring point 3 tended to be constant. This study used 152,100 elements to reduce the calculation time.
The grid used for the model calculation is shown in Figure 3b, with 53 grids along the X direction, 87 grids along the Y direction, and 33 grids along the Z direction.

3. The Explosion Characteristics without Protective Walls

This study calculated the affected range of the explosion without protective walls. The overpressures at various times without protective walls are shown in Figure 4 and the temperatures at various times without protective walls are shown in Figure 5. At 0.18 s, the overpressure inside the container exceeded 1.5 bar and the temperature reached 2600 K. According to injury guidelines, the explosion can cause severe damage to the equipment and injury to humans. At 0.20 s, the shock wave generated by the explosion had progressed downstream and had begun to create a negative pressure zone. However, the temperature in most of the area 6 m away from the container remained above 1500 K, which is still high enough to cause severe damage to equipment and injury to humans.
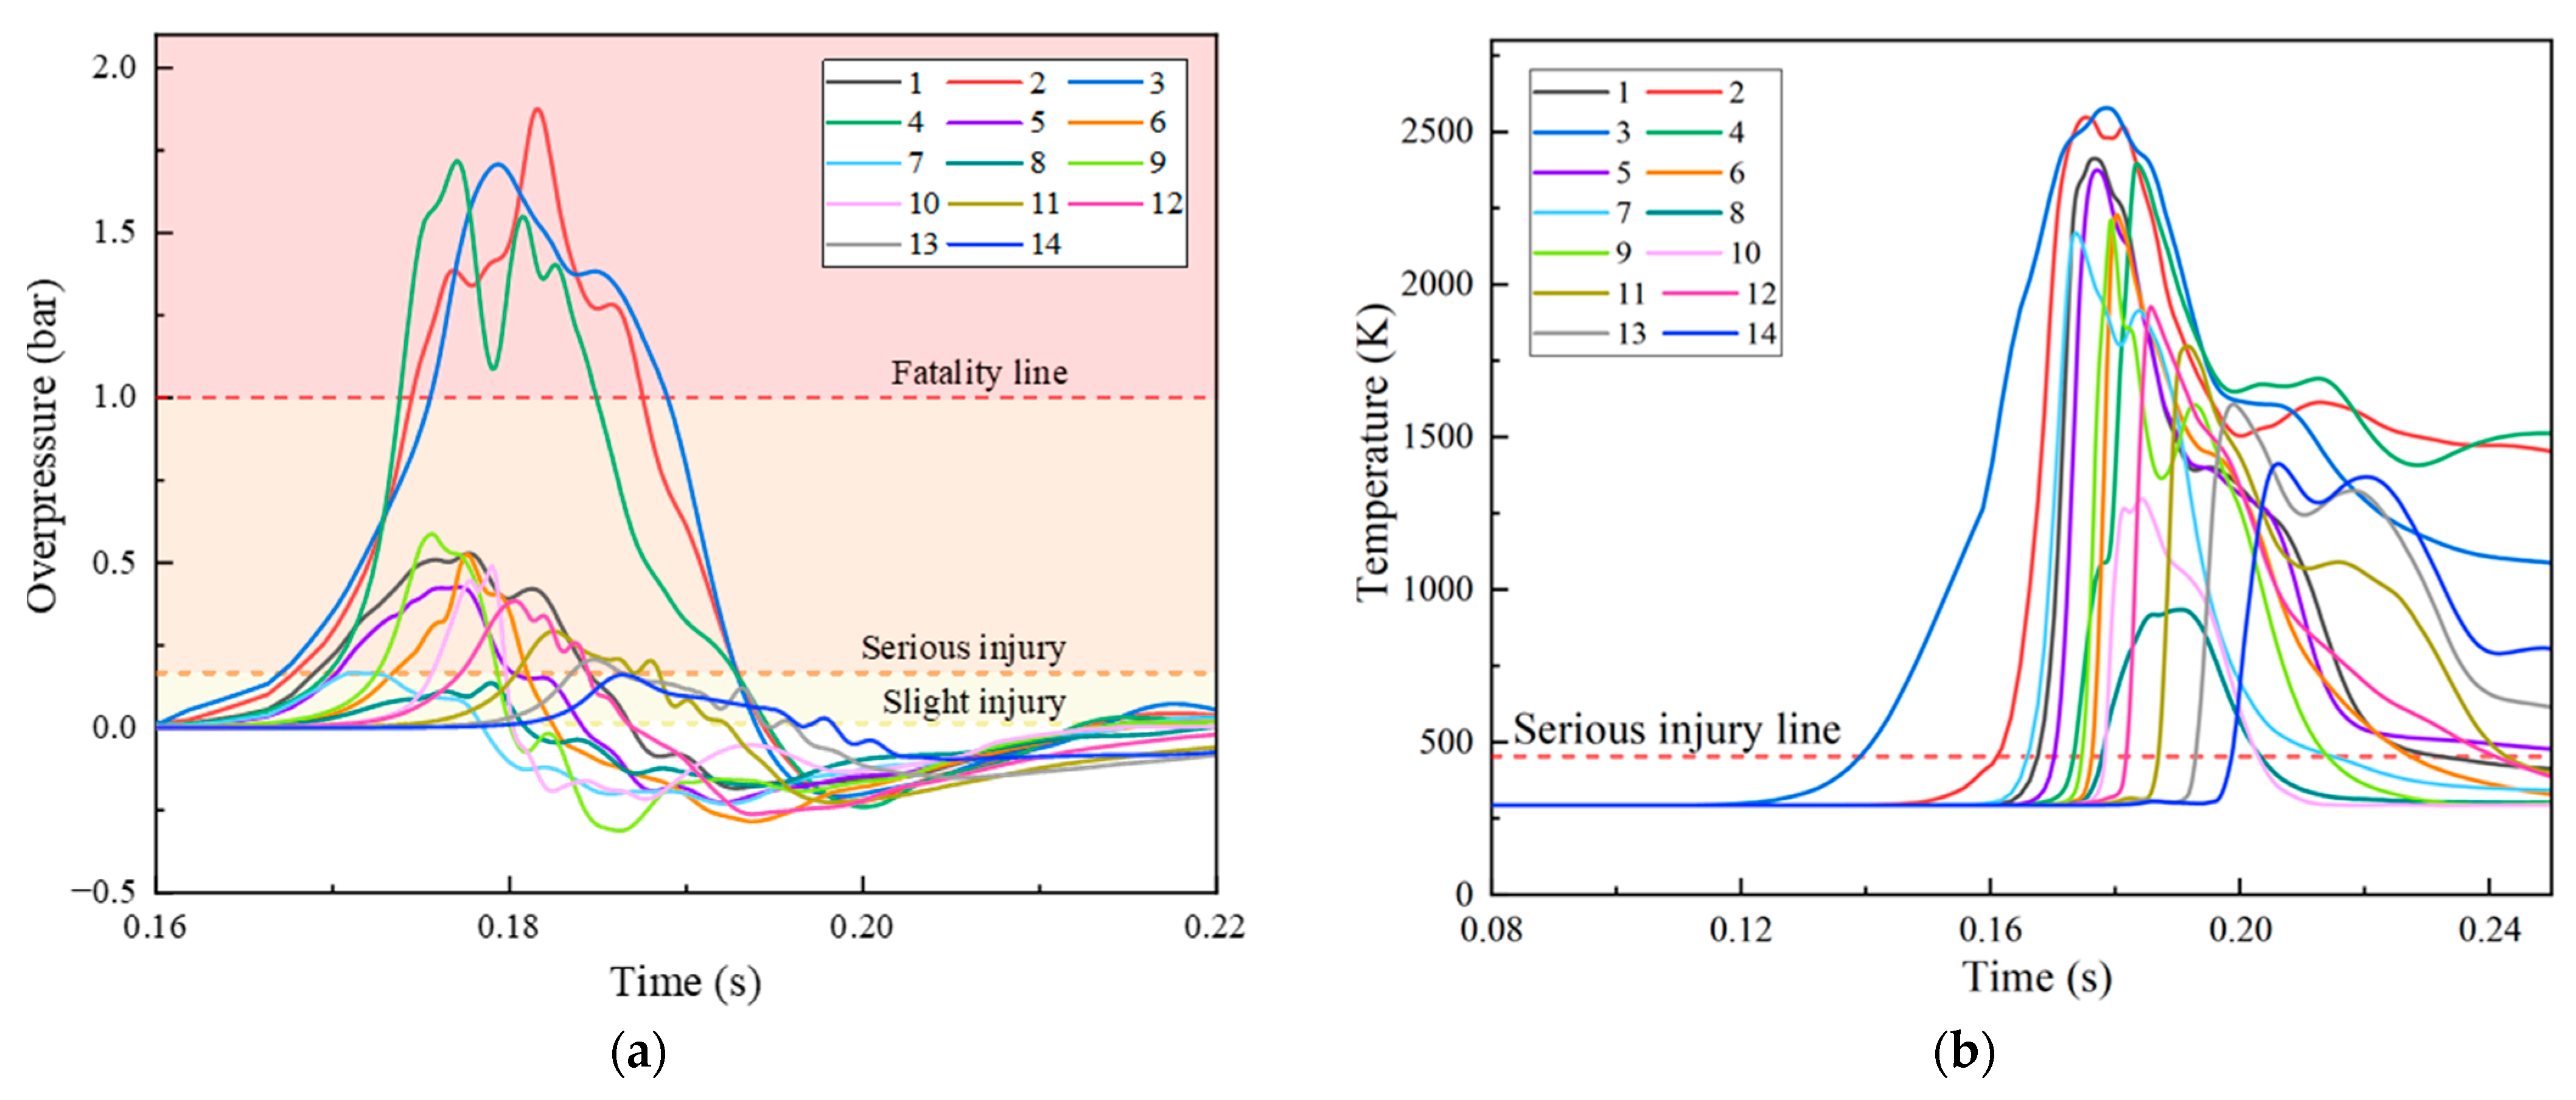
The overpressure and temperature evolutions at each monitoring point without protective walls are shown in Figure 6. The pressure and temperature in the area inside the container below the image rise significantly faster than in other areas. This is because the ignition point is near the hydrogen fuel cell, and the equipment and container walls around the ignition point restrict the spread of the flammable cloud, thereby intensifying the turbulence of the hydrogen and air-mixed gas in the local area. The increased contact surface area between the unignited gas and flame results in an elevated chemical reaction rate. The rapid combustion of the hydrogen gas releases a substantial amount of heat and rapidly expands in volume, leading to a quick increase in pressure and temperature in the area. As the explosion shock wave progresses downstream, the pressure in the affected area drops below atmospheric pressure, creating a negative pressure zone. At this point, the impact of the explosion pressure decreases gradually. The peak overpressure is 0.22 bar, and the peak temperature is more than 1400 K at the farthest monitoring point 14. The overpressure and temperature values are larger than the criteria for human injury, suggesting that the installation of a protective wall is necessary to reduce the hazards caused by the explosion.

4. The Protective Effects of the Protective Walls

Setting protective walls is an effective protective method. This study simulated five kinds of protective-wall installation (cases 2–6) and determined the optimal protective wall configuration by comparing the protective effects of walls with various distances and heights.

4.1. The Protective Effects of the Protective Walls with Various Distances

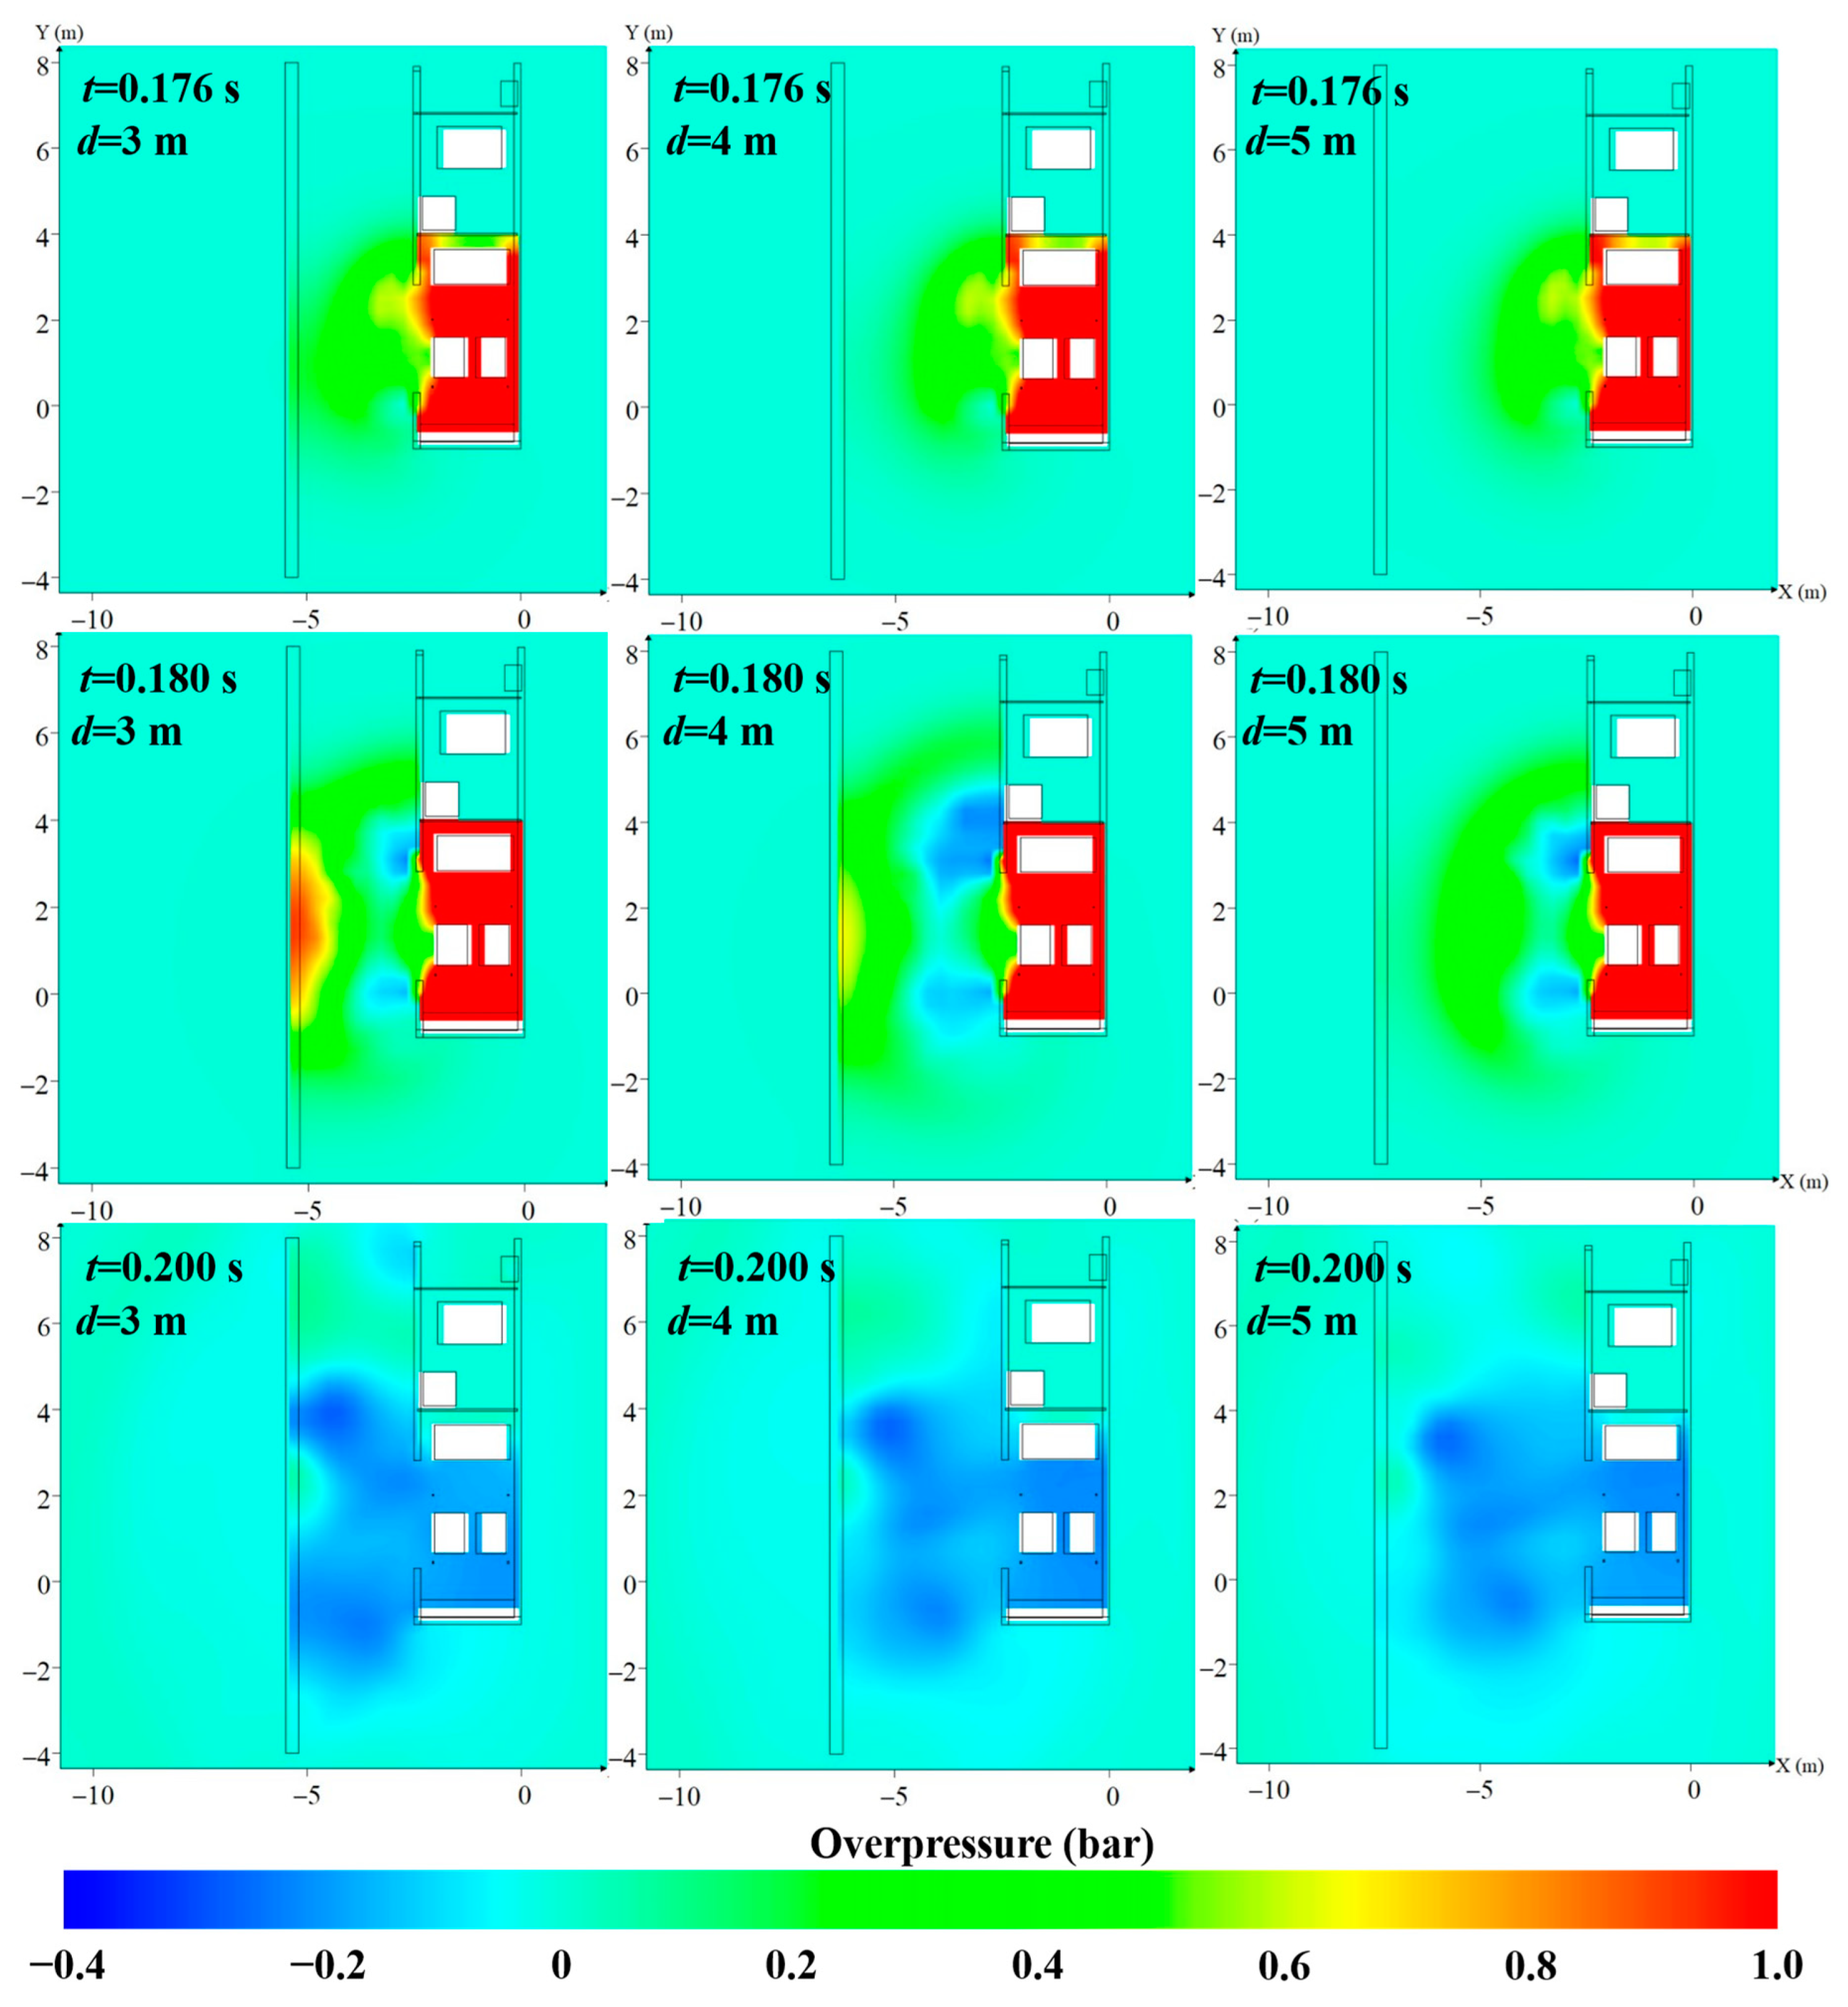
The present study modeled 3 m high protective walls at 3 m, 4 m, and 5 m distances from the container. The protective effects of the protective walls at various distances were calculated to determine a reasonable arrangement of the protective wall. The overpressures at various times for various protective wall distances are shown in Figure 7 and the temperatures at various times for various protective wall distances are shown in Figure 8. The results showed that the presence of the protective wall effectively blocked the propagation of shock waves and temperature, and provided good protection for the area behind the wall (−X direction). However, the maximum overpressure and temperature inside the wall (+X direction) may be higher due to the reflection effect of the protective wall compared to those without a protective wall. The peak overpressure inside the protective wall at the 3 m distance is 0.8 bar, and the peak temperature is 2000 K. According to the injury criteria in Table 2, the equipment inside the wall would be seriously damaged and humans injured.
Monitoring points 7, 8, and 11–14 were selected to quantitatively analyze the explosion consequences. For the various monitoring points, the overpressure evolutions are shown in Figure 9 and the temperature evolutions are shown in Figure 10. Protective walls installed at various distances all significantly reduced the overpressure and temperature in the area behind the wall. Monitoring point 14 showed a decrease in peak overpressure from 0.16 bar to 0.05 bar and a decrease in temperature to ambient temperature, with the overpressure and temperature behind the wall lower than the minimum injury criterion. The peak reflected overpressure inside the 3 m distance protective wall was 0.9 bar, which is about twice the overpressure value without the protective wall. The peak reflected overpressure inside the 5 m distance protective wall was the lowest, at 0.45 bar. The monitoring points of overpressure and temperature data show that setting a protective wall at the exit of the hydrogen fuel cell container can effectively reduce the range of high-pressure and high-temperature areas and have a better protective effect on the area behind the wall. However, the protective wall could reflect the shock waves and flame, thus increasing the overpressure and temperature inside the wall. The overpressure distribution at monitoring points 7 and 8 did not change significantly inside the various distance protective walls, but the temperature increased by 100–300 K. Setting a protective wall at a distance of 3 m causes the largest temperature change from 950 K to 1250 K. Therefore, a suitable distance must be determined to set the protective wall. The proper distance of the protective wall for this hydrogen fuel cell container is 5 m, determined by comparing the simulation results.

4.2. The Protective Effects of the Protective Walls with Various Heights

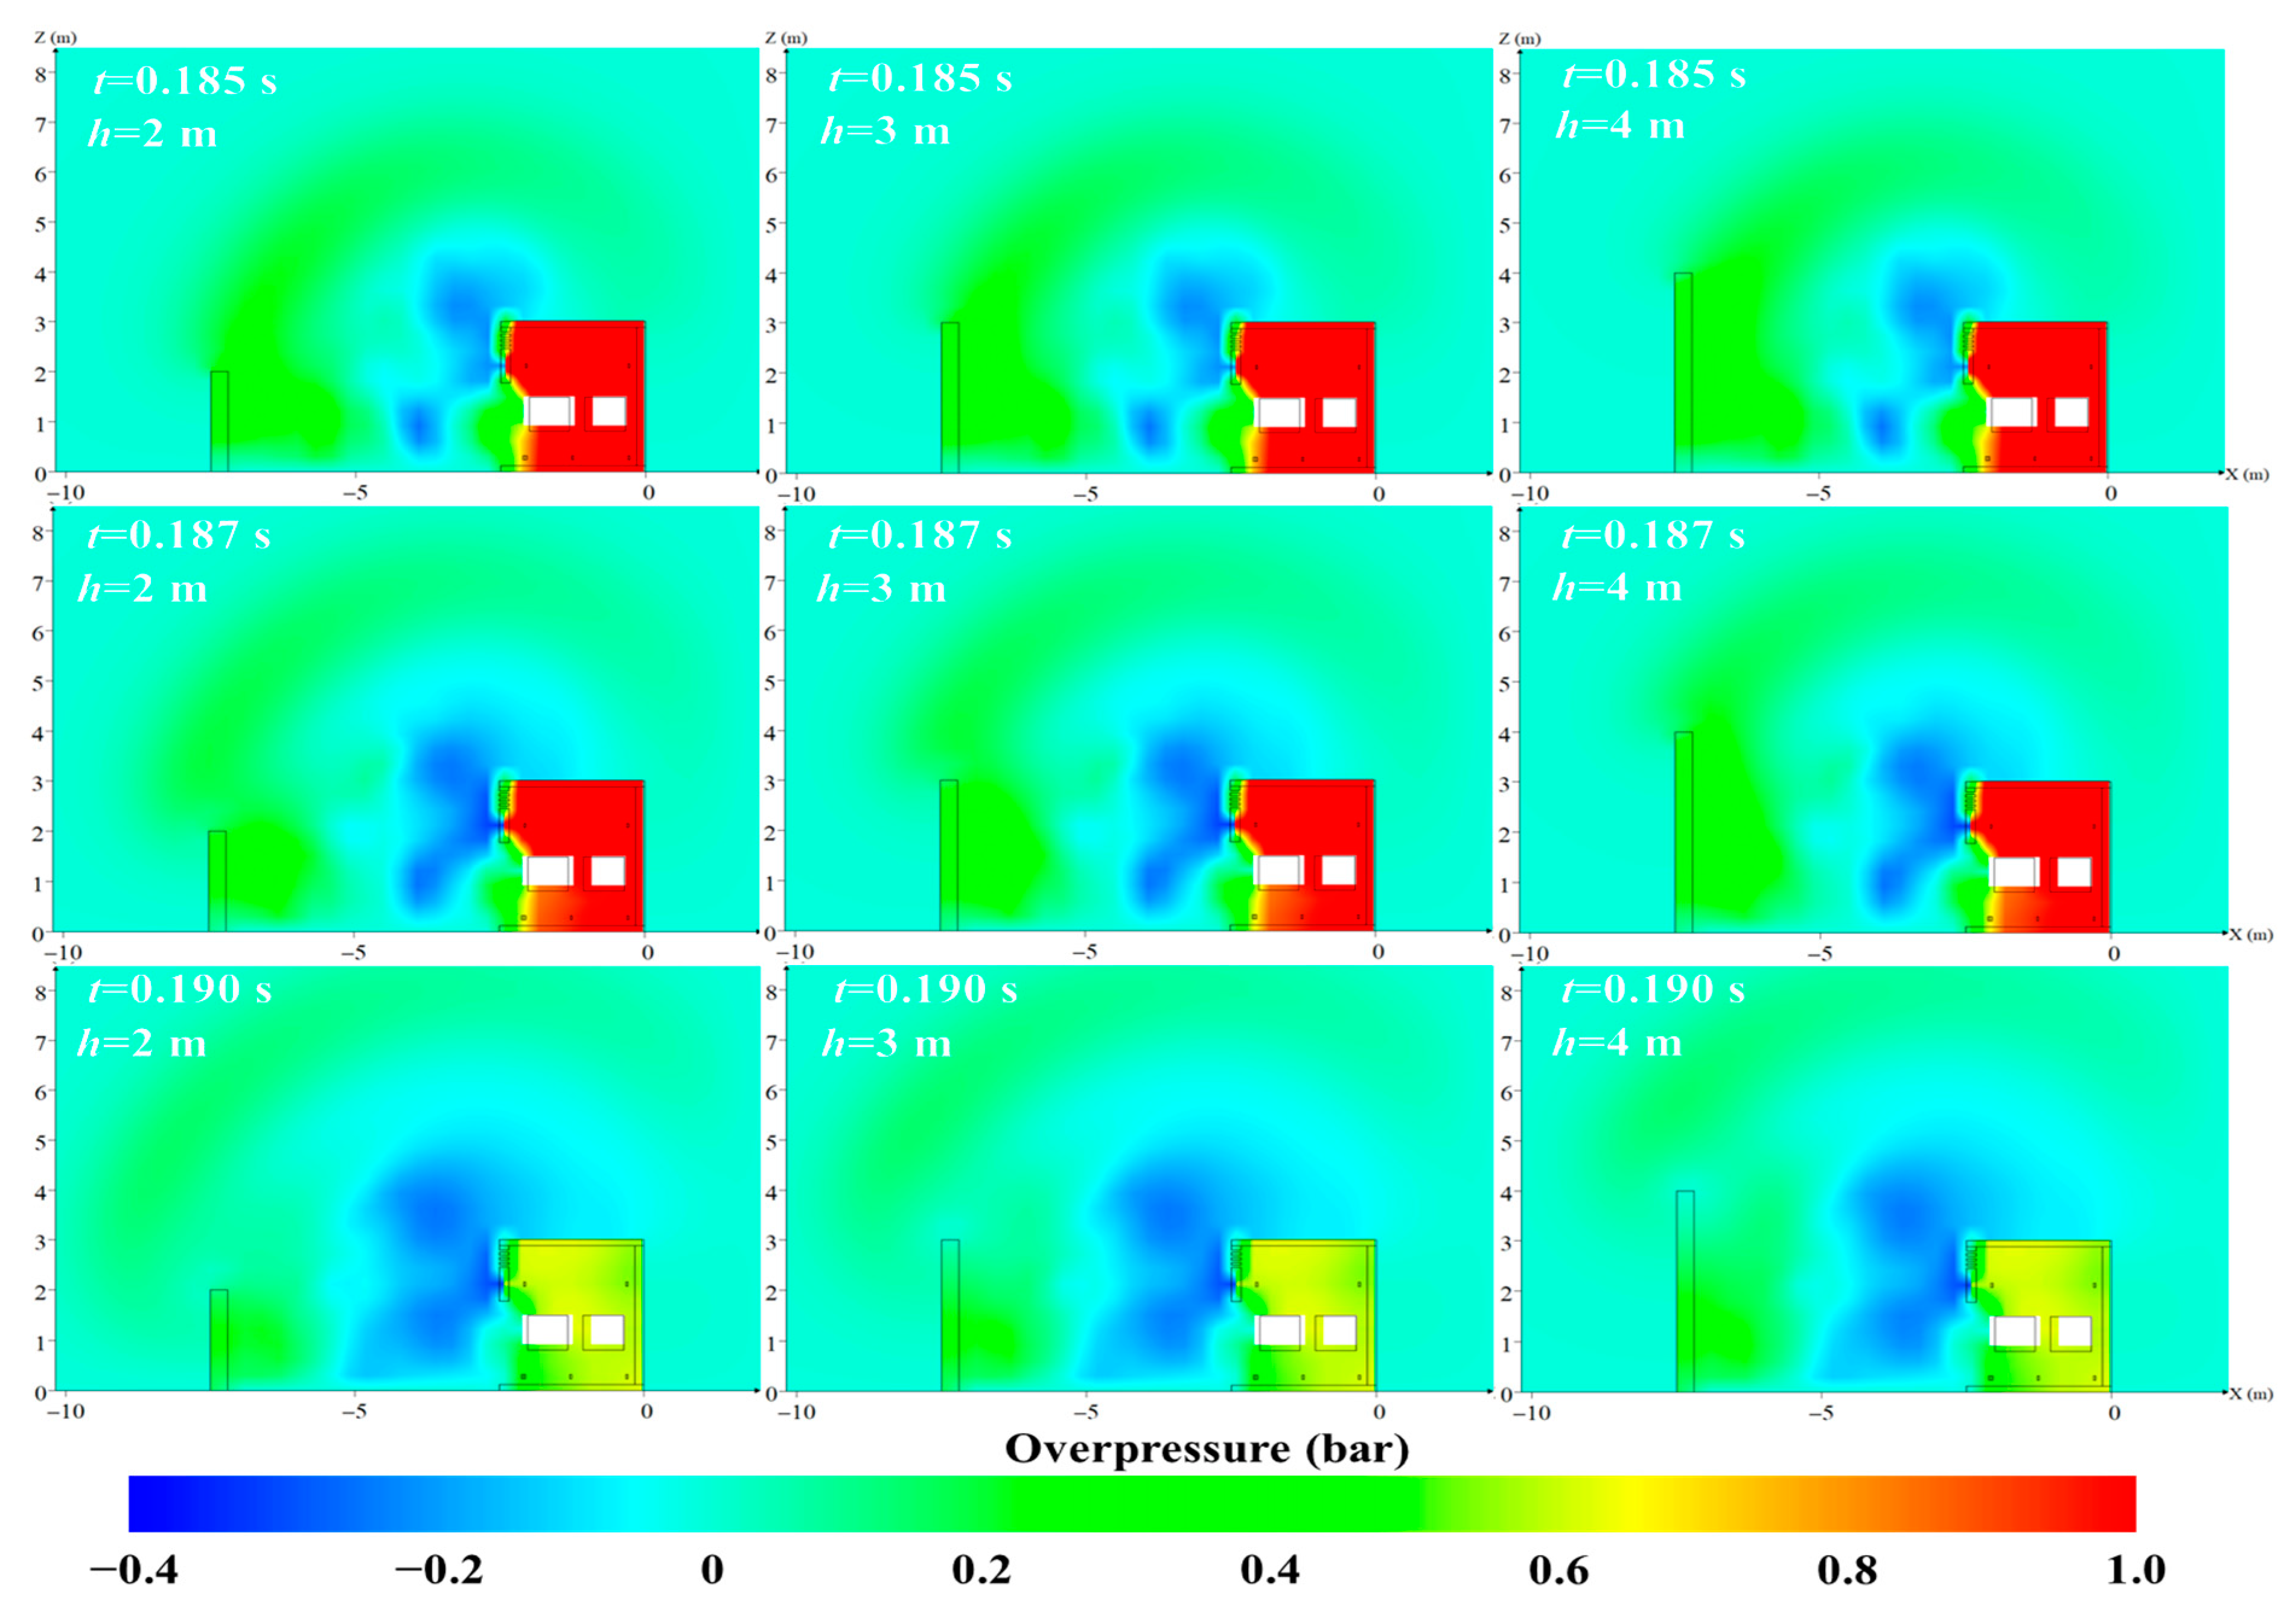
The present study modeled protective walls of 2 m, 3 m, and 4 m in height at a 5 m distance from the container. The protective effects of the protective walls were calculated for various heights. The overpressures at various times for various protective wall heights are shown in Figure 11 and the temperatures at various times for various protective wall heights are shown in Figure 12. The protective effect of the wall on the explosion flame and shock-wave protection is obvious. The overpressure of most of the area behind the wall was still above 0.165 bar when the height of the protective wall was 2 m. The high-pressure area above 0.165 bar was confined inside the wall as the wall height increased, but the reflected overpressure inside the wall could achieve up to 0.6 bar. The flame area inside the wall increased as the protective-wall height increased, because the flame contact area with the wall surface expanded. Then the flame developed above due to the effect of pressure difference.
For the various monitoring points, the overpressure evolutions are shown in Figure 13 and the temperature evolutions are shown in Figure 14. The overpressure and temperature evolutions at monitoring points 7 and 8 did not change significantly inside the various height protective walls. Various-height walls all significantly reduced the overpressure and temperature in the area behind the wall. Setting a 4 m high protective wall reduced the overpressure the most. Monitoring point 14 shows a decrease in peak overpressure from 0.16 bar to 0.04 bar. However, the peak overpressure increased from 0.2 bar to 0.43 bar inside the wall. The temperature at monitoring point 13 decreased as the protective wall height increased. Protective walls 3 m and 4 m high had the same reduction effect on temperature, from 1620 K to 1200 K. The overpressure distribution at monitoring point 14 shows a significant difference in the time and magnitude of the peak overpressure outside the wall for various wall heights. The protective-wall height influenced the appearance time and magnitude of the diffraction shock wave. The lower the protective wall, the earlier the peak overpressure appeared and the greater the peak overpressure. The proper height of the protective wall for this hydrogen fuel cell container was 3 m, determined by comparing the simulation results.

5. Conclusions

In this study, the explosion accident of a hydrogen fuel cell container was numerically studied using FLACS. This study analyzed the consequences of premixed hydrogen fuel cell container explosions without protective walls. The protective effects of the protective walls were analyzed for various heights and distances.
This study demonstrates that protective walls are an effective measure to reduce explosion overpressure and limit flame development. Specifically, the peak overpressure in the area behind the wall was reduced by over 69%, and temperature was lowered to atmospheric levels. Our findings show that both the height and distance of the protective wall from the container have an impact on the protective effect. When the protective wall is too close to the container, reflected shock waves and flames can generate a high-temperature and high-pressure area that can harm humans and equipment inside the wall. The peak overpressure and temperature behind the wall are lowest when the protective wall is 4 m high, but then the peak reflected overpressure inside the wall is highest. The protective effect of the 2 m high wall is the worst, with the overpressure and temperature behind the wall exceeding the injury criteria. Based on our study, we recommend a protective wall distance of 5 m and a height of 3 m as the optimal combination for protecting the area behind the wall while reducing the reflection overpressure and temperature inside the wall.
Although there have been some studies on hydrogen explosions in hydrogen production plants or refueling stations, these studies mainly focus on fixed buildings, and research on portable systems is very limited. Additionally, there is a lack of research on the effectiveness of protective walls in preventing explosions. The novelty of this study lies in filling the research gap on protective walls for portable systems, thus providing a scientific basis for the safety- and protection-design of portable fuel cell systems. This study provides a reference for the design of protective walls for hydrogen fuel cell containers.

Author Contributions

Methodology, M.L.; Software, M.L.; Validation, L.Z.; Data curation, L.Z.; Writing—original draft, L.Z., Q.W., Y.Z. and J.Z.; Writing—review & editing, M.L., X.L. and Q.B. All authors have read and agreed to the published version of the manuscript.

Funding

This research and APC were funded by the Technology Project of State Grid Zhejiang Electric Power Company, LTD. (No. B311DS221001) “Research on risk identification and safety protection technology of electric-hydrogen coupling system”.

Data Availability Statement

Data available on request due to restrictions eg privacy or ethical. The data presented in this study are available on request from the corresponding author.

Acknowledgments

This study was supported by the Technology Project of State Grid Zhejiang Electric Power Company, LTD.

Conflicts of Interest

The authors declare no conflict of interest.

References

  1. Noyan, O.F.; Hasan, M.M.; Pala, N. A Global Review of the Hydrogen Energy Eco-System. Energies 2023, 16, 1484. [Google Scholar] [CrossRef]
  2. Mneimneh, F.; Ghazzawi, H.; Abu Hejjeh, M.; Manganelli, M.; Ramakrishna, S. Roadmap to Achieving Sustainable Development via Green Hydrogen. Energies 2023, 16, 1368. [Google Scholar] [CrossRef]
  3. Samsun, R.C.; Rex, M.; Antoni, L.; Stolten, D. Deployment of Fuel Cell Vehicles and Hydrogen Refueling Station Infrastructure: A Global Overview and Perspectives. Energies 2022, 15, 4975. [Google Scholar] [CrossRef]
  4. Hu, Q.C.; Zhang, X.H.; Hao, H. A review of hydrogen-air cloud explosions: The fundamentals, overpressure prediction methods, and influencing factors. Int. J. Hydrogen Energy 2023, 48, 13705–13730. [Google Scholar] [CrossRef]
  5. Zhou, Y.H.; Li, Y.C.; Gao, W. Experimental investigation on unconfined hydrogen explosion with different ignition height. Int. J. Hydrogen Energy 2023, 48, 20112–20123. [Google Scholar] [CrossRef]
  6. Zhou, Y.H.; Li, Y.C.; Gao, W. Experimental research on unconfined hydrogen explosion of different gas scale and the overpressure prediction method. Int. J. Hydrogen Energy 2023. [Google Scholar] [CrossRef]
  7. Jiang, Y.T.; Li, Y.C.; Zhou, Y.H.; Jiang, H.P.; Zhang, K.; Gao, Z.H.; Gao, W. Investigation on unconfined hydrogen cloud explosion with external turbulence. Int. J. Hydrogen Energy 2021, 47, 8658–8670. [Google Scholar] [CrossRef]
  8. Zhuang, C.J.; Zhang, L.J.; Tao, G.; Zhang, Y.Q.; Huang, H.; Wang, Z.R. Effect of concentration, obstacles, and ignition location on the explosion overpressure of hydrogen-air in a closed-vessel. Int. J. Hydrogen Energy 2023. [Google Scholar] [CrossRef]
  9. Zhou, N.; Mei, Y.; Li, X.; Chen, B.; Huang, W.Q.; Zhao, H.J.; Yuan, X.J. Numerical simulation of the influence of vent conditions on the characteristics of hydrogen explosion in confined space. Combust. Theory Model. 2022, 26, 241–259. [Google Scholar] [CrossRef]
  10. Xing, H.; Yu, R.; Xu, G.; Li, X.; Qiu, Y.; Wang, D.; Li, B.; Xie, L. Theoretical and Experimental Investigation of Explosion Characteristics of Hydrogen Explosion in a Closed Vessel. Energies 2022, 15, 8630. [Google Scholar] [CrossRef]
  11. Dai, T.K.; Zhang, B.; Liu, H. On the explosion characteristics for central and end-wall ignition in hydrogen-air mixtures: A comparative study. Int. J. Hydrogen Energy 2021, 46, 30861–30869. [Google Scholar] [CrossRef]
  12. Guo, J.; Wang, C.J.; Liu, X.Y.; Chen, Y. Explosion venting of rich hydrogen-air mixtures in a small cylindrical vessel with two symmetrical vents. Int. J. Hydrogen Energy 2017, 42, 7644–7650. [Google Scholar] [CrossRef]
  13. Luo, X.J.; Wang, C.J.; Rui, S.C.; Wan, Y.; Zhang, Z.; Li, Q. Effects of ignition location, obstacles, and vent location on the vented hydrogen-air deflagrations with low vent burst pressure in a 20-foot container. Fuel 2020, 280, 118677. [Google Scholar] [CrossRef]
  14. Russo, P.; De Marco, A.; Parisi, F. Assessment of the Damage from Hydrogen Pipeline Explosions on People and Buildings. Energies 2020, 13, 5051. [Google Scholar] [CrossRef]
  15. To, C.W.; Chow, W.K.; Cheng, F.M. Simulation of Possible Fire and Explosion Hazards of Clean Fuel Vehicles in Garages. Sustainability 2021, 13, 12537. [Google Scholar] [CrossRef]
  16. Zhao, Z.; Liu, M.; Xiao, G.; Cui, T.; Ba, Q.; Li, X. Numerical Study on Protective Measures for a Skid-Mounted Hydrogen Refueling Station. Energies 2023, 16, 910. [Google Scholar] [CrossRef]
  17. Zhang, S.H.; Zhang, Q. Effect of vent size on vented hydrogen-air explosion. Int. J. Hydrogen Energy 2018, 43, 17788–17799. [Google Scholar] [CrossRef]
  18. Pang, L.; Li, G.Y.; Yang, K.; Hu, Q.R. Characteristics of external explosions induced by vented hydrogen deflagration. Int. J. Hydrogen Energy 2023, 48, 18129–18140. [Google Scholar] [CrossRef]
  19. Rokhy, H.; Mostofi, T.M. Tracking the explosion characteristics of the hydrogen-air mixture near a concrete barrier wall using CESE IBM FSI solver in LS-DYNA incorporating the reduced chemical kinetic model. Int. J. Impact Eng. 2023, 172, 104401. [Google Scholar] [CrossRef]
  20. Yu, X.; Yan, W.J.; Liu, Y.; Zhou, P.G.; Li, B.; Wang, C.J. The flame mitigation effect of vertical barrier wall in hydrogen refueling stations. Fuel 2022, 315, 123265. [Google Scholar] [CrossRef]
  21. Xu, R.Z.; Chen, L.; Fang, Q.; Zheng, Y.Z.; Li, Z.; Cao, M.J. Protective effects of gabion wall against blast waves from large TNT-equivalent explosions. Eng. Struct. 2021, 249, 113389. [Google Scholar] [CrossRef]
  22. Nian, X.Z.; Xie, Q.M.; Kong, X.L.; Yao, Y.K.; Huang, K. Experimental and numerical study on protective effect of RC blast wall against air shock wave. Def. Technol. 2022. [Google Scholar] [CrossRef]
  23. Bleyer, A.; Taveau, J.; Djebaïli-Chaumeix, N.; Paillard, C.E.; Bentaïb, A. Comparison between FLACS explosion simulations and experiments conducted in a PWR Steam Generator casemate scale down with hydrogen gradients. Nucl. Eng. Des. 2012, 245, 189–196. [Google Scholar] [CrossRef]
  24. Su, B.; Luo, Z.M.; Wang, T.; Liu, L. Experimental and numerical evaluations on characteristics of vented methane explosion. J. Cent. South Univ 2020, 27, 2382–2393. [Google Scholar] [CrossRef]
  25. Vyazmina, E.; Jallais, S. Validation and recommendations for FLACS CFD and engineering approaches to model hydrogen vented explosions: Effects of concentration, obstruction vent area and ignition position. Int. J. Hydrogen Energy 2016, 41, 15101–15109. [Google Scholar] [CrossRef]
  26. Hjertager, B.H. Computer Simulation of Turbulent Reactive Gas Dynamics. Model. Identif. Control (MIC) 1984, 5, 211–236. [Google Scholar] [CrossRef]
  27. FLACS-CFD Technical Manuals. Available online: https://www.gexcon.com/wp-content/uploads/2023/02/FLACS-CFD-22.2-manual.pdf (accessed on 9 April 2023).
  28. Treadwell, I. Effects of blasts on the human body. Nurs RSA 1989, 4, 32–36. Available online: https://pubmed.ncbi.nlm.nih.gov/2733763/ (accessed on 9 April 2023).
  29. Kashkarov, S.; Li, Z.Y.; Molkov, V. Blast wave from a hydrogen tank rupture in a fire in the open: Hazard distance nomograms. Int. J. Hydrogen Energy 2020, 45, 2429–2446. [Google Scholar] [CrossRef]
Figure 1. Model of a containerized hydrogen fuel cell system.
Energies 16 04477 g001
Figure 2. Location of monitoring points and protective walls.
Energies 16 04477 g002
Figure 3. Computation grid and grid sensitivity analysis.
Energies 16 04477 g003
Figure 4. Overpressures at various times without protective walls.
Energies 16 04477 g004
Figure 5. Temperatures at various times without protective walls.
Energies 16 04477 g005
Figure 6. (a) Evolution of the pressure at each monitoring point without protective walls; (b) Evolution of the temperature at each monitoring point without protective walls.
Energies 16 04477 g006
Figure 7. Overpressures at various times for various protective wall distances.
Energies 16 04477 g007
Figure 8. Temperatures at various times for various protective wall distances.
Energies 16 04477 g008
Figure 9. Overpressure evolutions at various monitoring points for various protective wall distances.
Energies 16 04477 g009
Figure 10. Temperature evolutions at various monitoring points for various protective wall distances.
Energies 16 04477 g010
Figure 11. Overpressures at various times for various protective wall heights.
Energies 16 04477 g011
Figure 12. Temperatures at various times for various protective wall heights.
Energies 16 04477 g012
Figure 13. Overpressure evolutions at various monitoring points for various protective wall heights.
Energies 16 04477 g013
Figure 14. Temperature evolutions at various monitoring points for various protective wall heights.
Energies 16 04477 g014
Table 1. Modeled hydrogen explosion scenarios.
ScenarioDistance of Protective Wall from the Container (m)Height of Protective Wall (m)
case 1No protective wallsNo protective walls
case 233
case 343
case 453
case 554
case 652
Table 2. Overpressure injury to humans [29].
Overpressure (bar)Injury to the Human Body
<0.0135No harm
0.0135–0.165Slight injury
0.165–1.0Serious injury
>1.0Fatality
Table 3. Overpressure damage to buildings [29].
Overpressure (bar)Damage to Buildings
<0.048No damage
0.048–0.069Minor damage
0.069–0.345Partial demolition
>0.345Destruction
Disclaimer/Publisher’s Note: The statements, opinions and data contained in all publications are solely those of the individual author(s) and contributor(s) and not of MDPI and/or the editor(s). MDPI and/or the editor(s) disclaim responsibility for any injury to people or property resulting from any ideas, methods, instructions or products referred to in the content.