Article

Thermal Decomposition Processes in Relation to the Type of Organic Matter, Mineral and Maceral Composition of Menilite Shales

1
Institute for Applied Geology, Silesian University of Technology, 2 Akademicka St., 44-100 Gliwice, Poland
2
Oil and Gas Institute—National Research Institute, 25A Lubicz St., 31-503 Kraków, Poland
*
Author to whom correspondence should be addressed.
Energies 2023, 16(11), 4500; https://doi.org/10.3390/en16114500
Submission received: 5 May 2023 / Revised: 27 May 2023 / Accepted: 31 May 2023 / Published: 2 June 2023
(This article belongs to the Section J: Thermal Management)

Abstract

:
The aim of the research presented in this article was to analyse the processes of source-rock decomposition, including kinetic parameters of pyrolysis, in relation to the type of the organic matter and its maturity. The examined source rocks were Menilite shales from several units within the Flysch Carpathians (Poland). The samples were analysed with use of thermal methods, including Rock-Eval and thermogravimetry coupled with an FTIR detector. Kinetic parameters were determined with use of the model-free integral isoconversion method Kissinger–Akahira–Sunose. The observed gas evolution from the source rocks indicates two stages of organic matter decomposition for some samples. The main stage of pyrolysis takes place in the temperature range from 300 to 500 °C, while the secondary—cracking—takes place in the temperature range from 500 to 650 °C. Using FTIR, we detected vibrations derived from N-H groups, which provide information on the presence of nitrogen in the organic matter, and indicate a low maturity level. C=C stretching vibrations of aromatic hydrocarbons prove a higher maturity of organic matter. The Menilite source rocks have different activation energies, which are related to different organic and mineral compositions. The maturity of organic matter does not have a decisive influence on the kinetic parameters. A high share of carbonates in the rock increases the value of the apparent activation energy. The high share of bituminite within maceral components reduces the value of activation energy.

1. Introduction

The subject of the research presented in this paper are Menilite shales, which are the source rocks for the numerous accumulations of hydrocarbons exploited within the Outer Carpathians. Rocks belonging to the Menilite-type facies are characterised by their diversity in organic-matter content and composition, which is most often dominated by liptinite (alginite, bituminite, liptodetrinite) with an admixture of vitrinite (collotelinite, vitrodetrinite) and inertinite (fusinite, semifusinite, inertodetrinite) macerals. The maturity of organic matter (determined using both the Tmax and Ro parameters) most often indicates an immature phase, but in some areas it can reach the oil window [1,2,3,4]. Due to a very important role of the Menilite Beds in the Carpathian oil system, these sediments are a constant subject of investigations, mostly geochemical in nature (e.g., [5,6,7,8,9,10,11]).
The activation energy related to the generation of hydrocarbons generally reflects the dissociation energy of organic macromolecular bonds. The general assumption to be made when determining the activation energy is that there is a direct relationship between the average activation energy of hydrocarbon generation (Ea) and the type of organic matter, i.e., EaI < EaII1 < EaII2 < EaIII. This means that organic matter with a lower activation energy is more likely to generate crude oil. Assuming that the effective hydrocarbon-generation period is equivalent to a kerogen conversion factor in the range of 10% to 90%, the temperature range ∆T of the effective hydrocarbon-generation period for source rock will be in the following order: TIII > TII2 > TII1 > TI. The maximum generation rate (Vm) will be ranked as follows: VmI > VmII1 > VmII2 > VmIII. Hence, it can be concluded that the better the type of organic matter, the faster will be the rate of hydrocarbon generation and the more favourable the conditions for filling a hydrocarbon reservoir.
Qigui et al. [12] conducted studies on selected source rocks of marine origin from the southern part of China and determined that the activation energy depends on the type of kerogen as follows: EI < EII < EIII. Data obtained by Peters et al. [13] showed, however, that the kinetics of the source-rock decomposition may differ significantly even for the same type of kerogen, due to the variable composition of these rocks. The type of kerogen, determined using the hydrogen index HI, is not related to the kinetic parameters, and the assumption of specific kinetics of thermal decomposition, e.g., of type I or II kerogen, may lead to serious errors in the modelling of petroleum systems [14].
The decomposition process of source rocks is very complicated due to the complex composition of organic and inorganic matter present in these rocks. The usual mineral components of rocks, such as source rock, gas shale or oil shale, include quartz, clay minerals, other aluminosilicates, carbonates and—to a lesser extent—iron sulphides. Many research works deal with the issue of the influence of inorganic components of these rocks on the course of the combustion or pyrolysis process, but the results of these studies are not unambiguous. Clays and other aluminosilicates are usually believed to have a catalytic effect on the pyrolysis of organic matter in source rocks [15,16].
Yan et al. [17] conducted a study on Huadian oil shale and found that the effect of all inorganic minerals in oil shale is to increase the reactivity of organic matter, which promotes its decomposition and release of gases during the pyrolysis. A detailed analysis on Huadian oil samples was carried out by Chang et al. [18]. The findings of this research are as follows: silicates are found to promote the cracking and aromatization of aliphatic hydrocarbons; on the other hand, carbonates hinder the breakdown of long-chain aliphatic hydrocarbons. However, the same authors found that, due to the fact that carbonate minerals have an opposite effect to silicates in terms of the course of pyrolysis, it can be concluded that, through carbonate–silicate interactions, carbonates ultimately reduce the activity of silicates [18].
In case of heavy oil, however, Ariskina et al. [19] noticed a catalytic effect of the carbonate minerals in the process of combustion. Karabakan et al. [20] noted that the mechanism of interaction of carbonates has not yet been fully elucidated. These authors believe that carbonate minerals may play the role of a catalyst in the process of kerogen decomposition, for example due to the fact that M2+e-O surface groups are formed as a result of the interaction of alkaline earth metal cations with -COOH and -OH groups.
The aim of the research presented in this article was to analyse the processes of source-rock decomposition on the example of Menilite shale samples from several units in the Flysch Carpathians. The course of the thermal decomposition process was correlated with geochemical parameters, mineral and maceral composition. The samples were selected so that the organic matter contained in them mostly had a relatively low degree of thermal maturity.

2. Experimental Methods

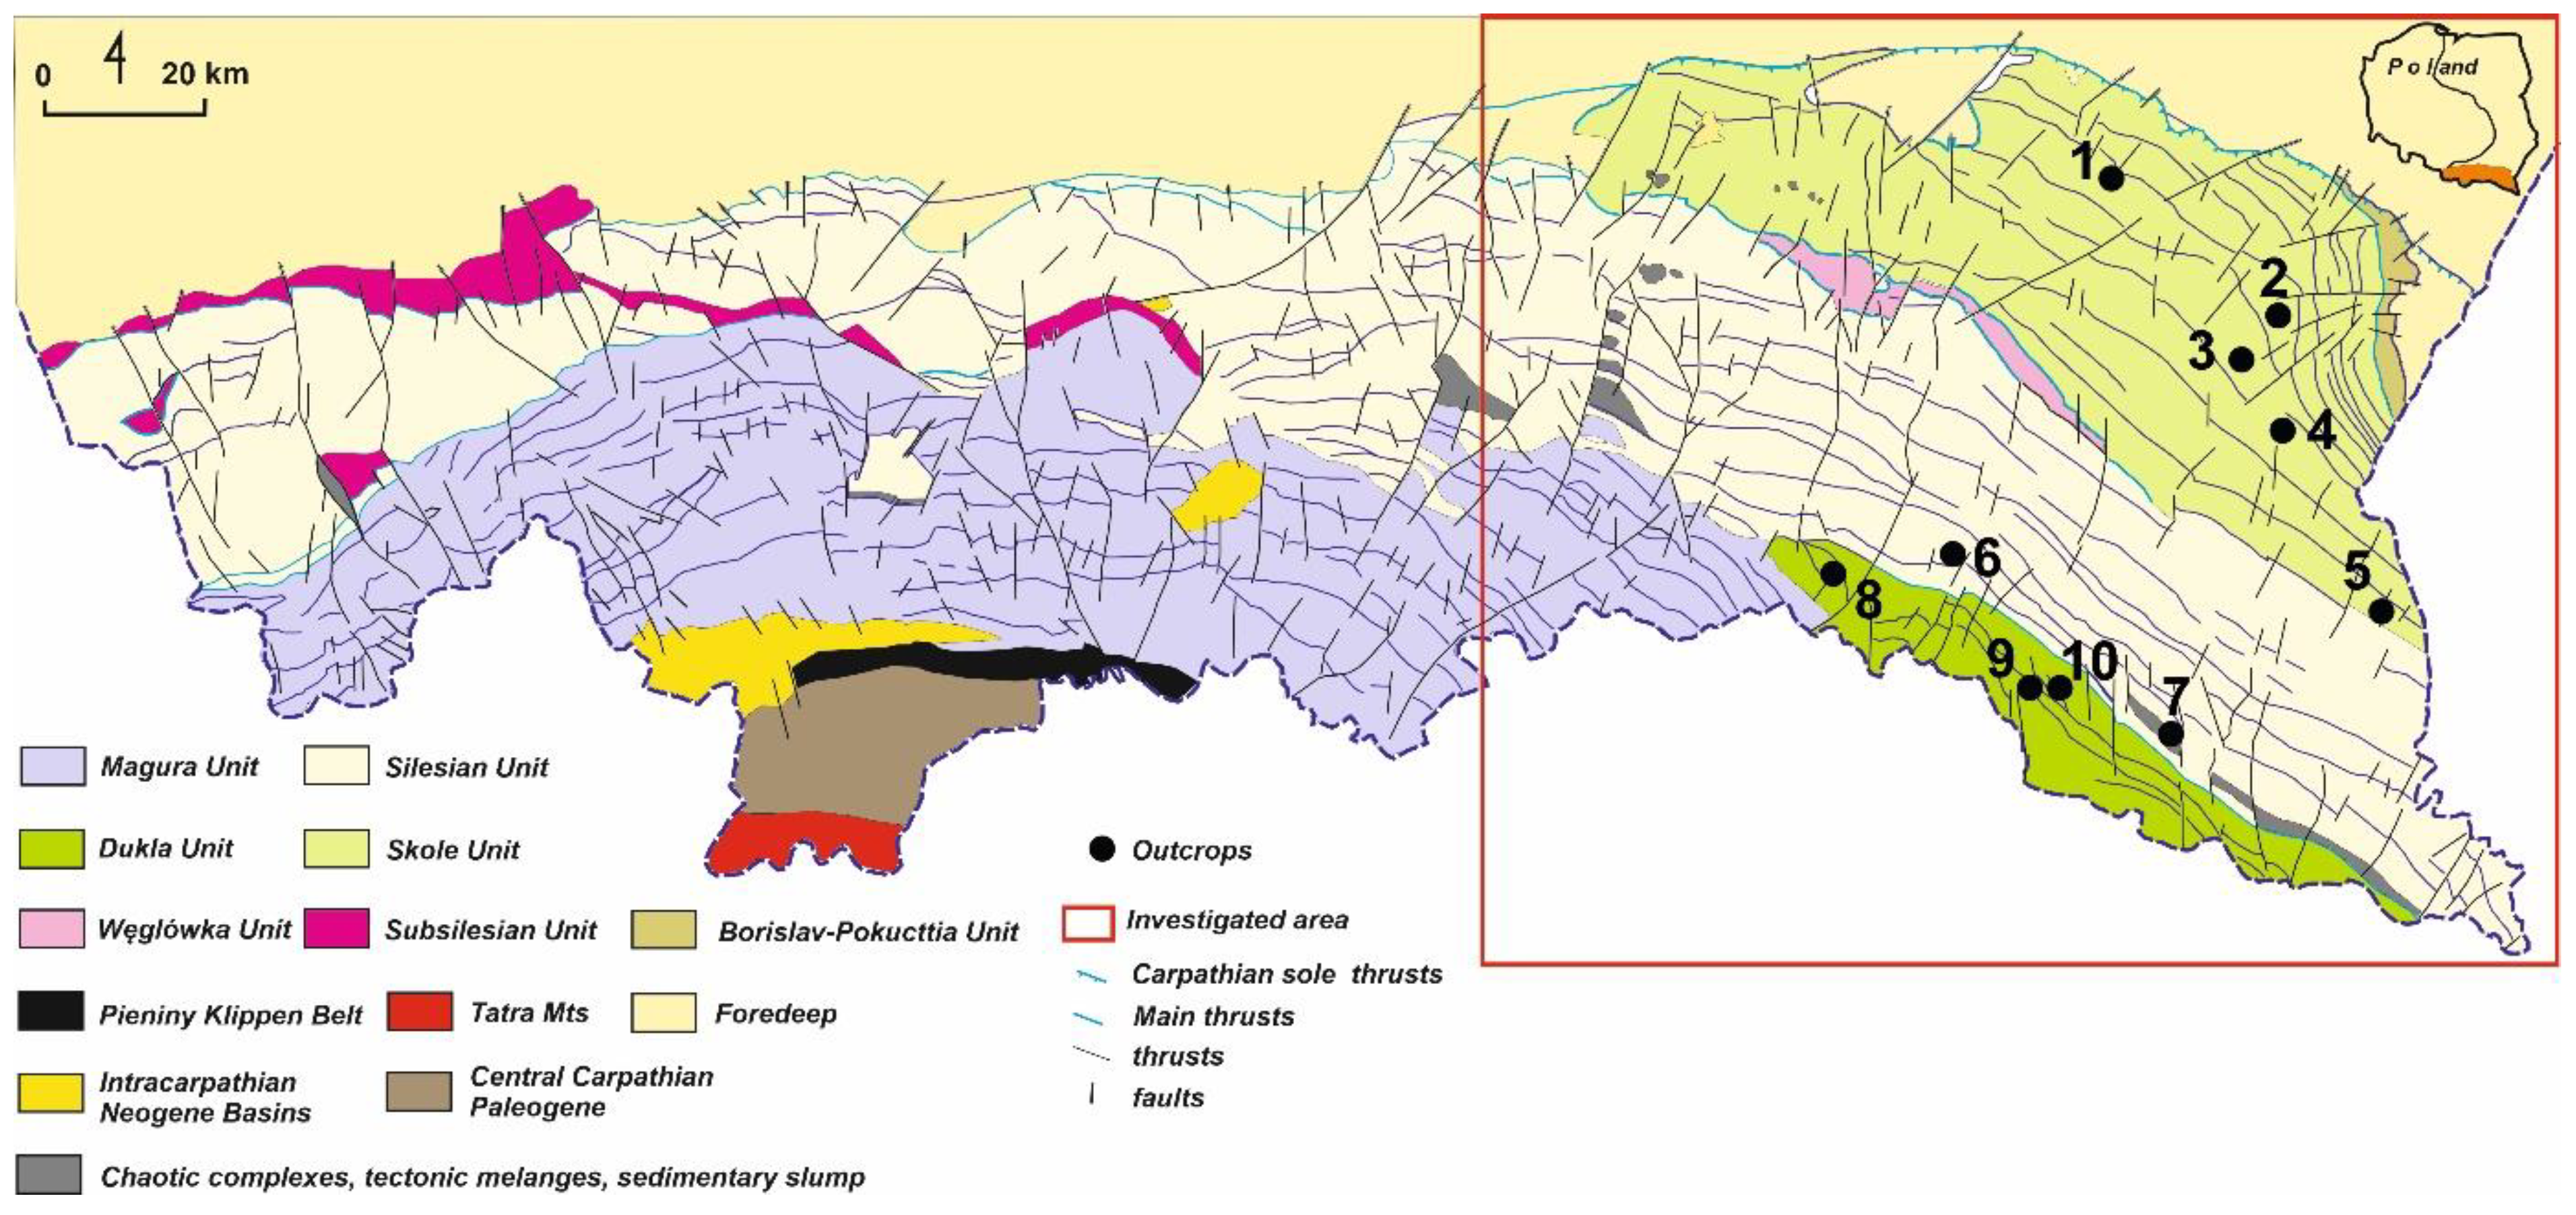
The analysed samples were collected from outcrops (Figure 1) of the Menilite Beds within the Flysch Carpathians (Poland). They belong to several units: The Silesian Unit (Wernejówka, Łubne), the Skole Unit (Dynów, Bircza, Leszczawa Górna, Wojtkowa, Bandrów) and the Dukla Unit (Zyndranowa, Czystogarb, Komańcza). In terms of the stratigraphy, the samples belong to the Oligocene. In all the analyses bulk rock samples were examined. Studies performed by Peters et al. [21] and Reynolds and Burnham [22] revealed that for low-maturity host rocks that contain large amounts of organic matter (OM), the kinetic parameters of kerogen and bulk rock are very similar.
The composition of the mineral phases of the rocks was determined via XRD using a Bruker-AXS Advance D8 powder diffractometer with 2Θ/Θ geometry (produced in Mannheim, Germany). The diffractometer is equipped with a LynxEye linear semiconductor detector and a SOL-XE energy dispersion detector.
Rock-Eval analyses were performed on rock samples using the Rock-Eval-6 Turbo analyser (Vinci Technologies, Nanterre, France). The samples were ground in an agate mortar to obtain grains of less than 0.02 mm. The first stage of the experiment was carried out in pyrolytic conditions under inert (nitrogen) atmosphere, in the temperature range of 300–650 °C, with heating at a rate of 25 °C min−1. At this stage, hydrocarbons and oxygen-containing compounds were released from the kerogen. Then, in the temperature range of 300–850 °C, the remaining part of the sample was burned in an oxidizing atmosphere (at a heating rate of 25 °C min−1). The released combustion products (CO2 and CO) were analysed with an IR detector. Microscopic observations were performed using O&GI-NRI with a Zeiss Axioplan optical microscope, at 500× magnification, using oil immersion (immersol 518 N, n = 1.518). The analyses were performed in two stages. In the first stage, the polished sections were observed under reflected light, also using fluorescence. In order to determine maceral composition of organic matter, the point-counting method was implemented (at least 500 points per sample were counted). During the second stage, the vitrinite reflectance was measured, in order to investigate the thermal maturity of the samples (two standards were used: spinel and garnet).
The TG/DSC analysis was performed at SUT using NETZSCH STA 449 F3 Jupiter® equipment (Selbt, Germany). The powdered rock samples were heated in alumina crucibles with pierced lids. Each sample was analysed several times under different experimental procedures:
(1) Using rock samples of about 20 mg, a heating rate of 10 °C/min and a gas flow rate of 50 mL min−1. The heating program was designed in such a way as to be compatible with the RE pyrolysis program. It included the following stages: 1—heating in a range of 40–300 °C, 2—an isothermal stage in which the temperature was maintained for 20 min at the level of 300 °C, 3—heating in the range of 300–650 °C, 4—an isothermal stage in which the temperature was maintained for 20 min at the level of 600 °C, 5—heating up to 1050 °C. Steps 1–4 were carried out in an inert gas atmosphere (nitrogen); step 5 in an oxidizing atmosphere (synthetic air).
(2) Using rock samples of about 20 mg, a heating rate of 10 °C/min and a gas flow rate of 50 mL min−1 in the temperature range of 40–1050 °C under inert atmosphere. In this experiment the gases released during pyrolysis were examined using FTIR (Bruker Optics GmbH, Ettlingen, Germany).
(3) Using rock samples of about 5 mg, a heating rate of 2, 5, 10, 15 and 20 °C min−1 and an inert gas flow rate of 50 mL min−1. Before the experiment the rock samples were ground and sieved to a size of less than 0.08 mm, to eliminate the effects of heat transfer and mass transfer in the rock particles on the kinetic parameters. The tests were carried under non-isothermal conditions over the temperature range of 40–600 °C. NETZSCH Kinetics Neo® software (Professional edition 2.4.68) was used to analyse data from thermo-chemical processes.
The FTIR method was used to study the gases emitted during thermogravimetric experiments. This was achieved using a Bruker alpha FTIR spectrometer directly coupled to an NETZSCH STA F3 thermal analyzer. Due to the fact that the FTIR spectrometer is located directly above the STA furnace, there is no gas transmission line, which improves the measurement quality [23]. The spectra were recorded every 16 s in the range of 400–4000 cm−1 with a resolution of 4 cm−1. The gas cell was kept at a constant temperature of 200 °C so that volatiles would not condense. OPUS software (Bruker Optics GmbH, Ettlingen, Germany) was used to analyse the obtained results.
The presence of individual gases and functional groups was determined on the basis of the characteristic FTIR absorption bands reported in the literature [17,24,25].
The kinetic parameters were determined based on thermogravimetric (TG) experiments using a methodology characterised above procedure (3). The model-free integral isoconversion method Kissinger–Akahira–Sunose (KAS) was implemented. In model-free methods, it is assumed that the reaction rate at a constant conversion rate depends only on the temperature, and, consequently, the activation energy can be estimated without specifying the reaction model [26].
Figure 1. Investigated area of the Polish part of Outer Carpathians [27,28]. Outcrops within the Skole, Silesian and Dukla Units: 1. Dynów; 2. Bircza; 3. Leszczawa Górna; 4. Wojtkowa; 5. Bandrów; 6. Wernejówka; 7. Łubne; 8. Zyndranowa; 9. Czystogarb; 10. Komańcza.
Energies 16 04500 g001

3. Results

3.1. Mineral Composition

Samples of 10 shale rocks from Oligocene Menilite formation were taken from outcrops within the Silesian, Skole and Dukla Units of the Flysch Carpathians (Table 1). The composition of the samples, given in Table 1, refers only to the crystalline components, so it does not take the presence of amorphous organic matter or some amorphous minerals into account. The composition of the samples is diverse; however, the main minerals are quartz and muscovite.
The highest quartz content is present in samples from the Silesian unit. Iron sulphide, pyrite, is also present in these samples. Some samples, mostly from the Skole unit are rich in carbonates (calcite and dolomite). It is worth to note the presence of pyrite in some samples from different units, as this component affects the course of thermal decomposition of the samples [29]. In the Leszczawa (Skole unit) and Łubne (Silesian Unit) samples, a rather rare mineral is present—jarosite. Jarosite is a hydrated potassium and iron sulphate with the formula KFe3+3(OH)6(SO4)2. This mineral is formed by the oxidation of iron sulphides and is found in the composition of menilite shales [30].

3.2. Maceral Composition

The maceral composition of the examined samples is rather monotonous. The rocks differ mainly in maceral proportions. There are macerals of all three main groups present (vitrinite, inertinite and liptinite) (Table 2; Figure 2). The most abundant are liptinite macerals (up to 29.5% vol., average 13% vol.) and they are represented by alginite, bituminite and liptodetrinite. The alginite content does not exceed 4.43% vol. It is mainly represented by lamalginite, which is in the form of single algae bodies or colonies. Telalginite is also present, but it is rather rare. The bituminite content changes in a wide range from traces to 27.2% vol. It usually appears in the form of laminae. Liptodetrinite consists of small liptinite particles (<10 µm) and is quite common, although it does not exceed 2.5% vol. Vitrinite macerals are represented by larger collotelinite and smaller vitrodetrinite. Vitrinite macerals rarely exceed 1% vol., apart from the sample collected at the Leszczawa outcrop, where the content of collotelinite is very high and reaches around 5.5% vol. Inertinite macerals (fusinite, semifusinite and inertodetrinite) are mostly present in the samples, although usually no more than few particles can be observed. Apart from the macerals mentioned above, in a few samples solid bitumen and zooclasts (fish) could be observed.

3.3. Hydrocarbon Potential and Thermal Maturity

Table 3 presents the results of RE analysis of the Menilite source rocks. The content of free hydrocarbons, indicated by the value S1, varies from 0.10 to 1.45 mg HC/g rock. An extremely high value of this parameter was achieved for the sample from Leszczawa (1.45 mg HC/g rock). At the same time, this sample is characterized by the lowest thermal maturity—0.27% RV (Tmax—408 °C) and the highest vitrinite content (5.84%). Such a high S1 value may be related to the intense bacterial activity during sedimentation, leading to transformation of algae bodies into bituminite (which in this sample is very common—27% vol.) and hydrocarbon generation.
The Hydrocarbon-generating potential (S2) for Menilite shales differs and varies from 4.15 to 26.47 mg HC/g rock. The S2 peak represents the hydrocarbon potential, as it is a result of cracking of heavy hydrocarbons in kerogen. The TOC value, which ranges from 1.28 to 8.59%, specifies the amount of organic matter in the sample. The MINC parameter (amount of inorganic carbon) is mostly low, and ranges from 0.10 to 0.25%. In the case of two of the samples (Dynów and Bandrów) from the Skole Unit this parameter is higher (3.33% and 5.16%, respectively) and indicates the presence of carbonates in the samples, which is also confirmed by XRD analysis results (Table 1). The relationship of the HI parameter to Tmax indicates that most of the samples represent oil-prone type II kerogen (Figure 3). Not taking the Wernejówka and Łubne samples (Silesian Unit) into account, we can conclude that most of the examined rocks are thermally immature (Tmax < 435 °C). This is also confirmed by the results of vitrinite reflectance, which is always lower than 0.5% (Table 2). In case of the Łubne sample, the Tmax value is much higher (Tmax = 459 °C), indicating higher maturity within the so-called “oil window”. Due to a lack of vitrinite macerals in this sample, the measurement of reflectance was impossible. However, microscopic investigation of the bituminite, showing very weak fluorescence, may indirectly confirm such a high maturity.

3.4. Thermal Decomposition

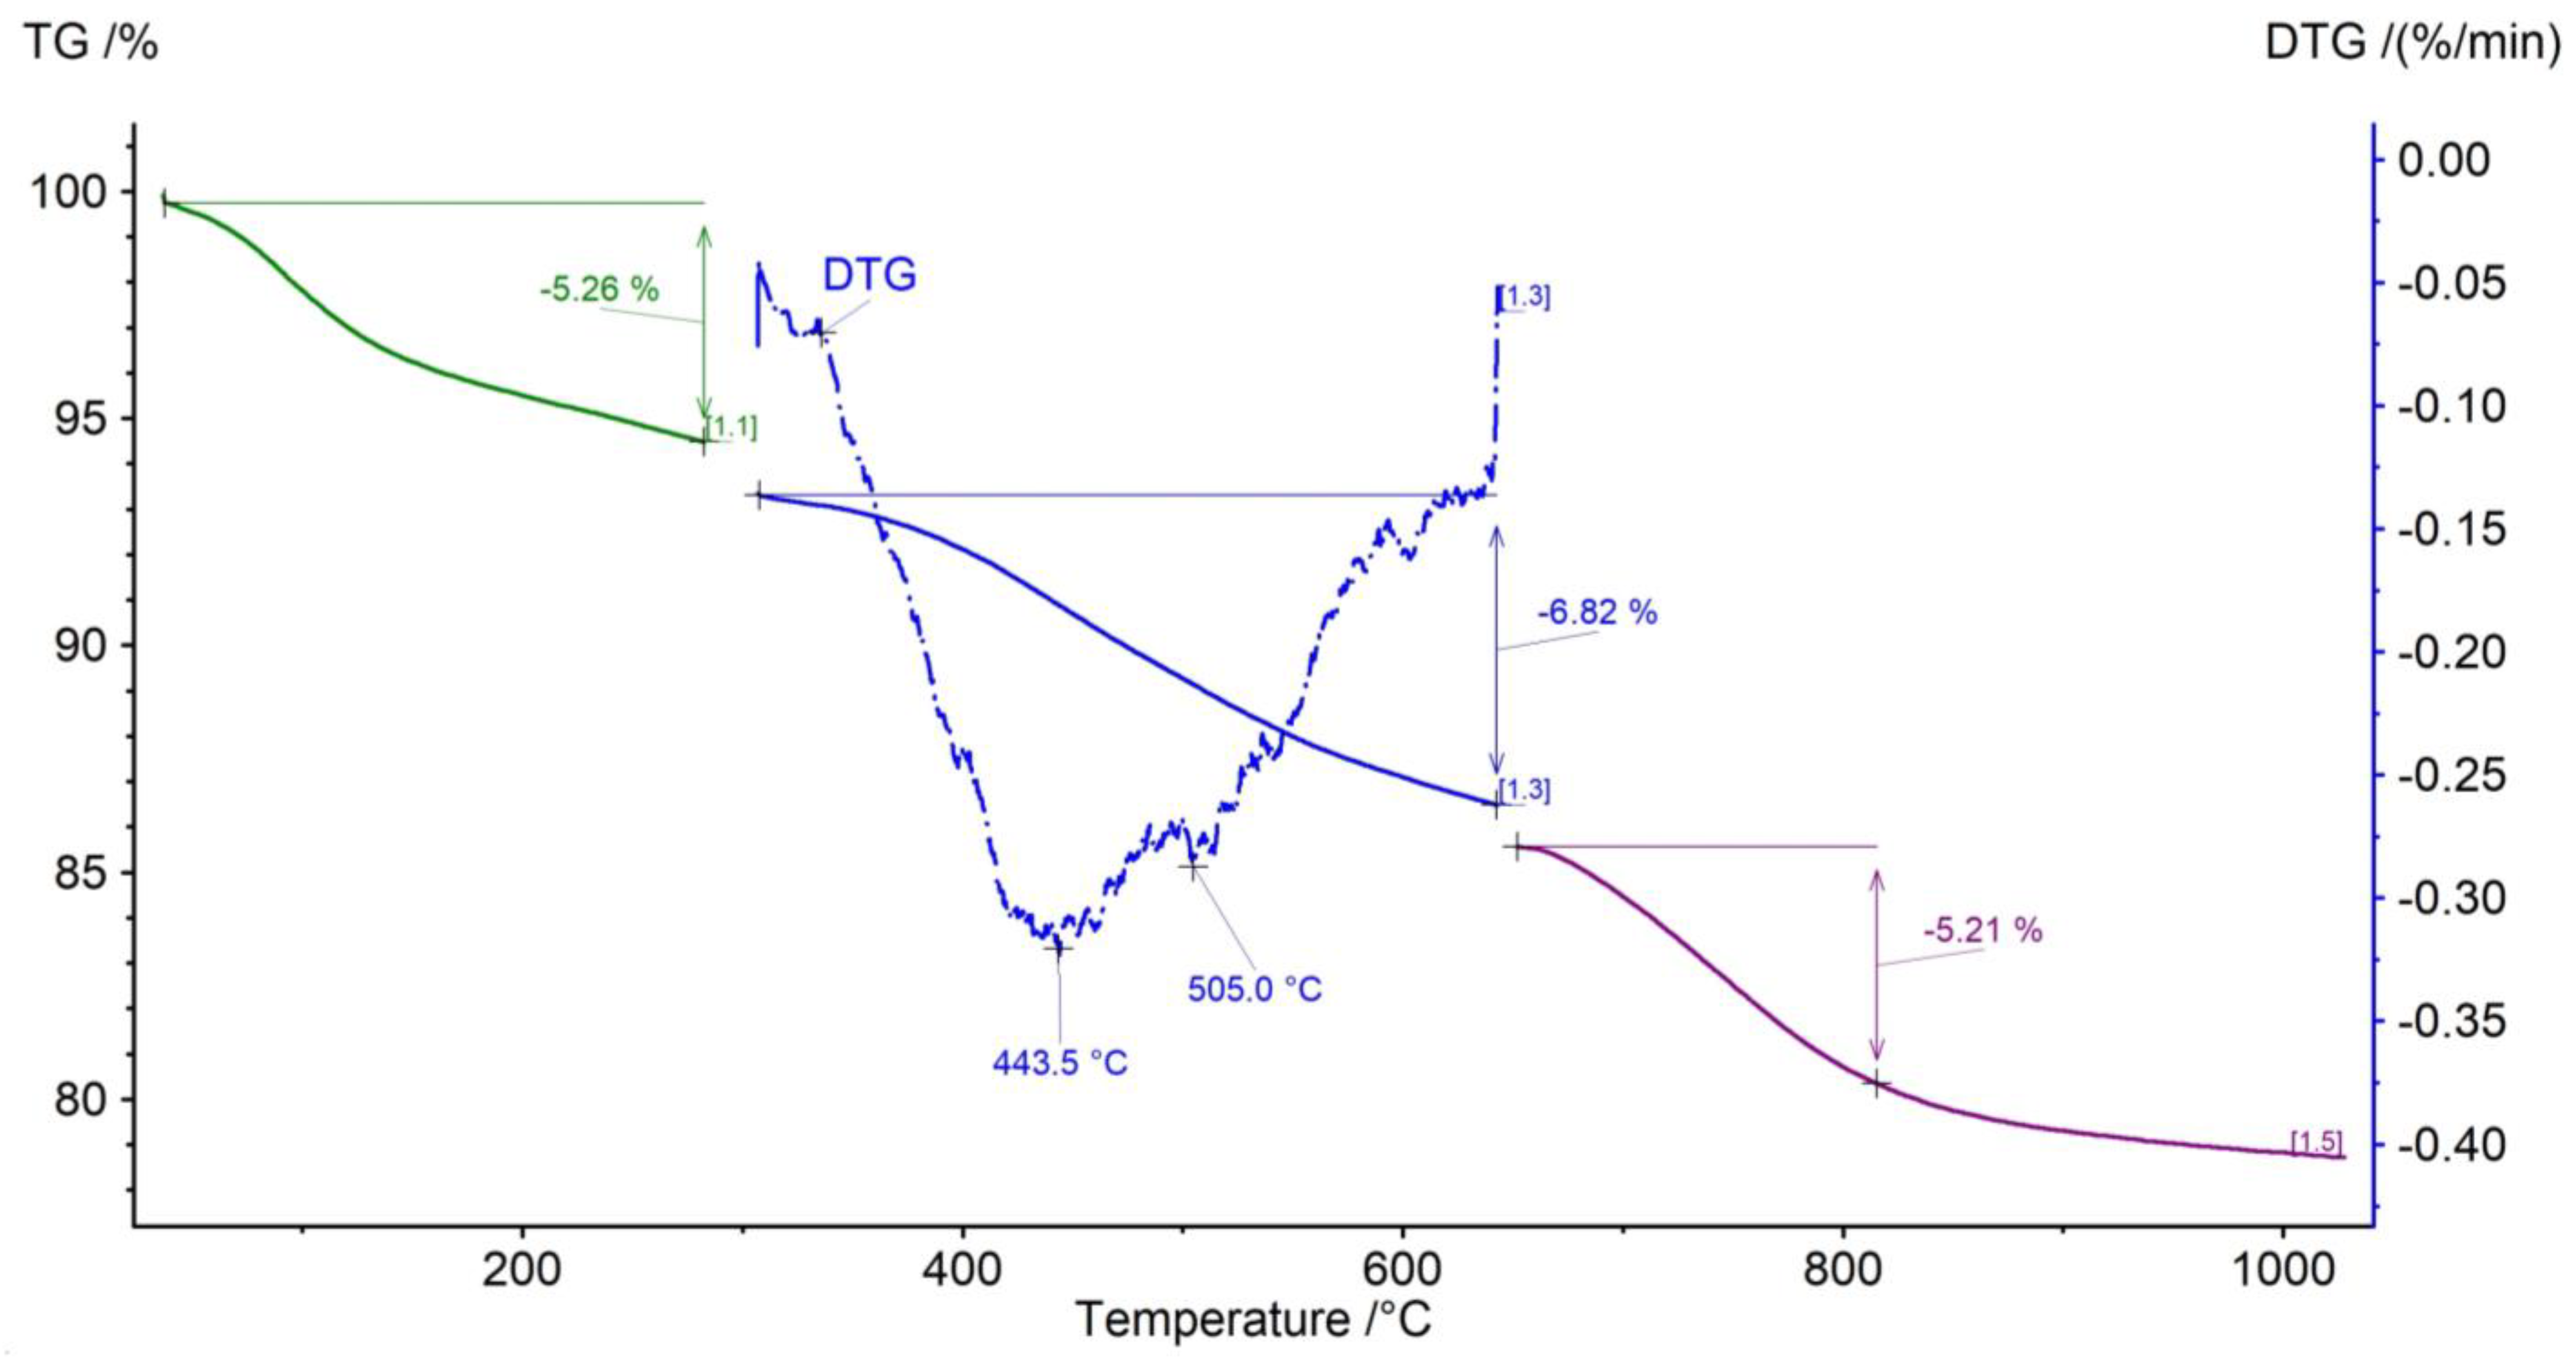
As mentioned in Section 2 (Experimental methods), the samples were examined using different experimental procedures. Procedure (1) is close to Rock-Eval temperature program; hence it enables a direct comparison of the results [31]. This method enables determination of the weight loss in the specified temperature ranges (Table 4), as exemplarily presented for the sample from Wojtkowa (Figure 4). The TG and DTG (in one segment only) curves are shown as a function of the temperature. The isothermal intervals in the heating program are not shown in the graph. The first mass loss seen in the graph is due to clay-mineral dehydration, overlapped by the first stage of organic matter (free bitumen) decomposition, resulting in a mass loss of 5.24%. In terms of pyrolysis of organic matter, the most interesting is the temperature interval from 300 to 650 °C, which can be compared to the S2 peak from the RE analysis. The pyrolysis proceeds in two steps, which is marked by double peak on the DTG curve. The double peak may also be an indicator of another overlapping reaction. In the case of the presented sample from Wojtkowa, the second reaction maximum is visible at a temperature of about 505 °C, which can be a result of pyrite (FeS2) decomposition [29]. The summarised mass loss of the pyrolysis reaction and the pyrite decomposition is 6.80%. In the third stage of the thermogram (650–1050 °C), due to the oxidizing atmosphere used, the organic matter remaining after the pyrolysis process is burned rapidly. In case of the Wojtkowa sample, the mass loss of 4.04% can be attributed to this process.
The general characteristics of the thermograms for each sample are summarized in Table 4. It can be noticed that the samples from Bircza and Leszczawa contain the highest amount of organic matter (10.58 and 11.55% of weight loss, respectively, within the temperature range of 300–650 °C). Overall weight loss in this range correlates with the value of the S2 peak from Rock-Eval analyses, which was confirmed by previous studies [31]. Some deviations from the rule result from the presence of mineral matter in the sample, the decomposition of which overlaps with the pyrolysis of organic matter. As noted in Table 4, in some cases the double peak on the DTG curve indicates these overlapping processes. Decomposition of pyrite is not clearly visible in all of the cases, as this reaction is overlapped by the decomposition of organic matter, as in the case of the sample from Łubne. The maximum temperatures for the relevant processes are marked with TTG symbols.
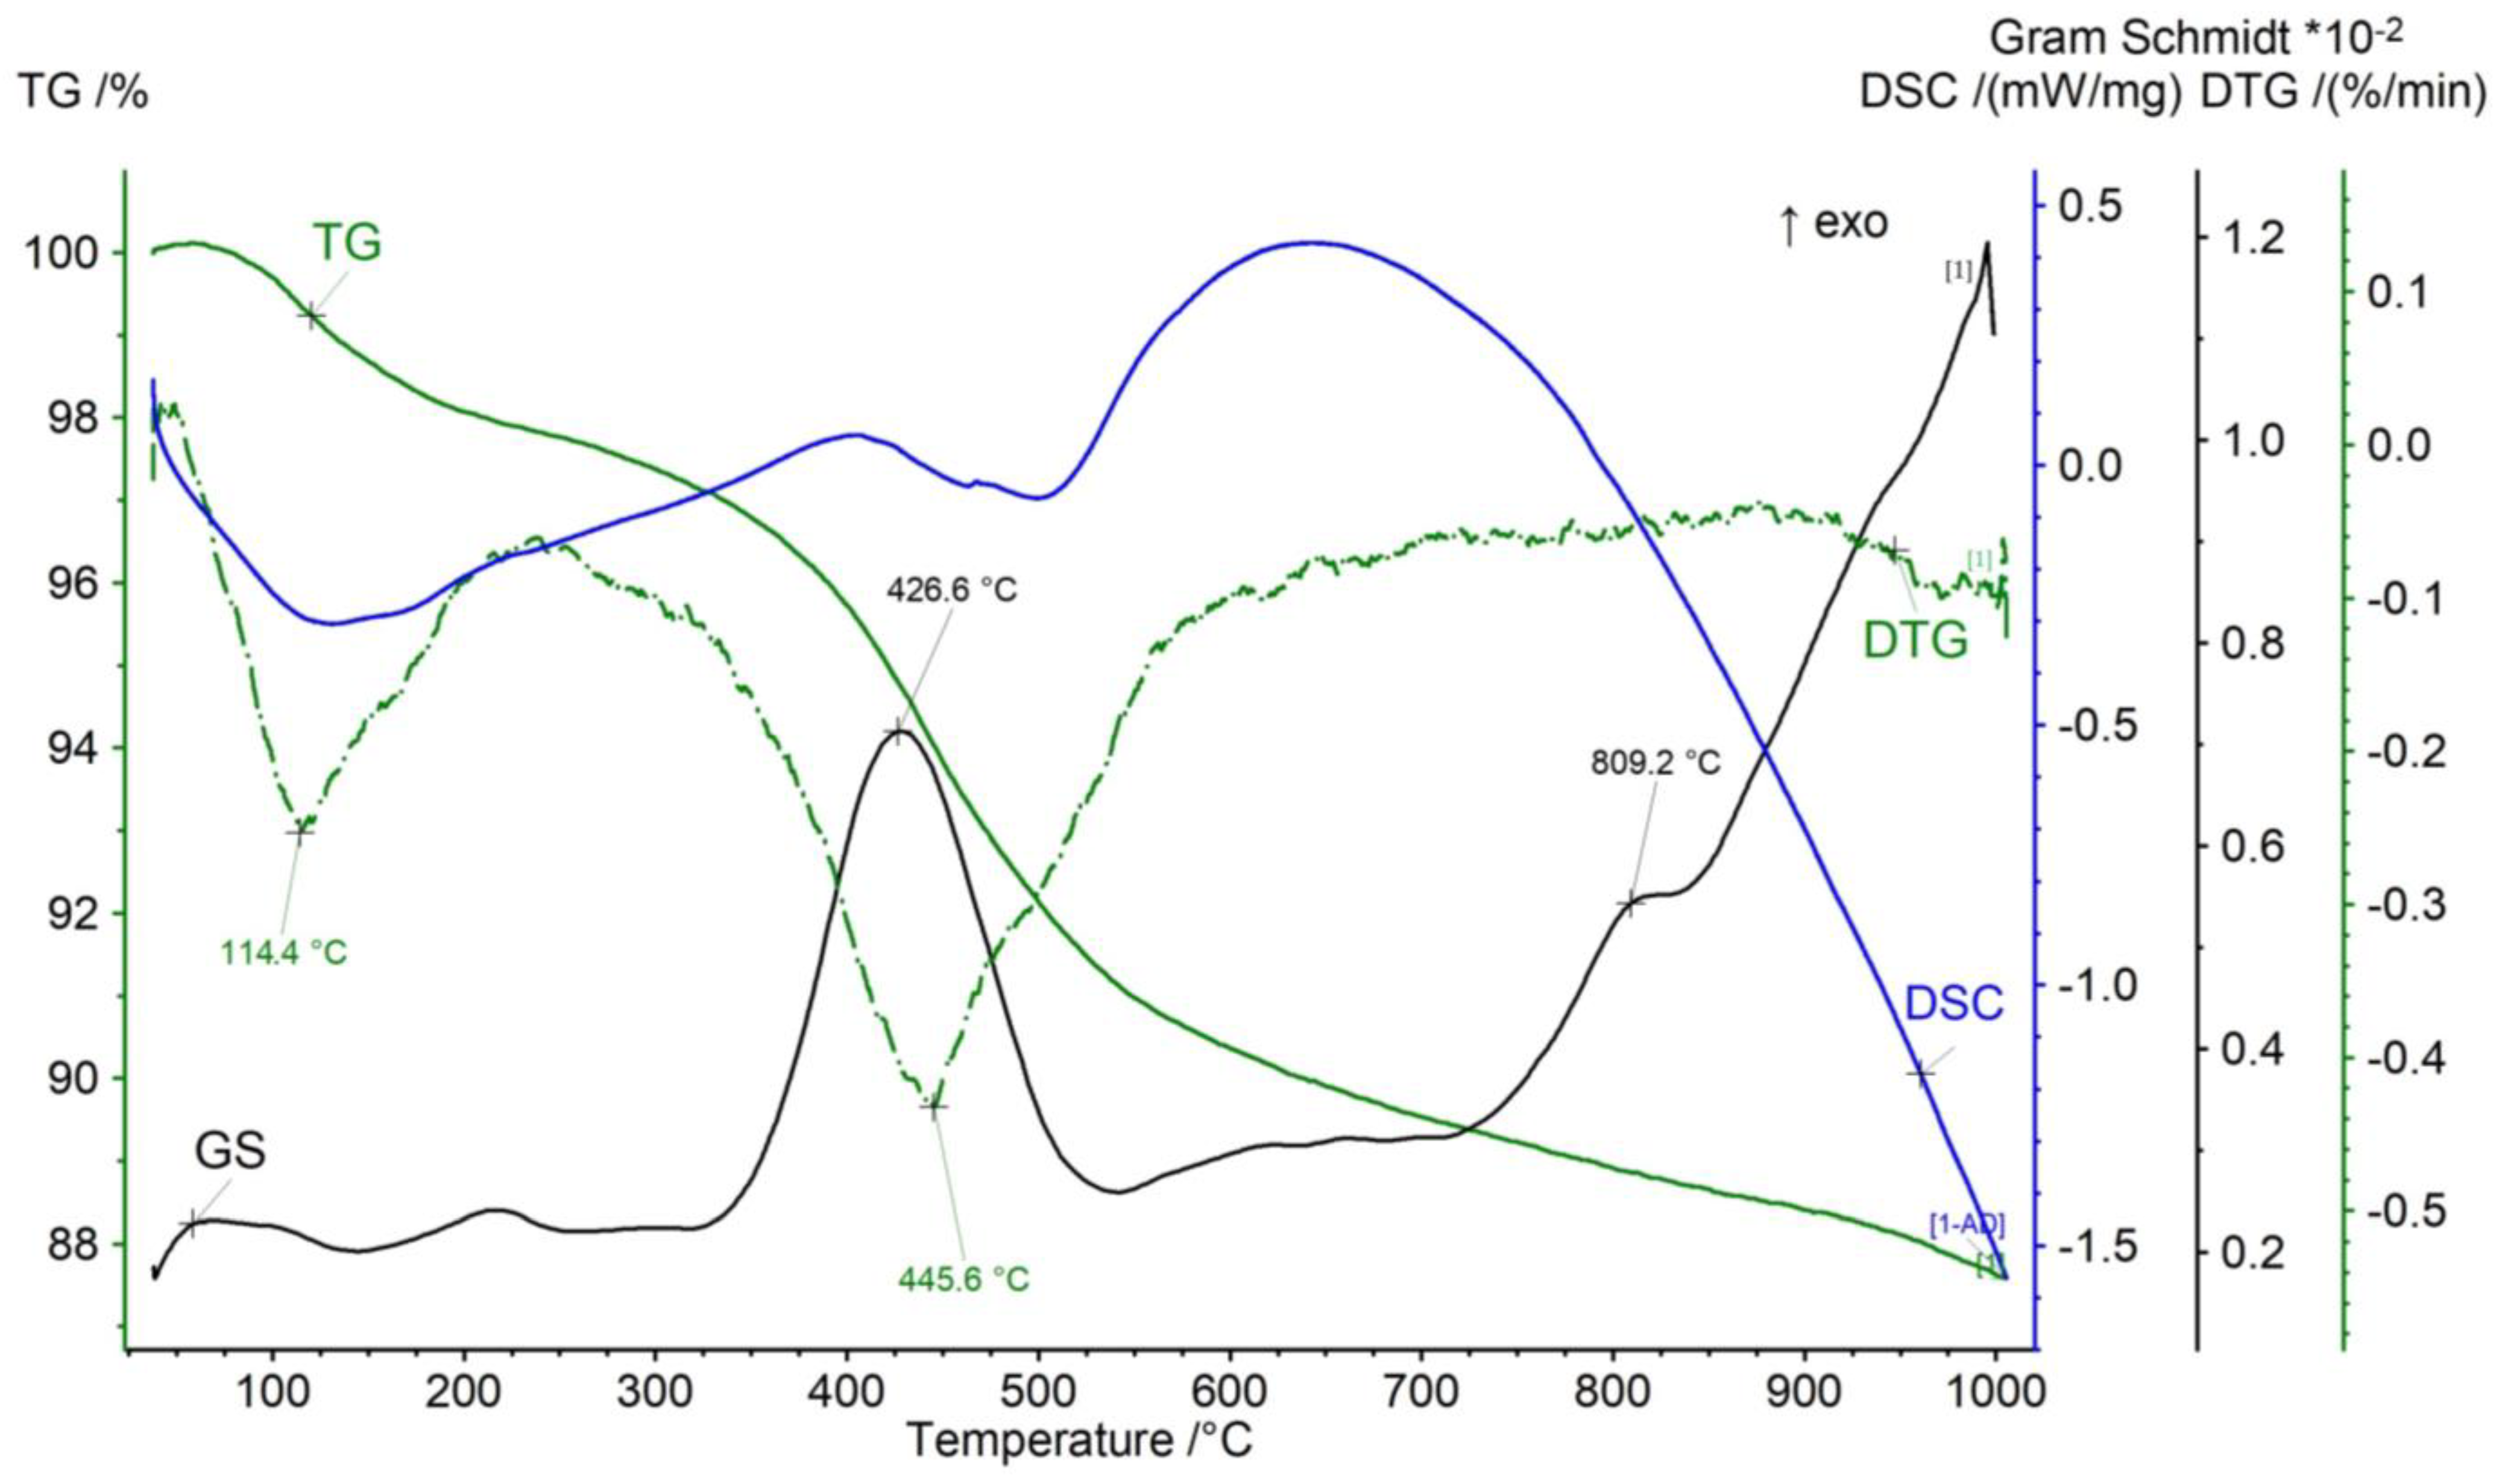
In the interpretation of thermogram, the analysis of gases released during the reactions is very helpful, thanks to the coupling of TG–FTIR methods. Figure 5 shows an example of a thermogram obtained using procedure (2), where the sample was heated continuously under inert atmosphere and the released gases were detected. The sample from Bircza (Figure 5) is characterised by a large amount of organic matter. The pyrolysis reaction begins at about 330 °C and lasts up to 530 °C, which is best reflected by the Gram–Schmidt (GS) curve, showing the cumulative gas emission from the sample during the experiment. The maximum of the gas emission is visible at 426.6 °C, while the TTG given by the DTG curve is shifted to a higher temperature of 445.6 °C. A slight deflection on the DTG and DSC curve over 500 °C, however, indicates that the decomposition of the components of the sample continues to higher temperatures, with lower release of gases. The interpretation of the absorption spectra obtained using the TG–FTIR analysis (Figure 6) helps to identify the reactions.
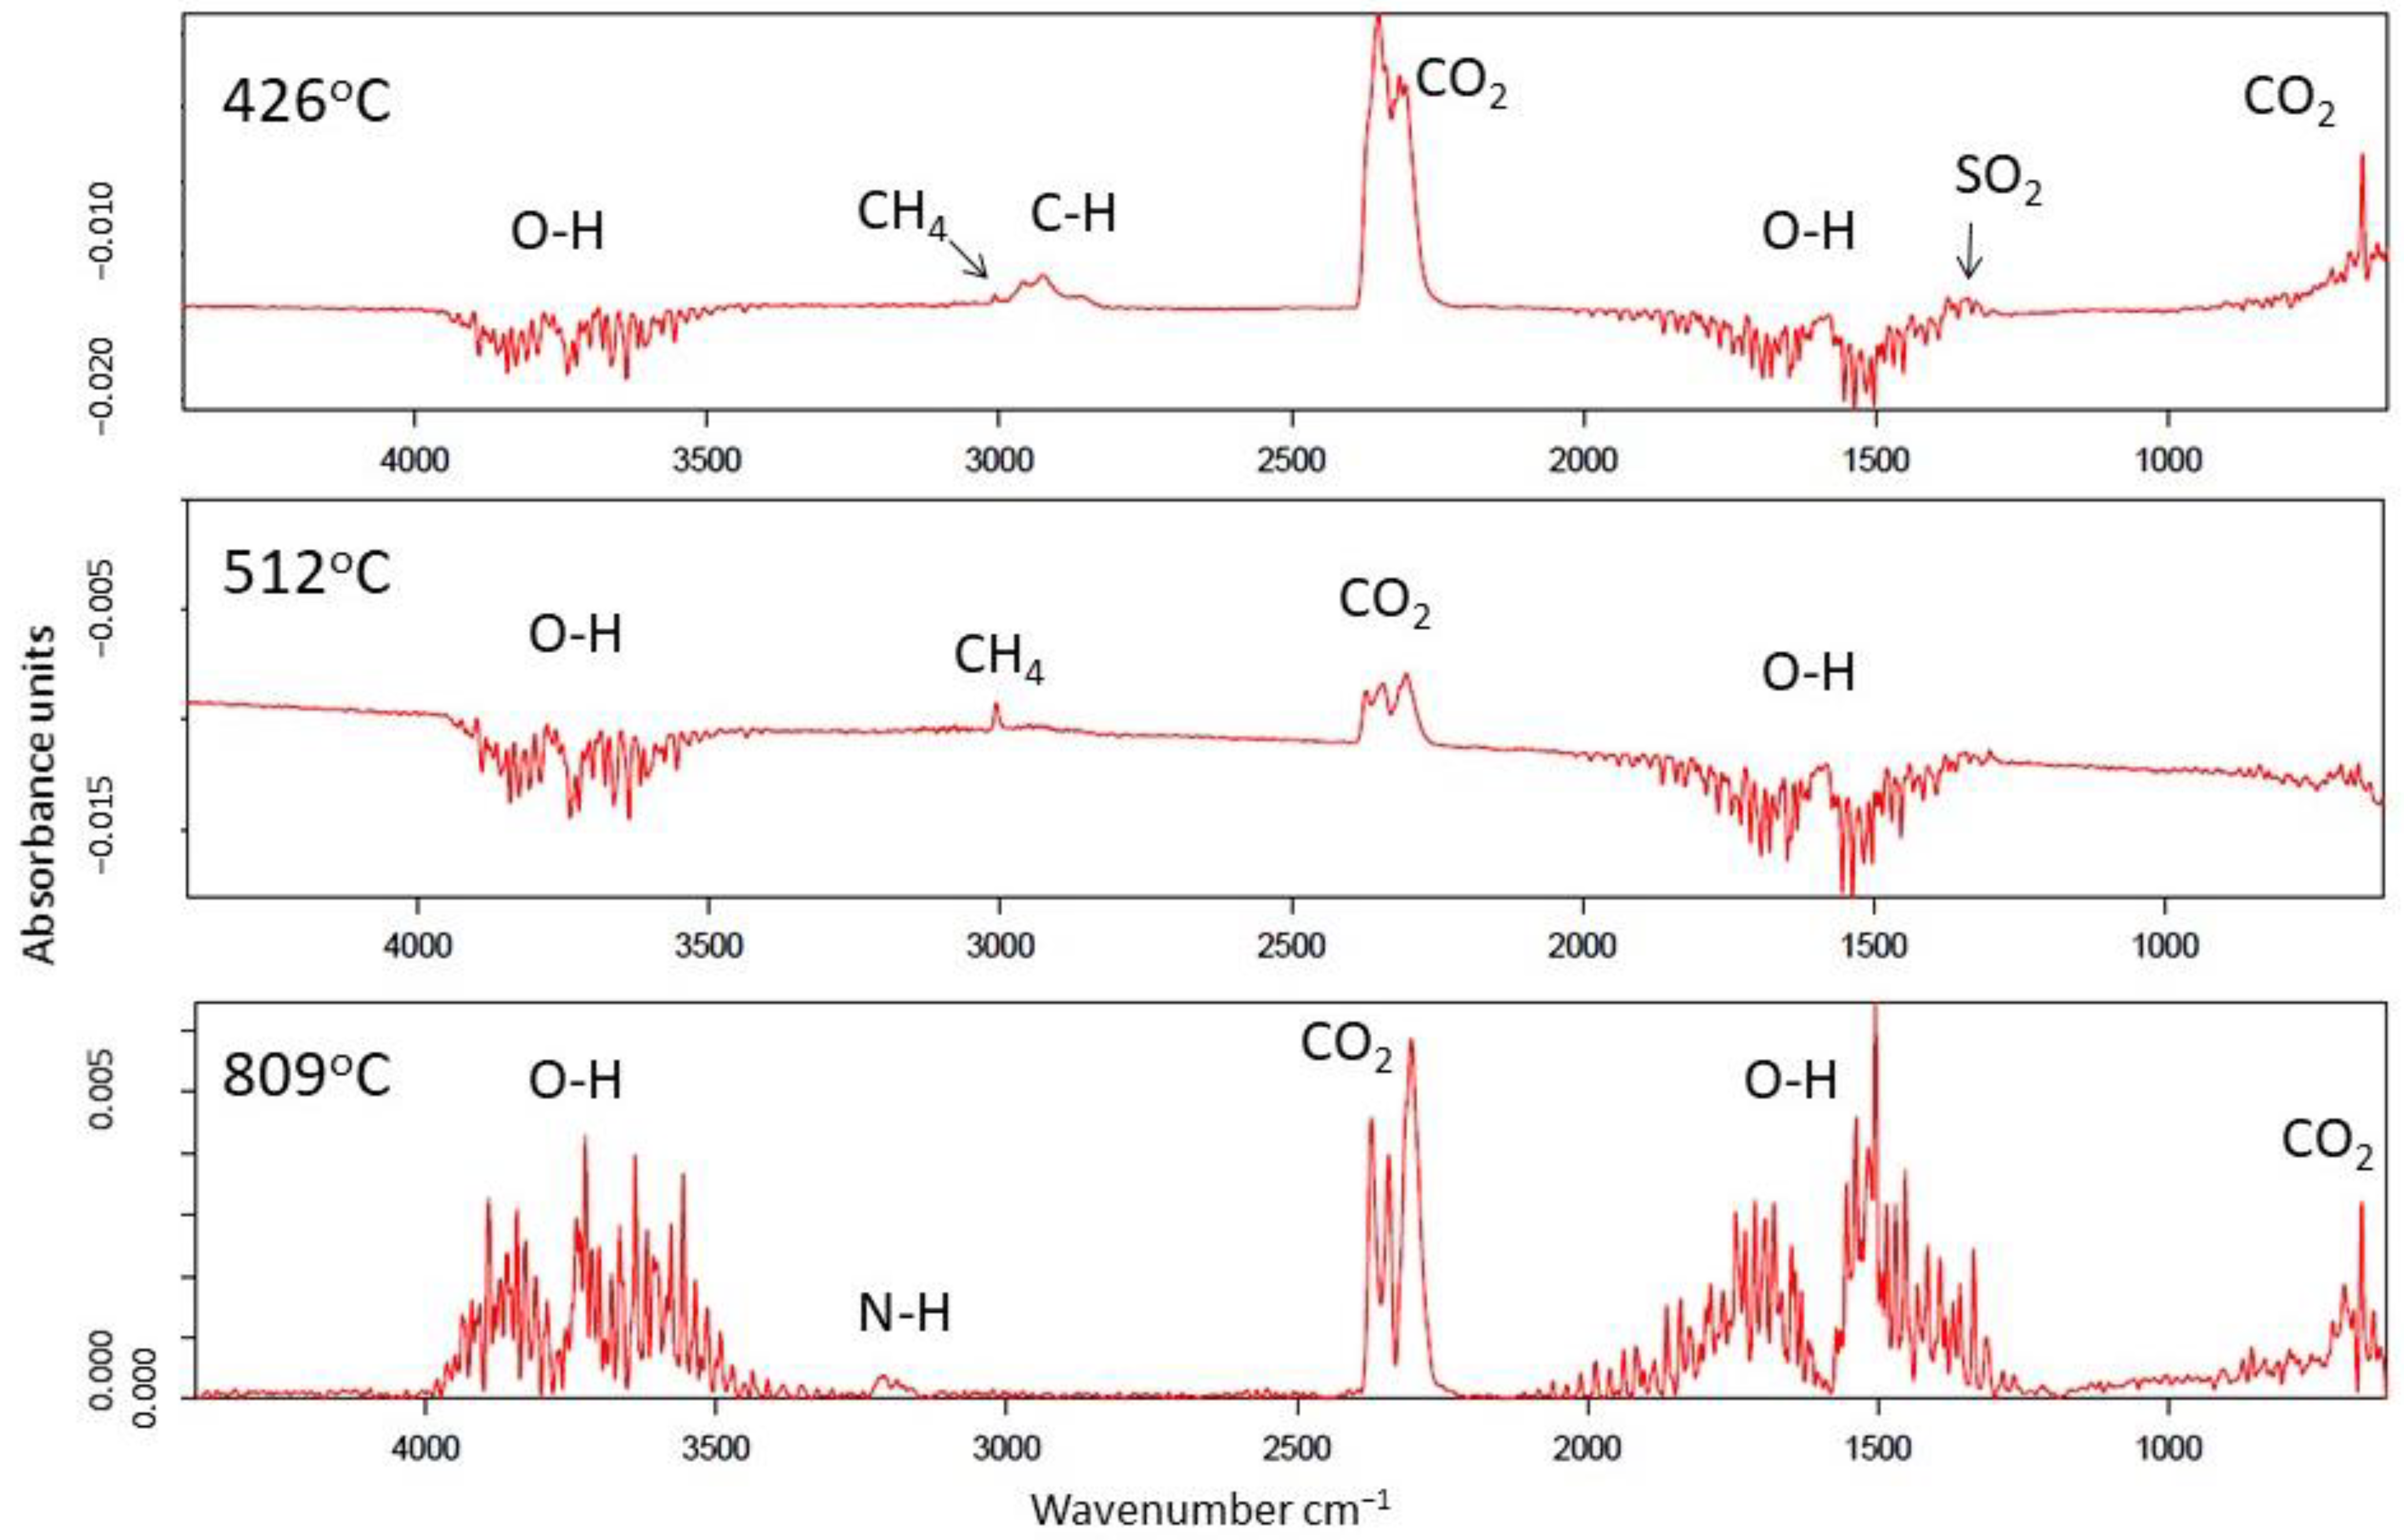
Figure 7 shows selected spectra at representative temperatures of released gas during TG–FTIR measurement (procedure (2)) of the sample from Bircza. The bands in the regions 4000–3500 cm−1, and 1900–1300 cm−1 are characteristic for O-H functional groups. In case of the spectra for 426 and 512 °C the absorption bands of H2O, which is present in the rock sample, are compensated for by a correction for moisture in the atmosphere, hence the downward-pointing peaks. At a temperature of 809 °C the release of water from dehydroxylation of clay minerals (montmorillonite) is very intense.
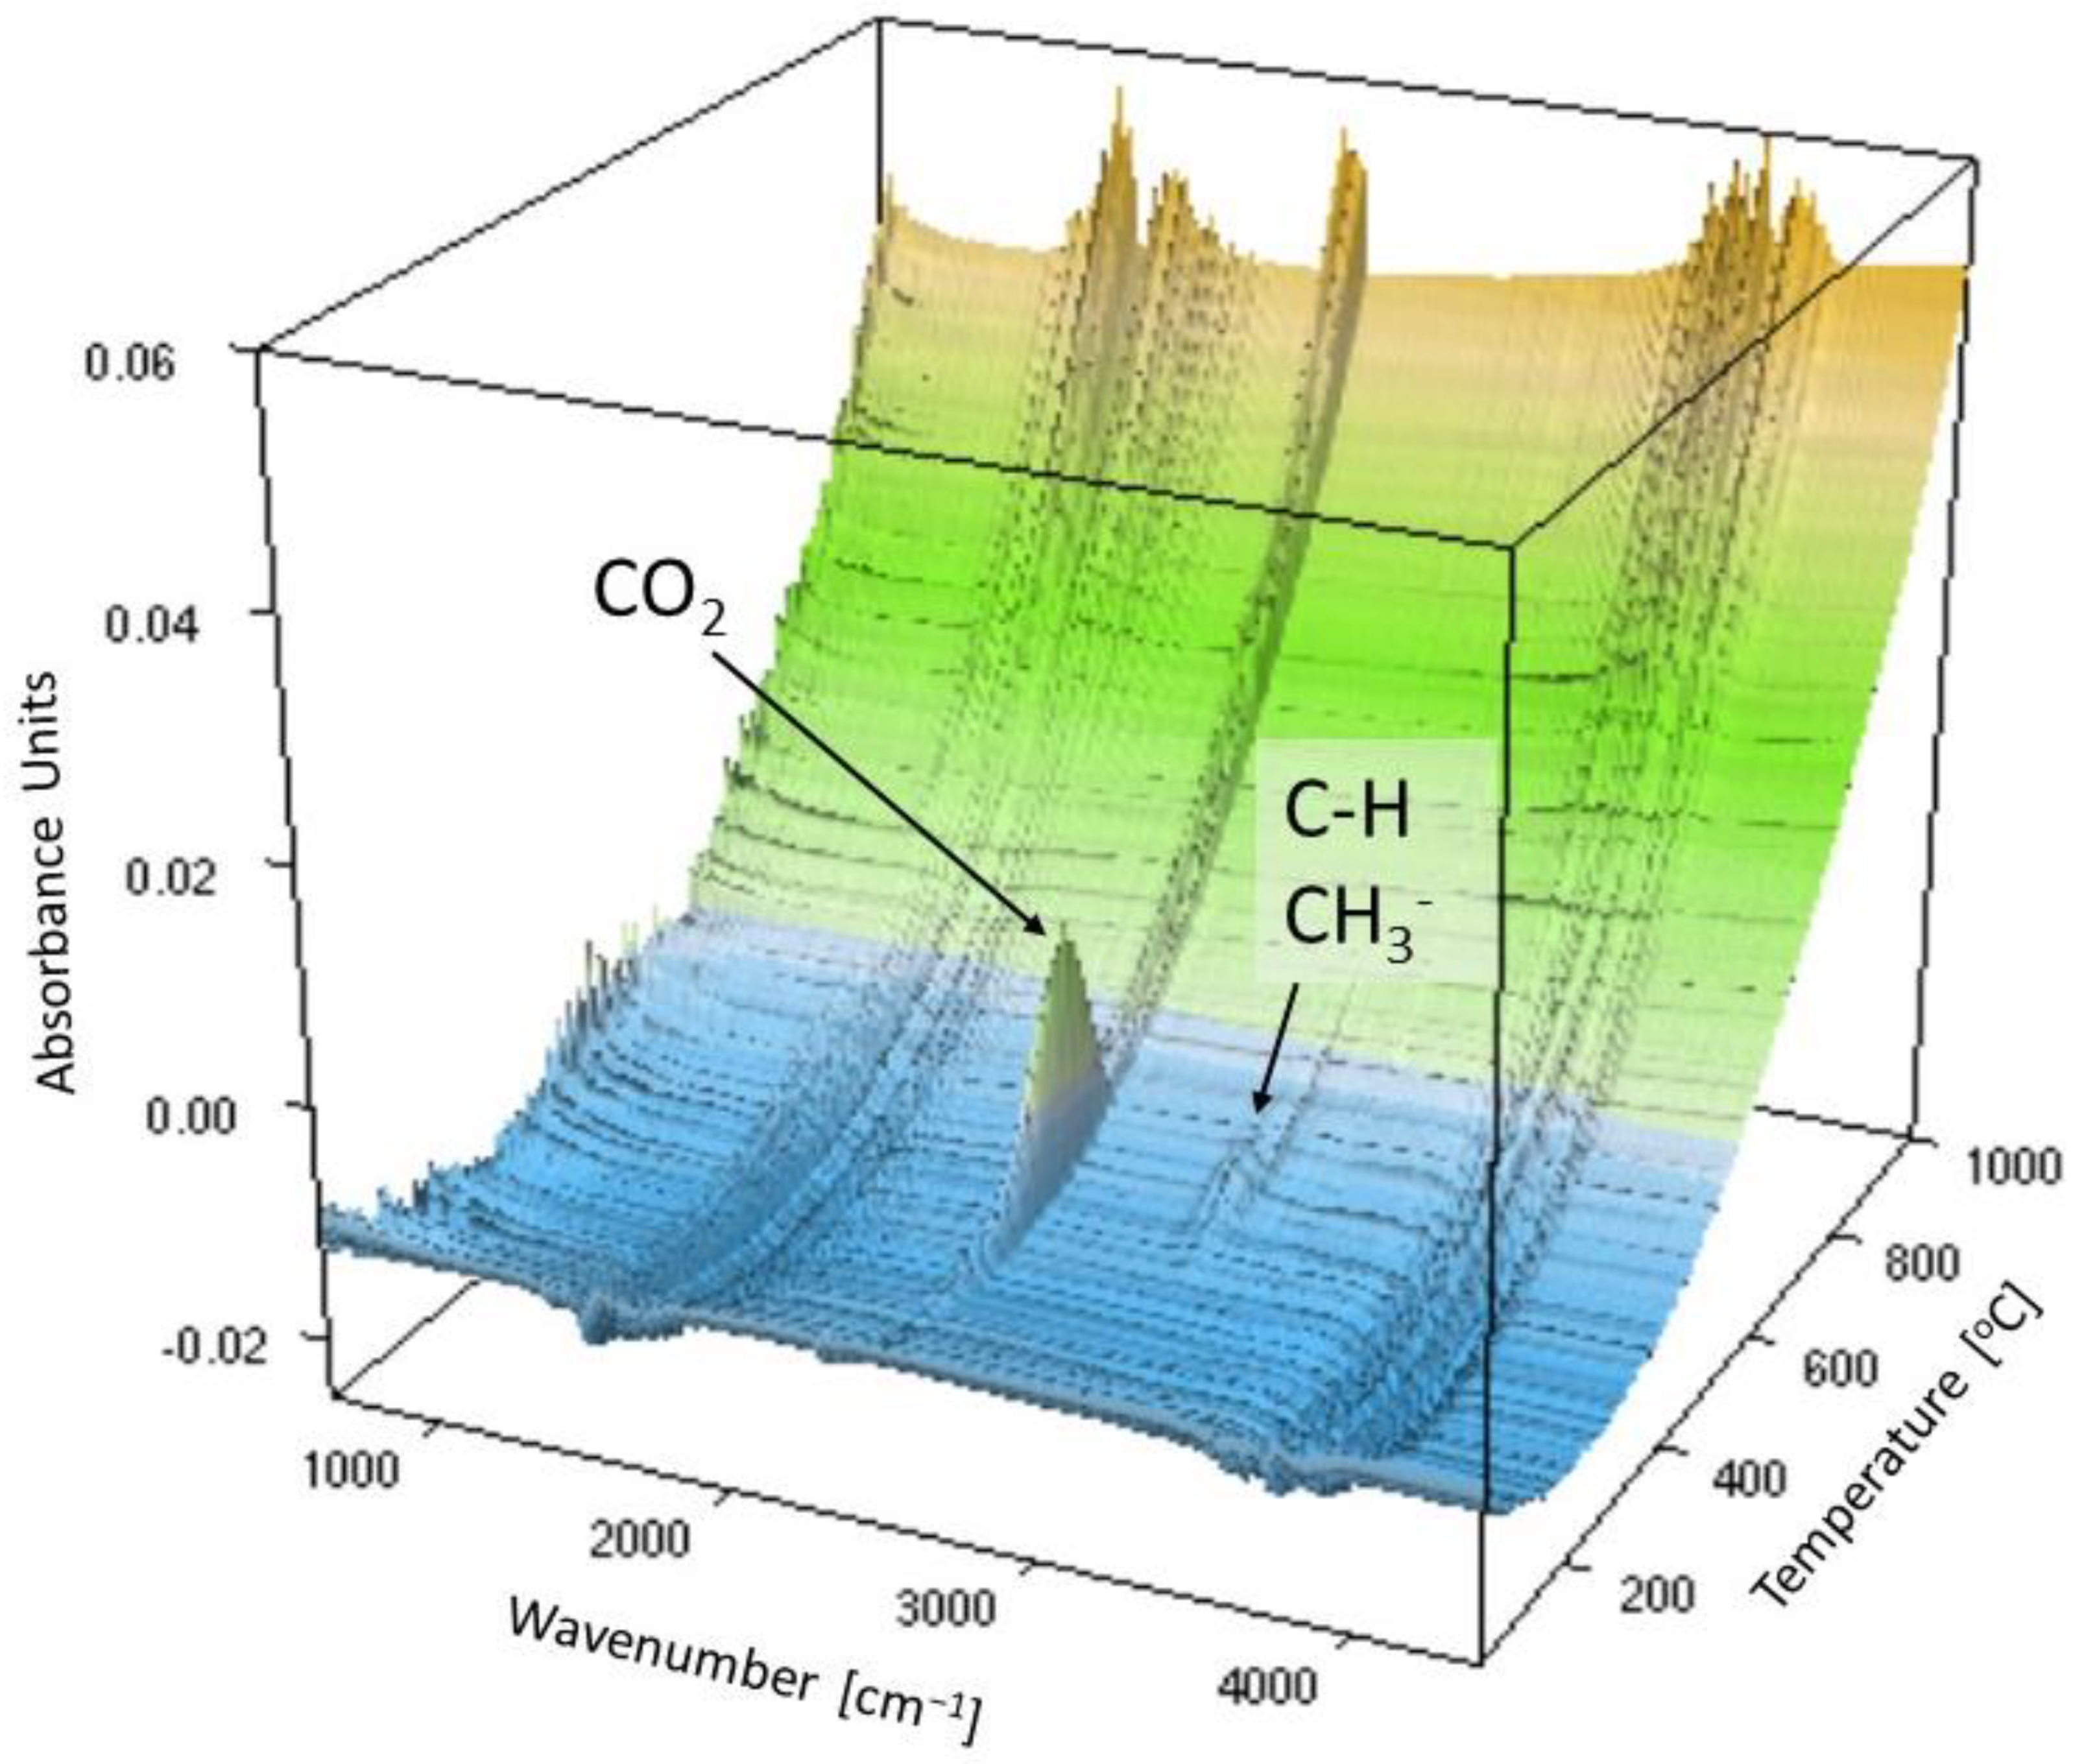
Analysing the spectra of gases released during the experiment, it can be seen that the most intense absorptions are between 2400 and 2240 and between 780 and 560 cm−1, and are characteristic of carbon dioxide. Carbon monoxide (CO) emissions are also noticeable, but the intensity is lower. These peaks range from 2240 to 2060 cm−1. As can be seen in the 3D FTIR diagram (Figure 7), the most intense CO2 release occurs at a temperature of 400 to 450 °C; however, this gas was released to varying degrees until the end of the experiment. The evolution of CO2 at about 400–450 °C is caused by the decomposition of oxygen-containing organic compounds, such as carboxylic acids, salts and ketones.
Apart from the CO2-emission intensity, the main indicators of organic matter decomposition are vibrations in the range of 3000–2850 cm−1, characteristic for C-H vibrations of aliphatic hydrocarbons. They are often accompanied by a peak characteristic for CH4 at a wavenumber of 3014 cm−1.
The bands between 2500 and 2480 and between 1160 and 1130 cm−1 indicate the release of SO2, while the bands between 1420 and 1300 cm−1 come from S=O stretching vibrations, which may also be associated with some organic sulphur–oxygen compounds, such as sulphones, sulphoxides, etc. [17]. In the spectrum obtained at a temperature of 426 °C, it is visible that the absorption level of the peaks in the range 1380 and 1340 cm−1 is higher, which indicates the pyrite oxidation reaction [29]. Noteworthy are vibrations derived from N-H groups. They provide information on the presence of nitrogen in the organic matter sample, which indicates its low maturity [32]. With a change in thermal maturity, the composition of organic matter changes. Immature organic matter is characterized by the predominance of polar compounds (containing heteroatoms such as O, N, S). As the thermal maturity increases, the proportion of “pure” hydrocarbons, both aliphatic and aromatic, increases.
From the point of view of organic matter decomposition, the most interesting temperature range is 300–650 °C. Hence, the table below (Table 5) summarizes the temperatures of the episodes of the most intense gas evolution from the samples during the experiments. In some samples, pyrolysis took place in one stage, while in others, two stages of decomposition of organic matter can be clearly distinguished. The main stage of pyrolysis takes place in the temperature range from 300 to 500 °C, and the second stage in the temperature range from 500 to 650 °C. In all cases, the gases released during the both episodes, listed in Table 5, included CO2; therefore, for the sake of simplicity, this component is not included in the table. The same applies to the O-H groups.
As can be noticed from the data in Table 5, during the thermal decomposition of Menilite rock samples, one or more episodes of violent gas evolution from the samples take place. The temperatures at the maximum intensity of gas evolution do not always coincide with the TTG determined on the basis of the DTG curves from the thermal analysis. An example of such displacements of the effects on the DTG, DSC and GS curves can be seen in Figure 5. It can be observed here on the GS curve that the maximum gas release from the sample occurred at a temperature slightly lower than the inflection of the DTG curve. The endothermal maximum in the DSC curve appears at an even higher temperature. A similar dependence can be observed in the case of most other experiments, i.e., usually the greatest intensity of gas release from the sample occurs at temperatures slightly lower than the TTG value.
In each sample the thermal decomposition of kerogen is manifested by the release of C-H and CH4 groups, which testify to the decomposition of both aliphatic and aromatic hydrocarbons. In some cases, the evolution of SO2 is indicative of the presence of organic sulphur in the kerogen. It is worth paying attention to the occurrence of C=C stretching vibrations in the case of the Łubne sample. These vibrations indicate the presence of aromatic hydrocarbons, which in turn indicates a higher maturity of organic matter. This observation is consistent with the results obtained from the Rock-Eval analysis (Table 3). As it can be seen, the Tmax of this sample has the highest value (459 °C), which proves its high thermal maturity. The temperature of the most intense gas evolution in the sample from Łubne is also the highest in the main stage of pyrolysis, in the temperature range of 300–500 °C, reaching 465 °C.
The second episode of gas release in some of the samples occurs in the temperature range of 500–650 °C. The evolution of CH4, C-H and C=C groups is the evidence of secondary cracking of hydrocarbons [33]. The release of SO2 results from the decomposition of organic sulphur compounds or inorganic matter (mainly pyrite).
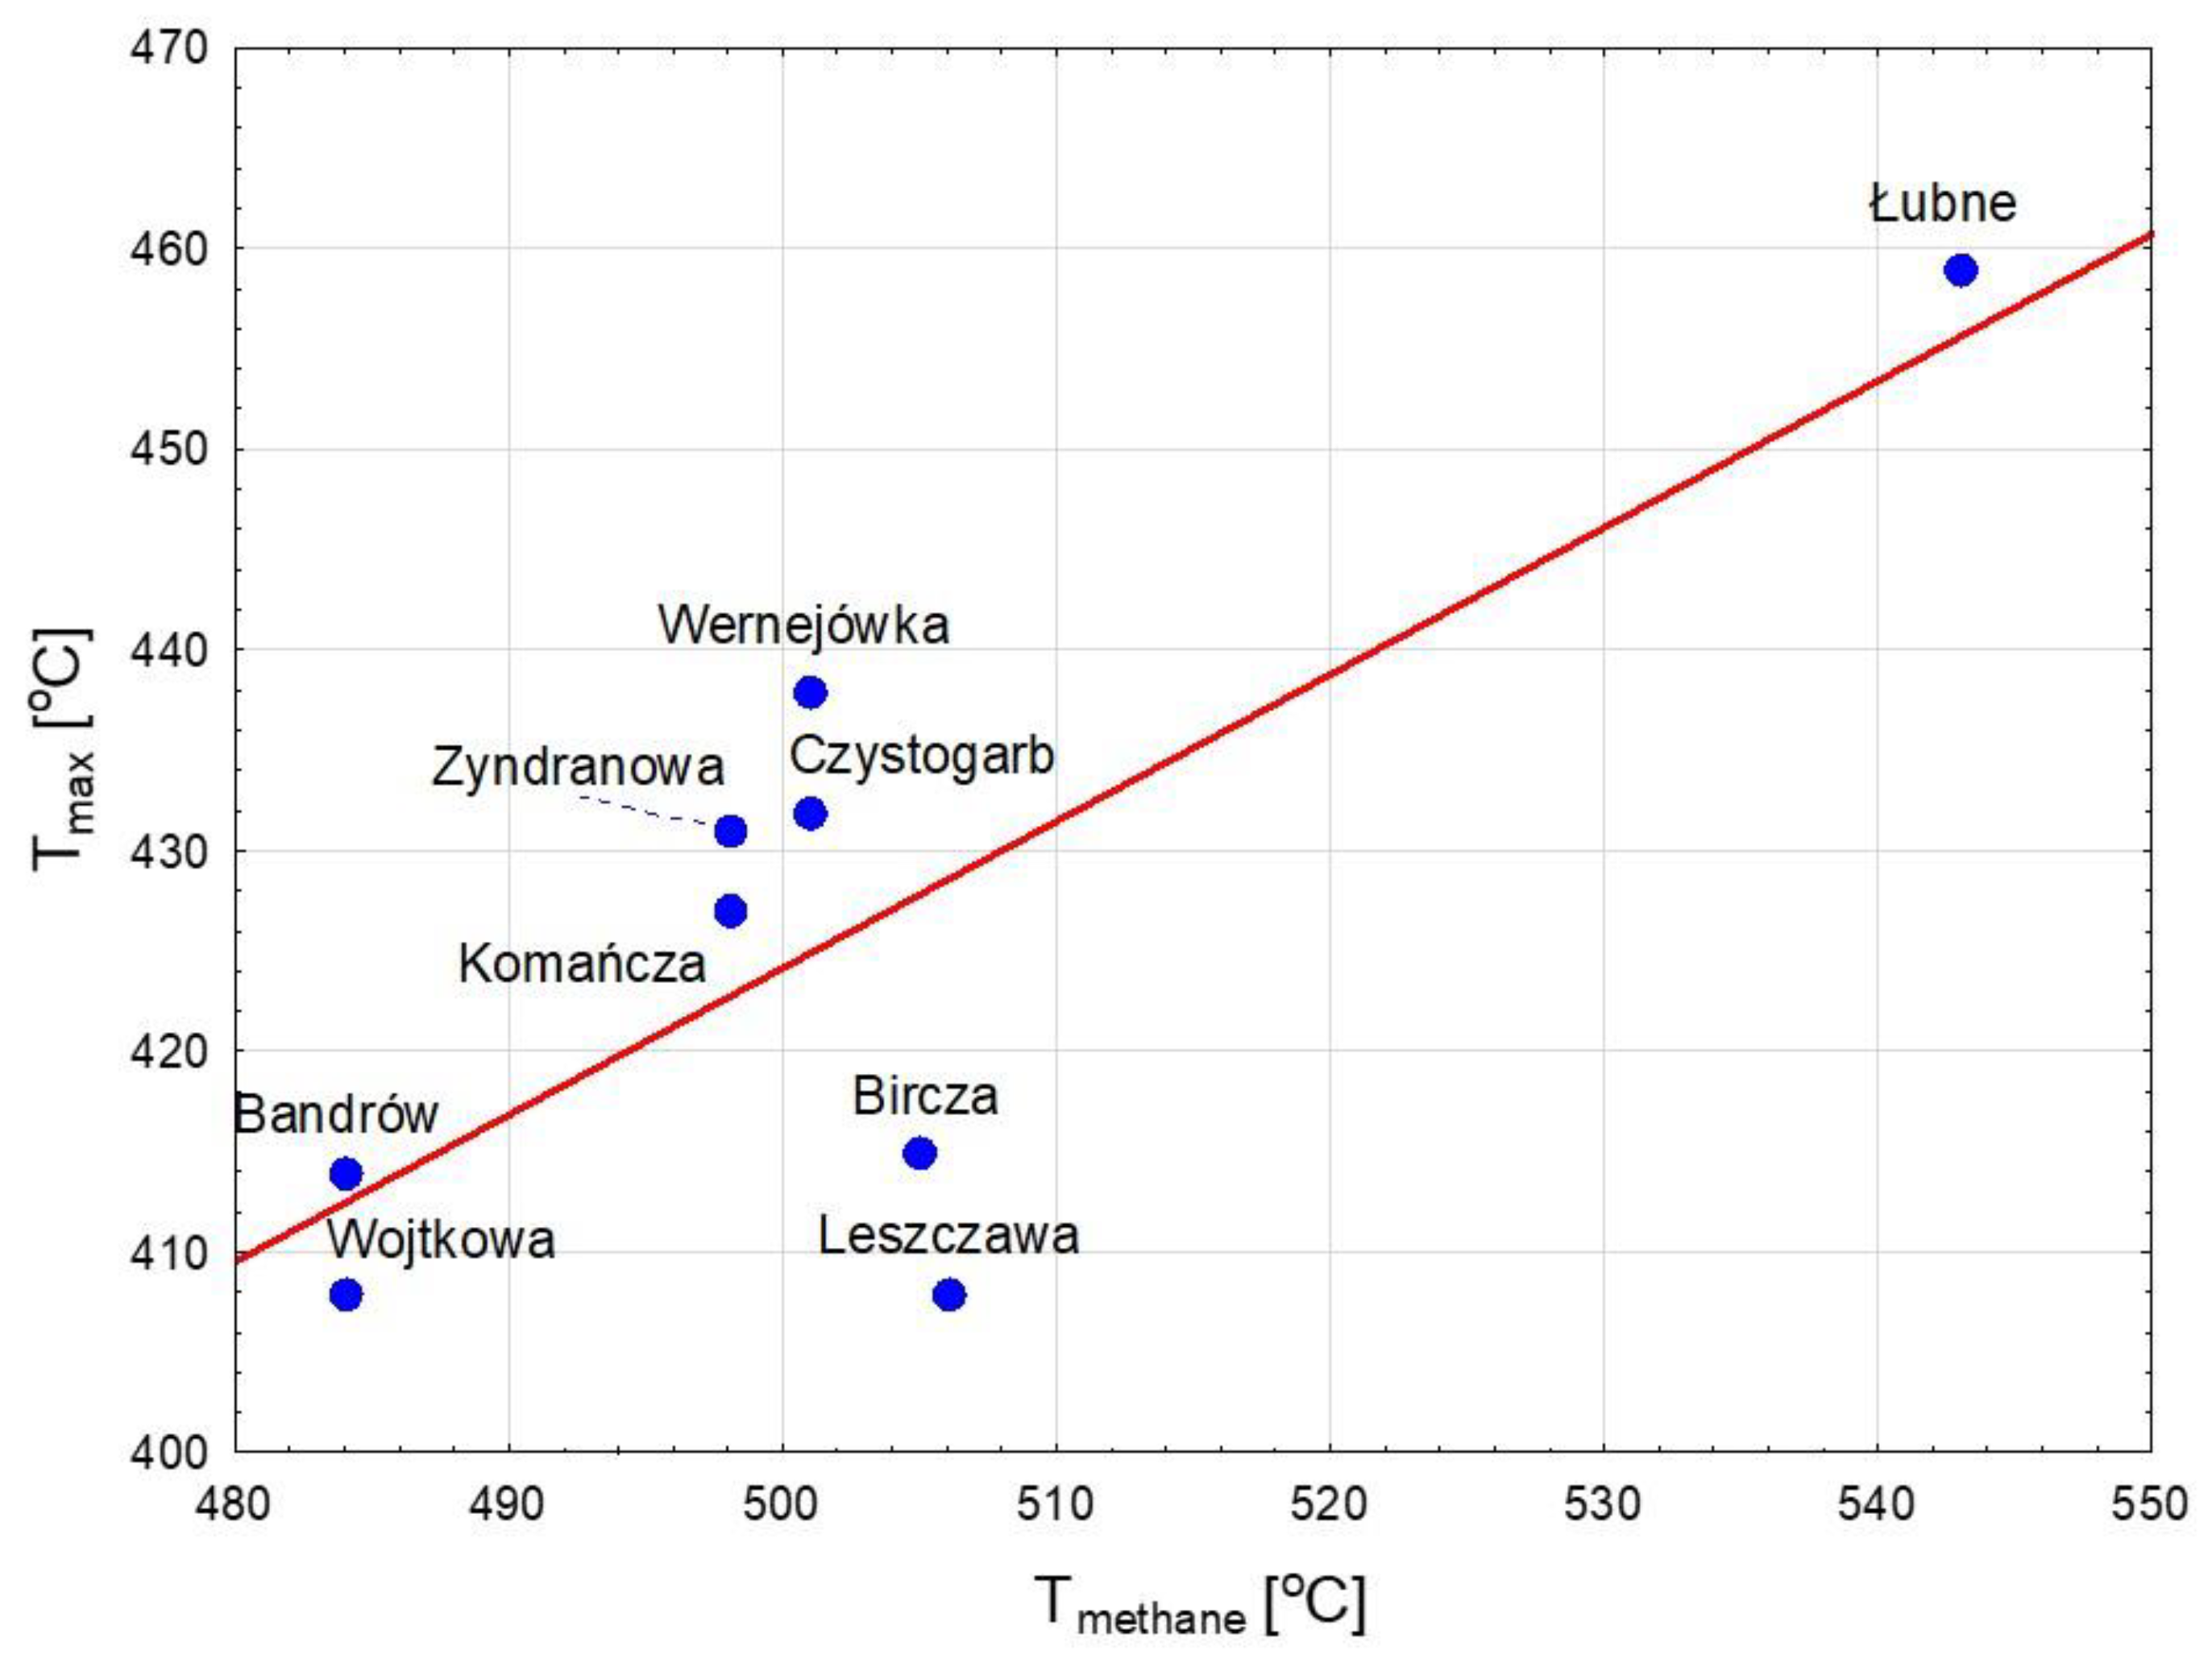
Comparing the intensity of the methane (CH4) emission peak during the first and second stage of pyrolysis, it can be observed that the intensity is higher in the second stage (compare the spectra of the sample from Bircza at 426 and 512 °C—Figure 6). The temperature at which the methane peak is the highest is called Tmethane in the literature and is considered an indicator of the maturity of organic matter [34]. In the case of the sample from Dynów no methane peak was observed. In other cases, Tmethane is in the range from 484 to 543 °C (Figure 8) and correlates with Tmax from Rock-Eval analysis.

3.5. Kinetic Parameters

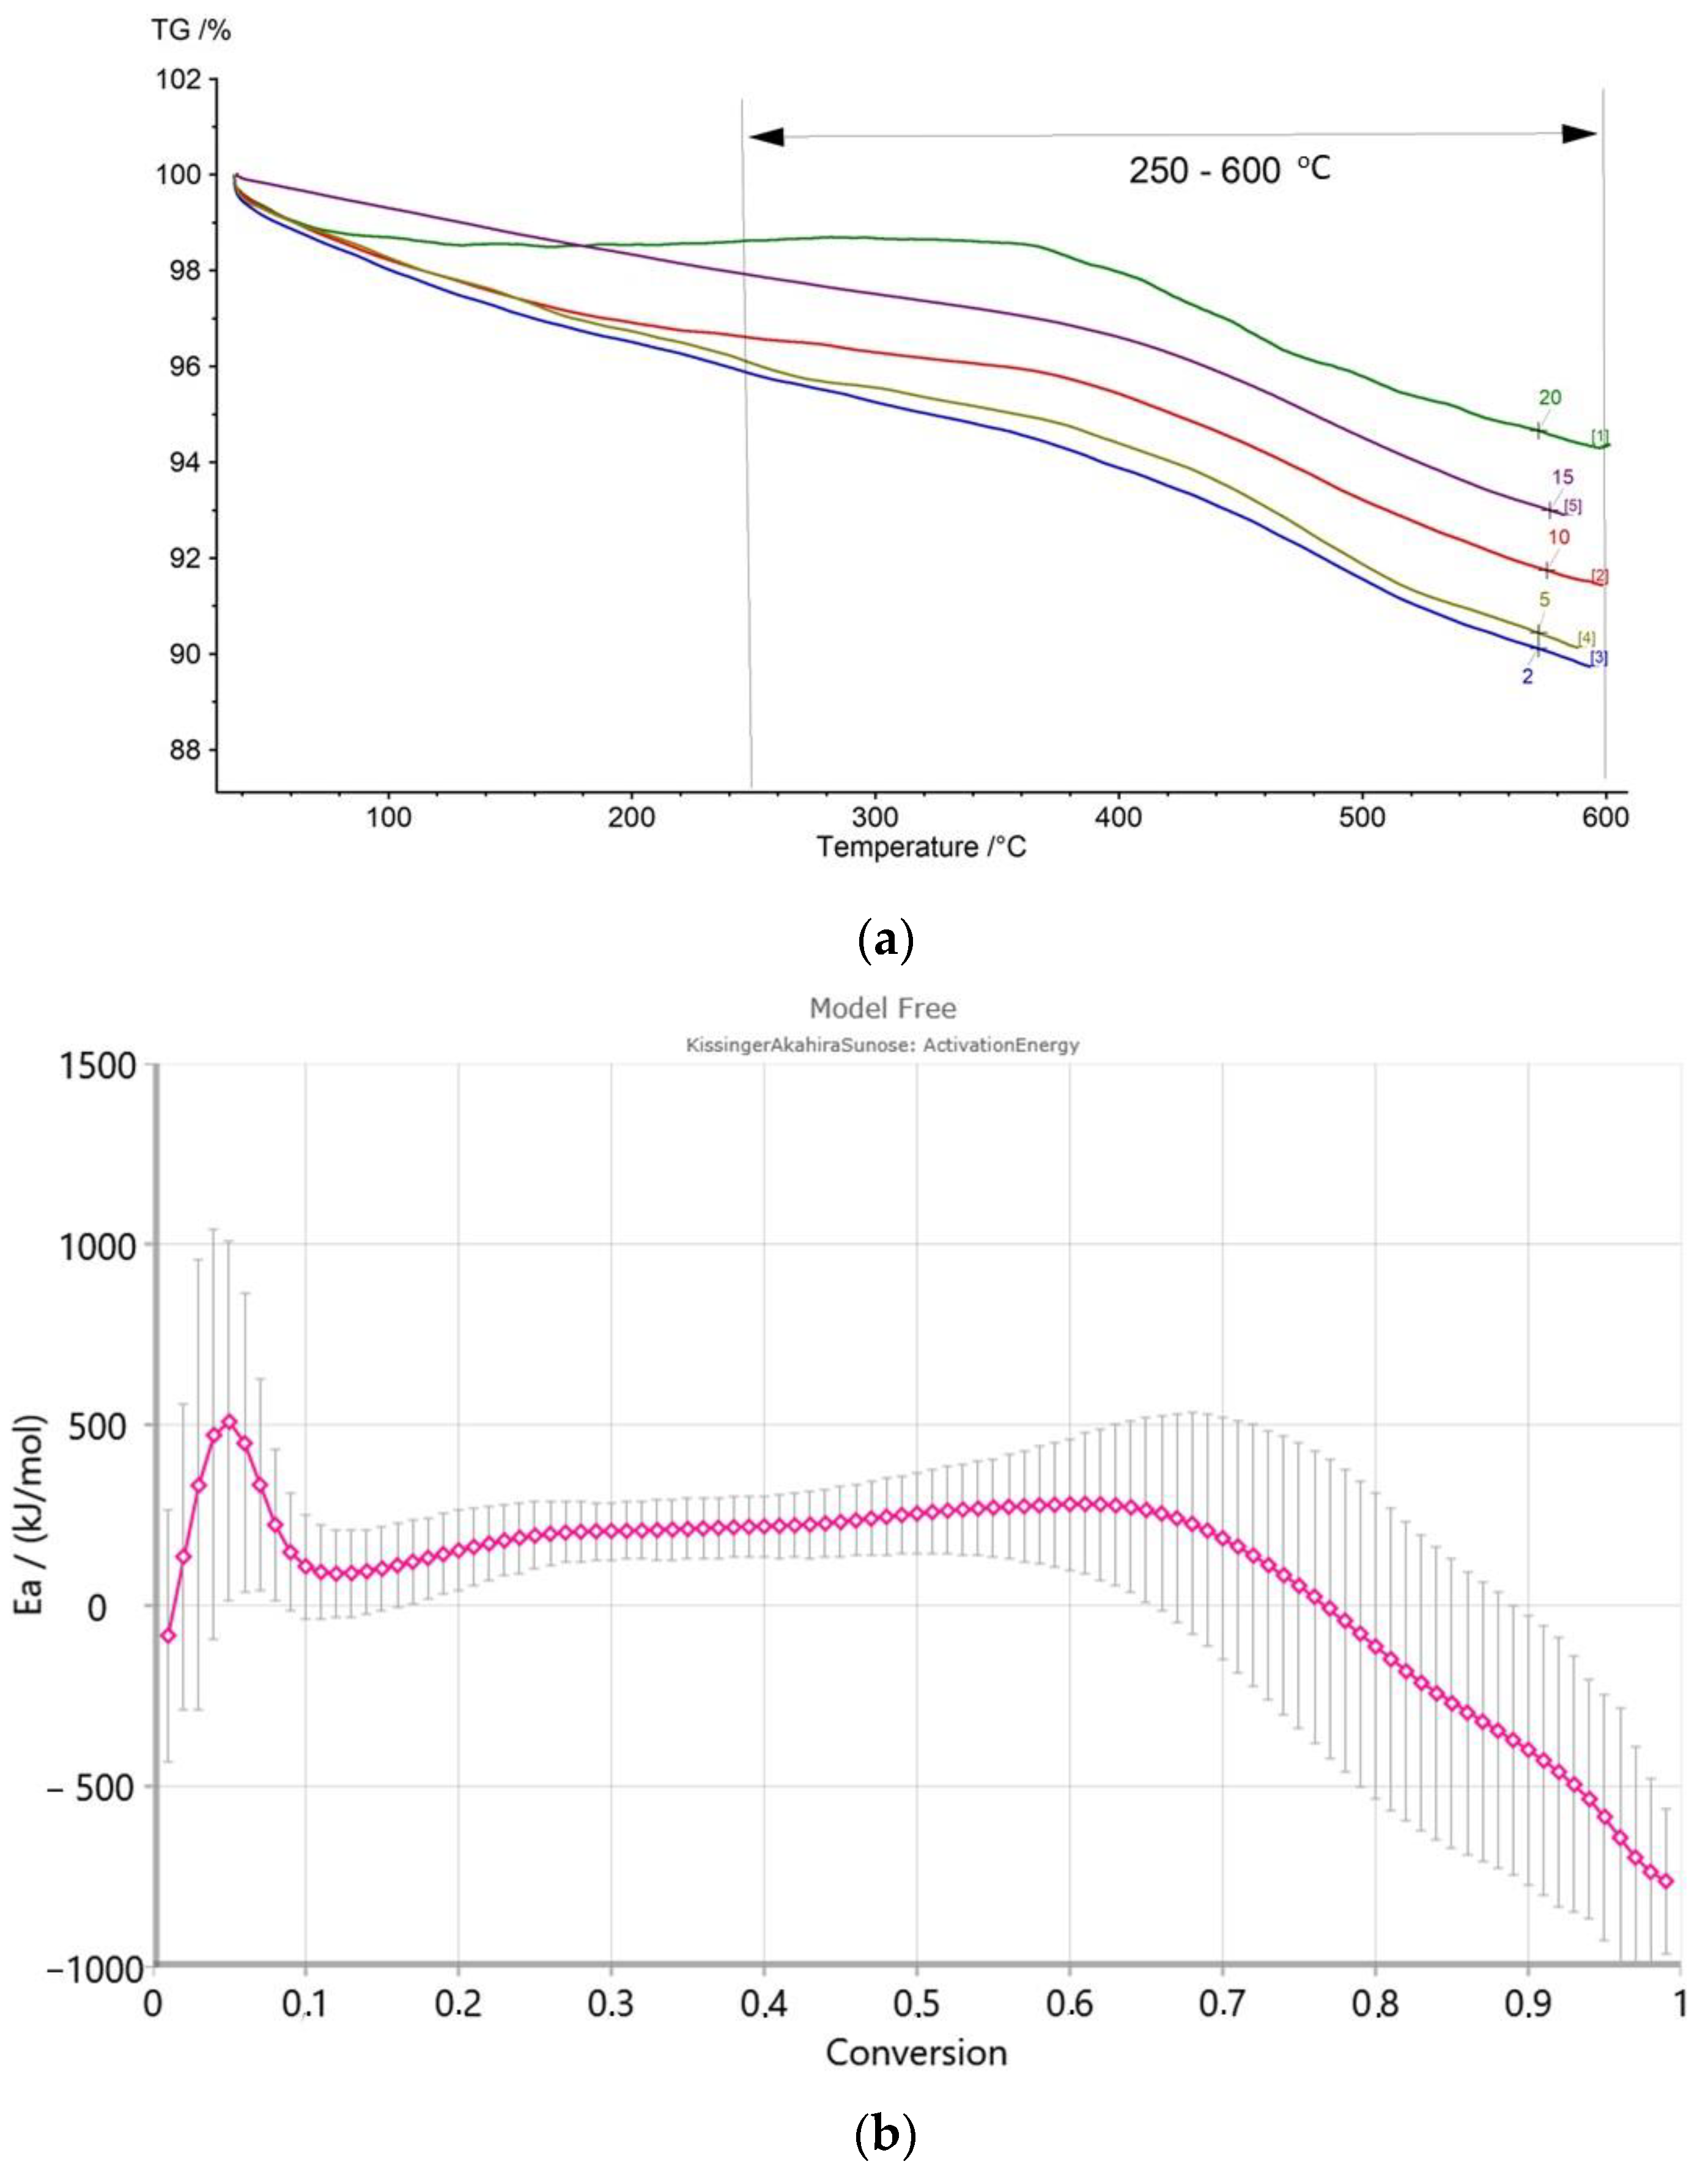
The kinetic parameters were determined based on TG curves obtained for different heating rates in the experiments performed using procedure (3). The temperature range taken into account was from 250 to 600 °C.
Figure 9a shows the plots of TG original data for the rock sample from Dynów. It can be seen here that the lower the temperature increase rate, the more complete the sample decomposition process. In the considered range, from 250 to 600 °C, it was not possible to achieve the same mass loss for all runs of the experiment. The reason for this state is the differentiated mineral composition of the samples, and the subsequent course of the decomposition process, e.g., carbonates contained in the rock.
Due to the fact that the decomposition of source rocks is a complex process, it is not uniform over the entire temperature range. As can be seen from the example shown in Figure 9b, after reaching a conversion of 0.75, the activation energy becomes negative, which cannot be taken into account in further considerations. This fact indicates a change in reaction rate, and, consequently, the kinetic parameters, during the pyrolysis process.
The obtained average values of activation energy differ, ranging from 108.52 (Leszczawa sample) to 325.33 kJ/mol (Table 6). The Ea for the Bandrów sample (325 kJ/mol) seems to be rather high. Wood [35] observed that the activation energies of most type I, type II and type III kerogens tend to lie across the range E = 175 kJ/mol to E = 265 kJ/mol. In the next article Wood [36] shows a wider range of activation energies: from E = 100 kJ/mol to 300 kJ/mol, corresponding to a wider range of hydrocarbon reactions. Some researchers, however, note even higher values of Ea, for example Han et al. [37] for Mongolian oil shale (Ea = 379 kJ/mol, Log A = 89.80 Log(1/s)), or Chi et al. [38] for Huadian oil shale (average Ea = 330.61 kJ/mol) and for Maoming oil shale (average Ea = 363.61 kJ/mol).

4. Discussion

4.1. Organic Matter Decomposition

Comparing the results obtained with the use of the TG/DSC and RE thermal methods, it should be stated that the quantitative determination of the organic matter content in the samples, which is expressed by the TOC and S2 values from the Rock-Eval analysis, is generally consistent with the weight loss in the range of 300–650 °C, obtained from the TG analysis. The pyrolysis process in some cases overlaps the effects derived from the decomposition of mineral rock components, such as sulphides or sulphates.
The coupling of thermogravimetric analysis with Fourier-transform infrared spectroscopy offers the advantages of real-time gas analysis and high sensitivity, which enables determining the course of the process and complementing the TG/DSC measurement.
The observed gas evolution from the source rock indicates two stages of organic matter decomposition for some samples. The main stage of pyrolysis takes place in the temperature range from 300 to 500 °C; the second stage of decomposition in the temperature range from 500 to 650 °C.

4.2. Thermal Maturity of the Samples

The samples were selected so that their thermal maturity, expressed by Tmax from the RE analysis, is similar. Most of the samples contain thermally immature kerogen. Only in case of the samples from Łubne and Wernejówka the values of Tmax exceed 435 °C, which is characteristic for Menilite facies from the Silesian Unit [7,11]. The interpretation of the results of FTIR analyses indicates the differentiation of organic matter decomposition processes in the samples. The main products from Menilite source-rock pyrolysis are aliphatic hydrocarbons. The other volatile compounds are CO, CO2, CH4 and SO2. Vibrations derived from N-H groups provide information on the presence of nitrogen in the organic matter, what indicates its low maturity level. C=C stretching vibrations, indicating the presence of aromatic hydrocarbons, prove higher maturity of organic matter (as in the case of the Łubne sample), which was confirmed by the results obtained using other analytical methods. We also implemented another indicator of the maturity of organic matter (Tmethane) which confirms the high maturity of the mentioned sample (Figure 8). It turns out, however, that the maturity of organic matter does not have a decisive influence on the kinetic parameters obtained from the TG measurements.

4.3. Kinetic Parameters

It is usually assumed that differences in the kinetics of hydrocarbon generation in rocks result from different types of organic matter. According to Quingi et al. [12], type I kerogen is characterized by the highest hydrocarbon generation rate. The most complex (having stronger chemical bonds) is type III kerogen, and therefore it shows the slowest rate of hydrocarbon generation. The kinetic characteristics of type II kerogen fall between types I and III. The structural differences between kerogens are reflected in the average activation-energy values, and are as follows: EaI < EaII < EaIII [12]. Our tests on samples representing mostly type II kerogen, show that despite the uniform kerogen type, these samples have different kinetic parameters. This observation agrees with the results of Peters et al. [13], who point to the differences resulting from the mineral composition of source rock.

4.4. Mineral and Maceral Composition

As it is known, the higher activation energy (Ea) indicates a more difficult transformation. This may be due to the presence of mineral matter, as these components form a barrier that hinders the diffusion of heat and the release of gaseous products of the pyrolysis process. The whole degradation process of bulk rock includes not only the fracture and cracking of kerogen, but also the decomposition of inorganic minerals; hence, various complicated reactions occur in parallel and in series [37,39]. The Menilite source rock samples have different activation energies, which are related to different compositions (organic and mineral) (Figure 10). Hence, the kinetic parameters obtained from bulk rock decomposition, based on TG data, concern the overall reaction rather than individual reactions, and the activation energy should be regarded as apparent activation energy [40].
One of the components shown in Figure 10 is bituminite, which is a maceral originating from alteration or degradation of algae, resulting from burial of sediment. The relatively high share of this maceral occurs in samples from the Skole unit, which indicates more advanced processes of organic matter decomposition in this unit, which, in turn, reduces the value of the activation energy (Ea).
As can be seen from Figure 10, it is quite difficult to notice direct relationships between the kinetic parameters and the content of mineral matter in the samples. Usually, it is believed that the mineral matter (mainly carbonates) has a catalytic effect on the decomposition of organic matter in the samples (e.g., [17,19]). In the case of the samples examined here, the presence of carbonates seems to rather increase the activation energy, while the effect of silicate and iron-bearing minerals (pyrite, jarosite) is ambiguous.

5. Conclusions

We analysed source rocks, representing Menilite shales, from the Skole, Silesian and Dukla units from the Flysch Carpathians. The examined rocks from the Skole and Dukla Units are thermally immature (Tmax < 435 °C), while Menilite shales from the Silesian Unit are of higher maturity. Most of the samples contain oil-prone type II kerogen, and generally represent organic-rich source rocks.
The maceral composition of the organic matter, with dominant alginite, indicates kerogen of type II, of marine–terrestrial character. Only in one sample (Leszczawa from the Silesian unit) the high vitrinite content indicates a higher share of terrestrial material.
A good indicator for the maturity of organic matter is the temperature at which the methane peak (Tmethane) is the highest over the course of evolved gas analysis.
The maturity of organic matter does not have a decisive influence on the kinetic parameters.
The greatest impact on the decomposition of organic material of Menilite shales, i.e., also on kinetic parameters, has the maceral and mineral composition as well as the structure of the source matter (type of functional groups). A high share of carbonates in the rock increases the value of the apparent activation energy.
A high share of bituminite within maceral components reduces the value of the activation energy.
Interpretation of all results for the purpose of determining the kinetics of hydrocarbon generation processes gives detailed information about the temperature and time of generation, which seems to be the most favourable for the Menilite beds from the Skole unit.
The obtained kinetic parameters, using the KAS method, illustrate the variability of source rocks in terms of the kinetics of generation processes well. Kinetic parameters of the decomposition of organic matter, which are used in oil systems modelling, should be measured independently for a given set of samples, due to the multitude of parameters they depend on.

Author Contributions

Conceptualisation, I.M.; Investigation, I.M., M.L. and K.Z.; Methodology, I.M., M.L. and K.Z.; Supervision, I.M.; Visualisation, K.Z.; Writing—original draft, M.L. All authors have read and agreed to the published version of the manuscript.

Funding

This paper is based on the results from statutory work realized at the Oil and Gas Institute, National Research Institute, Poland, in 2018–2020. This study was partly supported by the National Centre for Research and Development (NCBiR) in frames of INGA Project No.POIR.04.01.01-00-0006/18-00.

Data Availability Statement

Data available on request from the authors.

Conflicts of Interest

The authors declare no conflict of interest.

References

  1. Ziemianin, K. Petrographic-geochemical characterization of the dispersed organic matter in Menilite shales from the Silesian Unit in the Carpathian Mountains of SE Poland. Naft. Gaz 2017, 11, 835–842. [Google Scholar] [CrossRef]
  2. Ziemianin, K. Characteristics of dispersed organic matter in the Menilite Beds from the Skole Unit. Naft. Gaz 2018, 9, 636–646. [Google Scholar] [CrossRef]
  3. Ziemianin, K. Characteristics of dispersed organic matter in the Menilite Beds from the Dukla Unit based on microscopic analysis and Rock-Eval pyrolysis. Naft. Gaz 2019, 6, 303–313. [Google Scholar] [CrossRef]
  4. Ziemianin, K.; Spunda, K. Maceral composition and maturity of dispersed organic matter in selected lithostratigraphic beds within Dukla Unit. Naft. Gaz 2022, 2, 83–96. [Google Scholar] [CrossRef]
  5. Koltun, Y.V. Organic matter in oligocene Menilite formation rocks of the Ukrainian Carpathians: Palaeoenvironment and geochemical evolution. Org. Geochem. 1992, 18, 423–430. [Google Scholar] [CrossRef]
  6. Kruge, M.A.; Mastalerz, M.; Solecki, A.; Stankiewicz, B.A. Organic geochemistry and petrology of oil source rocks, Carpathian Overthrust region, southeastern Poland—Implications for petroleum generation. Org. Geochem. 1996, 24, 897–912. [Google Scholar] [CrossRef]
  7. Kotarba, M.J.; Więcław, D.; Koltun, Y.V.; Marynowski, L.; Kuśmierek, J.; Dudok, I.V. Organic geochemical study and genetic correlation of natural gas, oil and Menilite source rocks in the area between San and Stryi rivers (Polish and Ukrainian Carpathians). Org. Geochem. 2007, 38, 163–180. [Google Scholar] [CrossRef]
  8. Kotarba, M.J.; Więcław, D.; Dziadzio, P.; Kowalski, A.; Bilkiewicz, E.; Kosakowski, P. Organic geochemical study of source rocks and natural gas and their genetic correlation in the central part of the Polish Outer Carpathians. Mar. Pet. Geol. 2013, 45, 106–120. [Google Scholar] [CrossRef]
  9. Kosakowski, P.; Koltun, Y.; Machowski, G.; Papiernik, B. The geochemical characteristics of the Oligocene-lower Miocene menilite formation in the Polish and Ukrainian Outer Carpathians: A review. J. Pet. Geol. 2018, 41, 319–335. [Google Scholar] [CrossRef]
  10. Kosakowski, P.; Więcław, D.; Kotarba, M.J. Charakterystyka macierzystości wybranych utworów fliszowych w przygranicznej strefie polskich Karpat Zewnętrznych. Geologia 2009, 35, 155–190, (In Polish, with English Abstract). [Google Scholar]
  11. Wendorff, M.; Rospondek, M.J.; Kluska, B.; Marynowski, L. Organic matter maturity and hydrocarbon potential of the Lower Oligocenen Menilite facies in the Eastern Flysh Carpathians (Tarcău and Vrancea Nappes), Romania. Appl. Geochem. 2017, 78, 295–310. [Google Scholar] [CrossRef]
  12. Jiang, Q.; Wang, Y.; Qin, J.; Wang, Q.; Zhang, C. Kinetics of the hydrocarbon generation process of marine source rocks in South China. Pet. Explor. Dev. 2010, 37, 174–180. [Google Scholar]
  13. Peters, K.E.; Walters, C.C.; Mankiewicz, P.J. Evaluation of kinetic uncertainty in numerical models of petroleum generation. AAPG Bull. 2006, 90, 387–403. [Google Scholar] [CrossRef]
  14. Tissot, B.P.; Pelet, R.; Ungerer, P. Thermal history of sedimentary basins, maturation indices, and kinetics of oil and gas generation. AAPG Bull. 1987, 71, 1445–1466. [Google Scholar]
  15. Marshall, C.P.; Kannangara, G.S.K.; Wilson, M.A.; Guerbois, J.P.; Hartung-Kagi, B.; Hart, G. Potential of thermogravimetric analysis coupled with mass spectrometry for the evaluation of kerogen in source rocks. Chem. Geol. 2002, 184, 185–194. [Google Scholar] [CrossRef]
  16. Xinmin, W.; Qing, W.; Chunlei, W. Study of the effect of in situ minerals on the pyrolysis of oil shale in Fushun. China RSC Adv. 2022, 12, 20239–20250. [Google Scholar] [CrossRef]
  17. Yan, J.; Jiang, X.; Han, X.; Liu, J. A TG-FTIR investigation to the catalytic effect of mineral matrix in oil shale on the pyrolysis and combustion of kerogen. Fuel 2013, 104, 307–317. [Google Scholar] [CrossRef]
  18. Chang, Z.; Chu, M.; Zhang, C.; Bai, S.; Lin, H.; Ma, L. Influence of inherent mineral matrix on the product yield and characterization from Huadian oil shale pyrolysis. J. Anal. Appl. Pyrolysis 2018, 130, 269–276. [Google Scholar] [CrossRef]
  19. Ariskina, K.A.; Ding, Z.; Abaas, M.; Yuan, C.; Emelianov, D.A.; Chen, Q.; Varfolomeev, M.A. Influence of Carbonate Minerals on Heavy Oil Oxidation Behavior and Kinetics by TG-FTIR. Energies 2021, 14, 136. [Google Scholar] [CrossRef]
  20. Karabakan, A.; Yürüm, Y. Effect of the mineral matrix in the reactions of oil shales: 1. Pyrolysis reactions of Turkish Göynük and US Green River oil shales. Fuel 1998, 77, 1303–1309. [Google Scholar] [CrossRef]
  21. Peters, K.E.; Burnham, A.K.; Walters, C.C. Petroleum generation kinetics: Single versus multiple heating-ramp open-system pyrolysis. AAPG Bull. 2015, 99, 591–616. [Google Scholar] [CrossRef]
  22. Reynolds, J.G.; Burnham, A.K. Comparison of kinetic analysis of source rocks and kerogen concentrates. Org. Geochem. 1995, 23, 11–19. [Google Scholar] [CrossRef]
  23. Shindler, A.; Neumann, G.; Rager, A.; Fügline, E.; Blumm, J.; Denner, T. A novel direct coupling of simultaneous thermal analysis (STA) and Fourier transform-infrared (FT-IR) spectroscopy. J. Therm. Anal. Calorim. 2013, 113, 1091–1102. [Google Scholar] [CrossRef] [Green Version]
  24. Smith, A.L. Applied Infrared Spectroscopy: Fundamentals, Techniques and Analytical Problem-Solving, Series Chemical Analysis; John Wiley & Sons: New York, NY, USA, 1979. [Google Scholar]
  25. Stuart, B. Infrared Spectroscopy: Fundamentals and Applications; John Wiley & Sons: New York, NY, USA, 2004. [Google Scholar]
  26. Vyazovkin, S.; Burnham, A.K.; Criado, J.M.; Pérez-Maqueda, L.A.; Popescu, C.; Sbirrazzuoli, N. ICTAC Kinetics Commitee recommendations for performing kinetic computations on thermal analysis data. Thermochim. Acta 2011, 520, 1–19. [Google Scholar] [CrossRef]
  27. Jankowski, L. Kompleksy chaotyczne Karpat Polskich. In Proceedings of the Conference Materials, Kraków, Poland, 24–27 September 2008; pp. 26–88, (In Polish, with English Abstract). [Google Scholar]
  28. Jankowski, L.; Probulski, J. Rozwój tektoniczno-basenowy Karpat zewnętrznych na przykładzie budowy geologicznej złóż Grabownica, Strachocina i Łodyna oraz ich otoczenia. Geologia 2011, 37, 555–583, (In Polish, with English abstract). [Google Scholar]
  29. Labus, M. Pyrite thermal decomposition in source rocks. Fuel 2021, 287, 119529. [Google Scholar] [CrossRef]
  30. Li, S.; Zhu, R.K.; Cui, J.W.; Luo, Z.; Cui, J.G.; Liu, H.; Li, W.Q. The petrological characteristics and significance of organic-rich shale in the Chang 7 member of the Yanchang Formation, south margin of the Ordos basin, central China. Pet. Sci. 2019, 16, 1255–1269. [Google Scholar] [CrossRef] [Green Version]
  31. Labus, M.; Matyasik, I. Application of different thermal analysis techniques for the evaluation of petroleum source rocks. J. Therm. Anal. Calorim. 2019, 136, 1185–1194. [Google Scholar] [CrossRef] [Green Version]
  32. Bennet, B.; Love, G.D. Release of organic nitrogen compounds from kerogen via catalytic hydropyrolysis. Geochem. Trans. 2000, 61, 61. [Google Scholar] [CrossRef]
  33. You, Y.; Han, X.; Wang, X.; Jiang, X. Evolution of gas and shale oil during oil shale kerogen pyrolysis based on structural characteristics. J. Anal. Appl. Pyrolysis 2019, 138, 203–210. [Google Scholar] [CrossRef]
  34. Dang, S.T.; Sondergeld, C.H.; Rai, C.S. Study of Kerogen Maturity using Fourier Transform Infrared Spectroscopy (FTIR) and Thermogravimetric Analysis (TGA). In Proceedings of the SPE Annual Technical Conference and Exhibition, Houston, TX, USA, 28–30 September 2015. [Google Scholar] [CrossRef]
  35. Wood, D.A. Kerogen conversion and thermal maturity modelling of petroleum generation: Integrated analysis applying relevant kerogen kinetics. Mar. Pet. Geol. 2018, 89, 313–329. [Google Scholar] [CrossRef]
  36. Wood, D.A. Establishing credible reaction-kinetics distributions to fit and explain multi-heating rate S2 pyrolysis peaks of kerogens and shales. Adv. Geo Energy Res. 2019, 3, 1–28. [Google Scholar] [CrossRef]
  37. Han, J.; Sun, Y.; Guo, W.; Deng, S.; Hou Ch Qu, L.; Li, Q. Non-isothermal thermogravimetric analysis of pyrolysis kinetics of four oil shales using Sestak-Bergen method. J. Therm. Anal. Calorim. 2019, 135, 2287–2296. [Google Scholar] [CrossRef]
  38. Chi, M.; Xu, X.; Ciu, D.; Zhang, H.; Wang, Q. A TG-FTIR investigation and kinetic analysis of oil shale kerogen pyrolysis using the distributed activation energy model. Oil Shale 2016, 33, 228–247. [Google Scholar] [CrossRef] [Green Version]
  39. Kok, M.V.; Senguler, I.; Hufnagel, H.; Sonel, N. Thermal and geochemical investigation of Seyitomer oil shale. Thermochim. Acta 2001, 371, 111–119. [Google Scholar] [CrossRef]
  40. Liu, Q.Q.; Han, X.X.; Li, Q.Y.; Huang, Y.R.; Jiang, X.M. TG-DSC Analysis of Pyrolysis Process of two Chinese Oil Shales. J. Therm. Anal. Calorim. 2014, 116, 511–517. [Google Scholar] [CrossRef]
Figure 2. Photomicrographs of investigated samples. (A) Sample with high content of pyrite (Wojtkowa). (B) Large vitrinite particle (Bircza). (C) Sharp-edged fusinite (Wojtkowa). (D) Semifusinite with partly preserved cellular structure (Wojtkowa). (E) Large telalginite (Bircza). (F) Lamalginite (Wojtkowa). (G) Liptodetrinite particles within bituminite laminae (Leszczawa). (AD)—reflected light; (EG)—UV mode.
Energies 16 04500 g002
Figure 3. Determination of the kerogen types of the examined samples using modified Van Krevelen diagrams: (a) HI versus OI, (b) HI versus Tmax.
Energies 16 04500 g003
Figure 4. TG and DTG (dashed line) curves obtained during procedure (1) of TG experiments for the Wojtkowa sample.
Energies 16 04500 g004
Figure 5. Thermogram of the sample from Bircza obtained using heating procedure (2).
Energies 16 04500 g005
Figure 6. FTIR spectra of gaseous products of the pyrolysis experiment of the sample from Bircza at 426, 512 and 809 °C.
Energies 16 04500 g006
Figure 7. A 3D FTIR spectrum for the Bircza sample.
Energies 16 04500 g007
Figure 8. Correlation of Tmethane from FTIR analysis versus Tmax from RE analysis.
Energies 16 04500 g008
Figure 9. Example of kinetic input data for the Dynów sample: (a) TG data, and (b) activation energy (Ea) with error bars.
Energies 16 04500 g009
Figure 10. Variability of kinetic parameters of Menilite beds with maceral and mineral composition and hydrocarbon potential.
Energies 16 04500 g010
Table 1. Mineral composition (XRD (% wt)) of the analysed samples.
UnitSampleQuartzMuscoviteKaoliniteMontmorilloniteOrthoclaseClinoptyloliteChloritePyriteCalciteDolomiteGypsumJarosite
SkoleDynów43.26 *2.927.55-----44.471.80--
Bircza39.6931.7215.6511.10-1.84------
Leszczawa G.62.3823.41----10.37----3.84
Wojtkowa48.1230.6717.28----3.93----
Bandrów23.7412.66----8.172.9552.48---
SilesianWernejówka80.5411.615.79----2.06----
Łubne90.465.94----0.920.971.10--0.61
DuklaZyndranowa68.3323.837.84---------
Czystogarb68.2218.4911.24-2.05-------
Komańcza64.7820.1510.12----2.67--2.28-
* in case of the Dynów sample the amount of “Quartz” is the sum of quartz (8.98%) + cristobalite (24.88%) + tridymite (9.40%). This indicates the presence of microcrystalline opal (Opal-CT), which is interpreted as consisting of clusters of stacked cristobalite and tridymite over very short length scales.
Table 2. Maceral composition of the Menilite samples.
VitriniteInertiniteLiptiniteOther Components
UnitSampleColloteliniteVitrodetriniteFusiniteSemifusiniteInertodetriniteAlginiteBituminiteLiptodetriniteZooclastsSolid BitumensMineral MatterVitrinite Reflectance
SkoleDynówtracetracen.o.n.o.n.o.3.57trace2.48tracen.o.93.94n.m.
Bircza0.97tracetracetracetrace1.4613.920.65n.o.n.o.83.010.41
Leszczawa G.5.670.17tracetracen.o.1.6727.170.670.17n.o.64.50.27
Wojtkowa0.170.33tracetracen.o.2.9920.271.00tracen.o.75.250.33
Bandrów0.630.16tracetracetrace0.3211.360.32tracen.o.87.220.38
SilesianWernejówkatracetracen.o.n.o.trace1.100.780.47tracen.o.97.65n.m.
Łubnen.o.n.o.n.o.n.o.n.o.n.o.21.05trace1.810.9976.15n.m.
DuklaZyndranowatrace0.20n.o.n.o.n.o.2.57n.o.1.38n.o.n.o.95.850.28
Czystogarbtrace0.39n.o.n.o.trace4.431.931.73n.o.n.o.91.520.28
Komańczatracetracetracen.o.n.o.3.314.570.94n.o.n.o.91.180.28
n.o.—not observed, n.m.—not measured.
Table 3. Rock-Eval pyrolysis results.
UnitSampleTmaxS1S2S3PIPCRCTOCHIOIMINC
SkoleDynów4250.104.591.250.020.450.831.28359983.33
Bircza4150.3526.423.500.012.445.948.38315420.22
Leszczawa4081.4526.472.090.052.506.098.59308240.25
Wojtkowa4080.2411.561.500.021.105.386.48178230.21
Bandrów4140.2620.920.970.011.843.345.18404195.16
SilesianWernejówka4380.157.630.200.020.671.592.2633890.10
Łubne4590.114.150.620.030.393.593.98104160.12
DuklaZyndranowa4310.5010.621.750.051.022.443.46307510.11
Czystogarb4320.2512.511.450.021.152.163.31378440.16
Komańcza4270.246.711.440.030.661.752.41278600.16
Tmax—the temperature at which the maximum rate of hydrocarbon generation occurs (°C); S1—the free hydrocarbons released at a moderate temperature (300 °C) (mg HC g−1 rock); S2—the volume of hydrocarbons generated during the pyrolytic degradation of the heavy products and kerogen (300–650 °C) (mg HC g−1 rock); S3—the CO2 yield during pyrolysis (mg CO2 g−1 rock); PI = S1/(S1 + S2)—production index; PC—pyrolytic carbon content (wt. %); RC—residual carbon content (wt. %); TOC –total organic carbon (wt. %); HI—hydrogen index (mg HC g−1 TOC); OI—oxygen index (mg CO2 g−1 TOC); MINC—mineral inorganic carbon (wt. %).
Table 4. Weight loss in specified temperature ranges from TG analysis.
Temperature Range40–300 °C300–650 °C
(TTG)
650–1050 °C
ProcessDehydrationKerogen pyrolysisCombustion of residual organic matter
(650–775 °C)
Carbonate decomposition (775–850 °C)Decomposition of the remaining components
(850–1050 °C)
SampleWeight loss (%)Weight loss (%)
(TTG) [°C]
Weight loss (%)
Dynów2.383.70
(TTG n.i.)
5.724.170.37
Bircza5.2110.58
(445.6)
7.87-0.56
Leszczawa5.6611.55
(432.6)
12.15--
Wojtkowa5.246.80
(441.3, 505.0)
4.041.771.02
Bandrów2.774.48
(519.7)
6.905.730.65
Wernejówka1.233.47
(461.9)
1.980.170.35
Łubne0.112.80
(503.4)
1.750.230.59
Zyndranowa3.084.60
(463.2)
2.380.130.22
Czystogarb2.054.54
(454.0)
2.340.110.30
Komańcza1.865.23
(458.5, 521.6)
3.000.450.95
n.i.—not identified.
Table 5. Main episodes of gas release measured using FTIR analysis.
Temperature Range300–500 °C500–650 °C
SampleFunctional GroupsFunctional Groups
DynówC-H
SO2
-
BirczaC-H
CH4
SO2
CH4
LeszczawaC-H
CH4
SO2
CH4
SO2
WojtkowaC-H
CH4
SO2
CH4
SO2
BandrówC-H
CH4
CH4
SO2
WernejówkaC-H
CH4
SO2
-
ŁubneC=C
SO2
C=C
CH4
SO2
ZyndranowaC-H
CH4
-
CzystogarbC-H
CH4
SO2
N-H
C-H
CH4
SO2
KomańczaC-H
CH4
CH4
SO2
Table 6. The average values of activation energy (Ea), pre-exponential factor (A) and coefficient of determination (r2).
UnitSampleEaLog A
(Log(1/s))
r2
(kJ/mol)(kcal/mol)
SkoleDynów24659171.0000
Bircza23356150.9830
Leszczawa10926240.9892
Wojtkowa13432100.9998
Bandrów32578100.9951
SilesianWernejówka2636360.9942
Łubne21451190.9948
DuklaZyndranowa1253061.0000
Czystogarb20750181.0000
Komańcza23155180.9917
Disclaimer/Publisher’s Note: The statements, opinions and data contained in all publications are solely those of the individual author(s) and contributor(s) and not of MDPI and/or the editor(s). MDPI and/or the editor(s) disclaim responsibility for any injury to people or property resulting from any ideas, methods, instructions or products referred to in the content.