Decomposition Analysis and Trend Prediction of Energy-Consumption CO2 Emissions in China’s Yangtze River Delta Region
Abstract
1. Introduction
2. Materials and Methods
2.1. The LMDI Decomposition Method
2.2. GM (1, 1) Model
2.3. Data
2.4. Limitations
3. Results and Discussion
3.1. Energy-Consumption CO2 Emissions of Yangtze River Delta Region
3.2. Decomposition Analysis of CO2 Emissions Factor
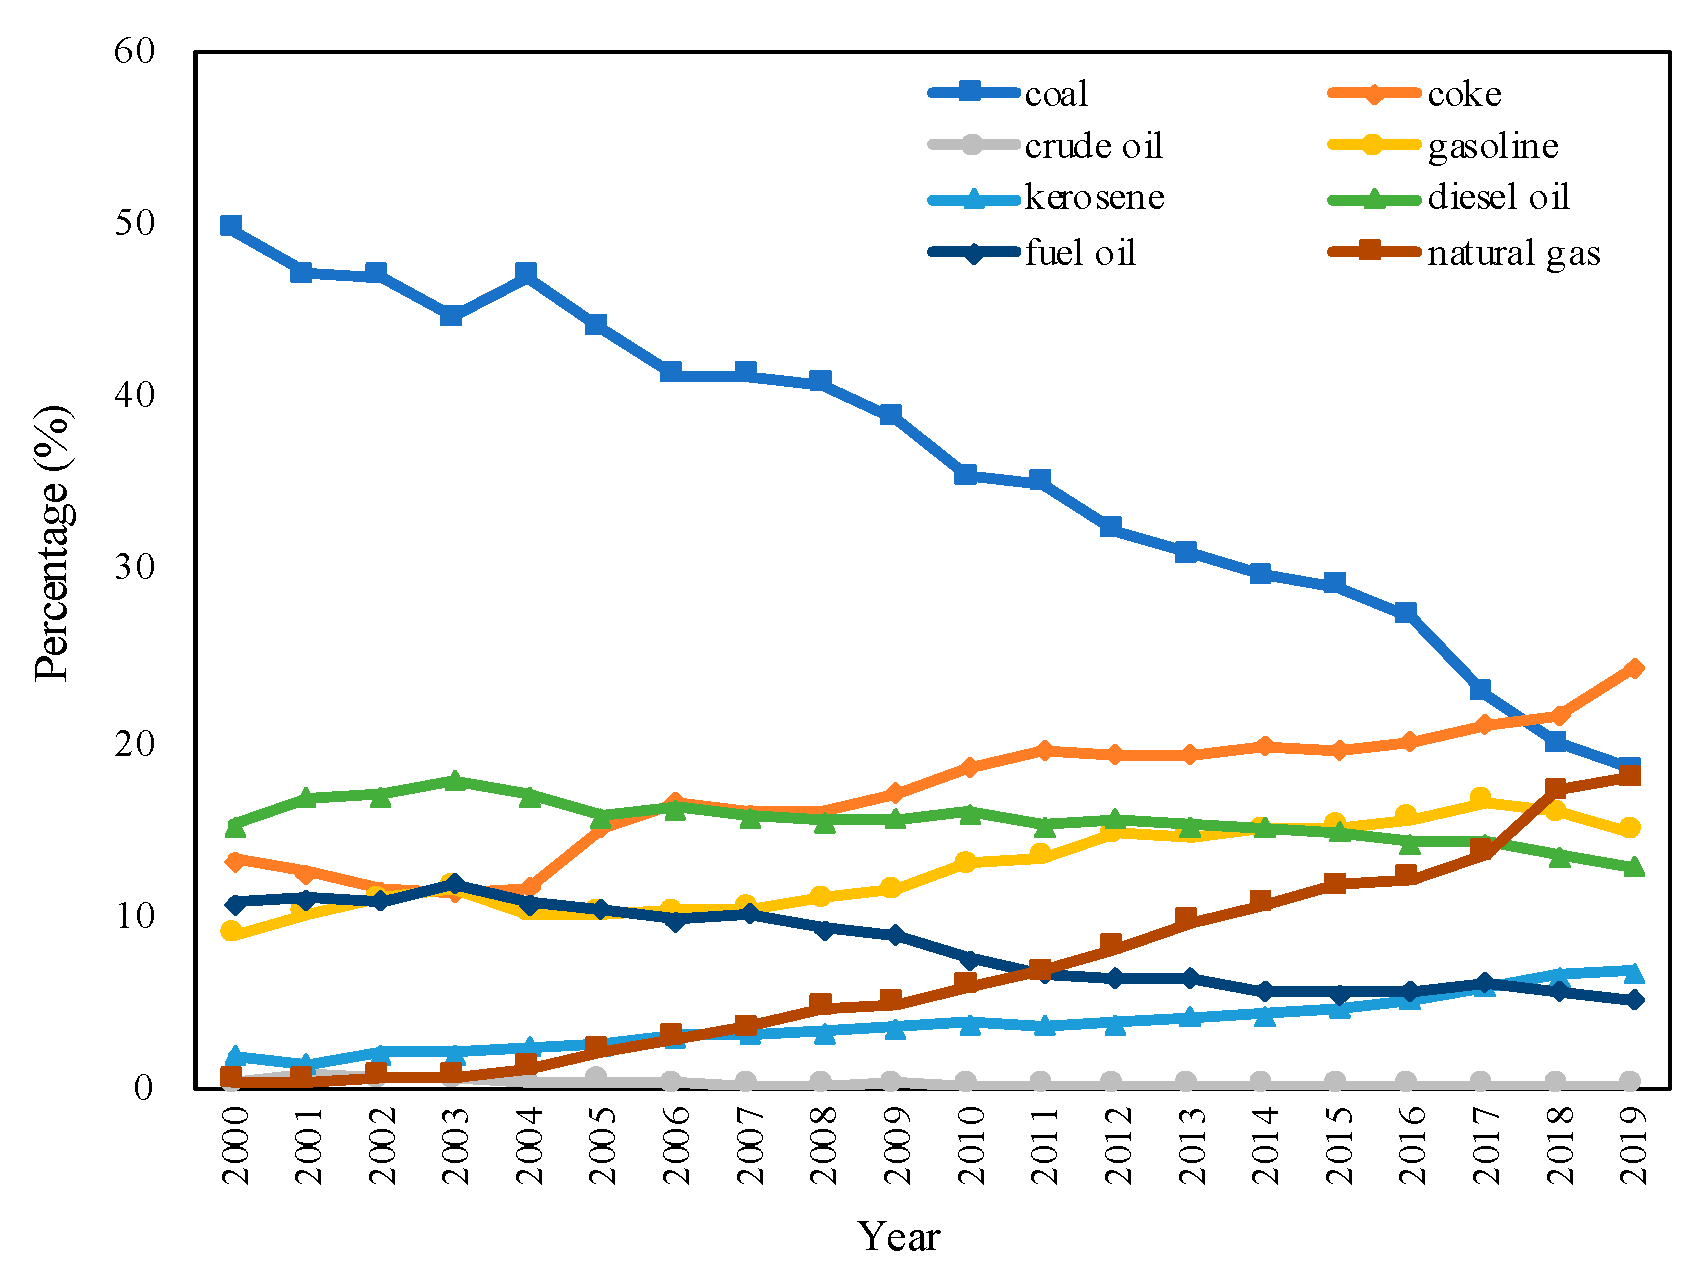
3.2.1. Energy Structure Effect
3.2.2. Energy Intensity Effect
3.2.3. Industrial Structure Effect
3.2.4. Economic Output Effect
3.2.5. Population Size Effect
3.3. Forecasting Results
4. Conclusions
- (1)
- Primary energy consumption and CO2 emissions will continue to rise in the Yangtze River Delta region from 2020 to 2026, with total CO2 emissions rising by 192.715 million tons over the forecast period;
- (2)
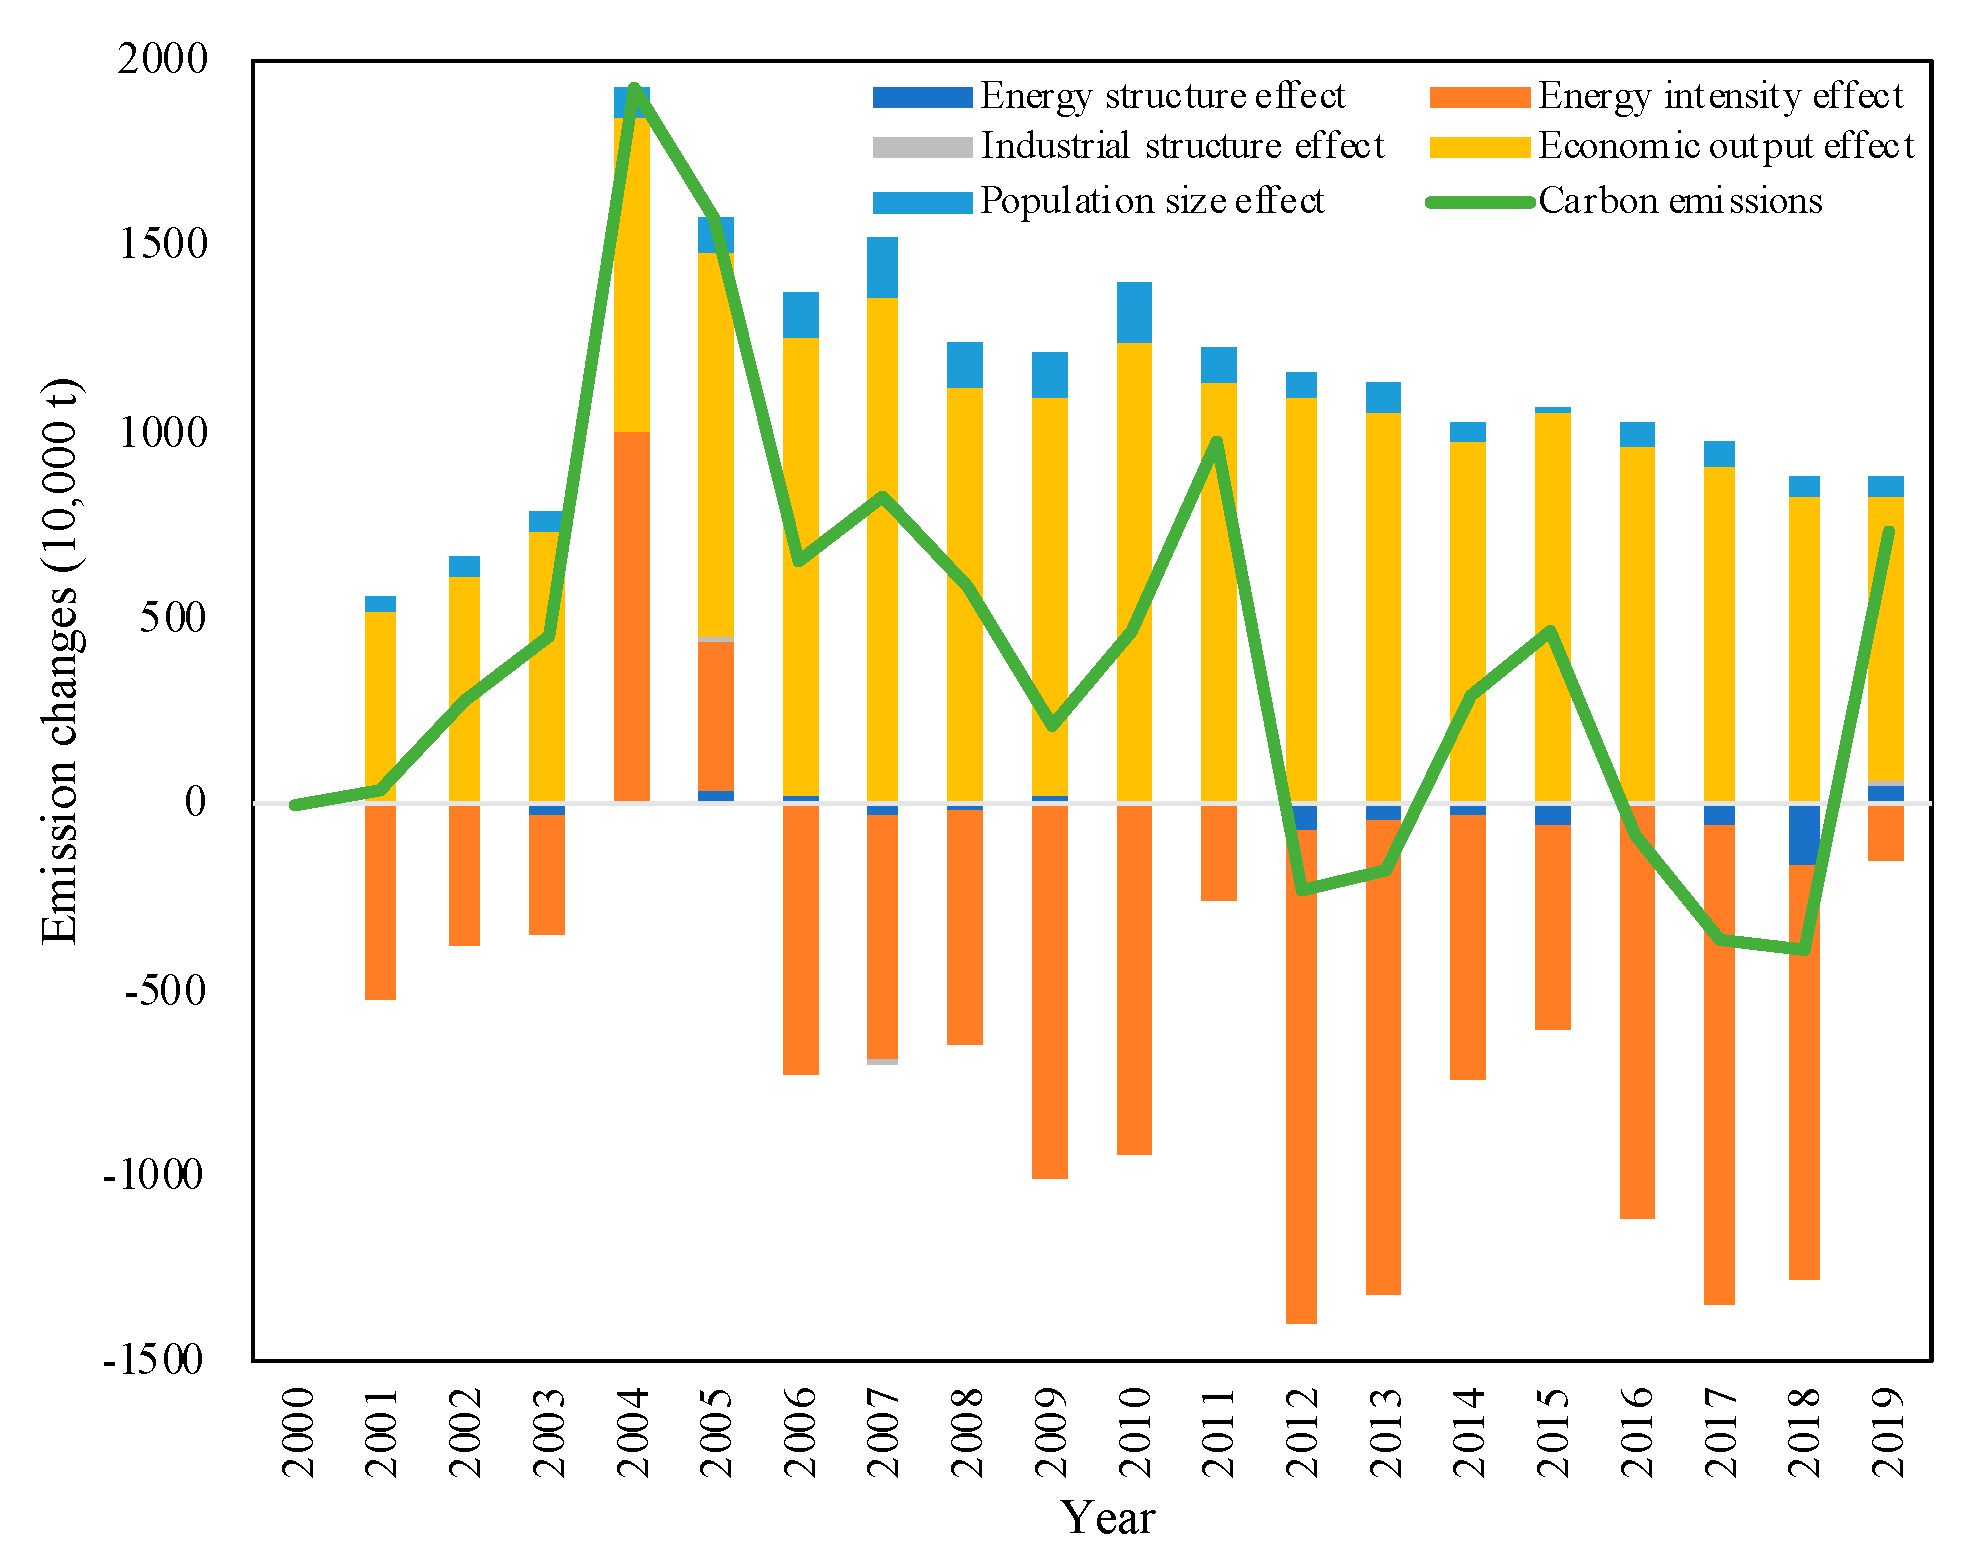
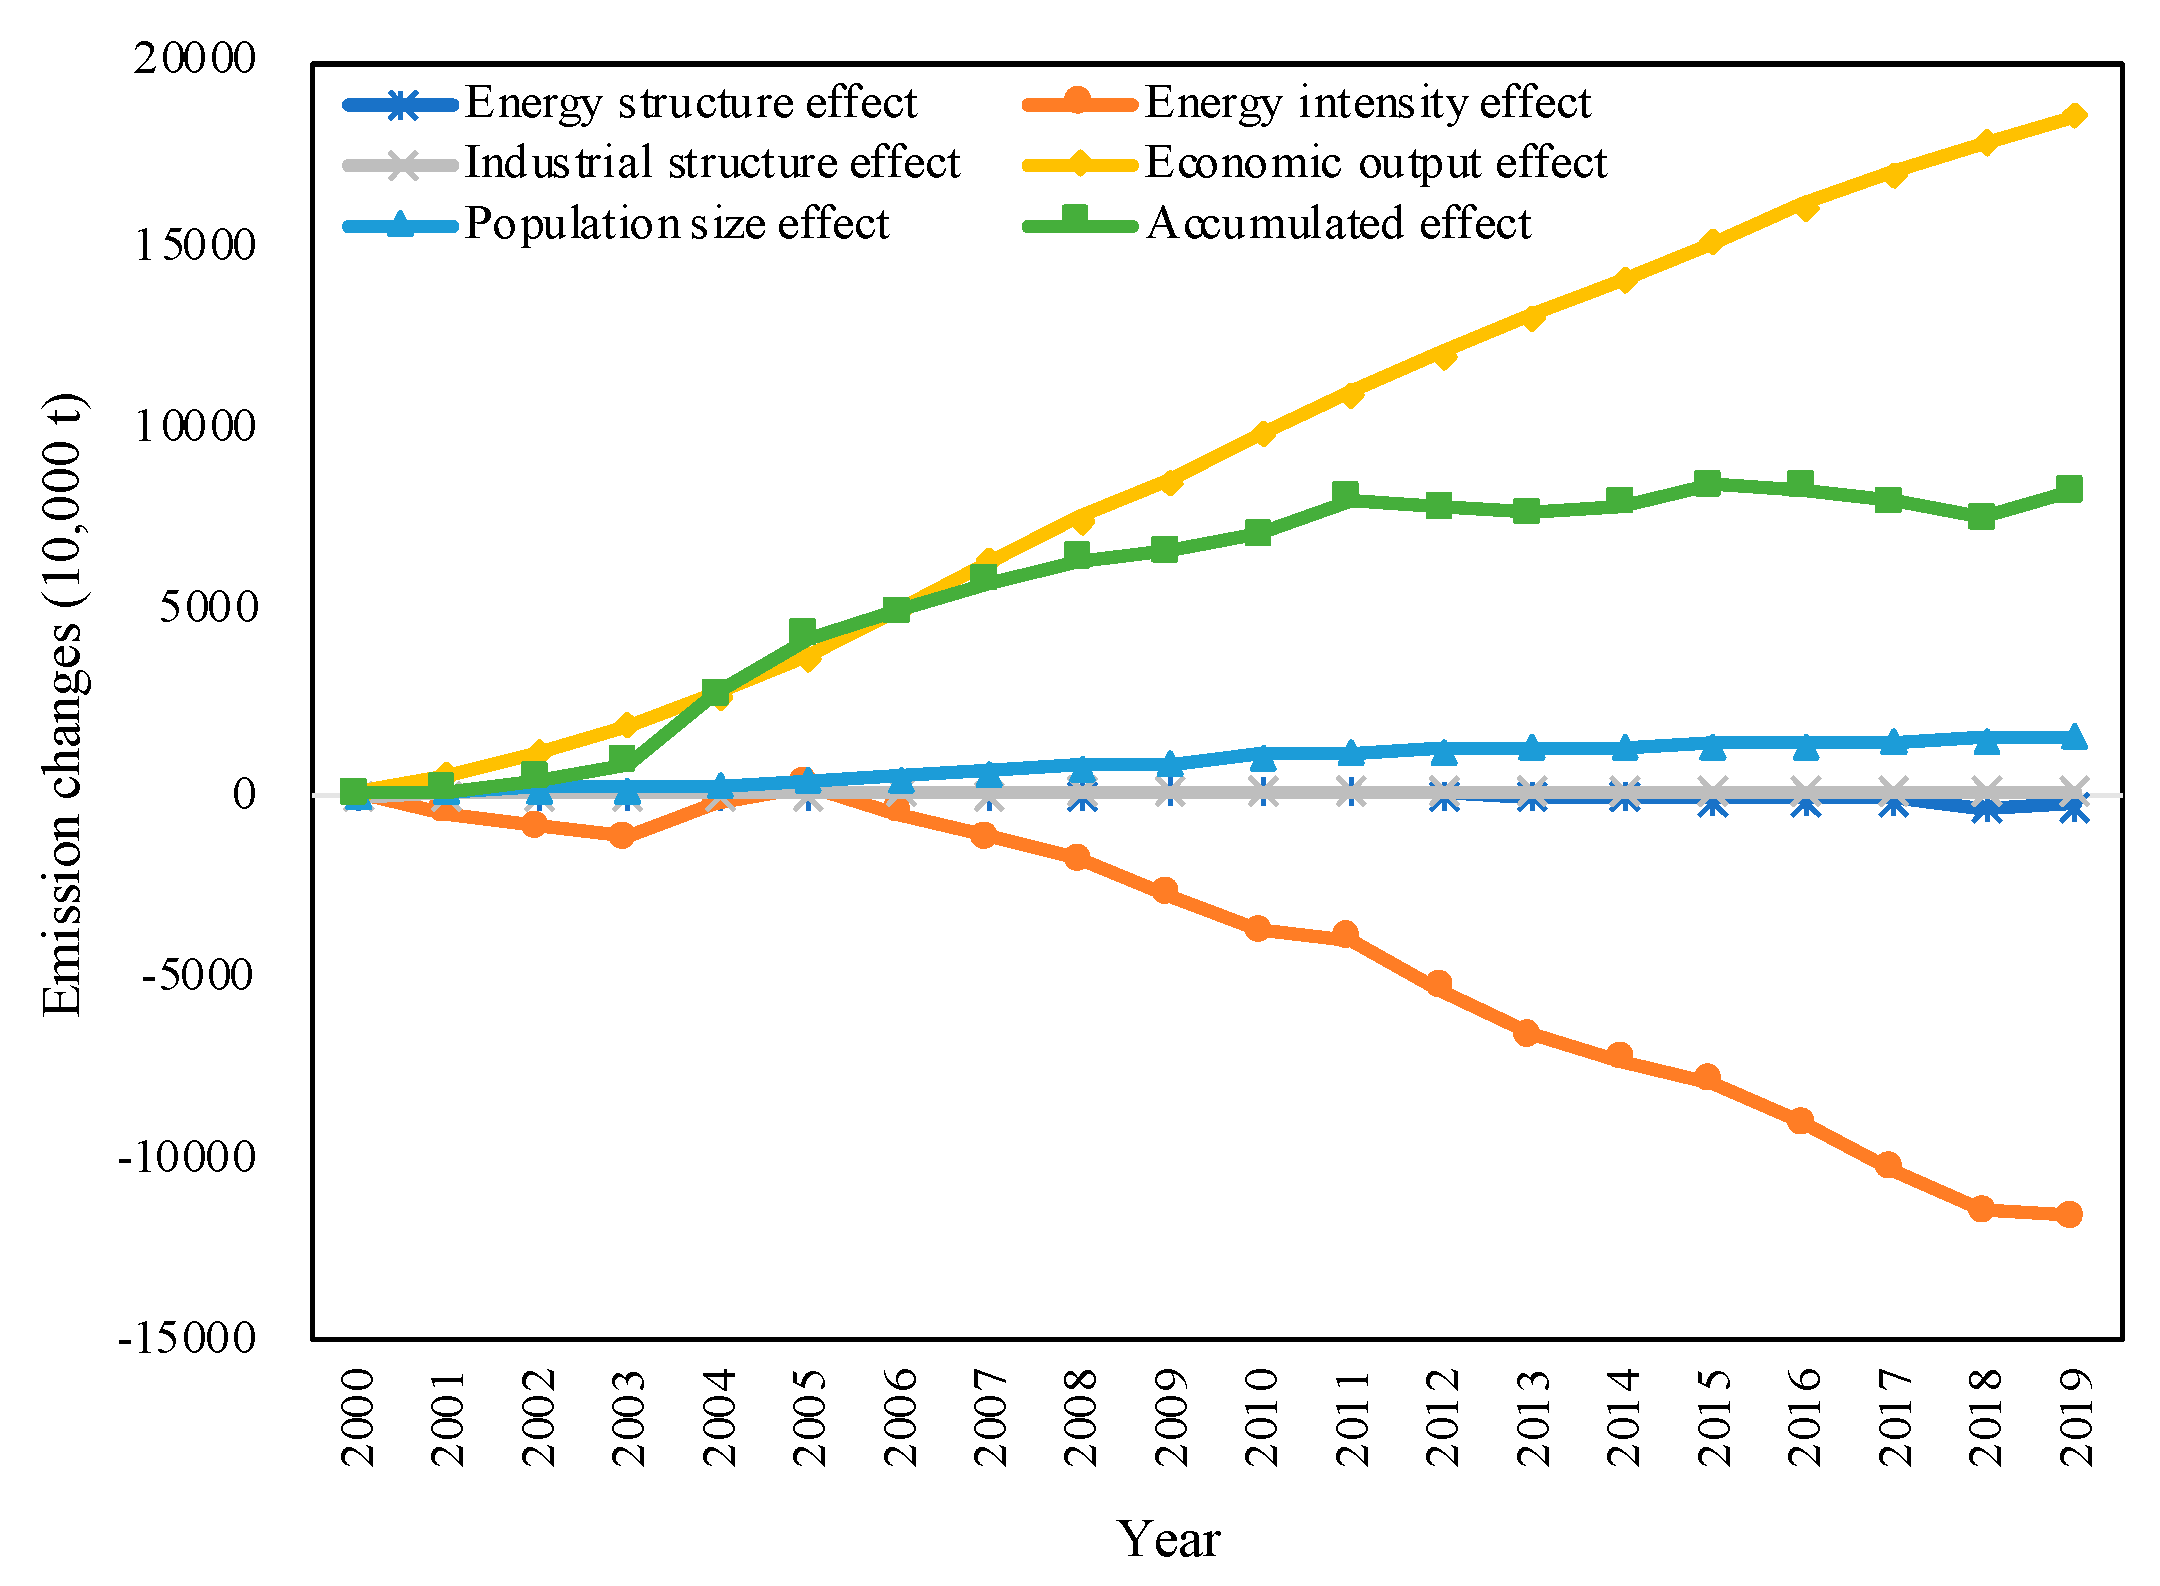
- Economic output and population size have mainly positive effects on the increase in CO2 emissions, and the impacts of changes in these two factors led to growth in CO2 emissions. Economic output is the biggest force pulling up CO2 emissions, contributing 224.90% in the study period. Population size is the second-most important factor promoting the growth in CO2 emissions, the cumulative contribution ratio of which is 18.61%;
- (3)
- Except for 2004 and 2005, energy intensity is the greatest inhibitory factor in reducing CO2 emissions, with a significant negative effect. The energy intensity effect contributed −140.27% to the change in CO2 emissions;
- (4)
- Energy structure and industrial structure have insignificant contributions to CO2 emissions, contributing −3.75% and 0.51%, respectively. Although energy structure had a positive and negative effect during the study period, it showed a negative effect in terms of the cumulative contribution. Industrial structure had a positive effect on CO2 emissions except in 2007, although the pull effect was not significant;
- (5)
- Changes in energy structure and energy intensity had a restraining effect, but they were insufficient to counteract the rise in CO2 emissions, which led to an overall trend of rising CO2 emissions.
- (1)
- Formulating appropriate economic development goals.
- (2)
- Optimizing the energy consumption structure.
- (3)
- Promoting technological progress and innovation.
- (4)
- Adjusting industrial structure and developing low-carbon industries.
- (5)
- Optimizing the population structure and promoting low-carbon living.
Author Contributions
Funding
Data Availability Statement
Acknowledgments
Conflicts of Interest
Appendix A
| Time | ||||||||||||
|---|---|---|---|---|---|---|---|---|---|---|---|---|
| AC | CC | AC | CC | AC | CC | AC | CC | AC | CC | AC | CC | |
| 2000 | 0 | 0 | 0 | 0 | 0 | 0 | 0 | 0 | 0 | 0 | 0 | 0 |
| 2001 | −6.29 | −6.29 | −517.43 | −517.43 | 0.02 | 0.02 | 515.49 | 515.49 | 45.98 | 45.98 | 37.77 | 37.77 |
| 2002 | 4.66 | −1.63 | −382.31 | −899.74 | 1.40 | 1.42 | 610.48 | 1125.97 | 46.11 | 92.09 | 280.34 | 318.12 |
| 2003 | −27.65 | −29.28 | −317.00 | −1216.75 | 3.10 | 4.52 | 736.06 | 1862.04 | 54.43 | 146.52 | 448.94 | 767.05 |
| 2004 | 5.88 | −23.40 | 992.71 | −224.04 | 0.22 | 4.74 | 849.03 | 2711.07 | 84.67 | 231.19 | 1932.50 | 2699.55 |
| 2005 | 33.82 | 10.42 | 413.17 | 189.13 | 3.83 | 8.57 | 1038.69 | 3749.76 | 94.49 | 325.68 | 1583.99 | 4283.55 |
| 2006 | 20.46 | 30.88 | −724.67 | −535.54 | 3.22 | 11.79 | 1230.99 | 4980.75 | 121.98 | 447.65 | 651.99 | 4935.54 |
| 2007 | −22.14 | 8.74 | −669.59 | −1205.13 | −1.32 | 10.48 | 1370.27 | 6351.02 | 150.79 | 598.45 | 828.02 | 5763.56 |
| 2008 | −19.22 | −10.48 | −629.10 | −1834.23 | 2.81 | 13.28 | 1122.03 | 7473.05 | 116.84 | 715.29 | 593.35 | 6356.91 |
| 2009 | 22.47 | 11.99 | −1005.80 | −2840.04 | 3.92 | 17.20 | 1077.65 | 8550.70 | 120.38 | 835.67 | 218.62 | 6575.53 |
| 2010 | 3.75 | 15.75 | −940.68 | −3780.72 | 4.85 | 22.05 | 1243.00 | 9793.70 | 153.75 | 989.42 | 464.67 | 7040.19 |
| 2011 | −3.21 | 12.54 | −255.60 | −4036.31 | 3.43 | 25.48 | 1131.92 | 10,925.62 | 94.57 | 1083.98 | 971.12 | 8011.31 |
| 2012 | −66.29 | −53.75 | −1330.18 | −5366.49 | 3.36 | 28.84 | 1095.75 | 12,021.37 | 64.87 | 1148.85 | −232.49 | 7778.82 |
| 2013 | −39.37 | −93.12 | −1270.88 | −6637.37 | 2.14 | 30.98 | 1062.22 | 13,083.59 | 72.04 | 1220.89 | −173.84 | 7604.97 |
| 2014 | −22.60 | −115.72 | −714.37 | −7351.74 | 2.24 | 33.22 | 974.90 | 14,058.49 | 55.81 | 1276.70 | 295.98 | 7900.95 |
| 2015 | −55.41 | −171.13 | −552.31 | −7904.05 | 3.14 | 36.36 | 1051.48 | 15,109.97 | 18.05 | 1294.75 | 464.95 | 8365.90 |
| 2016 | 14.40 | −156.74 | −1113.74 | −9017.79 | 1.85 | 38.21 | 953.78 | 16,063.75 | 58.66 | 1353.42 | −85.05 | 8280.85 |
| 2017 | −53.51 | −210.24 | −1289.07 | −10,306.85 | 1.71 | 39.91 | 904.44 | 16,968.19 | 68.00 | 1421.41 | −368.43 | 7912.42 |
| 2018 | −157.47 | −367.72 | −1121.95 | −11,428.80 | 0.51 | 40.42 | 823.82 | 17,792.01 | 59.70 | 1481.12 | −395.39 | 7517.04 |
| 2019 | 58.15 | −309.57 | −148.33 | −11,577.14 | 1.62 | 42.04 | 770.56 | 18,562.57 | 54.71 | 1535.83 | 736.69 | 8253.73 |
References
- Fu, X.; Zhou, Y. Collaborative Optimization of PV Greenhouses and Clean Energy Systems in Rural Areas. IEEE Trans. Sustain. Energy 2023, 14, 642–656. [Google Scholar] [CrossRef]
- Song, S.; Long, J.; Jiang, H.; Ran, B.; Yao, L. Characteristics of Office Lighting Energy Consumption and Its Impact on Air Conditioning Energy Consumption. Energy Built Environ. 2023, in press. [Google Scholar] [CrossRef]
- Fu, X. Statistical Machine Learning Model for Capacitor Planning Considering Uncertainties in Photovoltaic Power. Prot. Control. Mod. Power Syst. 2022, 7, 5. [Google Scholar] [CrossRef]
- Tsemekidi Tzeiranaki, S.; Bertoldi, P.; Economidou, M.; Clementi, E.L.; Gonzalez-Torres, M. Determinants of Energy Consumption in the Tertiary Sector: Evidence at European Level. Energy Rep. 2023, 9, 5125–5143. [Google Scholar] [CrossRef]
- China’s Greenhouse Gas Emissions Exceeded the Developed World for the First Time in 2019. Available online: https://rhg.com/research/chinas-emissions-surpass-developed-countries/ (accessed on 20 April 2023).
- British Petroleum. bp Statistical Review of World Energy 2022; British Petroleum Press: London, UK, 2022. [Google Scholar]
- China Statistical Yearbook. Available online: http://www.stats.gov.cn/sj/ndsj/ (accessed on 24 April 2023).
- Ang, B.W. Decomposition Analysis for Policymaking in Energy: Which Is the Preferred Method? Energy Policy 2004, 32, 1131–1139. [Google Scholar] [CrossRef]
- Ang, B.W.; Choi, K.-H. Decomposition of Aggregate Energy and Gas Emission Intensities for Industry: A Refined Divisia Index Method. Energy J. 1997, 18, 59–73. [Google Scholar] [CrossRef]
- Ang, B.W. The LMDI Approach to Decomposition Analysis: A Practical Guide. Energy Policy 2005, 33, 867–871. [Google Scholar] [CrossRef]
- Wang, W.; Liu, X.; Zhang, M.; Song, X. Using a New Generalized LMDI (Logarithmic Mean Divisia Index) Method to Analyze China’s Energy Consumption. Energy 2014, 67, 617–622. [Google Scholar] [CrossRef]
- Chong, C.H.; Ma, L.; Li, Z.; Ni, W.; Song, S. Logarithmic Mean Divisia Index (LMDI) Decomposition of Coal Consumption in China Based on the Energy Allocation Diagram of Coal Flows. Energy 2015, 85, 366–378. [Google Scholar] [CrossRef]
- Chang, Y.F.; Lewis, C.; Lin, S.J. Comprehensive Evaluation of Industrial CO2 Emission (1989–2004) in Taiwan by Input-Output Structural Decomposition. Energy Policy 2008, 36, 2471–2480. [Google Scholar] [CrossRef]
- Wang, M.; Feng, C. Decomposition of Energy-Related CO2 Emissions in China: An Empirical Analysis Based on Provincial Panel Data of Three Sectors. Appl. Energy 2017, 190, 772–787. [Google Scholar] [CrossRef]
- Wang, C.; Chen, J.; Zou, J. Decomposition of Energy-Related CO2 Emission in China: 1957–2000. Energy 2005, 30, 73–83. [Google Scholar] [CrossRef]
- Xu, S.C.; He, Z.X.; Long, R.Y. Factors That Influence Carbon Emissions Due to Energy Consumption in China: Decomposition Analysis Using LMDI. Appl. Energy 2014, 127, 182–193. [Google Scholar] [CrossRef]
- Liu, L.C.; Fan, Y.; Wu, G.; Wei, Y.M. Using LMDI Method to Analyze the Change of China’s Industrial CO2 Emissions from Final Fuel Use: An Empirical Analysis. Energy Policy 2007, 35, 5892–5900. [Google Scholar] [CrossRef]
- Wu, P.; Song, Y.; Zhu, J.; Chang, R. Analyzing the Influence Factors of the Carbon Emissions from China’s Building and Construction Industry from 2000 to 2015. J. Clean. Prod. 2019, 221, 552–566. [Google Scholar] [CrossRef]
- Xu, J.H.; Fleiter, T.; Eichhammer, W.; Fan, Y. Energy Consumption and CO2 Emissions in China’s Cement Industry: A Perspective from LMDI Decomposition Analysis. Energy Policy 2012, 50, 821–832. [Google Scholar] [CrossRef]
- Lin, B.; Long, H. Emissions Reduction in China’s Chemical Industry—Based on LMDI. Renew. Sustain. Energy Rev. 2016, 53, 1348–1355. [Google Scholar] [CrossRef]
- Xie, X.; Shao, S.; Lin, B. Exploring the Driving Forces and Mitigation Pathways of CO2 Emissions in China’s Petroleum Refining and Coking Industry: 1995–2031. Appl. Energy 2016, 184, 1004–1015. [Google Scholar] [CrossRef]
- Zhang, M.; Li, H.; Zhou, M.; Mu, H. Decomposition Analysis of Energy Consumption in Chinese Transportation Sector. Appl. Energy 2011, 88, 2279–2285. [Google Scholar] [CrossRef]
- Wang, W.W.; Zhang, M.; Zhou, M. Using LMDI Method to Analyze Transport Sector CO2 Emissions in China. Energy 2011, 36, 5909–5915. [Google Scholar] [CrossRef]
- Ren, S.; Yin, H.; Chen, X.H. Using LMDI to Analyze the Decoupling of Carbon Dioxide Emissions by China’s Manufacturing Industry. Environ. Dev. 2014, 9, 61–75. [Google Scholar] [CrossRef]
- Zhao, M.; Tan, L.; Zhang, W.; Ji, M.; Liu, Y.; Yu, L. Decomposing the Influencing Factors of Industrial Carbon Emissions in Shanghai Using the LMDI Method. Energy 2010, 35, 2505–2510. [Google Scholar] [CrossRef]
- Song, M.; Guo, X.; Wu, K.; Wang, G. Driving Effect Analysis of Energy-Consumption Carbon Emissions in the Yangtze River Delta Region. J. Clean. Prod. 2015, 103, 620–628. [Google Scholar] [CrossRef]
- Chen, L.; Xu, L.; Xu, Q.; Yang, Z. Optimization of Urban Industrial Structure under the Low-Carbon Goal and the Water Constraints: A Case in Dalian, China. J. Clean. Prod. 2016, 114, 323–333. [Google Scholar] [CrossRef]
- Zhang, W.; Li, K.; Zhou, D.; Zhang, W.; Gao, H. Decomposition of Intensity of Energy-Related CO2 Emission in Chinese Provinces Using the LMDI Method. Energy Policy 2016, 92, 369–381. [Google Scholar] [CrossRef]
- Zhou, X.; Zhang, M.; Zhou, M.; Zhou, M. A Comparative Study on Decoupling Relationship and Influence Factors between China’s Regional Economic Development and Industrial Energy–Related Carbon Emissions. J. Clean. Prod. 2017, 142, 783–800. [Google Scholar] [CrossRef]
- Ju-Long, D. Control Problems of Grey Systems. Syst. Control Lett. 1982, 1, 288–294. [Google Scholar] [CrossRef]
- Wu, L.; Liu, S.; Liu, D.; Fang, Z.; Xu, H. Modelling and Forecasting CO2 Emissions in the BRICS (Brazil, Russia, India, China, and South Africa) Countries Using a Novel Multi-Variable Grey Model. Energy 2015, 79, 489–495. [Google Scholar] [CrossRef]
- Pao, H.T.; Fu, H.C.; Tseng, C.L. Forecasting of CO2 Emissions, Energy Consumption and Economic Growth in China Using an Improved Grey Model. Energy 2012, 40, 400–409. [Google Scholar] [CrossRef]
- Wang, X.; Cai, Y.; Xu, Y.; Zhao, H.; Chen, J. Optimal Strategies for Carbon Reduction at Dual Levels in China Based on a Hybrid Nonlinear Grey-Prediction and Quota-Allocation Model. J. Clean. Prod. 2014, 83, 185–193. [Google Scholar] [CrossRef]
- Tang, D.; Ma, T.; Li, Z.; Tang, J.; Bethel, B.J. Trend Prediction and Decomposed Driving Factors of Carbon Emissions in Jiangsu Province during 2015–2020. Sustainability 2016, 8, 1018. [Google Scholar] [CrossRef]
- Liu, X.; Peng, H.; Bai, Y.; Zhu, Y.; Liao, L. Tourism Flows Prediction Based on an Improved Grey GM(1,1) Model. Procedia Soc. Behav. Sci. 2014, 138, 767–775. [Google Scholar] [CrossRef]
- 2006 IPCC Guidelines for National Greenhouse Gas Inventories. Available online: https://www.ipcc-nggip.iges.or.jp/public/2006gl/index.html (accessed on 24 April 2023).
- Jiangsu Statistical Yearbook. Available online: https://tj.jiangsu.gov.cn/col/col87172/index.html (accessed on 24 April 2023).
- Zhejiang Statistical Yearbook. Available online: http://tjj.zj.gov.cn/col/col1525563/index.html (accessed on 24 April 2023).
- Shanghai Statistical Yearbook. Available online: https://tjj.sh.gov.cn/tjnj/index.html (accessed on 24 April 2023).
- National Bureau of Statistics of China. China Energy Statistical Yearbook (2001–2020); China Statistics Press: Beijing, China, 2020.




| Energy Types | Standard Coal Reference Coefficient (kgce/kg) | Carbon Emission Coefficient (kg/kgce) |
|---|---|---|
| Coal | 0.7143 | 0.7476 |
| Coke | 0.9714 | 0.8550 |
| Crude oil | 1.4286 | 0.5825 |
| Gasoline | 1.4714 | 0.5538 |
| Kerosene | 1.4714 | 0.5714 |
| Diesel oil | 1.4571 | 0.5921 |
| Fuel oil | 1.4286 | 0.6185 |
| Natural gas a | 1.3300 | 0.4435 |
| Year | Agriculture, Forestry, Animal Husbandry, and Fishery | Industry | Construction | Transport, Storage, and Post | Wholesale, Retail Trade, Hotels, and Catering Services |
|---|---|---|---|---|---|
| 2000 | 9.11 | 44.49 | 5.60 | 6.66 | 11.11 |
| 2005 | 9.19 | 44.53 | 5.62 | 6.66 | 11.13 |
| 2010 | 9.33 | 44.57 | 5.67 | 6.66 | 11.10 |
| 2015 | 9.46 | 44.61 | 5.71 | 6.66 | 11.07 |
| 2019 | 9.48 | 44.63 | 5.71 | 6.66 | 11.08 |
| Year | 2020 | 2021 | 2022 | 2023 | 2024 | 2025 | 2026 |
|---|---|---|---|---|---|---|---|
| Predicted value | 160.528 | 165.669 | 170.897 | 176.214 | 181.621 | 187.121 | 192.715 |
| Year | Actual Value | Fitted Value | Residual | Relative Error (%) |
|---|---|---|---|---|
| 2000 | 56.508 | 56.508 | 0 | 0 |
| 2001 | 56.886 | 77.698 | −20.812 | 36.585 |
| 2002 | 59.69 | 81.426 | −21.737 | 36.416 |
| 2003 | 64.179 | 85.218 | −21.039 | 32.782 |
| 2004 | 83.504 | 89.075 | −5.571 | 6.671 |
| 2005 | 99.344 | 92.997 | 6.347 | 6.389 |
| 2006 | 105.864 | 96.986 | 8.878 | 8.386 |
| 2007 | 114.144 | 101.043 | 13.101 | 11.478 |
| 2008 | 120.078 | 105.169 | 14.908 | 12.416 |
| 2009 | 122.264 | 109.366 | 12.898 | 10.549 |
| 2010 | 126.91 | 113.634 | 13.277 | 10.461 |
| 2011 | 136.622 | 117.975 | 18.647 | 13.649 |
| 2012 | 134.297 | 122.39 | 11.907 | 8.866 |
| 2013 | 132.558 | 126.88 | 5.679 | 4.284 |
| 2014 | 135.518 | 131.446 | 4.072 | 3.005 |
| 2015 | 140.167 | 136.091 | 4.077 | 2.908 |
| 2016 | 139.317 | 140.815 | −1.498 | 1.075 |
| 2017 | 135.633 | 145.619 | −9.986 | 7.363 |
| 2018 | 131.679 | 150.505 | −18.826 | 14.297 |
| 2019 | 139.046 | 155.474 | −16.429 | 11.815 |
Disclaimer/Publisher’s Note: The statements, opinions and data contained in all publications are solely those of the individual author(s) and contributor(s) and not of MDPI and/or the editor(s). MDPI and/or the editor(s) disclaim responsibility for any injury to people or property resulting from any ideas, methods, instructions or products referred to in the content. |
© 2023 by the authors. Licensee MDPI, Basel, Switzerland. This article is an open access article distributed under the terms and conditions of the Creative Commons Attribution (CC BY) license (https://creativecommons.org/licenses/by/4.0/).
Share and Cite
Yuan, Y.; Suk, S. Decomposition Analysis and Trend Prediction of Energy-Consumption CO2 Emissions in China’s Yangtze River Delta Region. Energies 2023, 16, 4510. https://doi.org/10.3390/en16114510
Yuan Y, Suk S. Decomposition Analysis and Trend Prediction of Energy-Consumption CO2 Emissions in China’s Yangtze River Delta Region. Energies. 2023; 16(11):4510. https://doi.org/10.3390/en16114510
Chicago/Turabian StyleYuan, Yue, and Sunhee Suk. 2023. "Decomposition Analysis and Trend Prediction of Energy-Consumption CO2 Emissions in China’s Yangtze River Delta Region" Energies 16, no. 11: 4510. https://doi.org/10.3390/en16114510
APA StyleYuan, Y., & Suk, S. (2023). Decomposition Analysis and Trend Prediction of Energy-Consumption CO2 Emissions in China’s Yangtze River Delta Region. Energies, 16(11), 4510. https://doi.org/10.3390/en16114510


