Article

Transport Phenomena in a Banded Solid Oxide Fuel Cell Stack—Part 1: Model and Validation

Department of Fundamental Research in Energy Engineering, AGH University of Krakow, 30-059 Krakow, Poland
*
Author to whom correspondence should be addressed.
Energies 2023, 16(11), 4511; https://doi.org/10.3390/en16114511
Submission received: 30 April 2023 / Revised: 27 May 2023 / Accepted: 30 May 2023 / Published: 3 June 2023
(This article belongs to the Special Issue Current Advances in Fuel Cell Technology)

Abstract

:
This paper primarily focuses on the formulation and validation of mathematical and numerical models for a new electrolyte-supported solid oxide fuel cell stack. By leveraging numerical modeling, the main goal is to deepen the understanding of the operational aspects and transport phenomena within this system. The developed models are implemented in ANSYS, Inc., Fluent software, which enables a range of simulations. To validate the models, a stack fabrication methodology, a prototype construction, and conducted electrochemical tests were proposed. The simulated current-voltage characteristics for two different operating temperatures and three different fuel compositions were compared with the experimental measurements with satisfactory agreement. The counter-flow configuration was simulated and compared to the co-flow arrangement. The numerical simulation has demonstrated its efficacy in identifying possible design imperfections and enhancing the operational conditions of the prototype stack. Moreover, the developed model was further used, in Part 2 of this paper, to analyze the improvement options implementation for the next stage of the prototype.

1. Introduction

The increase in energy demand and the need to reduce greenhouse gas production are just a few of the many reasons why mankind should become more environmentally friendly and focus on more efficient energy conversion methods. A fuel cell, which is a unit that converts the chemical energy of a fuel directly into electrical energy, could be one of the possible solutions. The wide range of power levels allows fuel cells to be used in centralized and decentralized power supply systems. This paper focuses on solid oxide fuel cells (SOFCs), which are the most efficient fuel cell systems in a wide range of system sizes [1]. SOFCs are highly efficient ceramic fuel cells that operate at temperatures between 700 °C and 1000 °C because the applied ceramics need high temperatures to achieve the expected ionic conductance. On the cathode side, the air is transported, providing oxygen, which is converted to oxygen ions O 2 with free electrons. The ions are conducted through the electrolyte layer to the anode. On the anode, the oxygen ions are joined by the hydrogen molecules supplied. This reaction produces free electrons, which are conducted to the cathode by an external circuit and generate electricity. Between the anode and the cathode, the electric potential difference is generated. When powered by pure hydrogen, the only reaction products are steam, heat, and electrical energy.
SOFCs have been recognized as advanced power generation systems with high thermal efficiency [1]. Furthermore, SOFCs can be operated with alternative fuels, such as carbon monoxide, hydrocarbons, or ammonia, with minimal preprocessing requirements and, due to the elevated operating temperature, exhibit greater resistance to impurities than low-temperature fuel cells [2,3]. Several variations of SOFC designs are possible, such as: electrolyte-supported, anode-supported, or cathode-supported. Since SOFC electrolytes are usually of high strength zirconium dioxide ZrO 2 , such as yttria-stabilized zirconia (YSZ) or scandia-stabilized zirconia (ScSZ), the electrolyte-supported design exhibits sufficient durability and reliability [4]. One of the most interesting possibilities of electrolyte-supported design is symmetrical cells, usually supported on the YSZ or lanthanum strontium gallium magnesium oxides (LSGM) electrolyte [5]. A comprehensive review is presented in [5]. In this paper, the prototypical unit of the electrolyte-supported SOFC stack is introduced, tested experimentally, and numerically inspected. The investigated stack shown in Figure 1 consists of six pairs of electrodes, banded in a single electrolyte, electronically connected in series [6]; therefore, it is termed a “banded solid oxide fuel cell stack”. The half-tubular ceramic covers form fuel and air channels with thin tubes for the inlets and outlets. The covers are connected to the stack plate with ceramic sealing. This work describes the implementation of computational fluid dynamics (CFD) to investigate the operation of the SOFC stack prototype. The purpose of this work is to broaden the knowledge about the proposed stack [6] in terms of fluid mechanics, thermodynamics, and current transport. Mathematical and numerical modeling is recognized as a useful tool for analyzing such systems, making it possible to understand and visualize the processes that occur inside the stack.
The banded SOFC stack fits into research on so-called “segmented-in-series” or “integrated planar” solid oxide fuel cell stacks. These designs can be understood as a transition between the planar and tubular variants of SOFCs: electrodes are fabricated on a single substrate, but electrical connections between cells, as well as the separation of fuel and oxidant, are realized without the need for bipolar plates. Historically, the first example of such a design was proposed by Westinghouse Electric Corporation in 1981 [7]—Isenberg proposed a tubular porous substrate on which several cells connected in series are manufactured [7]. Rolls-Royce developed a similar idea in the late 1990s of the twentieth century [8]. The substantial difference was in the geometry of the stack: the cell arrangement is substantially the same as in the Westinghouse design, but it is manufactured on a planar porous substrate [8,9]. The segmented-in-series SOFC stack with porous support with flattened tubular gas channels (flat tubular substrate) was proposed by Kyocera and Tokyo Gas [10]. Corning Incorporated analyzed segmented-in-series stacks as a potential candidate for low-mass SOFCs for portable applications [11]. The recent application of segmented electrodes was described by Kim et al. [12], who fabricated a solid oxide fuel cell with a segmented lanthanum strontium manganite (LSM) cathode to examine local performance variations. Reports on segmented-in-series SOFCs pointed out low production costs, reduced weight (no need to introduce bipolar plates), and relaxed requirements on the thermal expansion of materials (compared to standard planar cells) as major advantages [8], while ohmic losses are kept at a level similar to the standard planar design [13].
To better understand the operation of the banded SOFC stack, mathematical modeling and numerical simulation are crucial but highly complex techniques. In recent years, the field of computer modeling has advanced rapidly, and many sophisticated methods and techniques can now be applied through software. These methods range from simple simulations to complex models that incorporate multiple physical phenomena, such as the operation of the SOFC stack. ANSYS, Inc., Fluent forms a useful instrument for engineering and scientific purposes and is described as a valuable tool used for the software-based modeling of solid oxide fuel cells [14]. The Fuel Cell and Electrolysis add-on module, which enables the modeling of SOFCs, can be used to analyze various fuel cell system designs. The second slightly different SOFC add-on module, SOFC with Unresolved Electrolyte, was presented in detail in [15] but, since the governing equations for the electrolyte in this method are significantly simplified, for the electrolyte-supported stack it is less desirable. The three-dimensional model of a SOFC was developed and experimentally validated with satisfactory results by Tikiz et al. [16]. The research has analyzed the single, planar, anode-supported SOFC with the cross-flow realized by bipolar plates, serving as current collectors and gas channels, in terms of the influence of operation parameters [16]. The numerical modeling of a SOFC stack of five cells was performed to analyze the transport processes and flow uniformity in the stack by Dong et al. [17]. The investigated stack consists of five planar anode-supported cells with a circular shape arranged in a concentric way. The cells are connected by using metal separators as current collectors and contributing gas paths, sealed with mica. The temperature field, current density, overpotential, and reactant distributions were examined. A comparison of the numerical models found in the literature and applied in the study with the experimental results was performed under different mean current densities [17]. A SOFC operation simulation was performed under different operating conditions, while the influence of the stack design and system size on system performance was investigated using ANSYS, Inc., Fluent by Pirasaci [18]. The numerical simulation results were examined using experimental data found in the literature. The uniform multi-stack design was compared with the non-uniform design, which showed a performance difference [18]. In both cases, the stack geometries were constructed using conventional rectangular planar cells with metal interconnectors [18]. The operation of the SOFC fueled by partially pre-reformed methane was simulated by Pianko-Oprych et al. [19]. A single anode-supported rectangular-shaped cell enclosed between two bipolar plates with cross-flow characteristics was studied [19]. A modeling investigation was carried out to predict performance and analyze the influence of different fuel compositions. The numerical model was examined using the experimental results found in the literature [19]. The three-dimensional computational fluid dynamics model was created by Zhang et al. [20] and confirmed by the experimental voltage-current characteristics obtained under identical conditions [20]. The research was conducted to verify and analyze the phenomena that occur in the planar, anode-supported, cross-flow, single SOFC with a rectangular shape, closed between bipolar plates, which also included the characteristics of co-flow cells. The model allowed for the observation of temperature and flow distributions, as well as species transport, fuel utilization, potential, and current density distributions in the cell [20]. The application of new ideas through research using ANSYS, Inc., Fluent software could have an impact on speeding up the performance and growth over the lifetime of the fuel cells. Wei et al. [21] proposed and tested the new idea of stacking and redesigning the flow channels [21]. The three-dimensional CFD model allowed for the observation of the thermal stresses in the components and the verification of the transport phenomena. In all the cases studied, Wei et al. [21] used rectangular planar anode-supported cells, connected in stacks through metal plates. The new design of the flow paths, contributed by metal plates, also showed an improvement in performance in the field of power density and electrical efficiency. The obtained model was compared with another SOFC model found in the literature, which preserved the same simulation conditions [21]. Another new idea for anode-supported cross-flow planar single fuel cell design, closed between metal plates, was tested using ANSYS, Inc., Fluent software with the Fuel Cell module by Pianko-Oprych et al. [22]. The model was validated with experimental data found in the literature. The results were used to implement changes in the fuel cell development process and could be a basis for the further optimization of the new design of bipolar plates [22]. The ANSYS, Inc.,Fluent in-build SOFC modules could also be rebuilt or extended by in-house developed models. The implementation of the in-house models could result in a better match with specific units and estimate desired parameters. Li et al. [23] proposed a coupled multiphysics model to simulate production-scale SOFC stacks. The paper investigates a stack made up of planar cells enclosed between metal plates with co-flow and counterflow characteristics, repeated into a 30-cell stack. The model was validated with experimental data and was found to be accurate, stable, and efficient. The obtained model counts all the components of the stack on numerical grids and provides detailed stack operation information [23]. The results of the CFD simulation could also be used in further analysis and extended in the field of economics. A technical and economic comparison was presented between the different cell types [24]. Not only ANSYS, Inc., Fluent is used to simulate SOFC operation. Beale et al. proposed an open-source computational model of SOFC, written using the OPENFOAM FOUNDATION LIMITED, OpenFOAM finite volume method library [25]. Another OPENFOAM FOUNDATION LIMITED, OpenFOAM model was prepared by Nishida et al. to evaluate the performance of a whole stack [26]. Andersson et al. applied COMSOL, Inc., COMSOL Multiphysics to analyze the operation of a SOFC fueled with renewable fuels, e.g., biogas and ethanol [27]. In-house models can also provide valuable information on SOFC operation. For example, Prokop et al. published a detailed heterogeneous model of transport phenomena in the SOFC’s anode, written in C++ [2]. Moździerz et al. prepared a model of a single SOFC in Python [28]. This model combines a description of the microscale charge and mass transfer with macroscale momentum and heat transfer [28]. Chalusiak et al. presented a model of transport phenomena in a direct internal reforming SOFC, written in MATHWORKS, Inc., MATLAB [29].
CFD-based studies of segmented-in-series stacks are rather rare and focus mainly on the reproduction of experimental results. For example, Costamagna et al. [30] prepared a simple mass transfer model of such a stack. The results indicate that the model can successfully reproduce the results from both a laboratory-scale integrated planar stack and a full-size prototype. However, the model omits several phenomena to be understood, such as thermal issues. The tubular segmented-in-series SOFC stack was analyzed by Son et al. [31] from the point of view of interconnection materials and interconnection design. The voltage distribution in a flat tube segmented-in-series SOFC stack was numerically investigated by Cui et al. [32]. However, analyses of other transport phenomena critical to the proper design of a banded SOFC stack, shown in both works, are rather limited.
Scientific research widely applies computational fluid dynamics to analyze the operation of solid oxide fuel cells. This study presents mathematical and numerical models, alongside the experimental validation of a banded solid oxide fuel cell stack. Although the experimental analysis demonstrated stable stack operation, it also revealed underperformance. Therefore, this numerical simulation was developed to improve the system’s performance in the future. The main contribution of this study is a computational fluid dynamic simulation of a banded solid oxide fuel cell stack arrangement, which is underinvestigated, as unveiled in the literature survey. In addition, the study provides a well-documented methodology for employing ANSYS, Inc., Fluent in solid oxide fuel cell studies.

2. Experimental Analysis

2.1. Stack Preparation

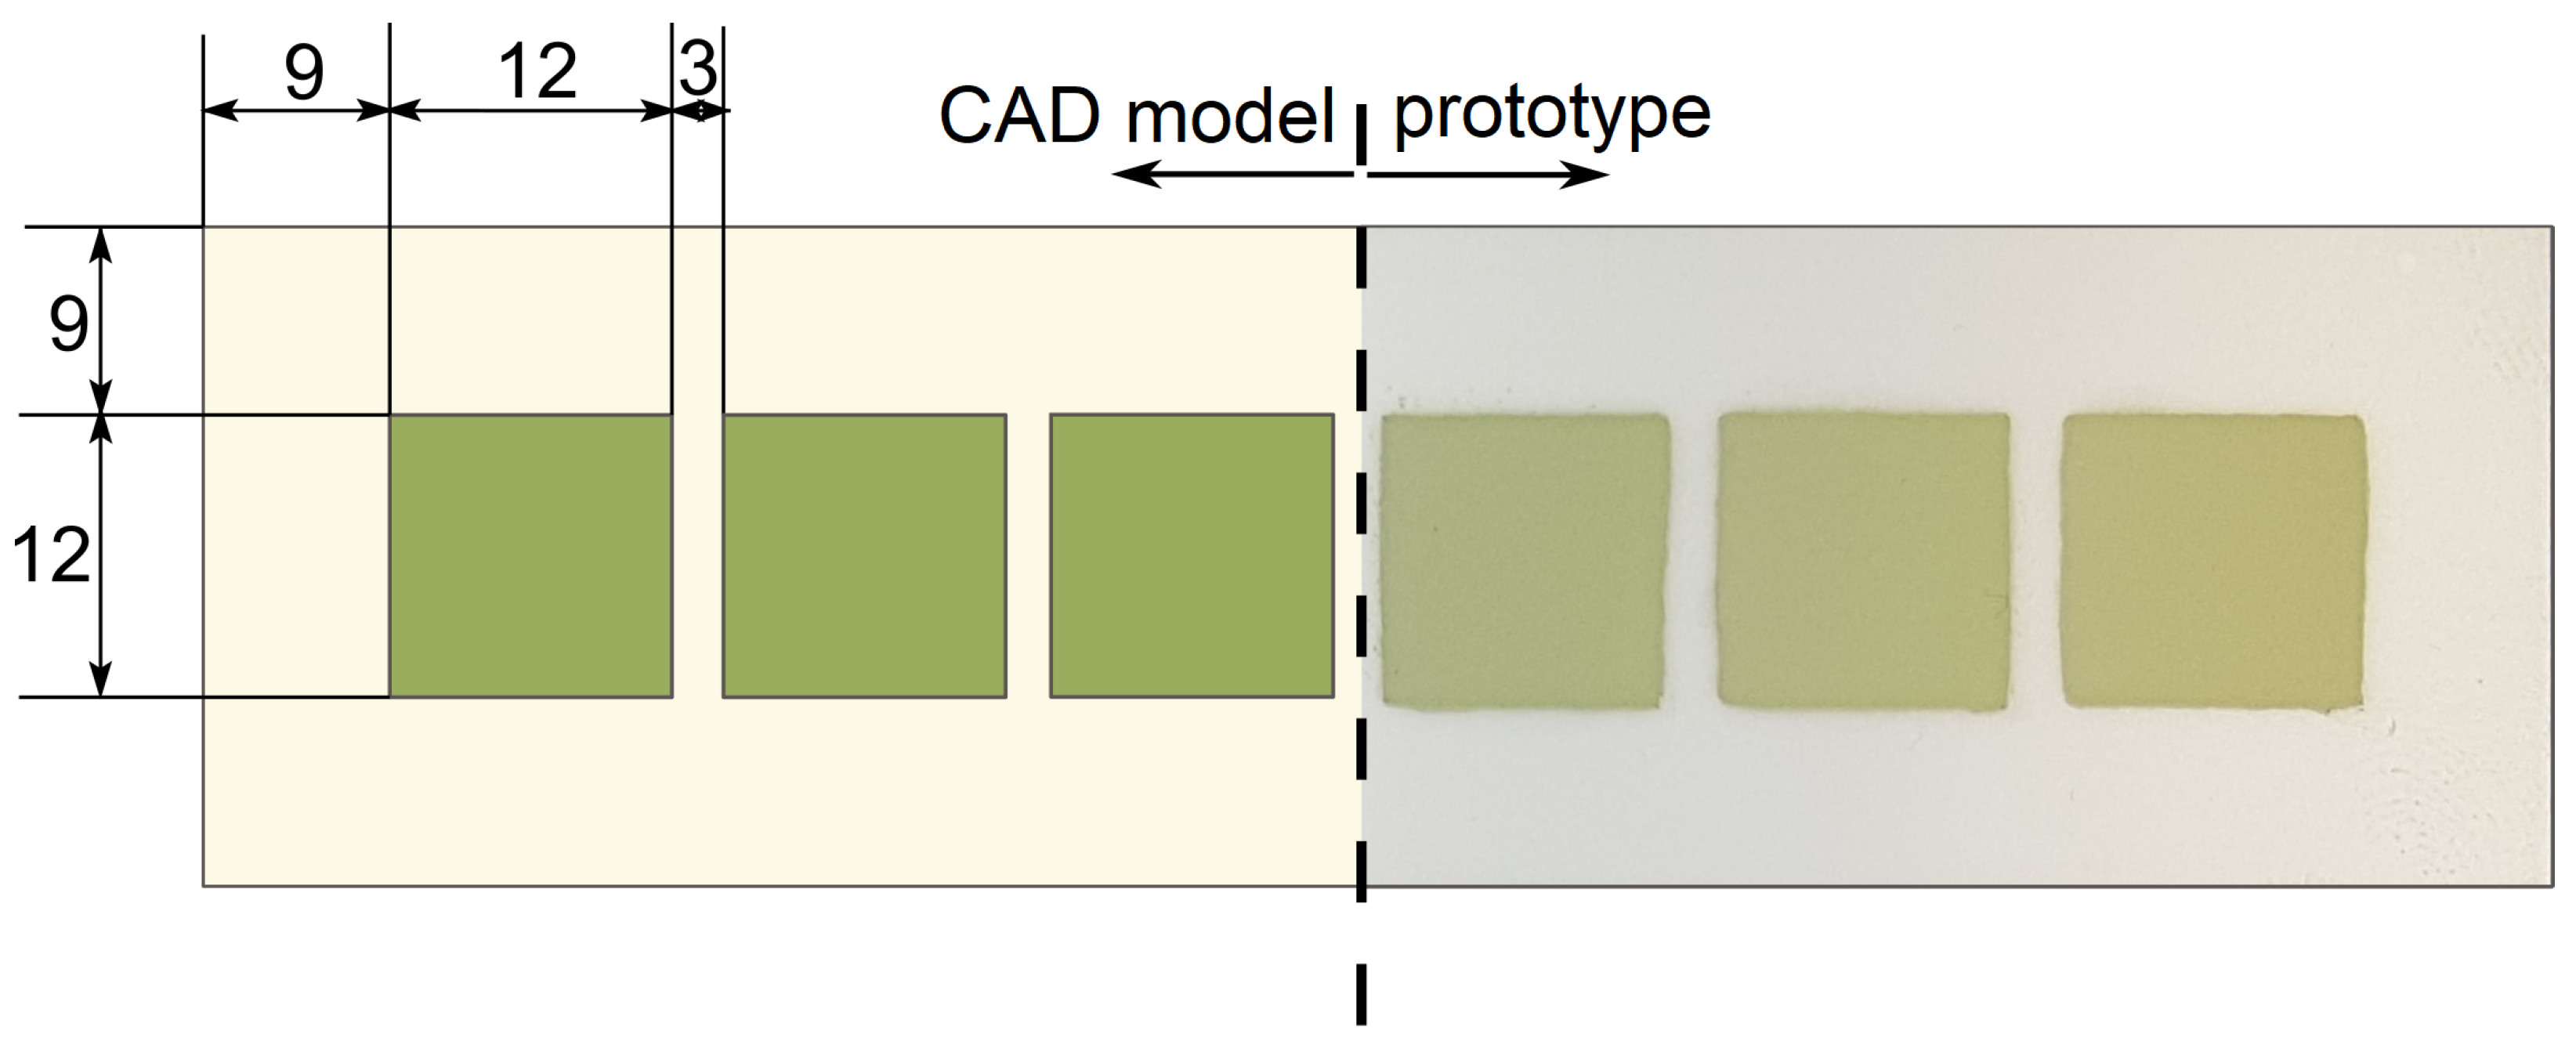
The primary element of the stack is the YSZ plate (Kerafol, Germany) of 105 mm × 30 mm and with 300 μm thickness. It serves as an electrolyte and mechanical support for the entire construction. On both sides of the electrolyte, a series of six electrodes, anodes, and cathodes were screen printed using a steel mesh with 90 μm opening size (170 openings per inch). The electrodes were placed along the geometric axes of the YSZ plate and were distanced with a 3 mm gap between each other and a 9 mm gap from the edge of the plate, as shown in Figure 2.
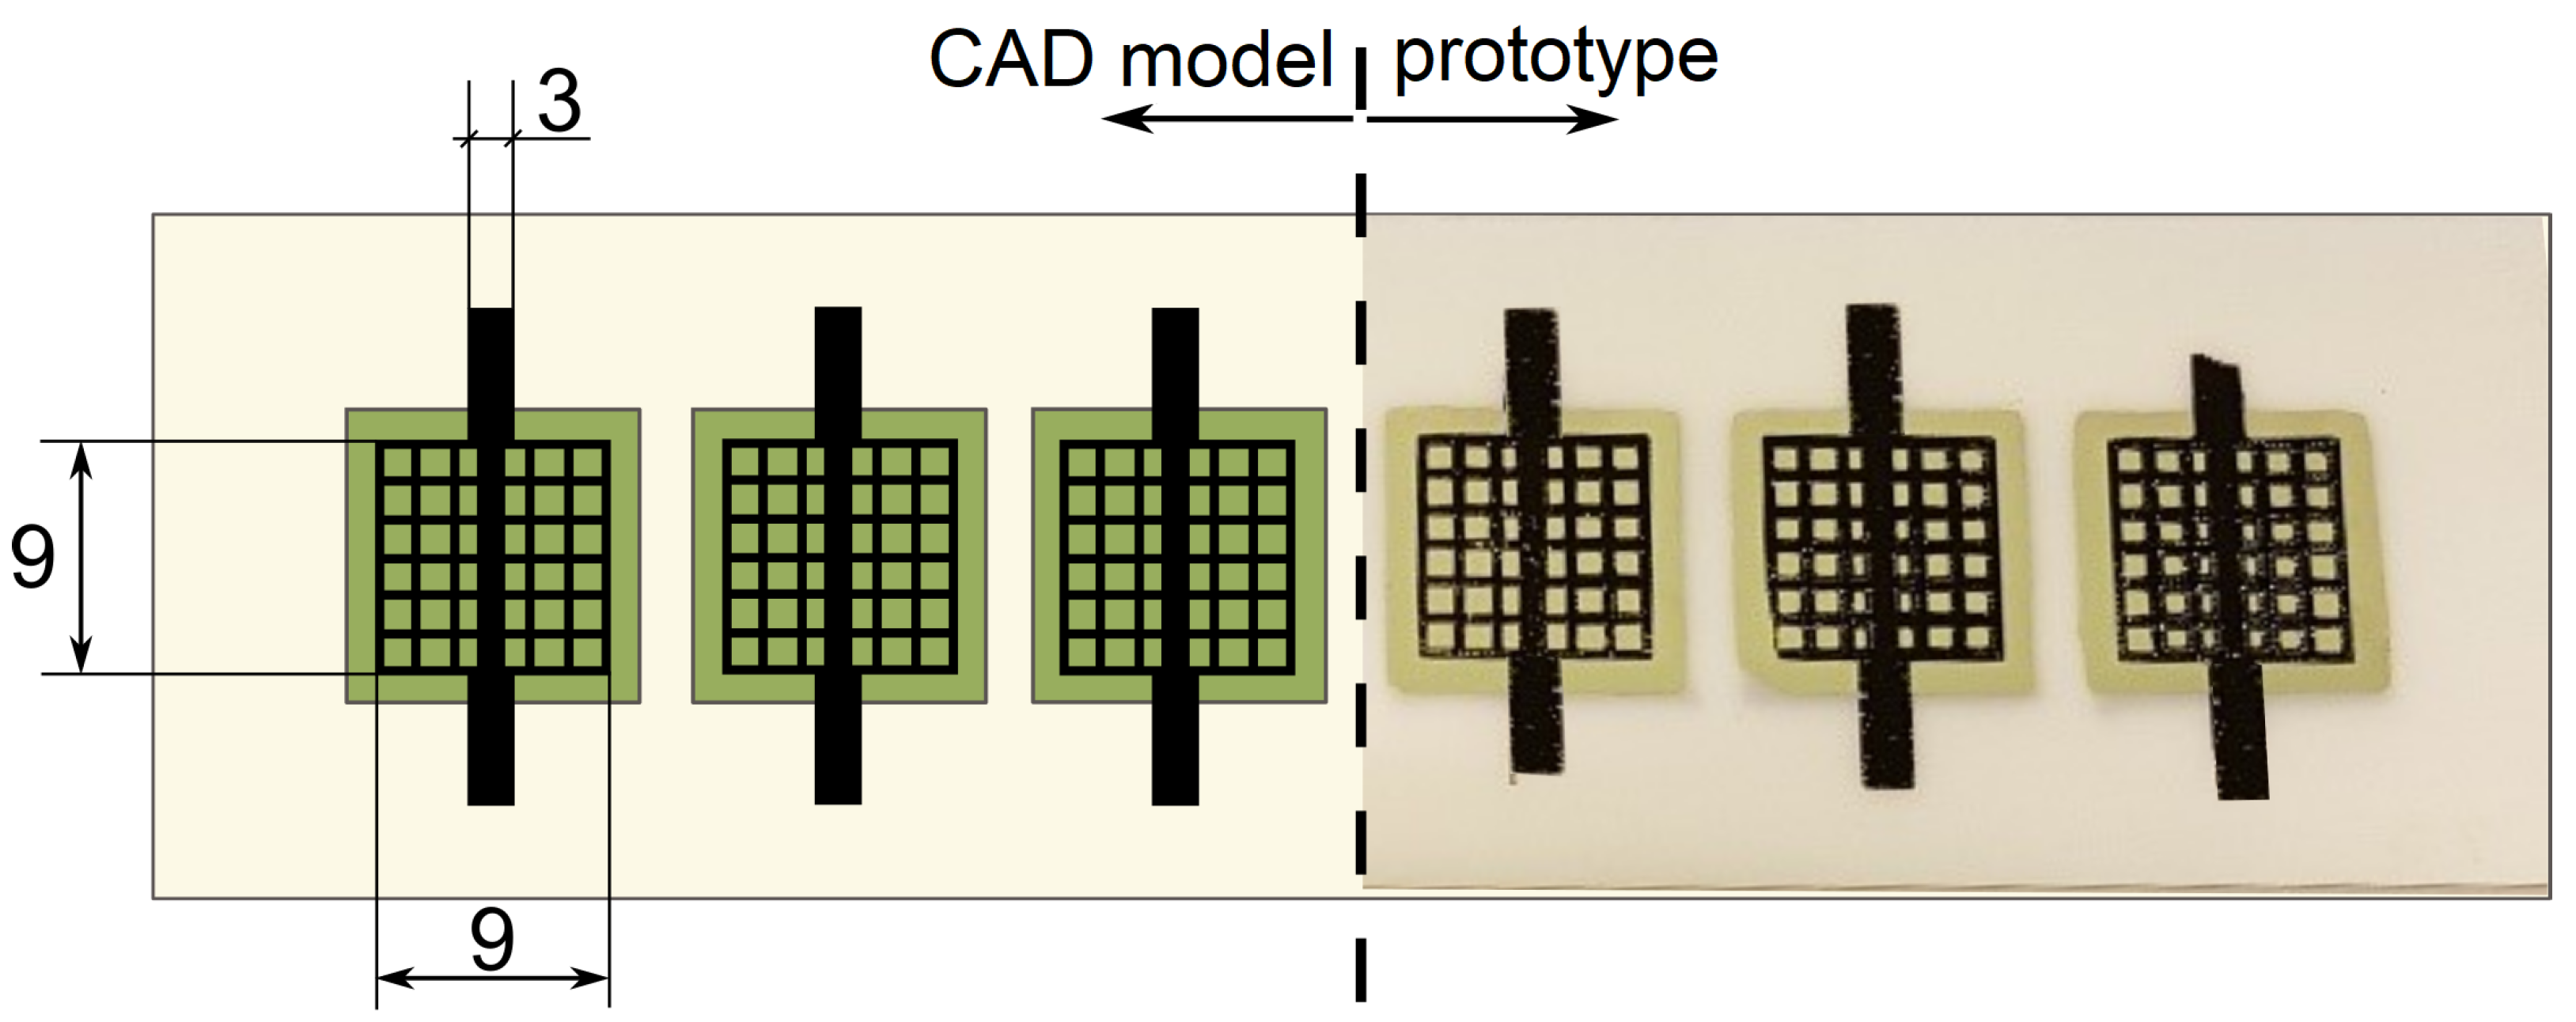
For the anode, which was first printed, a commercial nickel oxide-yttria-stabilized zirconia (NiO-YSZ) paste (ESL ElectroScience, Columbus, OH, USA) Ni/YSZ = 50/50 vol. % was used, while for the cathode, a commercial LSM paste (ESL ElectroScience, Columbus, OH, USA) was used. On each side, three layers of material were deposited, separated by drying at 100 °C for 30 min. After drying, the assembly was sintered at 1300 °C (anode) and 1150 °C (cathode) in an electrical furnace. Note that the anodes were deposited and sintered first, and then the procedure for the cathodes was repeated. Next, using a 170 μm steel mesh with a grid pattern, a silver paste was screen printed on each electrode, as shown in Figure 3.
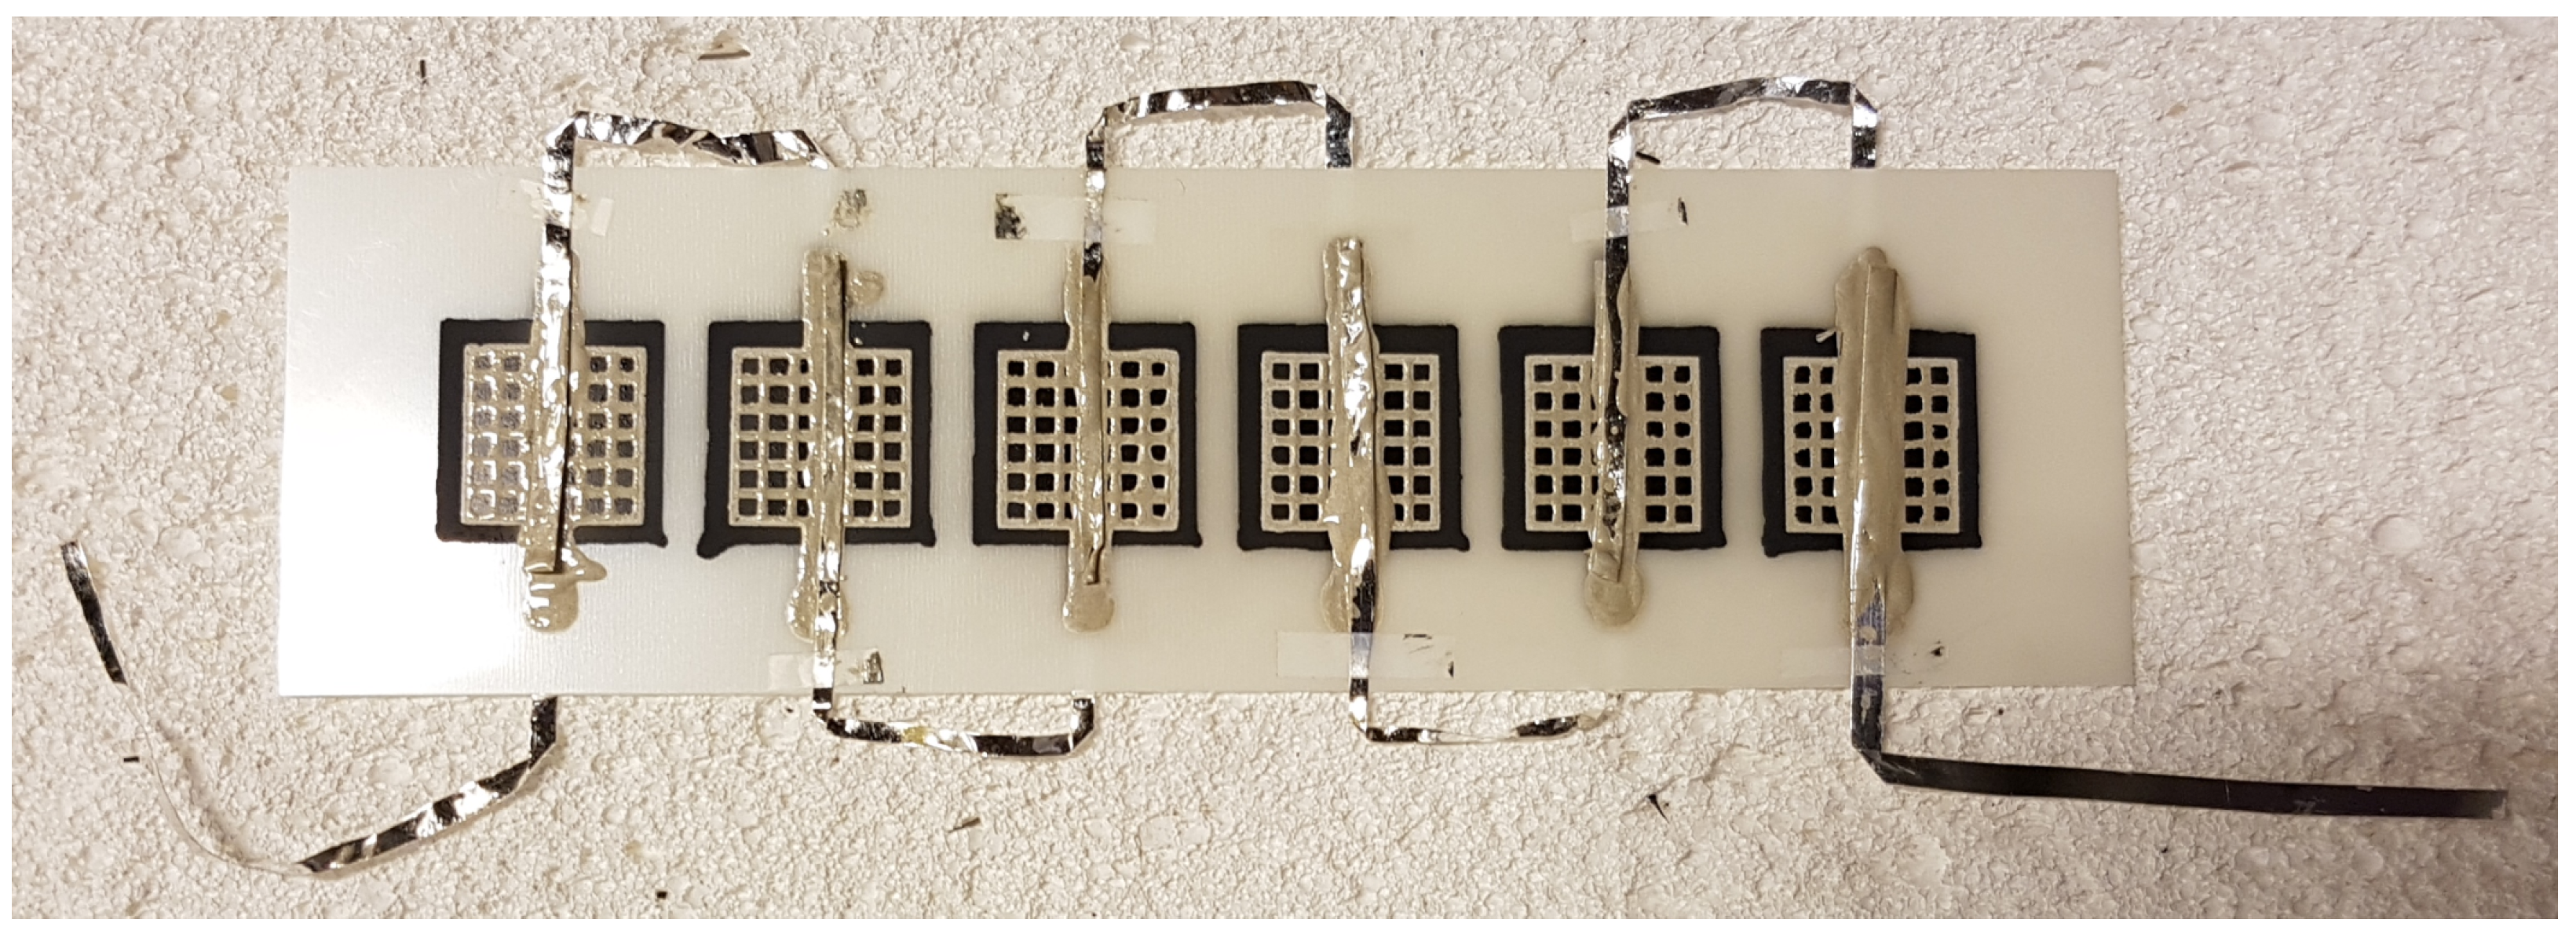
Using 40 mm-long silver stripes, each anode was connected to the consecutive cathode on the opposite side to form a serial electrical connection in the stack. The connection was established by gluing the ends of the stripes onto the mesh with a small amount of silver paste, drying for 1 h at 100 °C and sintering at 900 °C for 15 min (applying a moderate heating/cooling slope of 200 °C/h). As a result, the stack presented in Figure 4 was obtained.
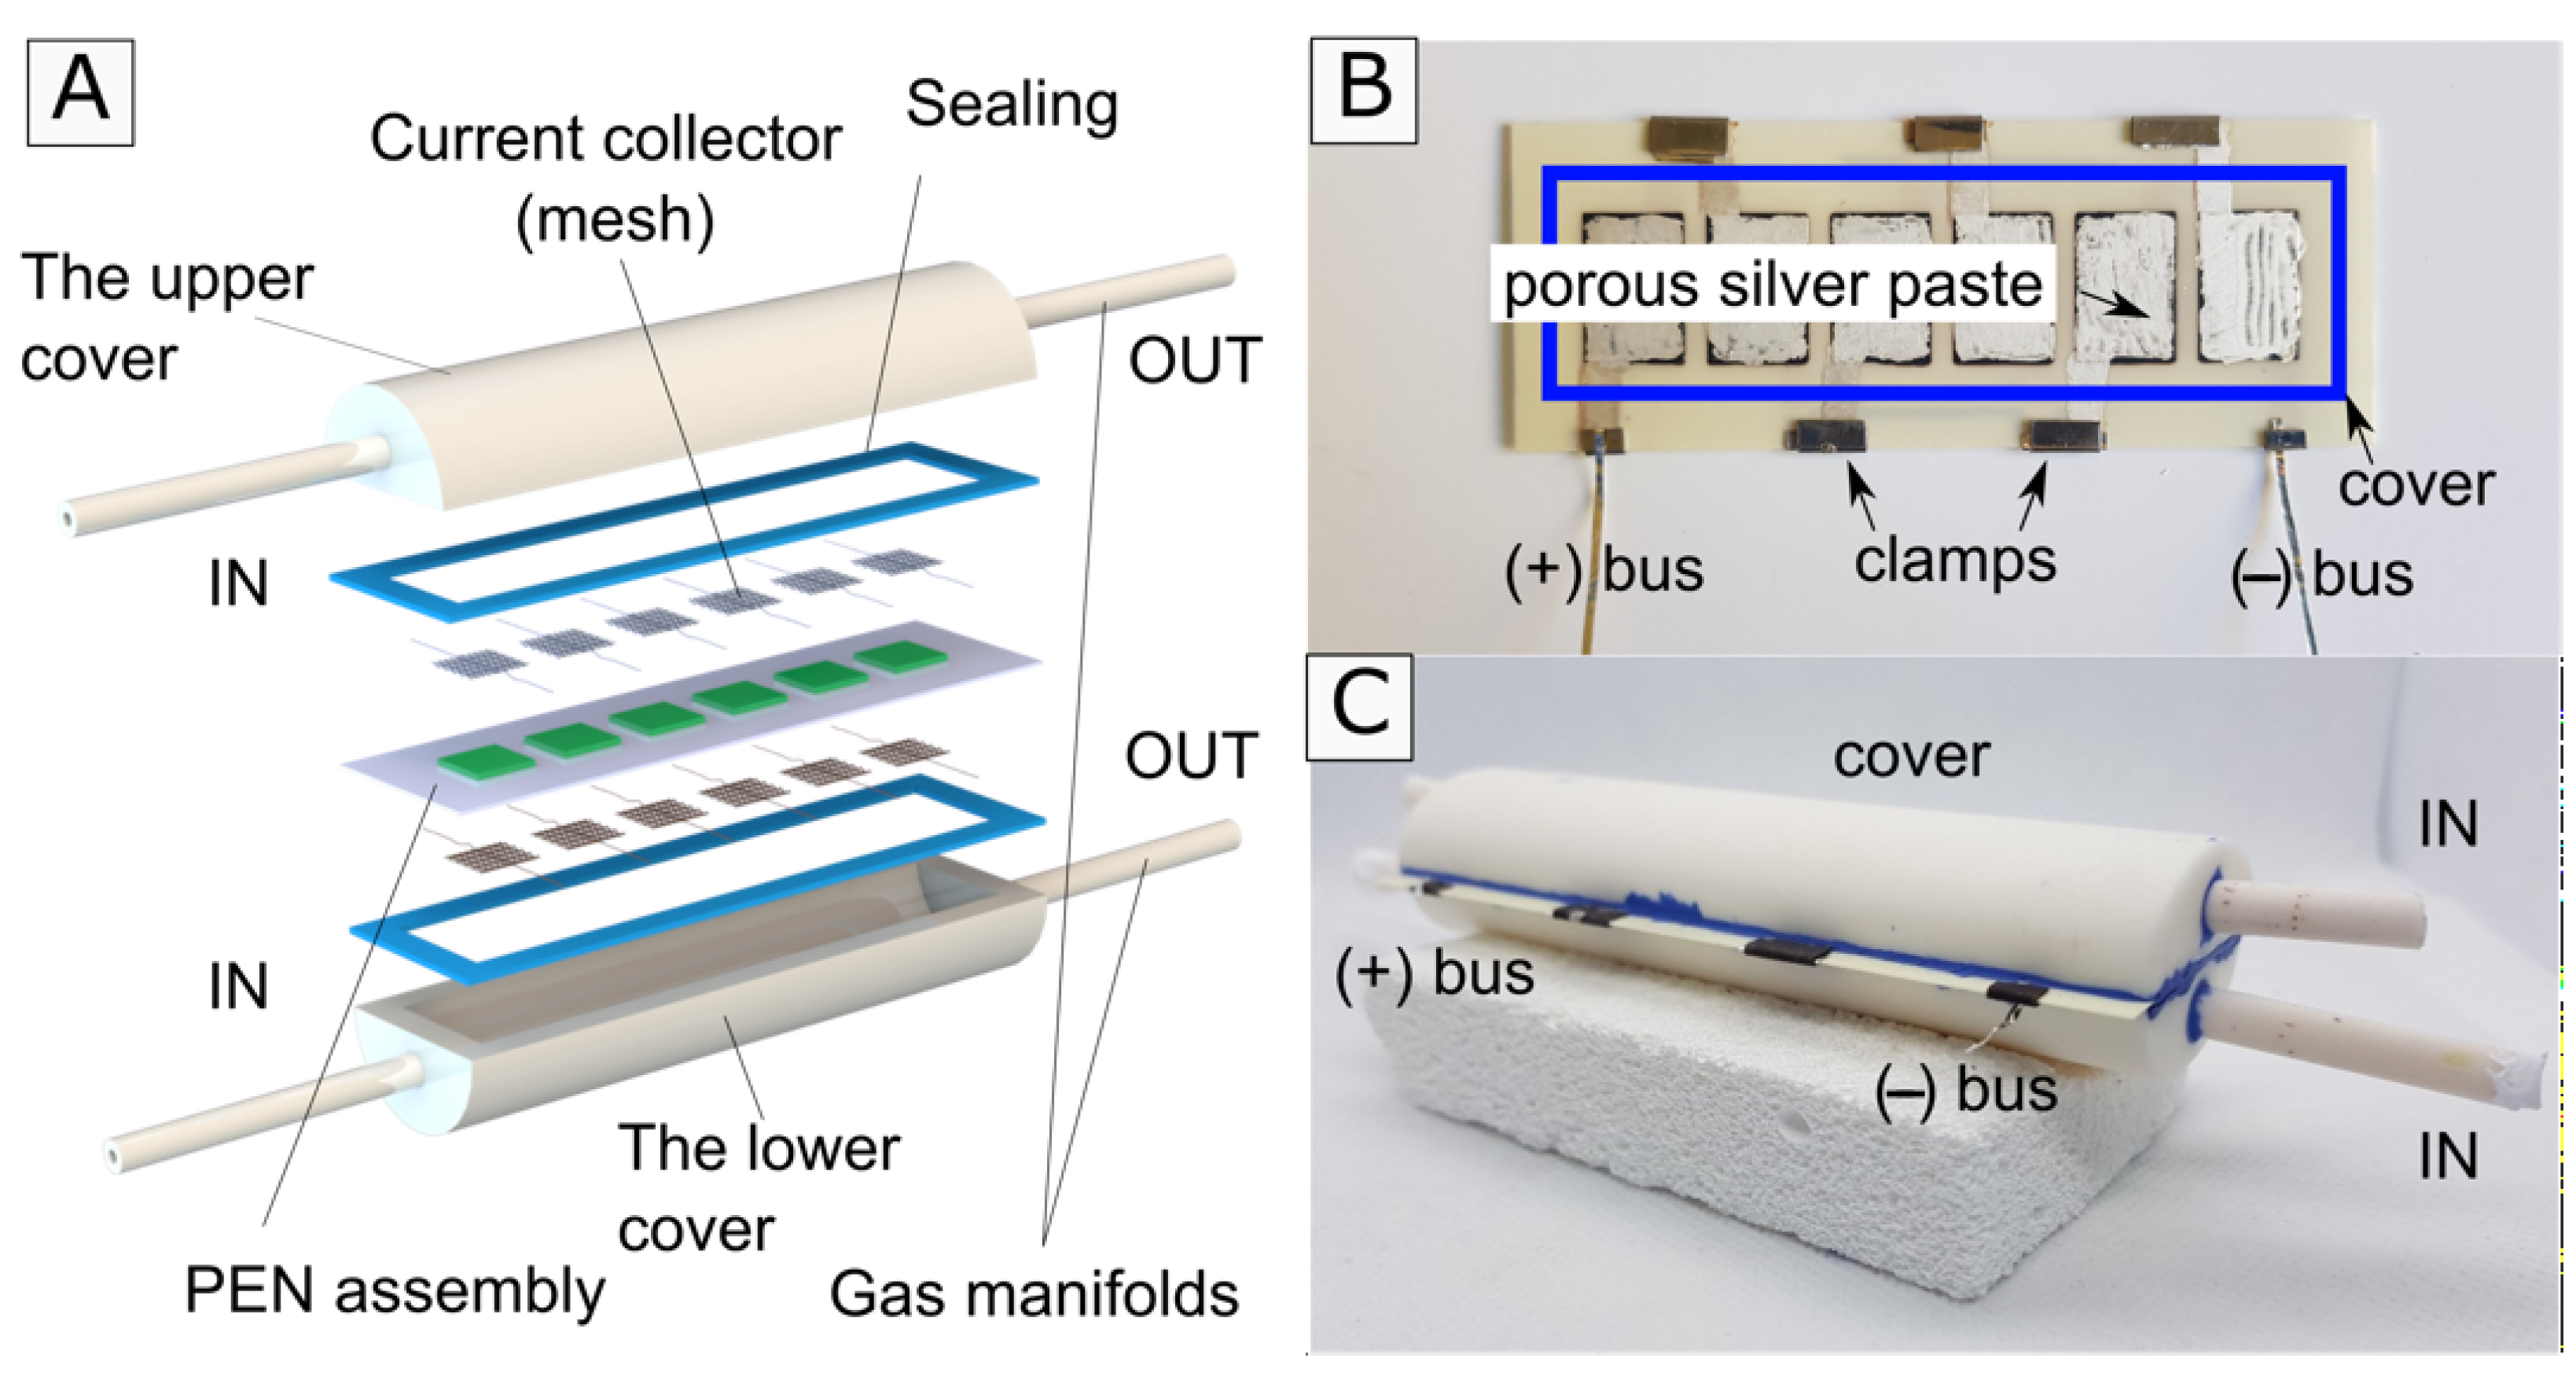
The stack covers, which form the fuel and oxidant channels, were made from aluminum oxide (Al2O3) by Inceramics, Warsaw, Poland. Each cover was a half-cylinder, drained from the inside, with a 5 mm diameter inlet and outlet (see Figure 5A for details). Both cylinders were sealed at the electrolyte border with dielectric sealing paste (ESL EUROPE, Berkshire, UK) as indicated in Figure 5. Inside the inlet and outlet, Al2O3 tubes were mounted and sealed with the same ceramic. The sealing required firing at 900 °C for 15 min.

2.2. Electrochemical Testing

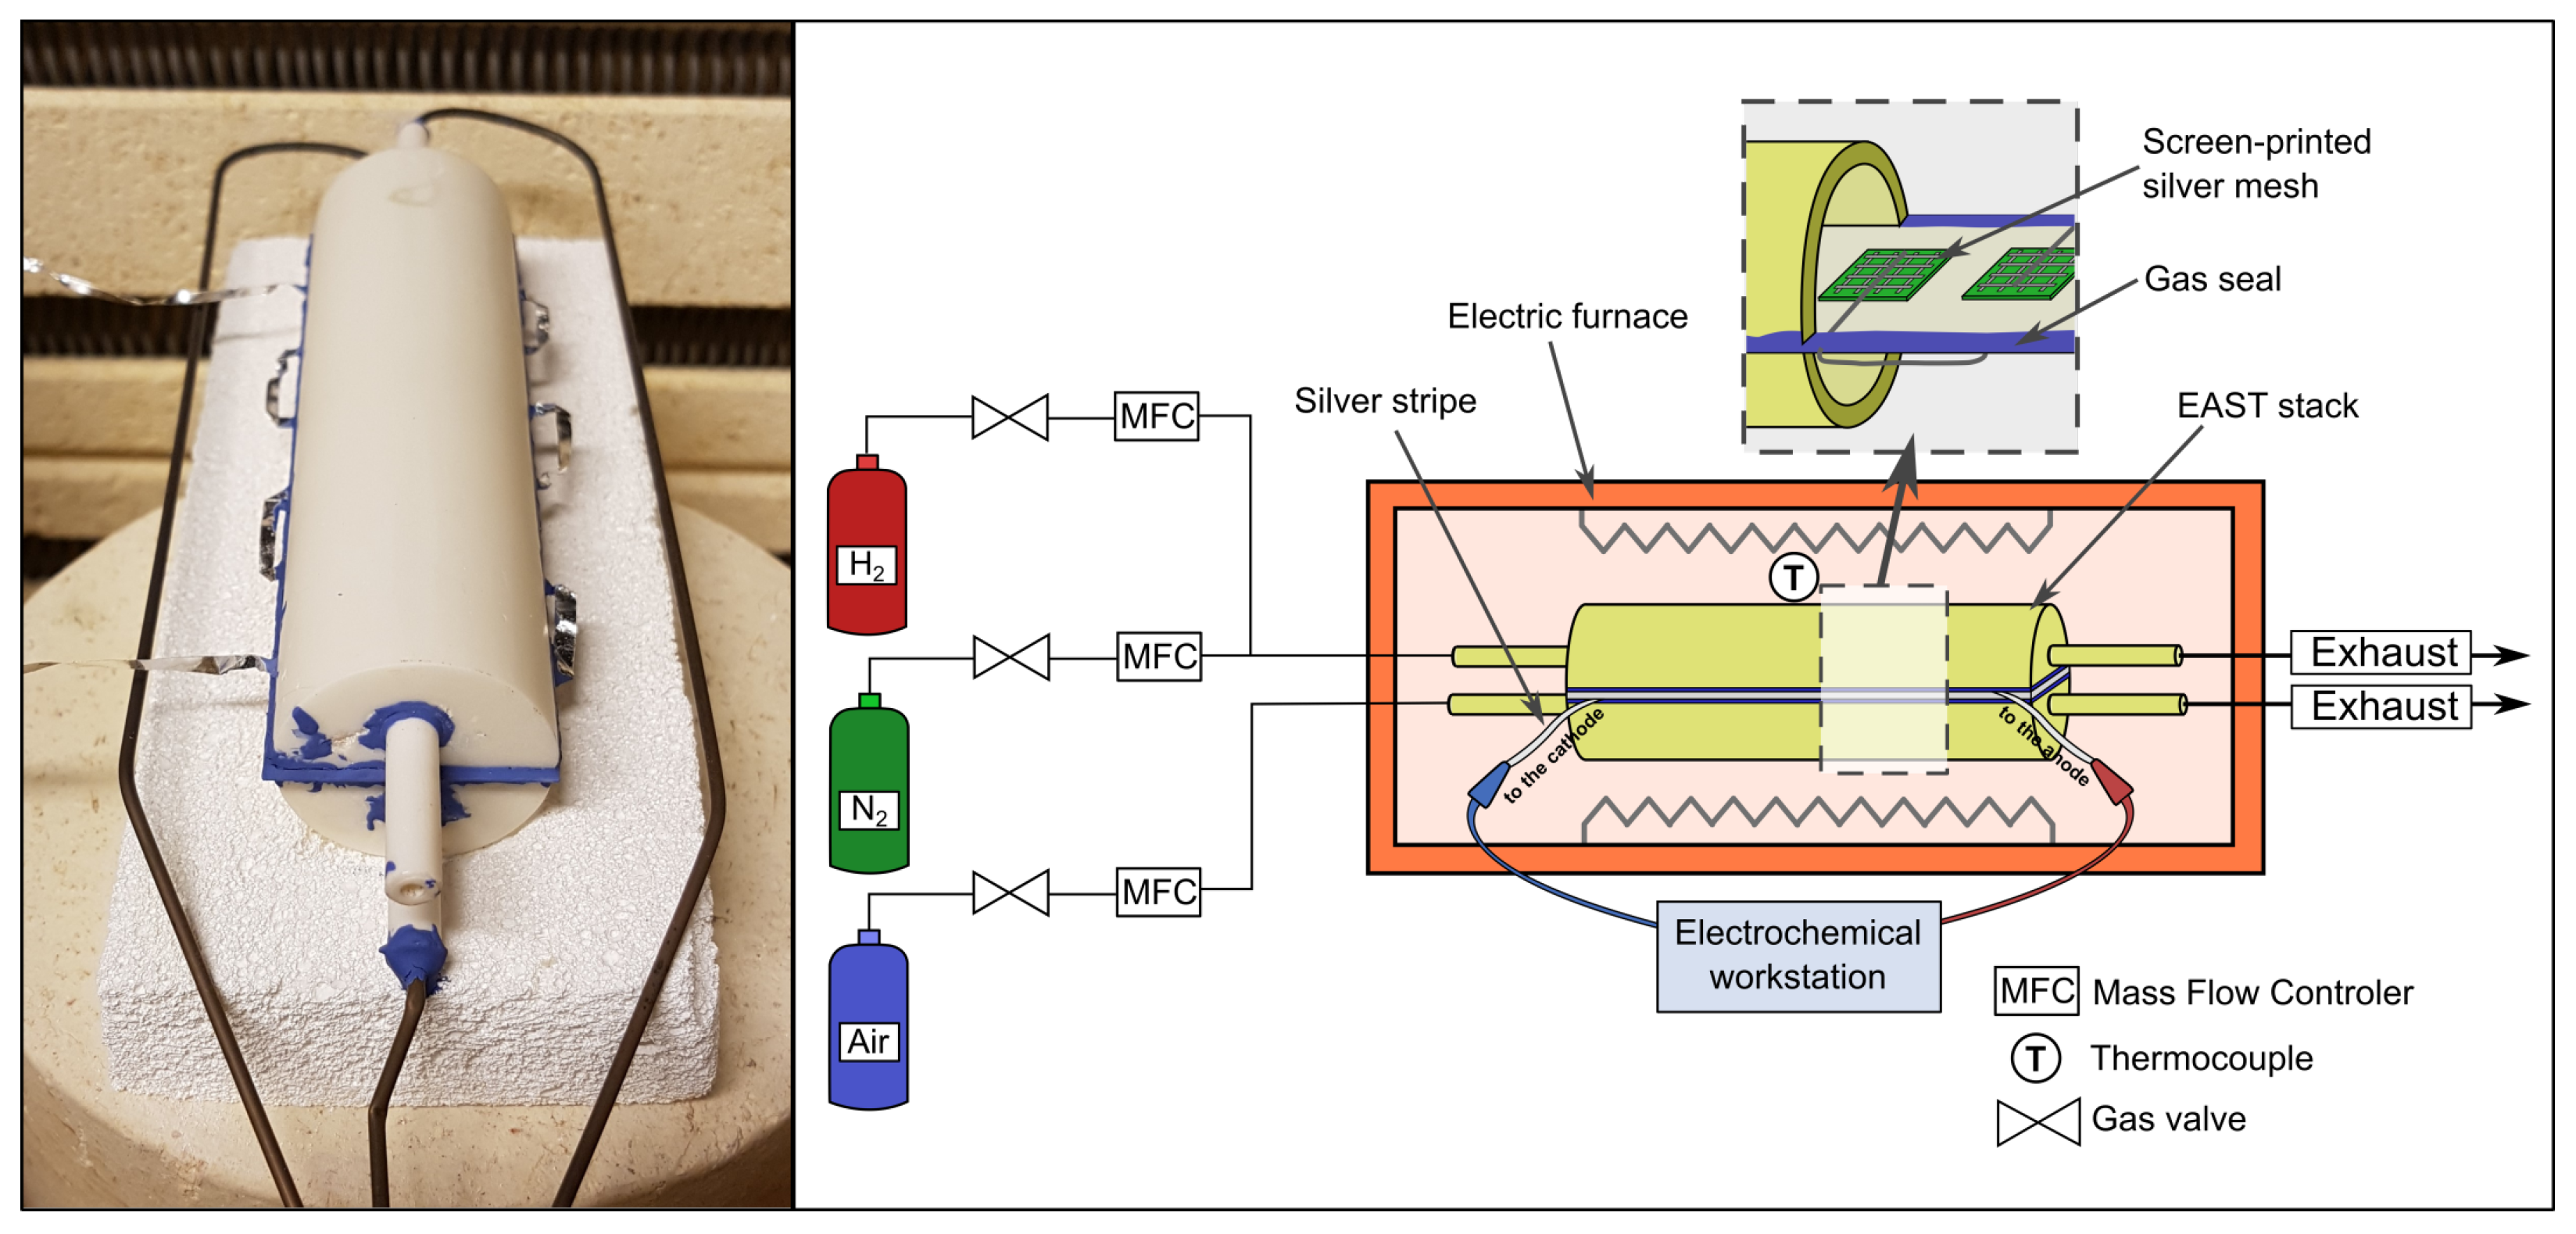
The evaluation of the stack performance required placing it in a testing setup and heating it to the operating temperature. The illustration of the complete testing setup is presented in Figure 6. Stainless steel gas pipes were installed in the inlets and outlets of the alumina tubes to provide gases from the gas delivery system. The vicinity of the contact area between the gas pipes and alumina tubes was sealed with dielectric paste.
During heat-up, the anode reduction process was conducted. Initially, only nitrogen and air were supplied to the stack. At 600 °C, the hydrogen started to gradually be introduced up to 50 % of the total volumetric flow of 200 sccm. This flow was kept constant for 15 min after reaching 850 °C until the open circuit voltage (OCV) stabilized at 5.5 V. The OCV was lower than expected; however, it remained stable, so the experiment could be continued. Electrochemical tests were carried out at two furnace temperatures, 850 °C and 900 °C, at total fuel and oxidant flow rates of 200 sccm and at three hydrogen/nitrogen (H2/N2) ratios: 50/50, 75/25, and 100/0. Dry hydrogen (without steam) was used for the experiment. Each time, after setting new operating conditions, the system was stabilized for 5 min.

3. Mathematical Modeling of Transport Phenomena

3.1. Computational Domain and Modeling Assumptions

The computational domain of the mathematical model is represented by the three-dimensional geometry designed using the Autodesk, Inc., Autodesk Inventor Professional, v.2020 software. The geometry contains six pairs of electrodes with a single electrolyte support, a simplified current collector for each electrode, insulators between the electrolyte and current collectors, and two fluid domains for the anode and cathode channels. The fluid domain is the inner space of the sealed Al2O3 covers. To meet the requirements of the Fuel Cell and Electrolysis Add-on Module, the electrodes were designed in two parts, the catalyst layers, which are in contact with the electrolyte, with a 34 μm thickness, and the diffusion layers on top, with a 66 μm thickness. The current collectors are 12 mm × 9 mm and 33 μm thick, with side contact with the diffusion layers, and are insulated from the electrolyte by electrical insulators. The other geometric dimensions agree with the experimental setup. The stretched scheme of the computational domain is shown in Figure 7.
The mathematical model contains a set of partial differential equations that describe the transport phenomena in the fluid and solid zones. Since the Reynolds number does not exceed 200 in all the performed simulations, the flow is considered as laminar, solved using the Direct Numerical Simulation method. All the fluids are solved as Newtonian. Several assumptions were made during the modeling. The model assumes the steady-state behavior of the stack and the incompressible fluid characteristics. Furthermore, the gravitation and energy dissipation were omitted.

3.2. Mathematical Description of Fluid Zones

The fluid zones contain a fuel channel filled with hydrogen or a hydrogen-nitrogen mixture, and an air channel filled with an oxygen-nitrogen mixture.
The mass transport in the fluid zones (fuel and air channels) is described by the steady-state mass conservation equation:
· ρ v = 0 ,
where ρ ( k g   m 3 ) is the density and v ( m   s 1 ) is the velocity vector.
In the fuel and air channels, an equation describing the conservation of momentum is also solved, written as follows:
· ρ v v = p + τ ¯ ¯ ,
where p ( Pa ) is the static pressure and τ ¯ ¯ ( Pa ) is the viscous stress tensor. The stress tensor τ ¯ ¯ ( Pa ) in the assumption of the incompressible flow with a constant density and constant dynamic viscosity μ ( Pa s ), can be written as follows:
  ·   τ ¯ ¯ = μ 2 v .
The species conservation equation, which describes each component of the gas mixture under steady-state conditions, is given as follows:
  ·   ρ v Y i =   ·   J i ,
where Y i (-) is the species i mass fraction.
In the fluid zones, the steady-state energy equation is given in the following form:
  ·   v ρ h =   ·   k eff T i h i J i
where h ( J   k g 1 ) is the specific enthalpy, k eff ( W   m 1   K 1 ) is the effective thermal conductivity of a fluid mixture, and T ( K ) is the temperature.
J i ( k g   m 2   s 1 ) is the diffusion flux of species i, calculated using the full multicomponent diffusion method using the Stefan–Maxwell equations, given as follows:
J i = i ρ D i Y i ρ D i , t T ,
where D i , t ( m 2   s 1   K 1 ) represents the thermal diffusion coefficient of each species and D i ( m 2   s 1 ) represents the diffusion coefficients of Fick’s law.

3.3. Mathematical Description of Solid and Porous Zones

The mass transport in the porous zones (anodes and cathodes) is described by the steady-state mass conservation equation:
  ·   ρ ε v = S p ,
where ε (-) represents porosity and S p ( k g   m 3   s 1 ) is the source term of mass in the anode and cathode areas. The product ε v is the seepage velocity. The source or sink is defined as the sum of the reactants consumed and the products generated through the electrochemical reactions in the SOFC. The sum is written as follows:
S p an = S H 2 + S H 2 O ,
S p cat = S O 2 .
The species conservation equation that describes each component of the gas mixture under steady-state conditions in the porous areas is given as follows:
  ·   ρ ε v Y i =   ·   J i , eff + S i ,
where
J i , eff = i ρ D i , eff Y i ρ D i , t T ,
where D i , eff ( m 2   s 2 ) is the effective mass diffusion coefficient of species i in the mixture, representing the correction method used to include the porous effect, computed as follows:
D i , eff = ε 1.5 D i .
S i ( k g   m 3   s 1 ) is the term sink and source of the species rates, which describes the consumption of the reactants and the product generation rates due to the electrochemical reactions in the SOFC, derived using the Faraday laws of electrolysis as follows:
S O 2 = j 4 F M O 2 ,
S H 2 = j 2 F M H 2 ,
S H 2 O = j 2 F M H 2 O ,
where j ( A / m 3 ) is the volumetric transfer current density (see Equations (21) and (22)), F ( 9.65 × 10 4   C   mol 1 ) is the Faraday constant and M i ( k g   mol 1 ) is the molar mass of the species i involved in the electrochemical reaction.
In the porous areas, an equation describing the conservation of momentum is written as follows:
  ·   ρ v v = p + τ ¯ ¯ + S ,
where S ( k g   m 2   s 2 ) is the source term, computing the pressure drop caused by the viscous and inertial pressure drop. The value of the inertial loss is neglectable compared to the viscous loss value, so the source term for the homogeneous porous electrodes can be written as follows:
S = μ β ε v C β ρ ε 2 v v ,
where β ( m 2 ) is the permeability and C (-) is the internal momentum resistance factor.
In the porous electrodes and non-porous conductive solids, the electron transport potential equation in the following form is solved:
  ·   σ el ϕ el + j = 0 ,
where σ el ( S   m 1 ) is the electrical conductivity (see Table 1), ϕ el ( V ) is the electron-conducting phase potential and j ( A   m 3 ) is the volumetric transfer current density, which is the potential source term. For the anodes, j = j an and, for the cathodes, j = + j cat (see Equations (21) and (22)).
In the ion-conducting phases (electrodes and electrolyte), the potential equation is solved in the following form:
  ·   σ ion ϕ ion + j = 0 ,
where ϕ ion ( V ) is the ionic potential, j ( A   m 3 ) is on the anode side, and the cathode side is j = + j an and j = j cat , respectively. For the electrolyte, j = 0 . σ ion is the ionic conductivity and the ion conductive areas are written as follows [33]:
σ ion = 100 0.3685 + 0.002838 e 10 , 300 / T .
The volumetric transfer current density j ( A   m 3 ) is described by the Butler–Volmer equation for the anode and for the cathode, respectively:
j an = ζ TPB i an eq X H 2 X H 2 , ref γ an e α an a F η an / R T e α an c F η an / R T ,
j cat = ζ DPB i cat eq X O 2 X O 2 , ref γ cat e α cat c F η cat / R T e α cat a F η cat / R T ,
where ζ TPB ( m   m 3 ) is the triple phase boundary length density, ζ DPB ( m 2   m 3 ) is the double phase boundary length density, i an eq ( A   m 1 ) is the anode equilibrium exchange current, i cat eq ( A   m 2 ) is the cathode equilibrium exchange current, X i (kmol   m 3 ) is the local concentration of the species and X i , ref (kmol m 3 ) is the reference value, γ i (-) is the concentration dependence, F ( 9.65 × 10 7   C mol 1 ) is the Faraday constant, and R ( 8.314   J   K 1 mol 1 ) is the universal gas constant. Additionally, α an a (-) is the anodic (forward reaction) transfer coefficient for the anode, α an c (-) is the cathodic (backward reaction) transfer coefficient for the anode, α cat a (-) is the anodic (forward reaction) transfer coefficient for the cathode, and α cat c (-) is the cathodic (backward reaction) transfer coefficient for cathode; the nomenclature is based on a simple electron-transfer reaction R O + n e [34].
The difference between the electron-conducting phase potential and the ion-conducting phase potential is the local surface overpotential η ( V ), for the anode and cathode side, respectively, given in the following form:
η an = ϕ el ϕ ion ,
η cat = ϕ el ϕ ion ϕ OCV ,
where ϕ OCV ( V ) is the open-circuit voltage. These equations are derived from the standard definition of the overpotential as the difference between the equilibrium electrode potential and the actual potential. However, to calculate the equilibrium potential, knowledge of the chemical potential of oxygen ions is necessary. Therefore, the actual local potentials of the conducting phases are shifted by a constant reference amount, which does not change the potential profile but removes the need to introduce a chemical potential of oxygen anions in the equations. Here, the following shifts are adopted:
ϕ el , an = φ el , an + 1 2 F μ ^ H 2 + μ ^ O 2 μ ^ H 2 O
ϕ el , cat = φ el , cat + 1 2 F μ ^ H 2 + μ ^ O 2 μ ^ H 2 O
ϕ ion = φ ion
where φ ( V ) is an actual non-shifted potential of an appropriate phase and μ ^ i ( J   mol 1 ) is a chemical potential of species i. The cathode overpotential is assumed to be negative.
The steady-state energy equation that describes the heat transport within the porous and solid zones is written in the following form:
  ·   ε v ρ h =   ·   ε k eff + 1 ε k s T i h i J i + S h ,
where k s ( W   m 1   K 1 ) is the solid thermal conductivity and S h ( W   m 3 ) is the total heat source. In the solid zones, the porosity is set to zero. The heat source is not equal to zero in the catalyst layers and the electrolyte, which is calculated as follows:
S h = j h react 2 F + j η + i 2 σ ,
where h react ( J   mol 1 ) is the net enthalpy change due to the electrochemical reactions and i ( A   mol 2 ) is the current density.

3.4. Boundary Conditions

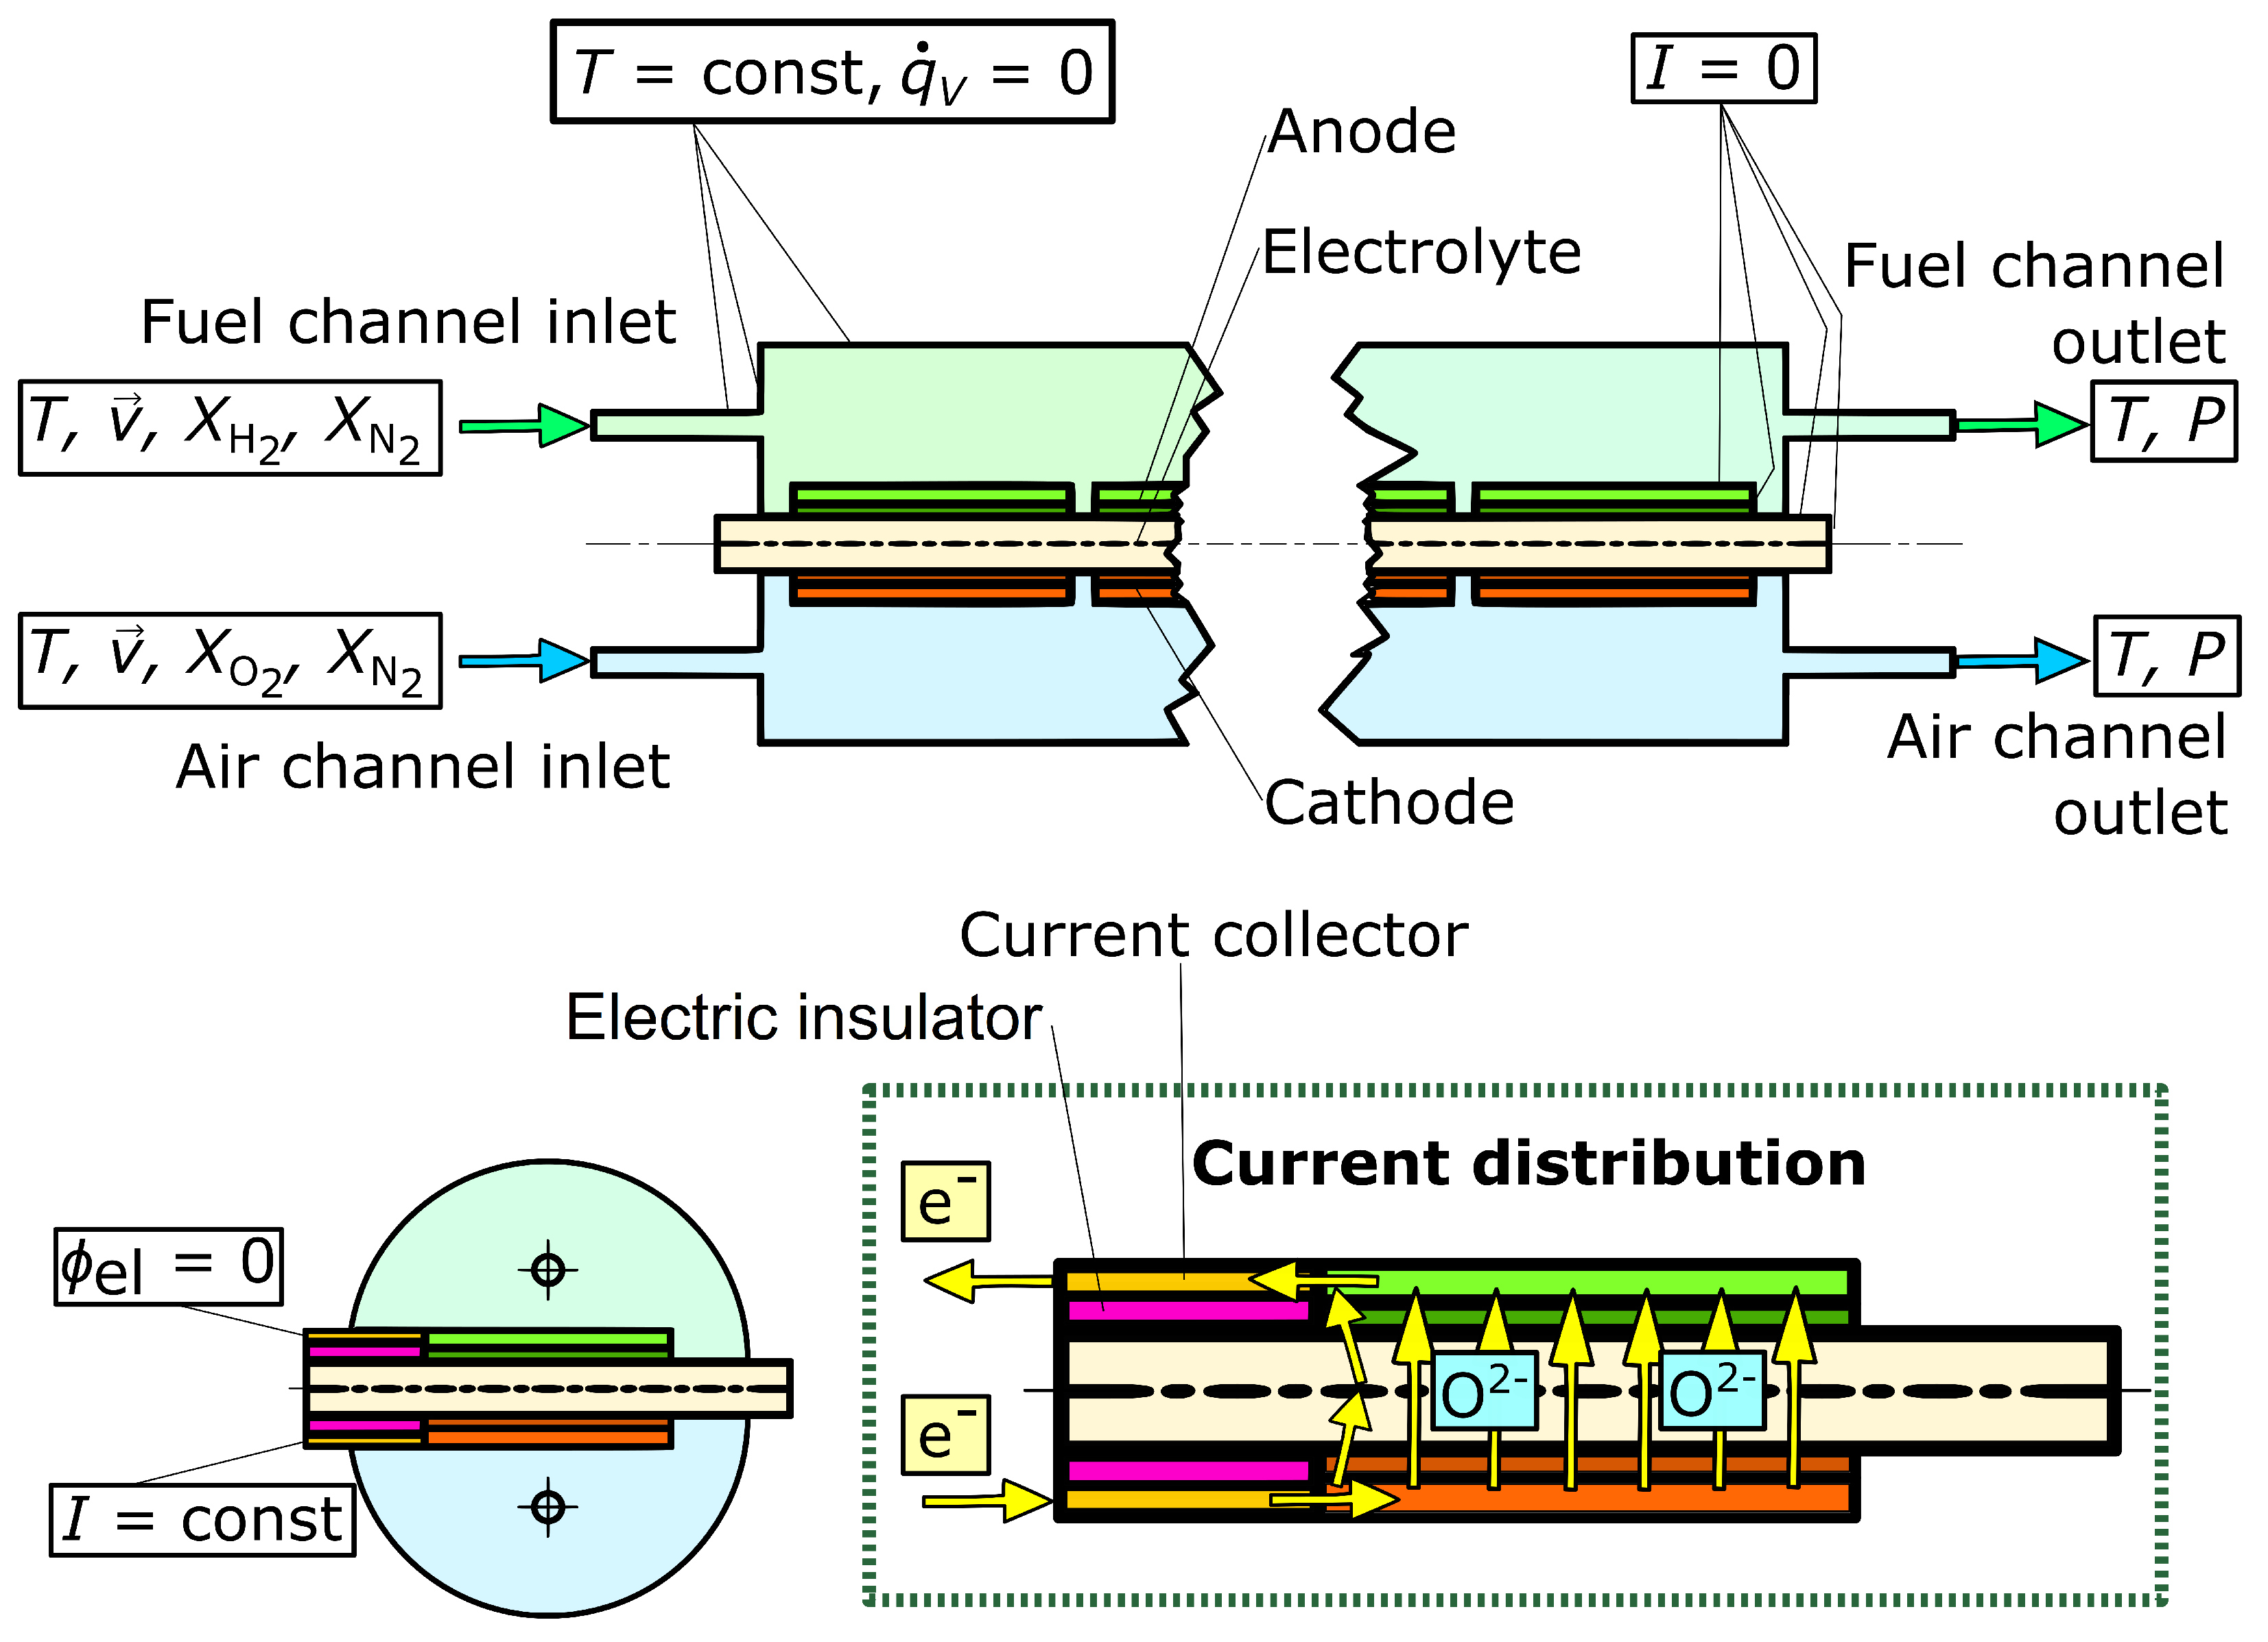
In Figure 8, the main boundary conditions are presented. The Al2O3 covers were replaced by the Dirichlet boundary condition on the inner walls of the covers, applying the constant temperature of the surroundings, the temperature set on the furnace controller in the experiment. The inlets with an established velocity and temperature, with a co-flow of fuel and air, were used. The outlets were fixed as pressure outlets with constant atmospheric pressure and furnace temperature. For the current distribution, an outer wall of each current collector was set as external contacts, as shown in the current distribution scheme in Figure 8. On the anode side, the boundary condition of the constant potential was applied. On the cathode side, a constant current density flux was established. On the rest of the outer walls of the solid zones, zero-flux conditions were applied in terms of electric current.
The electrochemical process is a series of phenomena that occur in the stack of planar cells. The electrochemical reactions that occur on the cathode side can be written as follows:
1 2 O 2 + 2 e O 2 .
The equation describes the process, where the oxygen particles from the air fed to the channel join the electrons present in the cathode, converting to the oxygen ions—the form which could be transported through the electrolyte to the anode, where the reaction can be written as follows:
H 2 + O 2 H 2 O + 2 e ,
while the overall reaction can be written as:
H 2 + 1 2 O 2 H 2 O .
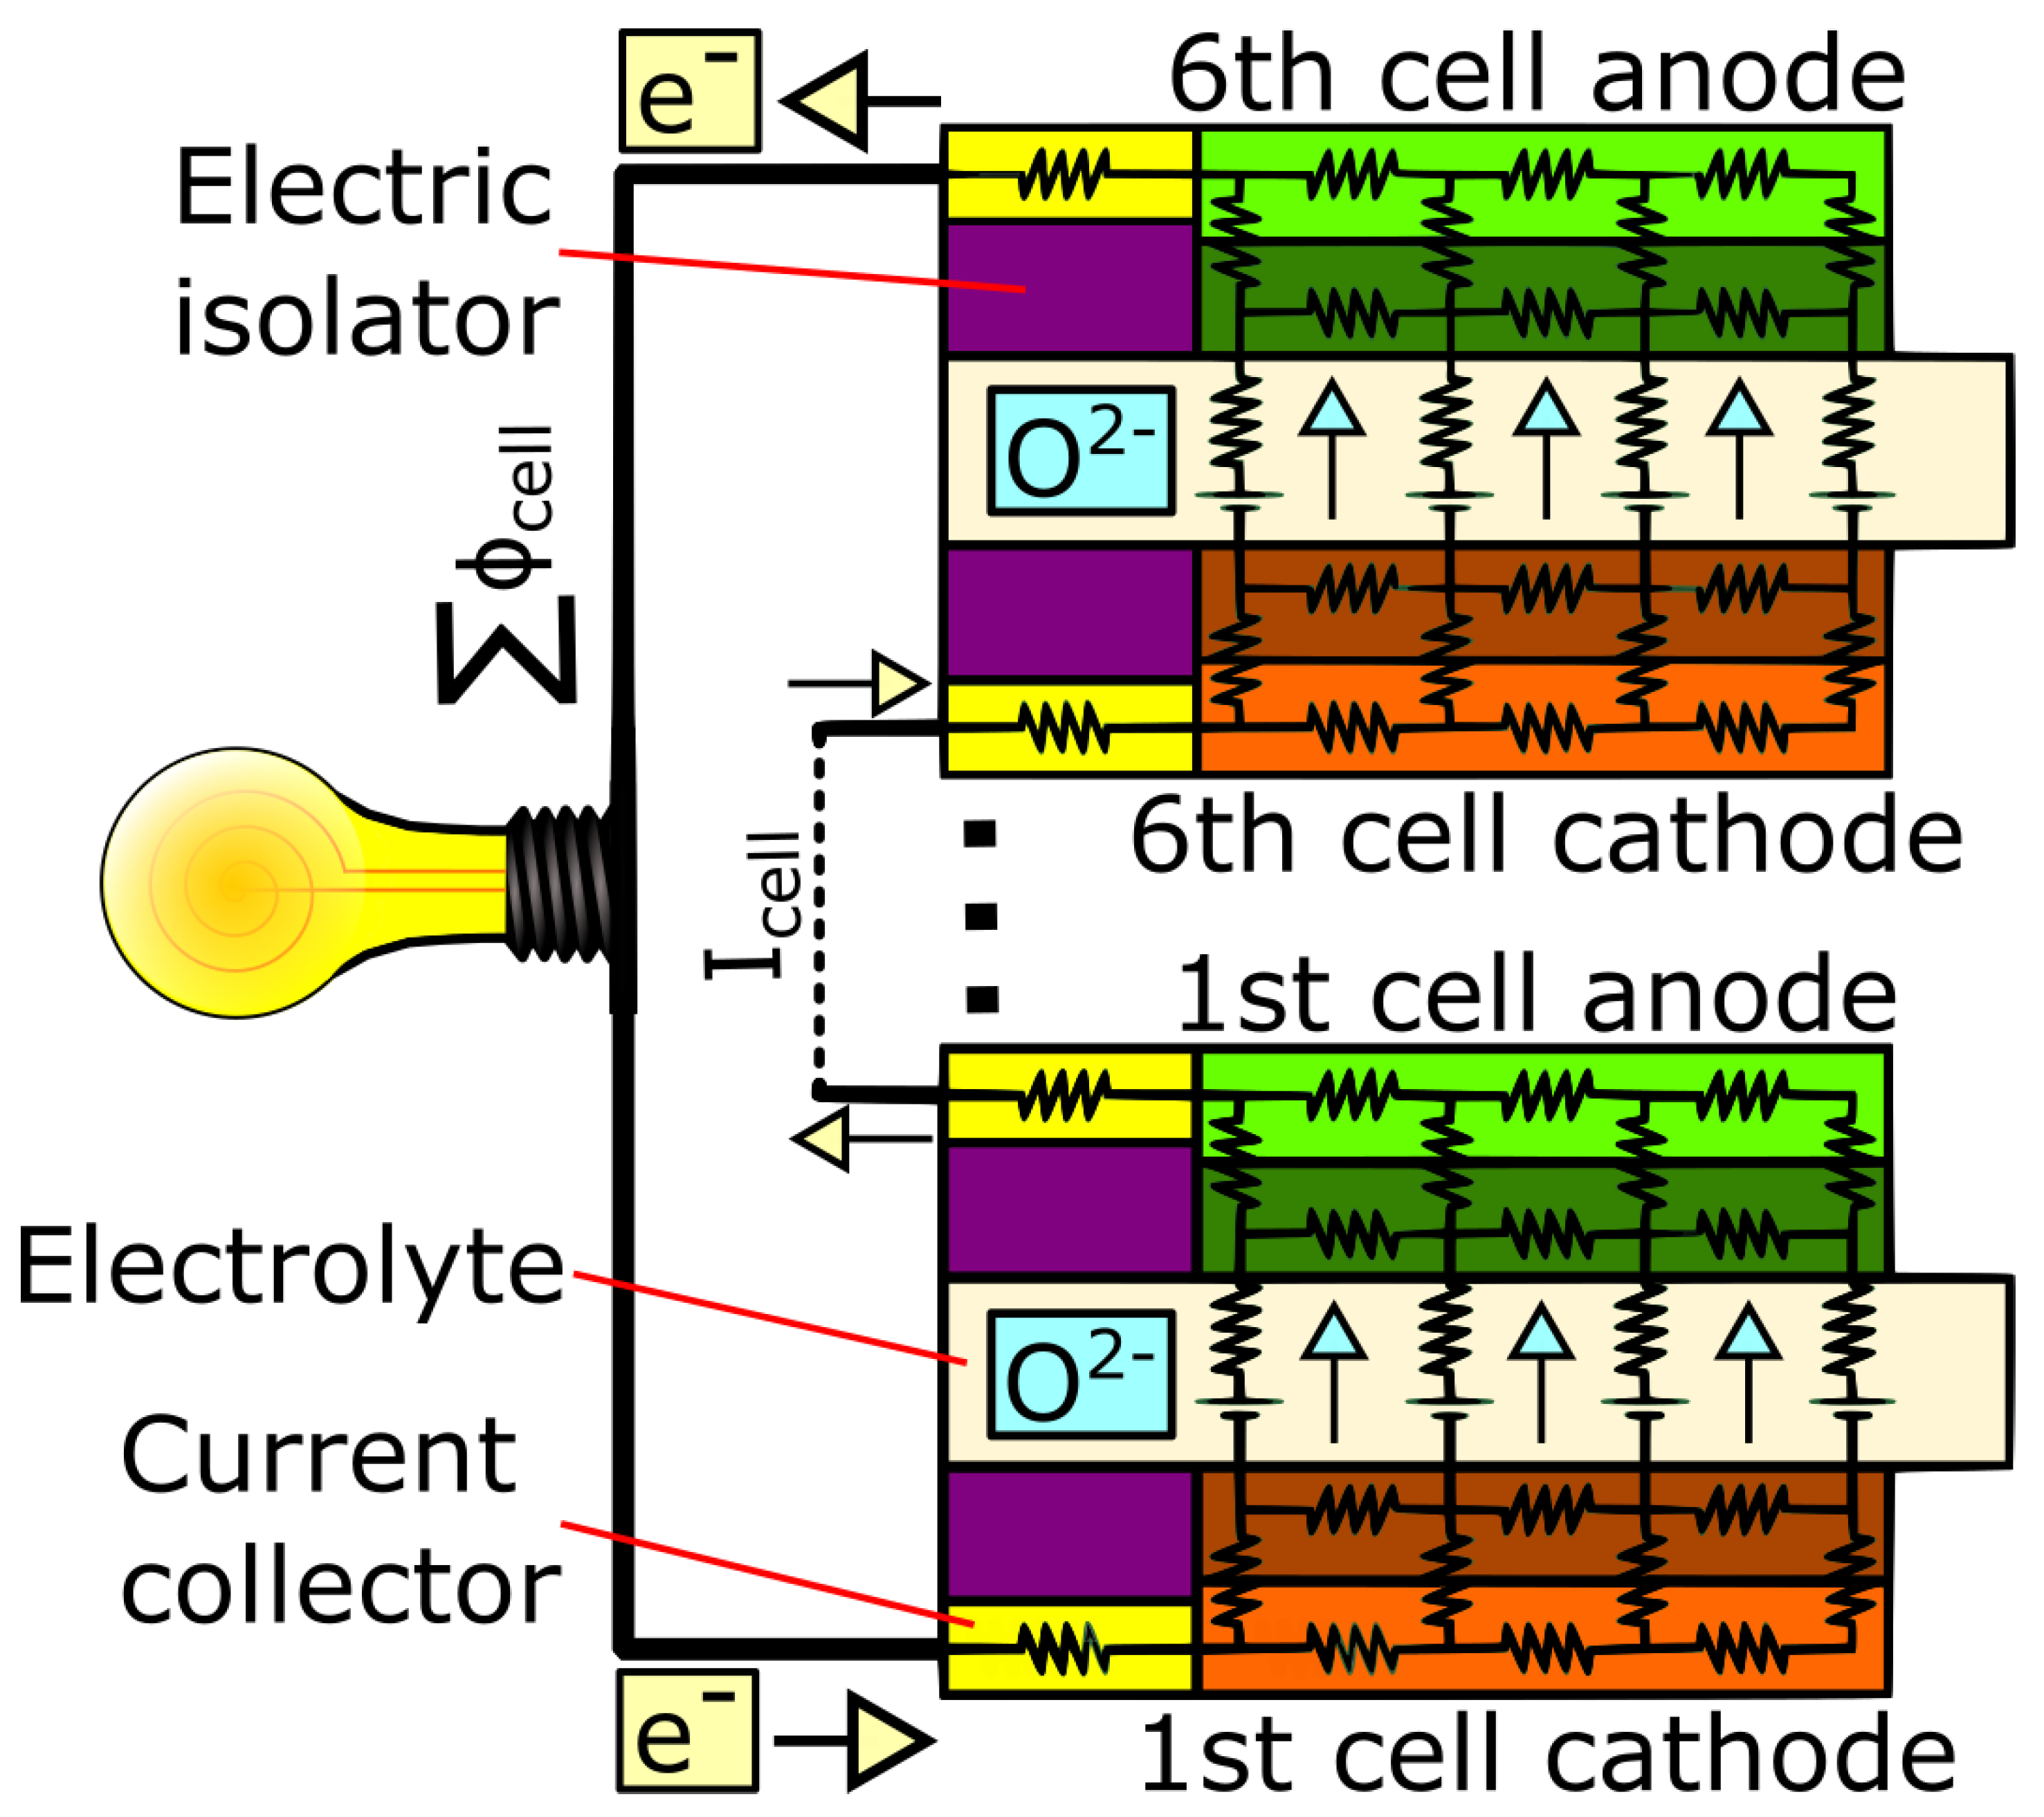
The transport of the electrons in the stack is defined by the circuit of six cells, shown in Figure 9, connected in series by the constant current boundary condition in each cell. In the external circuit of the stack, the electric current is equal to a single-cell current and the electric potential is equal to the sum of the potential of each cell. The driving force for the electric current flux is directly related to a variety of factors, which could be classified into three groups. The electromotive force, which is the ideal cell voltage, is achieved at zero current flux. This factor is largely determined by the fuel concentration, as the hydrogen is consumed and its concentration becomes lower, the electromotive force decreases. The internal resistance, which causes the loss of potential, is relevant to three factors. The activation overpotential is provoked because of the sluggishness of the reaction activation. The activation loss increases as the temperature decreases. The ohmic overpotential is mainly relevant to the ionic conductivity of the electrolyte, so the ohmic loss decreases with a temperature rise. The last factor is the concentration overpotential. In reaction areas, the concentration of the species participating in the reaction is nonuniform and noticeably lower than in the core flow areas, causing the concentration loss to affect the stack performance. The concentration overpotential increases as the fuel or oxygen concentration decreases. The third group represents the external load of the stack, which regulates the current flux. While the current flux is increased, the potential is reduced. As power is a product of these two factors, a peak value is reached at a certain load.
The summary of the computational parameters used in the described model is shown in Table 1.

4. Numerical Model

To compute the described mathematical model, the finite-volume method was used. The geometry established as a three-dimensional CAD model was transfigured into a computational mesh consisting of hexahedral elements. The total number of elements is the main parameter that forms the computation time. Increasing the number of elements not only extends the computation time but also yields a higher resolution of the solution. The choice of element number is a compromise between time and resolution. To obtain the time gain, various element sizing techniques can be used in different areas. It allows for an increase in the number of elements in crucial regions and a decrease in less significant areas. Another important factor to consider while meshing the geometry is the mesh quality. There are two main parameters, helpful in determining the quality and deciding if the mesh is acceptable, the orthogonal quality and the skewness of the single elements. The best quality is when the maximum skewness is close to zero and the minimum orthogonal quality is close to one. In short, the most regular elements would have the best quality in numerical meaning. Poor quality can cause numerical errors and inaccurate results.
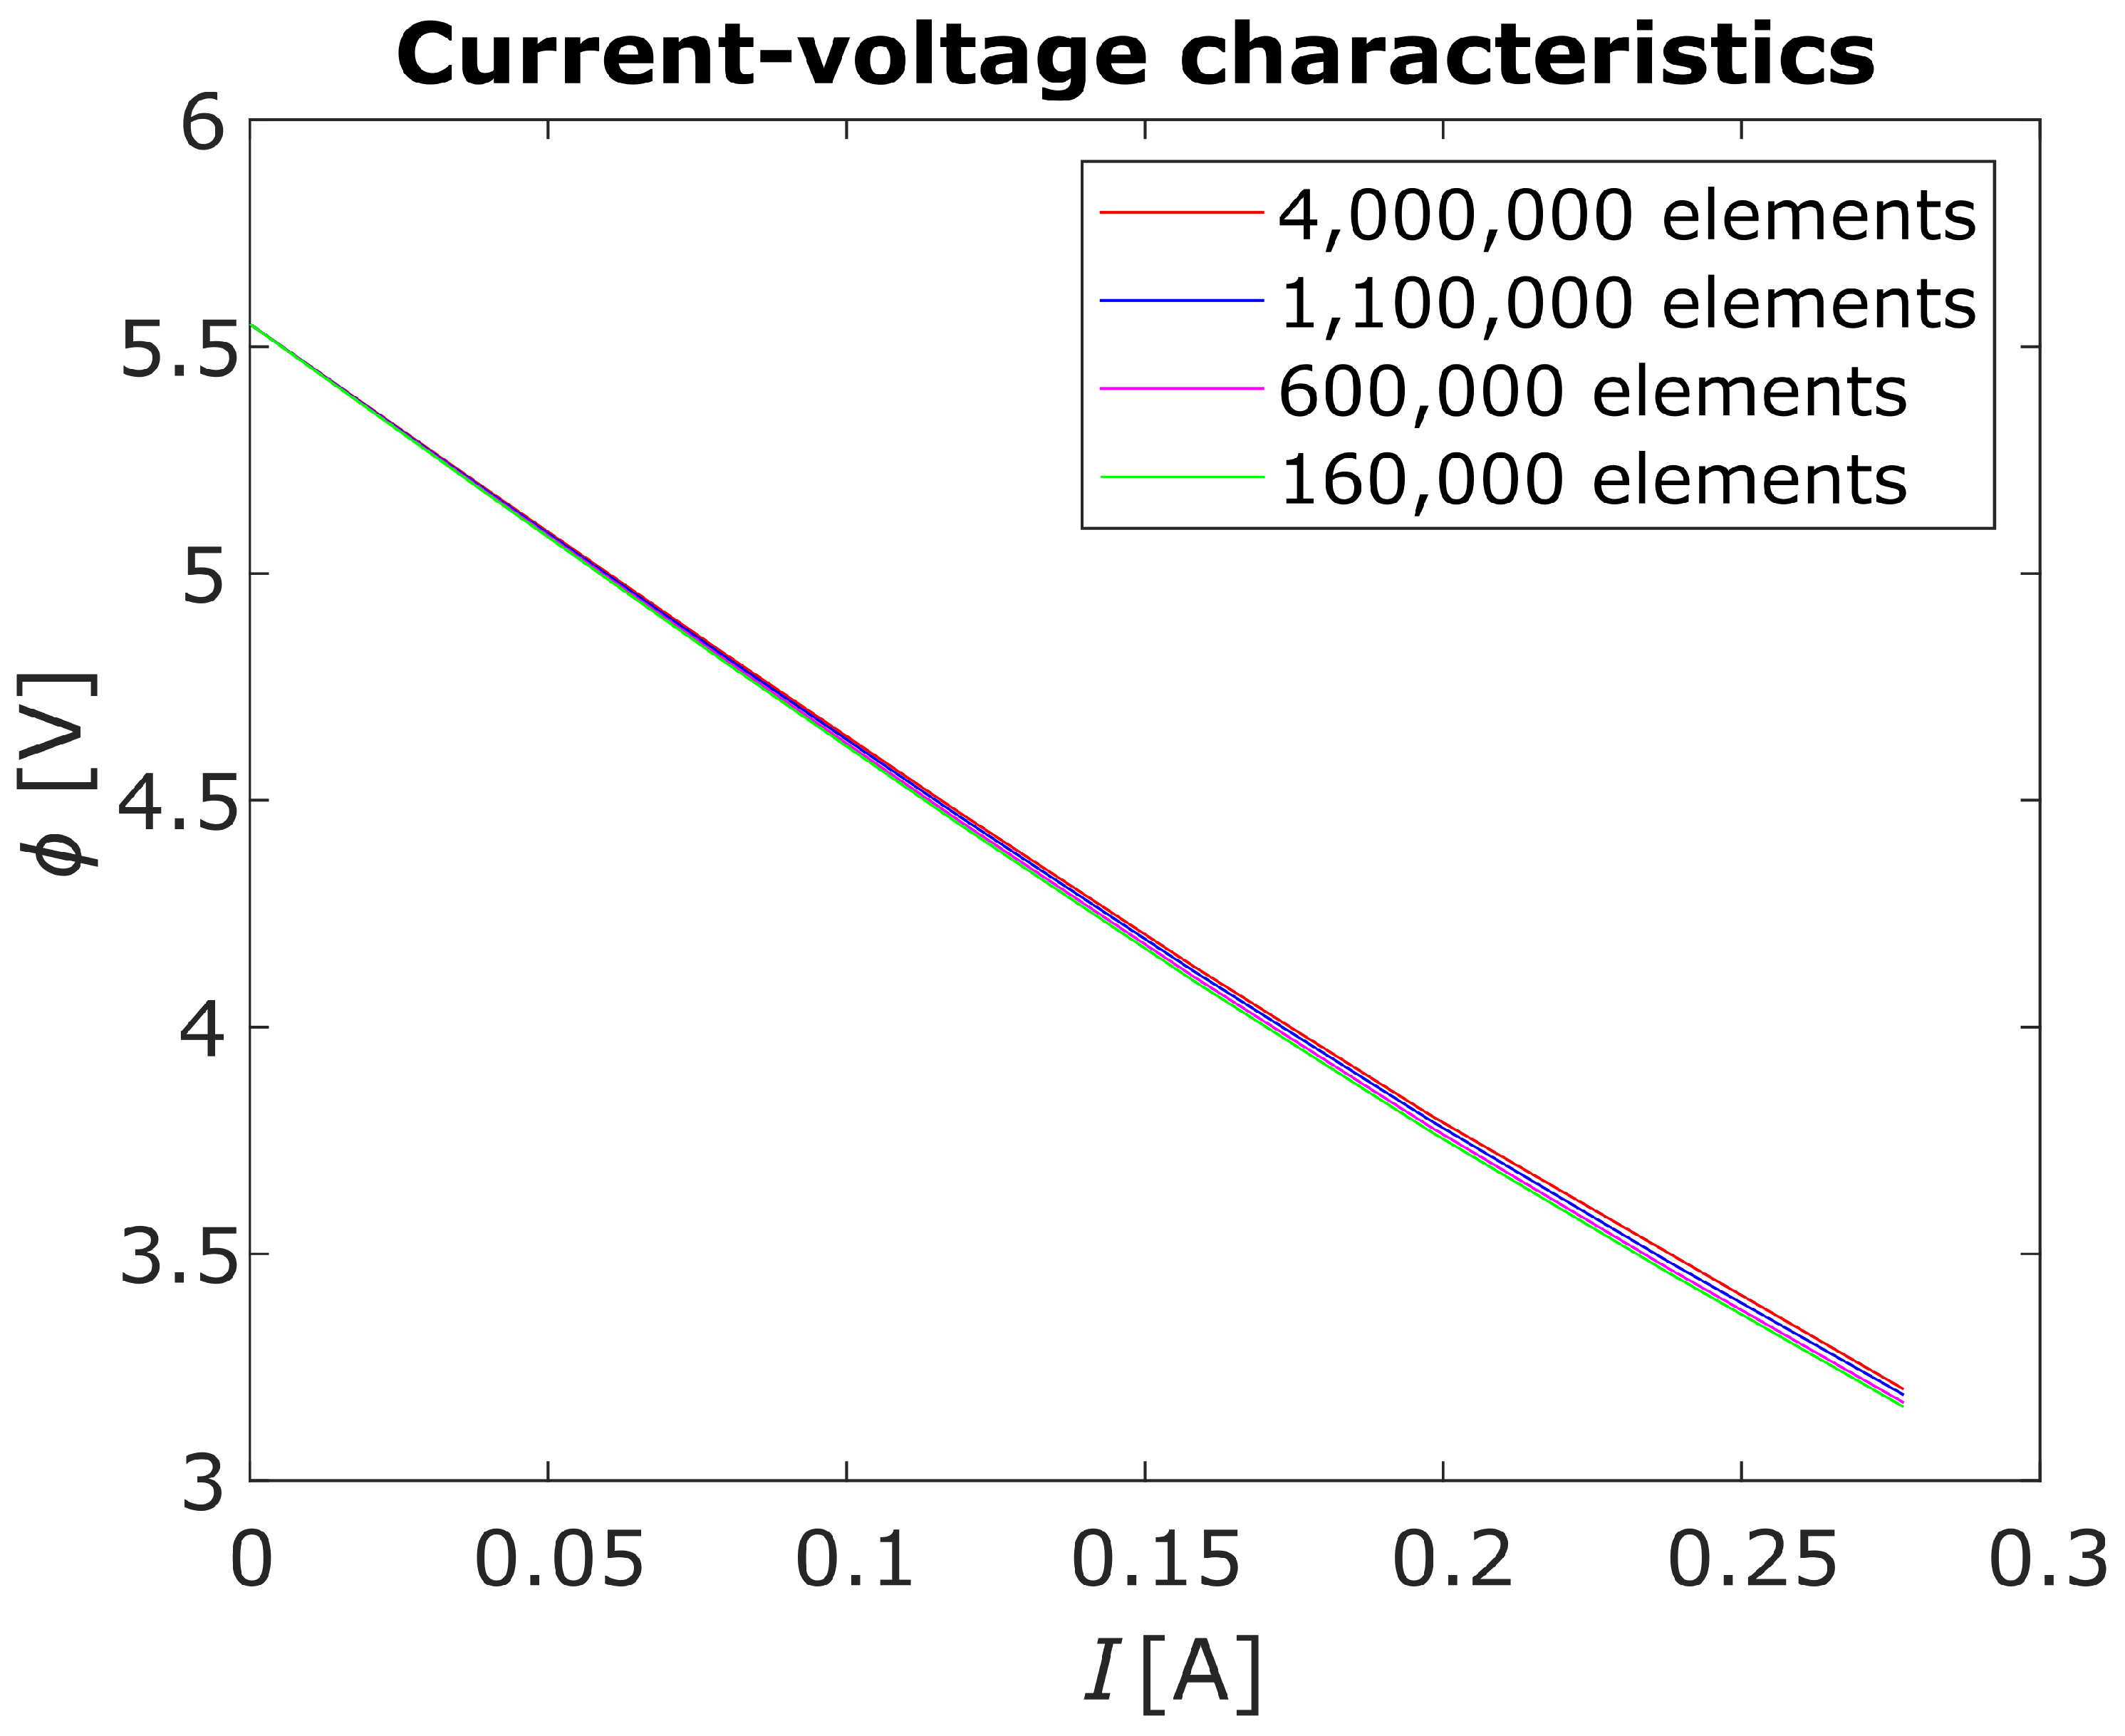
To choose the element number, a mesh sensitivity study was conducted. Four different meshes were calculated, starting from 1.6 × 10 5 elements, through 6 × 10 5 , 1.1 × 10 6 , and 4 × 10 6 elements. An analysis of the mesh comparison counts a few factors, which allows one to measure the computation accuracy. The comparison of the current-voltage characteristics is the primary factor to check in the analysis. As shown in Figure 10, each mesh examined exhibits similar characteristics, which means that the low limit of the mesh size was not reached. If the characteristic would vary between the meshes, it could mean that the element number is deficient. Obtaining repetitive results proves the correctness of the computation using each mesh. The next parameter to compare for the results obtained is mass conservation, measured as the absolute value of the difference between the sum of the inlet mass flow rate and the sum of the outlet mass flow rate. To conduct the comparison, the same point of the current-voltage characteristics was analyzed for each mesh. The results are presented in Table 2. Table 2 also includes the duration of time per iteration ratio, which is the third measurable factor consulted in the analysis. The last factor, which was used to decide which mesh size to choose, is the resolution of the results, which is a subjective parameter that depends on the demands of the research. The current-voltage characteristics and the continuity of the mass analysis show that all four meshes are accurate, so the deciding parameters would be the computation time and the requested resolution. Taking into account all four described factors, the chosen optimal mesh would have 1.1 × 10 6 elements, which allows one to slice thin layers into even thinner volumes, which allows one to increase the resolution and investigate the behavior of the phenomena inside the thin layers while keeping the computation time in an acceptable range. Since the gas distribution weakly influences the flow field in the analyzed system, to minimize the computational time during the simulation process, the velocity distribution was calculated independently to the utilization of the gases, as suggested by Patankar [35].
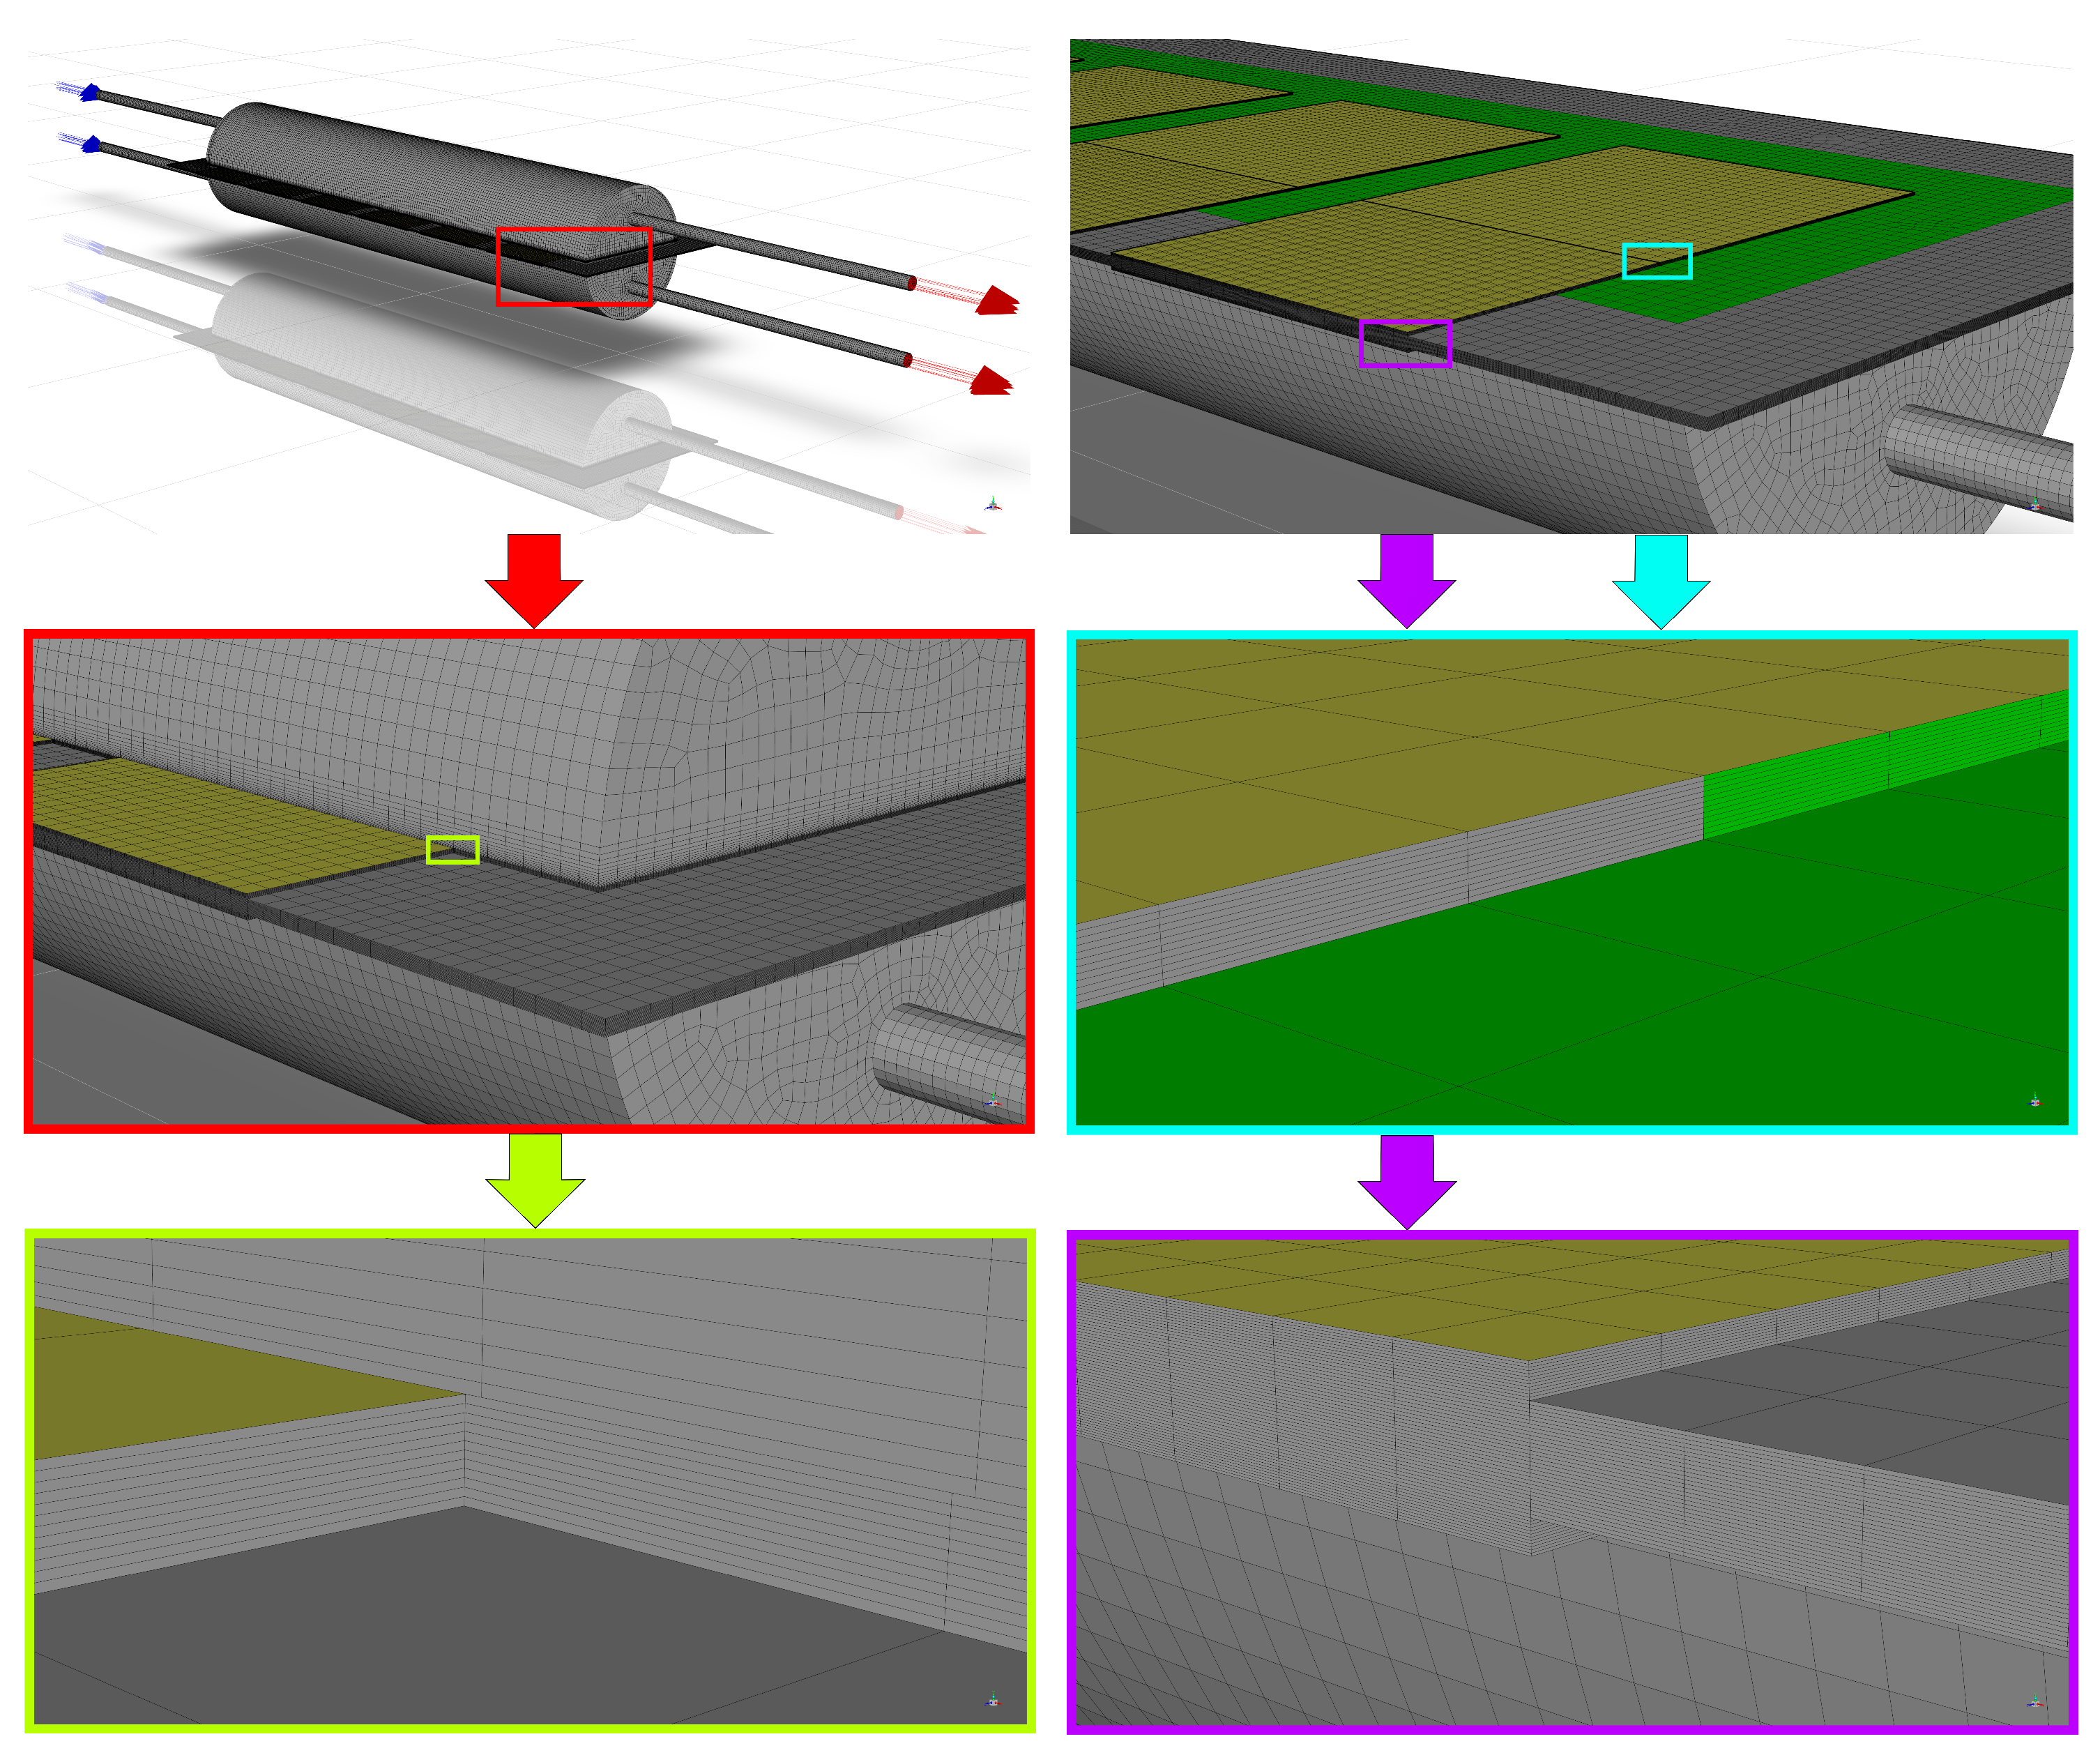
The chosen mesh is made up of 1,088,136 hexahedral elements. The main dimension of a single element was stated as 0.5 mm, so each volume aims to not exceed that value on every edge. Additionally, as the fuel and air domains approach the cells, the gradient transition was applied to smoothly reach the maximum thickness of 10 μm in the area of the thin layers of the solids, as shown in Figure 11. Figure 11 also presents the mesh sizing with a hidden fuel domain to visualize the mesh of the solids covered by the fluid. The minimum orthogonal quality of the elements is 0.44, with an average quality of 0.99, and the maximum skewness is 0.87, with an average of as low as 0.05. These parameters demonstrate the acceptable quality of the mesh.
The solution process was conducted using the SIMPLE scheme and the Rhie-Chow distance-based flux type. The spatial discretization methods and the under-relaxation factors for each computed parameter were cataloged in Table 3.

5. Numerical Analysis

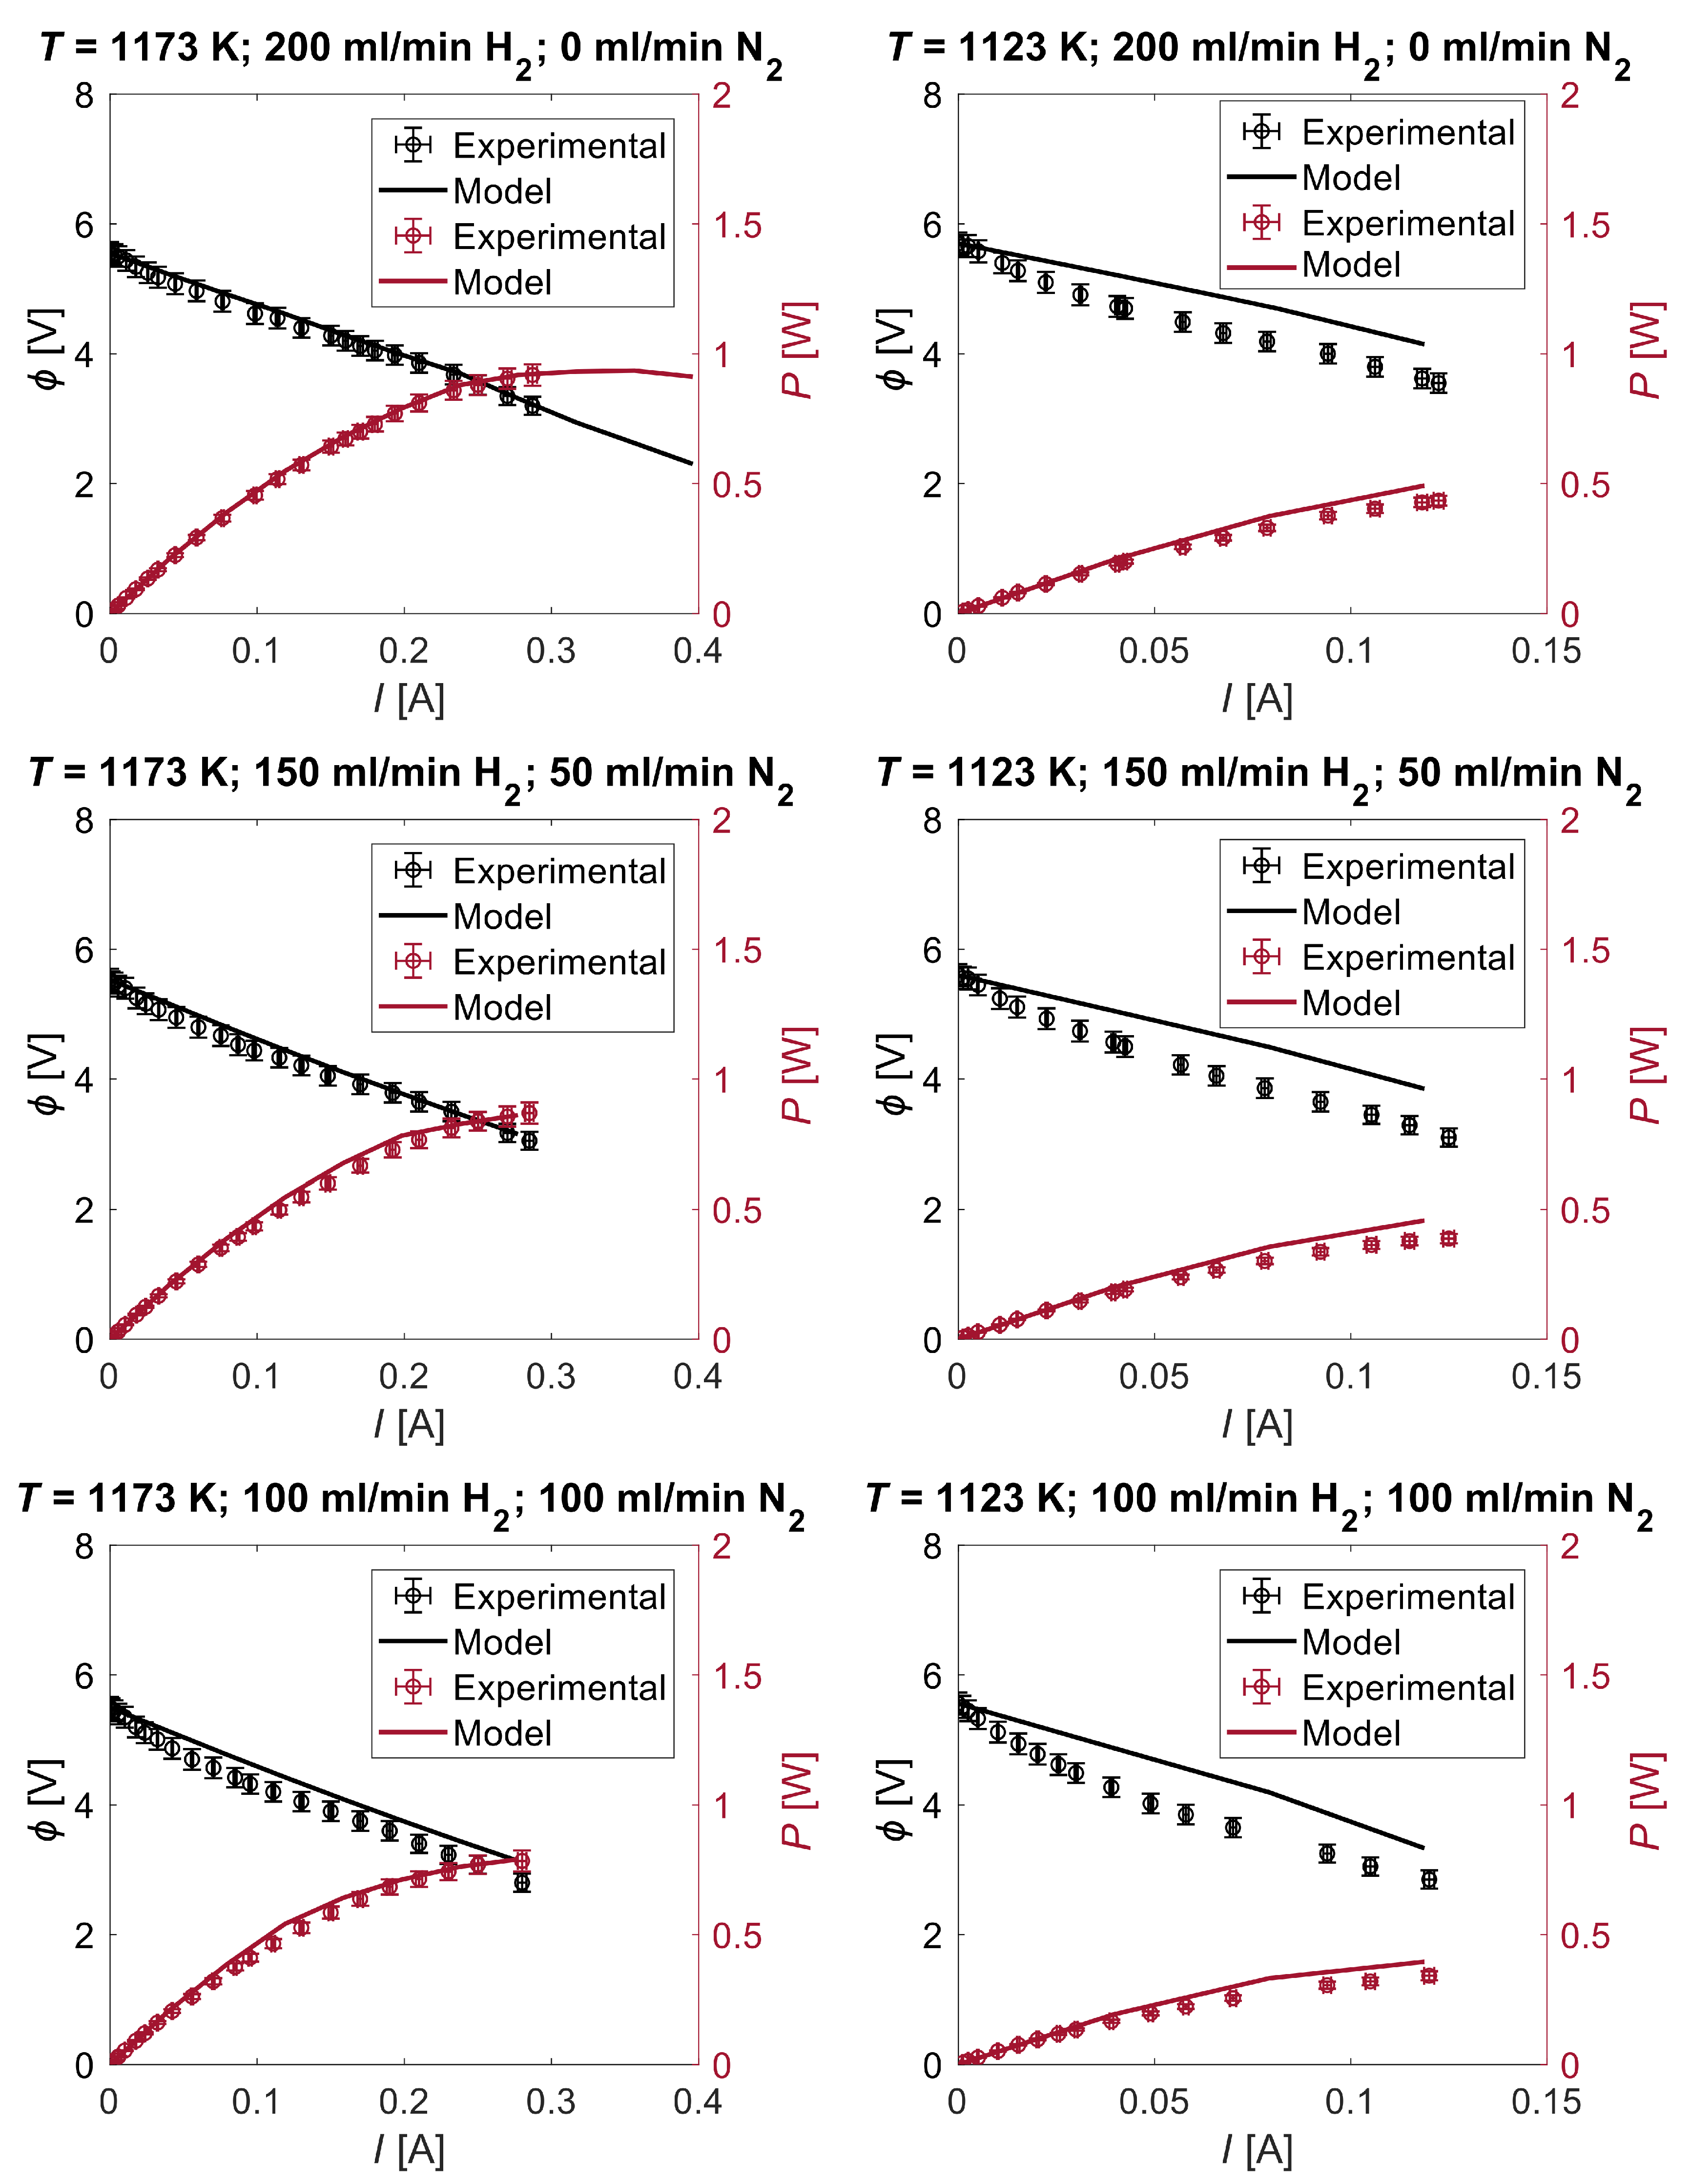
The main results to analyze are the current-voltage characteristics, which could confirm the model’s correctness. The comparison of the characteristics obtained from the model marked as solid lines, and the experimental data, marked as circles, is shown in Figure 12. The comparison consists of three different concentrations of hydrogen mixed with nitrogen up to 50% in volumetric terms. The air flow rate for each case was 200 mL/ min , on the cathode side, the nitrogen and hydrogen mixture was fed in three amounts: 200 mL/min/0 mL/min H2/N2, 150 mL/min/50 mL/min H2/N2, and 100 mL/min/100 mL/min H2/N2. For each gas flow rate, two different operating temperatures T = 1173 K and T = 1123 K were examined. The electrical load range was selected to follow the experimental data, for the maximum output power case, the current range was elongated to reach the power peak. As can be seen in Figure 12, at the operating temperature of T = 1173 K, the model remains highly predictable with the experimental data. The results for T = 1123 K are overestimated, but considering the possible inaccuracy in the experimental study, the predictability of temperature changes follows the proper trend and is satisfactory. Furthermore, it is a common issue to overestimate results by numerical models [16,17,23], due to contributing usually a simplified description of studied cases, which does not include all of the phenomena occurring during the operation, that exist in actual physics. The developed model has simplified the current collectors, so the contact resistance is not involved, also the current leakage is not counted. Furthermore, the concentration losses are computed in a simplified way and some parameters are constant instead of being connected to the temperature or concentration changes. These are a few reasons why the proposed model could overestimate stack performance. In the studied model, the trends are preserved and the model properly reacts to the applied temperature changes, so it can be considered valuable and correct. Moreover, for both temperatures, the numerical results maintain the precise reaction for changes in fuel concentration. The model, taken as a whole, can be determined as closely convergent and can provide relevant and veritable information about stack operation. Data statistics analysis confirms the convergence of the model. The Correlation Coefficient of 96.2%, the Coefficient of Determination of 92.6%, and the Standard Error of 0.22 were obtained during the analysis of the comparison of the potential values.
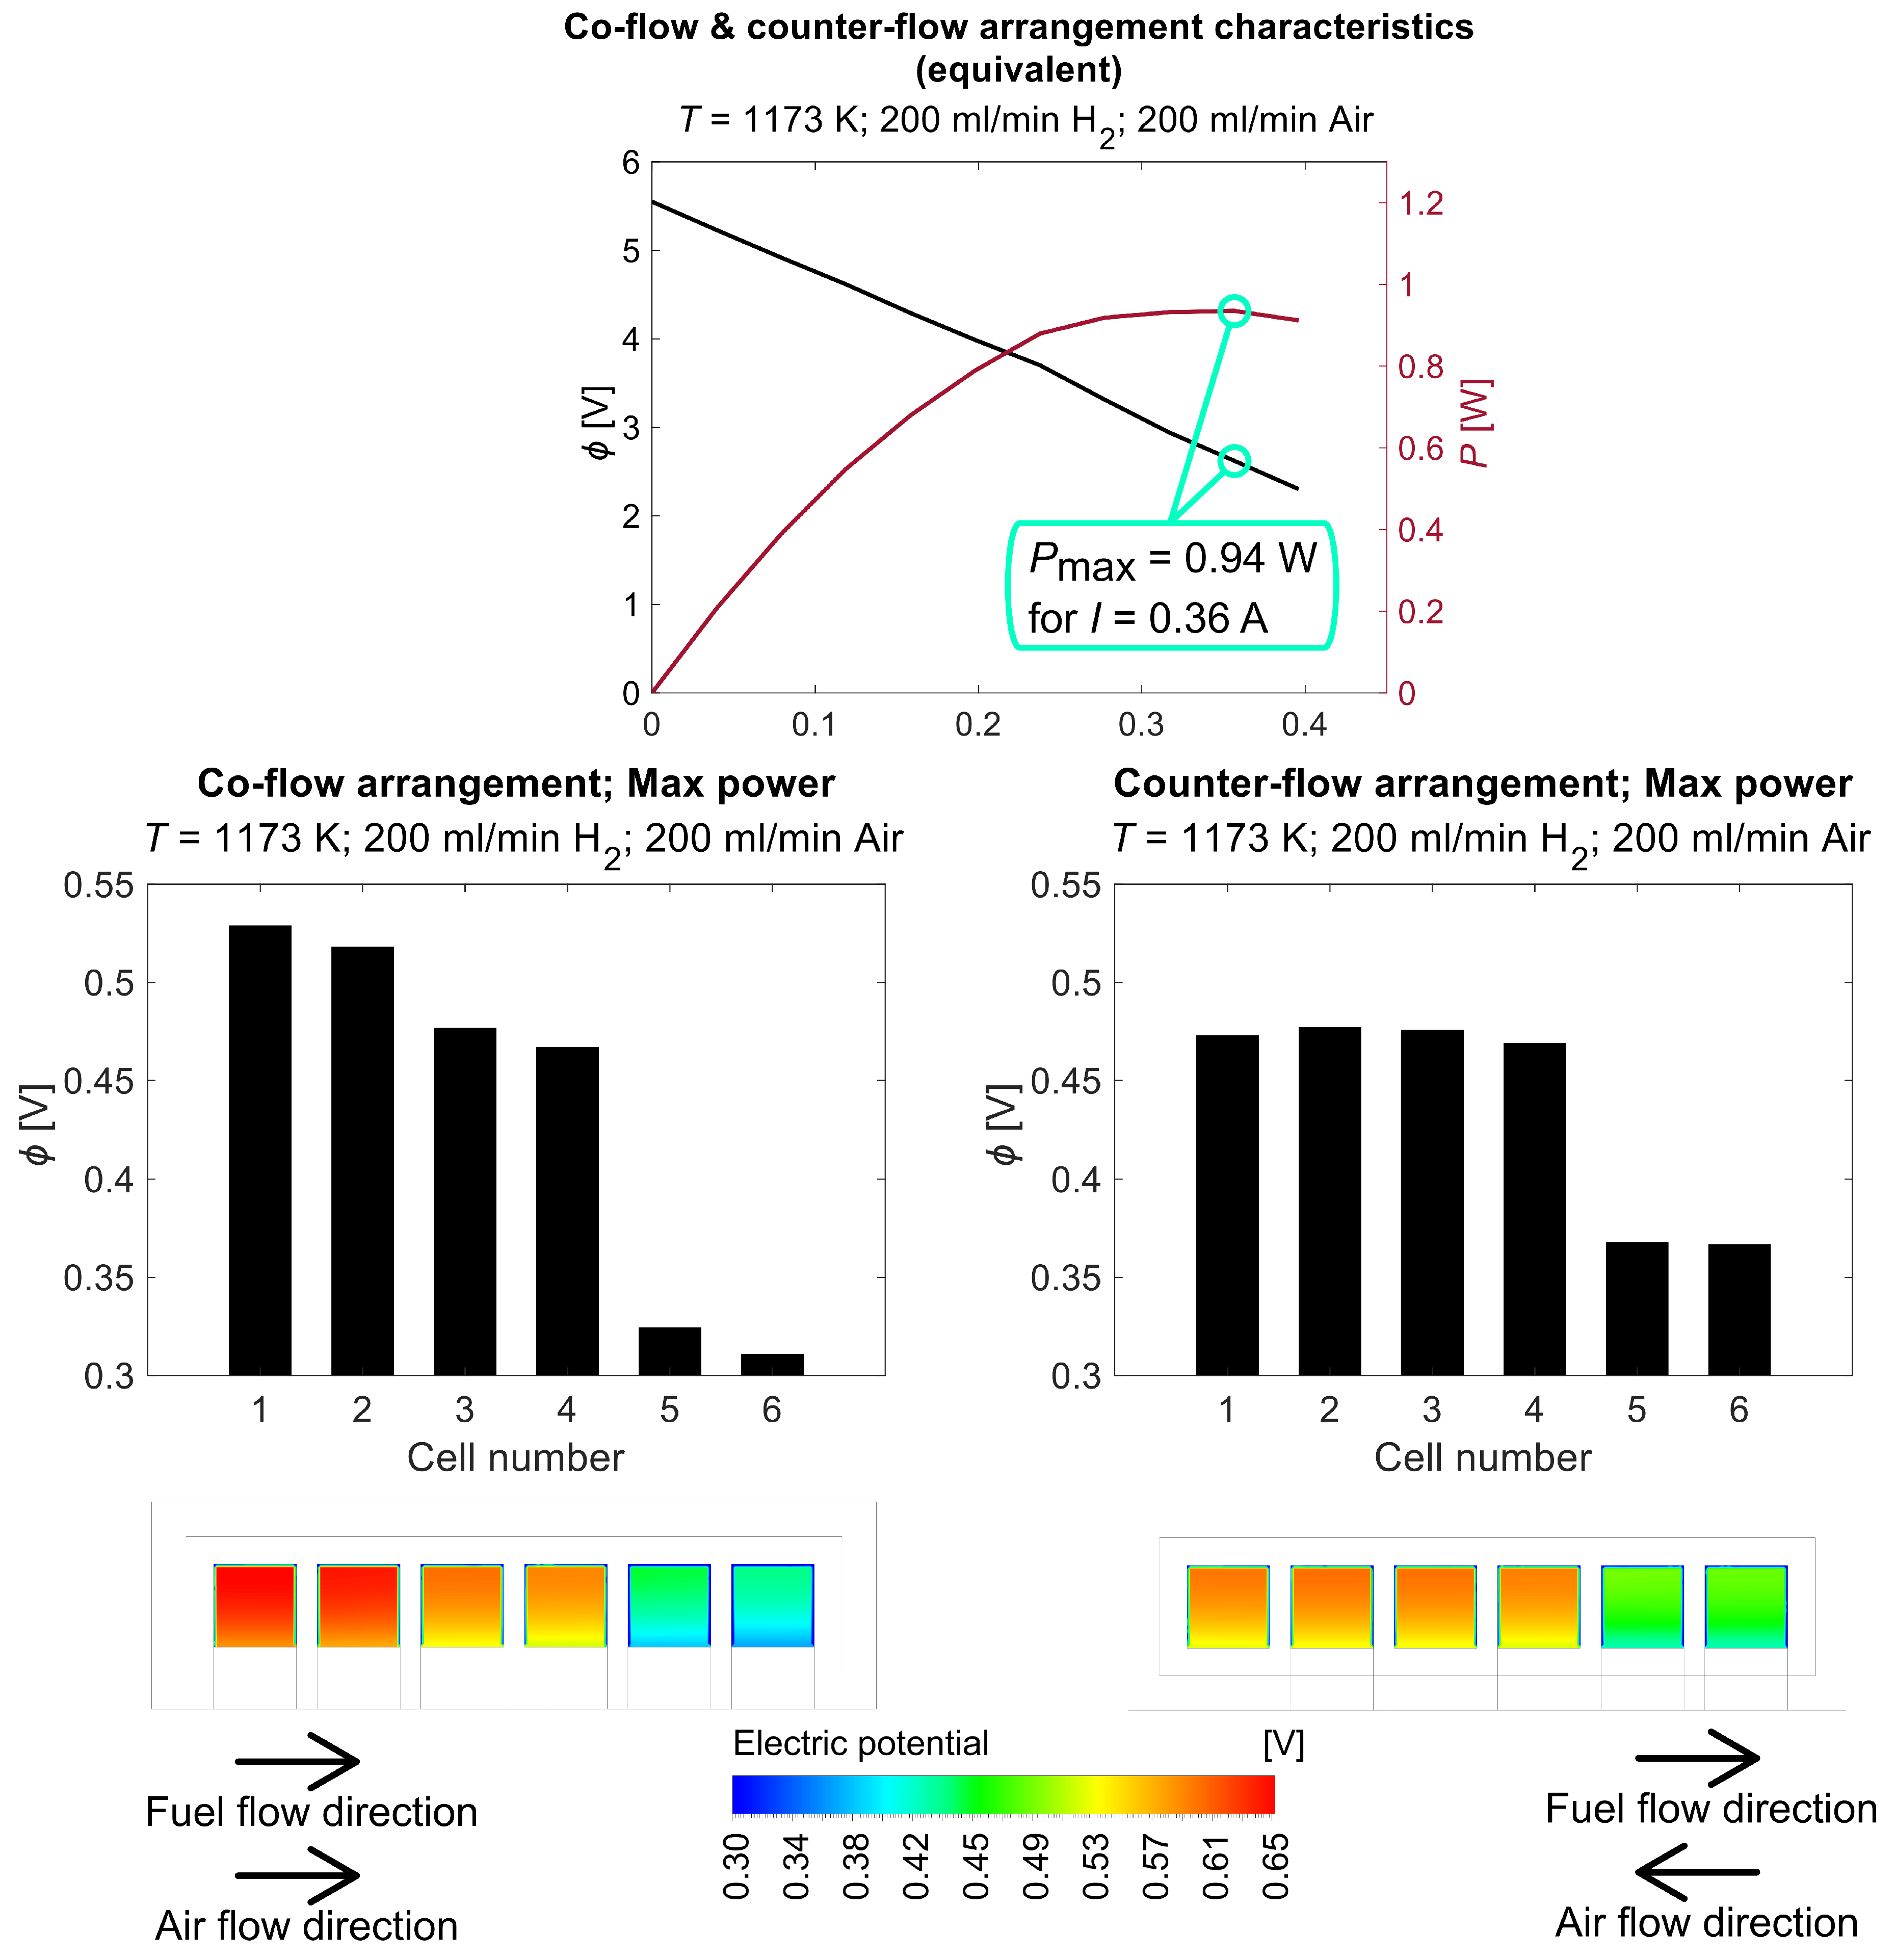
In order to study the influence of the gases’ flow direction, the comparison of co-flow and counter-flow arrangements was provided. For the temperature of 1173 K and the flow rates set to 200 mL/min of air and 200 mL/min of hydrogen, two different current-voltage and current-power characteristics were obtained, but the characteristics did not show any relevant difference between those two cases, as shown in Figure 13 in the upper graph. However, the deeper study revealed the difference in the potential distribution in the single cells of the stack, as shown in the lower part of Figure 13 in the form of bar plots and distribution visualization in the cathode areas. For the co-flow arrangement first cells, counting from inlets, have the highest potential value, decreasing along the stack. For the counter-flow arrangement, after providing the opposite direction of airflow, the potential distribution is more uniform, the first cells’ (one and two), counting from the fuel inlet, potential has decreased and the last cells’ (five and six) potential has increased. Still, the potential value is not equal along the stack, but the flow configuration has shown its influence on the potential distribution.
To study the mass fractions of hydrogen and water vapor on the anode side, and oxygen on the cathode side, a comparison of the co-flow and counter-flow configurations is shown in Figure 14. On the left side, a co-flow arrangement is presented, and on the right side is a counter-flow configuration with the opposite airflow direction, as shown by the arrows. Values scale is shown in the local range. The distributions of hydrogen and water vapor are located 5 μm above the anodes’ surface. The oxygen distribution is located 5 μm above the cathodes’ surface. The distributions on the anode side do not show any significant difference. On the cathode side, the oxygen behavior is similar for both cases with a symmetrical reflection but, since there was a significant change in the potential distribution along the stack (Figure 13), the influence of the flow direction arrangement was proved. Similar results in terms of gas distribution were obtained by other researchers while conducting such a comparison [36]. The temperature distribution was also studied during this research but, since a boundary condition of a constant current was applied, there was no significant difference for both cases. It is expected to expose a temperature distribution difference while simulating a constant potential boundary condition.
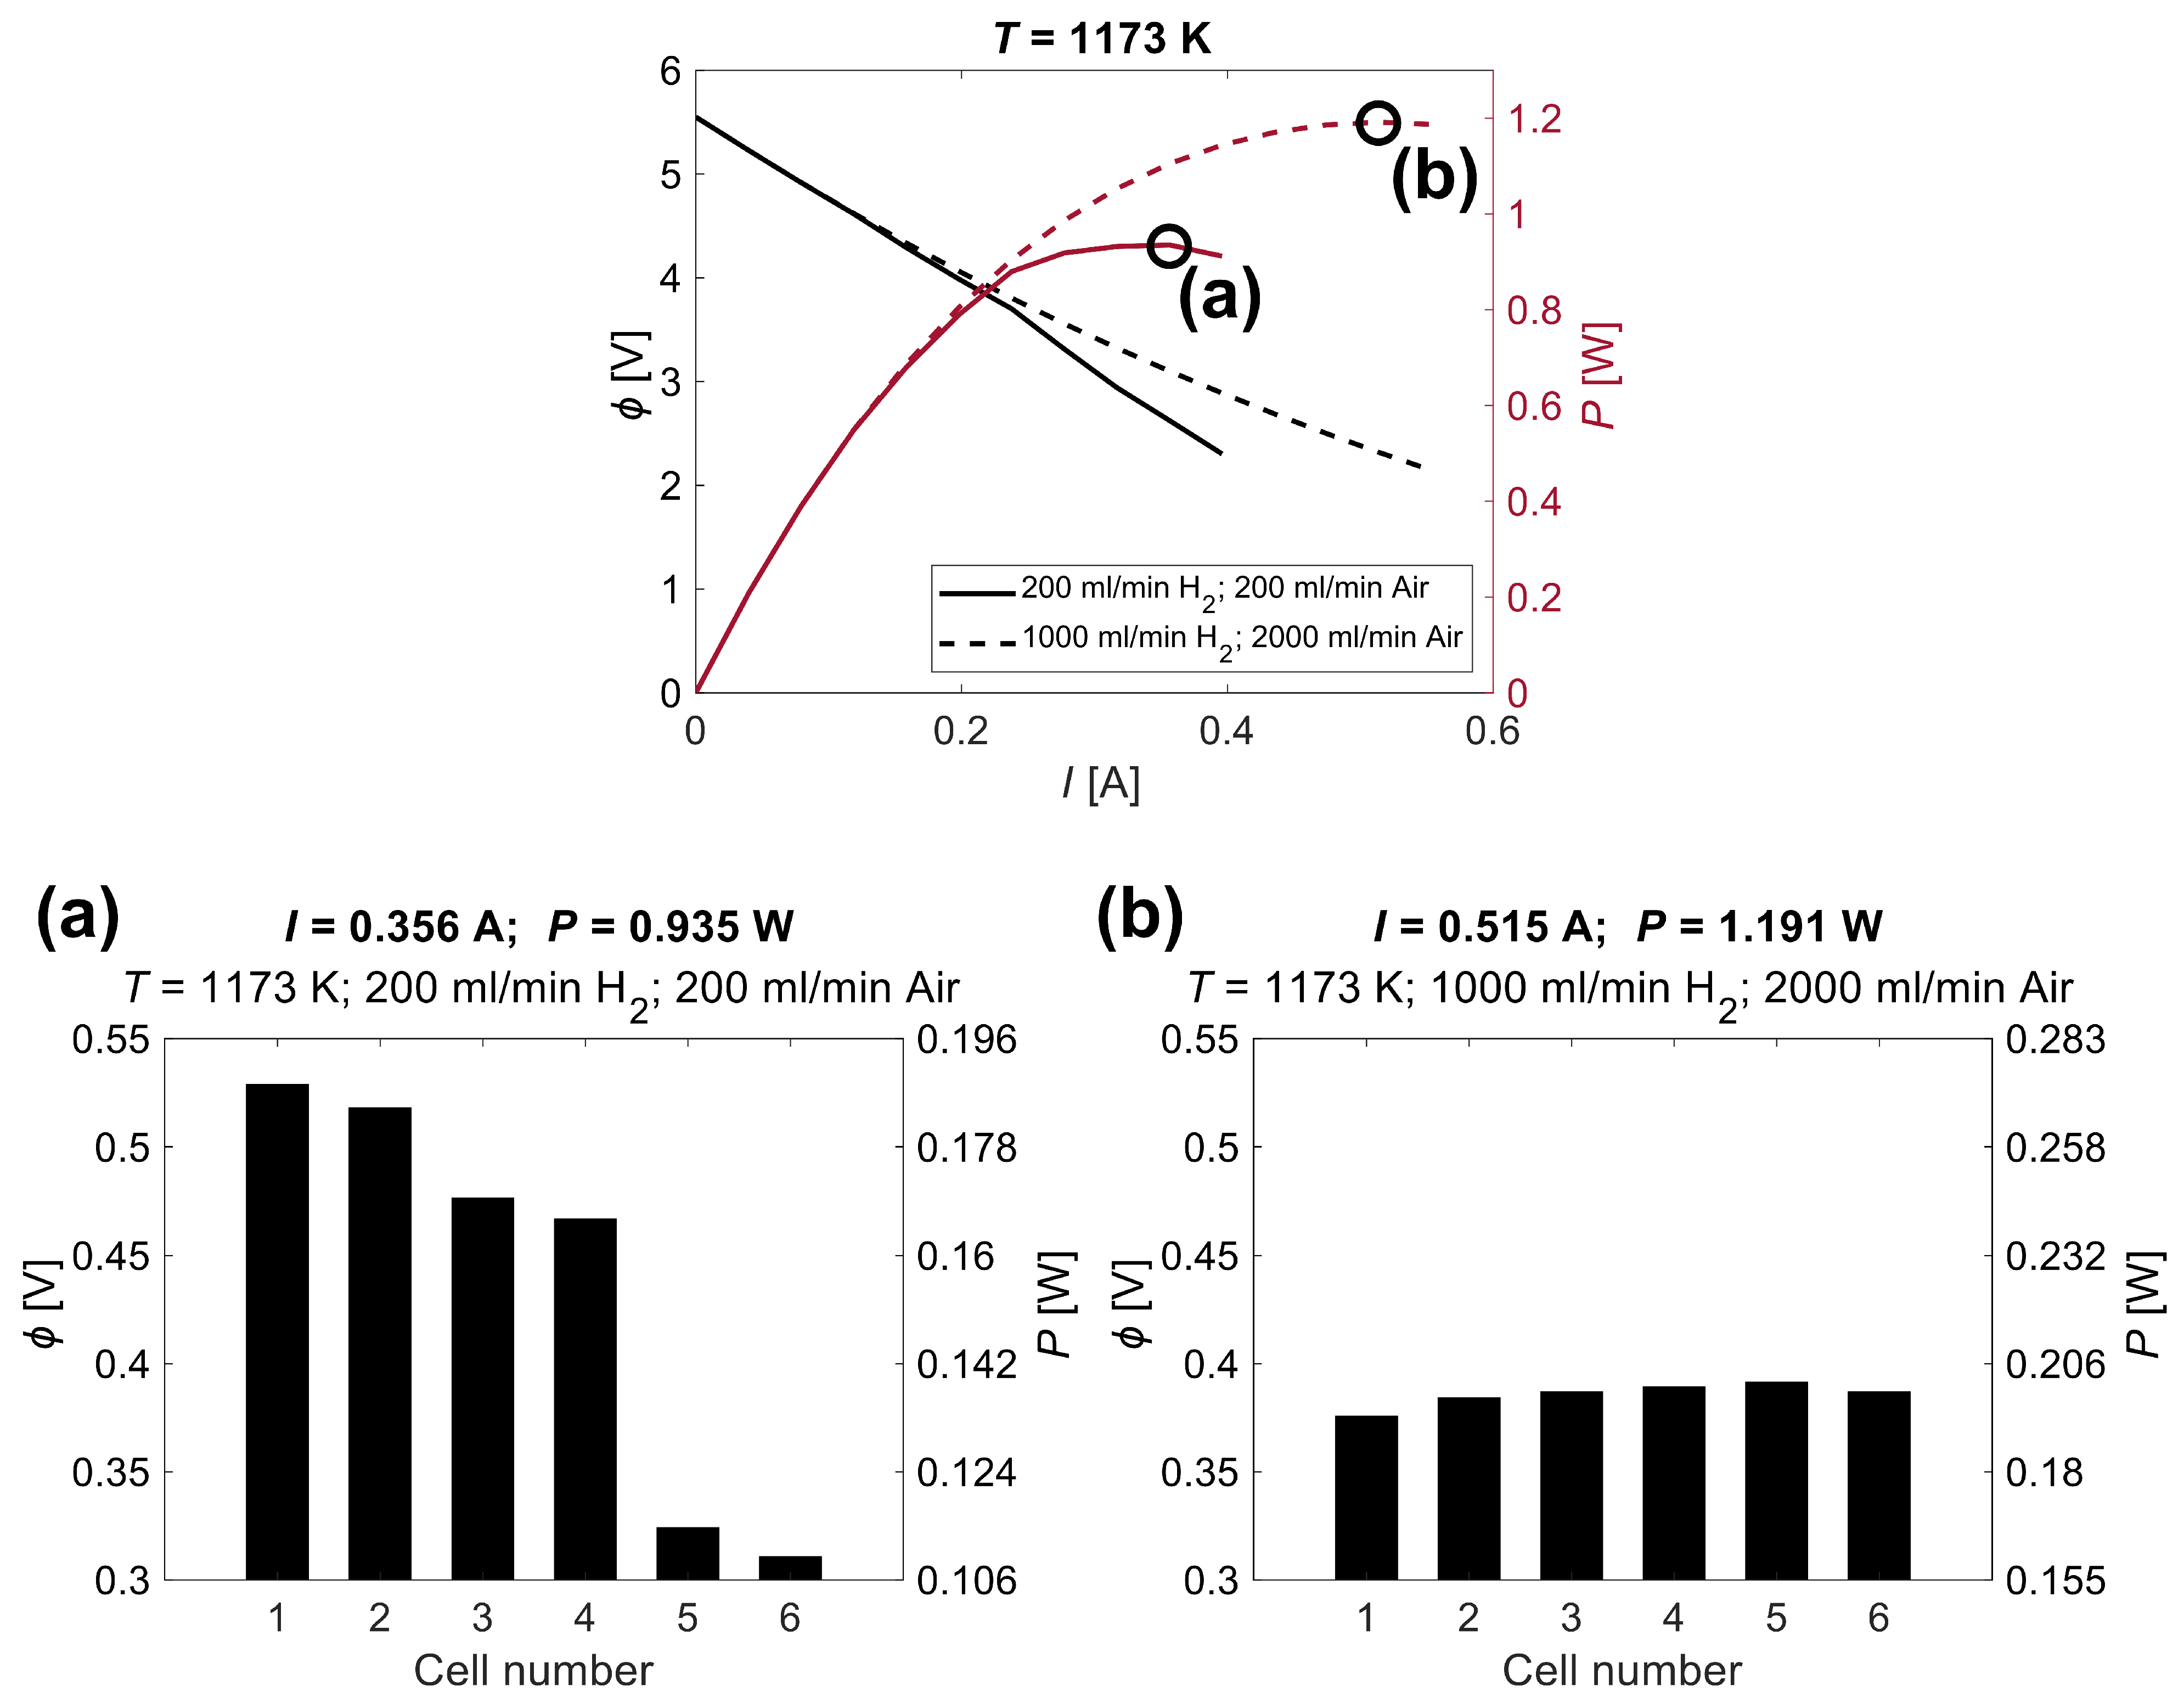
As the performance characteristics prove, the model operation can be considered veritable, so it is expected to provide relevant information even beyond the scope of the experimental range. To find the maximum power value, which could be obtained during the experimental study, the electrical load of the highest performance case was extended. The results obtained during the study showed that the lack of fuel and oxygen is a crucial factor that determines performance, so the next step was to increase the gas flow rates. The volumetric flow rates of pure hydrogen and air were increased five and ten times, respectively. The results are presented in the current-voltage and current-power characteristics in Figure 15. Solid lines represent the case with the highest experimentally tested values of the gas flow rates. The dashed lines represent the case with an increased supply of gases. For the case marked as solid lines, the maximum output power value is P = 0.935   W at the current of I = 0.356   A “(a)”, while the case marked as dashed lines reach a power of P = 1.191   W at I = 0.515   A “(b)”. The potential and power distribution of the individual cells of the “(a)” point show the influence of the lack of fuel and oxygen on the performance because of a decreasing power trend along the stack and a large power drop in the area of the last two cells. The extra boost in the form of flow rate enhancement has evened the potential (power) distribution along the stack, indicating a fuel and air surplus. The adjustments implemented have brought an improvement in the performance of 27.4%.
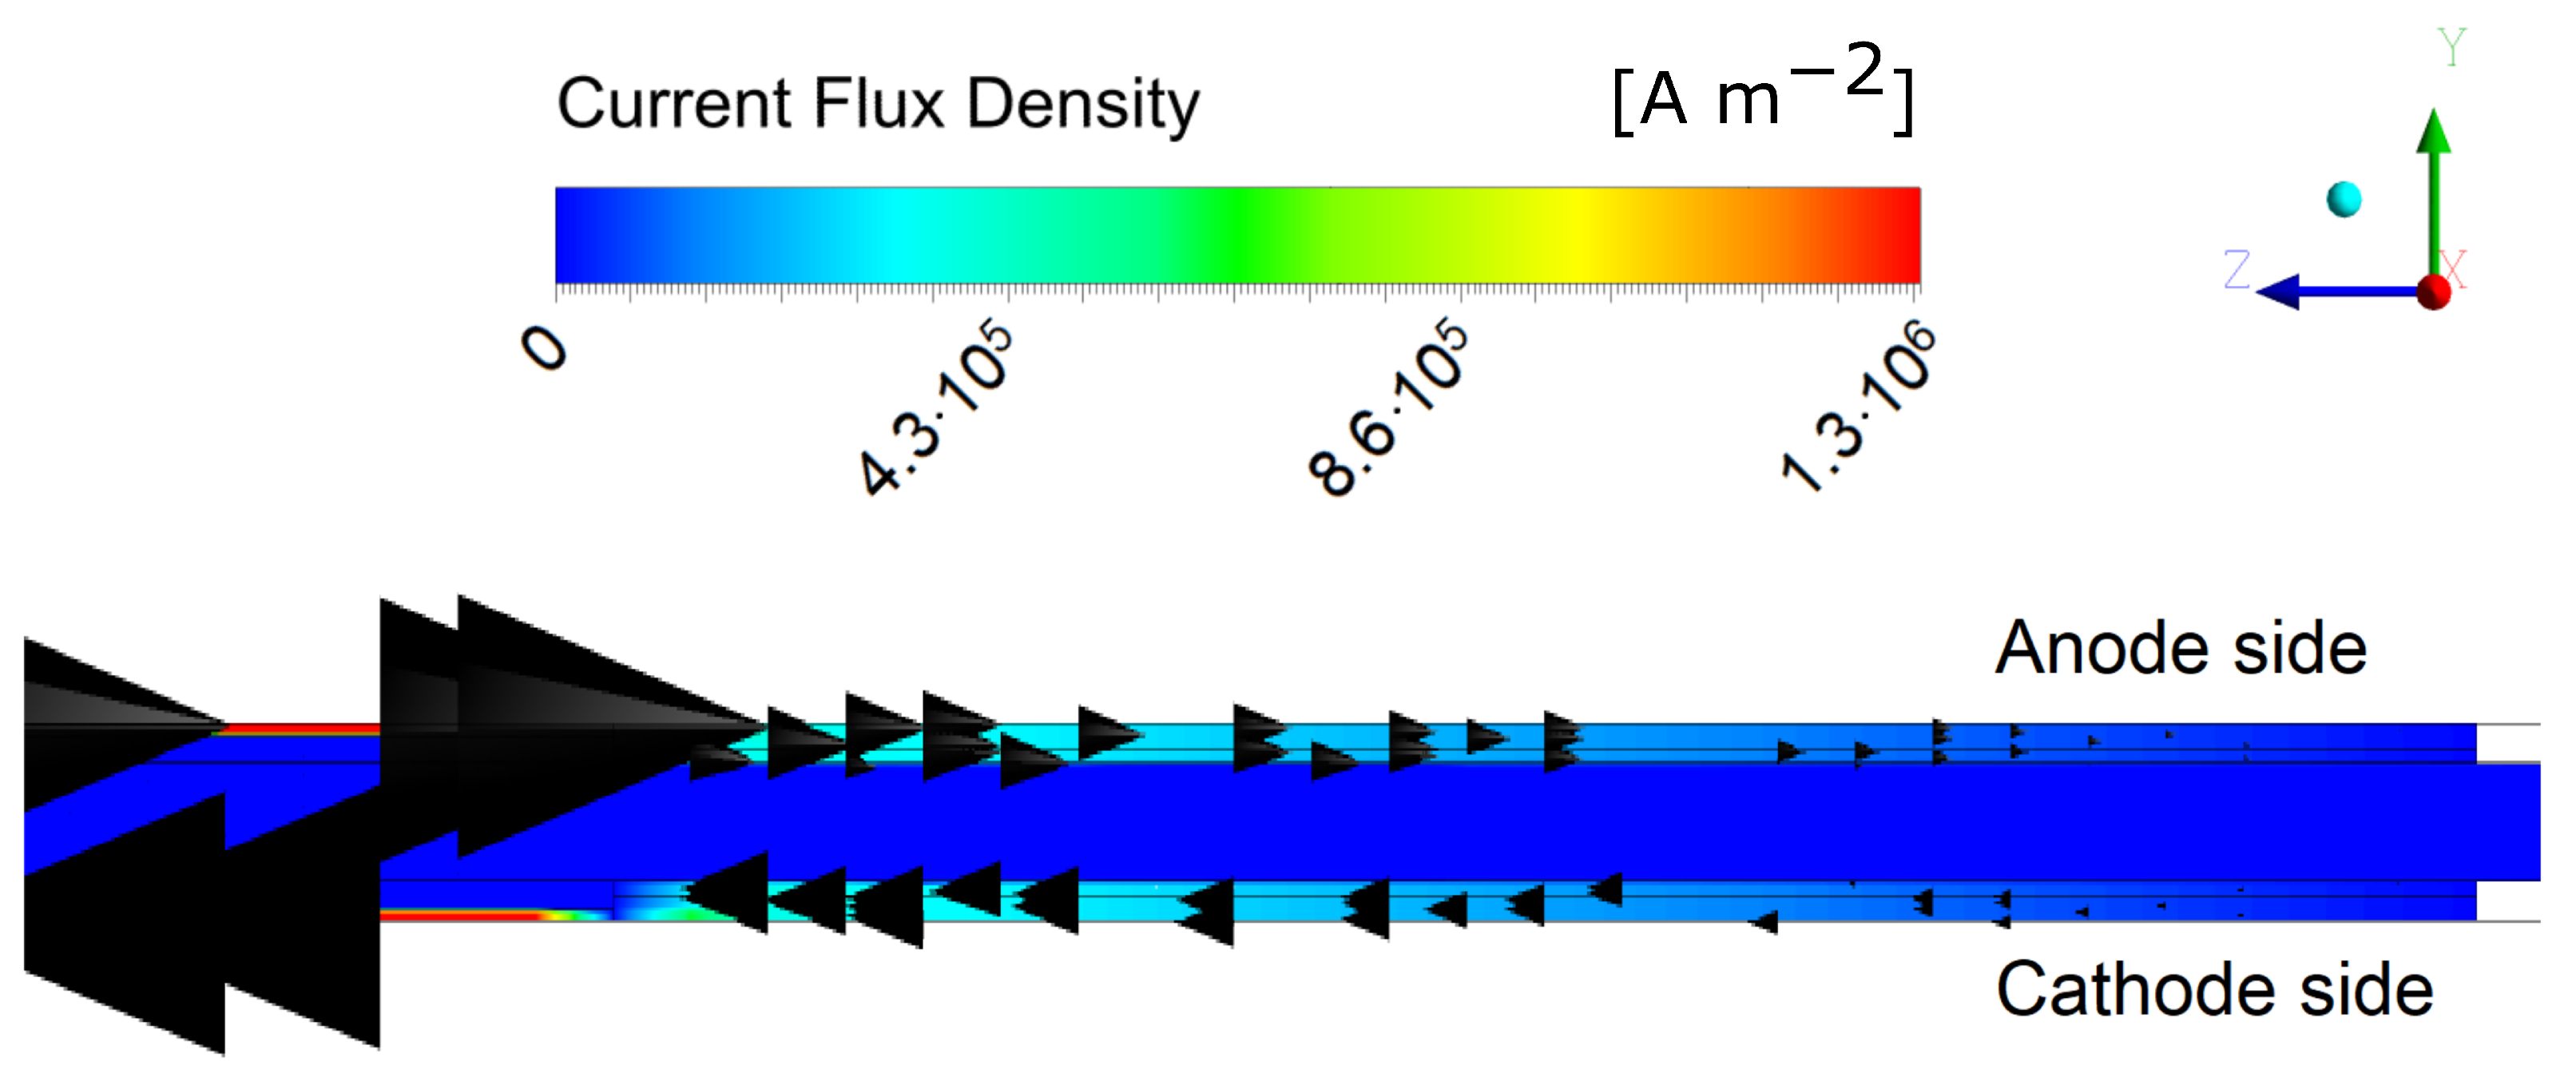
The current flux density distribution, shown in Figure 16, compares the operation of the model in terms of current transport with the theoretical expectations shown in Figure 8, where the transport of ions and electrons is described. Figure 16 presents the current flux density in the form of scaled vectors and the planar distribution with the color value. The distribution shows the case for operating parameters as follows: q ˙ V H 2 = 1000 mL/min; q ˙ V Air = 2000 mL/min; P = 1.191   W ; I = 0.515   A ; and T = 1173   K . The distribution is located in a cross-section of the fourth cell, parallel to the yz plane, with a view from the outlet side. The vectors of the calculated current density flux have an opposite direction to the transport of the electrons and ions, indicating a proper operation of the model. The highest current density values are concentrated in the current collector, which comes from a decreased thickness toward the electrodes. In the electrodes, the values decrease along with an increasing distance from the current collectors, suggesting a simultaneous spread of the current uptake on both sides.

6. Conclusions

This paper broadens the understanding of the transport phenomena that occur inside the investigated banded stack. The experimental study revealed the correctness of the design assumptions of combining in series a few cells on a single electrolyte support, closed between ceramic covers, forming flow channels. Furthermore, the novelty of this paper includes a detailed mathematical description of the model and provides a catalog of all the computational parameters used to perform the numerical analysis. The broad description of the model will allow other researchers to build their work on the presented model and provide relevant results in a shorter time. Moreover, the model accuracy was confirmed and validated. The overall statistics of the model are as follows: the Correlation Coefficient of 96.2%, the Coefficient of Determination of 92.6%, and the Standard Error of 0.22.
The mathematical and numerical models developed have correctly reproduced the current-voltage and current-power characteristics of the experimental study. As the experimental current-power curve did not reach the maximum power in the case of the highest hydrogen and air input tested, at a temperature of T = 900 °C, the simulation has extended the range of the electric load. In conclusion, the stack could reach P = 0.935   W , with the operating parameters set as tested. Further investigation, such as examining the fuel and oxidizer distributions and potential and power distributions of the individual cells, revealed a lack of oxygen and hydrogen as the performance limiting factor. To find the maximum power that could be obtained, a surplus of fuel and air was applied. The power value obtained from this operation reached P = 1.191   W , giving 27.4% of a performance improvement.
The model also demonstrated the correlation with physics in terms of the current distribution. The current flux direction is preserved. The current density distribution in the electrodes exhibits the concentration of current on the side of the current collectors, but in the provided model the current collectors were simplified so, to study the current collection system more accurately, the subject needs further investigation.
The prototype construction has been successfully calculated numerically, providing relevant results, which are useful for describing the design flaws and pointing out the possibilities for improvement. Moreover, the comparison of co-flow and counter-flow configurations was performed. The presented results show the influence of the flow arrangement on the potential distribution uniformity along the stack. An extended numerical analysis was provided in Part 2 of this article.
This stage of analysis ends with the confirmation of the model’s accuracy and provides a solid base for further investigation performed in Part 2 of this article. The proposed model has been described in detail, so other researchers can also follow it.

Author Contributions

Conceptualization: G.B.; data curation: K.K.Ś. and M.C.; formal analysis: K.K.Ś.; funding acquisition: G.B.; investigation: K.K.Ś. and M.C.; methodology: K.K.Ś., M.C., M.M. and G.B.; project administration: G.B.; resources: G.B. and J.S.S.; software: K.K.Ś.; supervision: M.M., G.B. and J.S.S.; validation: K.K.Ś. and M.C.; visualization: K.K.Ś.; writing—original draft preparation: K.K.Ś., M.C., M.M. and G.B.; writing—review and editing: K.K.Ś., M.M., G.B. and J.S.S. All authors have read and agreed to the published version of the manuscript.

Funding

The presented research was mainly supported by the “Easy-to-Assemble Stack Type (EAST): Development of solid oxide fuel cell stack for the innovation in Polish energy sector” project, carried out within the FIRST TEAM program (project number First TEAM/2016-1/3) of the Foundation for Polish Science, cofinanced by the European Union under the European Regional Development Fund and partially by AGH Grant No. 16.16.210.476. The AVIZO software used in the research for the microstructural analysis of the electrodes was funded by the program “Excellence Initiative—Research University” for the AGH University of Krakow, Poland.

Data Availability Statement

Data available on request from the authors.

Acknowledgments

The authors are grateful for the support. This research made use of the computational power provided by the PL-Grid Infrastructure.

Conflicts of Interest

The Authors declare the following competing interests: M.M., G.B. and J.Sz. are employees of AGH University of Science and Technology, which has applied for a Polish patent “High-Temperature Solid Oxide Fuel Cell Stack,” Int. Cl. H01M 8/2432 (2016.01) H01M 8/2475 (2016.01) [6]. The institute currently holds the patent, with G.B. listed as an inventor. K.Ś and M.Ch. are Ph.D. students at the aforementioned institution.

Nomenclature

Cinternal momentum resistance factor(-)
D i mass diffusion coefficient( m 2   s 1 )
D i , t thermal diffusion coefficient( m 2   s 1   K 1 )
F Faraday constant( 9.65 × 10 4   C mol 1 )
hspecific enthalpy( J   kg 1 )
h react enthalpy change( J   mol 1 )
Icurrent( A )
i an eq anode equilibrium exchange current( A   m 1 )
i cat eq cathode equilibrium exchange current( A   m 2 )
icurrent density flux( A   m 2 )
jvolumetric transfer current density( A   m 3 )
J i diffusion flux( kg   m 2   s 2 )
kthermal conductivity( W   m 1   K 1 )
Mmolar mass( kg   mol 1 )
pstatic pressure( Pa )
Ppower( W )
q V ˙ volumetric flux of species( m 3   s 1 )
R universal gas constant( 8.314   J   K 1   mol 1 )
R Ohm ohmic resistance( Ω m )
S source/sink term of momentum( kg   m 2   s 2 )
S p source/sink term of mass( kg   m 3   s 1 )
S i source/sink term of species rates( kg   m 3   s 1 )
S h source/sink term of heat( W   m 3 )
Ttemperature( K )
v velocity vector( m   s 1 )
X i local species concentration(kmol m 3 )
Y i species mass fraction(-)
Greek letters
α transfer coefficient(-)
β permeability( m 2 )
γ concentration dependence(-)
ε porosity rate(-)
ζ TPB triple phase boundary length density( m   m 3 )
ζ DBP double phase boundary length density( m 2   m 3 )
η local surface overpotential( V )
μ dynamic viscosity( Pa s )
μ ^ i chemical potential of species i( J   mol 1 )
ρ density( k g   m 3 )
σ conductivity( S   m 1 )
τ ¯ ¯ stress tensor( Pa )
ϕ electric potential( V )
φ actual potential of an appropriate phase( V )
Sub- and superscripts
a anodic
an anode
c cathodic
cat cathode
DPB double phase boundary
eff effective value
el electronic
eq equilibrium
ireaction component
ion ionic
react reaction
ref reference value
s solid
T thermal
TPB triple phase boundary
Abbreviations
3Dthree-dimensional
CADcomputer aided design
CFDcomputational fluid dynamics
OCVopen circuit voltage
SOFCsolid oxide fuel cell

References

  1. Buchaniec, S.; Sciazko, A.; Mozdzierz, M.; Brus, G. A Novel Approach to the Optimization of a Solid Oxide Fuel Cell Anode Using Evolutionary Algorithms. IEEE Access 2019, 7, 34361–34372. [Google Scholar] [CrossRef]
  2. Prokop, T.A.; Berent, K.; Iwai, H.; Szmyd, J.S. A Three-Dimensional Numerical Assessment of Heterogeneity Impact on a Solid Oxide Fuel Cell’s Anode Performance. Catalysts 2018, 8, 503. [Google Scholar] [CrossRef] [Green Version]
  3. Koncewicz, W.; Moździerz, M.; Brus, G. A fast Gaussian process-based method to evaluate carbon deposition during hydrocarbons reforming. Int. J. Hydrogen Energy 2023, 48, 11666–11679. [Google Scholar] [CrossRef]
  4. Mukerjee, S.; Leah, R.; Selby, M.; Stevenson, G.; Brandon, N.P. Chapter 9—Life and Reliability of Solid Oxide Fuel Cell-Based Products: A Review. In Solid Oxide Fuel Cell Lifetime and Reliability; Brandon, N.P., Ruiz-Trejo, E., Boldrin, P., Eds.; Academic Press: Cambridge, MA, USA, 2017; pp. 173–191. [Google Scholar] [CrossRef]
  5. Zamudio-García, J.; Caizán-Juanarena, L.; Porras-Vázquez, J.M.; Losilla, E.R.; Marrero-López, D. A review on recent advances and trends in symmetrical electrodes for solid oxide cells. J. Power Sources 2022, 520, 230852. [Google Scholar] [CrossRef]
  6. Brus, G. High-Temperature Solid Oxide Fuel Cell Stack. Polish Patent PL 234427, 28 February 2020. [Google Scholar]
  7. Isenberg, A. Energy Conversion via Solid Oxide Electrolyte Electrochemical Cells at High Temperatures. Solid State Ionics 1981, 3–4, 431–437. [Google Scholar] [CrossRef]
  8. Gardner, F.; Day, M.; Brandon, N.; Pashley, M.; Cassidy, M. SOFC Technology Development at Rolls-Royce. J. Power Sources 2000, 86, 122–129. [Google Scholar] [CrossRef]
  9. Haberman, B.; Young, J. Three-Dimensional Simulation of Chemically Reacting Gas Flows in the Porous Support Structure of an Integrated-Planar Solid Oxide Fuel Cell. Int. J. Heat Mass Transf. 2004, 47, 3617–3629. [Google Scholar] [CrossRef]
  10. Koi, M.; Yamashita, S.; Matsuzaki, Y. Development of Segmented-in-series Cell-stacks with Flat-tubular Substrates. ECS Trans. 2007, 7, 235–243. [Google Scholar] [CrossRef]
  11. Badding, M.; Bouton, W.; Brown, J.; Kester, L.; Pollard, S.; Tanner, C.W.; Tepesch, P. Ultra-Low Mass Planar SOFC Design. ECS Trans. 2011, 35, 465–471. [Google Scholar] [CrossRef]
  12. Kim, M.W.; Son, M.J.; Park, H.; Park, J.Y.; Lim, H.T. Experimental Investigation of In-plane Performance Variation on Anode Supported Solid Oxide Fuel Cells Using Segmented Cathodes and Reference Electrodes. Fuel Cells 2020, 20, 212–219. [Google Scholar] [CrossRef]
  13. Timurkutluk, B.; Timurkutluk, C.; Mat, M.D.; Kaplan, Y. A Review on Cell/Stack Designs for High Performance Solid Oxide Fuel Cells. Renew. Sustain. Energy Rev. 2016, 56, 1101–1121. [Google Scholar] [CrossRef]
  14. Ghorbani, B.; Vijayaraghavan, K. A review study on software-based modeling of hydrogen-fueled solid oxide fuel cells. Int. J. Hydrogen Energy 2019, 44, 13700–13727. [Google Scholar] [CrossRef]
  15. Ghorbani, B.; Vijayaraghavan, K. 3D and simplified pseudo-2D modeling of single cell of a high temperature solid oxide fuel cell to be used for online control strategies. Int. J. Hydrogen Energy 2018, 43, 9733–9748. [Google Scholar] [CrossRef]
  16. Tikiz, I.; Taymaz, I.; Pehlivan, H. CFD modelling and experimental validation of cell performance in a 3-D planar SOFC. Int. J. Hydrogen Energy 2019, 44, 15441–15455. [Google Scholar] [CrossRef]
  17. Dong, S.K.; Jung, W.N.; Rashid, K.; Kashimoto, A. Design and numerical analysis of a planar anode-supported SOFC stack. Renew. Energy 2016, 94, 637–650. [Google Scholar] [CrossRef]
  18. Pirasaci, T. Non-uniform, multi-stack solid oxide fuel cell (SOFC) system design for small system size and high efficiency. J. Power Sources 2019, 426, 135–142. [Google Scholar] [CrossRef]
  19. Pianko-oprych, P.; Zinko, T. Computational fluid dynamics calculation of a planar solid oxide fuel cell design running on syngas. Chem. Process. Eng. 2017, 38, 513–521. [Google Scholar] [CrossRef] [Green Version]
  20. Zhang, Z.; Chen, J.; Yue, D.; Yang, G.; Ye, S.; He, C.; Wang, W.; Yuan, J.; Huang, N.; Equipment, T. Three-dimensional CFD modeling of transport phenomena in a cross-flow anode-supported planar SOFC. Energies 2014, 7, 80–98. [Google Scholar] [CrossRef] [Green Version]
  21. Wei, S.S.; Wang, T.H.; Wu, J.S. Numerical modeling of interconnect flow channel design and thermal stress analysis of a planar anode-supported solid oxide fuel cell stack. Energy 2014, 69, 553–561. [Google Scholar] [CrossRef]
  22. Pianko-oprych, P.; Zinko, T. Simulation of the steady-state behaviour of a new design of a single planar Solid Oxide Fuel Cell. Pol. J. Chem. Technol. 2016, 1, 64–71. [Google Scholar] [CrossRef] [Green Version]
  23. Li, A.; Song, C.; Lin, Z. A multiphysics fully coupled modeling tool for the design and operation analysis of planar solid oxide fuel cell stacks. Appl. Energy 2017, 190, 1234–1244. [Google Scholar] [CrossRef]
  24. Chelmehsara, M.E.; Mahmoudimehr, J. Techno-economic comparison of anode-supported, cathode-supported, and electrolyte-supported SOFCs. Int. J. Hydrogen Energy 2018, 43, 15521–15530. [Google Scholar] [CrossRef]
  25. Beale, S.B.; Choi, H.w.; Pharoah, J.G.; Roth, H.K.; Jasak, H.; Hyup, D. Open-source computational model of a solid oxide fuel cell. Comput. Phys. Commun. 2016, 200, 15–26. [Google Scholar] [CrossRef] [Green Version]
  26. Nishida, R.T.; Beale, S.B.; Pharoah, J.G.; Haart, L.G.J.D.; Blum, L. Three-dimensional computational fluid dynamics modelling and experimental validation of the Jülich Mark-F solid oxide fuel cell stack. J. Power Sources 2018, 373, 203–210. [Google Scholar] [CrossRef]
  27. Andersson, M.; Paradis, H.; Yuan, J.; Sundén, B. Modeling Analysis of Different Renewable Fuels in an Anode Supported SOFC. J. Fuel Cell Sci. Technol. 2011, 8, 031013. [Google Scholar] [CrossRef]
  28. Mozdzierz, M.; Berent, K.; Kimijima, S.; Szmyd, J.S.; Brus, G. A Multiscale Approach to the Numerical Simulation of the Solid Oxide Fuel Cell. Catalysts 2019, 9, 253. [Google Scholar] [CrossRef] [Green Version]
  29. Chalusiak, M.; Wróbel, M.; Moździerz, M.; Berent, K.; Szmyd, J.; Kimijima, S.; Brus, G. A numerical analysis of unsteady transport phenomena in a Direct Internal Reforming Solid Oxide Fuel Cell. Int. J. Heat Mass Transf. 2019, 131, 1032–1051. [Google Scholar] [CrossRef]
  30. Costamagna, P.; Selimovic, A.; Del Borghi, M.; Agnew, G. Electrochemical Model of the Integrated Planar Solid Oxide Fuel Cell (IP-SOFC). Chem. Eng. J. 2004, 102, 61–69. [Google Scholar] [CrossRef]
  31. Son, B.W.; Park, S.J.; Lee, S.B.; Lim, T.H.; Song, R.H.; Lee, J.W. A Tubular Segmented-in-Series Solid Oxide Fuel Cell with Metallic Interconnect Films: A Performance Study through Mathematical Simulations. Curr. Appl. Phys. 2013, 13, 1906–1913. [Google Scholar] [CrossRef]
  32. Cui, D.; Ji, Y.; Chang, C.; Wang, Z.; Xiao, X.; Li, Y. Influence of structure size on voltage uniformity of flat tubular segmented-in-series solid oxide fuel cell. J. Power Sources 2020, 460, 228092. [Google Scholar] [CrossRef]
  33. Ahmed, S.; McPheeters, C.; Kumar, R. Thermal-hydraulic model of a monolithic solid oxide fuel cell. J. Electrochem. Soc. 1991, 138, 2712–2718. [Google Scholar] [CrossRef]
  34. Li, X. Principles of Fuel Cells; Taylor & Francis: Boca Raton, FL, USA, 2006. [Google Scholar] [CrossRef]
  35. Patankar, S.V. Numerical Heat Transfer and Fluid Flow; Series in Computational Methods in Mechanics and Thermal Sciences, Hemisphere; CRC Press: Boca Raton, FL, USA, 1980. [Google Scholar] [CrossRef]
  36. Le, A.; Beale, S.; Pharoah, J. Validation of a Solid Oxide Fuel Cell Model on the International Energy Agency Benchmark Case with Hydrogen Fuel. Fuel Cells 2014, 15, 27–41. [Google Scholar] [CrossRef]
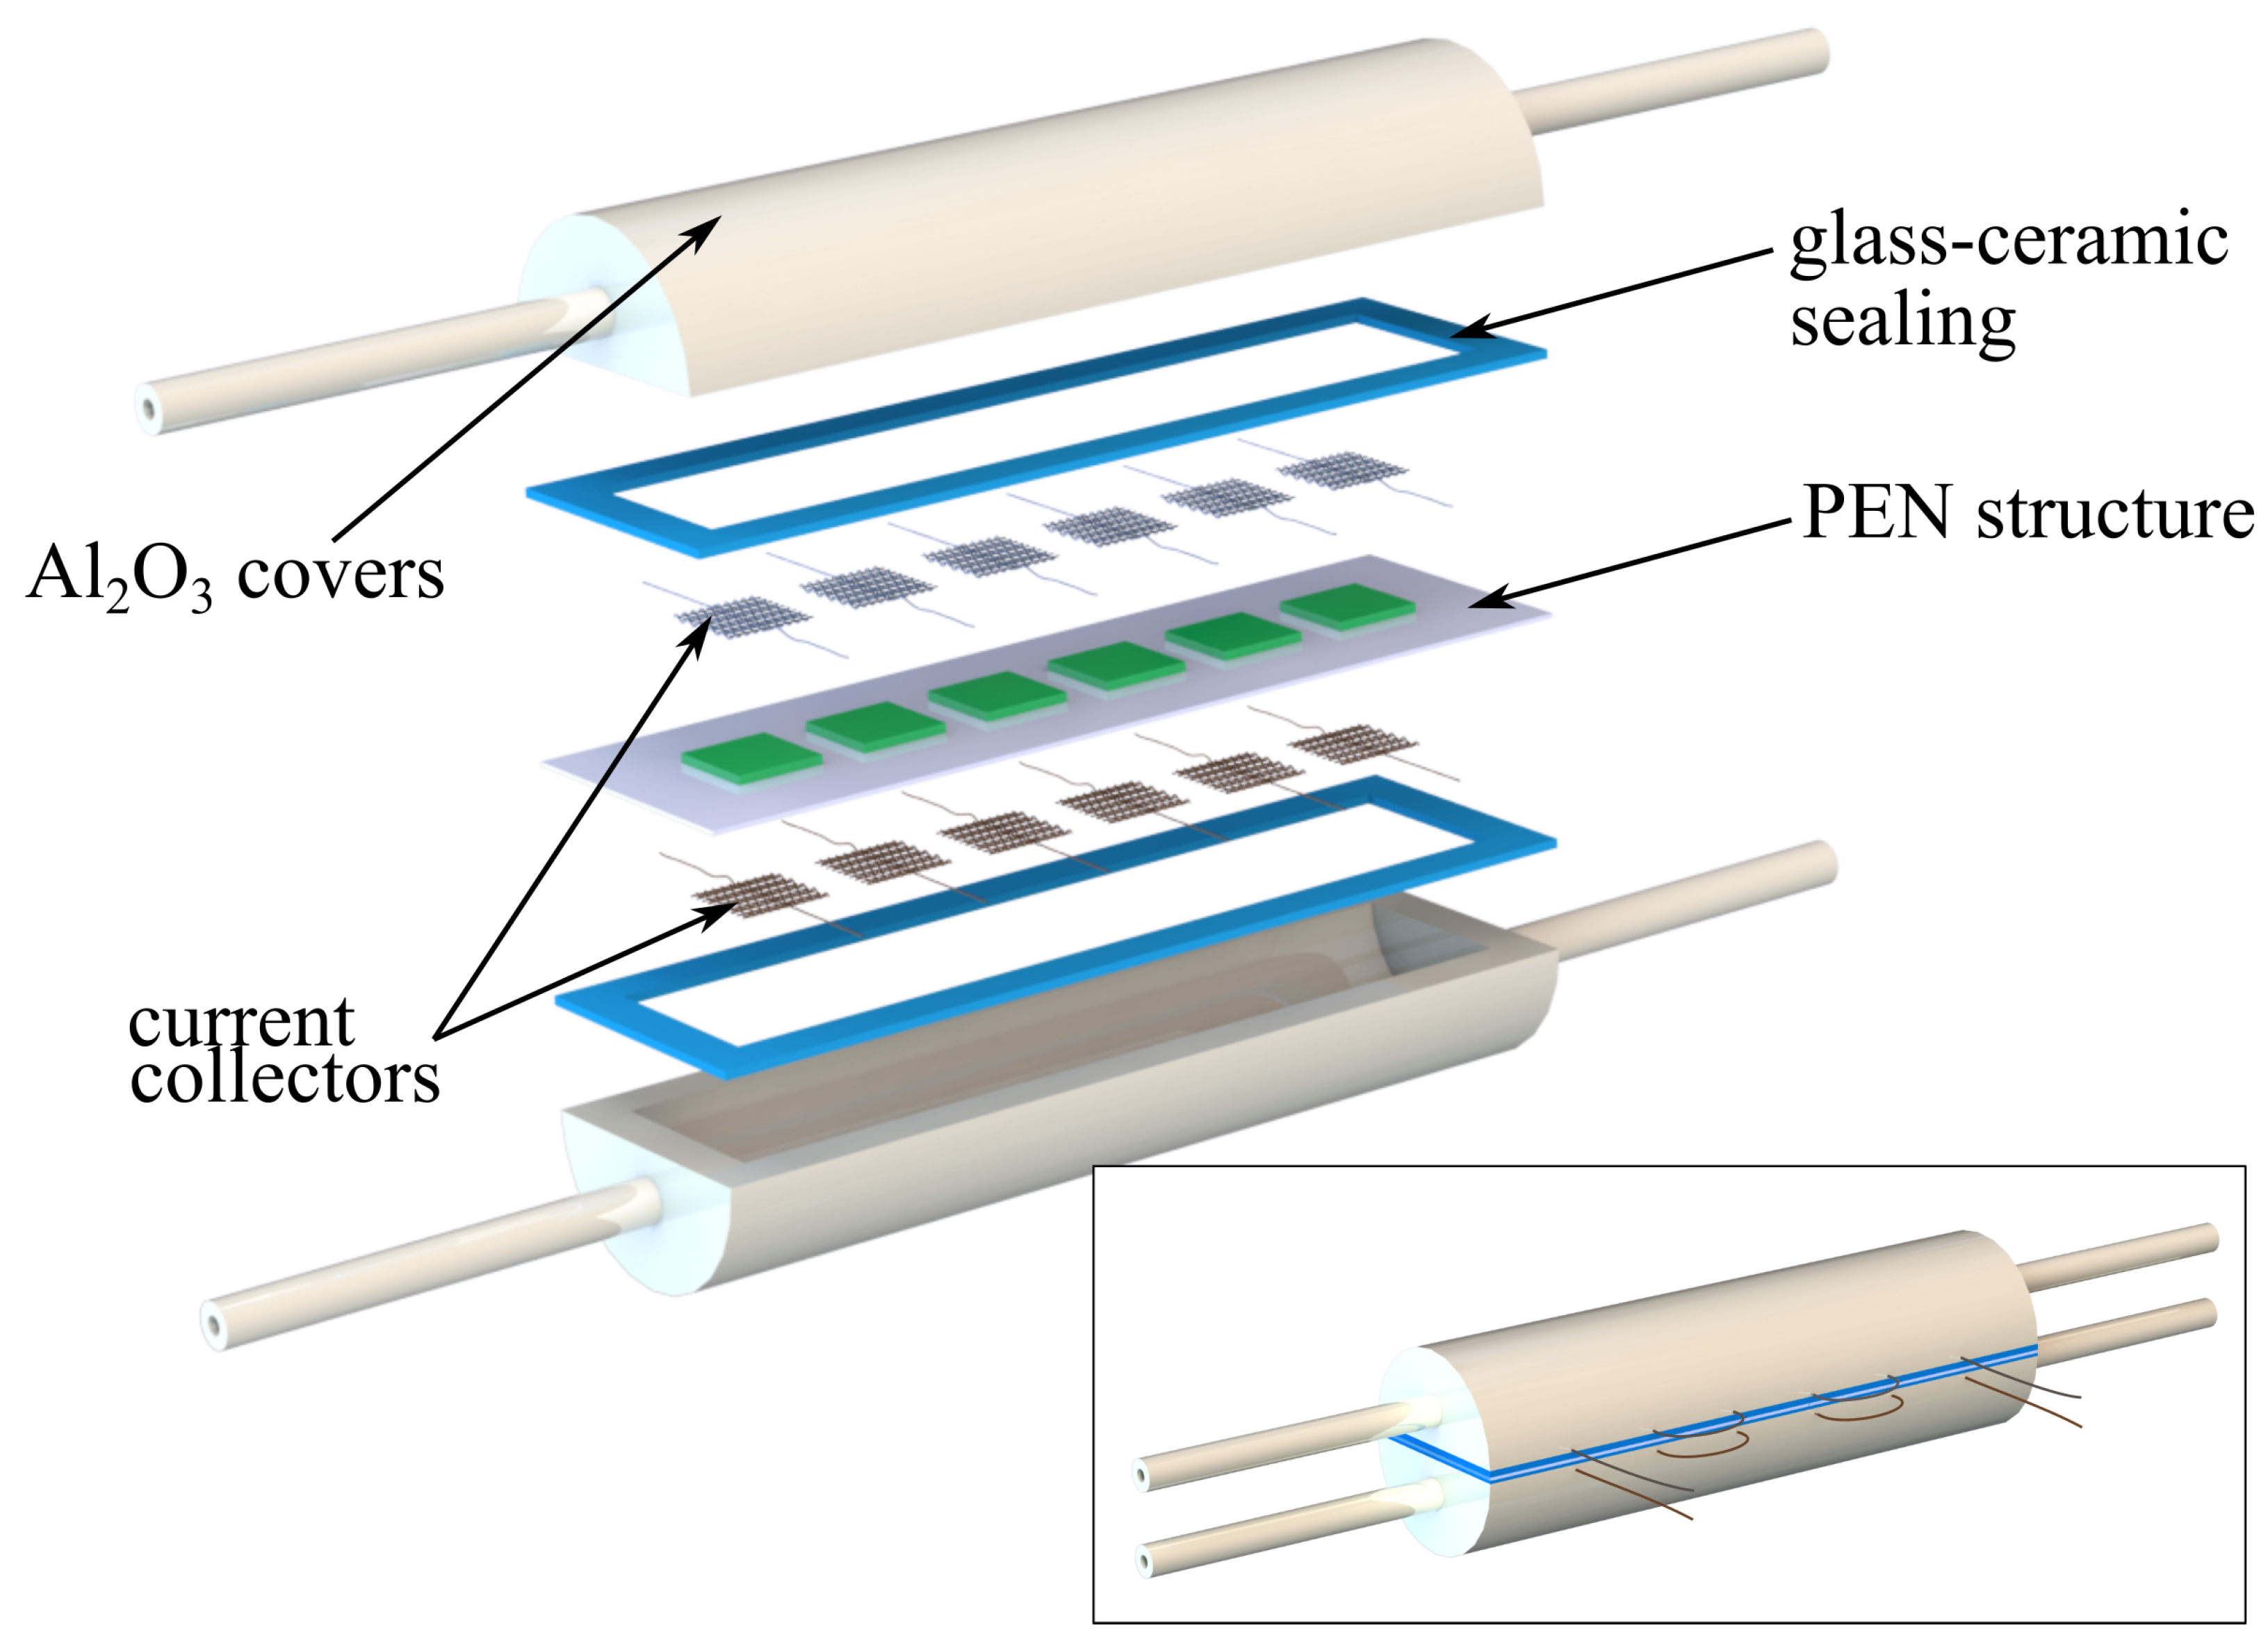
Figure 1. Model of the stack assembly.
Energies 16 04511 g001
Figure 2. Geometry of the stack PEN structure.
Energies 16 04511 g002
Figure 3. Silver mesh to serve as a current collector.
Energies 16 04511 g003
Figure 4. The stack consists of six pairs of electrodes on a single electrolyte, electrically connected in series.
Energies 16 04511 g004
Figure 5. (A) Exploded view of the investigated stack assembly model. (B) Ready for enclosure stack plate. (C) Stack with applied ceramic covers.
Energies 16 04511 g005
Figure 6. The assembly of the stack, left-hand side. Schematic of an experimental setup, right-hand side.
Energies 16 04511 g006
Figure 7. Schematic of the three-dimensional computational domain, not in scale.
Energies 16 04511 g007
Figure 8. Main boundary conditions.
Energies 16 04511 g008
Figure 9. Schematic description of the electrical circuit of the stack.
Energies 16 04511 g009
Figure 10. Comparison of current-voltage characteristics of four different meshes.
Energies 16 04511 g010
Figure 11. Visualization of the mesh details. On the left side, the whole domain is shown, presenting a close-up of the mesh configuration in the thin solid layer area (lime box). On the right side, a domain with a hidden fuel channel interior is shown to visualize the mesh configuration in the cell zone on the middle figure (cyan box) and to present mesh in the electrolyte area on the bottom figure (magenta box).
Energies 16 04511 g011
Figure 12. Chart of current-voltage (current-power) characteristics, obtained from the model (solid lines) and experimental tests (circle marks). The results presented compare the characteristics of three different concentrations of hydrogen at the operating temperature of T = 1173   K and T = 1123   K .
Energies 16 04511 g012
Figure 13. Comparison of co-flow and counter-flow arrangement in terms of electric performance. The upper graph shows the electric characteristics, the lower part presents the potential distribution along the stack in both configurations (left side—co-flow, right side—counter-flow). Operating parameters are given in the graph’s subtitle.
Energies 16 04511 g013
Figure 14. Comparison of co-flow and counter-flow arrangement in terms of hydrogen, water vapor, and oxygen mass fractions, counting from the upper side. The left side presents co-flow, and right side presents counter-flow configuration.
Energies 16 04511 g014
Figure 15. Top: Characteristics of current-voltage (current-power), obtained from the model. Two cases represent different gas flow rates at the operating temperature of T = 1173   K . The circle marks indicate the maximum power points. Bottom: Potential (power) distribution of individual cells in the stack of two circles marked points (a,b). Cells are numbered according to the flow direction. (a) q ˙ V H 2 = 200 mL/min; q ˙ V Air = 200 mL/min; P = 0.935   W ; I = 0.356   A ; T = 1173   K , (b) q ˙ V H 2 = 1000 mL/min; q ˙ V Air = 2000 mL/min; P = 1.191   W ; I = 0.515   A ; T = 1173   K .
Energies 16 04511 g015
Figure 16. Not scaled current density distribution in the cross section of the fourth cell. View from the outlet side. q ˙ V H 2 = 1000 mL/min; q ˙ V Air = 2000 mL/min; P = 1.191   W ; I = 0.515   A ; and T = 1173   K .
Energies 16 04511 g016
Table 1. Electrochemical and material parameters of solid zones.
ParameterSymbolValue
AnodeCathode
For T = 1173 K
Anode equilibrium exchange current i an eq [ A   m 1 ] 5.35 × 10 6 [28]-
Cathode equilibrium exchange current i cat eq [ A   m 2 ]-220 [28]
Concentration dependence γ [-]0.05 *0.05 *
Electric conductivity σ el [ S   m 1 ]42,941 [28]22,560 [28]
For T = 1123 K
Anode equilibrium exchange current i an eq [ A   m 1 ] 2.67 × 10 6 [28]-
Cathode equilibrium exchange current i cat eq [ A   m 2 ]-149 [28]
Concentration dependence γ [-]1 *1 *
Electric conductivity σ el [ S   m 1 ]43,838 [28]21,399 [28]
Reference concentration X i , ref [kmol m 3 ] 1.078 × 10 2 [20] 2.38 × 10 3 [20]
Anode side transfer rate α a [-]1.4 [28]1.2 [28]
Cathode side transfer rate α c [-]0.8 [28]1 [28]
Porosity ε [-]0.48 **0.39 **
Triple phase boundary length density ζ TPB [ m   m 3 ] 3.56 × 10 12 [28]-
Double phase boundary length density ζ DPB [ m 2   m 3 ]- 2.59 × 10 6 [28]
Density ρ [ k g   m 3 ]6220 [18]5300 [19]
Specific heat c p [ J   kg 1   K 1 ]450 [18]607 [19]
Thermal conductivityk [ W   m 1   K 1 ]6.23 [18]10 [19]
ParameterSymbolValue
ElectrolyteCurrent Collector
Electric conductivity σ el [ S   m 1 ] 10 16 * 1.75 × 10 5 *
Thermal conductivityk [ W   m 1   K 1 ]2 ***100 ***
* Fitted, ** Measured, *** ANSYS, Inc., Fluent, v.2022R1 Materials Data Base.
Table 2. Continuity of mass and time duration per iteration ratio.
ParameterValue
Number of elements 1.6 × 10 5 6 × 10 5 1.1 × 10 6 4 × 10 6
Mass conservation ( kg   s 1 ) 1.06 × 10 8 2.53 × 10 18 10 13 2.5 × 10 10
Time per iteration ( s )1.052.143.6817.45
Table 3. Spatial discretization methods and underrelaxation factors.
ParameterSpatial DiscretizationUnderrelaxation Factor
GradientGreen-Gauss Node Based0.3
PressureSecond Order1
DensityFirst Order Upwind1
MomentumFirst Order Upwind0.7
HydrogenFirst Order Upwind1
OxygenFirst Order Upwind1
Water VaporFirst Order Upwind1
EnergyFirst Order Upwind1
Electric PotentialFirst Order Upwind1
Ionic PotentialFirst Order Upwind1
Disclaimer/Publisher’s Note: The statements, opinions and data contained in all publications are solely those of the individual author(s) and contributor(s) and not of MDPI and/or the editor(s). MDPI and/or the editor(s) disclaim responsibility for any injury to people or property resulting from any ideas, methods, instructions or products referred to in the content.