Article

CFD Simulation and Experimental Study on a Thermal Energy Storage–Updraft Solid Waste Gasification Device

1
Department of Thermal Science and Energy Engineering, University of Science and Technology of China, Hefei 230026, China
2
Guangzhou Institute of Energy Conversion, Chinese Academy of Sciences, Guangzhou 510640, China
3
State Key Laboratory of Coal Combustion, Huazhong University of Sciences and Technology, Wuhan 430074, China
*
Author to whom correspondence should be addressed.
Energies 2023, 16(12), 4580; https://doi.org/10.3390/en16124580
Submission received: 11 May 2023 / Revised: 31 May 2023 / Accepted: 3 June 2023 / Published: 8 June 2023
(This article belongs to the Section D: Energy Storage and Application)

Abstract

:
A thermal energy storage–updraft gasification device is a type of reactor that should be considered for use in solid waste gasification research that can save energy. However, the operating parameters and internal flow field during its operation remain unclear. In this study, a numerical model of the thermal energy storage–solid waste gasification device based on the computational fluid dynamics dense discrete phase model (CFD-DDPM) which had almost never been used before was established, and an innovative method that causes particles to be piled to simulate the gasification process was proposed according to the updraft fixed bed gasification characteristics; meanwhile, solid waste gasification experiments were conducted on the device. This study focused on the influence of moisture content and excess air coefficient on the gasification process of solid waste particles, and the velocity, pressure, temperature, and species distribution of the internal flow field of the device were analyzed. Simulation results showed that the higher the moisture content of particles, the greater the amplitude of changes in the internal physical field of the device. The fluid pressure drop is around 25 Pa–75 Pa for different working conditions. The combustible species of the gas of moist particles raise slightly with the increase in excess air coefficient, while the dry particles have the opposite effect. Compared with other gasification devices of the same type, the hydrogen production of this device is about 2–3 times higher. Our findings could facilitate the analysis, predict the operation status, and provide a theoretical basis for the improvement of this device.

1. Introduction

The global energy shortage is becoming increasingly severe, and there is an urgent need to use traditional fossil energy efficiently while finding novel alternative energy sources [1,2]. Solid waste is a kind of substance with a wide range of sources and has some advantages such as good recyclability and circularity, which make it one of the most promising energy sources [3]. Meanwhile, with the increasingly serious problems of resource waste and environmental pollution caused by solid waste in production and daily life, the proper treatment of solid waste is an urgent need, especially in small and medium-sized cities and rural areas. The proposals for carbon (C) peak and C neutral policy put forward new requirements for the utilization and development of clean energy and efficient technologies [4,5]. Among many solid waste treatment technologies, gasification technology is a kind of thermochemical conversion technology that heats organic materials under oxygen (O2)-poor conditions and decomposes them into combustible gases, fixed carbon, and tar. Gasification technology can make full use of the physical resources and energy of solid waste to obtain high-priced products and fix carbon dioxide (CO2) [6,7,8], which can achieve efficient recovery of C resources, and has increasingly attracted the attention of researchers.
The structure and internal operation of the different gasification devices directly influence their gasification reaction characteristics. Common gasification devices include rotary kilns, fluidized beds, entrained flow beds, and fixed beds [9]. Among them, the fixed bed has unique characteristics, such as simple operation, low cost, high economic benefits, low technical requirements, and small-scale application [10,11]. Such advantages can facilitate the addressing of low solid waste treatment capacity and the urgent need for lightweight gasification reactors in small and medium-sized cities and rural areas, which prompted the selection of the fixed bed reactor for our research.
Considering ameliorating a gasification device to improve its thermal efficiency and reduce energy loss, combining thermal energy storage technology with the gasification process is a good way. Thermal energy storage technology has been widely used in many fields, such as thermal energy storage–nuclear power plant coupled systems [12,13], and there has been much related numerical simulation work [14,15,16]. There are not many studies on the combination of gasification and thermal energy storage technology; at the same time, there is less numerical simulation work related to these issues. Therefore, it is very important to develop thermal energy storage–gasification technology, design and run new types of thermal energy storage–gasification reactors, and improve related numerical simulation research.
Research on gasification processes is typically divided into experimental and numerical simulation methods. Compared with experimental methods, numerical simulation methods can be used to obtain all the information on all positions inside the gasification device, some of which is difficult to obtain through experimental means (e.g., changes in gas species, flow rate, and partial furnace temperature beyond the temperature measurement point at different positions inside the device). Moreover, numerical simulation methods can predict and analyze the physical state of reactor operation, reveal its intrinsic mechanism, and guide the improvement of the device; by combining numerical methods with experimental data, the accuracy of the study can be verified, and reasonable results can be obtained. The gasification process of solid waste belongs to the scope of multiphase flow; therefore, understanding and applying methods related to the numerical simulation of multiphase flow is crucial. A detailed review of the principles of numerical simulation of multiphase flow was conducted by Alobaid et al. (2022). By comparing different numerical calculation methods, industrial software, and equipment parameters involved in fluidized bed systems, they provided a systematic overview of the application of numerical simulation tools in multiphase flow, and their paper serves as an important reference in the study of numerical simulation of multiphase flow [17]. Adnan et al. (2020; 2021a; 2021b) conducted a comparative study on the application of the energy-minimization multiscale (EMMS) drag force model on the two-fluid model (TFM) and dense discrete phase model (DDPM) and confirmed the superiority of the EMMS drag force model in resolving the solid phase. Compared to the TFM model, the DDPM model can obtain information on solid circulation and discrete phase trajectories and is used for the acquisition of grid-independent solutions [18,19,20]. Hwang et al. (2019) investigated the volume fraction of particulate solids in a cyclone separator using the DDPM–kinetic theory of granular flow (DDPM-KTGF) method. By comparing the results with those obtained using the computational fluid dynamics discrete element model (CFD-DEM) method, they found that the DDPM-KTGF method could obtain more reasonable results with significantly less computational time [21]. Regarding the application of multiphase flow in solid waste gasification, Kong et al. (2022) implemented a CFD-DEM method based on the gasification of biomass in a bubbling fluidized bed (BFB) reactor. Numerical simulation studies were conducted, and the authors concluded that the highest rate of biomass pyrolysis reaction was achieved in a medium-density region. Sand and biomass particles exhibited synchronous horizontal motion, and higher operating temperatures resulted in higher solid dispersion coefficients; therefore, increasing the operating temperature and steam/biomass feedstock mass ratio (S/B) promoted biomass gasification reactions in the BFB [22]. Ostermeier et al. (2019) simulated the solid waste gasification state at three different moments during the operation of the fluidized bed. They confirmed the correctness of the model by comparing simulation results with experimental results [23]. Other studies on the numerical simulation of the solid waste gasification process have also been published [24,25,26,27,28].
The above-mentioned studies mostly focused on fluidized bed-type reactors because they have rich information on multiphase coupling motion, whereas fixed beds have less information than fluidized beds because of the immobility of the particle bed prepared by material stacking during operation. However, fixed beds, which are widely used reactors, also have great research value and significance, particularly in solid waste gasification. Compared with a fixed bed, a fluidized bed has a high cost, complex structure, and high operational difficulty; nevertheless, a fixed bed has a simple design, strong feedstock adaptability, and easy adjustment of operating conditions [29]; therefore, it has unique advantages in treating non-homogeneous and large-mass solid waste. Kumar and Paul (2019) simulated the gasification of rubberwood in a downdraft gasifier, modified the chemical reactions to make the exit gas composition more reasonable for different species, and validated the CFD model to study the effect of the gasifier equivalent ratio on the exit gas composition and gasifier temperature [30]. Ismail and El-Salam (2015) simulated the gasification of rubberwood in a downdraft gasifier, corrected the chemical reactions to rationalize the exit gas composition for different species, and validated a CFD model to study the effect of the equivalence ratio on the exit gas composition and gasifier temperature [29]. Ngamsidhiphongsa et al. (2020) studied a downdraft fixed bed using a porous media model, coupled with a DPM model, to predict the effect of the throat diameter and height of the air nozzle from the throat on gasifier performance [31]. Lu et al. (2017) developed a two-dimensional non-stationary mathematical model to predict the C conversion and gas composition of an updraft fixed bed gasification process; the simulation result was consistent with experimental results [32]. Manek et al. (2019) used the ANSYS Fluent software for an updraft gasifier, performed simulations to investigate the effect of air excess coefficients (0.24–0.36 on the gas production of the gasifier), and obtained the optimal air excess coefficient for the gasification reaction. Experimental data on the temperature distribution curve of the gasifier wall were compared with the numerical data, and the results were in good agreement [33].
However, there are only a few reports on the simulation of the overall physical field of fixed bed gasification directly at a three-dimensional scale; most research was limited to the two-dimensional scale, as shown in Table 1. At the same time, most existing studies used methods such as TFM and DPM, which have limitations due to the adoption of certain modeling assumptions. Therefore, it is crucial to use new methods to establish a three-dimensional CFD numerical model suitable for the fixed bed gasification reaction to improve the application of numerical simulation methods in fixed bed gasification.
The present study focuses on the simulation and analysis of the solid waste gasification process in a fixed bed reactor using numerical simulation methods. Experiments were conducted on the gasification reactor, including continuous stable operation tests, recording of the local temperature in the chamber, and mass fraction distribution analysis of some components of the exit gas. The overall reaction of combustible solid waste biomass in the gasifier was investigated using the DDPM method, and two feedstocks, moist and dry particles, were studied and compared. Three gasification agent flow rates were selected for each, and six working conditions were selected to investigate the effects of the particle moisture content and different excess air coefficients on gasification. The physical field distribution of each working condition was quantitatively analyzed to reveal the operational principles of the new gasifier and lay a foundation for subsequent improvement of the reactor.

2. Operation Experiment of Gasification Reactor

2.1. Introduction

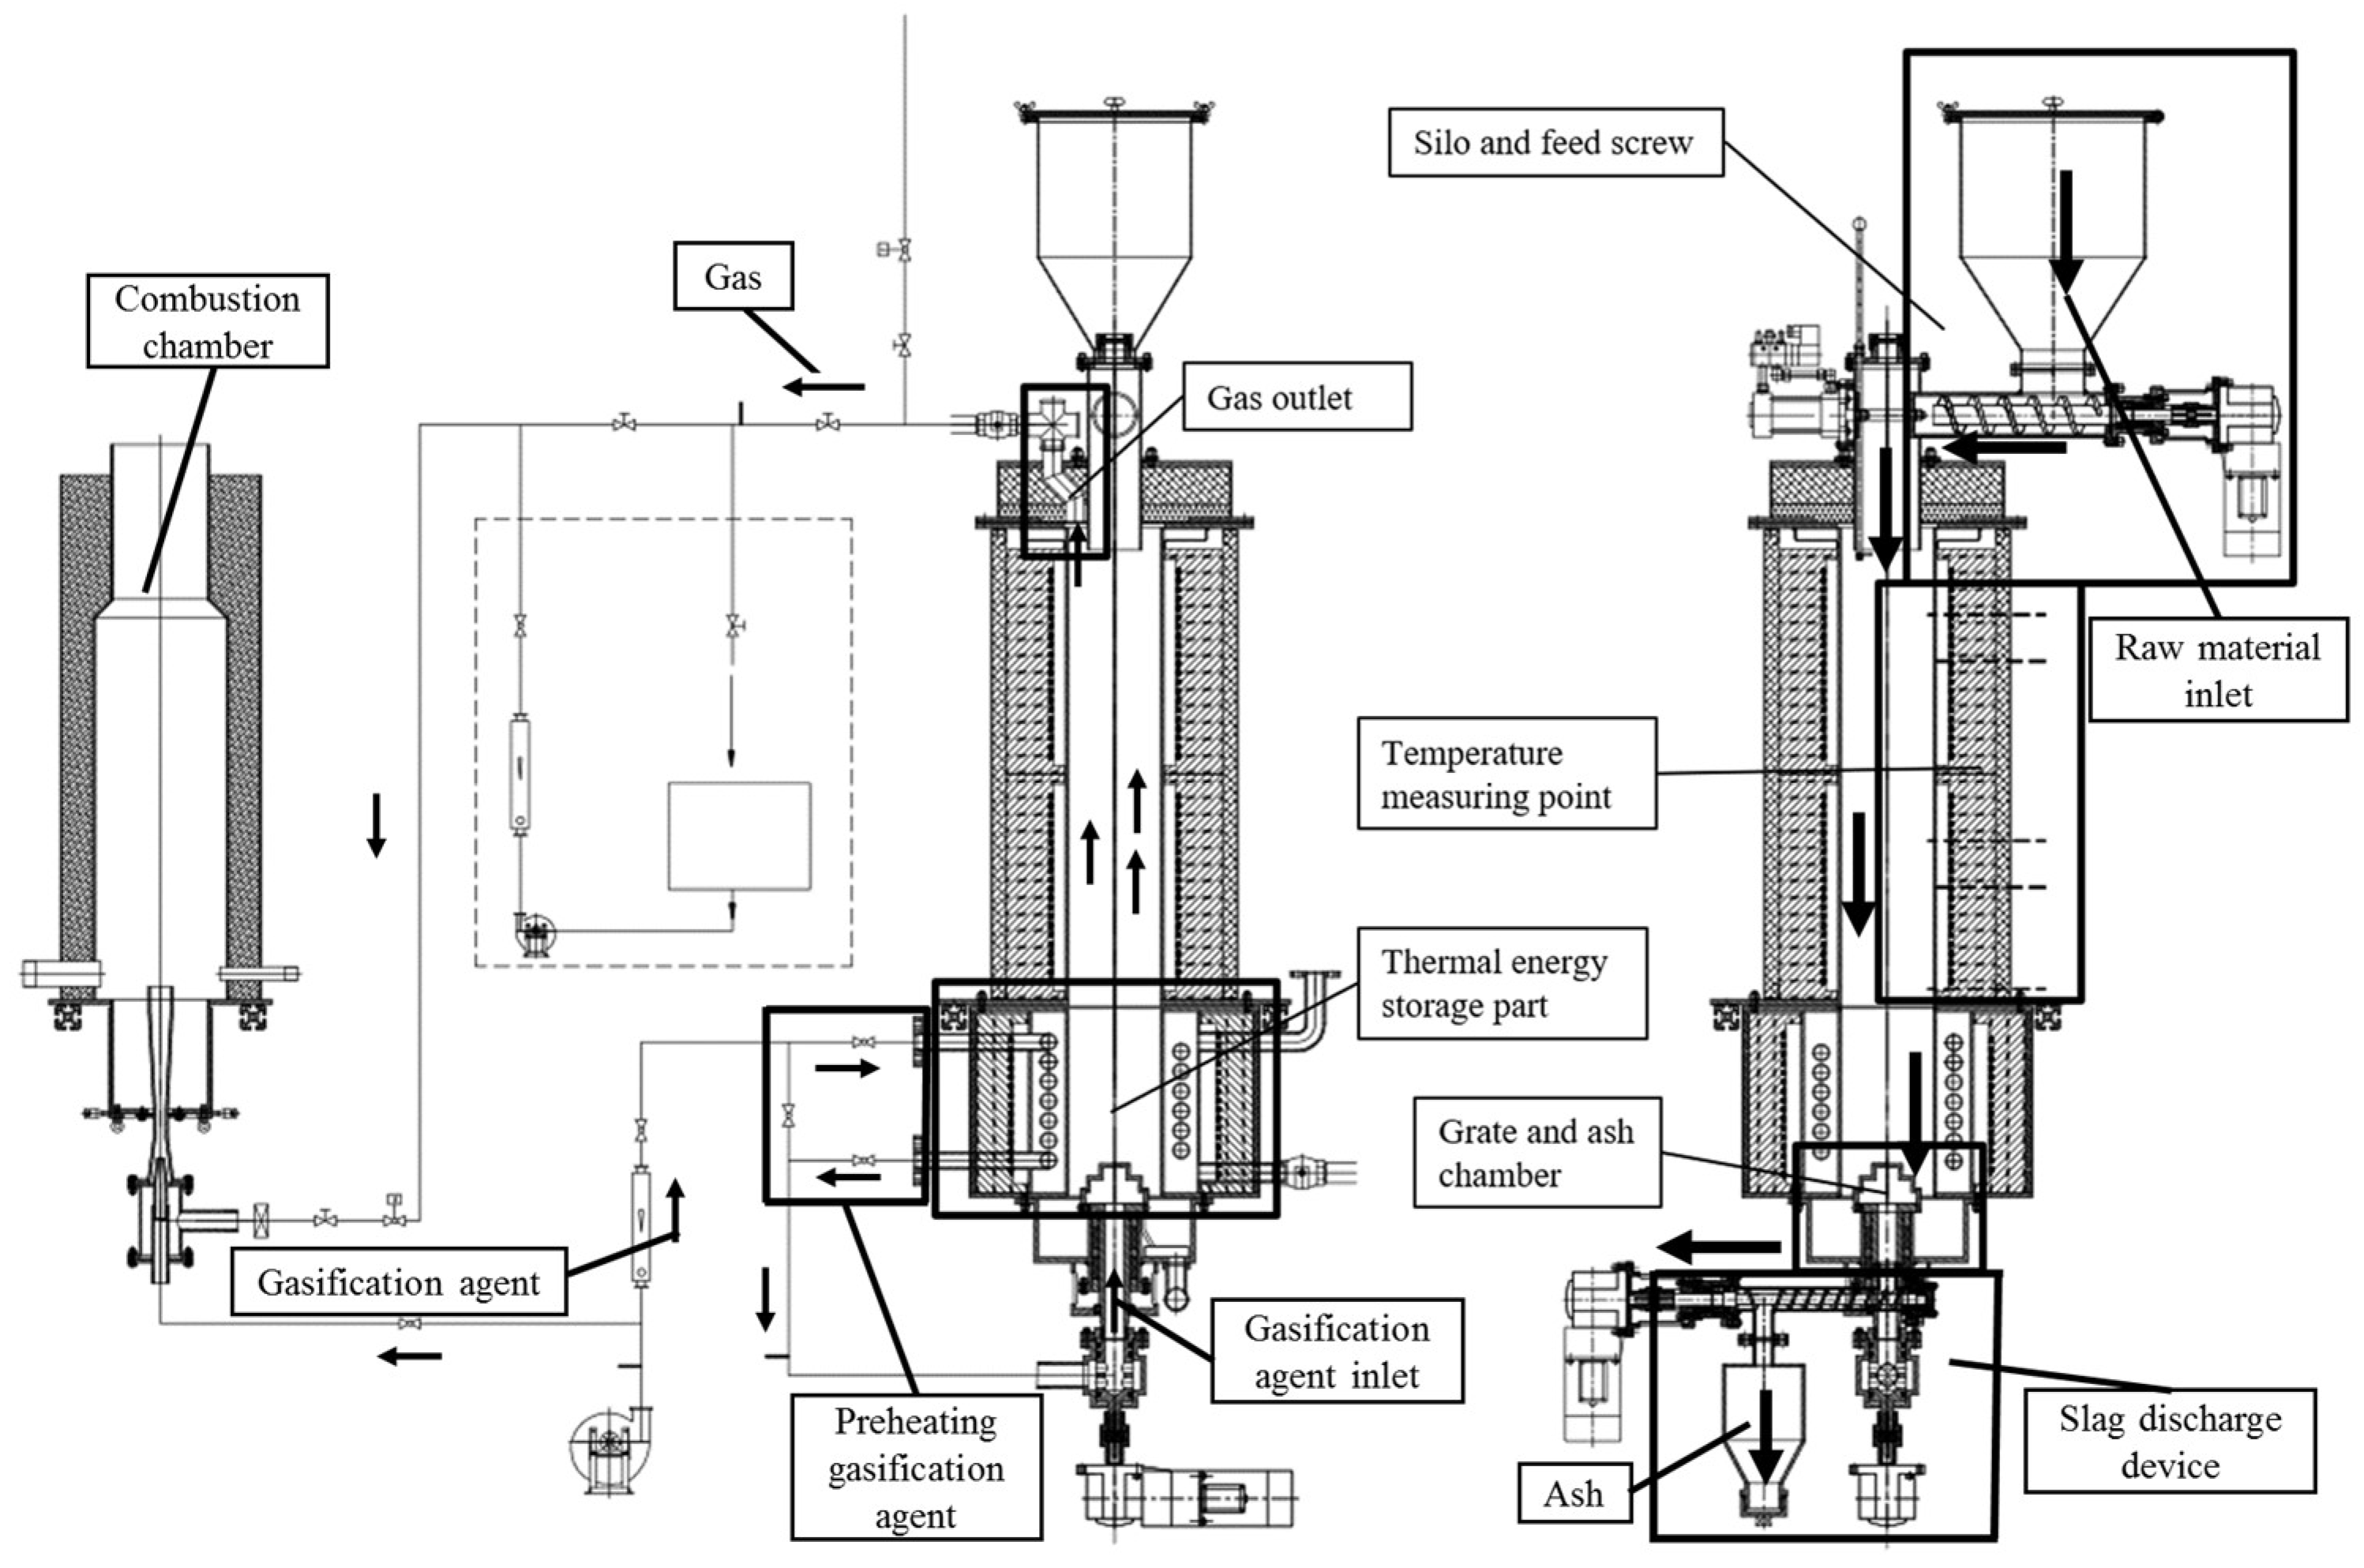
A thermal energy storage fixed bed gasification reactor was operated, for which a new design was adopted in which thermal energy storage technology was applied [37]. A thermal energy storage module was added outside the oxidation–reduction zone in the lower part of the furnace to absorb, store, and release the heat generated in the furnace to achieve energy interaction between the thermal energy storage material and reaction in the furnace, stabilize the temperature in the furnace, and maintain the reaction in a quasi-steady state. Therefore, the gasification device does not require external heat sources, the thermal energy storage part serves as an energy input point, and ideally, the device can achieve self-heating of raw materials to maintain the gasification process. This design has not been adopted by other researchers; therefore, this gasification device is innovative. The workflow diagram of the gasification device is shown in Figure 1.
The device was mainly composed of a gasifier, a thermal energy storage system, and an air supply system. In the present study, we focused on the gasifier. The gasifier was an updraft fixed bed with a cylindrical body, with a height of approximately 1 m and an inner diameter of 150 mm, including a charging hopper, feeding screw, gas outlet, pagoda-style grate, ash chamber, thermometer, and pressure gauges. The hopper was set at the top of the furnace, the gas outlet was set at the top side of the furnace, the grate and ash chambers were located at the bottom of the furnace, and a thermometer and manometer were set in the furnace chamber to monitor the temperature and pressure inside the furnace. The physical diagrams of the device are shown in the Figure 2 and Figure 3, the schematic diagram of the device is shown in Figure 4.
In this study, we selected a steel ball with a diameter of about two millimeters as the thermal energy storage material, and air as the gasification agent. The temperature of the device during the gasification process was about 300 K to 1200 K. The furnace pressure was maintained at less than 500 Pa, most of the time at about 100 Pa–300 Pa. The excess air coefficient could be adjusted within the range of 0–1. The raw material processing capacity was about 3 kg to 5 kg per hour, and the particles were piled up to about one-half to three-quarters of the furnace height. The residence time was about three to four hours.

2.2. Physical Analysis of Raw Materials

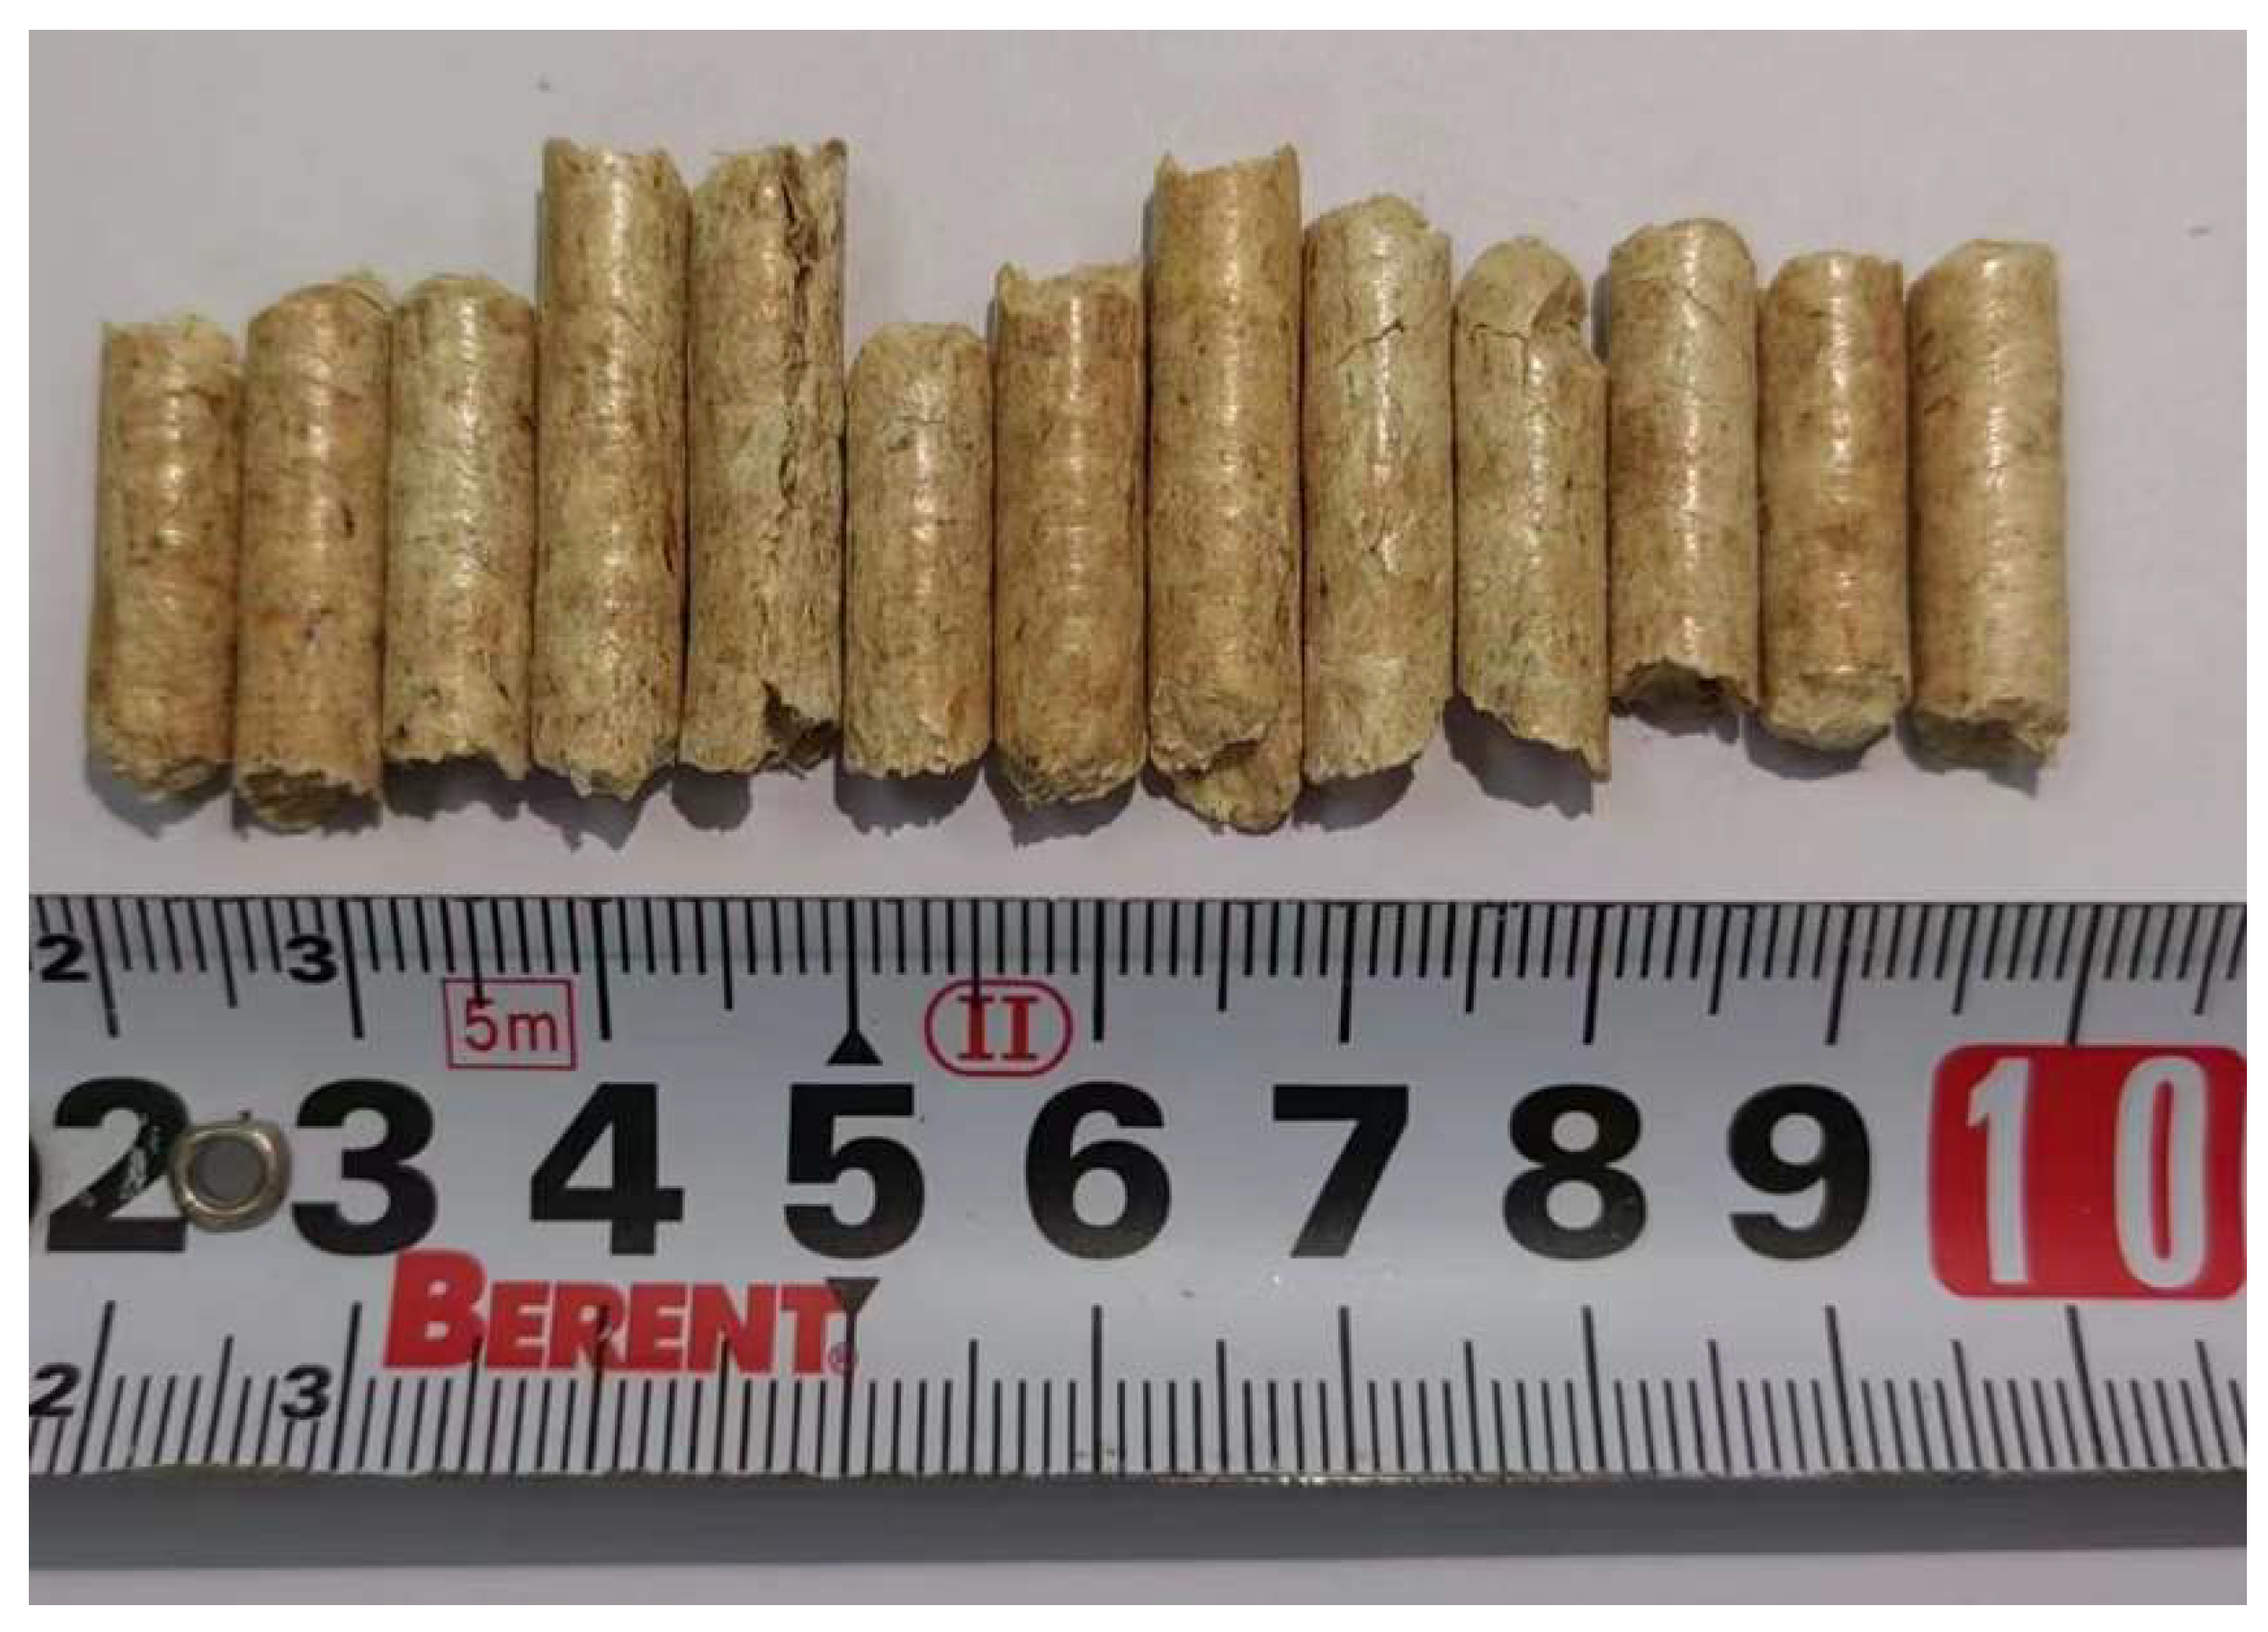
For the gasification experiments with the new gasification device, the selected combustible solid waste was biomass from agricultural and forestry waste, which was cylindrical in shape, with a diameter of 5–7 mm and a height 3–5 times greater than the diameter. The exemplary image of biomass solid waste particles is shown in Figure 5.
The results of the industrial and elemental analyses (after drying) of the combustible solid waste biomass particles used in the present study are listed in Table 2 and Table 3. A muffle furnace was mainly used for industrial analysis, and a CHONS Elemental Analyzer (vario EL cube, Elementar, Frankfurt, Germany) was mainly used for elemental analysis.
The material was dried before industrial analysis, and its ash content was very low. Therefore, in the subsequent simulation, the effect of ash was not considered. Moreover, solid waste particles do not produce ash during gasification. The elemental analysis could be determined for the elements C, hydrogen (H), and nitrogen (N). The N content of the raw materials was very low (only 0.02%) and could be considered negligible. The contents of S, Cl, and other elements were even lower. Therefore, to simplify the subsequent simulation process and reduce errors, the elements were included in the O content; that is, the raw material was considered to contain only three elements: C, H, and O (where the O content was 45.65%).
The amount of gasification agent (air) required for the complete combustion of solid waste materials is calculated as follows:
a = (2.6667C + 8H-O)/0.21
The mass ratio of raw material to gasification agent required for the complete combustion of solid waste materials was 1:6.34.

2.3. Gasification Device Operation Experiment

Before starting the gasification device, the annular thermal energy storage chamber was filled with the thermal energy storage material. When the furnace was started, the electric heating module was first activated to preheat the furnace so that the thermal energy storage material in the chamber could be initially heated. When the temperature inside the furnace reached a predetermined temperature, the feeding screw was started, and the solid waste particles pre-stacked in the feeding hopper fell into the furnace slowly and filled the bottom of the gasifier gradually. When the feeding was finished, the fan was turned on, the gasification agent was added, and the gasification reaction began. When the temperature inside the furnace is high, the thermal energy storage material absorbs the excess heat inside the furnace and passes the unpreheated gasification agent into the furnace to cool the furnace and heat the thermal energy storage material. Otherwise, when the temperature inside the furnace is low, the thermal energy storage material emits heat into the furnace, while the air supply coil supplies the gasification agent, preheats it, and finally delivers the preheated high-temperature gasification agent into the furnace chamber to raise the furnace temperature.
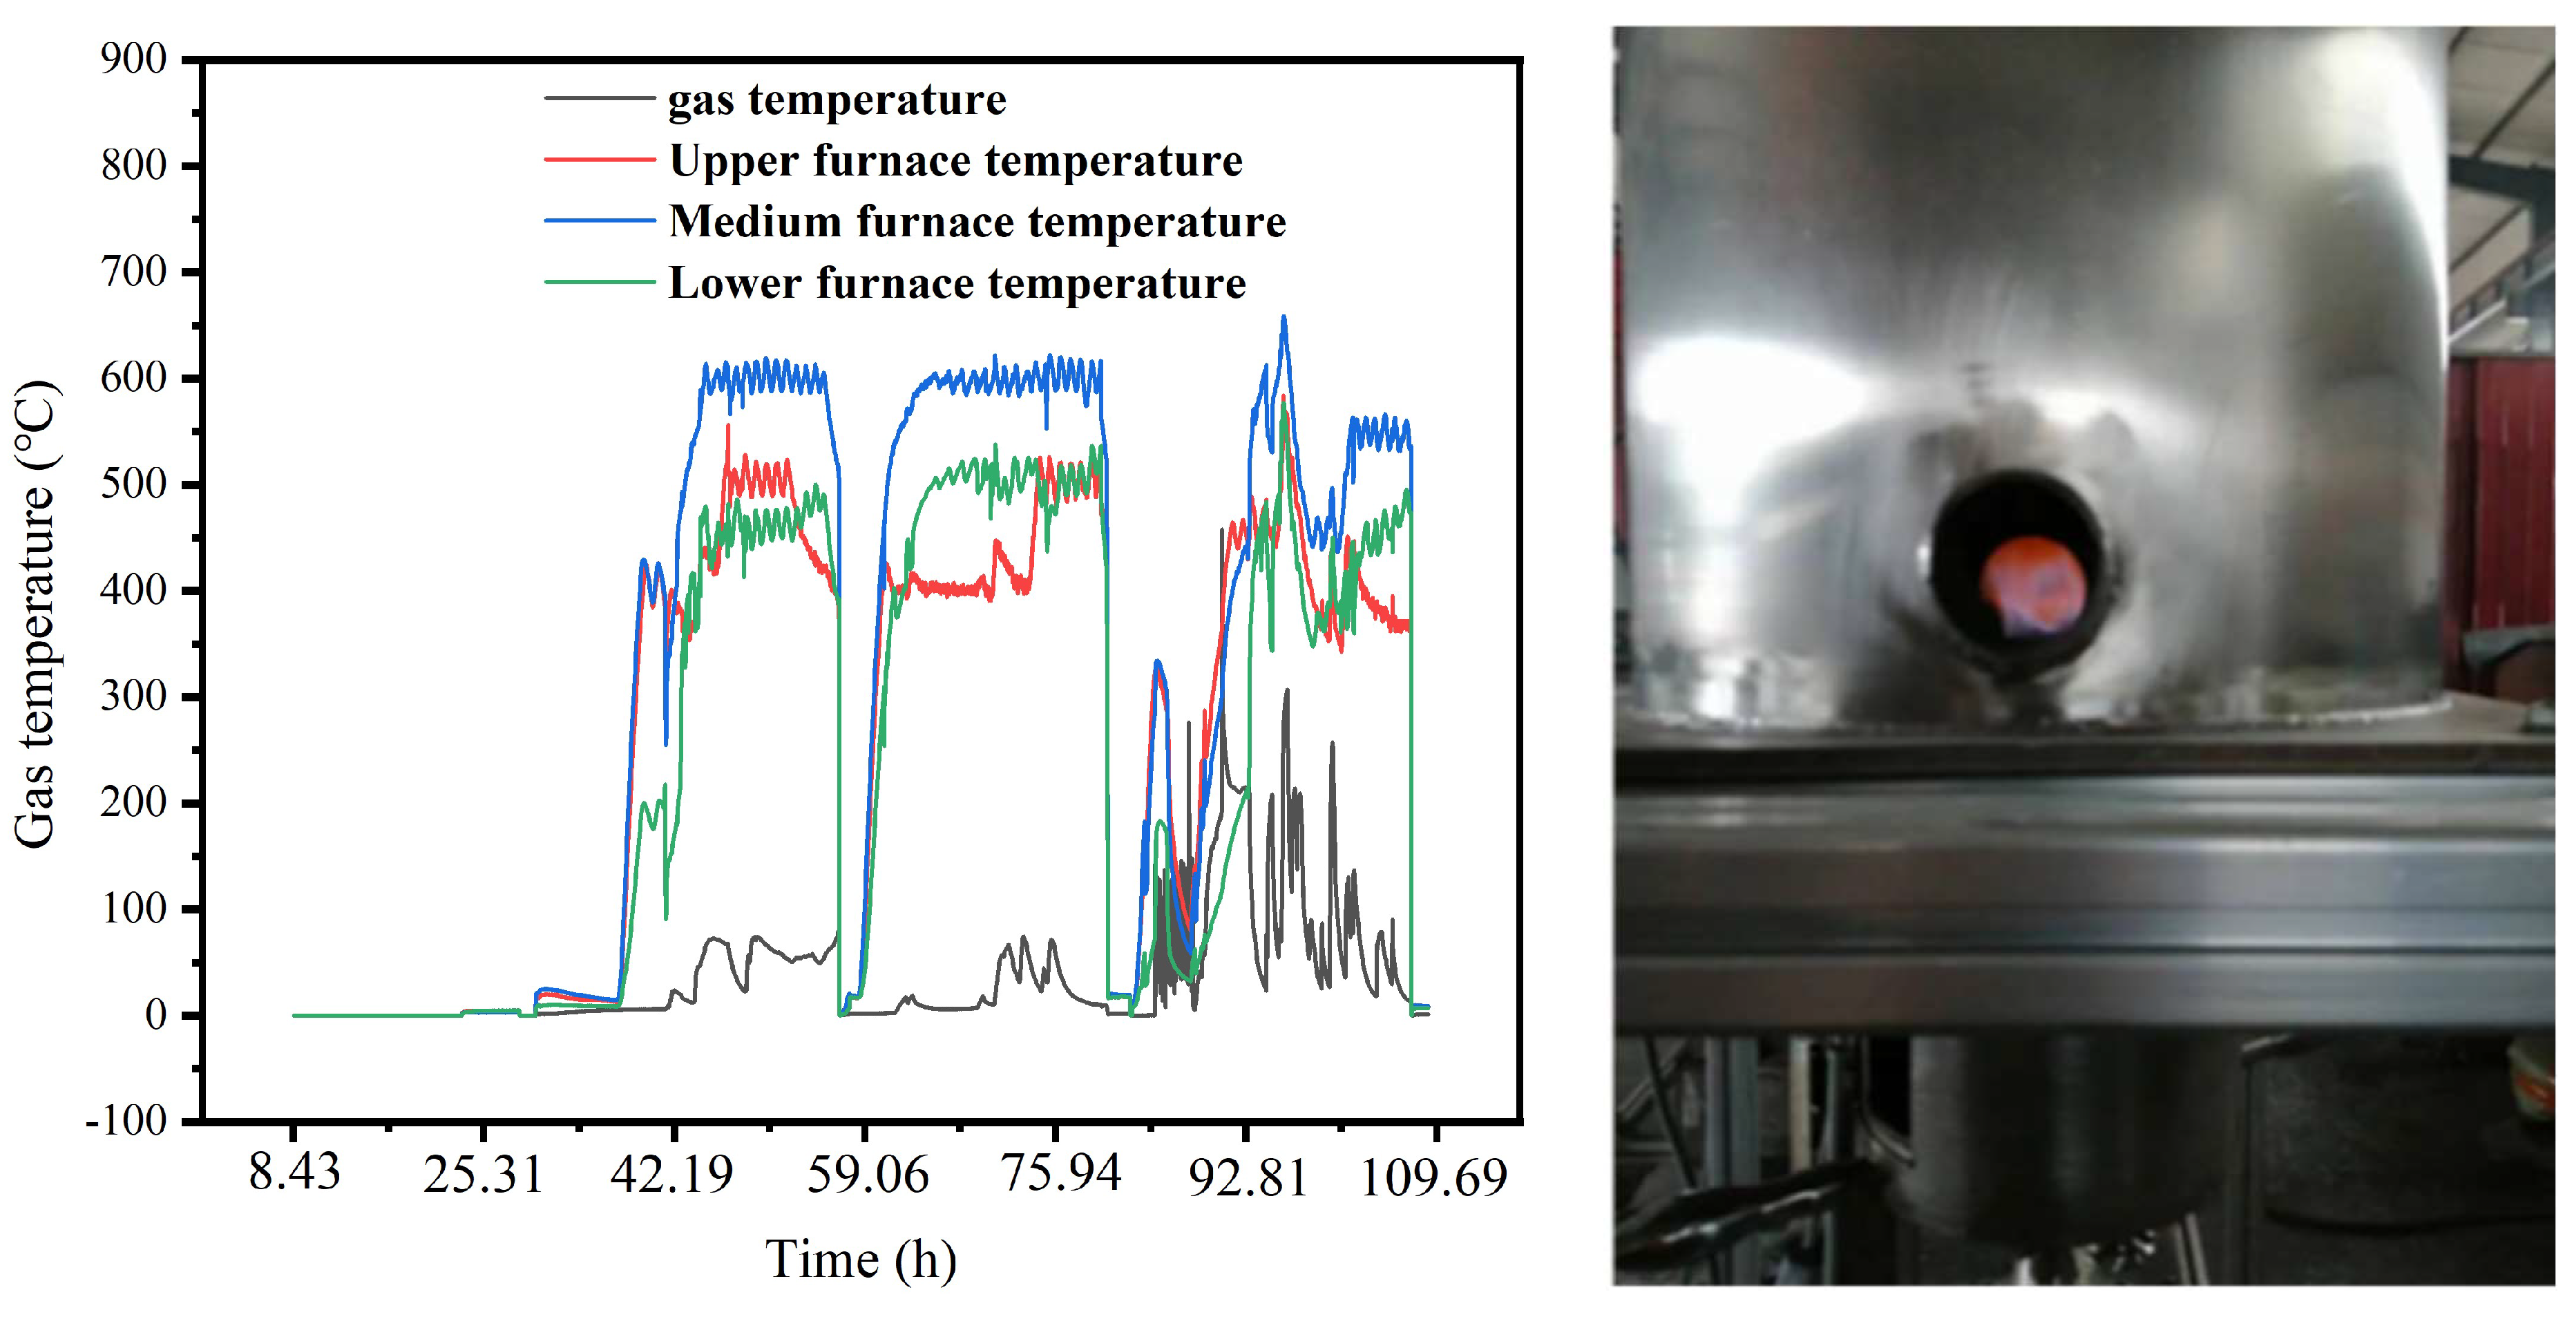
The experimental results showed that the device can produce combustible gas stably, maintain continuity, and burn steadily for several hours after ignition in a small combustion chamber. A partial record of the device operation and gas combustion flame in the combustion chamber is shown in Figure 6.
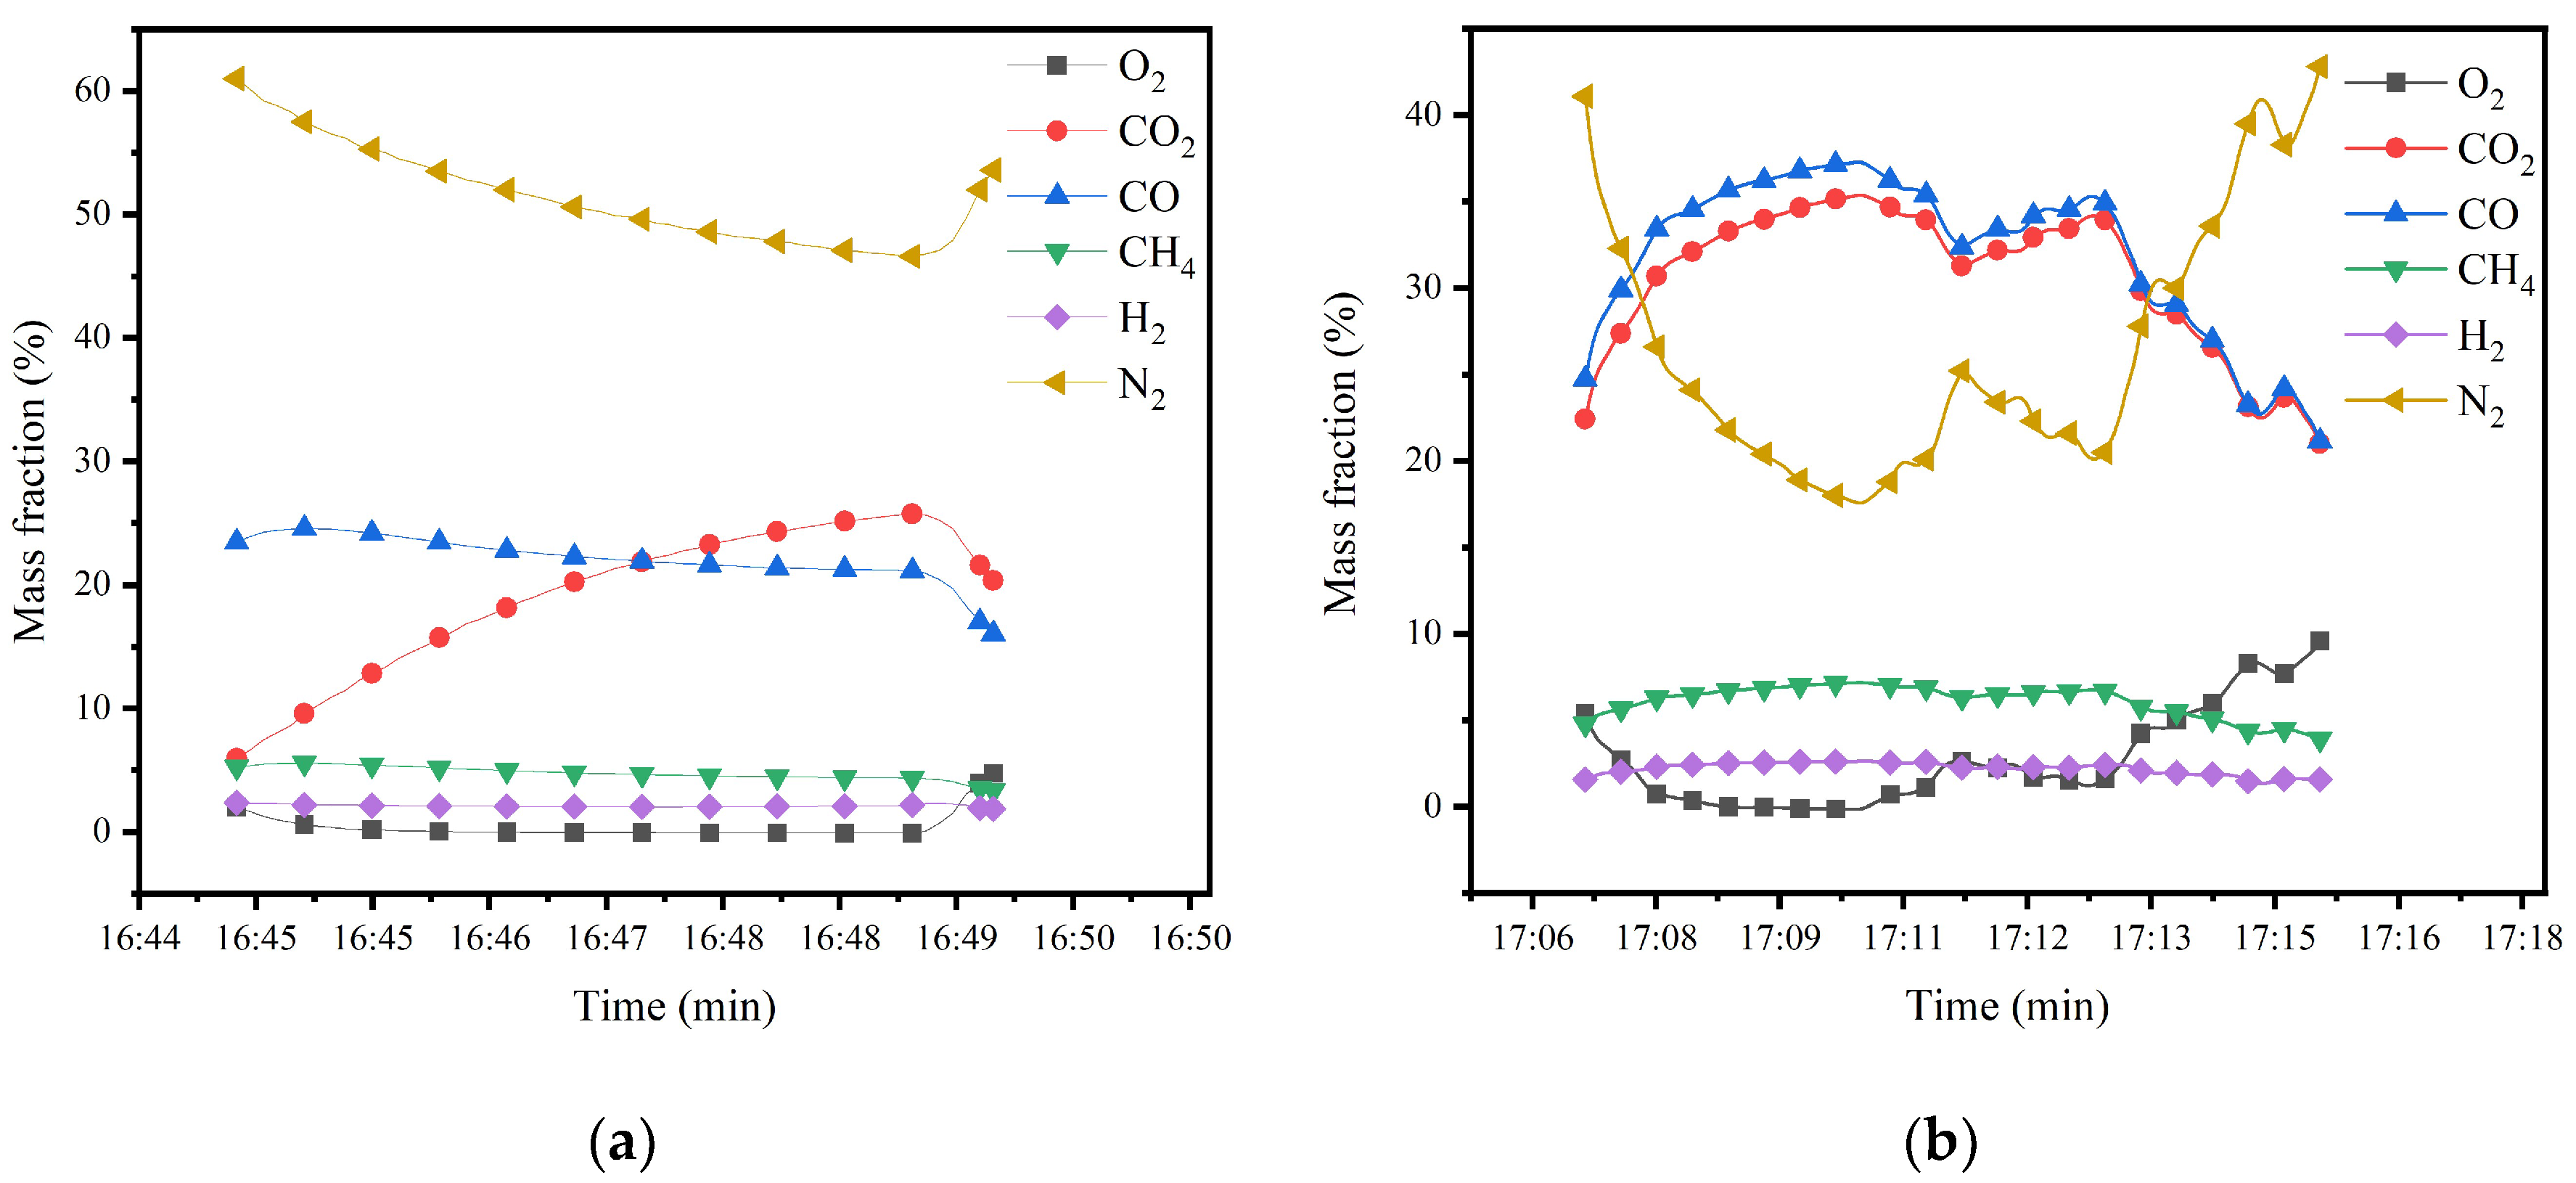
The composition of the outlet gas was analyzed using a VARIO plus-new flue gas analyzer (MRU Corp., Heilbronn, Germany), and data were recorded after the gasification process was relatively stable. Some of the results are presented in Figure 7.
As shown in Figure 7, taking the middle smoother data point, the mass fraction of H2 was approximately 2–2.5%, methane (CH4) 5%, carbon monoxide (CO) 16–20%, carbon dioxide (CO2) 20–22%, N2 50–60%, and O2 1–2%. The O2 content was high, indicating that although the reaction in the furnace had stabilized, O2 had not been completely consumed, which can be attributed to the uneven distribution of materials in the furnace. The gasification agent failed to fully contact the materials and combustible gases, resulting in an inadequate chemical reaction, and residual O2. In the few stages where the reaction effect was better (high combustible gas content), CO and CO2 contents increased, both up to more than 30%, that of CH4 was slightly increased, and O2 was almost completely consumed. Data are shown in Table 4. Taking the interval with relatively stable changes in species and calculating the average value, it can be seen that, the mass fractions of CO, CO2, and H2 are approximately 29%, 26.5%, and 2.3%. Therefore, we confirmed that the device could accomplish the gasification of combustible solid waste.

3. Mathematical Modeling

There is a multiphase chemical reaction process during solid waste gasification; therefore, the study of multiphase flow is very important. Within the scope of CFD, multiphase flows are generally treated in two ways: the Eulerian–Eulerian and Eulerian–Lagrangian methods [38,39]. The Eulerian–Eulerian method treats both fluids and particles as continuous phases and has a lower computational demand but lower accuracy and more limitations because it cannot distinguish the scale of gas–solid flow [35]. Meanwhile, in the Eulerian–Lagrangian method, the fluid is treated as a continuous phase and the particles are treated as a discrete phase, which can thus accurately describe the motion pattern of individual discrete phase particles, particle population in multiphase flow, and specific states of participation in chemical reactions [40,41].
To analyze and predict the whole process of solid waste gasification in the form of a fixed bed, the fit between the numerical model and the actual device is the cornerstone of the accuracy of the numerical simulation. Therefore, we investigated the operation of gasification devices using the Eulerian–Lagrangian model. The DDPM method is a combination of CFD-DEM [42] and MP-PIC methods [43,44] and is based on the discrete phase model (DPM) method. The DPM is applicable to the flow of a relatively sparse discrete phase (the volume fraction occupied by the discrete phase is not high); however, it cannot consider the effect of the volume occupied by the solid waste particle phase in the flow field. In other words, the discrete phase is regarded as a mass point that does not occupy volume in the continuous phase, and the effect of volume fraction interpolation on mass, momentum, energy, and components of the two-phase flow in the mathematical model is not considered. When the volume occupied by the discrete phase in the computational domain cannot be neglected, the use of this model results in an erroneous calculation, and the results are no longer applicable in fluidized bed simulations, where the solid phase volume fraction is relatively small. Therefore, it is even more unusable in fixed beds, in which the solid-phase volume fraction is larger than that in fluidized beds, and the material is in closer contact [45]. The DDPM method overcomes the drawback of not considering the volume of the discrete phase, enabling reasonable collision and piling of particles in the computational domain for effective numerical simulation and analysis of particle gasification reactions in a fixed bed; therefore, this method was used to simulate the new type of updraft fixed bed reactor. Models related to DDPM have rarely been used in previous studies of solid waste gasification in fixed bed reactors; the improvement in this aspect of this study is a promising innovation.

3.1. Meshing

In terms of meshing, the DDPM model requires the mesh size to be larger than the particle size. However, an excessively large mesh size has problems such as a large discrete space step size and unstable calculation that can lead to errors; therefore, it is important to select the mesh size reasonably and avoid calculation errors in both the continuous and discrete phases. The particles were designed as spherical particles with a diameter of 3 mm, so the mesh size should be at least greater than this value. Owing to the irregular geometry of the grate part, it is very difficult to use structured meshing, and even if an unstructured grid is used, the size will inevitably be too small; therefore, the gasifier was simplified to a cylindrical cylinder, and a structured mesh was used to ensure the quality and size of the grid. Thereafter, the grate was discarded.
A fan-shaped gas pressure outlet was placed in the upper part of the furnace body, the bottom of the furnace was set as the gasifier inlet, and the lower part of the furnace was set as the thermal energy storage wall surface. A sensitivity analysis of mesh numbers was completed. To demonstrate the correctness and accuracy of the larger mesh used in this study during the calculation process, we divided the gasifier into three meshes with different numbers and sizes (the small-size mesh contains 360,000 cells, the middle-size mesh contains 155,100 cells, and the large-size mesh contains 32,967 cells) and calculated the variation of flow rate with the height of the furnace, and the result is shown in Figure 8; the fluid velocity of different sizes of meshes remained almost constant, proving the rationality of mesh division. We chose the biggest mesh to calculate the gasification process.
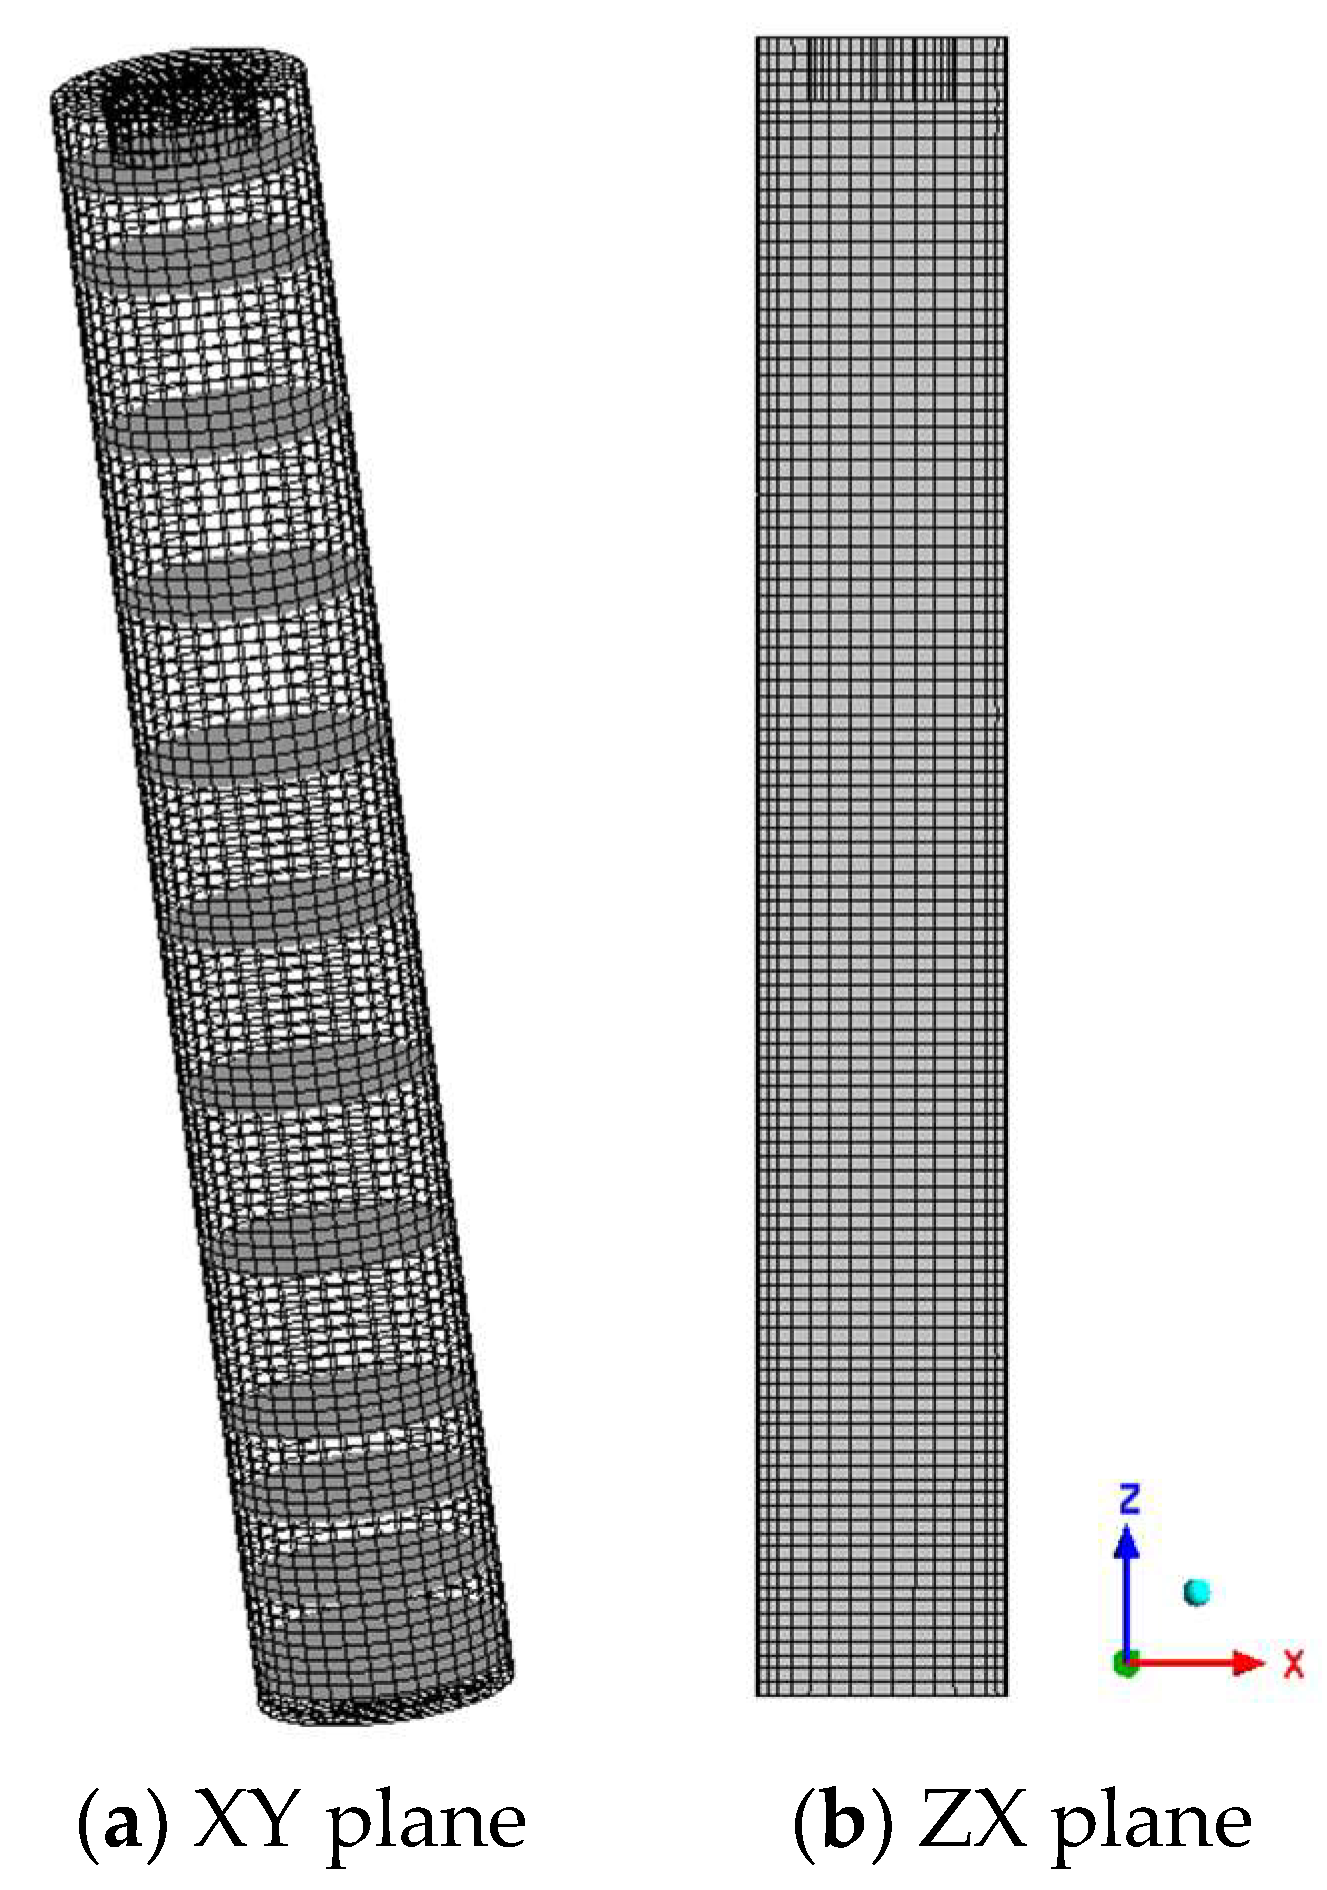
The entire model has a total of 32,967 grids, 101,340 grid surfaces, and 35,608 nodes, with a minimum grid quality of 0.84, which is much larger than the minimum threshold of the grid quality (grid quality > 0.3), and it can complete the calculation of the gasification process very well. The meshing is shown in Figure 9.

3.2. Continuous Phase Mathematical Model

The governing equations for the continuous gas phase are solved based on the Navier–Stokes equations. The interaction between gas and solid phases is accounted for by incorporating source terms for mass, momentum, and energy exchange into the governing equations [23].
1.
Continuity equation [23,46]:
t ε f ρ f + · ε f ρ f u f = S m a s s
where ε f is the fluid volume fraction; ρ f is the fluid density; u f is the fluid velocity; and S m a s s is the mass source term, where fluid-to-particle mass transfer occurs through water evaporation, devolatilization, and the heterogeneous reaction of fixed carbon from the biomass. This equation controls the mass change of the fluid.
2.
Momentum equation [23,42]:
t ( ε f ρ f u f ) + · ε f ρ f u f u f = ε f p + · ( ε f τ ̿ f ) + ε f ρ f g + K s f u s u f + S m o m
where p is the pressure; τ ̿ f is the bias stress tensor; g is the gravitational acceleration; K s f is the heterogeneous traction coefficient; u s is the particle velocity; and S m o m is the momentum source term, which contains the change in momentum owing to the mass transfer between the particle and fluid. This equation controls the momentum change of the fluid.
3.
Energy equation [23]:
t ε f ρ f H f + · ε f ρ f u f H f = ε f p t + τ ̿ : u f + · ε f λ f T f + i = 1 m h f , i A p T p T f + S e n
where H f is the enthalpy of the fluid, λ f is the thermal conductivity, h f , i is the heat transfer coefficient between the particle and the fluid component I, A p is the surface area of the particle, T f is the fluid temperature, T p is the particle temperature, and S e n is the energy source term indicating the heat generated or absorbed in the fluid due to chemical reactions and radiation. This equation controls the energy change of the fluid.
4.
Species transport equation [23]:
t ε f ρ f Y j + · ε f ρ f u f Y j = · ε f ρ f D e f f , f Y j + S j , h o m + S j , h e t e
where Y j is the mass fraction of fluid species j, D e f f , f is the mass diffusion coefficient, S j , h o m is the source term for the mass exchange of species due to the homogeneous reaction, and S J , h e t e is the mass exchange of species due to the heterogeneous reaction. This equation controls the species change of the fluid.

3.3. Discrete Phase Mathematical Model

The motion information of the particles is described by the Newtonian equations of motion for each particle.
The momentum equation of the particle is given by [23,47]
m p v p t = m p g + V p K f s v f v s + F D E M + F o t h e r
where m p is the particle mass; v s is the particle velocity; V p is the particle volume; and the right-hand side of the equation is, from left to right, gravity, heterogeneous interaction forces, interparticle forces, and the remaining forms of particle forces, such as pressure gradient forces, virtual mass forces, and Magnus forces. Because the particles in the present study were basically at rest, the particle density was much larger than the fluid density, and the particle size was larger; therefore, the effect of the additional forces is negligible, and they cannot be accounted for [17].
The EMMS energy multiscale model is used for the drag force coefficients, which can better distinguish the drag force variations within the grid scale compared with the homogeneous traction model [48,49].
For the EMMS model, the drag force coefficients are as follows:
K f s = 3 4 C D ε s ε f ρ f | v s v f | d p ε f 2.65 H D
where the values of each parameter are taken as follows:
C D 0.44 R e s 1000 24 R e s ( 1 + 0.15 R e s 0.687 ) R e s < 1000
R e s = ρ f d p | v s v f | μ f ε f
H D = a ( R e s + b ) c   0.001     R e s   35
where a, b, and c in H D are functions of the volume fraction of the fluid phase, as mentioned by Lu et al. (2014) and Qin et al. (2019) [49,50].
To calculate the interaction forces between discrete phases, the DDPM model has two treatments. The first is to use the kinetic theory of granular flow (KTGF)-based treatment, similar to the Eulerian TFM, to close the set of equations by modeling the forces between discrete phases [51]. The other is to couple the DEM soft-sphere model, thereby directly solving for the individual particle [23]. Although the former method has been applied in most gasification-related studies, the latter approach was used in the present study. The method of coupling the DEM approach was selected because it avoids the errors that may arise from the KTGF model due to the assumption of the discrete phase, and this is a beneficial innovation. The various parameters required in the particle collision process and their values are given by Ku et al. (2015), Ostermeier et al. (2019), and Wang et al. (2020) [23,52,53].
After heating, the particles undergo the process of water evaporation, pyrolysis devolatilization, and C reduction.
The material pyrolysis process can be expressed as follows:
w o o d ( d r y ) a H 2 + b C H 4 + c C O 2 + d C O + C ( s )
Ku et al. (2014) summarized the mass fractions of volatile fraction species for four common biomass types of combustible solid waste [38], and the data were averaged and processed in the present study. The processed results are shown in Table 4.
The pyrolysis reaction rate with a single-step reaction rate is as follows [23]:
d m p d t = k p y r o [ m p ( 1 f v , 0 ) ( 1 f w , 0 ) m p , 0 ]
where f v , 0 denotes the volatile fraction mass fraction, f w , 0 denotes the moisture mass fraction, and m p , 0 is the initial mass of the particle.
The kinetic rate can be expressed as follows [23]:
k p y r o = A p y r o e x p ( E p y r o R T p )
For the values of the pre-exponential factor and activation energy of the pyrolysis reaction rate, please refer to the work of Wang et al. (2020) [42].
A p y r o = 5   ×   10 6   s 1 ,   E p y r o = 1.2 × 10 8   J · kmol 1
After pyrolysis, the C reacts in a heterogeneous manner as follows [23,42,52]:
m c ( s ) t = A p Y j , f R ρ f T f M j k j k d i f f , j k j + k d i f f , j
where A p is the surface area of the particle.
The particle heterogeneous surface reaction rate is controlled by two reaction rates: temperature-dependent kinetic reaction rate and the diffusion reaction rate related to the gas diffusion rate on the particle surface.
The diffusion reaction rate is as follows [52]:
k d i f f , j = C j [ 0.5 ( T p + T f ) ] 0.75 d p
where C j is the diffusion rate constant (5·10−12 s/K0.75) [23] and d p is the particle diameter.
The kinetic reaction rate was k j = A h e t e T p e x p ( E h e t e R T p ) , and the heterogeneous reaction considered the reaction of C with CO2 and water (H2O). The values of the pre-exponential factor and activation energy are listed in Table 5.
The homogeneous phase reaction considers three reduction reactions and three oxidation reactions, whose rates are controlled by both the finite rate and eddy dissipation models.
The parameters of the finite rate model are listed in the following Table 6 and in [42,54].

4. Pre-Processing Settings

Regarding particle pyrolysis and devolatilization, most studies have assumed that the discrete phase first volatilizes as lumped volatile matter and that the other gas species are obtained by further decomposition of this lumped volatile matter [23,40]. Although this method has achieved good results and is used widely, it has two drawbacks. First, this artificially assumed volatile matter is a virtual substance whose physical parameters cannot be accurately set, which can cause certain computational errors. Second, the non-existent gas-phase product is released by the discrete phase, which inevitably affects the evolution of the flow field during its motion, decomposition, and participation in the reaction, leading to non-physical phenomena. Therefore, errors are likely to accumulate as the calculation advances and affect the accuracy of the results.
To address such challenges, this study designed five types of particles in the DDPM particle setup: fixed carbon and four types of combustible solid waste biomass particles with the same physical parameters. The four types of particles differed in their volatile matter, i.e., H2, CO, CO2, and CH4. In the specific simulation process, 2500 fixed carbon particles were first injected into the calculation domain to form a stable carbon layer; this step is based on the actual operation of the gasifier. Second, 7500 particles of each of the four types of particles with different volatiles were injected into the computational domain within 0.5 s. The particles entered the computational domain from the top of the furnace to ensure uniform mixing of different types of particles and avoid the accumulation of local reaction areas that may be caused by the agglomeration of the same type of particles. After all the particles were injected, as shown in Figure 10, the furnace was left to stand for 3 s without a gasification agent, which effectively avoided the problem of calculation instability caused by the gasification agent entering the furnace chamber when the particles had not yet formed a fixed bed. Similar setting methods have not been adopted by other studies; this method was created in this study.
Two stages of the fixed bed reaction are considered: the initial stage when the particles contain moisture and the stage when there is no water after gasification for a period of time. The solid waste particle treatment capacity of the device was 0.001 kg/s, and the excess air coefficients a = 0.2, 0.5, and 0.8 were selected for three conditions so that the gasification agent flow rates were 0.001268, 0.00317, and 0.005072 kg/s, respectively, related working conditions is shown in Table 7. Using the porous-medium model [31,55], the flow field in the furnace chamber above the grate section was verified basically moving in the axial direction. Therefore, the gasification agent inlet at the bottom of the furnace was set to enter along the normal direction of the inlet.
Some parameters of the turbulence and radiation models are listed in Table 8. The boundary conditions of the thermal energy storage wall were a constant wall temperature of 1000 K based on the approximate average temperature designed for the thermal energy storage part during the operation of the gasification device, a gasification agent temperature of 1100 K set to simulate high-temperature conditions for oxidation reactions at the bottom of the furnace [29,56], a continuous phase time step of 2 × 10⁻⁴ s, and a discrete phase time step of 2 × 10⁻⁵ s to ensure the acquisition of changes in physical quantities of continuous and discrete phases over time [17]. The chemical reaction setup was calculated separately for each working condition for 60 s, as previously described.

5. Results and Discussion

To explore the distribution of physical quantities at different locations in the furnace, a set of 13 planes parallel to the axis in the direction of the furnace axis was taken, and the average value of the physical quantities of the mass flow rate was obtained, thus obtaining the approximate distribution of each physical quantity at different furnace heights. The distribution of the planes obtained is shown in Figure 11. As the chemical reaction in the lower part of the furnace chamber was more intense, the distribution of physical quantities was complex, and the gradient was larger; thus, the numbers of planes were greater in the lower part than in the higher part. Meanwhile, in the upper part of the furnace, there was relatively little change in the number of planes taken. To make the data more representative, images of the cloud diagrams in the present study were taken from the calculation results when the excess air coefficient was a = 0.5.

5.1. Flow Field Structure Analysis

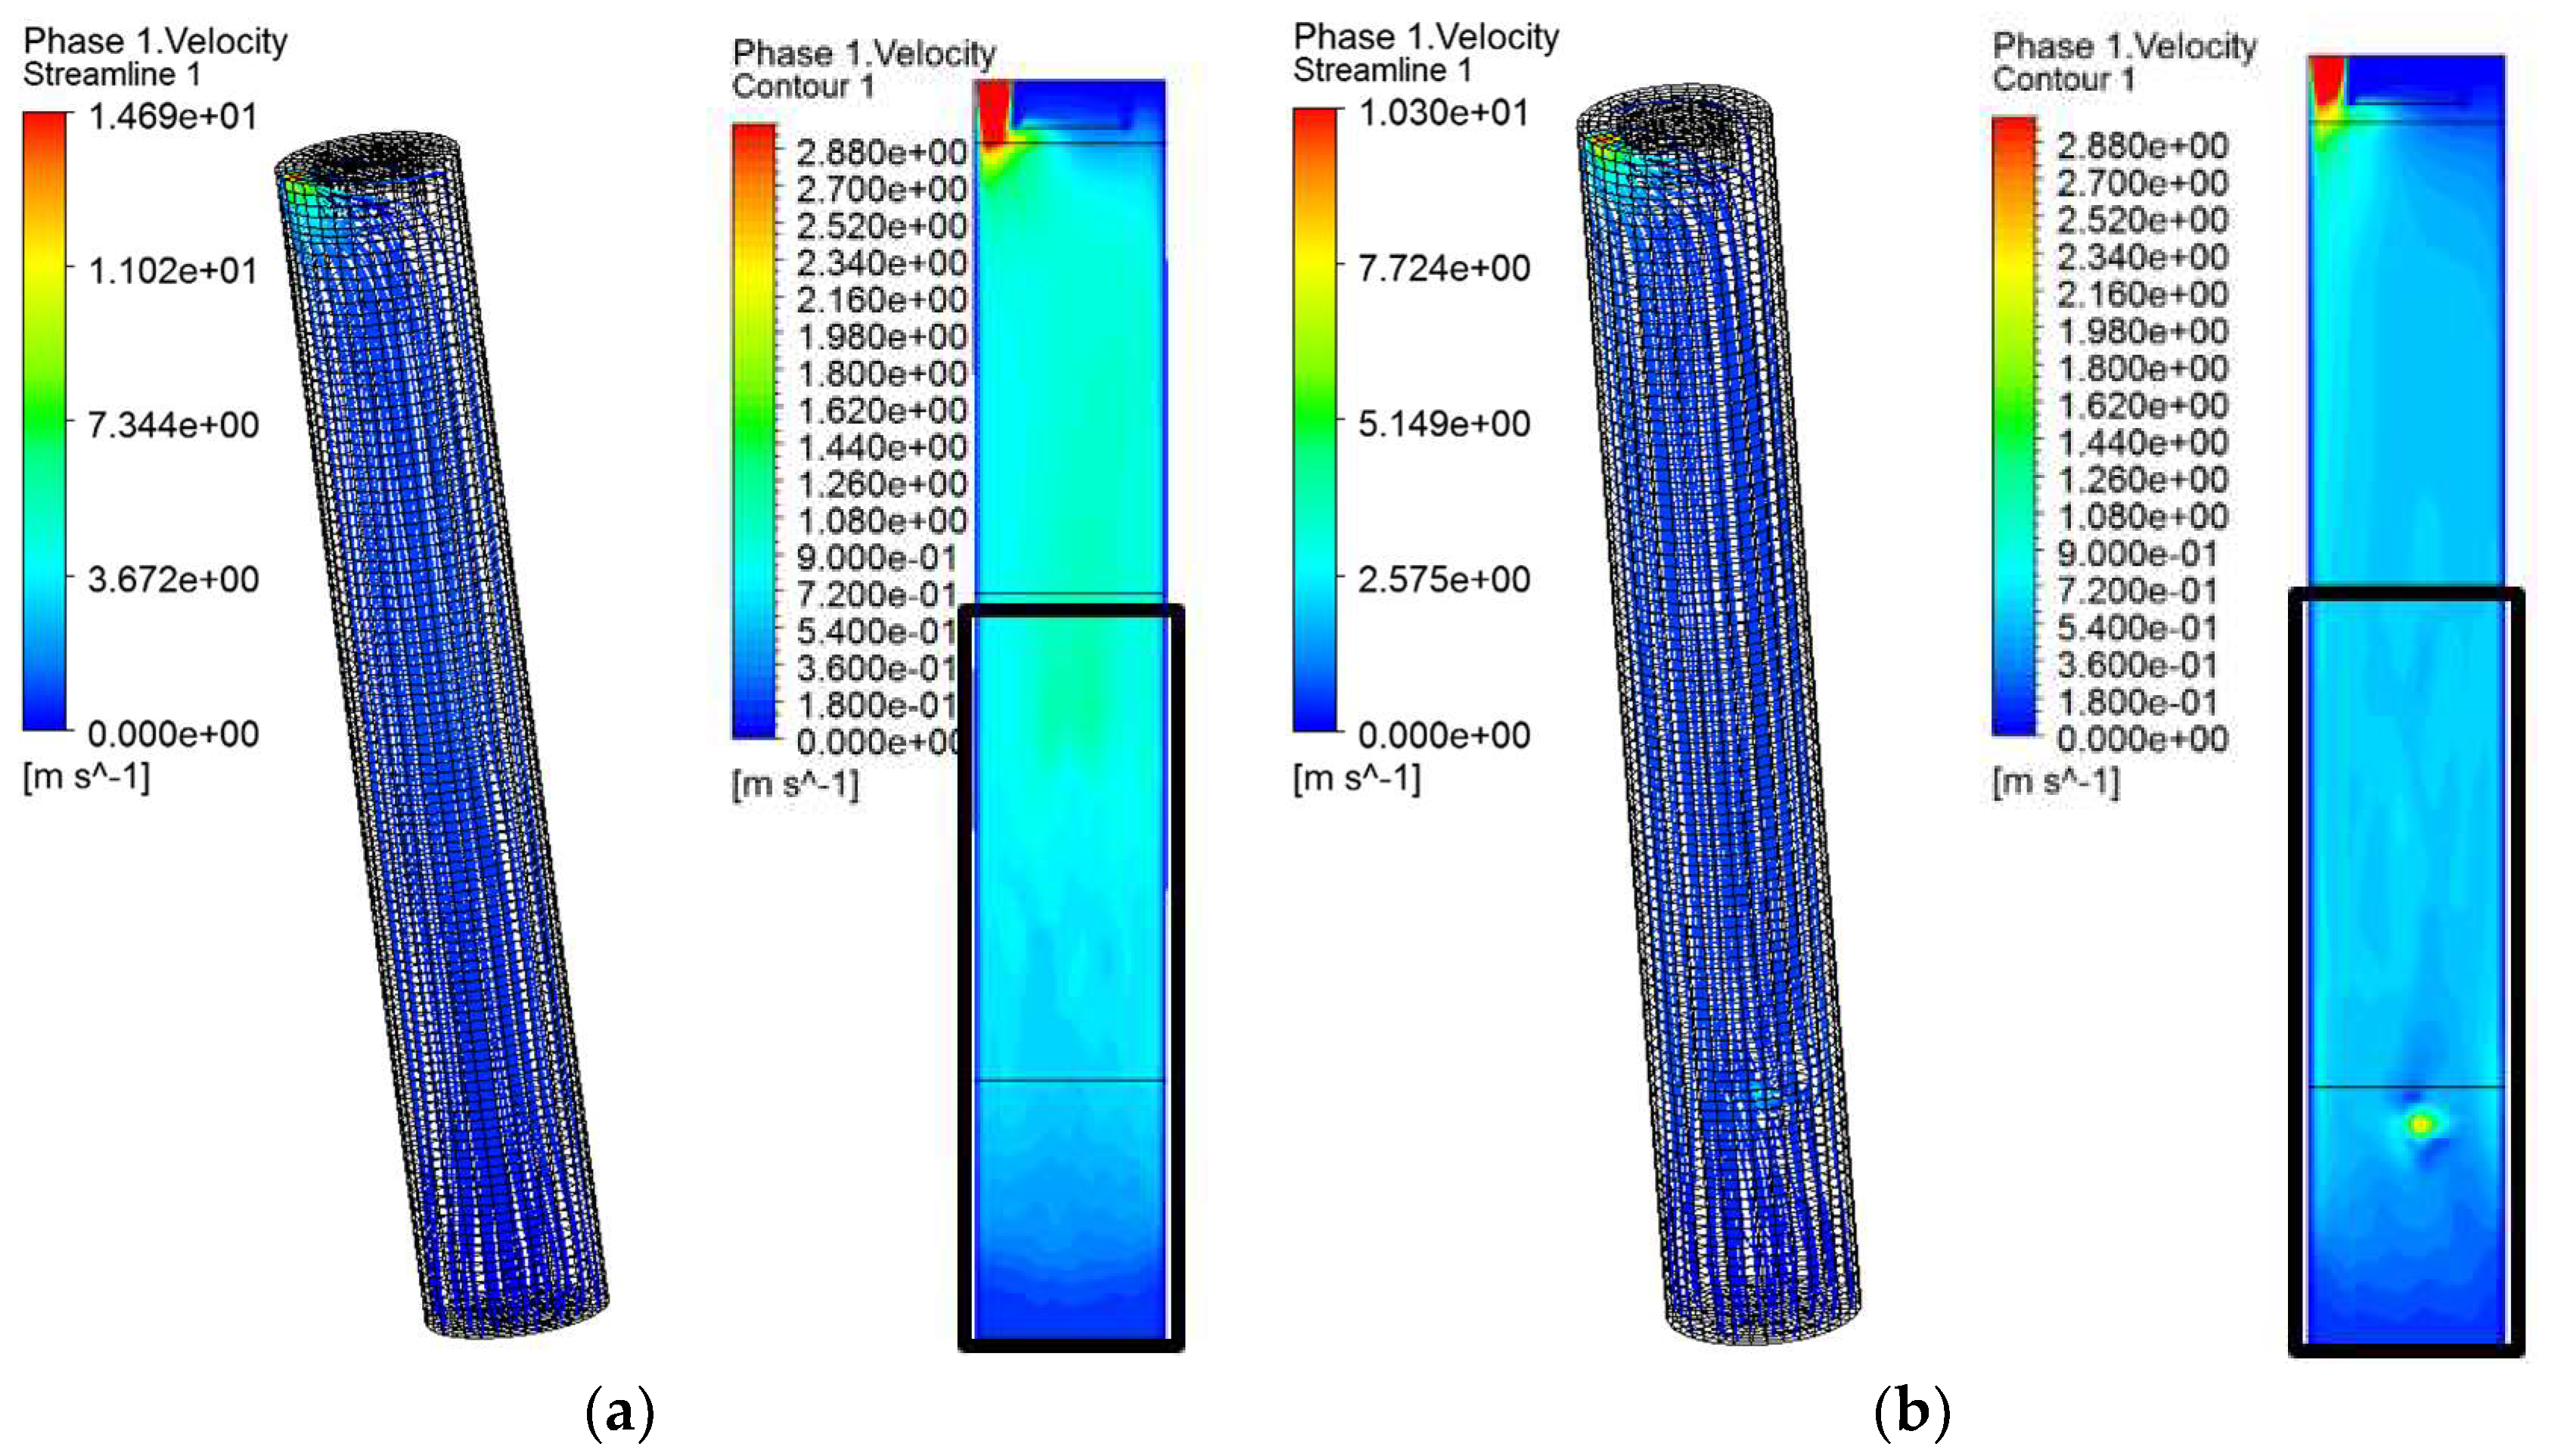
The streamline and velocity cloud diagrams are shown in Figure 12, and the upper limit of the velocity cloud diagrams was selected as 3 m/s to reflect the distribution of flow velocity more clearly, whereas the actual velocity near the gas outlet was greater than 10 m/s. The streamlines developed and extended along the direction of the z-axis, and the absolute value of the radial velocity was small. In the particle bed region, the gradient of velocity was large.
According to the designed feedstock-handling capacity of the gasification device, the particle bed did not fluidize at the given gasification agent flow rate, which indicates that the design working condition of the gasifier is reasonable. As the bed structure of particles was nonuniform, different locations differed in porosity; therefore, the momentum and energy transfer intensity of the fluid flowing through the particle bed were different in different areas. The chemical reaction has a strong coupling on the flow field owing to the effect of the heterogeneous reaction, which makes the mass of the discrete phase transform into the continuous phase, which is also one of the main reasons for the gradual increase in velocity during the movement of the fluid from the bottom to the top of the furnace. At the same time, the fluid showed a local speed surge or plunge; as we can see from the cloud diagram of dry particle gasification, a surge point in fluid velocity appeared.
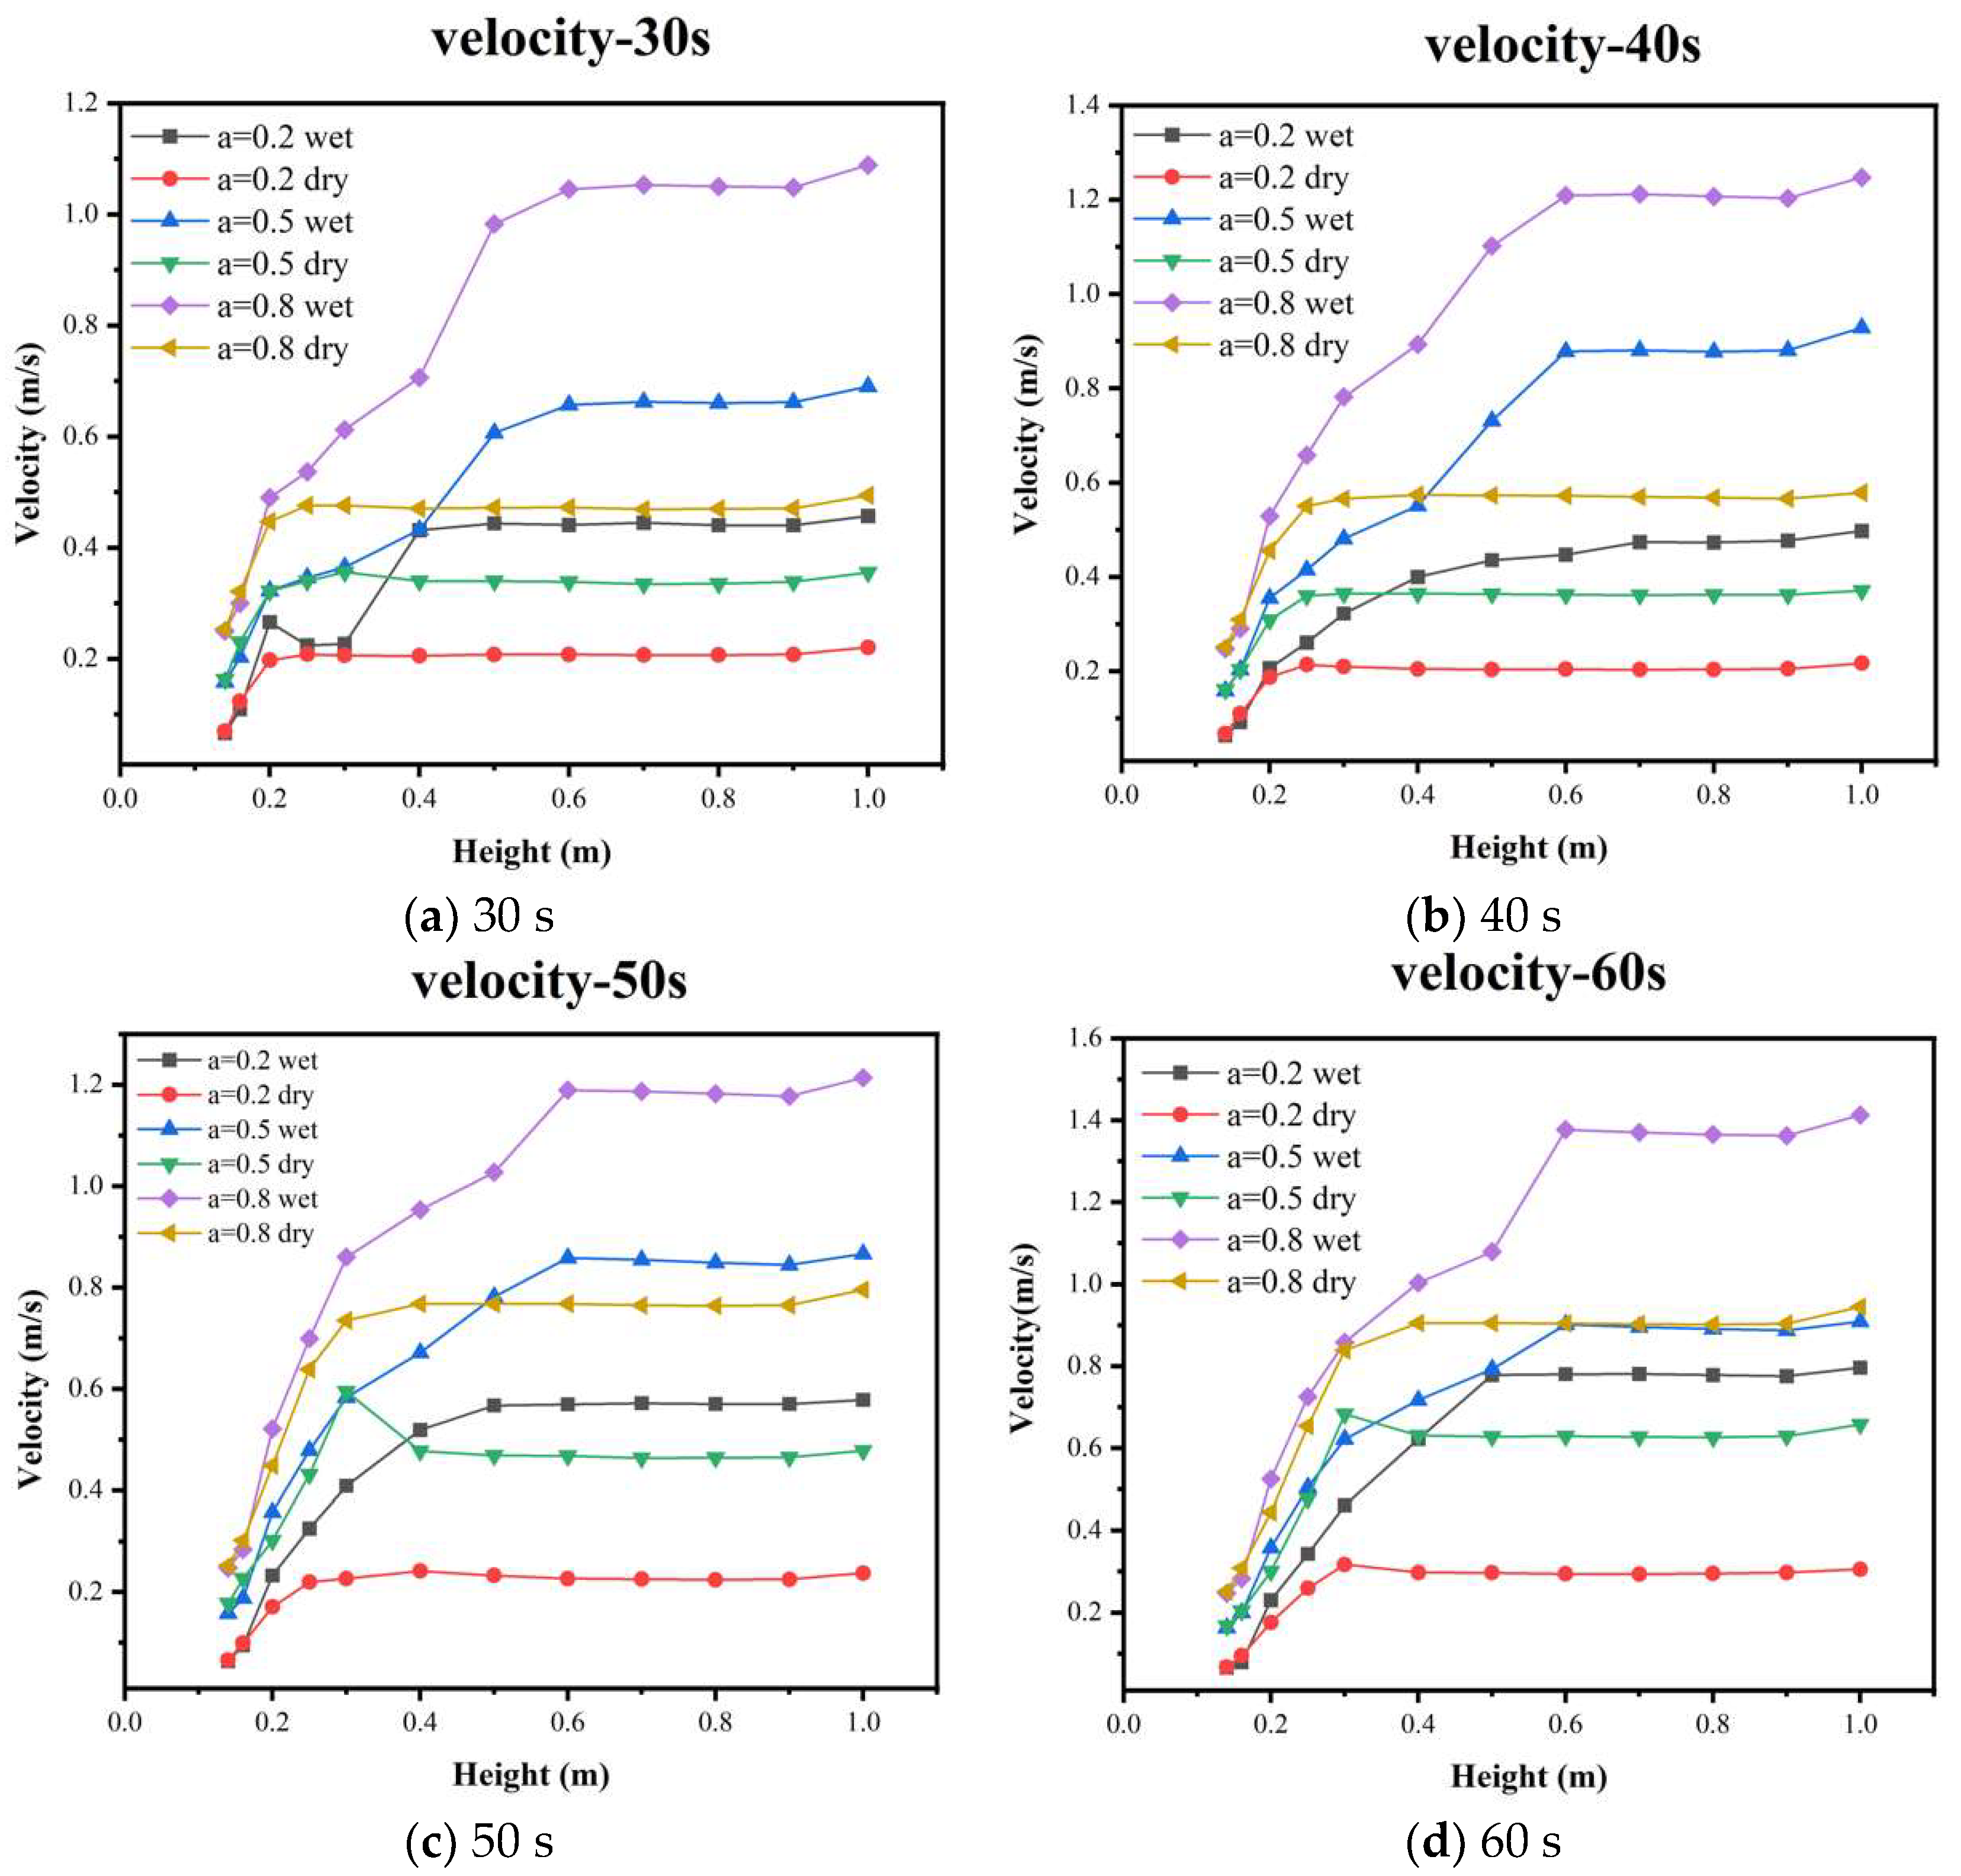
As shown in Figure 13, the fluid velocity accelerated based on the height of the z-axis and significant changes in the particle bed region; this result is similar to the findings of [56]. For the same excess air coefficient, the flow rate of the fluid during the gasification of moist particles was larger than that of dry particles (values were larger by about 0.3 m/s–0.6 m/s) because the evaporation of water from the particles during drying increased the gas-phase mass, thus causing an increase in the gas mass flow rate. The fluid velocity growth interval during the gasification of moisture-containing particles was longer, ending at the top of the particle bed (furnace height of about 0.5 m–0.6 m). In contrast, during the gasification process, the fluid velocity of dry particles was lower and the variation was smaller in the same place; there was no significant increase at the furnace height of around 0.3 m–0.4 m. Considering that the gas density does not change significantly under different operating conditions, the gas yield is proportional to the fluid velocity, and the higher the excess air coefficient, the higher the gas production rate will be.

5.2. Pressure Distribution

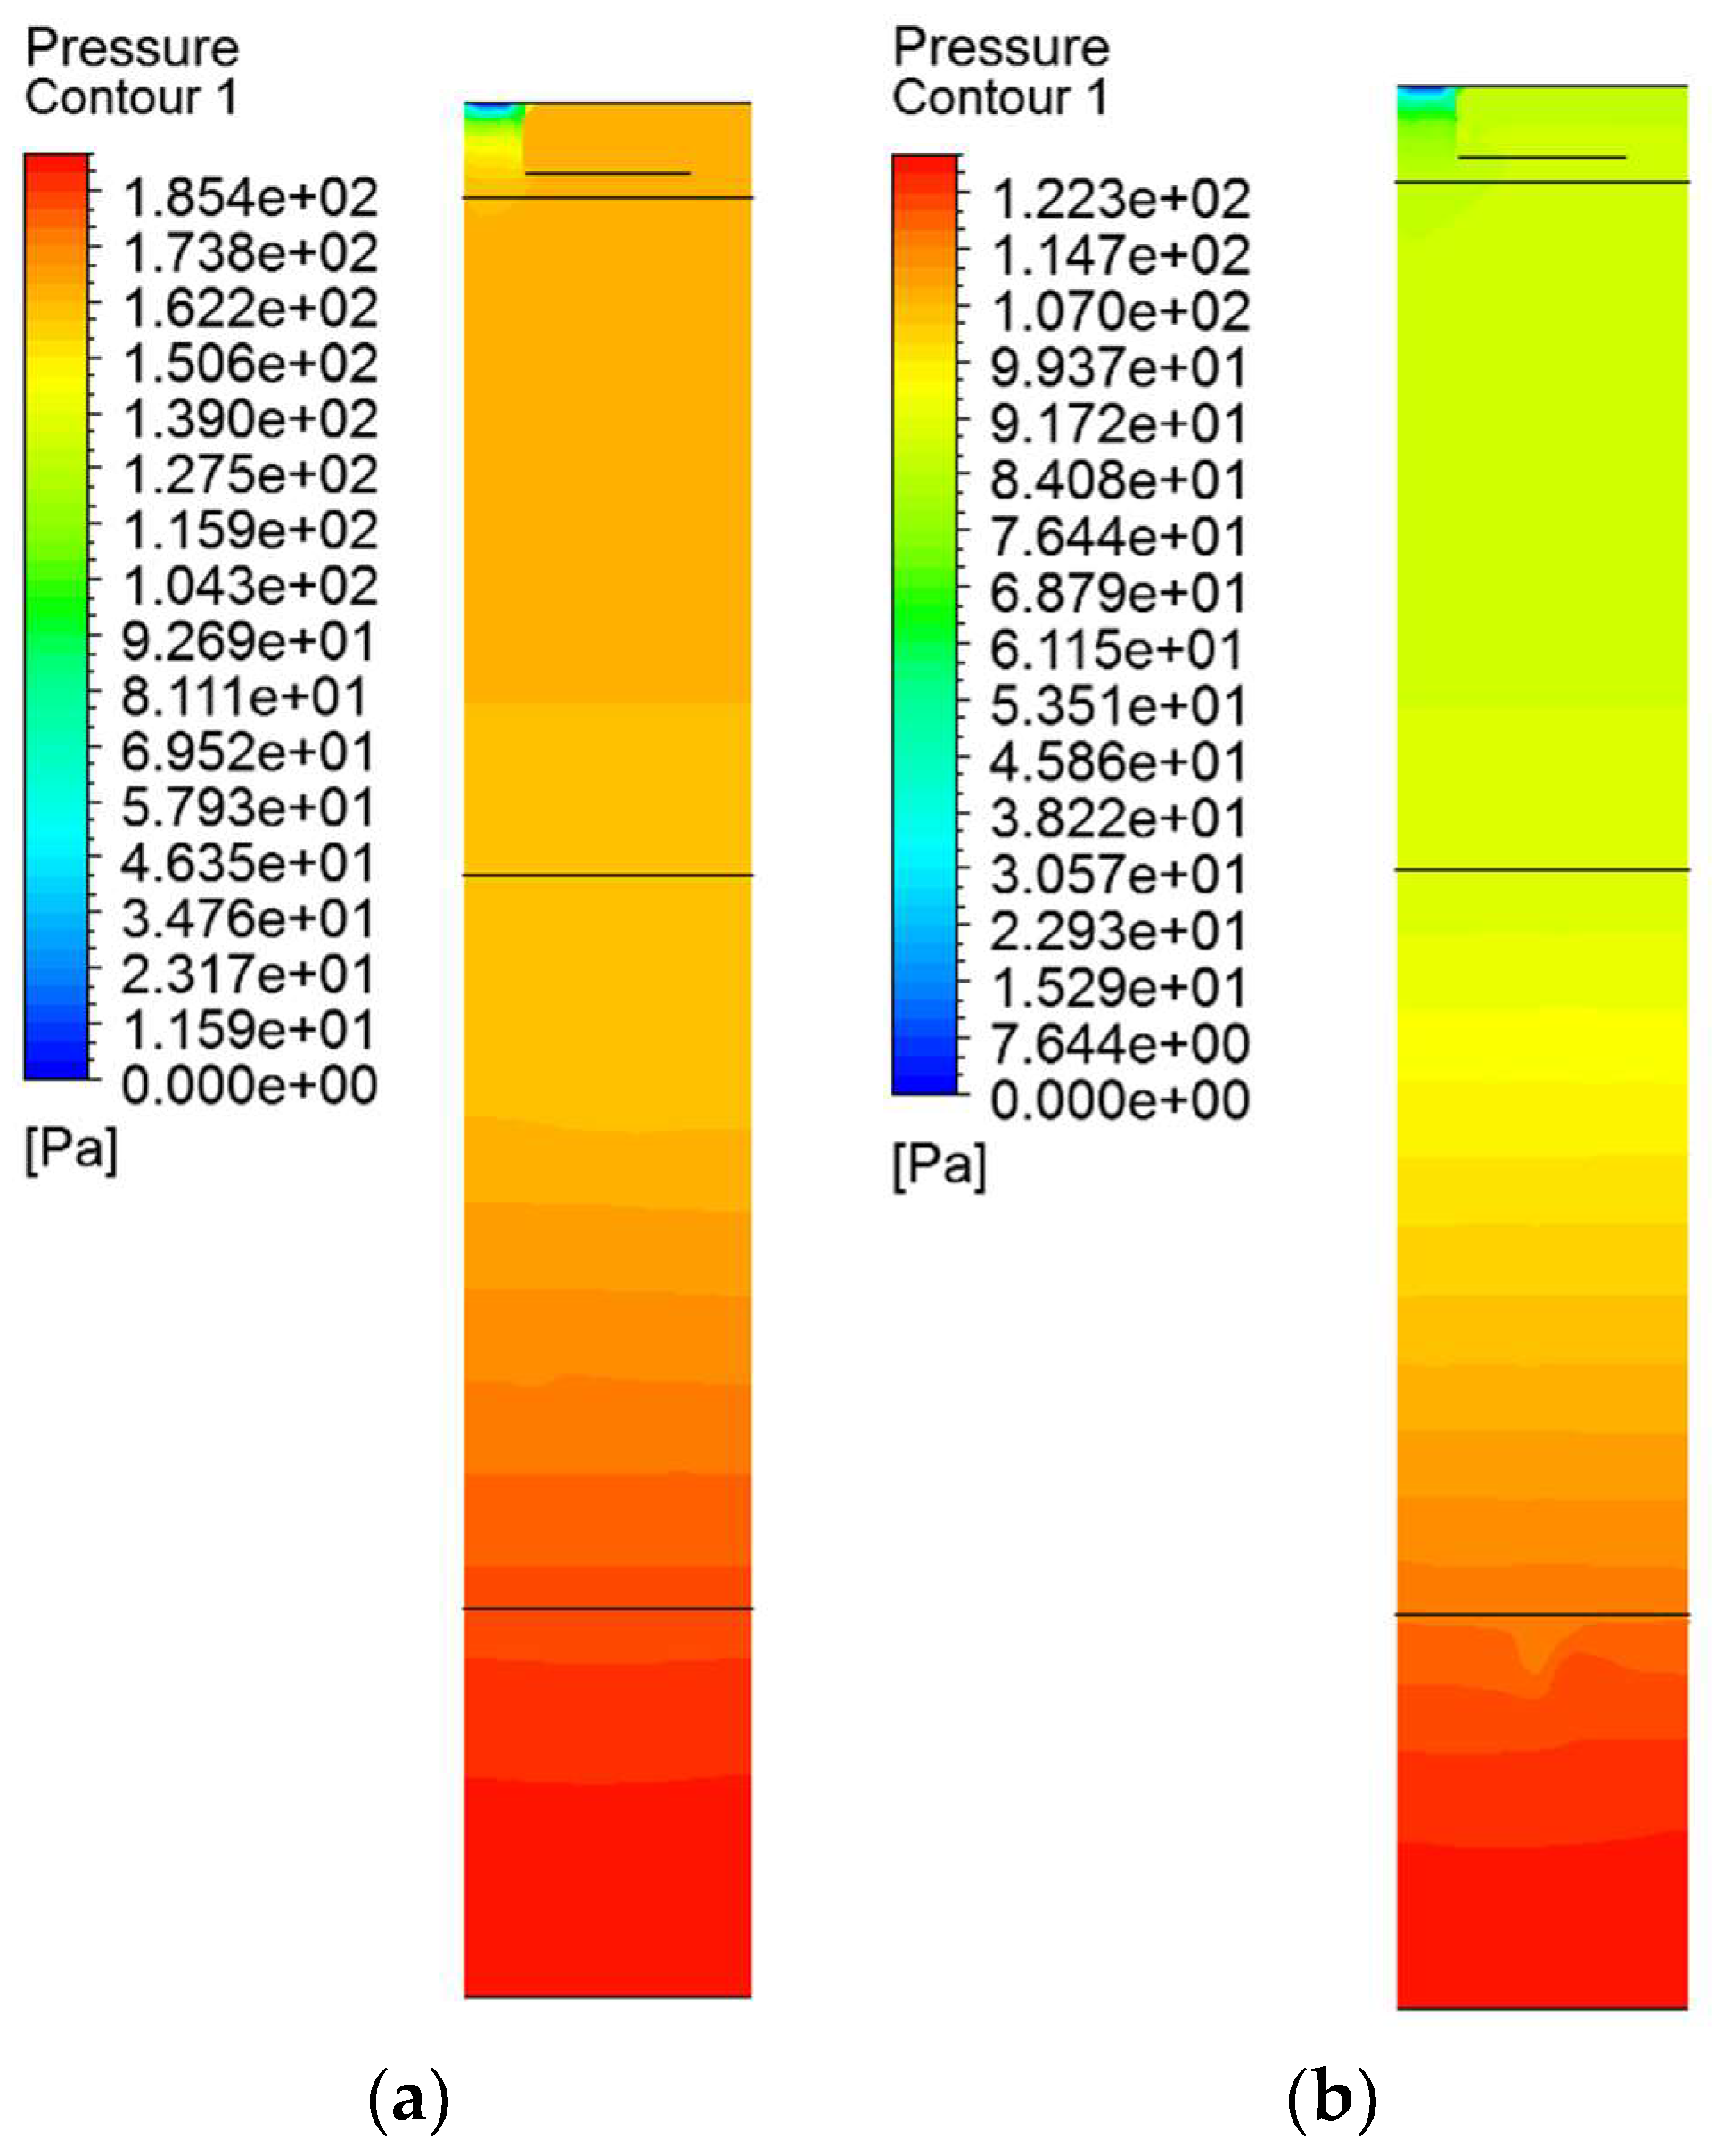
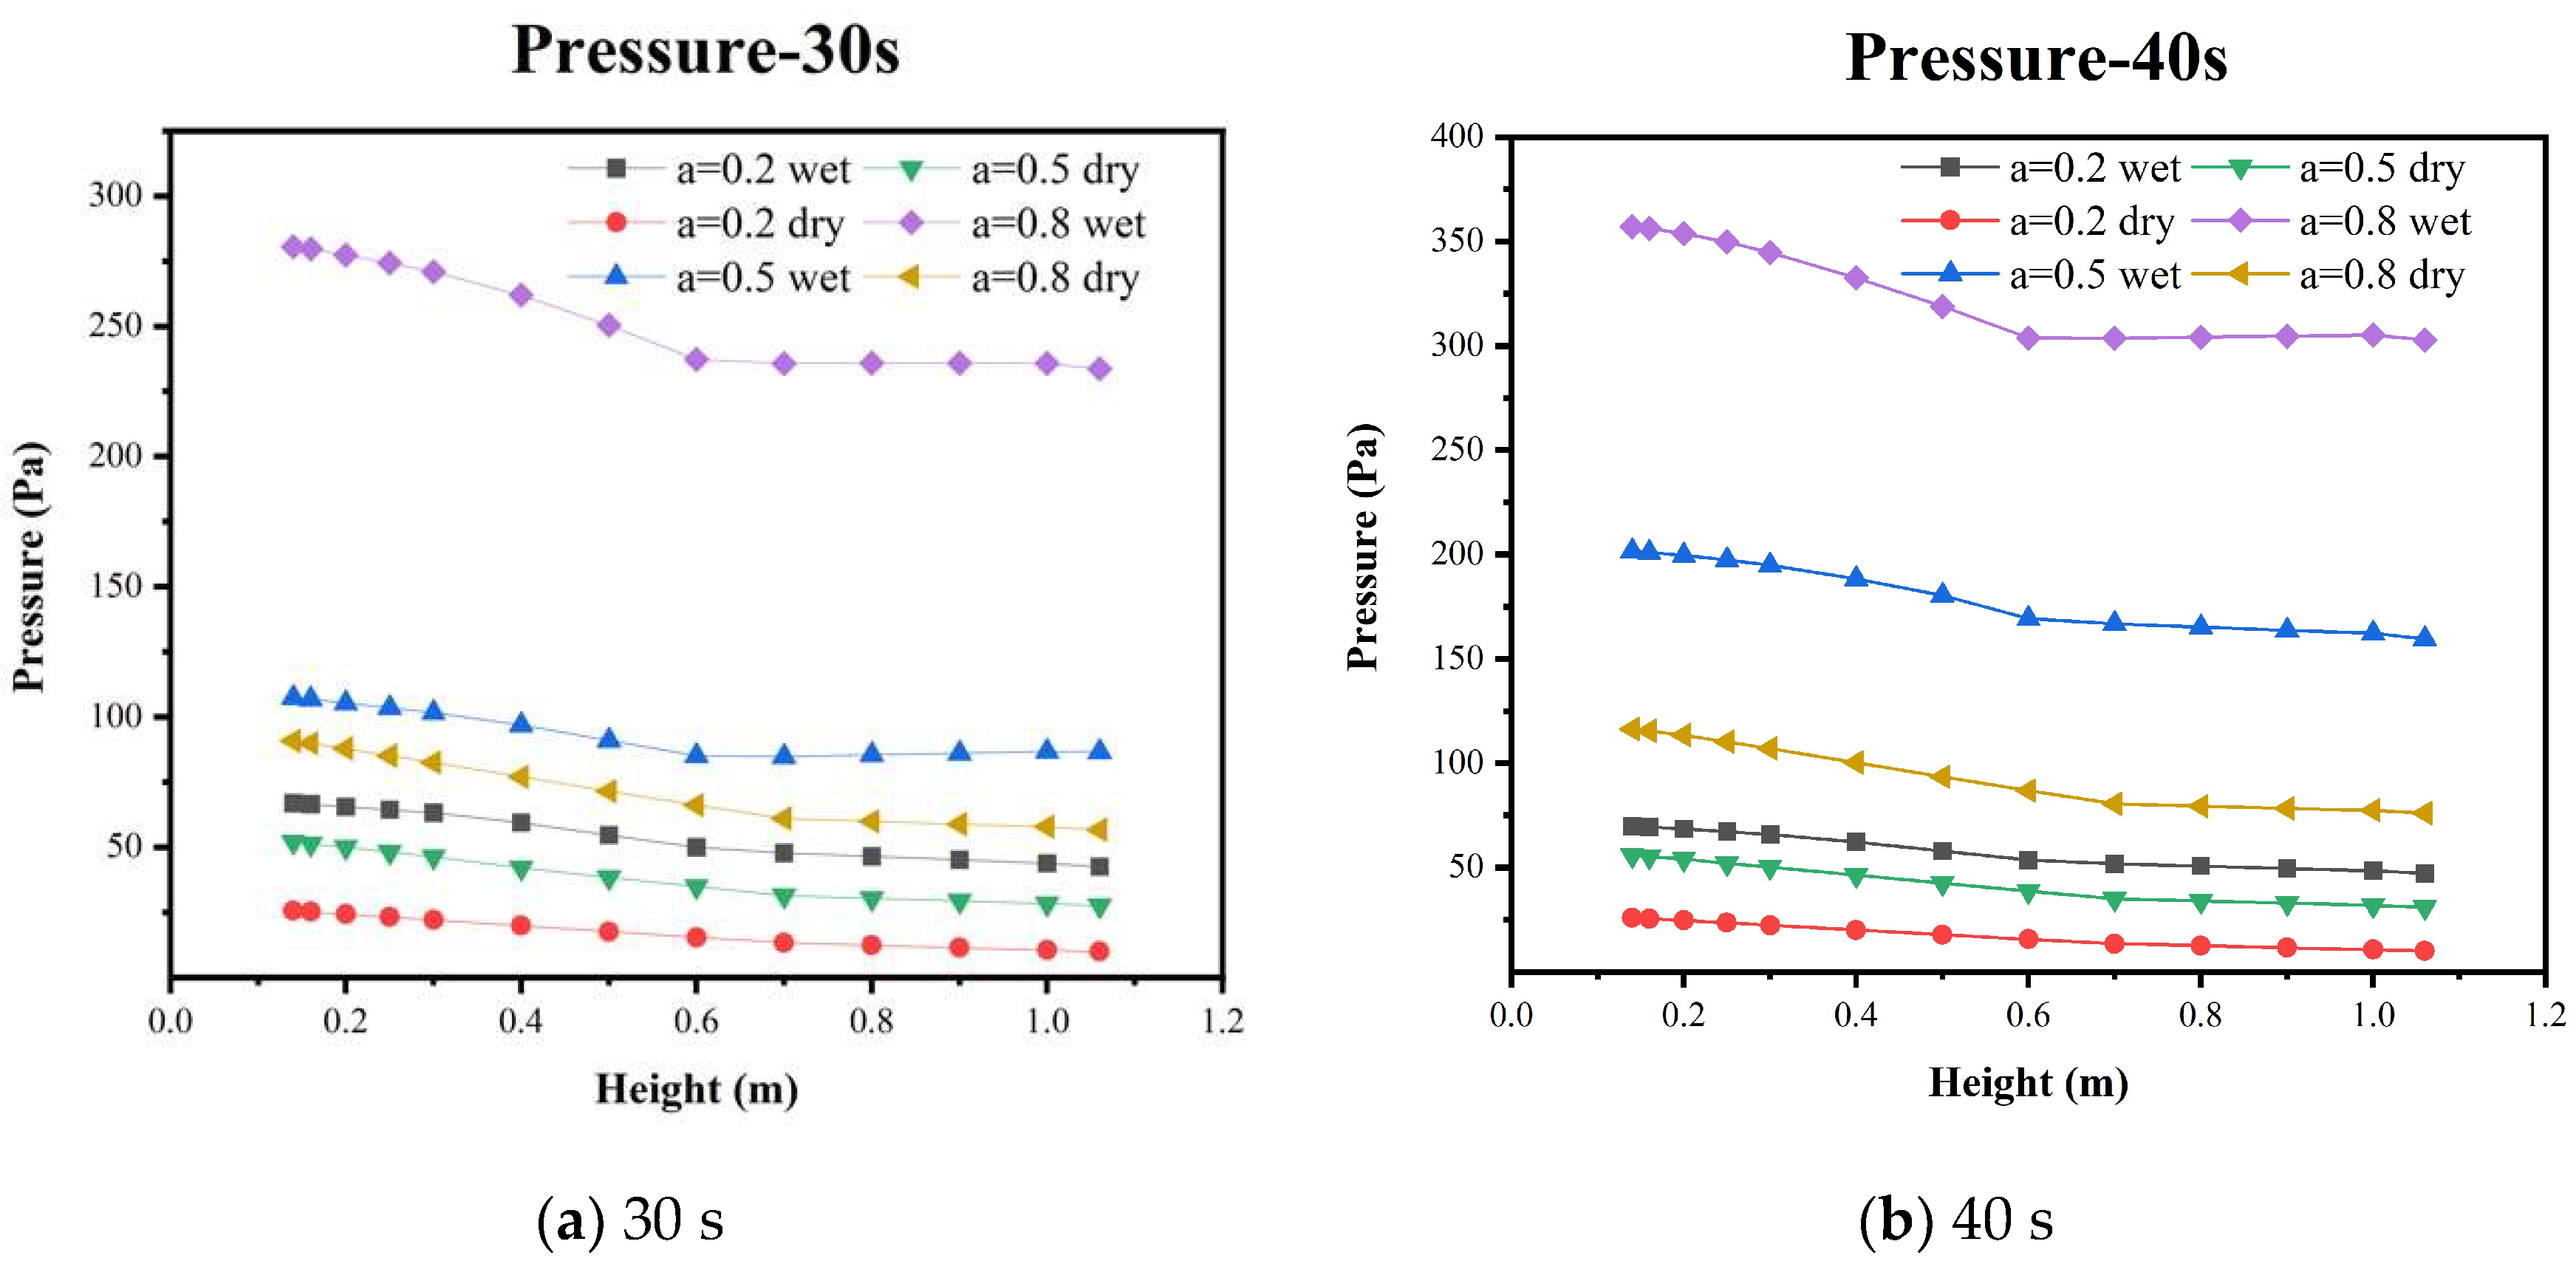
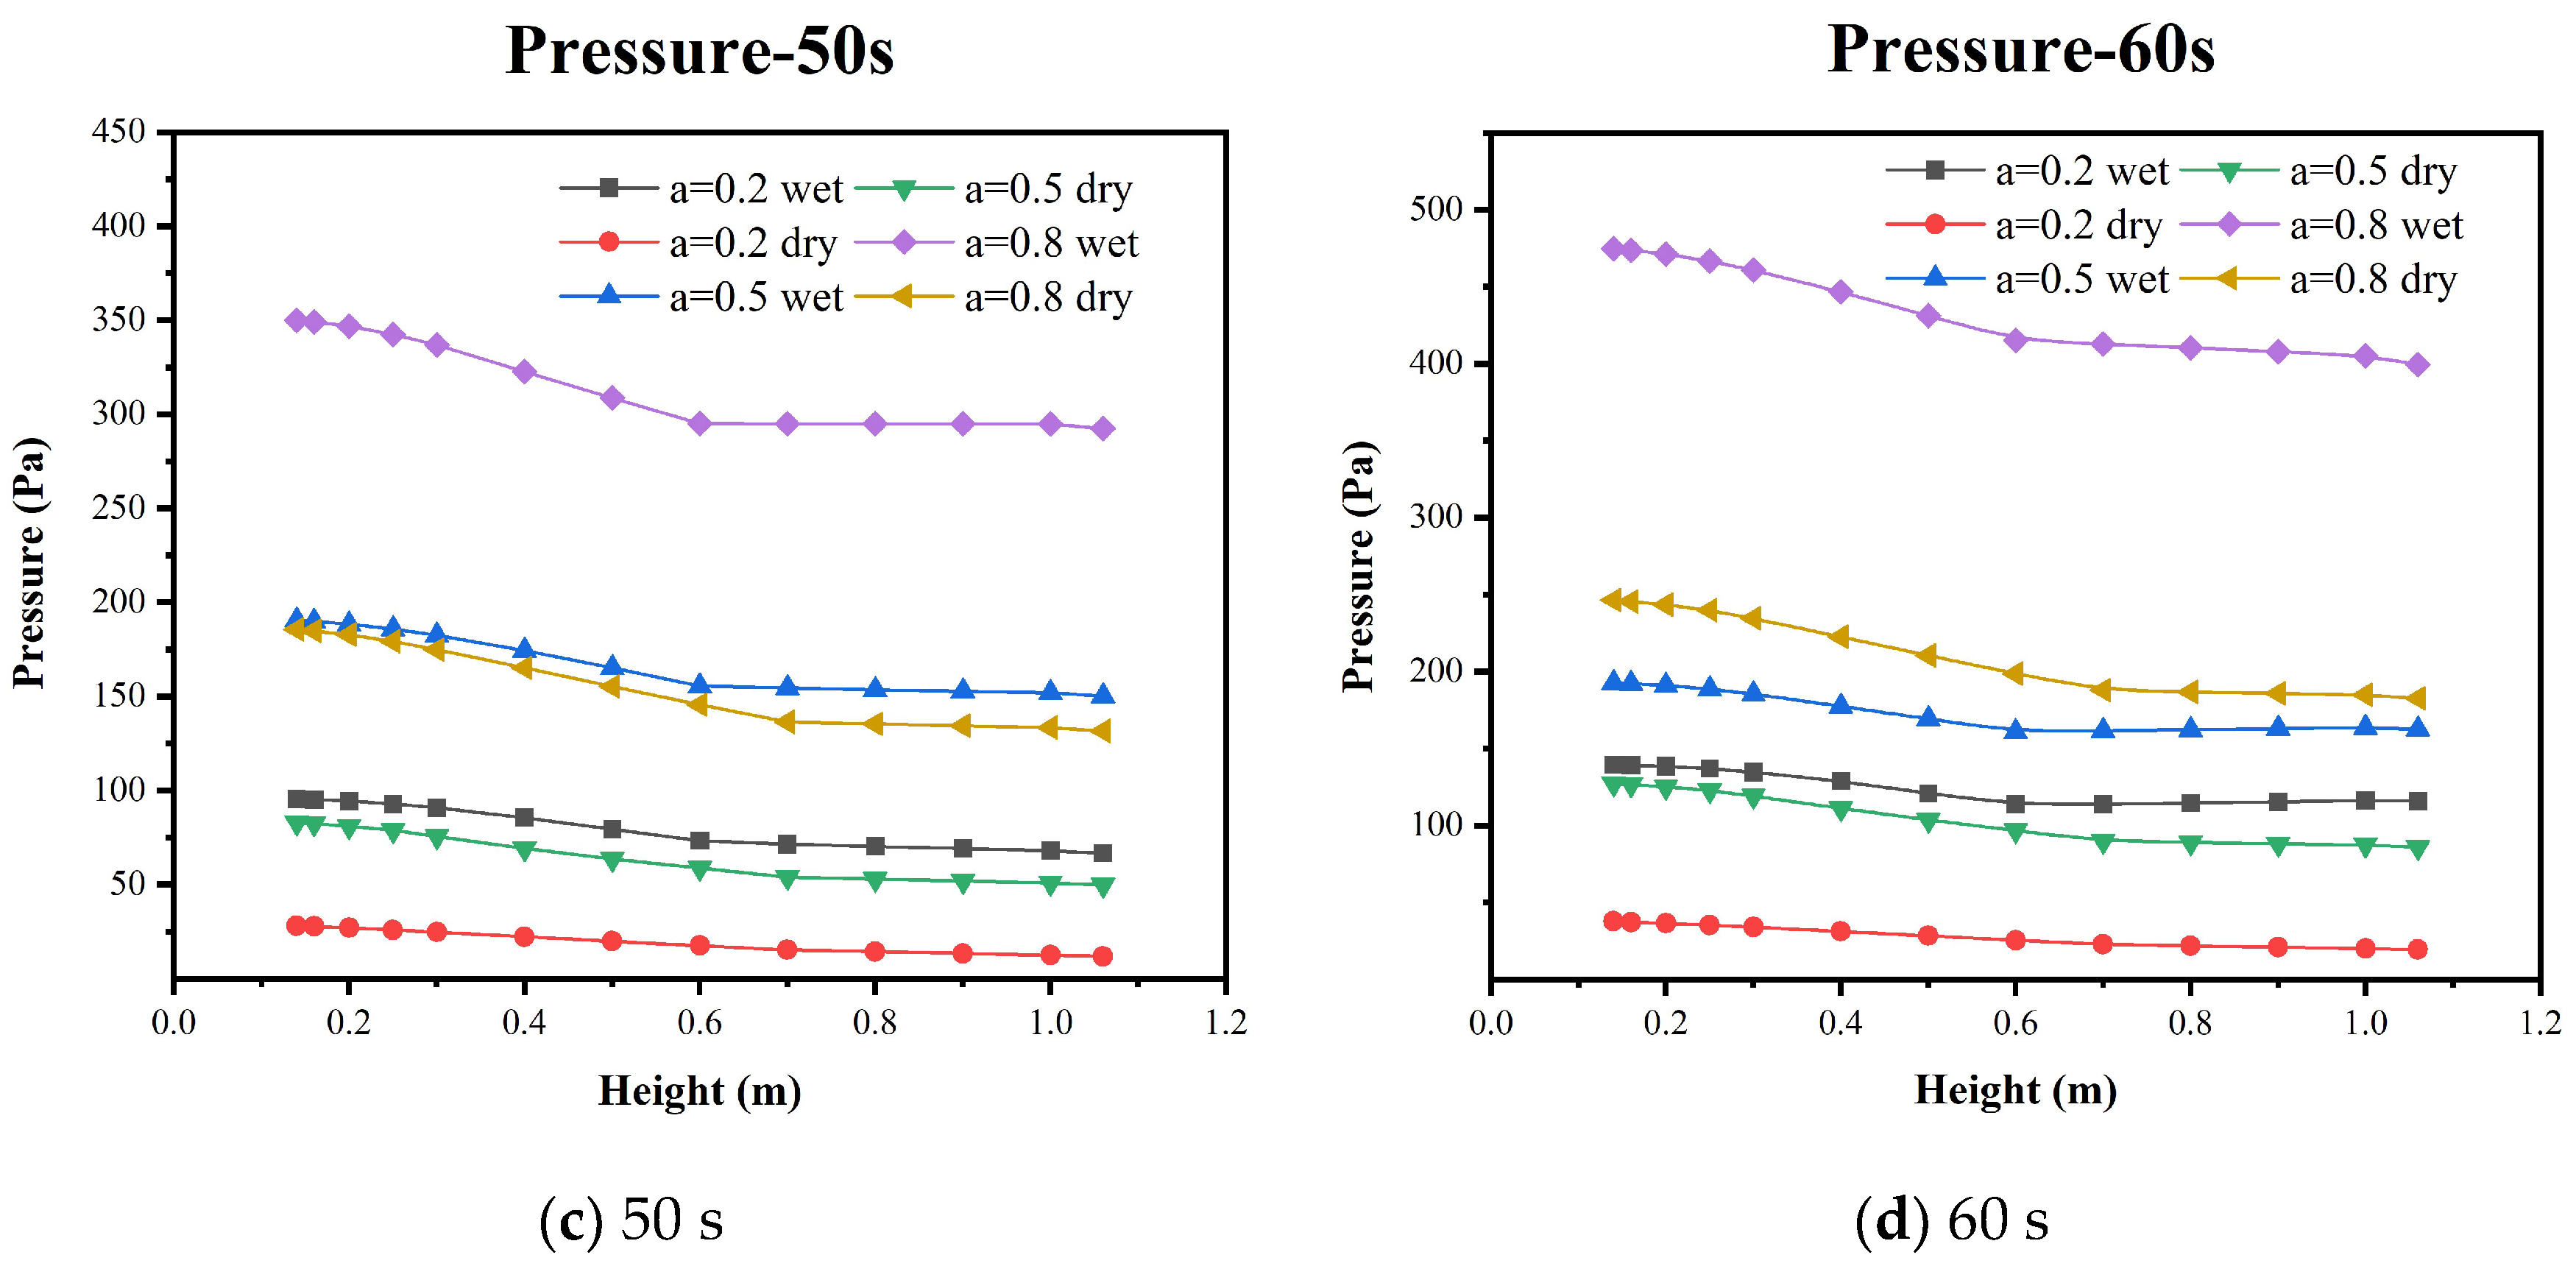
Figure 14 and Figure 15 show that the pressure in the furnace increased gradually from top to bottom along the z-axis. There were large pressure fluctuations in the particle bed that may be due to the different porosities owing to the uneven bed structure, which makes the fluid pass through the particle pores with a large pressure gradient change.
Compared to the upper portion of the furnace, the pressure drop in the lower part of the furnace is larger, indicating that when the fluid passes through the particle bed, there will be a pressure loss; the fluid pressure drops under different moisture contents and excess air coefficients are all around 25 Pa–75 Pa, and the pressure inside the device is lower than 500 Pa. For the same excess air coefficient, the pressure during gasification of moist particles was larger than that of dry particles at the same position, and the overall pressure drop in the furnace was also slightly larger because of increased fluid momentum and pressure caused by water evaporation as the main driving force maintaining the upward movement of the fluid. The overall pressure inside the furnace increased gradually with time, and the pressure and pressure drop continued to change at the end of the simulation, confirming that the actual reaction continues to proceed.

5.3. Temperature Distribution

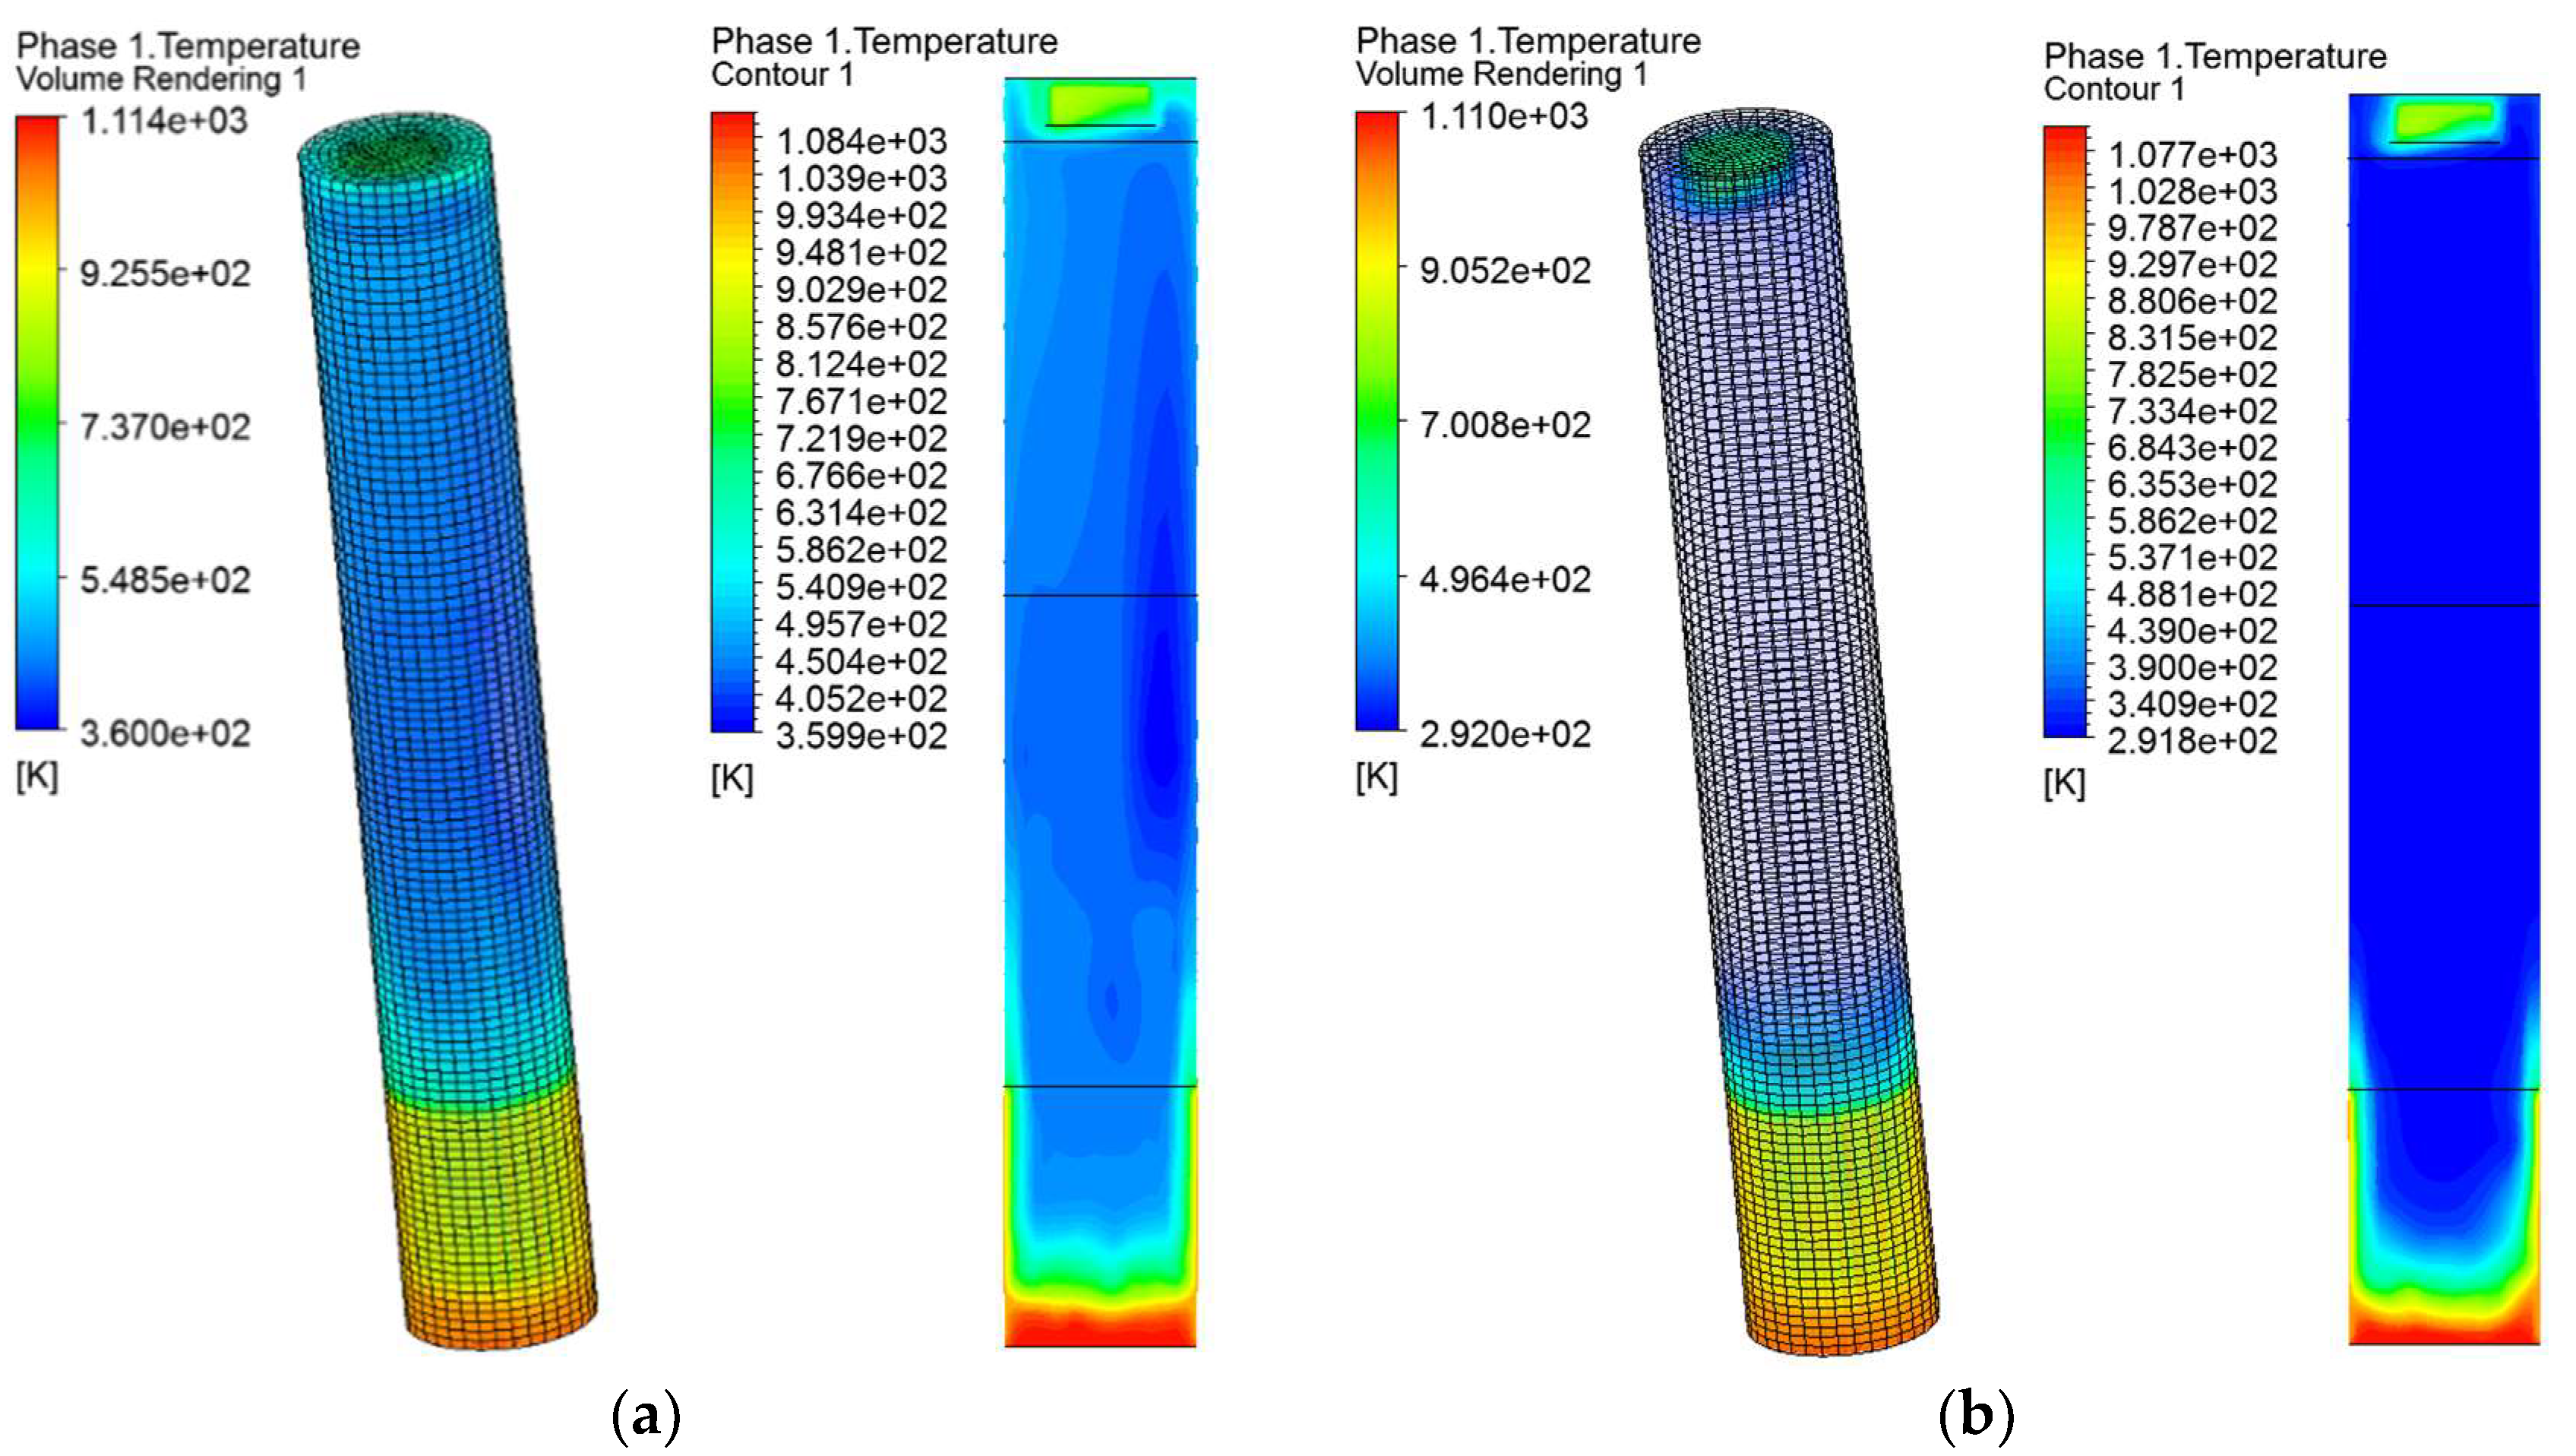
As shown in Figure 16, the temperatures near the bottom of the furnace and the thermal energy storage wall surface were high, and the temperature drops rapidly in the thermal energy storage part and changes slightly above the thermal energy storage part; this temperature change trend is similar to that in [10,56]. On the one hand, the particles are in contact with the high-temperature thermal energy storage wall surface for heat exchange via conduction and radiation; on the other hand, after the inflow of the high-temperature gasification agent, the C(s) at the bottom of the furnace reacts with O2 to generate heat, and the gas flows through the particles to transfer the bottom heat to the upper part of the furnace via convection and conduction. As the amount of O2 decreased and the temperature inside the furnace decreased gradually, the oxidation reaction slowed down, and the rate of reduction and pyrolysis increased gradually. The C(s) absorbs heat to generate reducing gas, and particles thermally release the volatile fraction, which intensifies the temperature drop.
The top of the furnace formed a high-temperature area owing to the accumulation of fluid upward flow in the feed hopper area, the gas concentration was high. O2 was not completely consumed in the furnace; a small part of O2 reacted with combustible gases, and it was difficult for the heat generated in the region to diffuse, eventually triggering the continuous oxidation of combustible gas; these circumstances should be avoided in the furnace as much as possible.
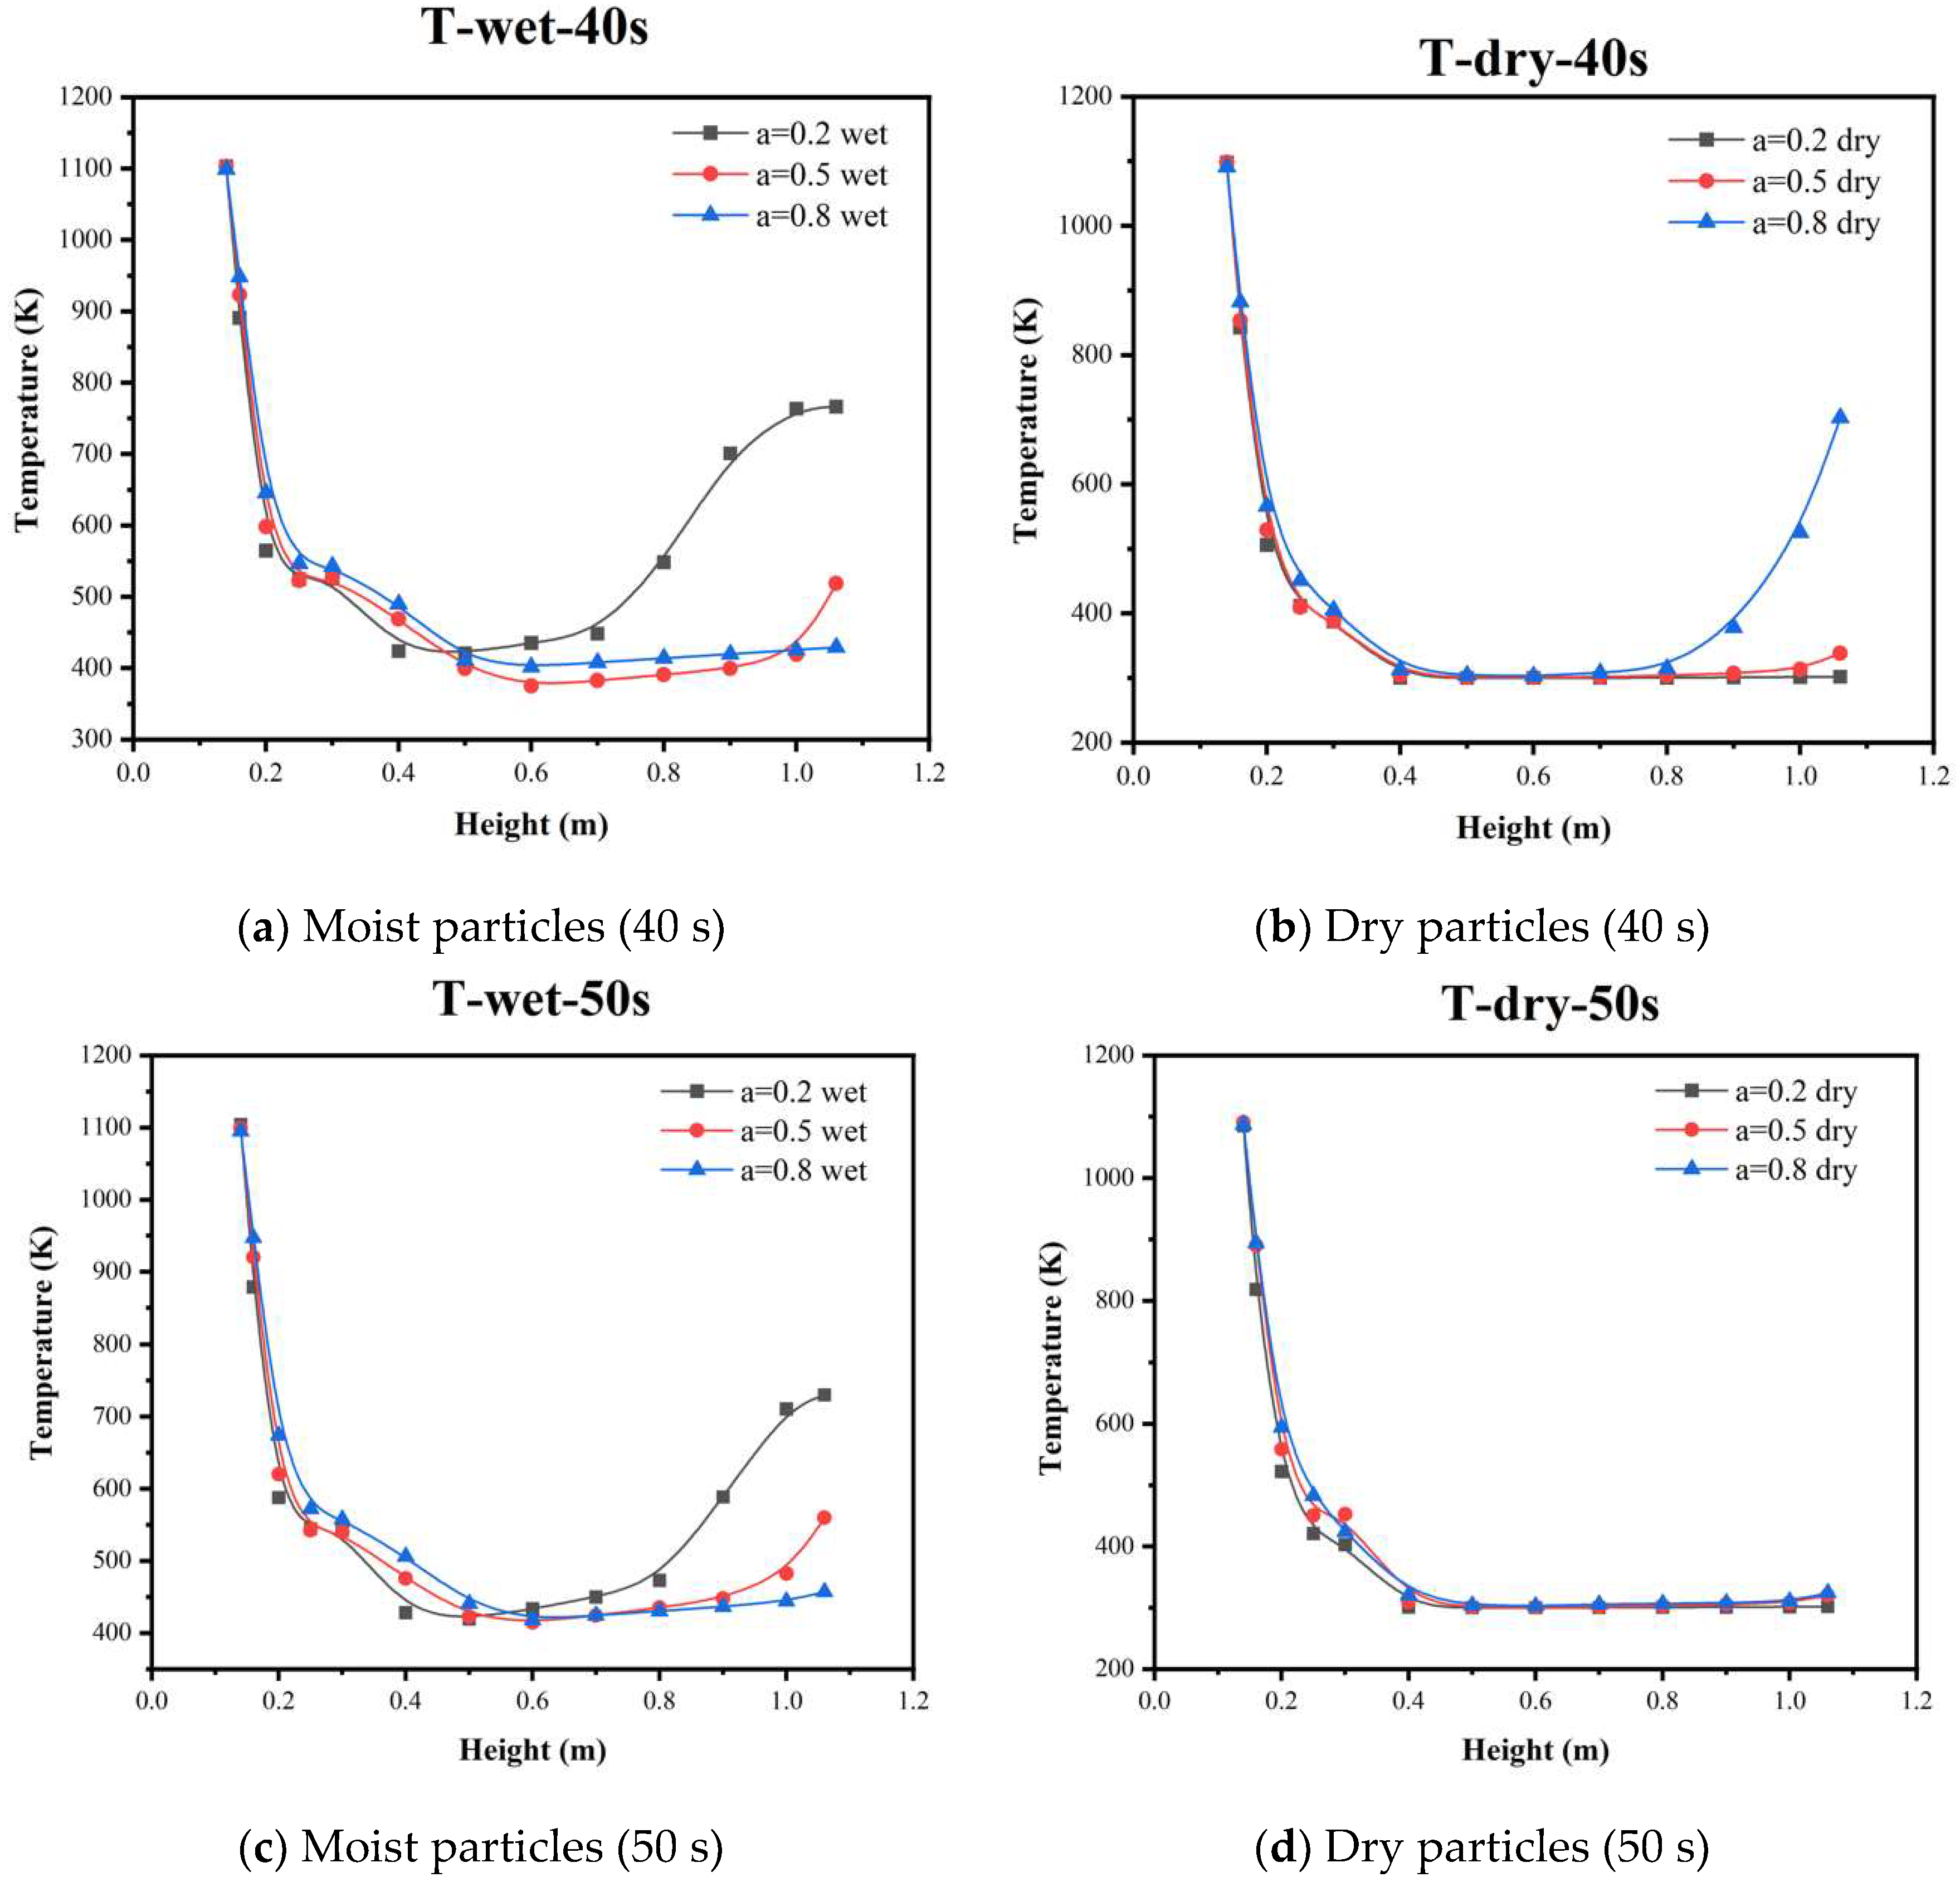
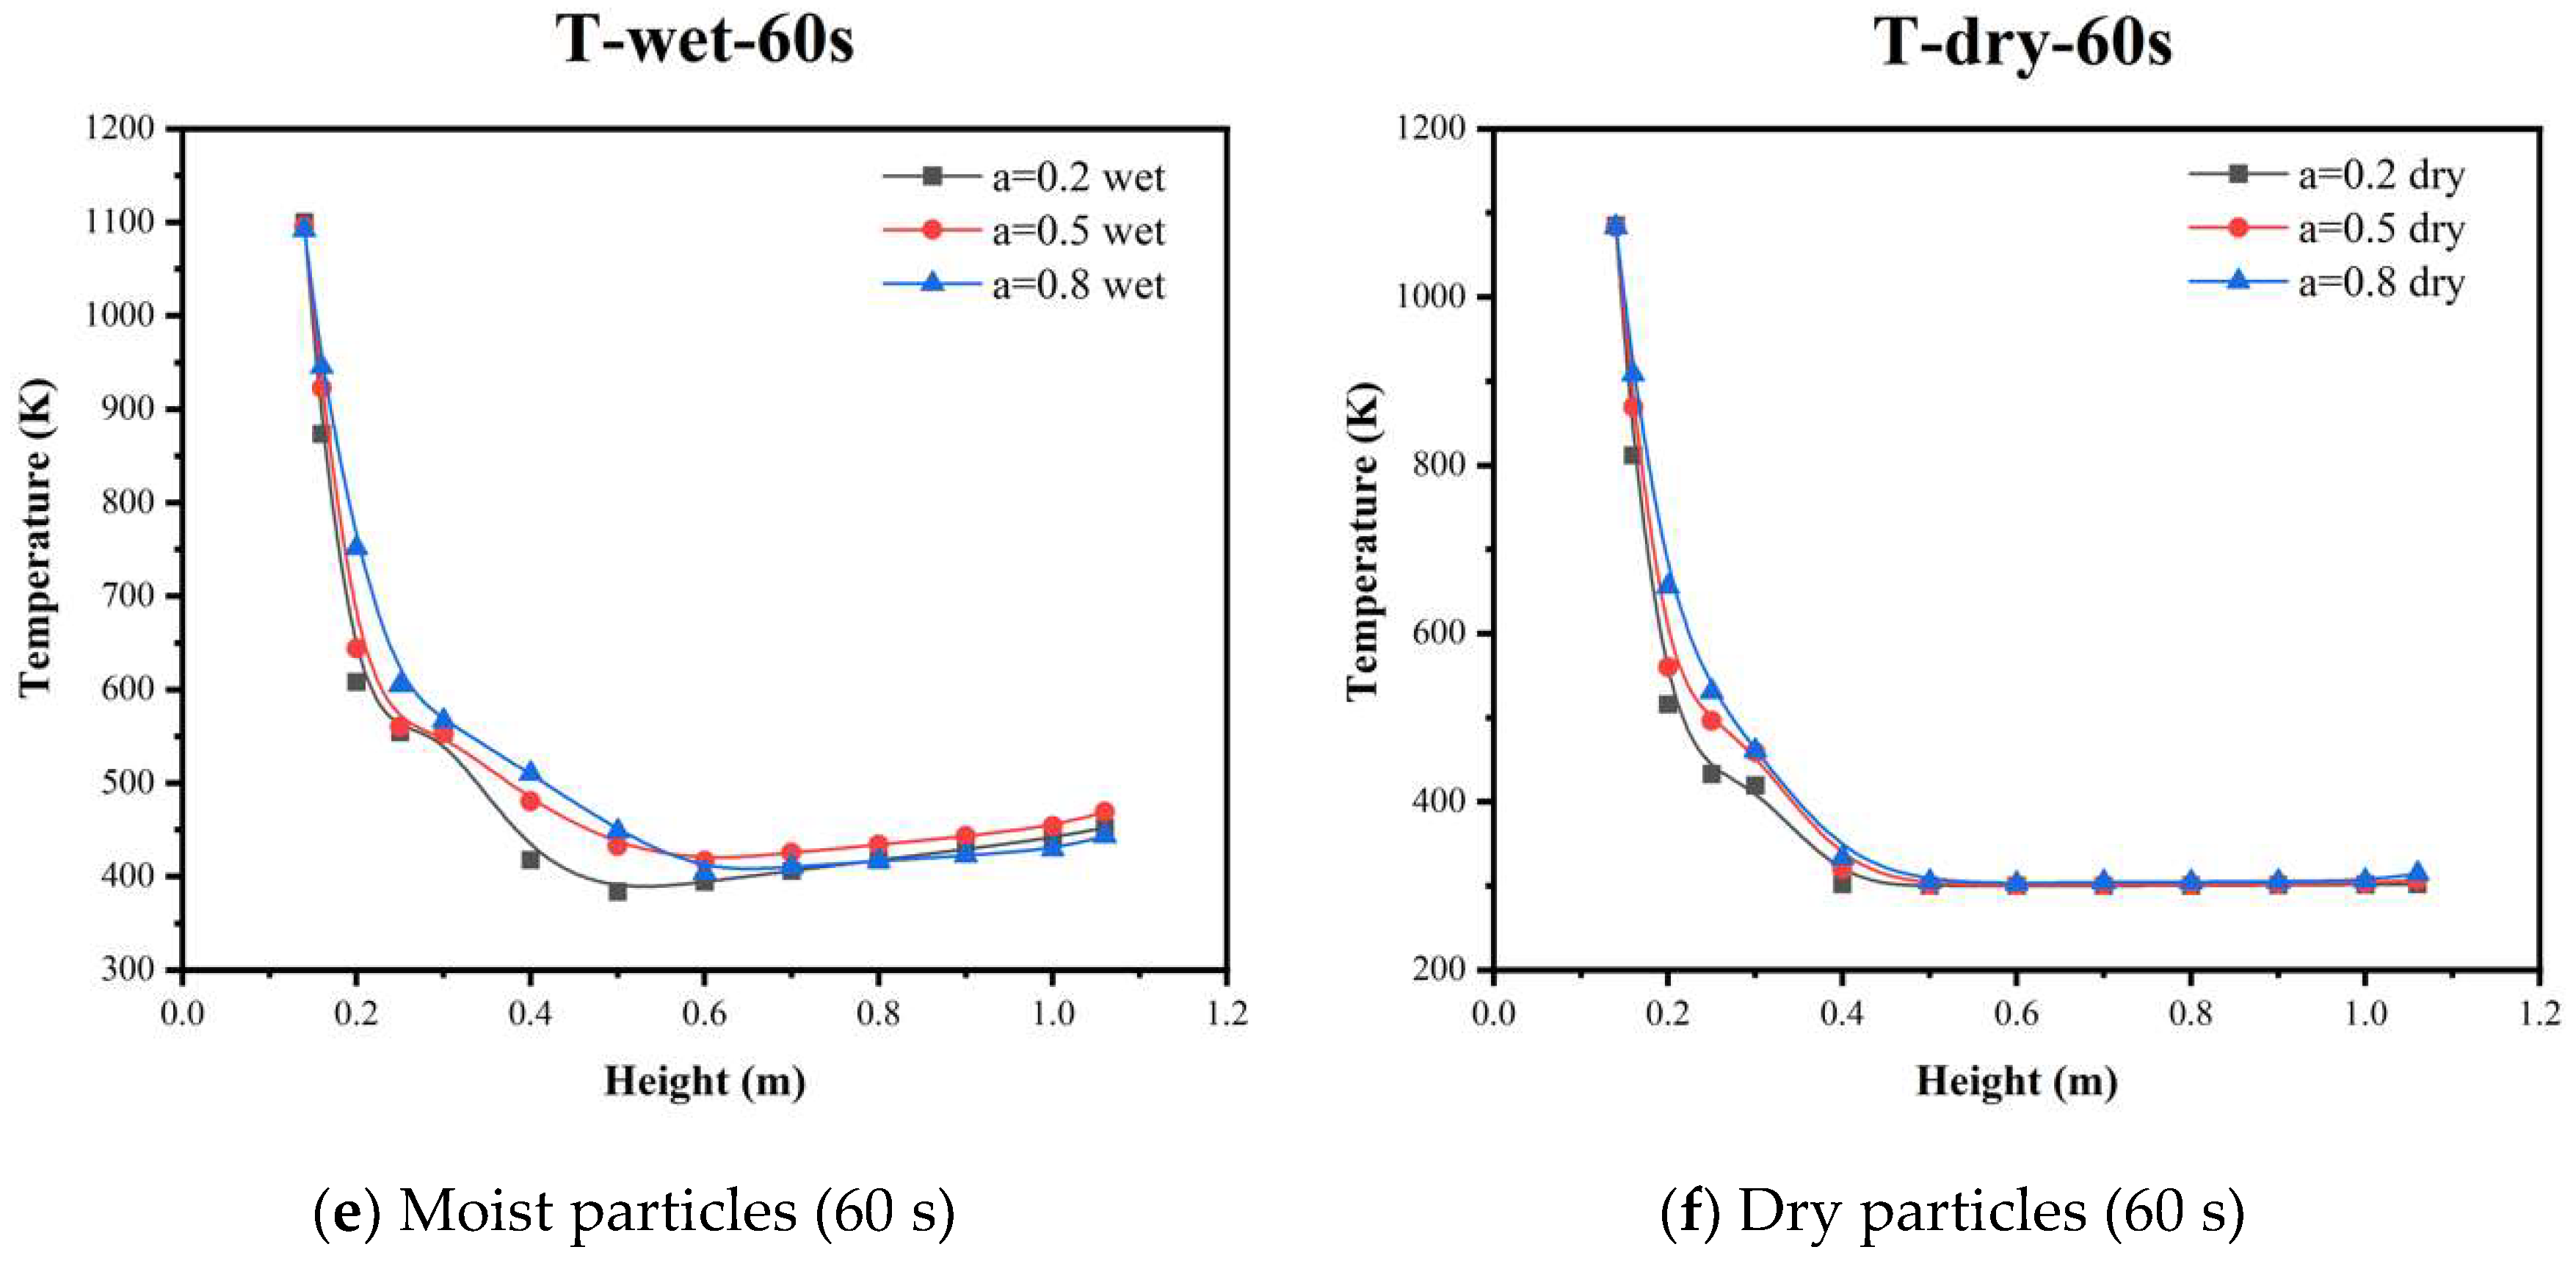
As shown in Figure 17, the fluid temperature decreased rapidly after the fluid passed through the particle region, indicating that the heat absorption process of the reduction reaction has a significant effect on the temperature. During the gasification of moist particles, the fluid temperature decreased after the fluid passed through the reduction region and then increased slightly; this temperature raise decreased gradually with the extension of simulation time. When the simulation time reached 60 s, the temperature rise was no longer evident, indicating that the reaction in the upper part was weakened. Therefore, the undesirable high-temperature state at the top can be addressed by extending the simulation time; in the actual experiment, this phenomenon also disappeared with time.
Compared with moist particles, the fluid temperature during the gasification of dry particles achieved relative stability more rapidly; the temperature in the middle and upper parts of the furnace no longer changed significantly at approximately 40 s, and it was stabilized at approximately 300 K. The particle bed pyrolysis and reduction absorbed a significant amount of heat, and the influence of the top high-temperature zone was limited, gradually weakening with time. Different gasification agent flow rates have a negligible effect on the distribution and changes in the furnace temperature, and the inflection points of significant temperature drops in the furnace appeared at the same position, indicating that the temperature field shares similarity.

5.4. Gas Species Distribution and Gasification Reaction Characteristics

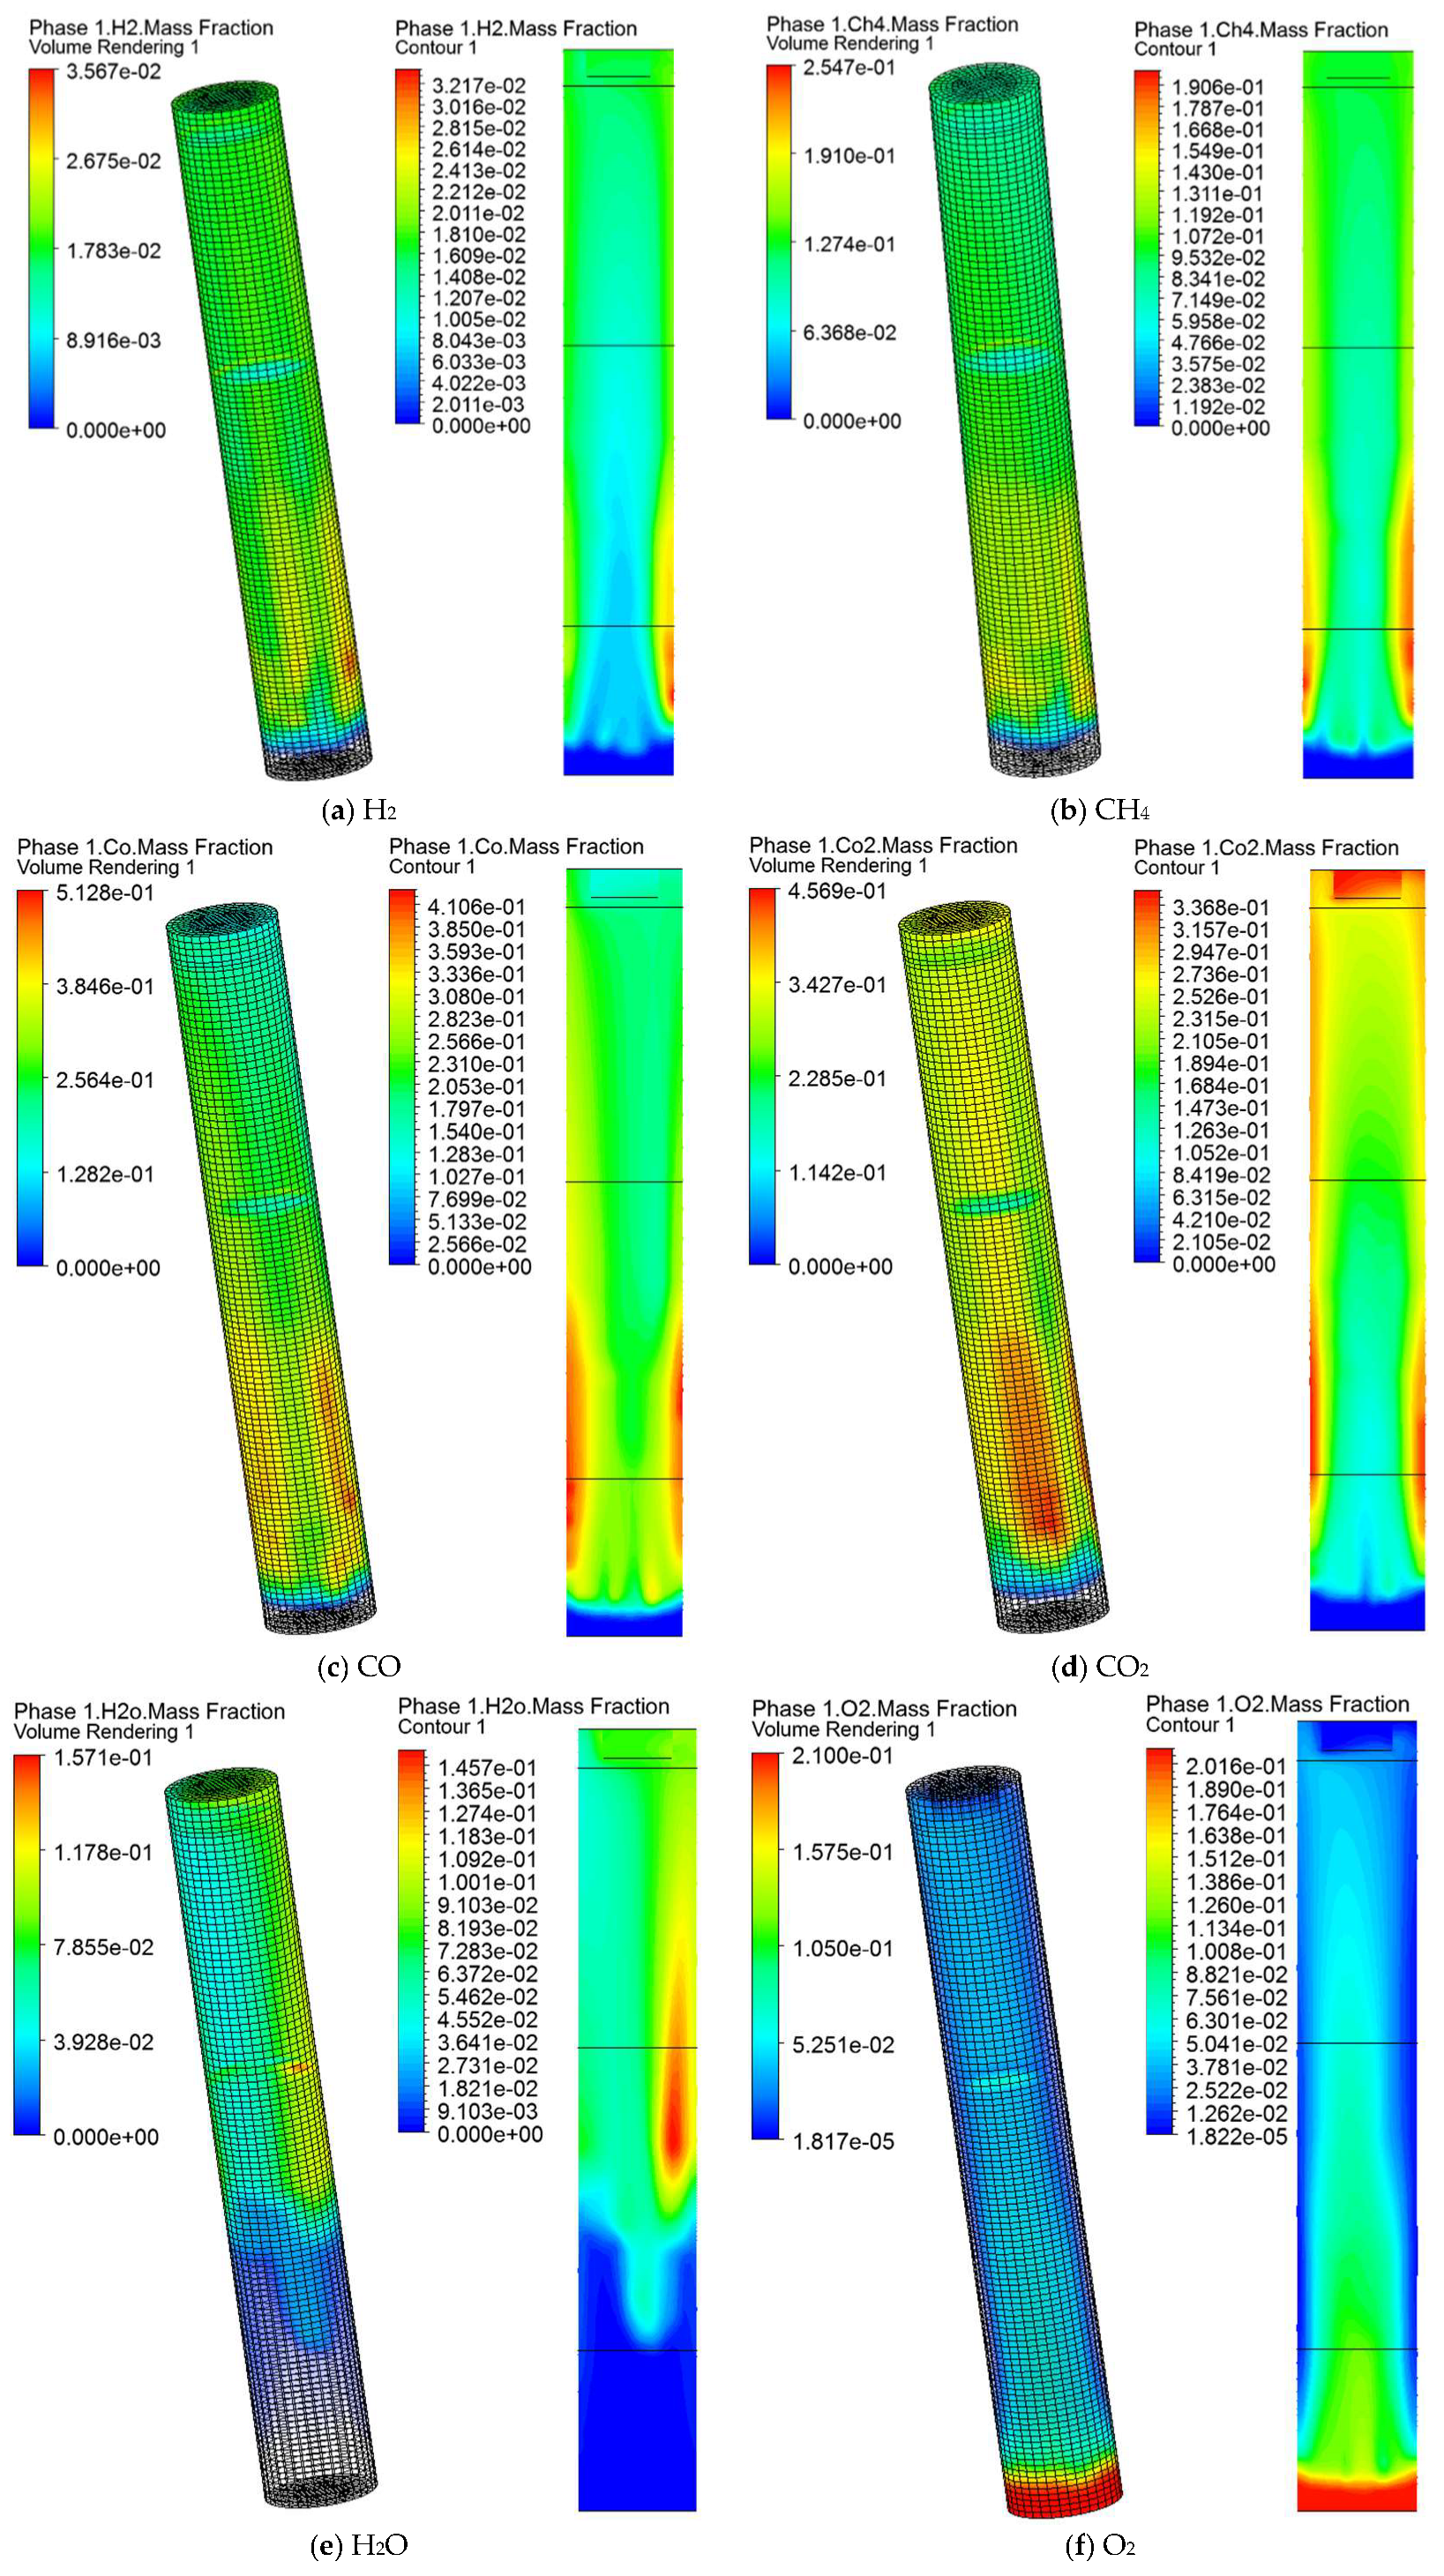
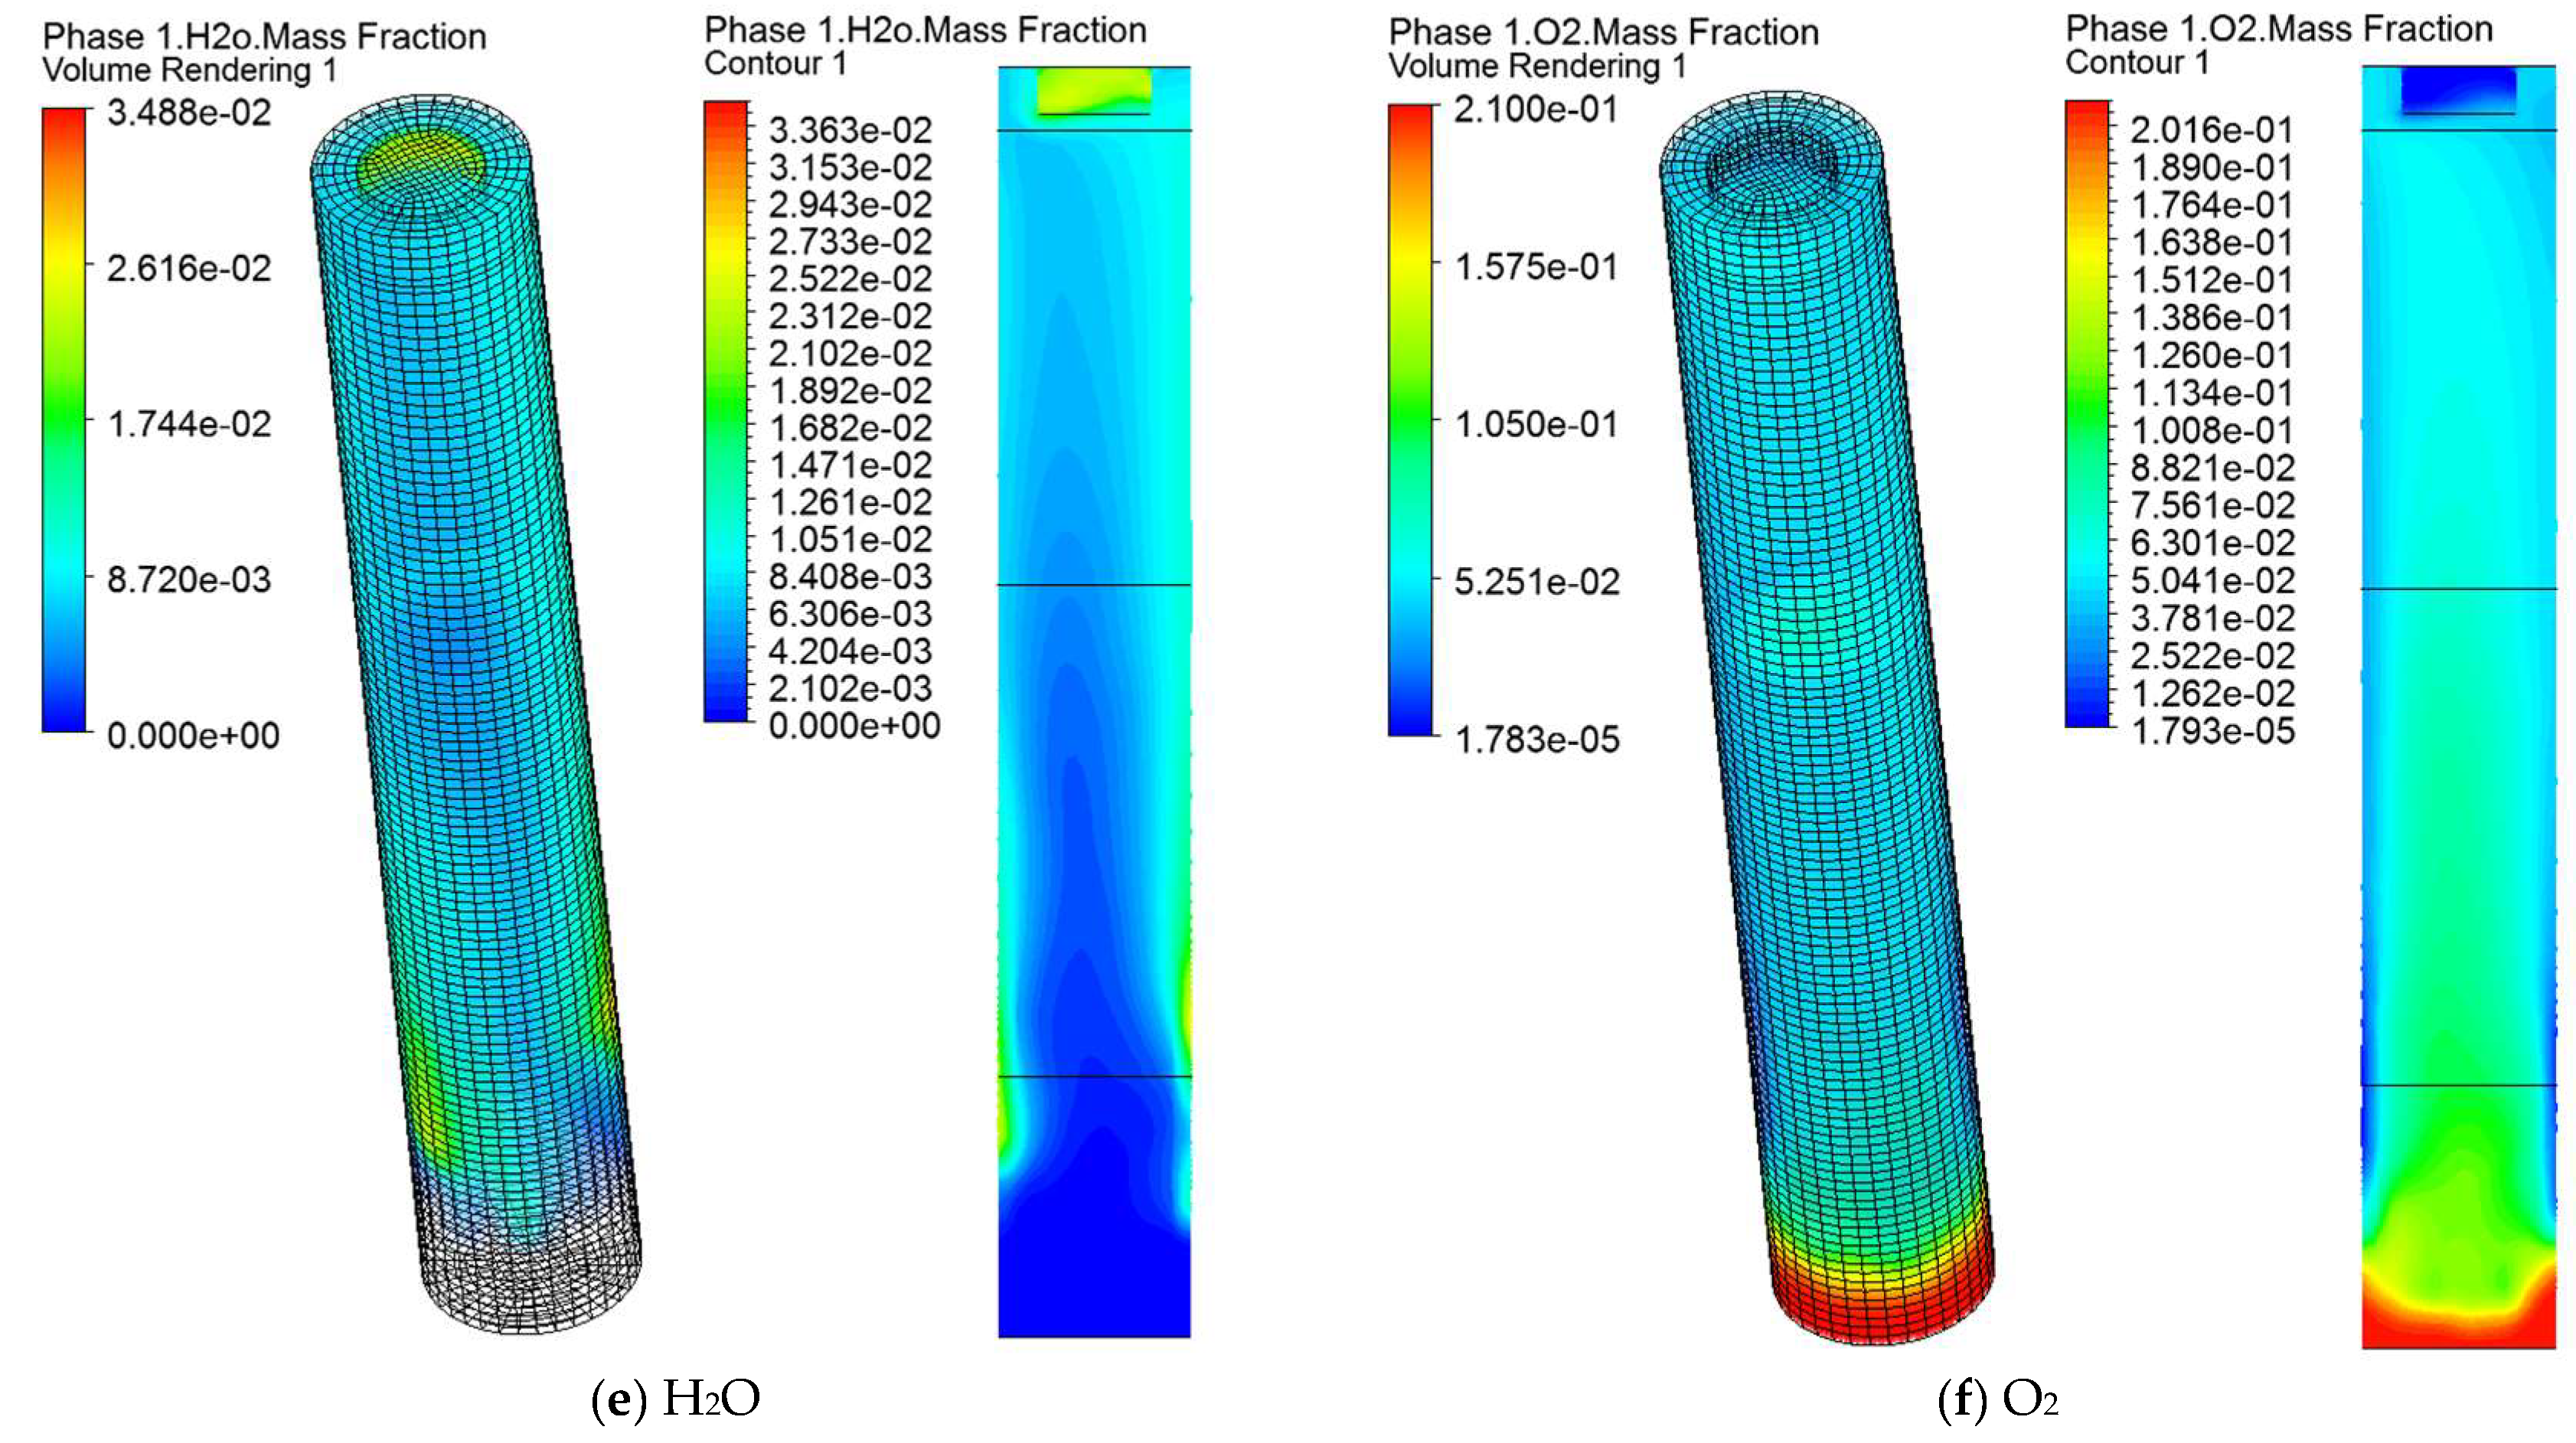
The species distribution cloud diagrams of the gasification reaction are shown in Figure 18 and Figure 19. The species of volatile gas were generated near the thermal energy storage wall surface and concentrated in the thermal energy storage part, indicating that temperature is the most important factor affecting pyrolysis. Moreover, the particles absorbed heat from the high-temperature wall surface for the pyrolysis reaction, while the close arrangement of the particles made it difficult for the inner particles to exchange heat with the outer particles and high-temperature wall surface. After the gasification agent was fed from the bottom of the furnace, a large amount of heat was absorbed by the bottom particles due to the reduction reaction, and the particles obstructed the convective heat exchange; thus, it was difficult for the gasification agent to transport the heat from the lower part to the upper part.
The pyrolysis gases are carried by the fluid moving upward along the z-axis; therefore, it is difficult for the pyrolysis gases to be transferred to the middle of the furnace through convection and diffusion, the distribution of the gas species shows that the pyrolysis gas tends to have a higher mass fraction near the wall of the furnace and a lower mass fraction in the center.
In the top region of the furnace, the mass fractions of H2 and CO were significantly reduced, and the remaining O2 was heavily consumed, while those of CO2 and H2O were increased. These findings confirm the previous inference that oxidation occurs at the top of the furnace. As the gasification agent contains a large amount of N2, which dilutes the syngas, the higher the gasification agent mass flow rate, the higher the N2 content, and the mass fraction of combustible species, such as H2 and CO, will be reduced, leading to a low calorific value. However, the increase in excess air coefficient can enhance the convective heat exchange effect in the furnace and promote the occurrence and cascade of each chemical reaction, which will speed up the gasification reaction rate, increase the mass conversion from the discrete phase to the fluid phase, and improve the gas production rate. Therefore, the gasification agent flow rate has a significant impact on the gasification process. The mass fraction of CO2 gradually increased with the increase in furnace height, which is similar to the results of [29,56].
Moisture occupies a large proportion of the furnace during the gasification of moist particles, which are concentrated in the middle and upper parts of the furnace; this area is connected with the pyrolysis region, indicating that there is a more evident distinction between the drying and pyrolysis layers.
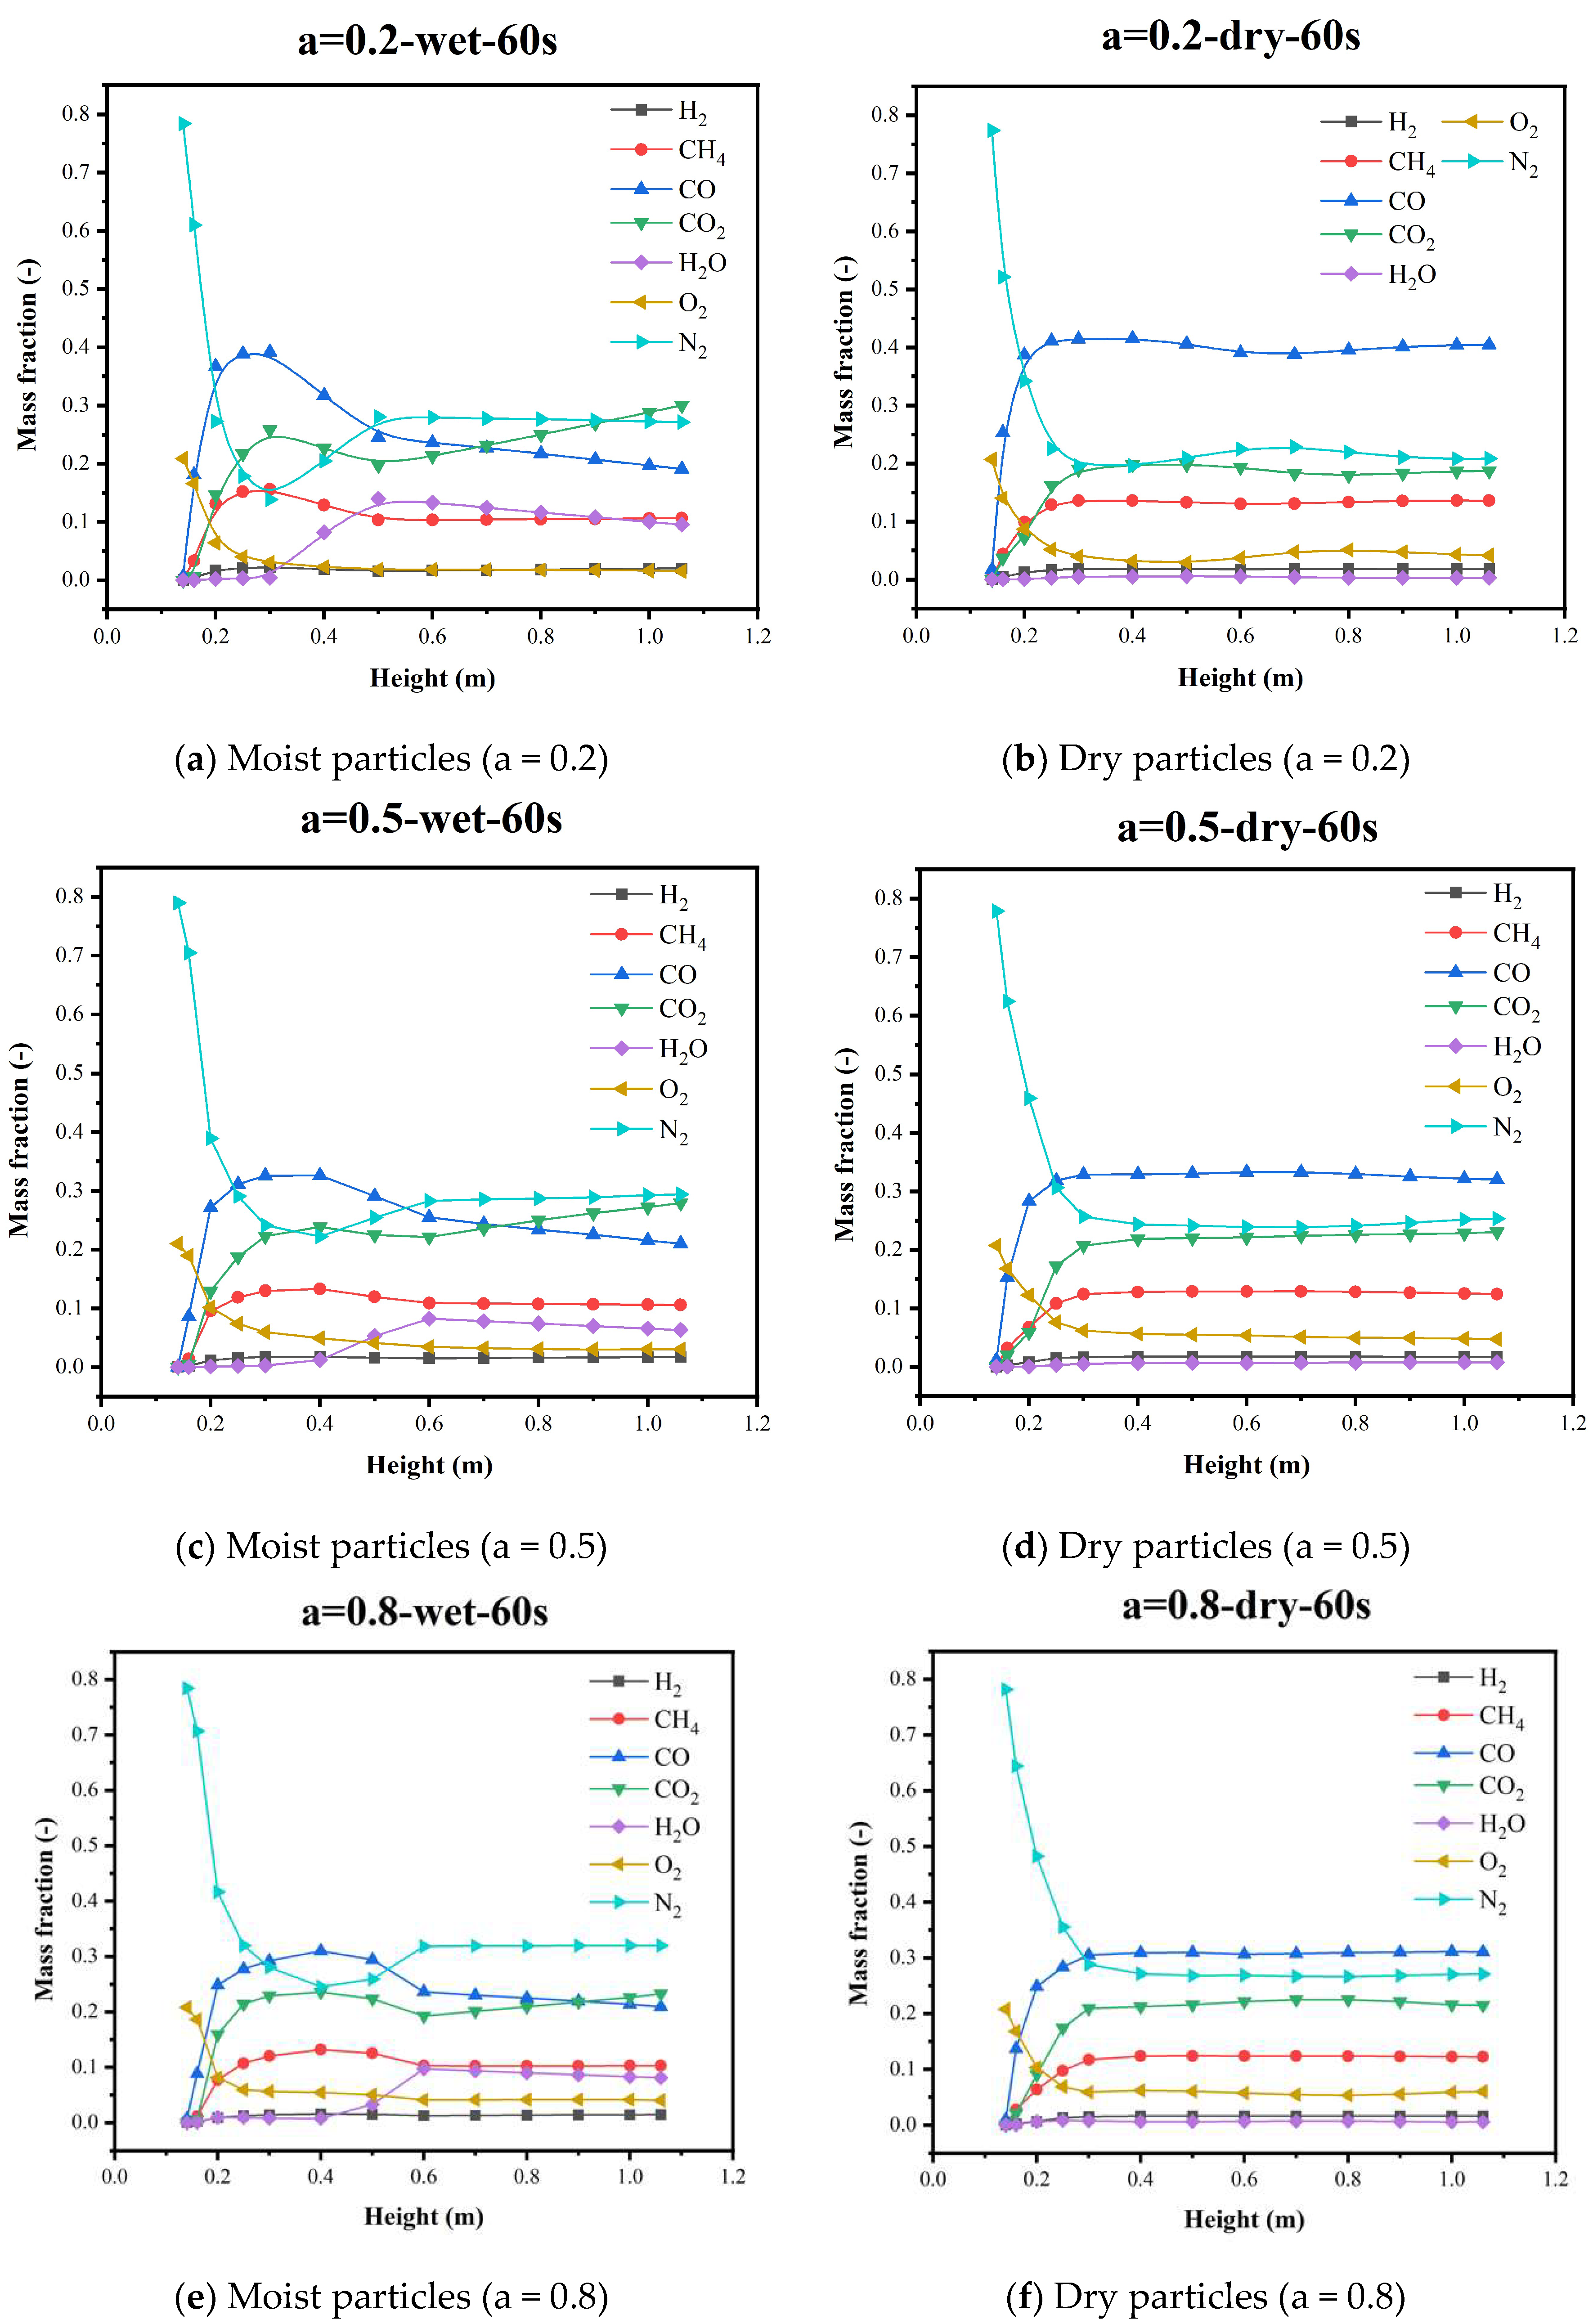
Figure 20 shows that the changes in the gas species in the thermal energy storage part were large, and the rapid decrease in the N2 mass fraction (from 80% to 20–30%) indicates that heterogeneous reactions occurred in the region, resulting in the discrete phase transferring mass to the continuous phase through pyrolysis and reduction reactions, causing the continuous phase mass to increase rapidly. The mass fraction of O2 was greatly reduced (from 20% to less than 5%) via oxidation.
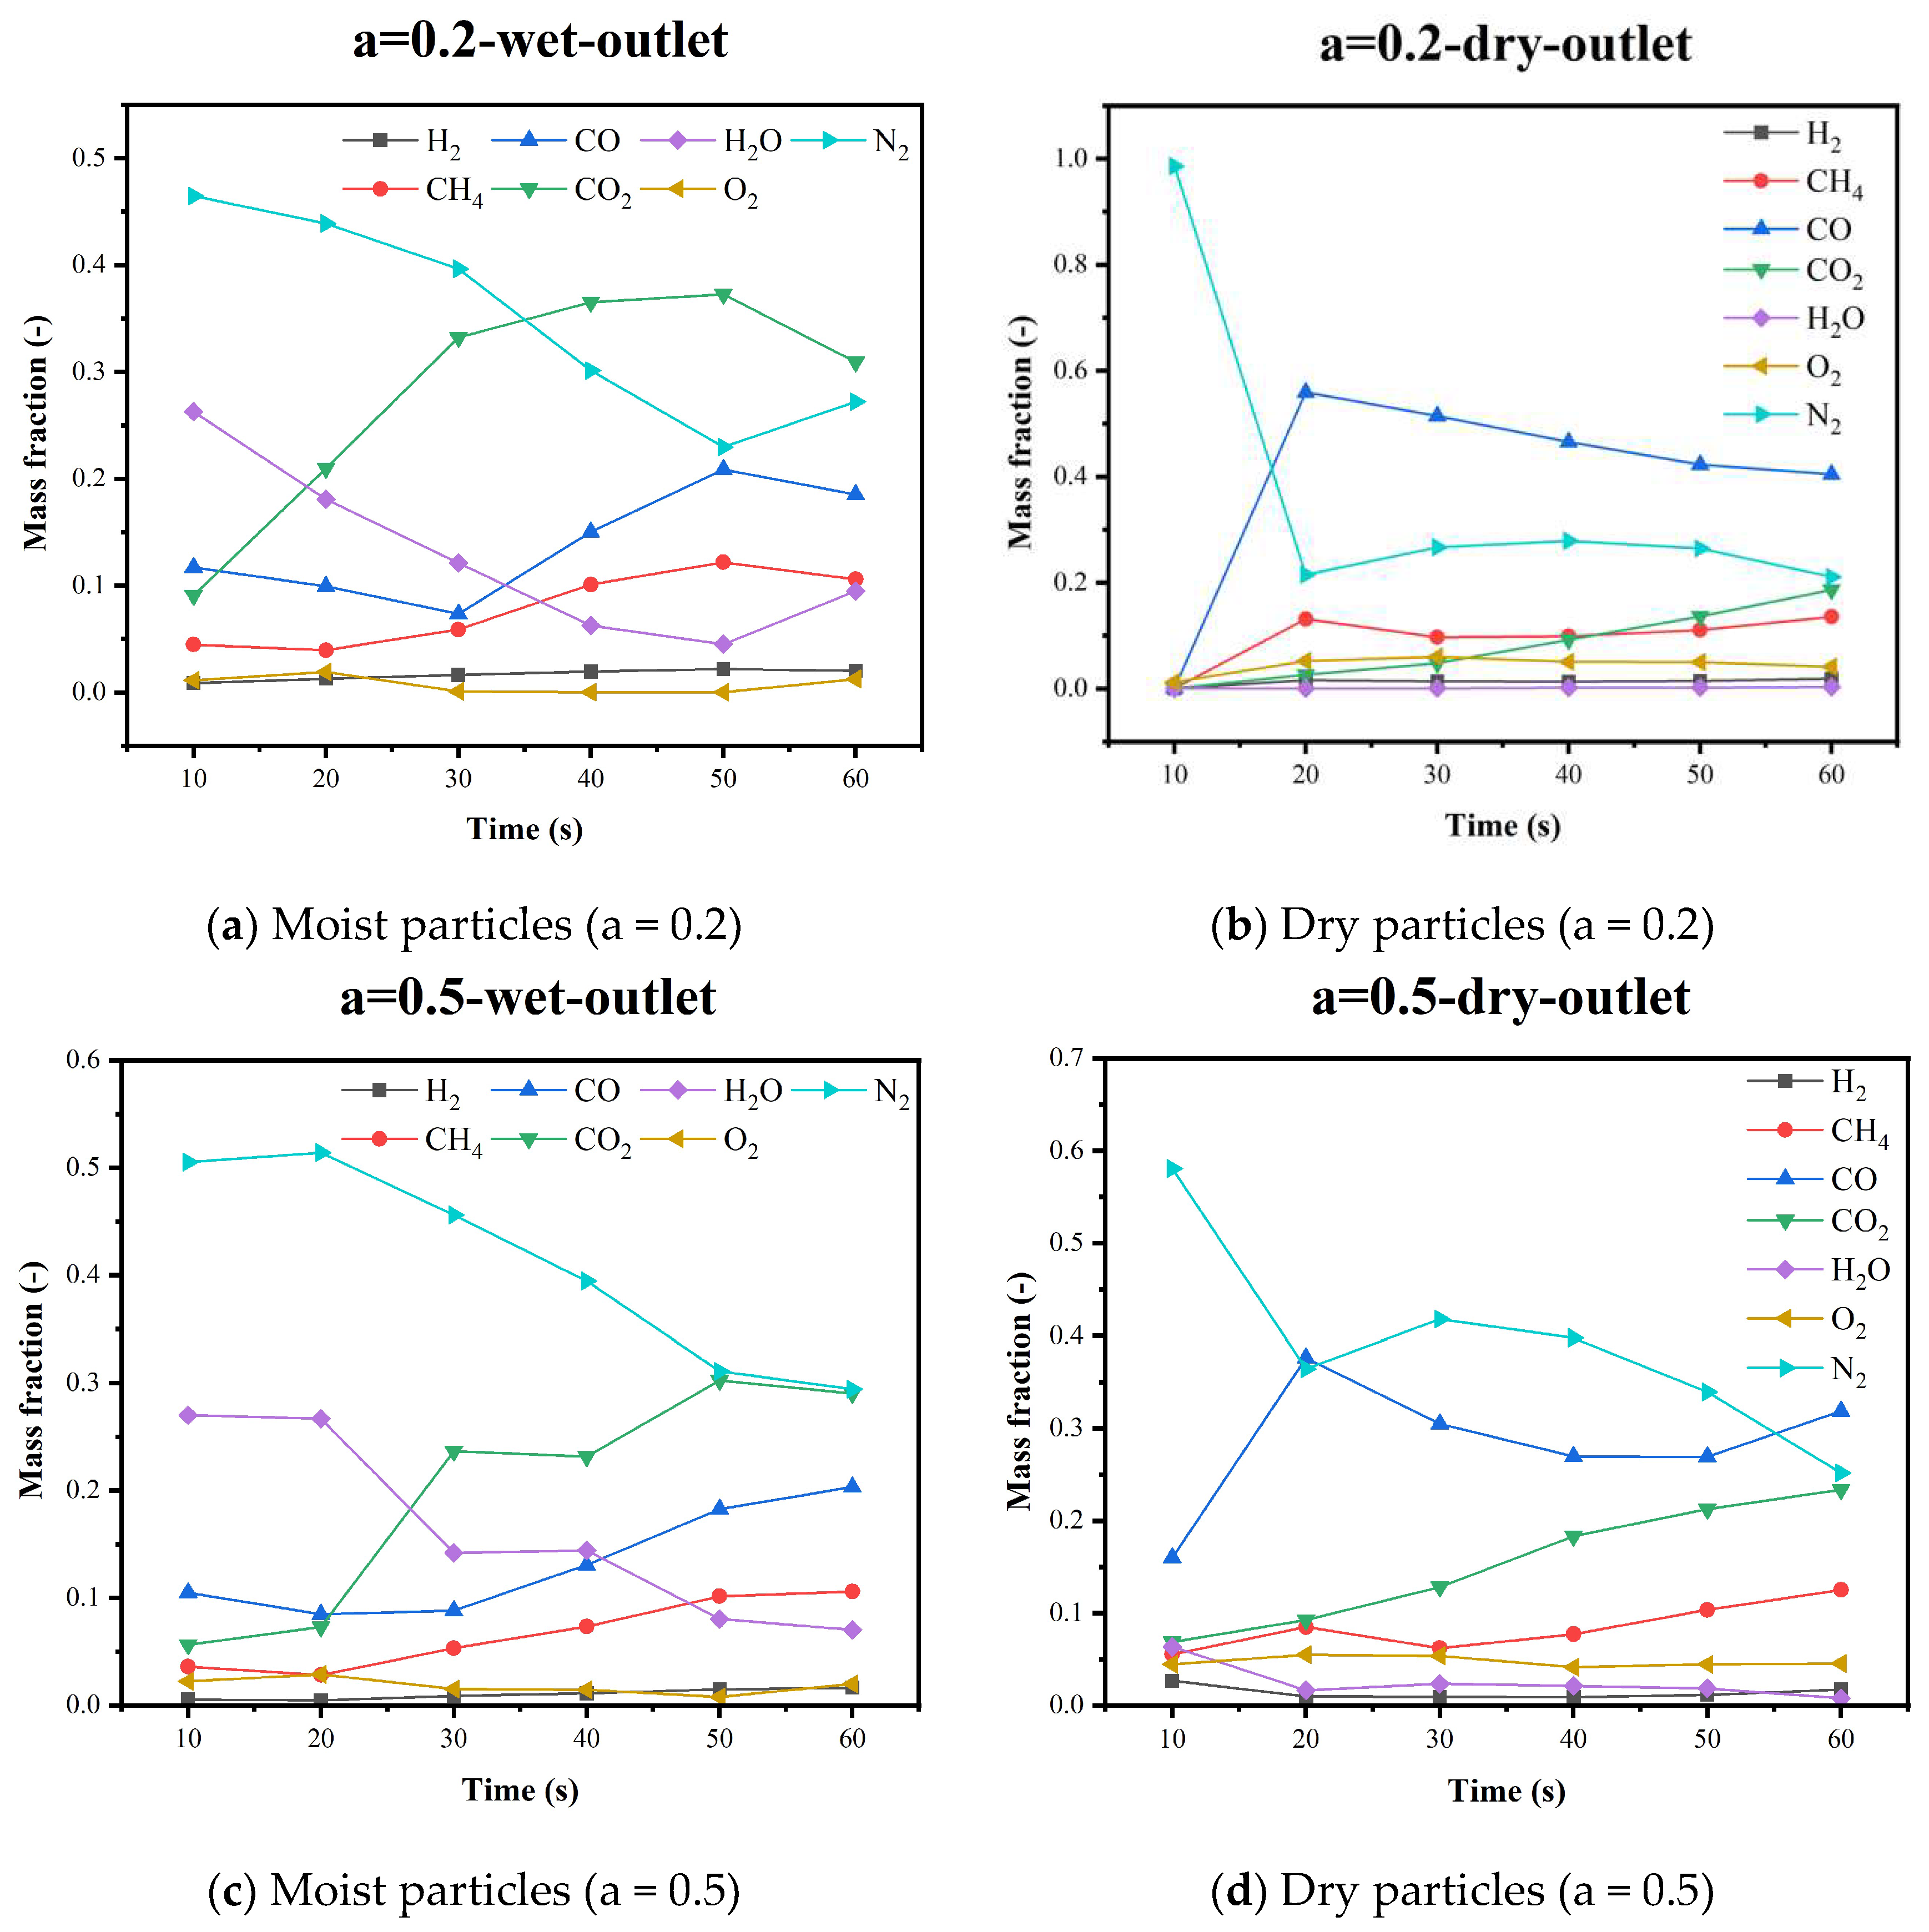
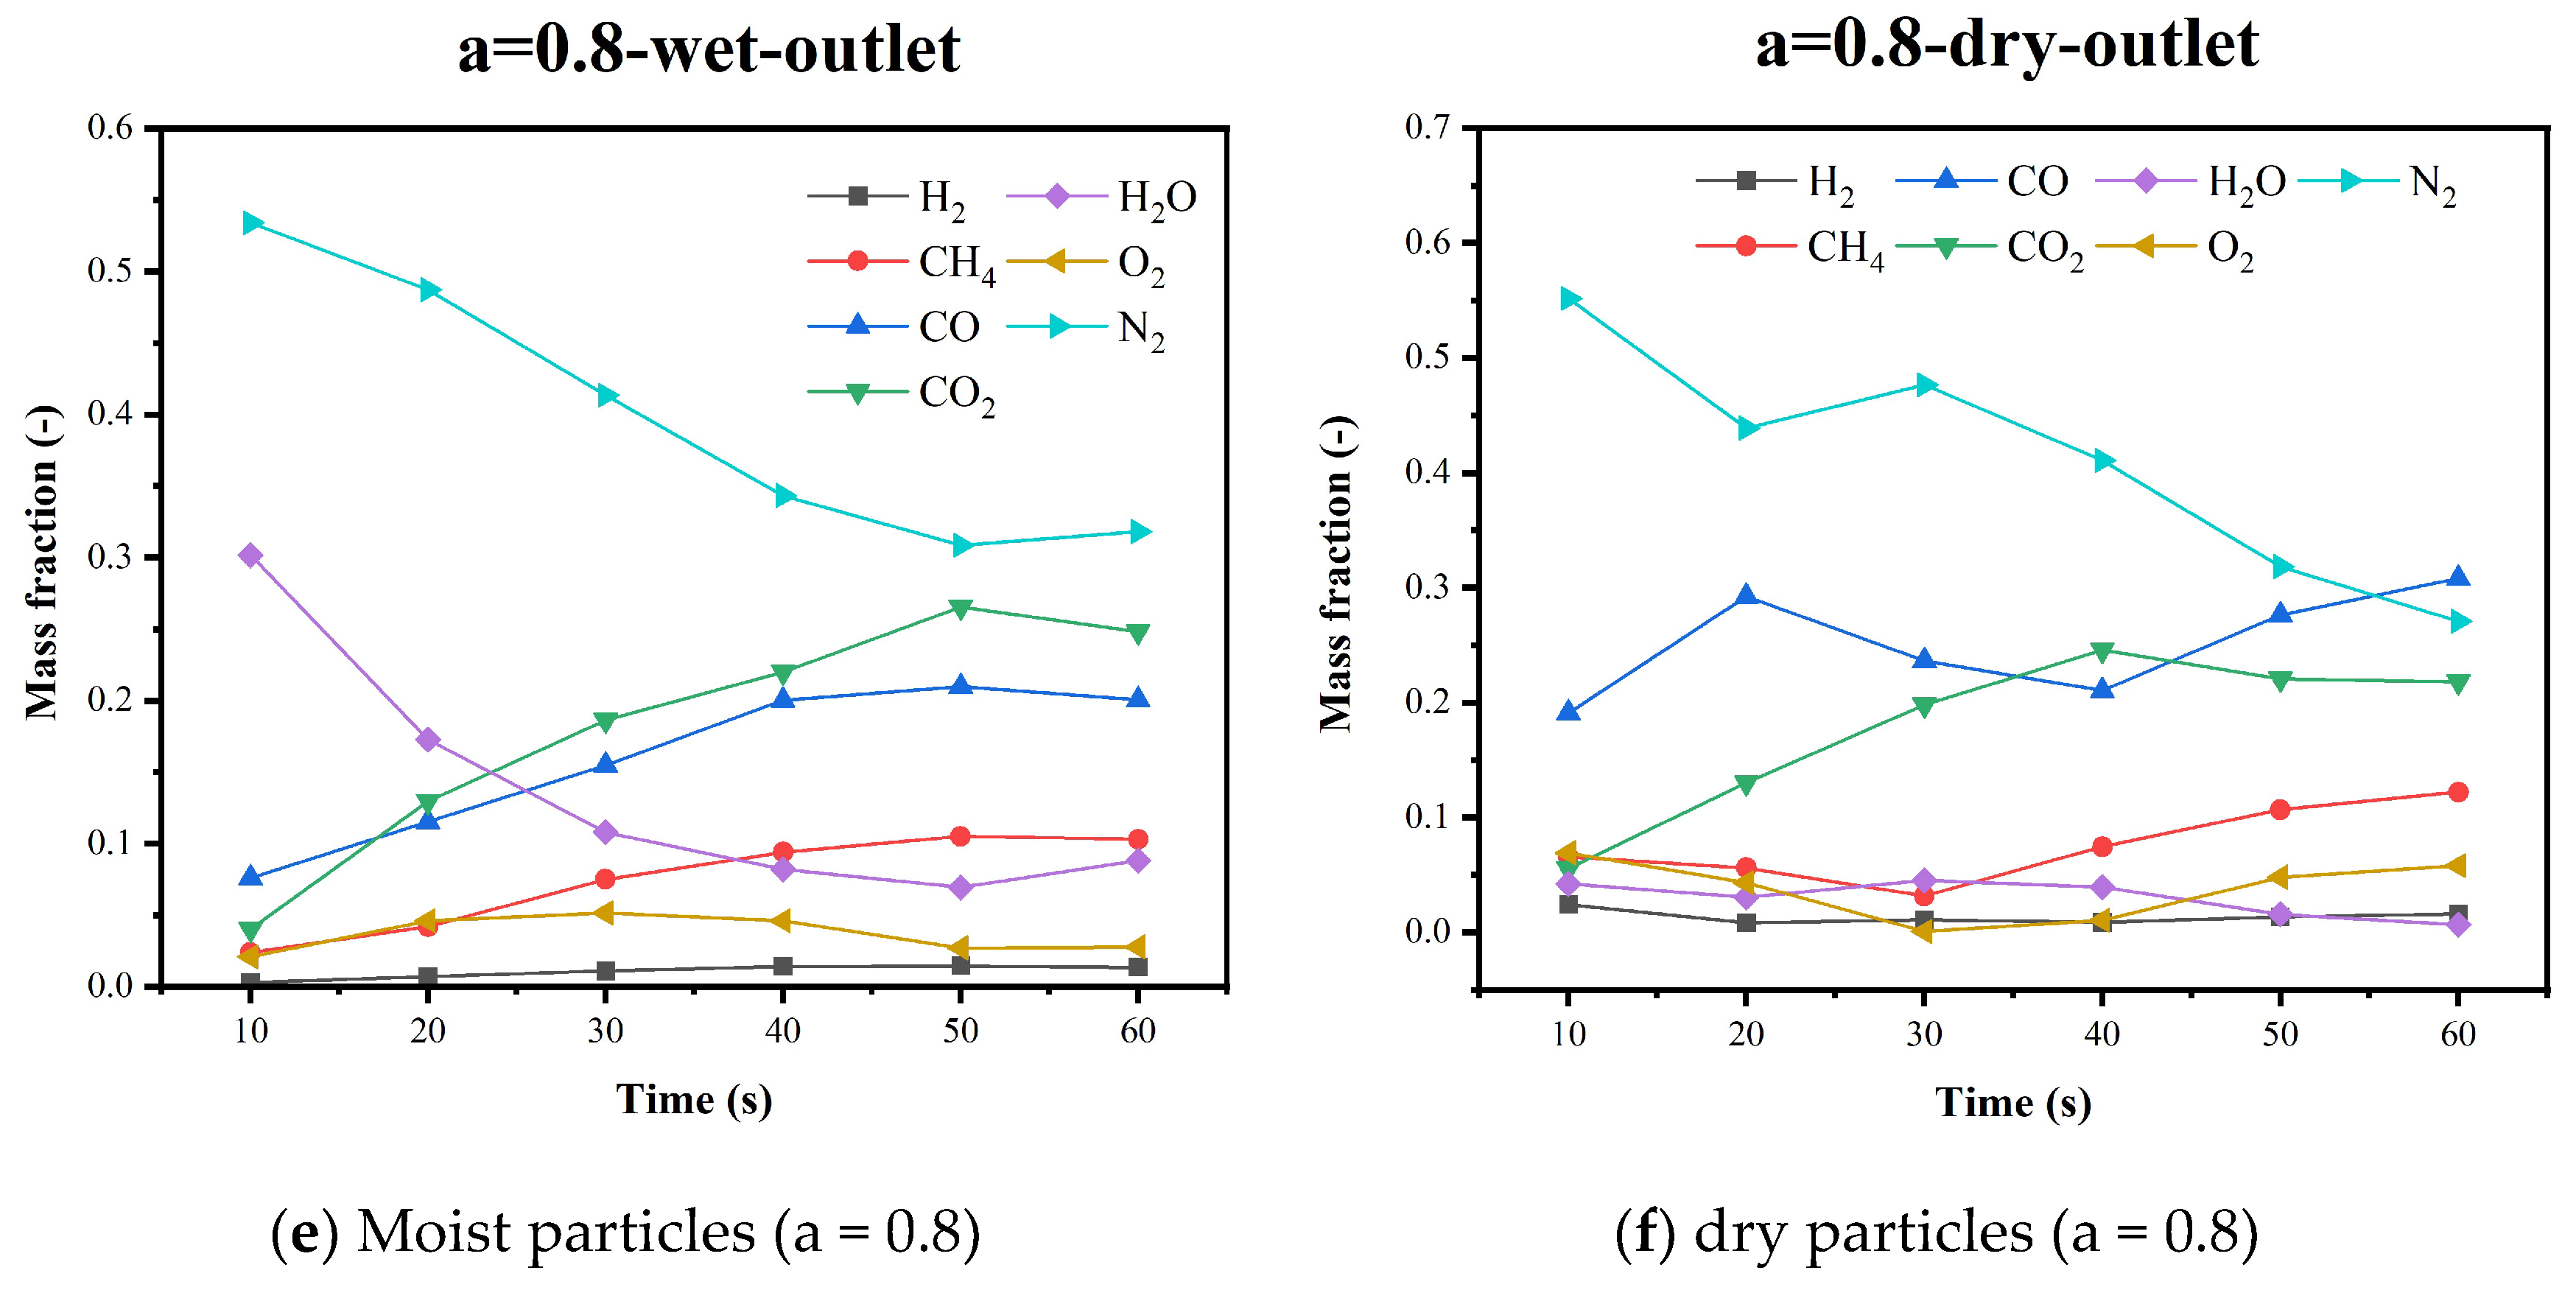
For the gasification of moist solid waste particles (Figure 19a,c,e), the CO mass fraction rose rapidly in the bottom region (from 0 to 20–35%) owing to the pyrolysis and reduction reaction of C(s) with CO2. The H2O mass fraction increased rapidly (from 0 to about 10%) above a height of 0.4 m owing to water evaporation. There was little change in the species above the middle of the furnace, with only a small decrease in CO mass fraction (about 5–10%) and a small increase in CO2 mass fraction (about 5–10%), indicating that CO continues to react with O2 and H2O to produce CO2. At the end of the gasification process, there was some O2 left, indicating that the gas–solid multiphase flow was not coupled perfectly with the chemical reaction, and O2 was not completely consumed (about 5% remaining) in the oxidation zone.
For the gasification process of dry solid waste particles (Figure 20b,d,f), because there is no influence of water evaporation, the distribution of gas species was in a stable state after the pyrolysis and gasification processes at the bottom of the furnace; the change in gas species was not significant. In a comparison with the moist particles, it was found that the water content greatly affected the overall reaction; H2O inhibited the generation of CO, and this result was also found in [36].
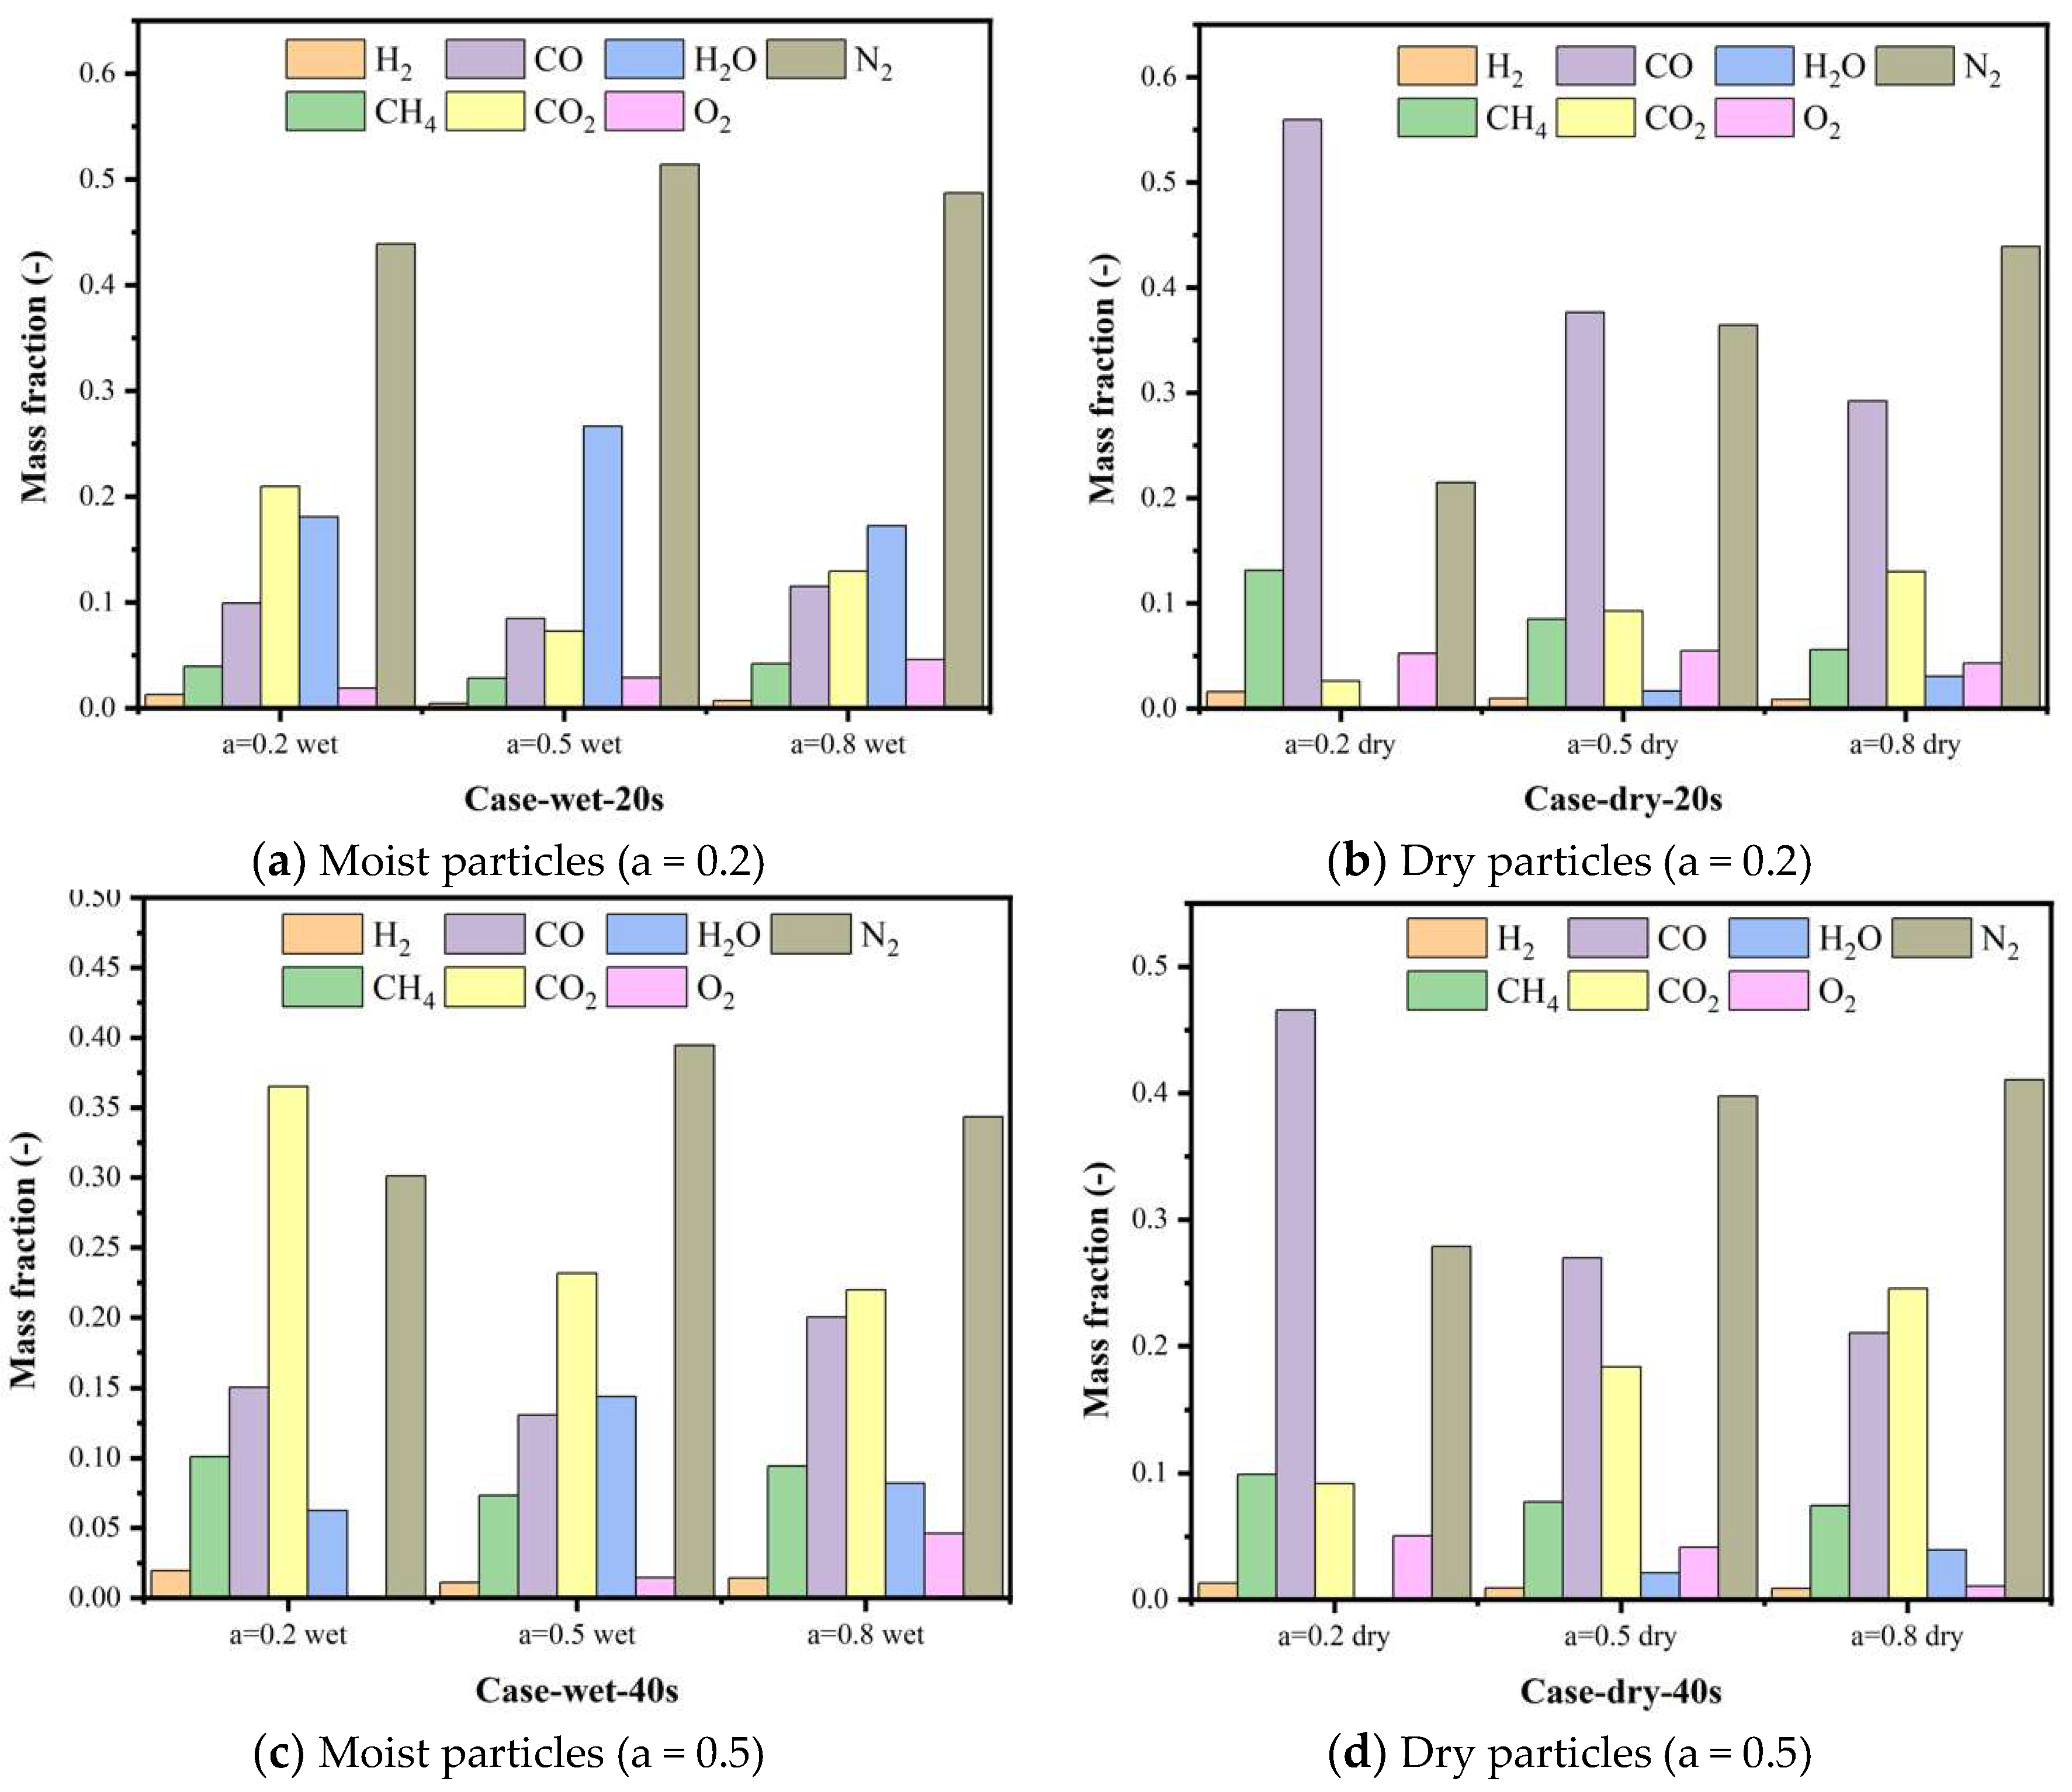
As shown in Figure 21 and Figure 22, the N2 mass fraction decreased rapidly (from about 50% to about 30%) as the reaction proceeded. For the gasification of moist solid waste particles, the H2O mass fraction was large (about 10–30%), and the mass fraction of CO was smaller than that of CO2. In addition, for the gasification of dry solid waste particles, the mass fraction of CO was larger, and the amount of N2 decreased as the simulation progressed, confirming that the rate of particle pyrolysis was increasing gradually. Under each working condition, a small amount of O2 overflowed from the outlet, which was unfavorable for gasification.
For the gasification of moist solid waste particles, the N2 mass fraction decreased gradually with time, reaching < 30%. For different excess air coefficients, the N2 mass fraction did not differ considerably and only increased slightly at high gasification agent flow rates, confirming that a higher gasification agent flow rate promotes pyrolysis and increases the total gas mass in the furnace. With an increase in the gasification flow rate, the exit O2 mass fraction at the outlet increased gradually (from 2% to 5%), reflecting the unfavorable aspect of the high gasification agent flow rate. The final H2O mass fraction at the outlet was below 10%, and the main gas products after stabilization were dominated by CO2 and CO, with CO2 having a greater mass fraction (about 5–15%). CO2 decreased with the increase in the excess air coefficient, while the changes in other species were relatively small.
For the gasification process of dry solid waste particles, the CO mass fraction was higher than that of moist particles (>30%). This indicates that in the gasification process of moist particles, the reaction rates of CO with H2O were high, whereas in that of dry particles, because there is no water evaporation, there is insufficient H2O (<5%) for the above reaction. The N2 mass fraction increased slowly, and the heterogeneous reaction of dry particles was more stable than that of moist particles. With the increase in the excess air coefficient, the contents of the target combustible species, such as CO, H2, and CH4, decreased gradually, reflecting the unfavorable effect of increasing the flow rate of the gasification agent. Although the gas yield is increased, the calorific value of the gas is reduced. The H2O mass fraction was very low, implying that H2 is rarely involved in the reaction. The mass fractions of H2 and CH4 were relatively stable in all calculations (around 2% and 13%, respectively).
Overall, the combustible species mass fraction of the output gas was higher when the particles were dry, and the velocity, temperature, and species fields in the device fluctuated less, making it easier for the gasification process to reach a relatively stable state. Therefore, reducing the moisture content of the solid waste feedstock enhances the operational stability of the gasifier and the gasification reaction efficiency.
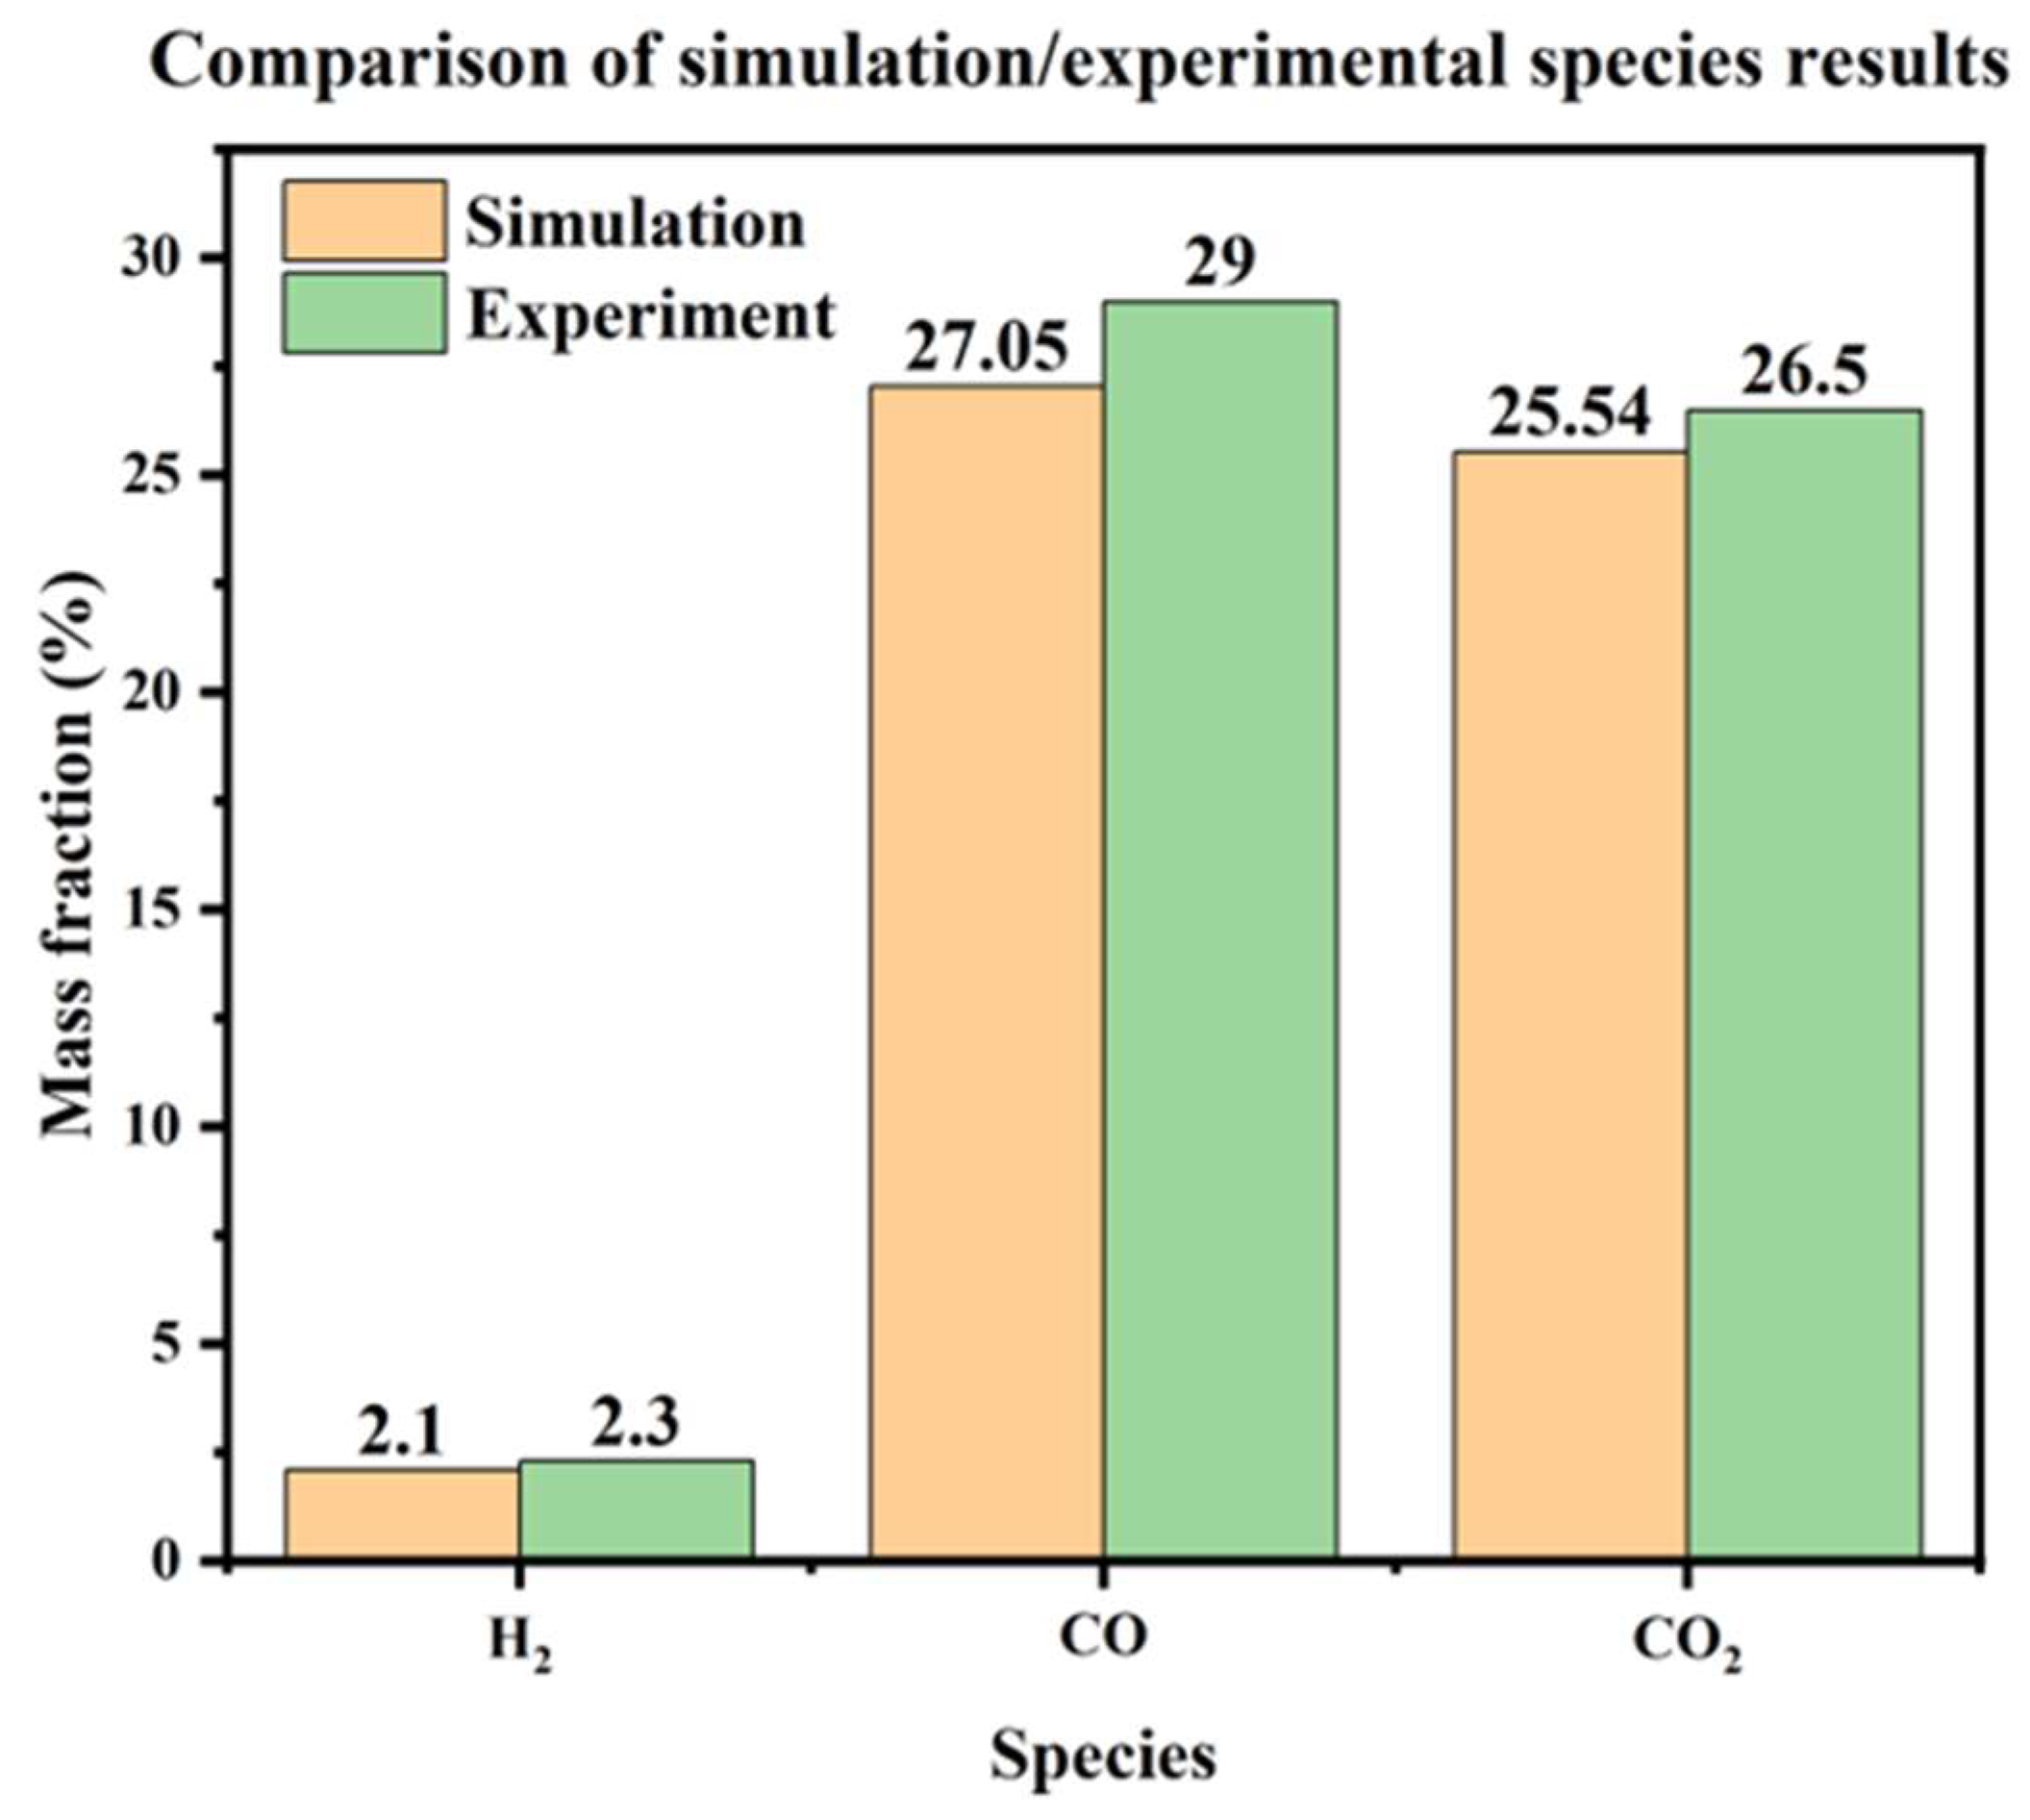
Taking the average of the simulation results of H2, CO, and CO2 in the gas species at the outlet under different excess air coefficients at 60 s, and considering the influence of particle moisture content, the results obtained are as follows: 2.1%, 27.05%, and 25.54%. Comparing this result with the experimental results shown in the following Figure 23, it can be seen that the simulation is in good agreement with the experimental results, and the resulting errors are all less than 10%, proving the credibility of the simulation results.
In the gasification process, the production of H2 and the ratio of CO/CO2 are important; they determine the calorific value of the gaseous product. The higher the mass fraction of H2 and the larger the CO/CO2 ratio, the higher the calorific value of the gaseous product, which is beneficial for the gasification results. In particular, the mass fraction of clean energy H2 has a high calorific value per unit mass, and the oxidation reaction product is H2O, making it a superior-performance combustible gas. A large number of research results on updraft fixed bed gasification were compared, as shown in Table 9. The mass fractions of H2, CO, and CO2 generated by gasification in each study were averaged to obtain the average mass fractions. Then, the sum of the mass fractions of the three gases was taken as the benchmark to calculate the relative mass fractions of H2, CO, and CO2.
By comparing the results of these studies, it can be seen that the H2 mass fraction of the gas produced by our device has a significant advantage when the particles are biomass and the gasification agent is air [10,35,56]; it is 2–3 times higher than that in other studies and can reach a maximum of about 2.9 times. This indicates that the new design of the device is beneficial for improving the gas species to increase H2 production. This may be due to the stable temperature control. The design of the thermal energy storage device can ensure a balanced temperature distribution in the furnace, fully develop the whole gasification process, and promote the reforming of H2O. In the last two studies [9,57], the H2 mass fraction was high; in particular, the last study exceeded our work, and this was due to the presence of steam in the gasification agent, which increased the H2 ratio. Our device achieved a high H2 yield without using steam as the gasification agent, demonstrating the superiority of the device design.
The CO/CO2 of the gas in this device has slightly decreased, but the amplitude is not significant. Combined with the increase in the H2 mass fraction mentioned, it can be considered that CO reacts with H2O to generate H2 and CO2, which is a very important chemical reaction in the gasification process.
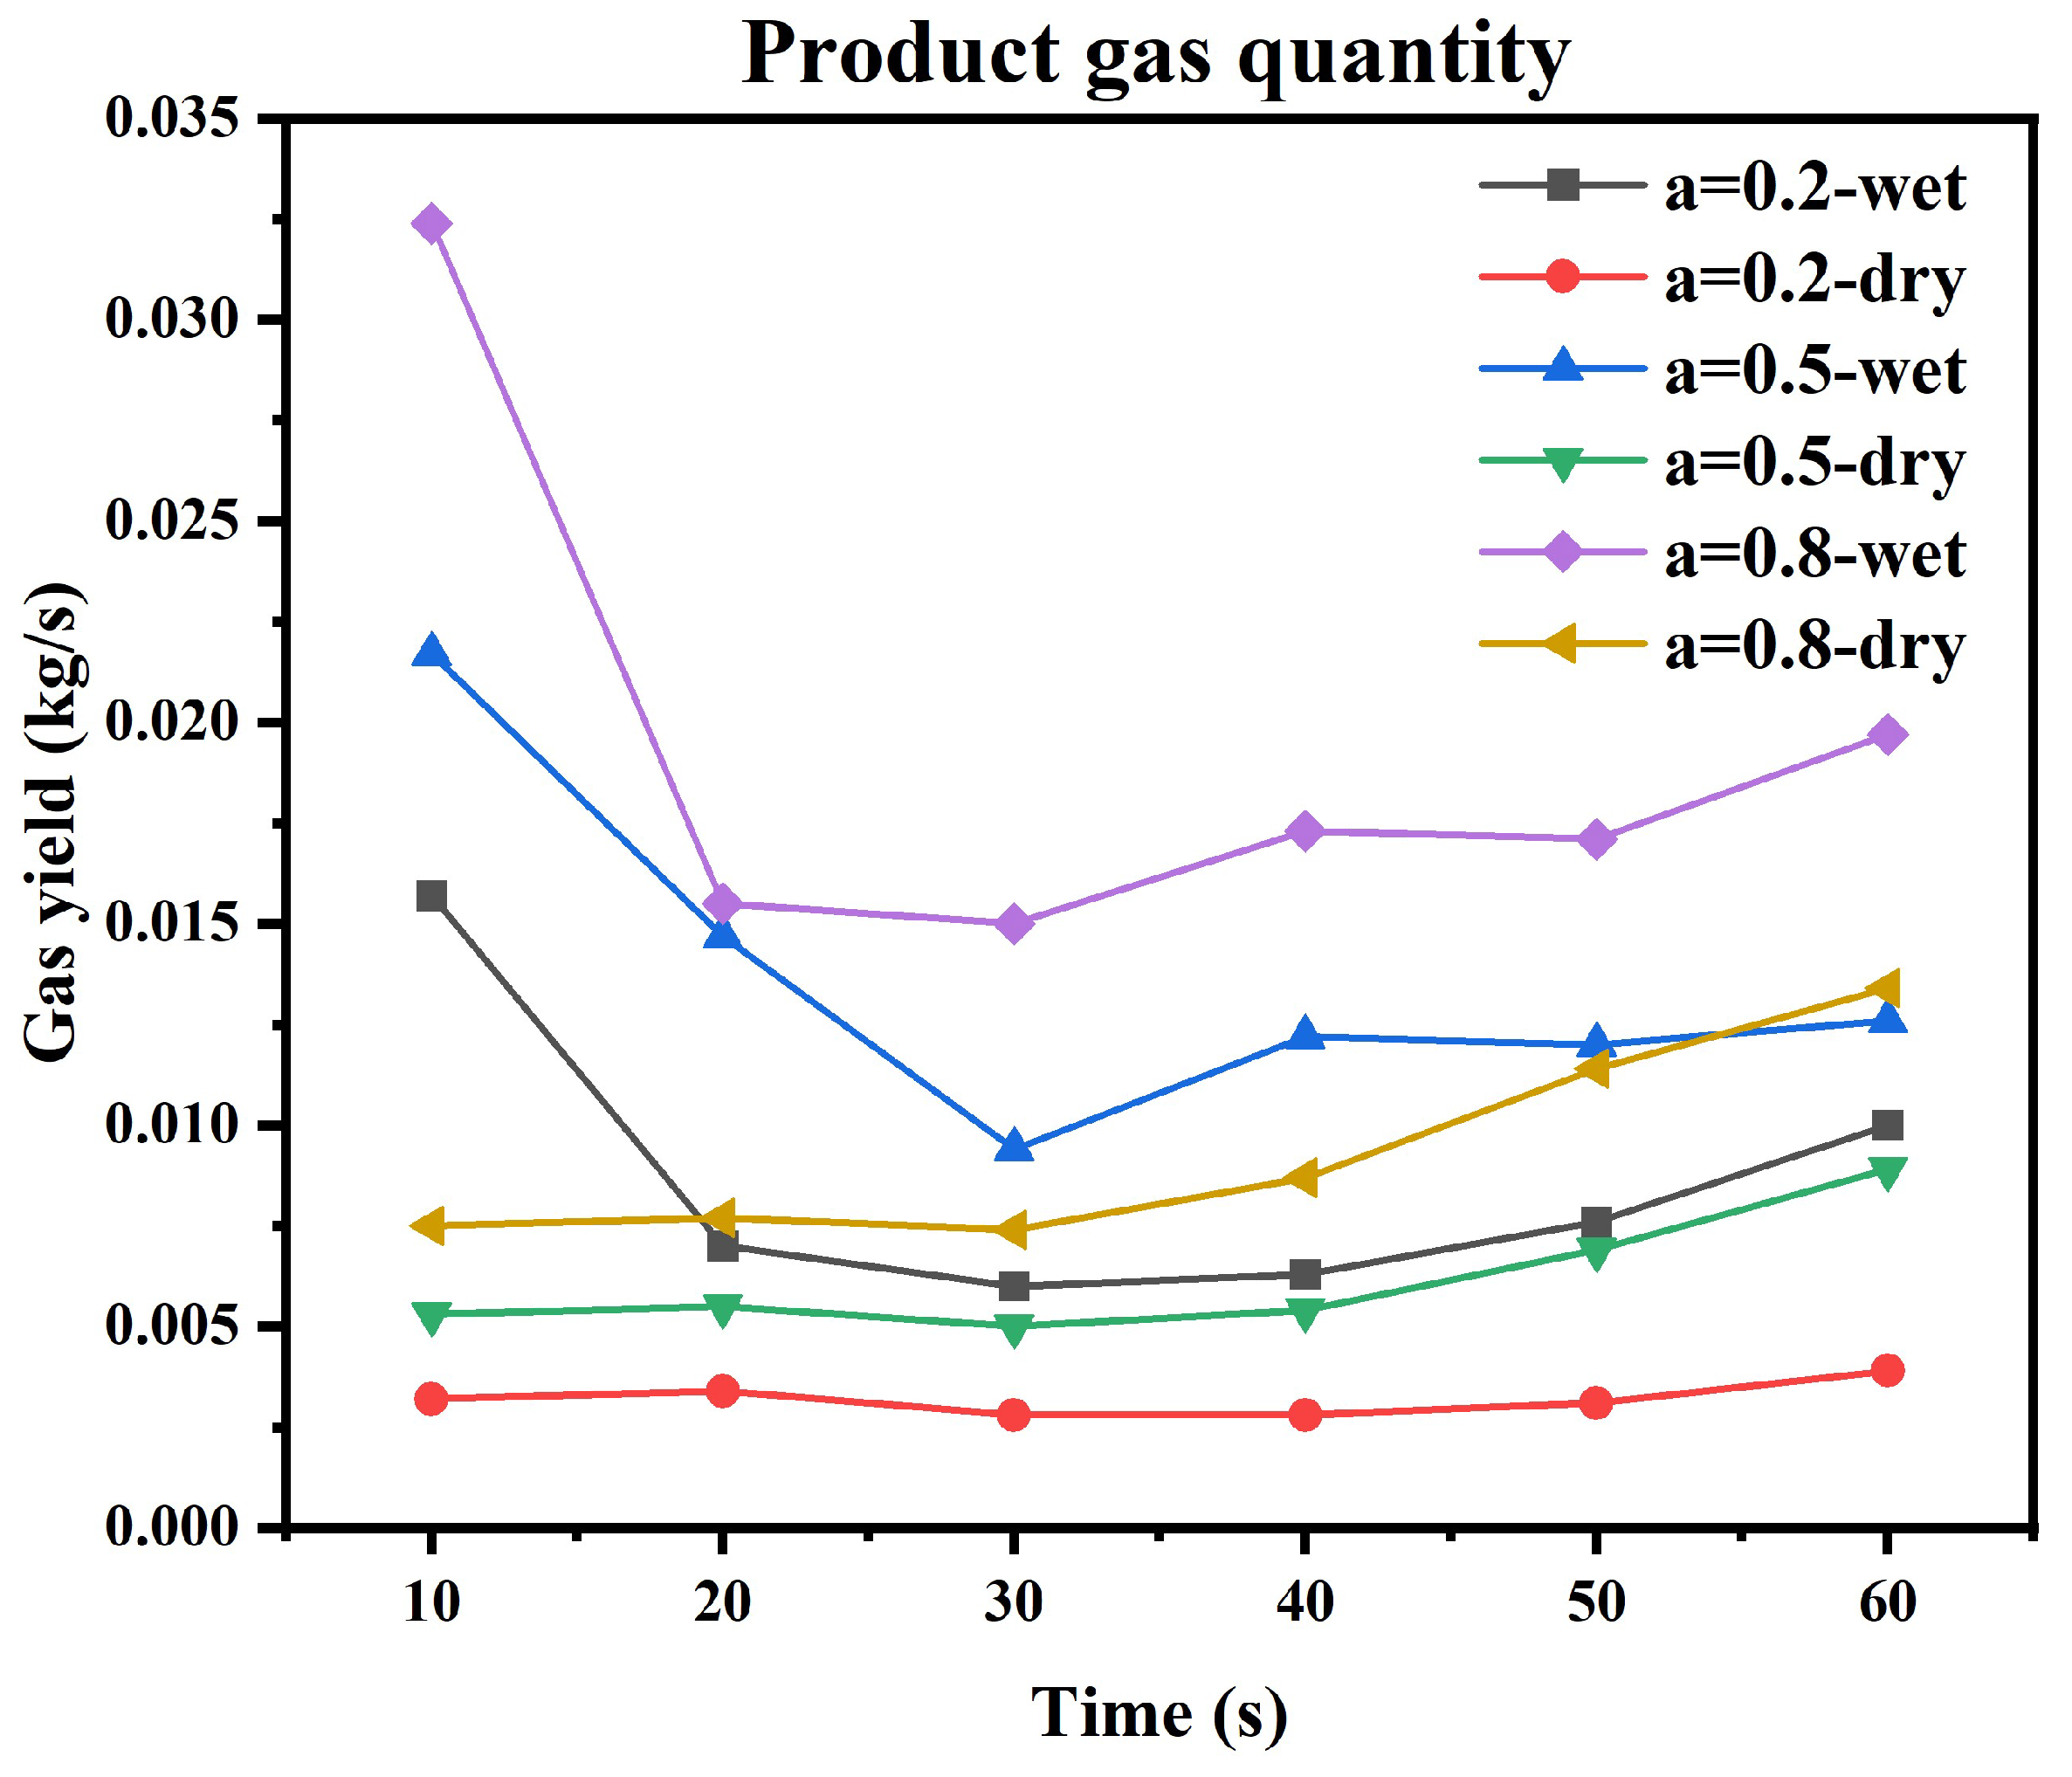
The variation in gas yield over time is shown in Figure 24, which shows that the gas yield is greater than the gasifying agent flow rate (for dry particles: a = 0.2, 0.0027 kg/s > 0.001268 kg/s; a = 0.5, 0.006 kg/s > 0.00317 kg/s; a = 0.8, 0.009 kg/s > 0.005072 kg/s), proving that particles have a good mass transfer effect on the fluid.

6. Conclusions

In this study, a numerical simulation model of solid waste gasification in a thermal energy storage device was established; this model is based on the rarely used CFD-DDPM method and has achieved good results. According to the operating characteristics of the updraft fixed bed, an innovative method of particle piling for fixed bed gasification simulation was adopted, simultaneously using various submodels that were not commonly used in previous work, such as the EMMS drag model and the DEM method. After adopting the above innovations, we successfully established the numerical calculation model on a three-dimensional scale and overcame the shortcomings of oversimplification in previous studies; the established model can fully describe the internal gasification process and physical field distribution (velocity, pressure, temperature, and species) of the device.
This work mainly focused on the influence of the moisture content and excess air coefficient on the gasification process. During the gasification, the velocity gradient in the particle bed area is larger than that outside the particle bed area. Furthermore, the particle bed area is the main pressure drop area of the fluid. The fluid pressure drops under different moisture contents and excess air coefficients are all around 25 Pa–75 Pa, and the pressure inside the device is lower than 500 Pa. The temperature near the bottom of the furnace and thermal energy storage wall surface was higher than that of other areas, and a high-temperature area was formed at the top of the furnace. A comparison of the gasification results of moisture-containing particles with dry particles shows that the higher the particle moisture content, the higher the velocity (for the same place and excess air coefficient, the values were larger (about 0.3 m/s–0.6 m/s)) and pressure values of the internal flow field in the device. With the excess air coefficient increased, the values of velocity and pressure increased significantly while the temperature did not vary much.
The mass fraction of pyrolysis species was higher near the wall of the furnace chamber than at the center. A comparison between the gasification results of moist and dry solid waste particles showed that H2O inhibited CO production. The mass fraction of CO was larger for the gasification of dry particles (>30%) than for moist particles (about 20%). Overall, the dry solid waste particle output gas had a higher mass fraction of combustible species and lower fluctuation of species in the furnace. For different excess air coefficients, the combustible species of the gas during the gasification process of moist particles increased slightly with the increase in gasifier flow rate, while the dry particles had the opposite effect. In a comparison with other studies, it was found that this device can improve the H2 production rate in the gasification process; the relative production of H2 can be raised 2–3 times.
According to the present research, the device is sensitive to the moisture content of the raw materials. High moisture content leads to a decrease in the mass fraction ratio of CO/CO2 and a greater change in the internal physical field of the device. Therefore, it is necessary to try to reduce the moisture content of the raw materials in the furnace and dry them. At the same time, the development of velocity and pressure fields is closely related to the particle bed, and the reasonable selection of bed height is also crucial. For the optimization of the device, the distribution and development of particle reduction and pyrolysis areas largely depend on the high-temperature conditions provided by the thermal energy storage wall. Therefore, the height of the thermal energy storage chamber should be appropriately increased to better maintain gasification development. In order to accelerate the heat transfer rate between the raw materials and thermal energy storage materials, the reactor diameter should be appropriately reduced.
Although the simulation achieved good results, some factors that affect the gasification process have not been considered, such as particle size, gasification temperature differences, and particle bed height. These factors need to be examined in subsequent work to improve the application of this numerical simulation method in calculating gasification and provide a basis and guidance for device optimization.
This study combines the DDPM method with the particle packing method for the first time and applies it to the numerical simulation of solid waste fixed bed gasification, providing new ideas for this research direction and demonstrating the feasibility of the method.

Author Contributions

Methodology, Z.S.; simulations, Z.S.; experiments, Z.S.; wrote the paper, Z.S.; revised the paper, Z.L., L.C. and X.L. (Xiang Li); project administration, Y.W., J.G. and H.Y.; Funding acquisition: X.L. (Xian Li). All authors have read and agreed to the published version of the manuscript.

Funding

This research was funded by (1) Key-Area Research and Development Program of GuangDong Province (2020B1111380001), (2) National Natural Science Foundation of China (51976223), and (3) Guangdong Basic and Applied Basic Research Foundation (2021B1515020068).

Acknowledgments

The authors acknowledge the technical support of the Guangzhou Institute of Energy Conversion, Chinese Academy of Sciences, and the help of the members of the Laboratory of Integrated Technology for “Urban and Rural Mines” Exploitation.

Conflicts of Interest

The authors declare no conflict of interest.

References

  1. Antimiani, A.; Costantini, V.; Paglialunga, E. Fossil fuels subsidy removal and the EU carbon neutrality policy. Energy Econ. 2023, 119, 6524. [Google Scholar] [CrossRef]
  2. Pao, H.-T.; Chen, H.; Li, Y.-Y. Competitive dynamics of energy, environment, and economy in the U.S. Energy 2015, 89, 449–460. [Google Scholar] [CrossRef]
  3. Lu, J.S.; Chang, Y.; Poon, C.S.; Lee, D.J. Slow pyrolysis of municipal solid waste (MSW): A review. Bioresour Technol. 2020, 312, 123615. [Google Scholar] [CrossRef]
  4. Galán-Martín, Á.; Contreras, M.d.M.; Romero, I.; Ruiz, E.; Bueno-Rodríguez, S.; Eliche-Quesada, D.; Castro-Galiano, E. The potential role of olive groves to deliver carbon dioxide removal in a carbon-neutral Europe: Opportunities and challenges. Renew. Sustain. Energy Rev. 2022, 165, 112609. [Google Scholar] [CrossRef]
  5. Ma, Y.; Li, Y.P.; Huang, G.H. Planning China’s non-deterministic energy system (2021–2060) to achieve carbon neutrality. Appl. Energy 2023, 334, 120673. [Google Scholar] [CrossRef]
  6. Dogu, O.; Pelucchi, M.; Van de Vijver, R.; Van Steenberge, P.H.M.; D’Hooge, D.R.; Cuoci, A.; Mehl, M.; Frassoldati, A.; Faravelli, T.; Van Geem, K.M. The chemistry of chemical recycling of solid plastic waste via pyrolysis and gasification: State-of-the-art, challenges, and future directions. Prog. Energy Combust. Sci. 2021, 84, 100901. [Google Scholar] [CrossRef]
  7. Heidenreich, S.; Foscolo, P.U. New concepts in biomass gasification. Prog. Energy Combust. Sci. 2015, 46, 72–95. [Google Scholar] [CrossRef]
  8. Mazaheri, N.; Akbarzadeh, A.H.; Madadian, E.; Lefsrud, M. Systematic review of research guidelines for numerical simulation of biomass gasification for bioenergy production. Energy Convers. Manag. 2019, 183, 671–688. [Google Scholar] [CrossRef]
  9. Cerone, N.; Zimbardi, F.; Contuzzi, L.; Baleta, J.; Cerinski, D.; Skvorčinskienė, R. Experimental investigation of syngas composition variation along updraft fixed bed gasifier. Energy Convers. Manag. 2020, 221, 113116. [Google Scholar] [CrossRef]
  10. Anca-Couce, A.; Archan, G.; Buchmayr, M.; Essl, M.; Hochenauer, C.; Scharler, R. Modelling fuel flexibility in fixed-bed biomass conversion with a low primary air ratio in an updraft configuration. Fuel 2021, 296, 120687. [Google Scholar] [CrossRef]
  11. Kurkela, E.; Kurkela, M.; Hiltunen, I. Pilot-scale development of pressurized fixed-bed gasification for synthesis gas production from biomass residues. Biomass Convers. Biorefinery 2021. [Google Scholar] [CrossRef]
  12. Ali, M.; Alkaabi, A.K.; Alameri, S.A.; Addad, Y. Overall efficiency analysis of an innovative load-following nuclear power plant-thermal energy storage coupled cycle. Int. J. Exergy 2021, 36, 98–122. [Google Scholar] [CrossRef]
  13. Alameri, S.A.; King, J.C.; Alkaabi, A.K.; Addad, Y. Prismatic-core advanced high temperature reactor and thermal energy storage coupled system–A preliminary design. Nucl. Eng. Technol. 2020, 52, 248–257. [Google Scholar] [CrossRef]
  14. Ali, M.; Alkaabi, A.K.; Lee, J.I. CFD simulation of an integrated PCM-based thermal energy storage within a nuclear power plant connected to a grid with constant or variable power demand. Nucl. Eng. Des. 2022, 394. [Google Scholar] [CrossRef]
  15. Ali, M.; Alkaabi, A.K.; Addad, Y. Numerical investigation of a vertical triplex-tube latent heat storage/exchanger to achieve flexible operation of nuclear power plants. Int. J. Energy Res. 2021, 46, 2970–2987. [Google Scholar] [CrossRef]
  16. Deepak Selvakumar, R.; Wu, J.; Ding, Y.; Alkaabi, A.K. Melting behavior of an organic phase change material in a square thermal energy storage capsule with an array of wire electrodes. Appl. Therm. Eng. 2023, 228. [Google Scholar] [CrossRef]
  17. Alobaid, F.; Almohammed, N.; Massoudi Farid, M.; May, J.; Rößger, P.; Richter, A.; Epple, B. Progress in CFD Simulations of Fluidized Beds for Chemical and Energy Process Engineering. Prog. Energy Combust. Sci. 2022, 91, 100930. [Google Scholar]
  18. Adnan, M.; Sun, J.; Ahmad, N.; Wei, J.J. Multiscale modeling of bubbling fluidized bed reactors using a hybrid Eulerian-Lagrangian dense discrete phase approach. Powder Technol. 2020, 376, 296–319. [Google Scholar] [CrossRef]
  19. Adnan, M.; Sun, J.; Ahmad, N.; Wei, J.J. Verification and validation of the DDPM-EMMS model for numerical simulations of bubbling, turbulent and circulating fluidized beds. Powder Technol. 2021, 379, 69–88. [Google Scholar] [CrossRef]
  20. Adnan, M.; Sun, J.; Ahmad, N.; Wei, J.J. Comparative CFD modeling of a bubbling bed using a Eulerian–Eulerian two-fluid model (TFM) and a Eulerian-Lagrangian dense discrete phase model (DDPM). Powder Technol. 2021, 383, 418–442. [Google Scholar] [CrossRef]
  21. Hwang, I.S.; Jeong, H.J.; Hwang, J. Numerical simulation of a dense flow cyclone using the kinetic theory of granular flow in a dense discrete phase model. Powder Technol. 2019, 356, 129–138. [Google Scholar] [CrossRef]
  22. Kong, D.; Luo, K.; Wang, S.; Yu, J.; Fan, J. Particle behaviours of biomass gasification in a bubbling fluidized bed. Chem. Eng. J. 2022, 428, 131847. [Google Scholar] [CrossRef]
  23. Ostermeier, P.; Fischer, F.; Fendt, S.; DeYoung, S.; Spliethoff, H. Coarse-grained CFD-DEM simulation of biomass gasification in a fluidized bed reactor. Fuel 2019, 255, 115790. [Google Scholar] [CrossRef]
  24. Chen, T.; Li, T.; Sjöblom, J.; Ström, H. A reactor-scale CFD model of soot formation during high-temperature pyrolysis and gasification of biomass. Fuel 2021, 303, 121240. [Google Scholar] [CrossRef]
  25. Timsina, R.; Thapa, R.K.; Moldestad, B.M.E.; Eikeland, M.S. Computational particle fluid dynamics simulation of biomass gasification in an entrained flow gasifier. Chem. Eng. Sci. X 2021, 12, 100112. [Google Scholar] [CrossRef]
  26. Wu, H.; Yang, C.; Zhang, Z.; Zhang, Q. Simulation of Two-Phase Flow and Syngas Generation in Biomass Gasifier Based on Two-Fluid Model. Energies 2022, 15, 4800. [Google Scholar] [CrossRef]
  27. Assoumani, N.; Simo-Tagne, M.; Kifani-Sahban, F.; Tagne Tagne, A.; El Marouani, M.; Obounou Akong, M.B.; Rogaume, Y.; Girods, P.; Zoulalian, A. Numerical Study of Cylindrical Tropical Woods Pyrolysis Using Python Tool. Sustainability 2021, 13, 13892. [Google Scholar] [CrossRef]
  28. Horsfall, I.T.; Ndukwu, M.C.; Abam, F.; Simo-Tagne, M.; Nwachukwu, C.C. Parametric studies of heat and mass transfer process for two-stage biochar production from poultry litter pellet biomass. Biomass Convers. Biorefinery 2022, 1–13. [Google Scholar] [CrossRef]
  29. Ismail, T.M.; El-Salam, M.A. Numerical and experimental studies on updraft gasifier HTAG. Renew. Energy 2015, 78, 484–497. [Google Scholar] [CrossRef]
  30. Kumar, U.; Paul, M.C. CFD modelling of biomass gasification with a volatile break-up approach. Chem. Eng. Sci. 2019, 195, 413–422. [Google Scholar] [CrossRef] [Green Version]
  31. Ngamsidhiphongsa, N.; Ponpesh, P.; Shotipruk, A.; Arpornwichanop, A. Analysis of the Imbert downdraft gasifier using a species-transport CFD model including tar-cracking reactions. Energy Convers. Manag. 2020, 213, 112808. [Google Scholar] [CrossRef]
  32. Lu, D.; Yoshikawa, K.M.; Ismail, T.; El-Salam, M.A. Computational Fluid Dynamics Model on Updraft Gasifier Using Carbonized Woody Briquette as Fuel. Energy Procedia 2017, 142, 166–171. [Google Scholar] [CrossRef]
  33. Manek, B.; Javia, M.S.; Harichandan, A.; Ramani, H. A CFD based comprehensive study of coal-fired updraft gasifier in ceramic industry. Therm. Sci. Eng. Prog. 2019, 9, 11–20. [Google Scholar] [CrossRef]
  34. Janajreh, I.; Al Shrah, M. Numerical and experimental investigation of downdraft gasification of wood chips. Energy Convers. Manag. 2013, 65, 783–792. [Google Scholar] [CrossRef]
  35. Lu, D.; Yoshikawa, K.; Ismail, T.M.; Abd El-Salam, M. Assessment of the carbonized woody briquette gasification in an updraft fixed bed gasifier using the Euler-Euler model. Appl. Energy 2018, 220, 70–86. [Google Scholar] [CrossRef]
  36. Murgia, S.; Vascellari, M.; Cau, G. Comprehensive CFD model of an air-blown coal-fired updraft gasifier. Fuel 2012, 101, 129–138. [Google Scholar] [CrossRef]
  37. Zhang, H.; Baeyens, J.; Cáceres, G.; Degrève, J.; Lv, Y. Thermal energy storage: Recent developments and practical aspects. Prog. Energy Combust. Sci. 2016, 53, 1–40. [Google Scholar] [CrossRef]
  38. Ku, X.; Li, T.; Løvås, T. Eulerian–Lagrangian Simulation of Biomass Gasification Behavior in a High-Temperature Entrained-Flow Reactor. Energy Fuels 2014, 28, 5184–5196. [Google Scholar] [CrossRef] [Green Version]
  39. Zhong, W.; Yu, A.; Zhou, G.; Xie, J.; Zhang, H. CFD simulation of dense particulate reaction system: Approaches, recent advances and applications. Chem. Eng. Sci. 2016, 140, 16–43. [Google Scholar] [CrossRef]
  40. Klimanek, A.; Adamczyk, W.; Katelbach-Woźniak, A.; Węcel, G.; Szlęk, A. Towards a hybrid Eulerian–Lagrangian CFD modeling of coal gasification in a circulating fluidized bed reactor. Fuel 2015, 152, 131–137. [Google Scholar] [CrossRef]
  41. Subramaniam, S. Lagrangian–Eulerian methods for multiphase flows. Prog. Energy Combust. Sci. 2013, 39, 215–245. [Google Scholar] [CrossRef] [Green Version]
  42. Wang, S.; Shen, Y. CFD-DEM study of biomass gasification in a fluidized bed reactor: Effects of key operating parameters. Renew. Energy 2020, 159, 1146–1164. [Google Scholar] [CrossRef]
  43. Wan, Z.; Hu, J.; Qi, X. Numerical analysis of hydrodynamics and thermochemical property of biomass gasification in a pilot-scale circulating fluidized bed. Energy 2021, 225, 120254. [Google Scholar] [CrossRef]
  44. Yang, S.; Liu, X.; Wang, S.; Zhang, K.; Wang, H. Eulerian-Lagrangian simulation study of the gas-solid reacting flow in a bubbling fluidized coal gasifier. Chem. Eng. J. 2021, 426, 130825. [Google Scholar] [CrossRef]
  45. Muhammad, A.; Zhang, N.; Wang, W. CFD simulations of a full-loop CFB reactor using coarse-grained Eulerian–Lagrangian dense discrete phase model: Effects of modeling parameters. Powder Technol. 2019, 354, 615–629. [Google Scholar] [CrossRef]
  46. Wang, S.; Shen, Y. Coarse-grained CFD-DEM modelling of dense gas-solid reacting flow. Int. J. Heat Mass Transf. 2022, 184, 122302. [Google Scholar] [CrossRef]
  47. Stroh, A.; Alobaid, F.; von Bohnstein, M.; Ströhle, J.; Epple, B. Numerical CFD simulation of 1 MWth circulating fluidized bed using the coarse grain discrete element method with homogenous drag models and particle size distribution. Fuel Process. Technol. 2018, 169, 84–93. [Google Scholar] [CrossRef]
  48. Hong, K.; Shi, Z.; Ullah, A.; Wang, W. Extending the bubble-based EMMS model to CFB riser simulations. Powder Technol. 2014, 266, 424–432. [Google Scholar] [CrossRef]
  49. Qin, Z.; Zhou, Q.; Wang, J. An EMMS drag model for coarse grid simulation of polydisperse gas–solid flow in circulating fluidized bed risers. Chem. Eng. Sci. 2019, 207, 358–378. [Google Scholar] [CrossRef]
  50. Lu, L.; Xu, J.; Ge, W.; Yue, Y.; Liu, X.; Li, J. EMMS-based discrete particle method (EMMS–DPM) for simulation of gas–solid flows. Chem. Eng. Sci. 2014, 120, 67–87. [Google Scholar] [CrossRef]
  51. Tricomi, L.; Melchiori, T.; Chiaramonti, D.; Boulet, M.; Lavoie, J.M. Numerical investigation of a cold bubbling bed throughout a dense discrete phase model with KTGF collisional closure. Biofuels Eng. 2017, 2, 32–50. [Google Scholar] [CrossRef]
  52. Ku, X.; Li, T.; Løvås, T. CFD–DEM simulation of biomass gasification with steam in a fluidized bed reactor. Chem. Eng. Sci. 2015, 122, 270–283. [Google Scholar] [CrossRef] [Green Version]
  53. Wang, S.; Luo, K.; Fan, J. CFD-DEM coupled with thermochemical sub-models for biomass gasification: Validation and sensitivity analysis. Chem. Eng. Sci. 2020, 217, 115550. [Google Scholar] [CrossRef]
  54. Behrendt, M.O.S.G.F. Euler–Lagrange/DEM simulation of wood gasification in a bubbling fluidized bed reactor. Particuology 2009, 7, 307–316. [Google Scholar]
  55. Chen, L.; He, A.; Zhao, J.; Kang, Q.; Li, Z.-Y.; Carmeliet, J.; Shikazono, N.; Tao, W.-Q. Pore-scale modeling of complex transport phenomena in porous media. Prog. Energy Combust. Sci. 2022, 88, 100968. [Google Scholar] [CrossRef]
  56. Fernando, N.; Narayana, M. A comprehensive two dimensional Computational Fluid Dynamics model for an updraft biomass gasifier. Renew. Energy 2016, 99, 698–710. [Google Scholar] [CrossRef]
  57. Umeki, K.; Namioka, T.; Yoshikawa, K. Analysis of an updraft biomass gasifier with high temperature steam using a numerical model. Appl. Energy 2012, 90, 38–45. [Google Scholar] [CrossRef]
Figure 1. Gasification device workflow diagram.
Energies 16 04580 g001
Figure 2. (a) Flowmeter. (b) Small combustion chamber and air supply pipeline. (c) Gasifier.
Energies 16 04580 g002
Figure 3. (a) Feed hopper and feed screw. (b) Ash chamber and slag discharge device.
Energies 16 04580 g003
Figure 4. Schematic of the gasification device.
Energies 16 04580 g004
Figure 5. Exemplary image of biomass solid waste particles.
Energies 16 04580 g005
Figure 6. Record of temperature changes at different positions in the gasifier during gasification process (left) and photo of gas burning in the small combustion chamber (right).
Energies 16 04580 g006
Figure 7. Record of gas mass fractions at the gas outlet. ((a): Record time period 1, (b): Record time period 2).
Energies 16 04580 g007
Figure 8. The variation of fluid velocity with device height in meshes of different sizes.
Energies 16 04580 g008
Figure 9. Gasifier meshing ((a): global meshing, (b): local meshing).
Energies 16 04580 g009
Figure 10. Particles in the form of a fixed bed filling the furnace.
Energies 16 04580 g010
Figure 11. Schematics of selection of furnace plane.
Energies 16 04580 g011
Figure 12. Streamlines and velocity cloud diagrams ((a): moist particles, (b): dry particles).
Energies 16 04580 g012
Figure 13. Variations in velocity along the z-axis for each working condition at different moments.
Energies 16 04580 g013
Figure 14. Pressure distribution cloud diagrams ((a): moist particles, (b): dry particles).
Energies 16 04580 g014
Figure 15. Pressure distributions along the z-axis of each working condition at different moments.
Energies 16 04580 g015aEnergies 16 04580 g015b
Figure 16. Temperature distribution cloud diagrams at a = 0.5 ((a): moist particles, (b): dry particles).
Energies 16 04580 g016
Figure 17. Temperature distributions along the z-axis at different moments.
Energies 16 04580 g017aEnergies 16 04580 g017b
Figure 18. Cloud diagrams of species distribution (moist particles).
Energies 16 04580 g018
Figure 19. Cloud diagrams of species distribution (dry particles).
Energies 16 04580 g019aEnergies 16 04580 g019b
Figure 20. Species distributions along the z-axis of two types of solid waste particles under different excess air coefficients.
Energies 16 04580 g020
Figure 21. Mass fractions of species at the gas outlet at different times for each working condition.
Energies 16 04580 g021aEnergies 16 04580 g021b
Figure 22. Histograms of gas species mass fraction at the gas outlet at different moments with different air excess coefficients.
Energies 16 04580 g022aEnergies 16 04580 g022b
Figure 23. Comparison of simulation/experimental results of the mass fraction of H2, CO, and CO2.
Energies 16 04580 g023
Figure 24. Change in product gas production over time.
Energies 16 04580 g024
Table 1. Some numerical simulation work on fixed bed gasification.
ResearchDevice TypeRaw MaterialSimulation MethodSpatial Scale
[30]Downdraft fixed bedbiomassDPM2D
[29]Updraft fixed bedbiomassDEM2D
[10]Updraft fixed bedbiomass-1D
[34]Downdraft fixed bedbiomassDPM2D
[35]Updraft fixed bedbiomassTFM2D
[36]Updraft fixed bedcoalTFM2D
[31]Downdraft fixed bedbiomassDPM2D
Table 2. Results of industrial analysis and elemental analysis of biomass particles.
Industrial AnalysisElemental Analysis
Volatile (%)Fixed Carbon (%)Ash (%)C (%)H (%)N (%)
82.951 ± 0.53116.677 ± 0.1240.372 ± 0.00248 ± 0.6816.35 ± 0.0370.02 ± 0.0001
Table 3. Data recording of several sets of gas mass fractions.
Data Record PointH2 (%)CH4 (%)CO (%)CO2 (%)O2 (%)Calorific Value (MJ/m3)
12.516.66235.49633.090.037.1
22.196.43233.19832.082.426.7
32.526.70135.67633.280.007.2
42.416.42434.26731.740.486.9
Table 4. Mass fraction of each volatile species (%).
H2CH4COCO2
2.22518.8537.6541.275
Table 5. Heterogeneous phase reaction parameters [53].
ReactionsPre-Exponential Factor
Ahete (s·m−1·K−1)
Activation Energy
Ehete (J·kmol−1)
C(s) + H2O → H2 + CO45.64.37 × 107
C(s) + CO2→2CO8.34.37 × 107
Table 6. Homogeneous phase reaction parameters.
ReactionsPre-Exponential Factor
Ahete (kmol/m3)
Activation Energy
Ehete (J·kmol−1)
CO + H2O → CO2 + H22.78 × 1031.26 × 107
CO2 + H2 → CO + H2O9.59 × 1044.66 × 107
CH4 + H2O → 3H2 + CO3 × 1081.26 × 108
CO + 0.5O2 → CO2 3.987 × 10141.6738 × 108
CH4 + 2O2 → CO2 + 2H2O1.585 × 10132.025 × 108
H2 + 0.5O2 → H2O1.9953 × 10121.092 × 108
Table 7. Gasification working conditions.
Work ConditionsWater Content (%)Excess Air Coefficient (−)Mass Flow Rate (kg/s)
1100.20.001268
2100.50.00317
3100.80.005072
400.20.001268
500.50.00317
600.80.005072
Table 8. Other simulation parameter settings.
Turbulence ModelRealizable k-ε
Wall functionScalable wall functions
Radiation modelDiscrete ordinates (DOs)
Gasification agent temperature1100 K
Thermal energy storage wall temperature1000 K
Fluid time step2 × 10−4 s
Discrete phase time step2 × 10−5 s
Table 9. Comparison of gas species mass fractions between current work and previous studies.
StudyParticle TypeGasification Agent TypeH2 (%)CO (%)CO2 (%)
This studybiomassair3.8449.4646.7
[36]coalair–steam2.2768.629.13
[56]biomassair1.4651.6446.9
[35]biomassair1.3168.829.89
[10]biomassair1.365147.64
[9]biomassair; air–steam363.4733.53
[57]biomasssteam5.911.382.8
Disclaimer/Publisher’s Note: The statements, opinions and data contained in all publications are solely those of the individual author(s) and contributor(s) and not of MDPI and/or the editor(s). MDPI and/or the editor(s) disclaim responsibility for any injury to people or property resulting from any ideas, methods, instructions or products referred to in the content.