
The Effect of Agricultural Biogas Plants on the Quality of Farm Energy Supply


Abstract
:1. Introduction
2. Materials and Methods
3. Results and Discussion
4. Conclusions
Author Contributions
Funding
Data Availability Statement
Conflicts of Interest
References
- Maczyszyn, B. Turnkey agricultural biogas plants. In Small Agricultural Biogas Plants—Mini Handbook; AF Projects Sp. z o. o.: Warsaw, Poland, 2010. [Google Scholar]
- Lehtomäki, A. Biogas Production from Energy Crops and Crop Residues; Jyväskylä University Printing House: Jyväskylä, Finland, 2006. [Google Scholar]
- Angelidaki, I.; Treu, L.; Tsapekos, P.; Luo, G.; Campanaro, S.; Wenzel, H.; Kougias, P.G. Biogas upgrading and utilization: Current status and perspectives. Biotechnol. Adv. 2018, 36, 452–466. [Google Scholar] [CrossRef] [Green Version]
- Meneses-Quelal, O.; Velázquez-Martí, B. Pretreatment of animal manure biomass to improve biogas production: A review. Energies 2020, 13, 3573. [Google Scholar]
- Kaltschmitt, M.; Scholwin, F.; Gattermann, H.; Schattauer, A.; Weiland, P. Biogas—Production Utilisation; Institut für Energetik und Umwelt Gmbh, Leipzig: Leipzig, Germany, 2005. [Google Scholar]
- Mata-Alvarez, J.; Macé, S.; Llabrés, P. Anaerobic digestion of organic solid wastes. An overview of research achievements and perspectives. Bioresour. Technol. 2000, 74, 3–16. [Google Scholar] [CrossRef]
- Skibko, Z.; Romaniuk, W.; Borusiewicz, A.; Porwisiak, H. Use of pellets from agricultural biogas plants in fertilization of oxytrees in Podlasie, Poland. J. Water Land Dev. 2021, 51, 124–128. [Google Scholar] [CrossRef]
- Myers, G.M.; Andersen, D.S.; Martens, B.J.; Raman, D.R. Cost Assessment of Centralizing Swine Manure and Corn Stover Co-Digestion Systems. Energies 2023, 16, 4315. [Google Scholar] [CrossRef]
- Akyürek, Z. Potential of biogas energy from animal waste in the Mediterranean region of Turkey. J. Energy Syst. 2018, 2, 160–167. [Google Scholar] [CrossRef] [Green Version]
- Tyagi, V.K.; Fdez-Güelfo, L.A.; Zhou, Y.; Álvarez-Gallego, C.J.; Garcia, L.I.R.; Ng, W.J. Anaerobic co-digestion of organic fraction of municipal solid waste (OFMSW): Progress and challenges. Renew. Sustain. Energy Rev. 2018, 93, 380–399. [Google Scholar] [CrossRef]
- Frigon, J.-C.; Mehta, P.; Guiot, S.R. Impact of mechanical, chemical and enzymatic pre-treatments on the methane yield from the anaerobic digestion of switchgrass. Biomass Bioenergy 2012, 36, 1–11. [Google Scholar] [CrossRef] [Green Version]
- Baldwin, S.; Anthony, L.; Wang, M. Development of a Calculator for the Techno-Economic Assessment of Anaerobic Digestion Systems; Final report submitted to BC Ministry of Agriculture and Land and BC Life Sciences; Chemical and Biological Engineering, University of British Columbia: Vancouver, BC, Canada, 2009. [Google Scholar]
- Campuzano, R.; González-Martínez, S. Characteristics of the organic fraction of municipal solid waste and methane production: A review. Waste Manag. 2016, 54, 3–12. [Google Scholar] [CrossRef]
- FAO. World Livestock: Transforming the Livestock Sector through the Sustainable Development Goals; Food and Agriculture Organization of the United Nations: Rome, Italy, 2018. [Google Scholar]
- Iglesias, R.; Muñoz, R.; Polanco, M.; Diaz, I.; Susmozas, A.; Moreno, A.D.; Guirado, M.; Carreras, N.; Ballesteros, M. Biogas from Anaerobic Digestion as an Energy Vector: Current Upgrading Development. Energies 2021, 14, 2742. [Google Scholar] [CrossRef]
- Ogbuewu, I.P.; Odoemenam, V.U.; Obikaonu, H.O.; Opara, M.N.; Emenalom, O.O.; Uchegbu, M.C.; Okoli, I.C.; Esonu, B.O.; Iloeje, M.U. The growing importance of neem (Azadirachta indica A. Juss) in agriculture, industry, medicine and environment: A review. Res. J. Med. Plant 2011, 5, 230–245. [Google Scholar] [CrossRef] [Green Version]
- Velthof, G.L.; Lesschen, J.P.; Webb, J.; Pietrzak, S.; Miatkowski, Z.; Pinto, M.; Kros, J.; Oenema, O. The impact of the Nitrates Directive on nitrogen emissions from agriculture in the EU-27 during 2000–2008. Sci. Total Environ. 2014, 468–469, 1225–1233. [Google Scholar] [CrossRef]
- Van Dijk, K.C.; Lesschen, J.P.; Oenema, O. Phosphorus flows and balances of the European Union Member States. Sci. Total Environ. 2016, 542, 1078–1093. [Google Scholar] [CrossRef]
- Webb, J.; Sommer, S.G.; Kupper, T.; Groenestein, K.; Hutchings, N.J.; Eurich-Menden, B.; Rodhe, L.; Misselbrook, T.H.; Amon, B. Emissions of ammonia, nitrous oxide and methane during the management of solid manures. In Agroecology and Strategies for Climate Change; Lichtfouse, E., Ed.; Springer: Dordrecht, The Netherlands, 2012; pp. 67–107. [Google Scholar]
- Tallou, A.; Haouas, A.; Jamali, M.Y.; Atif, K.; Amir, S.; Aziz, F. Review on cow manure as renewable energy. In Smart Village Technology: Concepts and Developments; Patnaik, S., Sen, S., Mahmoud, M.S., Eds.; Springer International Publishing: Cham, Switzerland, 2020; pp. 341–352. [Google Scholar]
- Nielsen, H.B.; Mladenovska, Z.; Westermann, P.; Ahring, B.K. Comparison of two-stage thermophilic (68 °C/55 °C) anaerobic digestion with one-stage thermophilic (55 °C) digestion of cattle manure. Biotechnol. Bioeng. 2004, 86, 291–300. [Google Scholar] [CrossRef] [PubMed]
- Nasir, I.M.; Mohd Ghazi, T.I.; Omar, R. Anaerobic digestion technology in livestock manure treatment for biogas production: A review. Eng. Life Sci. 2012, 12, 258–269. [Google Scholar] [CrossRef]
- Tsapekos, P.; Kougias, P.G.; Frison, A.; Raga, R.; Angelidaki, I. Improving methane production from digested manure biofibers by mechanical and thermal alkaline pretreatment. Bioresour. Technol. 2016, 216, 545–552. [Google Scholar] [CrossRef]
- Issah, A.-A.; Kabera, T.; Kemausuor, F. Biogas optimization processes and effluent quality: A review. Biomass Bioenergy 2020, 133, 105449. [Google Scholar] [CrossRef]
- Bhunia, S.; Bhowmik, A.; Mukherjee, J. Agronomic Efficiency of Animal-Derived Organic Fertilizers and Their Effects on Biology and Fertility of Soil: A Review. Agronomy 2021, 11, 823. [Google Scholar] [CrossRef]
- Urra, J.; Alkorta, I.; Garbisu, C. Urra Potential Benefits and Risks for Soil Health Derived From the Use of Organic Amendments in Agriculture. Agronomia 2019, 9, 542. [Google Scholar] [CrossRef] [Green Version]
- Alburquerque, J.; Fuente, C.; Ferrer-costa, A.; Carrasco, L.; Cegarra, D.M.; Bernal, P.M. Assessment of the fertilizer po-tential of digestates from farm and agroindus-trial residues. Biomass Bioenergy 2012, 40, 181–189. [Google Scholar] [CrossRef]
- Abbas, I.; Liu, J.; Noor, R.S.; Faheem, M.; Farhan, M.; Ameen, M.; Shaikh, S.A. Development and performance evaluation of small size household portable biogas plant for domestic use. Biomass Convers. Biorefinery 2022, 12, 3107–3119. [Google Scholar]
- Ellacuriaga, M.; García-Cascallana, J.; Gómez, X. Biogas Production from Organic Wastes: Integrating Concepts of Circular Economy. Fuels 2021, 2, 144–167. [Google Scholar] [CrossRef]
- Kowalczyk-Juśko, A.; Szymańska, M. Poferment as a Fertilizer for Agriculture; Foundation for the Development of Polish Agriculture: Warsaw, Poland, 2015. [Google Scholar]
- Skibko, Z.; Derehajło, S.; Tymińska, M. Influence of agricultural biogas plants on the power grid parameters. In Ulučšenie Èkspluatacionnyh Pokazatelej Selʹskohozâjstvennoj Ènergetiki; Simbirskih, E.S., Romaniuk, W., Eds.; Kirow, FGBOU VO Vâtskij GATU, 2021; Volume 21, pp. 3–12. [Google Scholar]
- Derehajło, S.; Skibko, Z. Cooperation of Biogas Plants with the Power Grid—Selected Issues; ElektroInfo No 1–2; Grupa Medium: Warsaw, Poland, 2021. [Google Scholar]
- Lamb, W.F.; Wiedmann, T.; Pongratz, J.; Andrew, R.; Crippa, M.; Olivier, J.G.J.; Wiedenhofer, D.; Mattioli, G.; Khourdajie, A.A.; House, J.; et al. A review of trends and drivers of greenhouse gas emissions by sector from 1990 to 2018. Environ. Res. Lett. 2021, 16, 073005. [Google Scholar] [CrossRef]
- Dudek, J.; Zaleska-Bartosz, J. Acquisition and use of biogas for energy purposes. Probl. Ekol. 2010, 14, 13–16. [Google Scholar]
- Obrycka, A. Social and economic benefits of constructing agricultural biogas plants. Scientific Journals of the Warsaw University of Life Sciences—SGGW. Econ. Organ. Food Econ. 2014, 107, 163–176. [Google Scholar]
- Pawlak, J. Biogas from Agriculture—Benefits and Barriers; Falenty Institute of Technology and Life Sciences, Warsaw Branch: Warsaw, Poland, 2013; pp. 99–108. [Google Scholar]
- Prochnow, A.; Heiermann, M.; Plöchl, M.; Linke, B.; Idler, C.; Amon, T.; Hobbs, P.J. Bioenergy from permanent grassland—A review: 1. Biogas. Bioresour. Technol. 2009, 100, 4931–4944. [Google Scholar] [CrossRef] [PubMed]
- EN 61000-4-30; Electromagnetic Compatibility (EMC)-Part 4-30: Testing and Measurement Techniques-Power Quality Measurement Methods. EU: Maastricht, The Netherlands, 2015.
- EN 50160:2010; Supply Voltage Parameters for Public Distribution Networks. EU: Maastricht, The Netherlands, 2010.
- Regulation of the Minister of Economy of 4 May 2007 on Detailed Conditions for the Operation of the Electricity System. Available online: https://isap.sejm.gov.pl/isap.nsf/DocDetails.xsp?id=wdu20070930623 (accessed on 4 June 2023).
- Instruction for the Operation and Maintenance of the Distribution Network (Approved by Decision of the President of the ERO No. DRR-4321-29(5)/2013/MKo4 of 10 September 2013). Available online: https://pgedystrybucja.pl/strefa-klienta/przydatne-dokumenty/akordeon-przydatne-dokumenty/instrukcja-ruchu-i-eksploatacji-sieci-dystrybucyjnej (accessed on 4 June 2023).


| Internal Combustion Engine | |
|---|---|
| Engine type | WG1605 |
| Cycle | Otto |
| Number of cylinders | 4 |
| Speed | 2700 rpm |
| Rated active power | 20 kW |
| Nominal apparent power | 26 kVA |
| Primary energy consumption | 62.5 kW |
| Electrical efficiency | 32% |
| Total efficiency | 97% |
| Thermal power | 40.9 kW |
| Maximum flue gas temperature | 110 °C |
| Rated voltage | 400 V |
| Rated current | 29 A |
| Power factor cos ϕ rated | 0.97 |
| Generator | |
| Type | Asynchronous 4P/IE2 |
| Rated speed | 1500 rpm |
| Rated frequency | 50 Hz |
| Rated voltage | 3 × 400 V |
| Winding connection | triangle |
| Variable | Apparent Power S | |||
|---|---|---|---|---|
| Pearson Correlations | Spearman Rank Order Correlations | Gamma Correlations | Kendall Tau Correlations | |
| Voltage U | 0.363376 | 0.390800 | 0.295968 | 0.295949 |
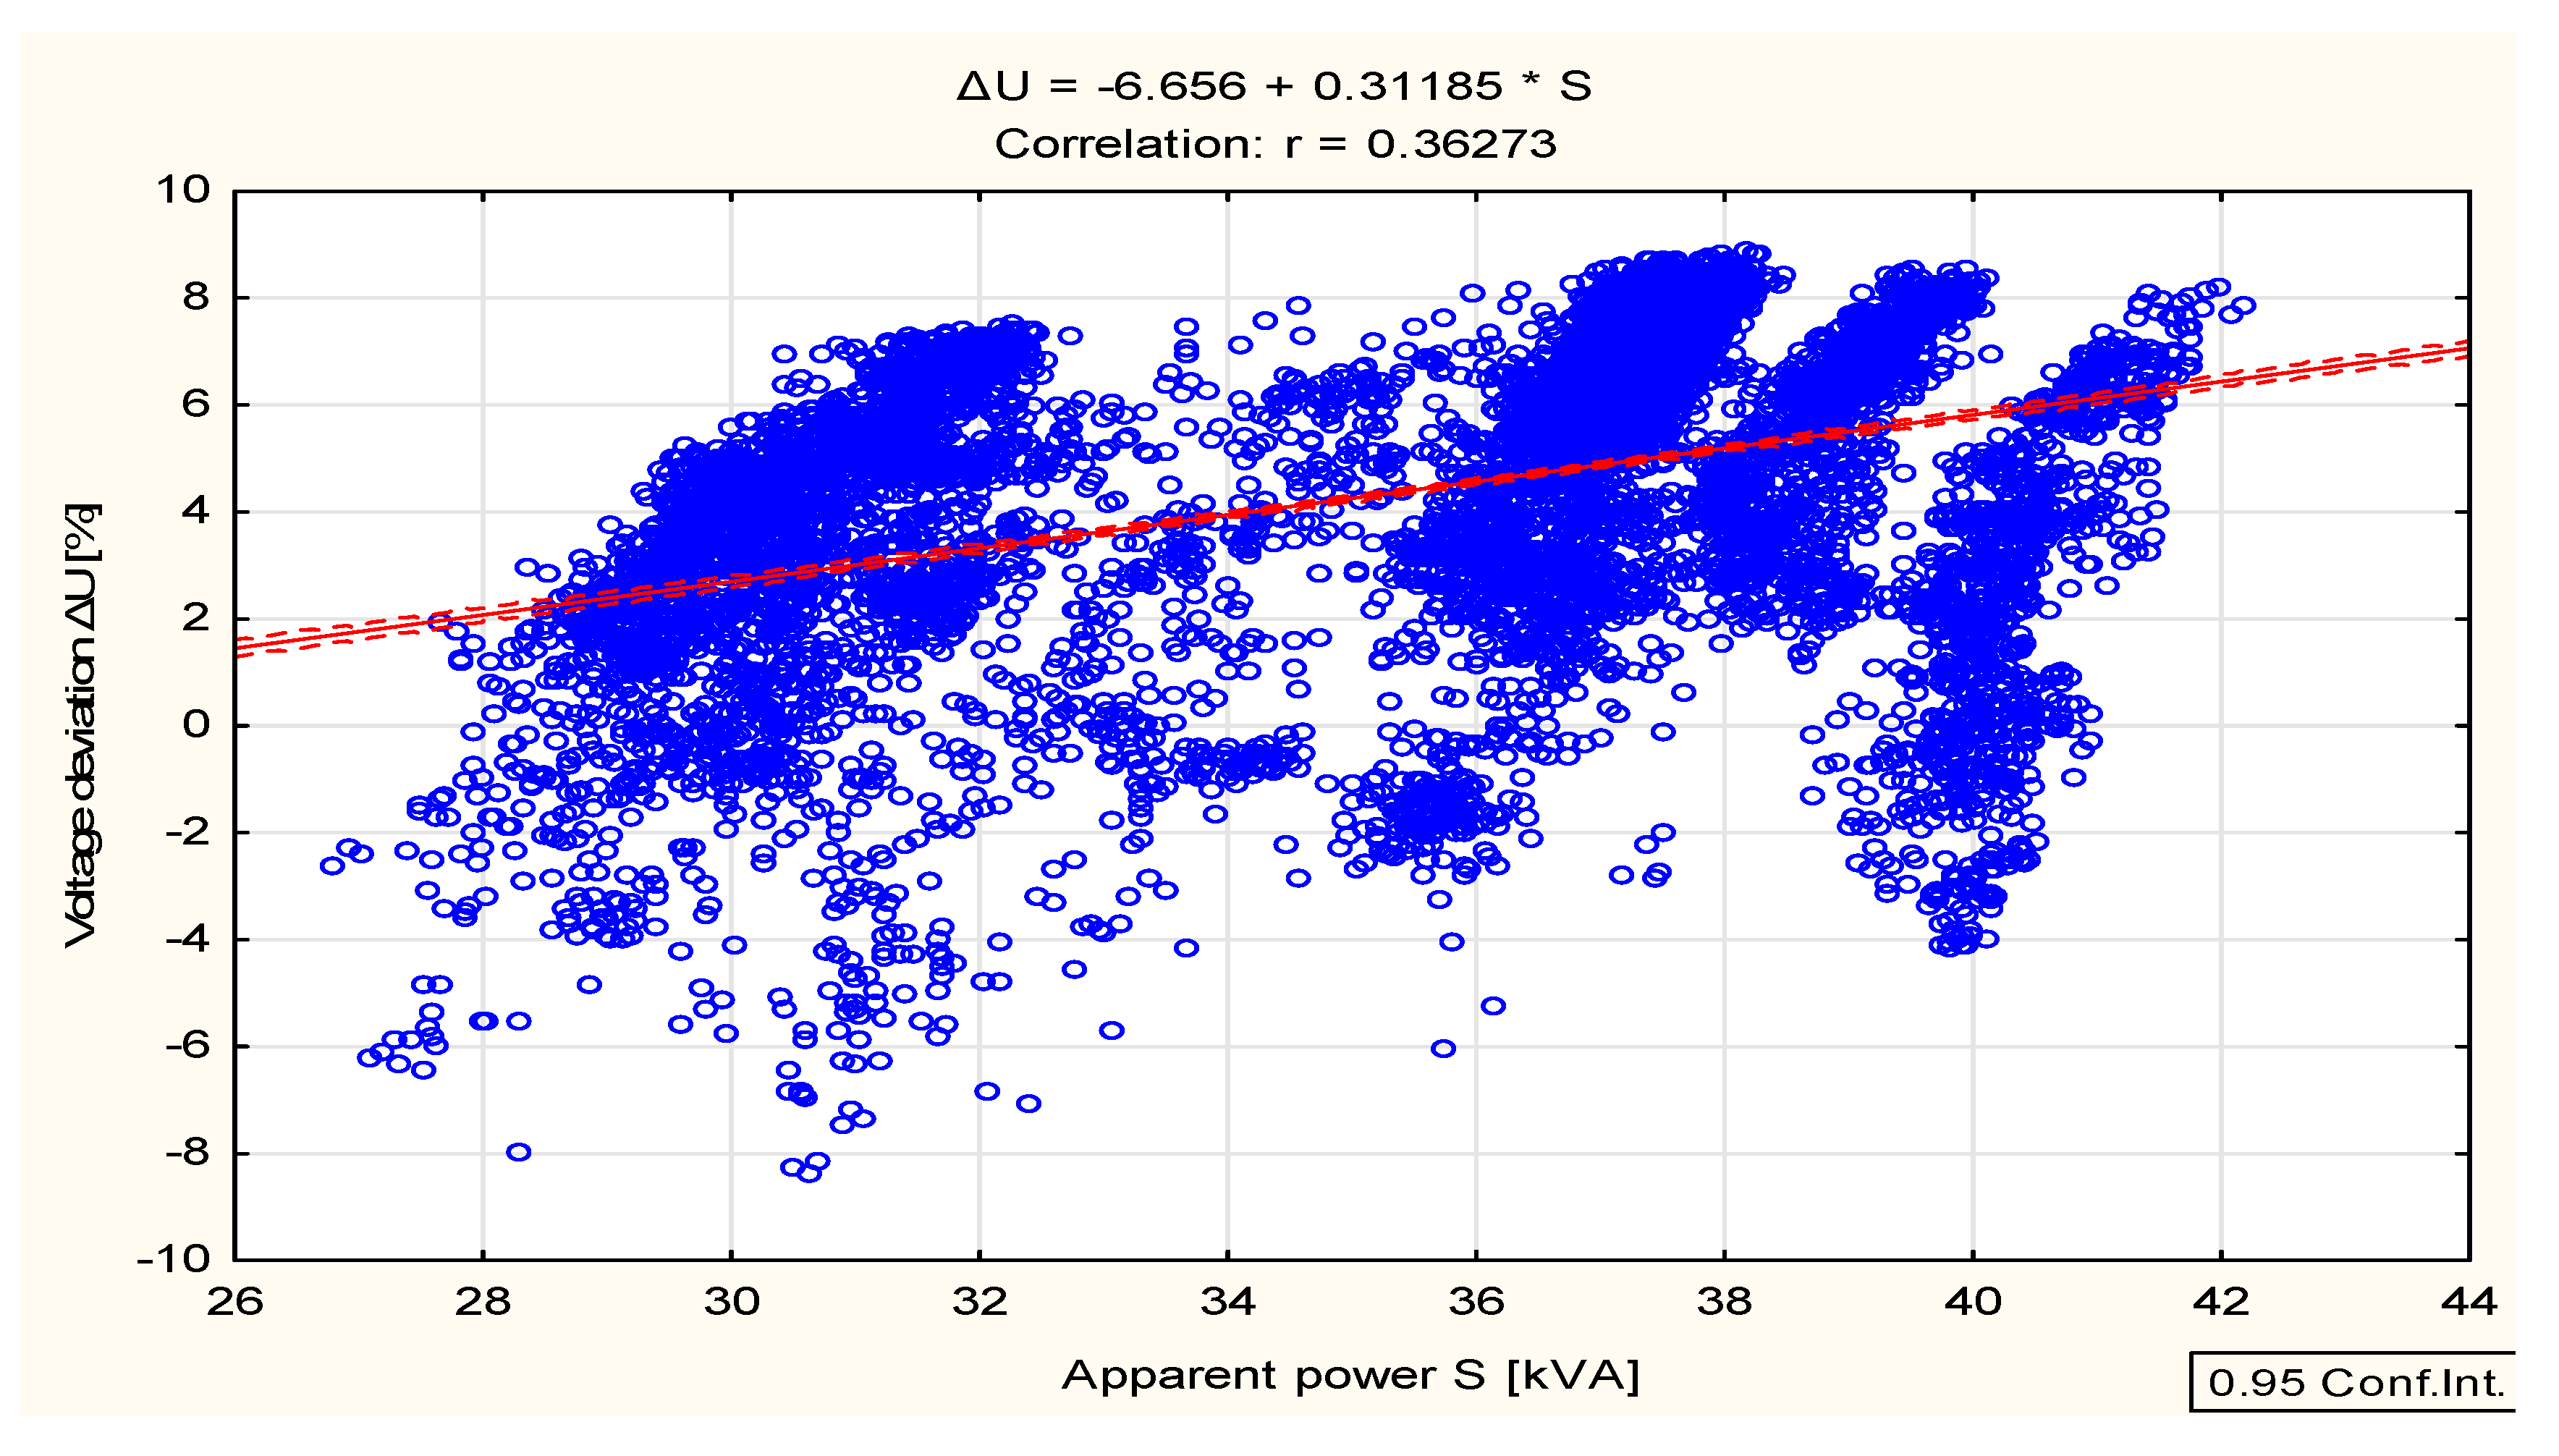
| Voltage deviation ΔU | 0.362725 | 0.390300 | 0.295535 | 0.295524 |
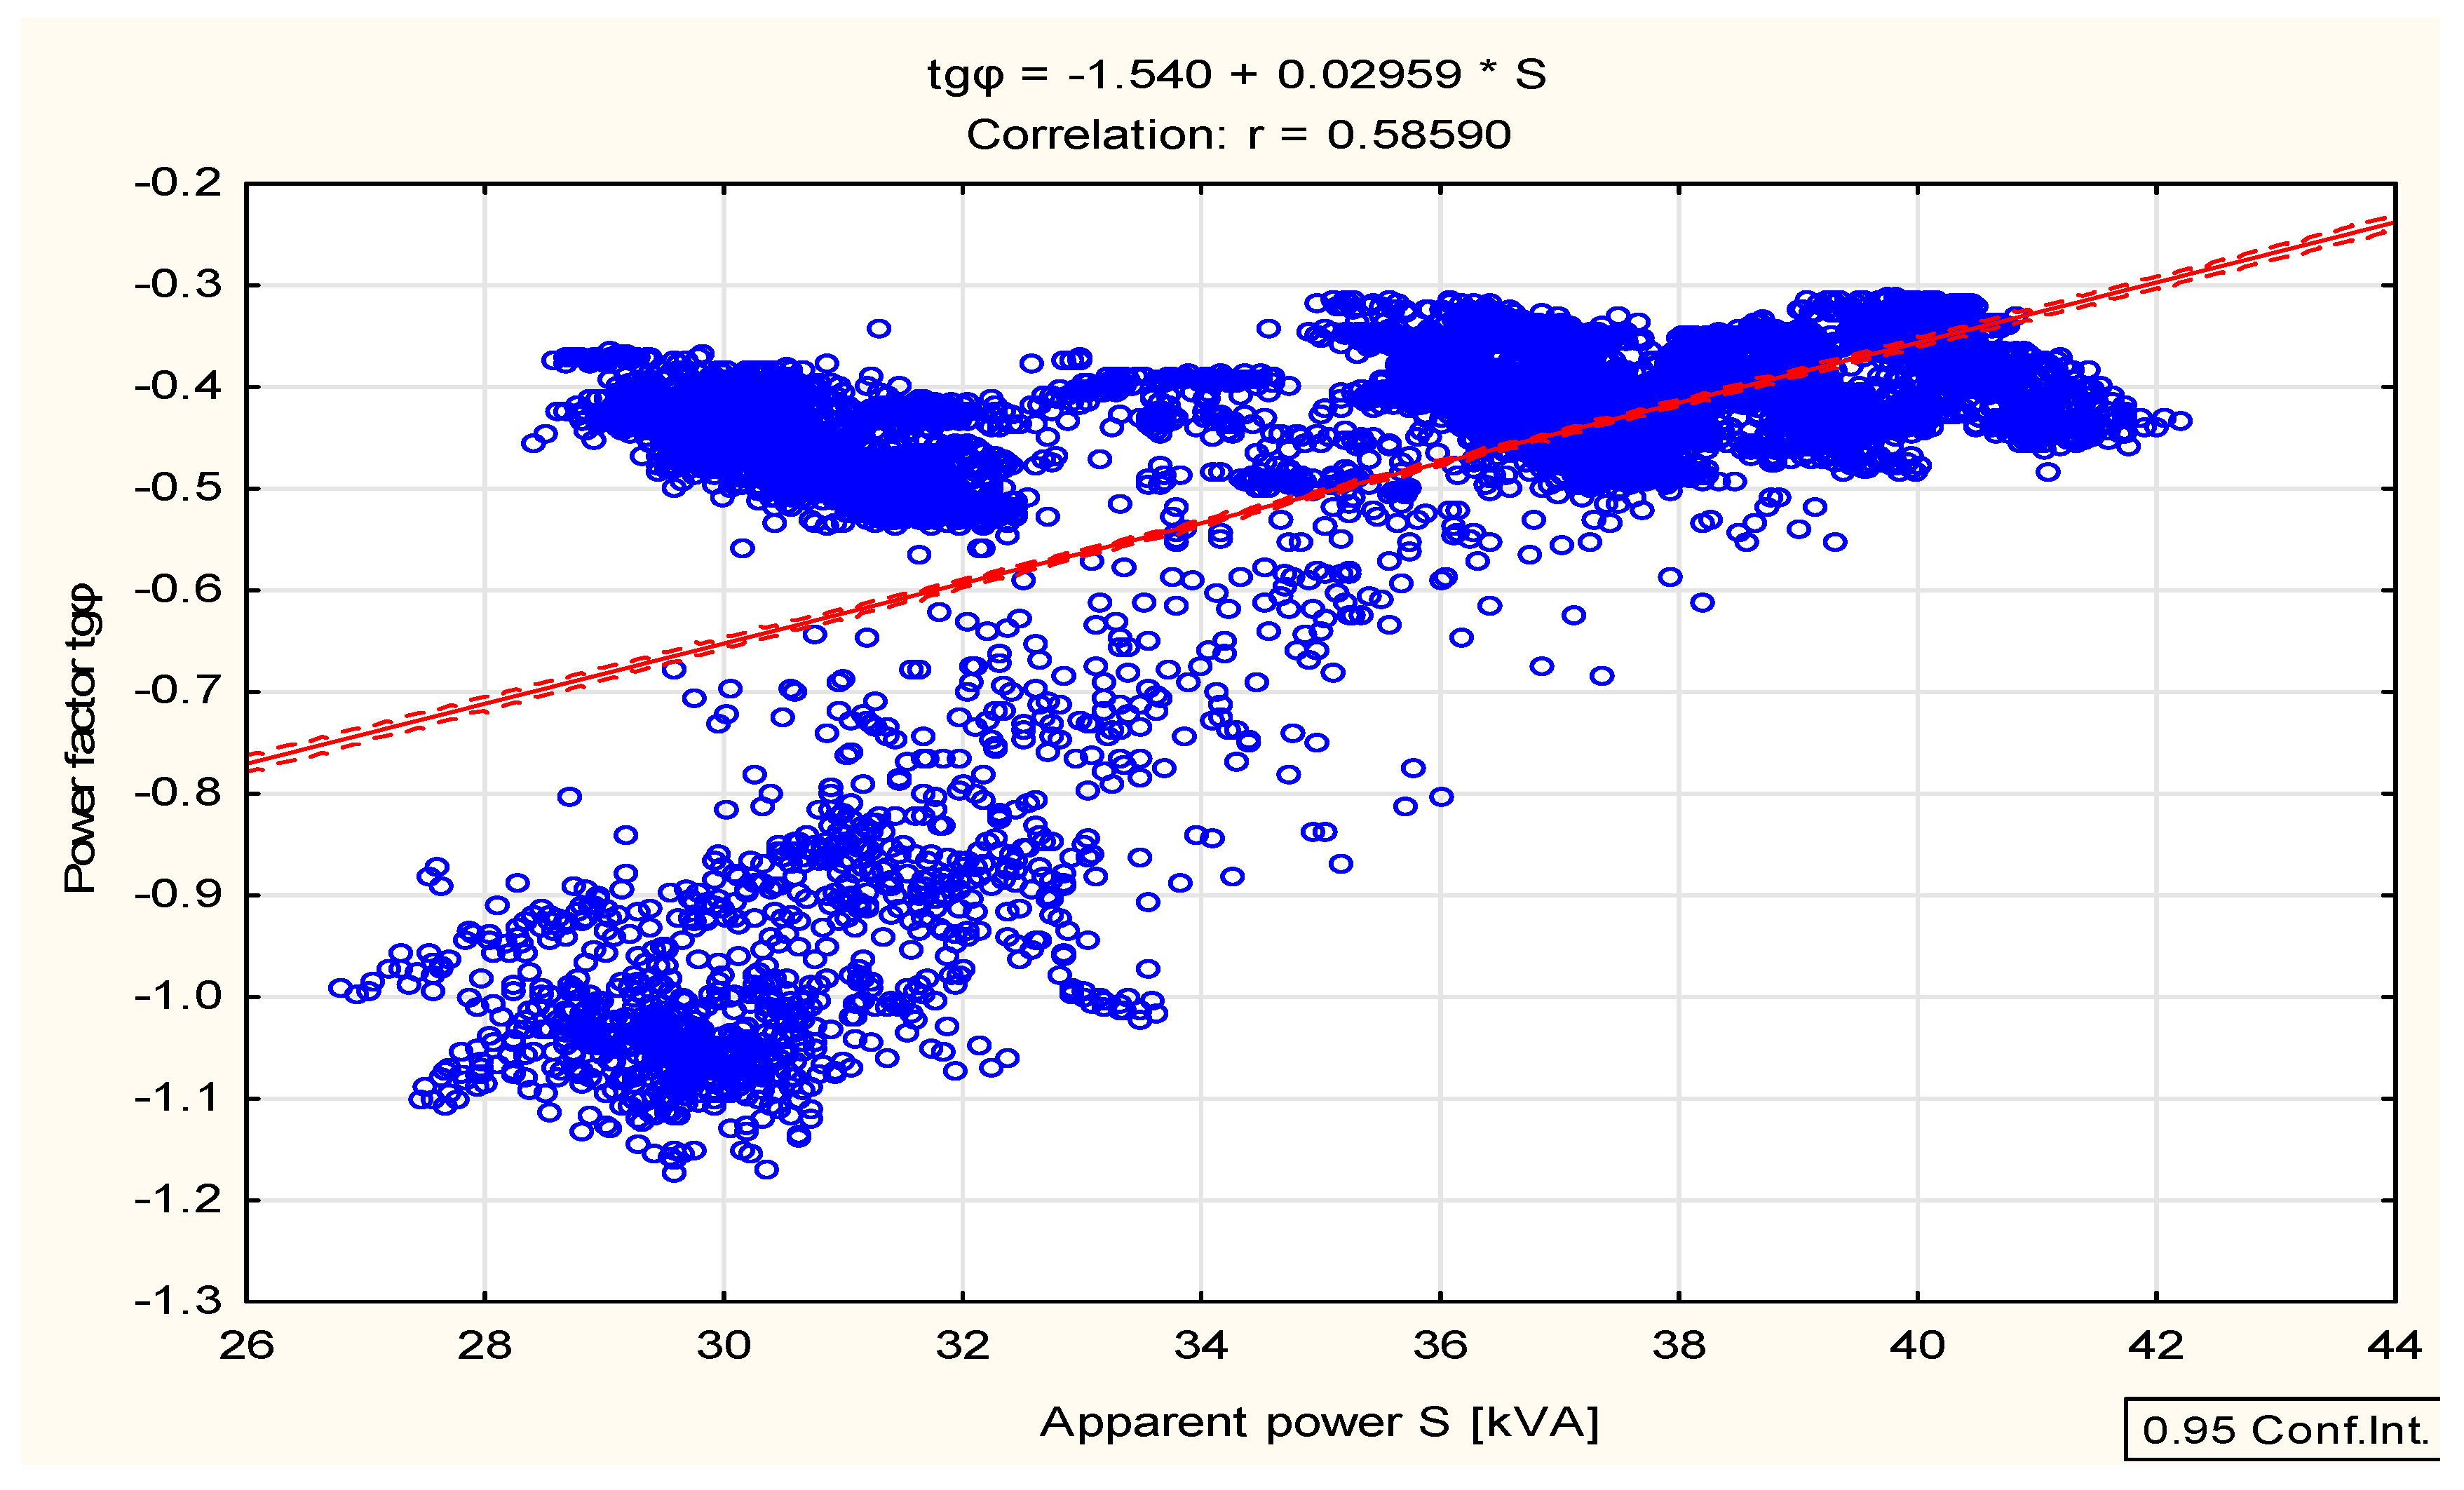
| Power factor tgφ | 0.585901 | 0.460740 | 0.313709 | 0.313709 |
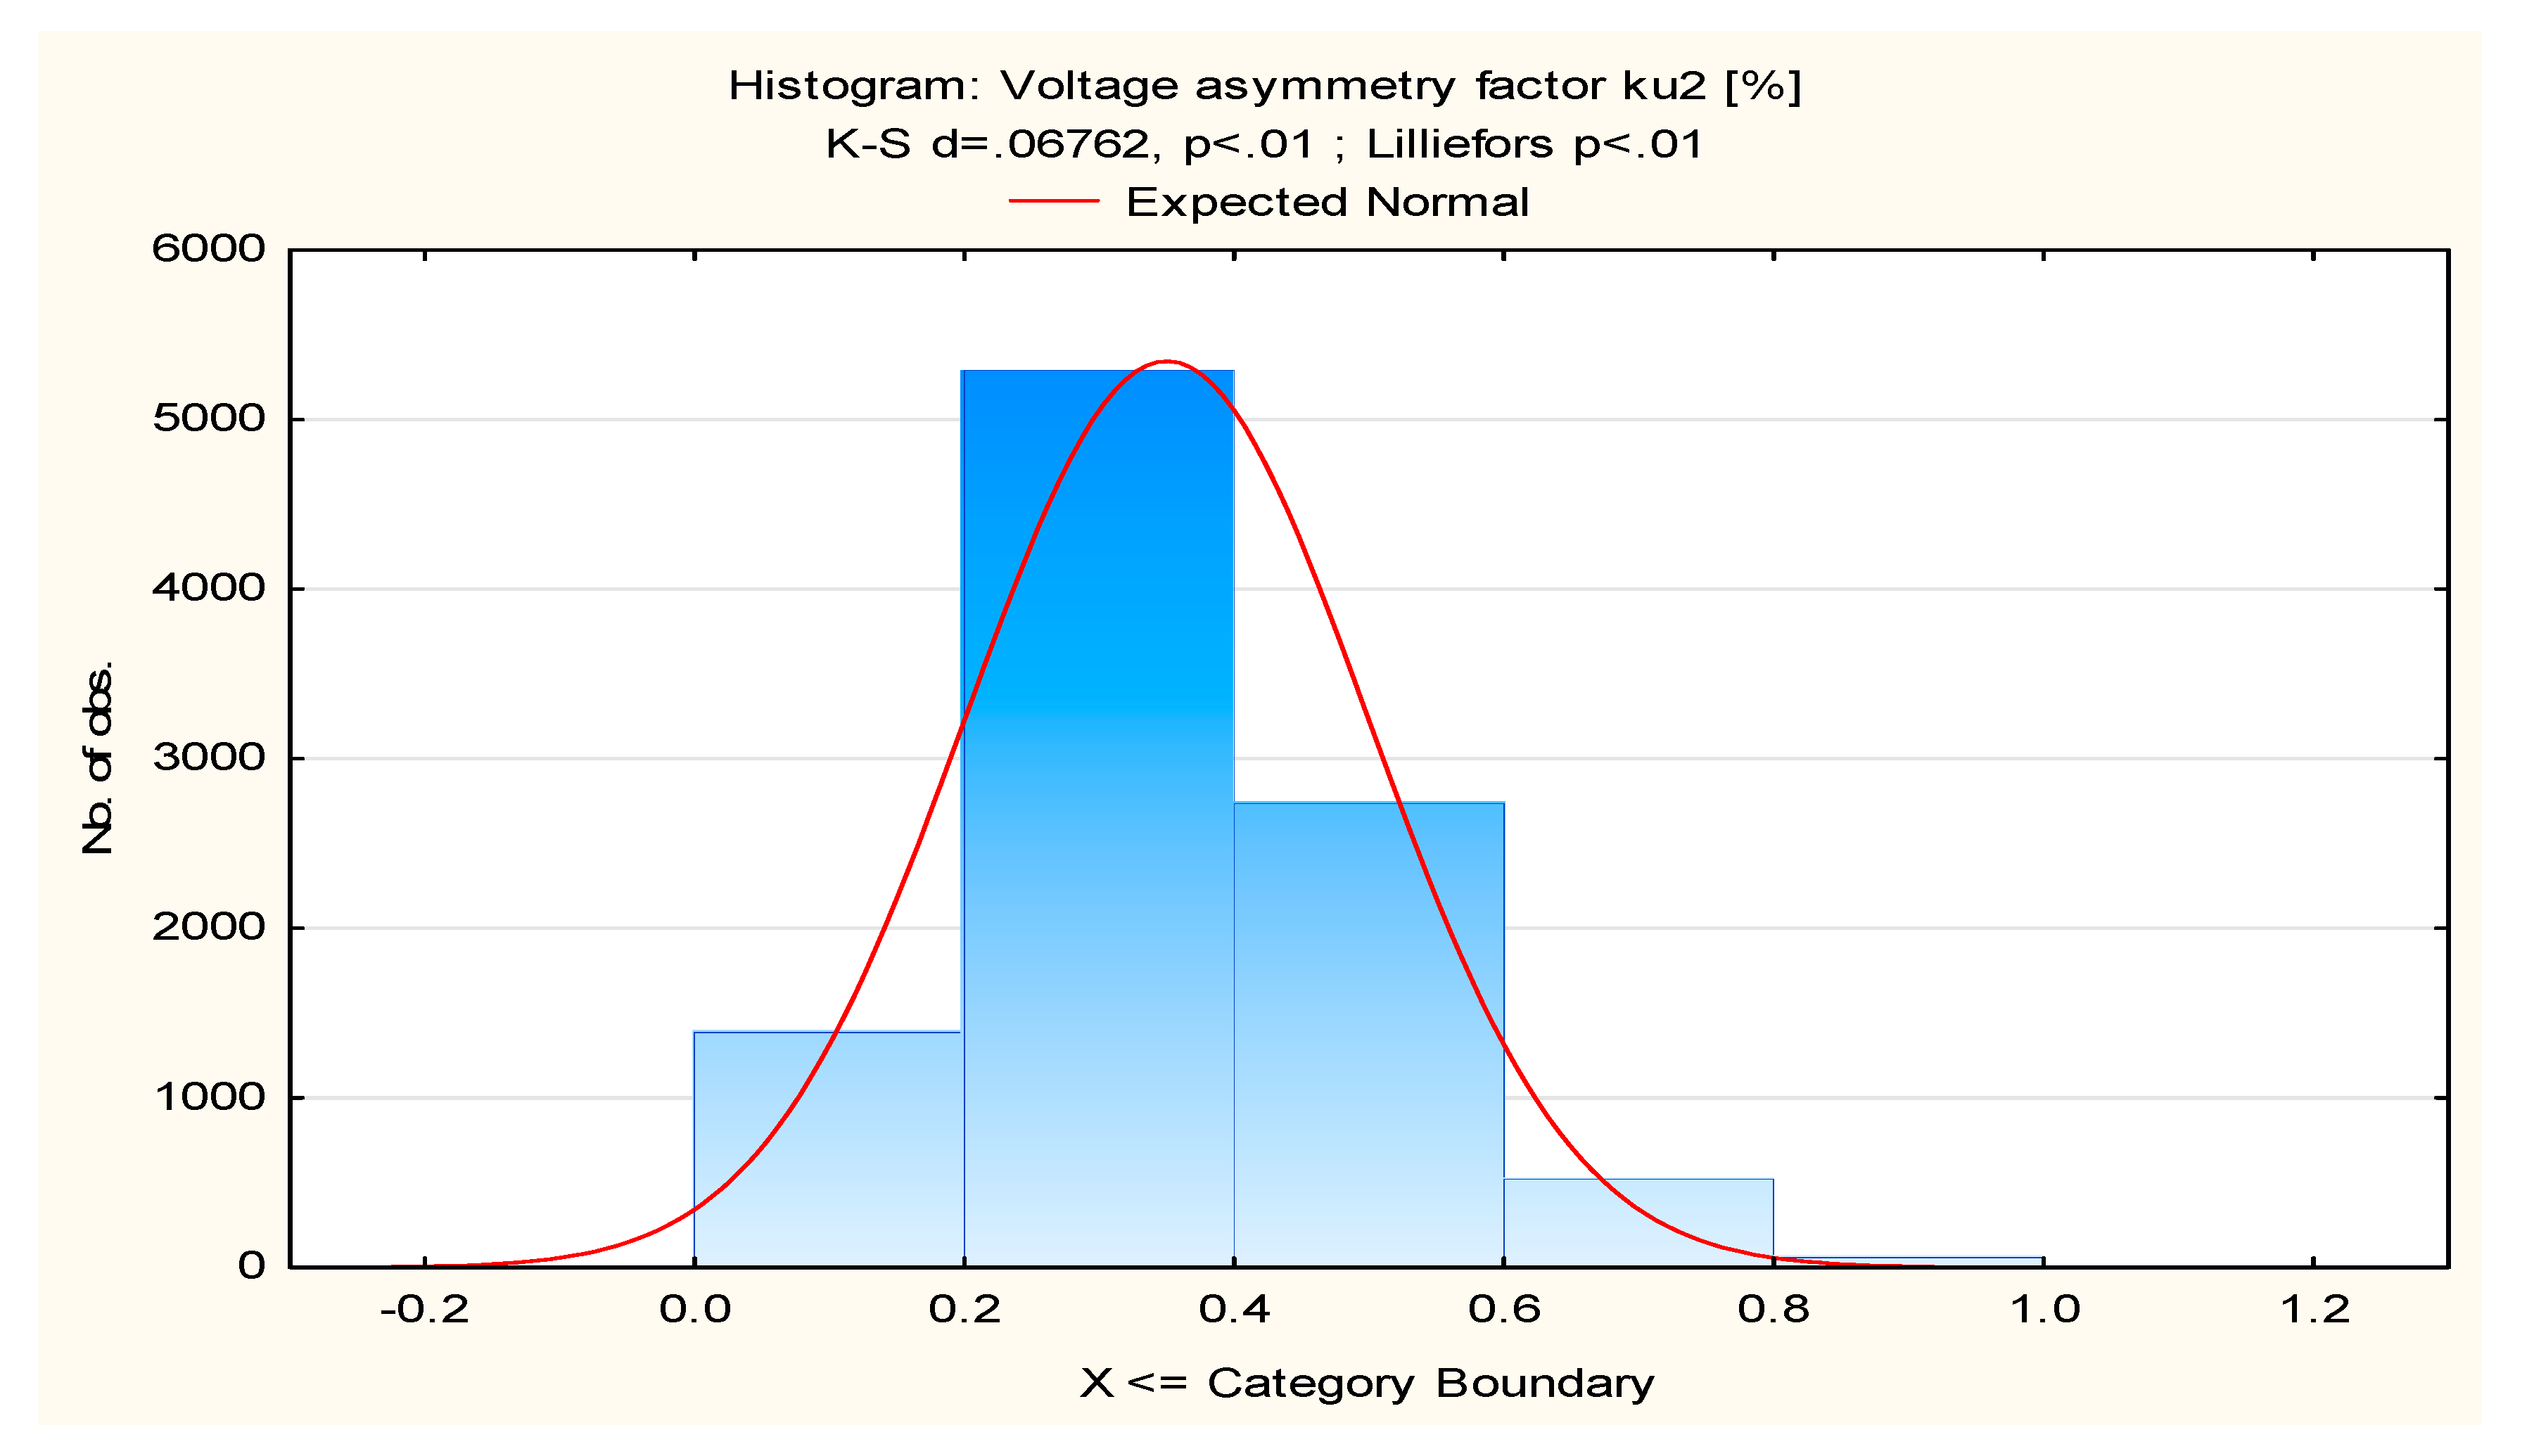
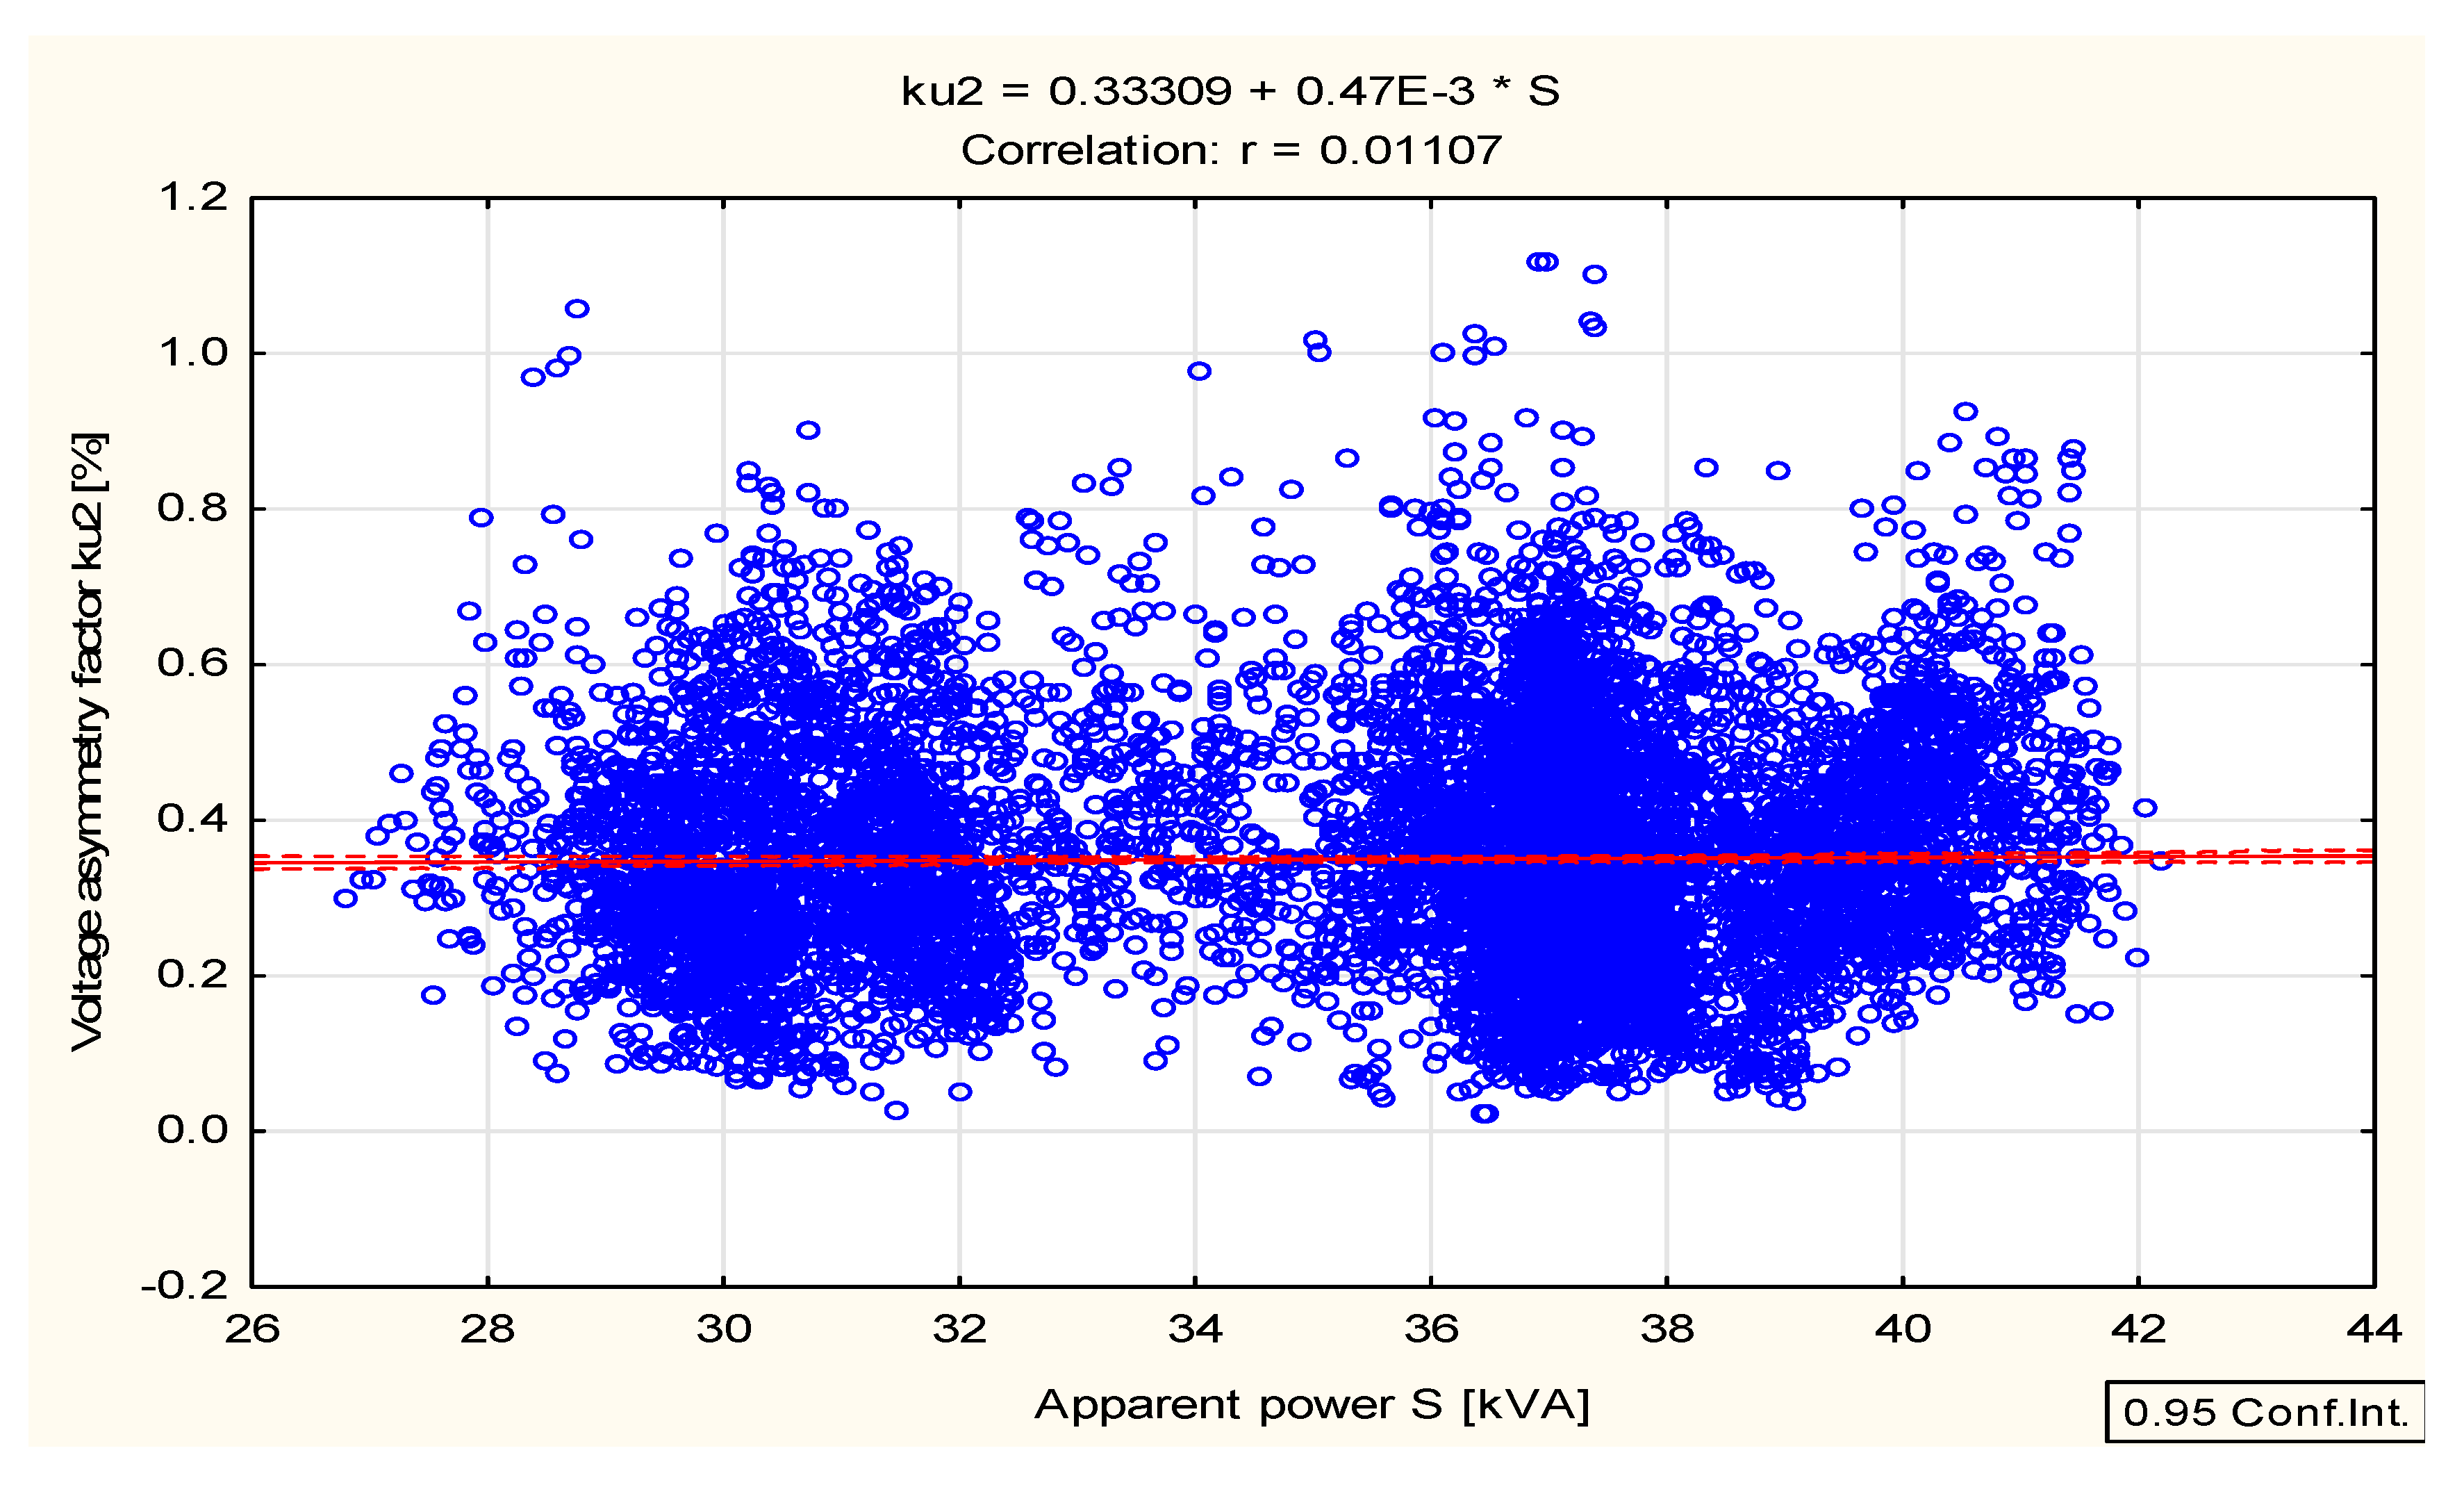
| Voltage asymmetry factor kU2 | 0.011067 | −0.015419 | −0.009762 | −0.009762 |
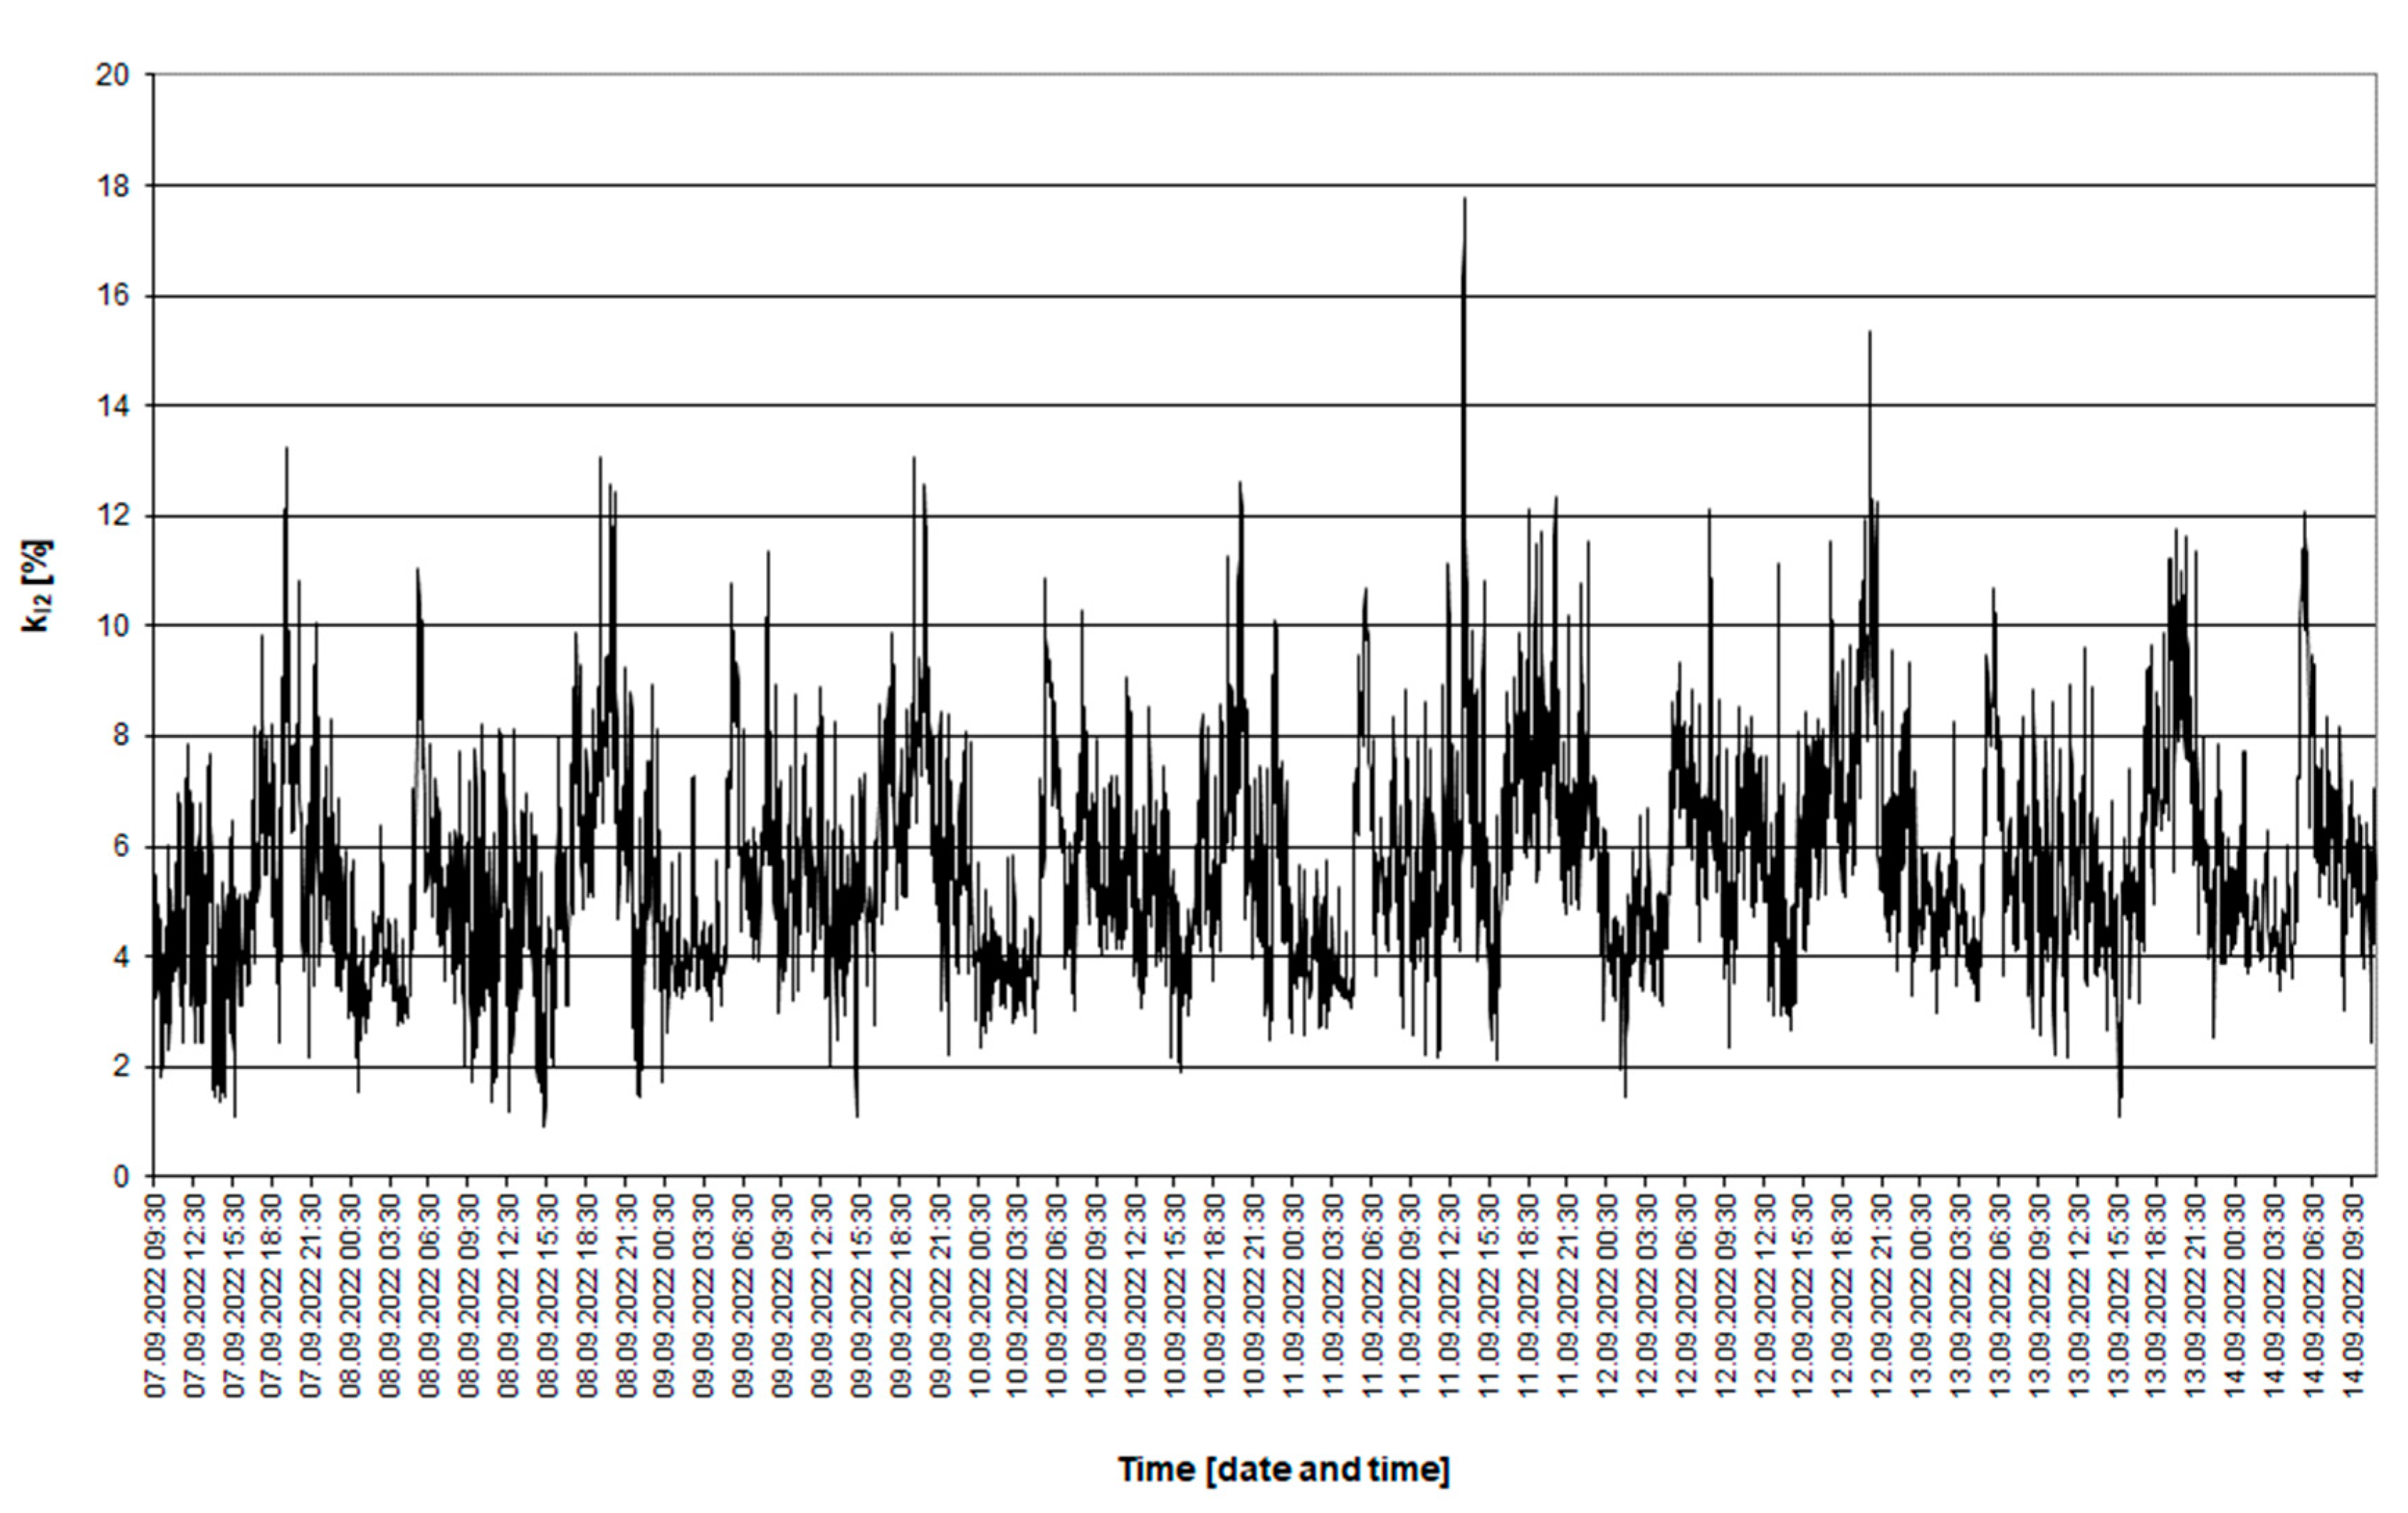
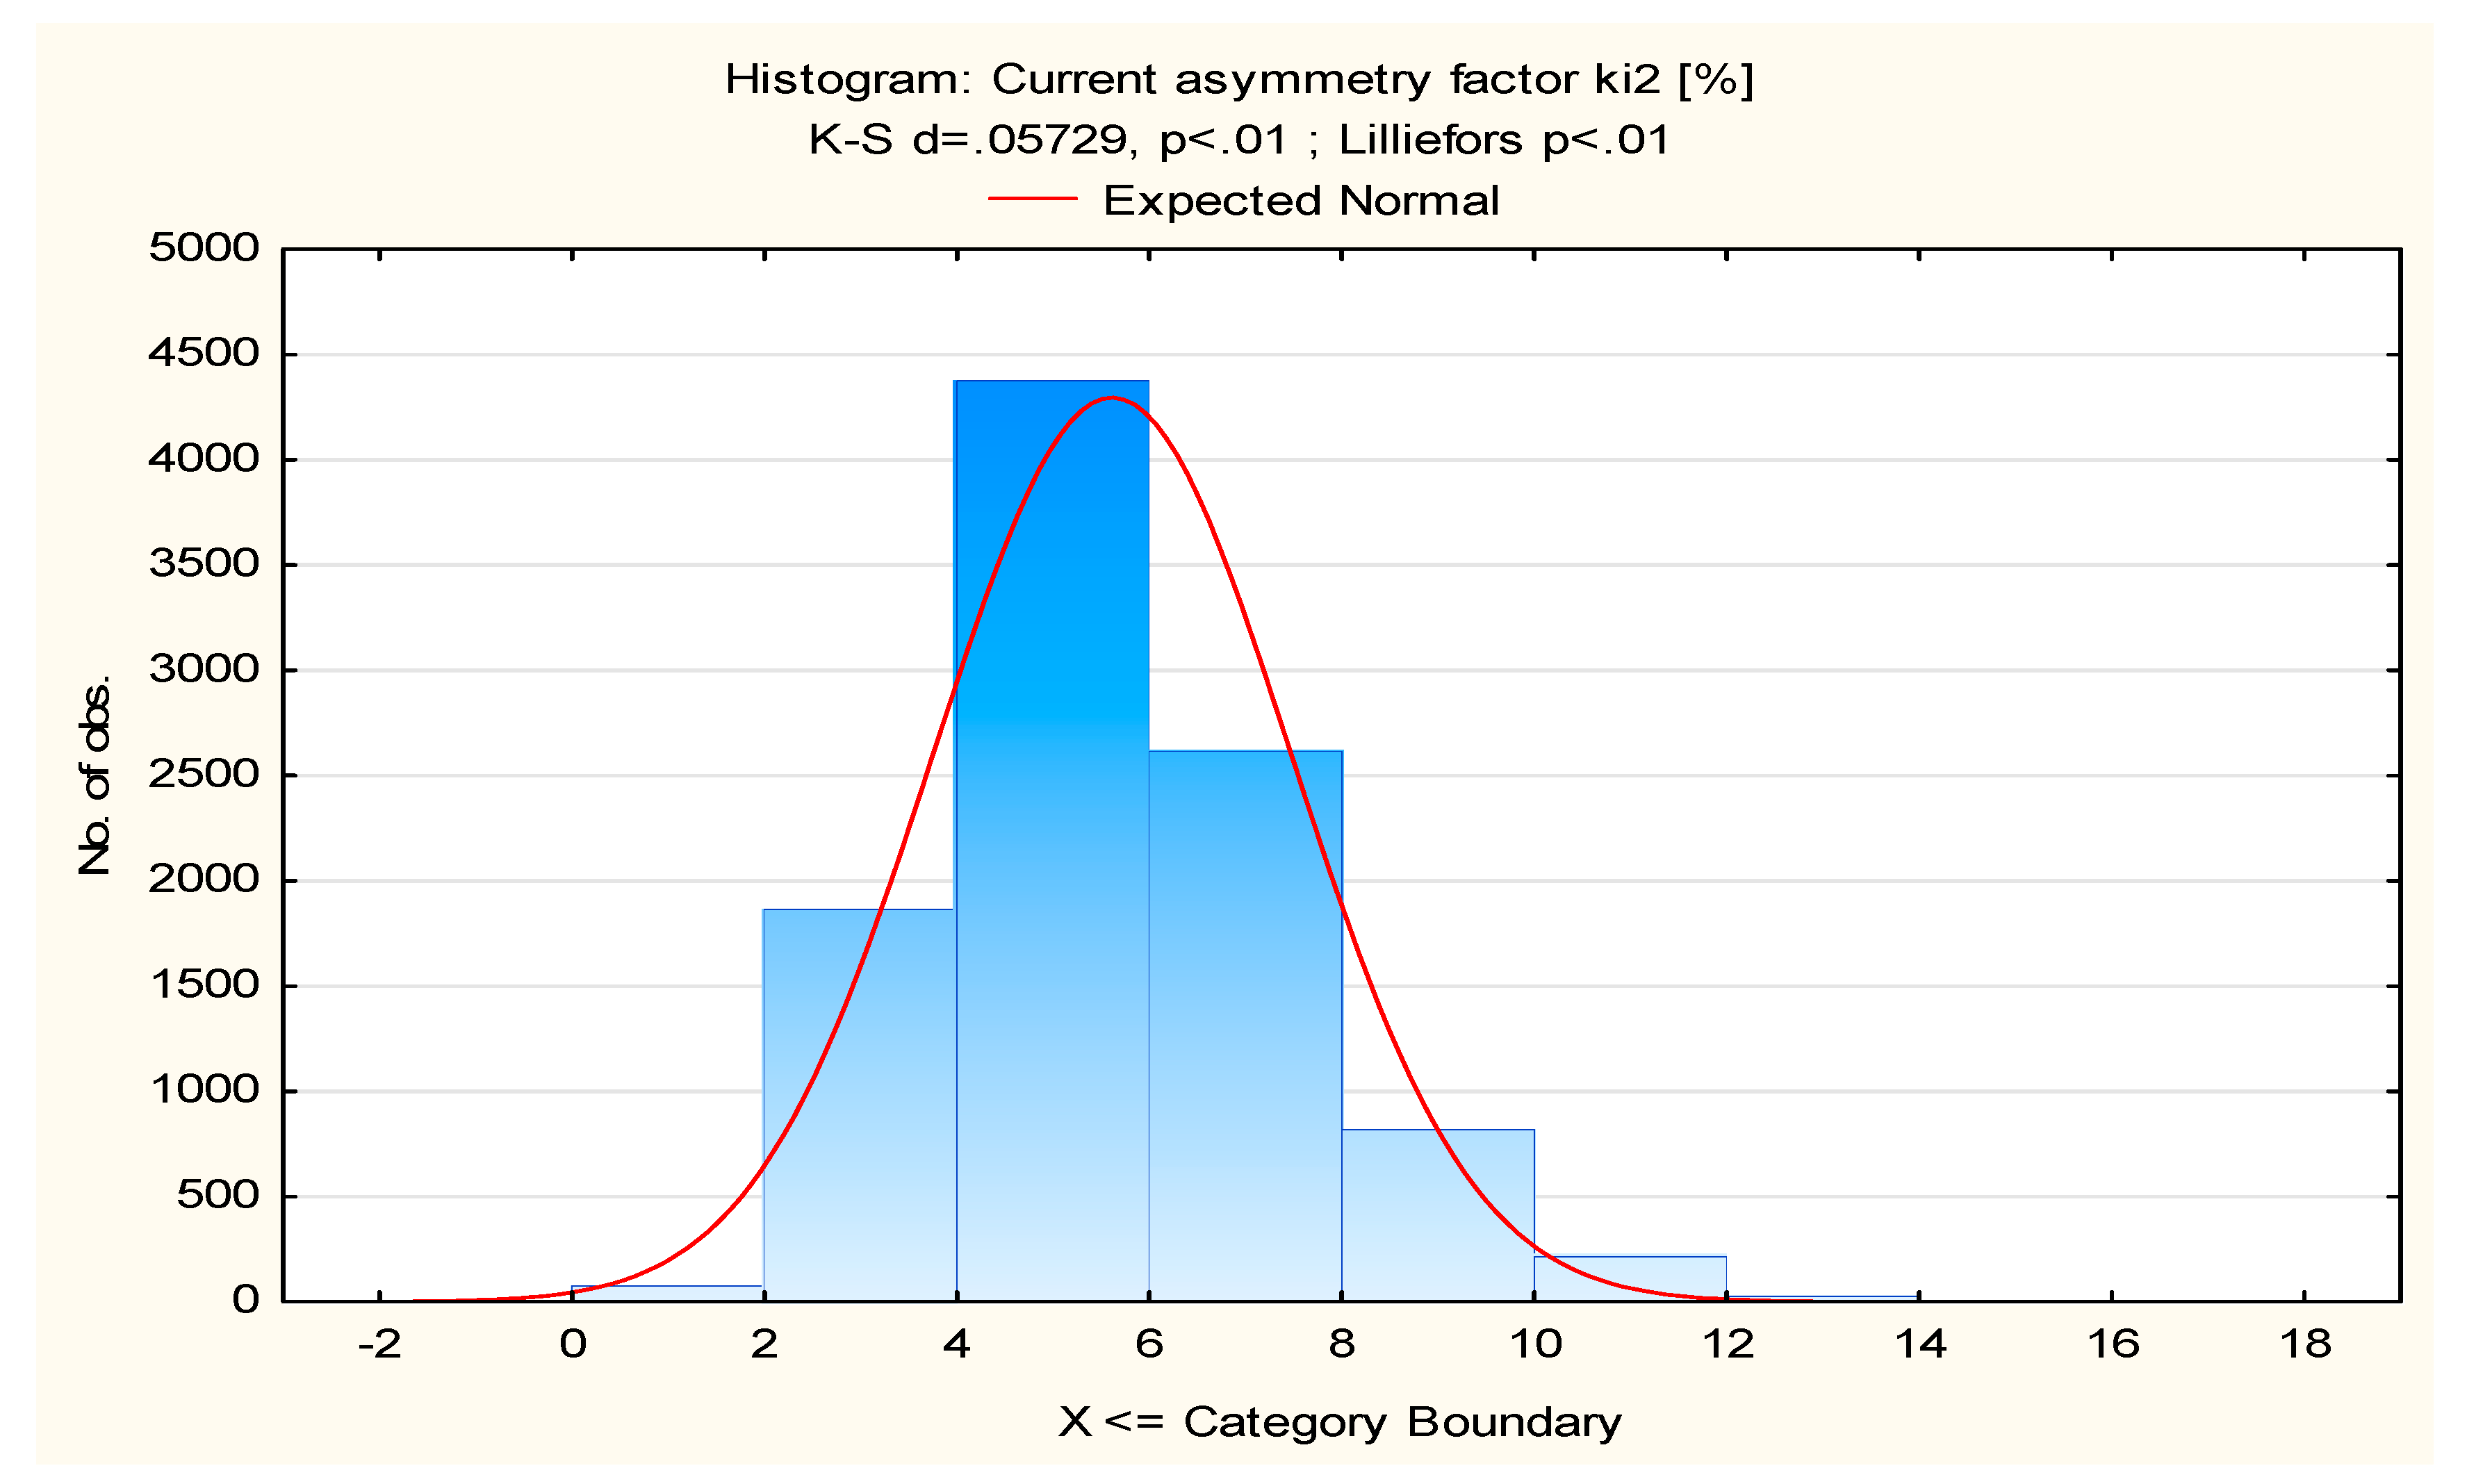
| Current asymmetry factor kI2 | −0.268349 | −0.270219 | −0.179850 | −0.179850 |
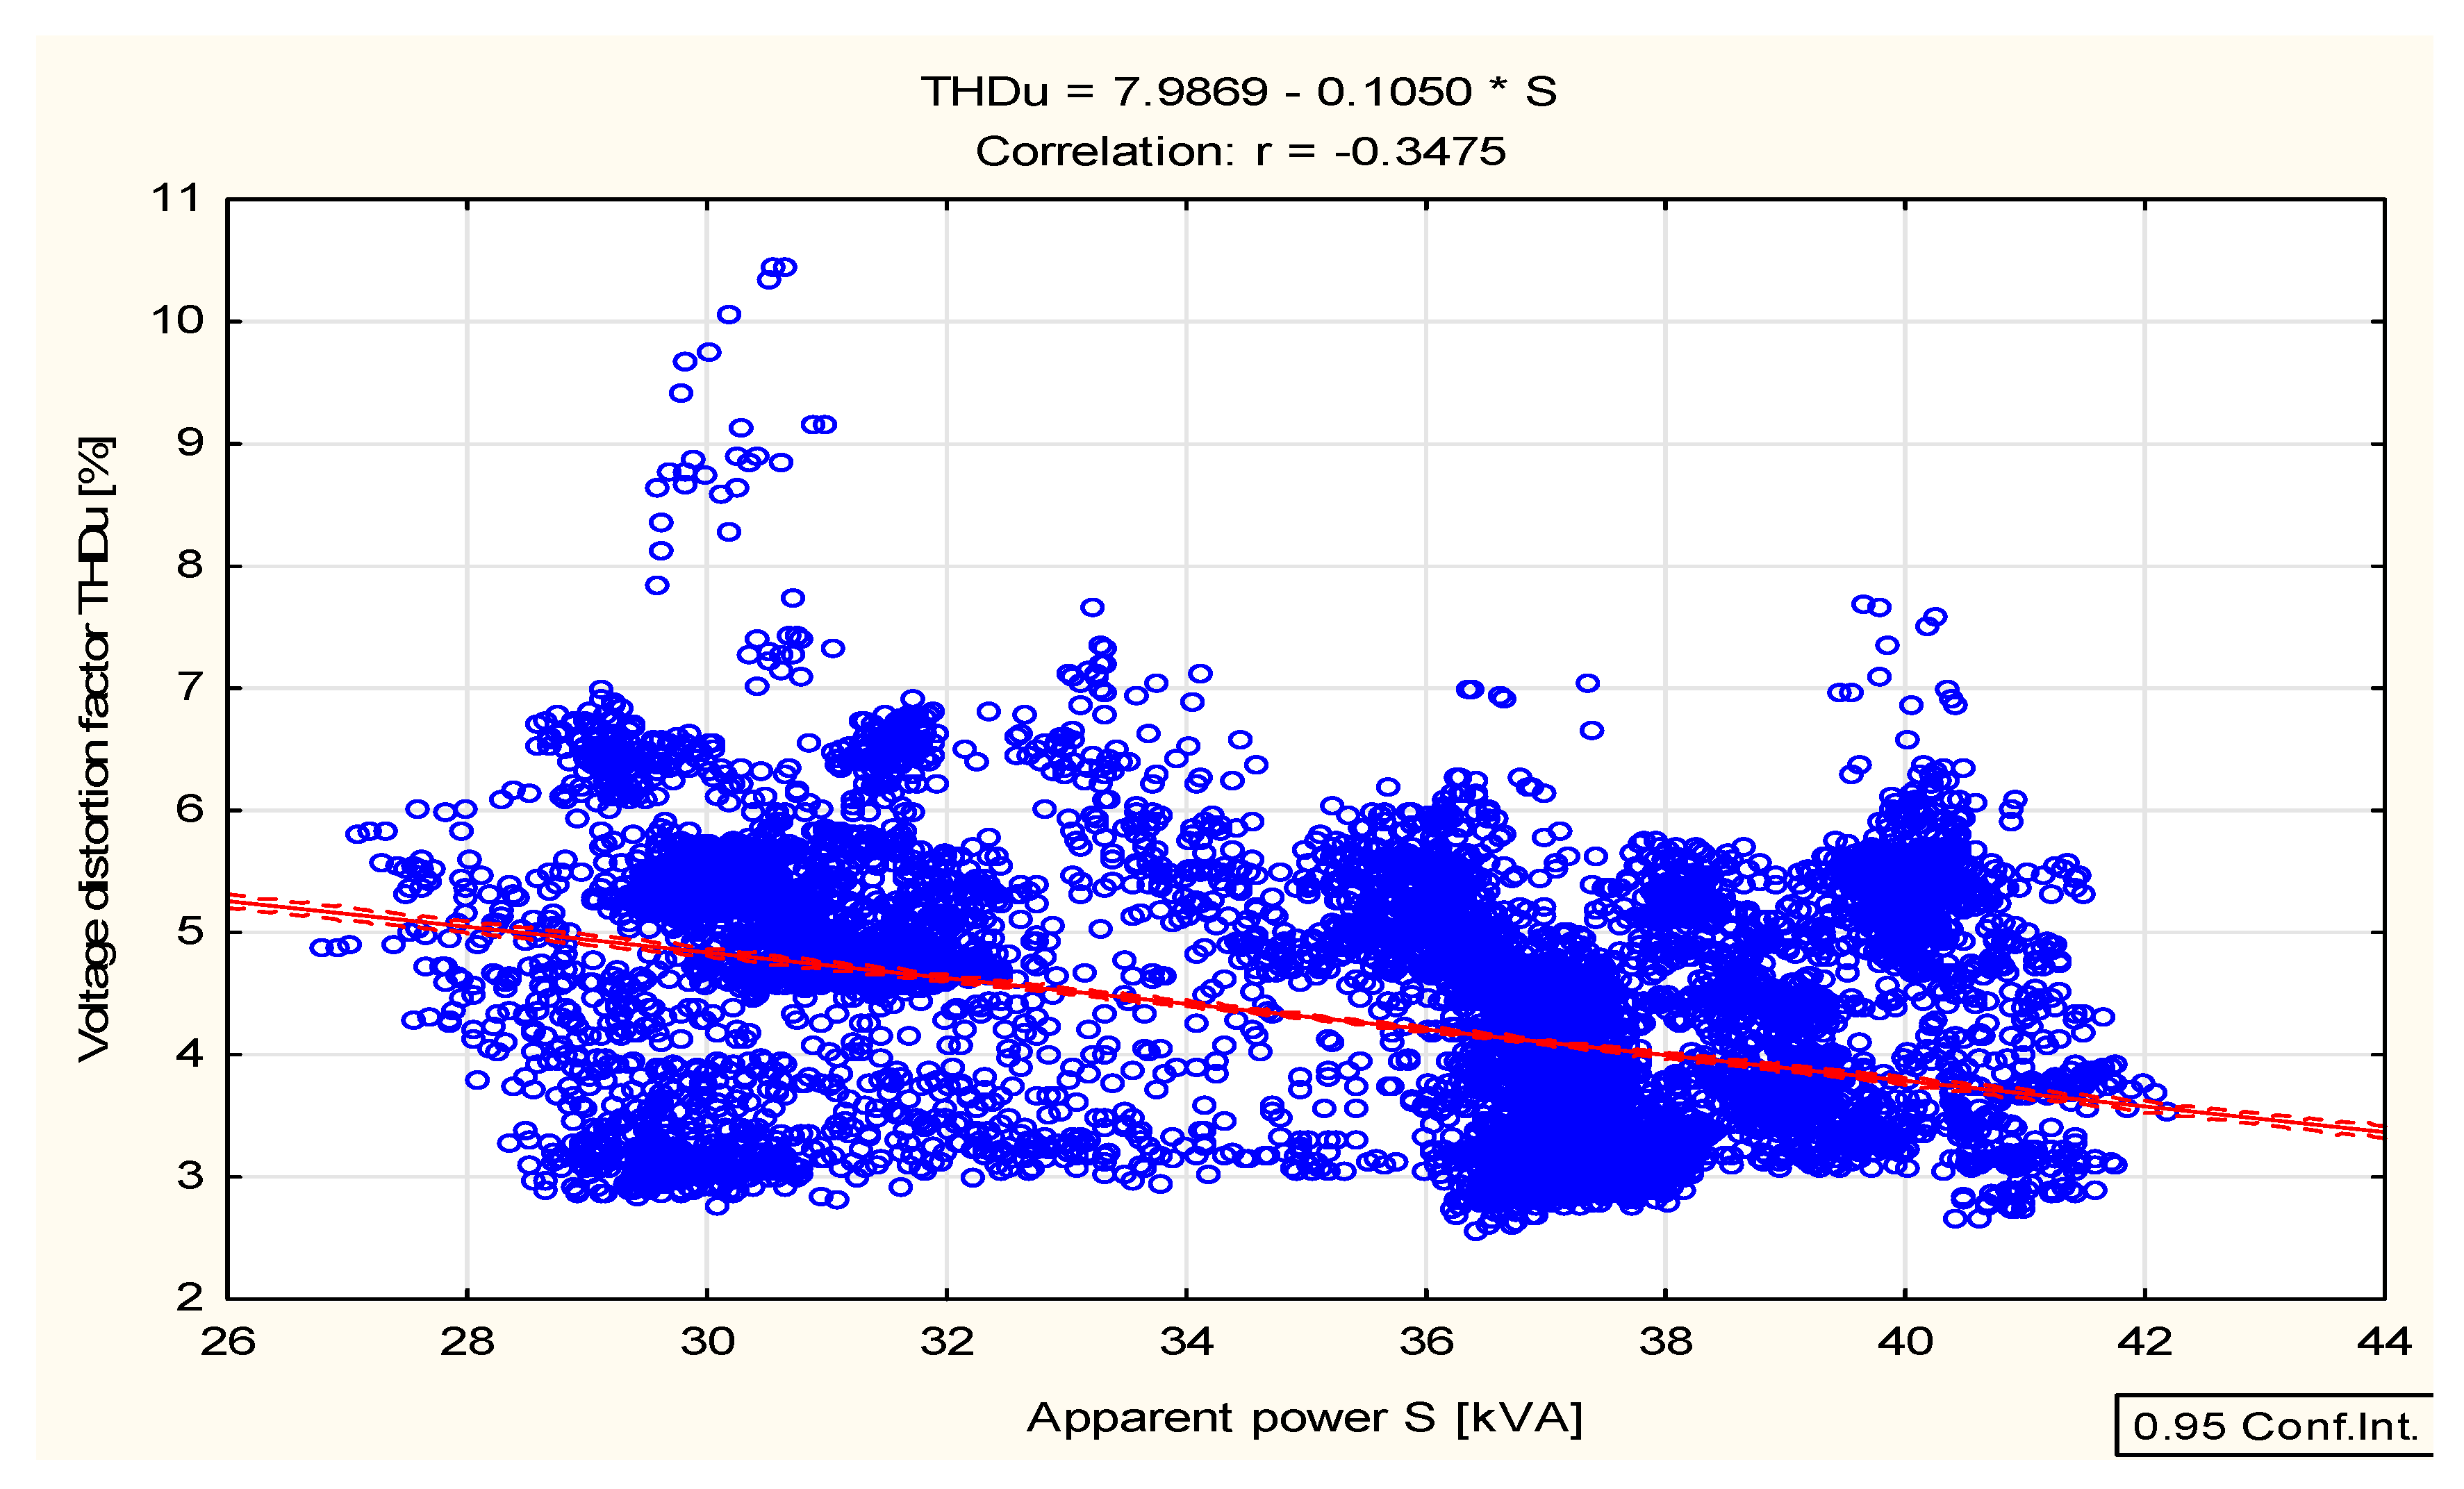
| Voltage distortion factor THDU | −0.347478 | −0.284441 | −0.197056 | −0.196958 |
| Marked correlations were significant at p < 0.05000 | ||||
| Voltage U [V] | Voltage Asymmetry Factor kU2 [%] | Current Asymmetry Factor kI2 [%] | Voltage Distortion Factor THDU [%] | Apparent Power S [kVA] | |
|---|---|---|---|---|---|
| Valid N | 9998 | 9998 | 9998 | 9998 | 9998 |
| Mean | 417.8139 | 0.3512 | 5.6134 | 4.2454 | 35.6261 |
| Median | 420.6652 | 0.3286 | 5.3602 | 4.1433 | 36.9863 |
| Minimum | 366.3967 | 0.0212 | 0.9005 | 2.5333 | 26.8018 |
| Maximum | 435.4828 | 1.1171 | 17.7779 | 10.4367 | 42.2088 |
| Lower Quartile | 410.7167 | 0.2437 | 4.2537 | 3.2367 | 31.9492 |
| Upper Quartile | 427.2263 | 0.4454 | 6.6771 | 5.0914 | 37.7431 |
| Std. Dev. | 11.9951 | 0.1492 | 1.8568 | 1.0542 | 3.4882 |
Disclaimer/Publisher’s Note: The statements, opinions and data contained in all publications are solely those of the individual author(s) and contributor(s) and not of MDPI and/or the editor(s). MDPI and/or the editor(s) disclaim responsibility for any injury to people or property resulting from any ideas, methods, instructions or products referred to in the content. |
© 2023 by the authors. Licensee MDPI, Basel, Switzerland. This article is an open access article distributed under the terms and conditions of the Creative Commons Attribution (CC BY) license (https://creativecommons.org/licenses/by/4.0/).
Share and Cite
Tymińska, M.; Skibko, Z.; Borusiewicz, A. The Effect of Agricultural Biogas Plants on the Quality of Farm Energy Supply. Energies 2023, 16, 4600. https://doi.org/10.3390/en16124600
Tymińska M, Skibko Z, Borusiewicz A. The Effect of Agricultural Biogas Plants on the Quality of Farm Energy Supply. Energies. 2023; 16(12):4600. https://doi.org/10.3390/en16124600
Chicago/Turabian StyleTymińska, Magdalena, Zbigniew Skibko, and Andrzej Borusiewicz. 2023. "The Effect of Agricultural Biogas Plants on the Quality of Farm Energy Supply" Energies 16, no. 12: 4600. https://doi.org/10.3390/en16124600
APA StyleTymińska, M., Skibko, Z., & Borusiewicz, A. (2023). The Effect of Agricultural Biogas Plants on the Quality of Farm Energy Supply. Energies, 16(12), 4600. https://doi.org/10.3390/en16124600