Article

Modeling and Pile-Driven Scaled Tests for Windfarm Foundations

by
Jorge Soriano Vicedo
1,*,
Javier García Barba
1,
William Daniel Cobelo
2 and
Aldo Fernández
2
1
Departamento de Ingeniería Civil, Escuela Politécnica Superior, Universidad de Alicante, 03080 Alicante, Spain
2
Facultad de Ingeniería Civil, CUJAE, Havana 19390, Cuba
*
Author to whom correspondence should be addressed.
Energies 2023, 16(12), 4612; https://doi.org/10.3390/en16124612
Submission received: 30 April 2023 / Revised: 3 June 2023 / Accepted: 6 June 2023 / Published: 9 June 2023
(This article belongs to the Section A3: Wind, Wave and Tidal Energy)

Abstract

:
One of the main problems associated with the generation of wind energy in offshore wind platforms is the analysis of the behavior of the soil when the pile is driven into the seabed. Nowadays, due to the large dimensions of the foundations (hollow steel piles up to 8 m in diameter and 15–20 cm thickness), there are no scale studies carried out that analyze the mechanical and deformational behavior of soil where piles are driven as well as the material of the pile that supports the motor. This paper presents the results obtained from scale submerged tests in a steel pool to analyze the behavior of sand in the presence of water where piles were installed. These tests use a hydraulic press to carry out the penetration of the steel tube in the sand. The results were compared with three different speeds for three tubes with different diameters and two types of termination at the end of the tested element. The results of the submerged tests were compared with the tests in dry conditions and with the results obtained through the finite element Plaxis program.

1. Introduction

The aim of this article is to estimate the penetration force and the stress state in soil and its application to real work driven from the results obtained in tests on a submerged scale. Nowadays, due to the large dimensions of the foundations (hollow steel piles up to 8 m in diameter and 15–20 cm in thickness), there are no scale studies carried out that analyze the mechanical and deformational behavior of soil where piles are driven. The tests carried out onshore have not taken into account the presence of water, and this is a very important factor when analyzing the results. In addition, on the seabed, there are several phenomena (such as corrosion, marine currents, scour, high pressure due to great depth, etc. [1,2,3,4]) that cause oversizing of monopile foundations to ensure the stability of the structure [4,5,6,7,8,9,10,11,12].
Previously, tests were carried out in dry conditions [13]. The following conclusions were reached:
  • For the same tube, a greater speed required a greater force to achieve the same penetration.
  • In addition, there were differences in the results obtained for hollow and flat situations. For flat penetration, a greater force was required to achieve the same drive length, which is a vital factor to take into account when designing offshore structures.
It is necessary to determine the behavior of the sands on which offshore foundations are installed. These sands settle to the seabed over time due to transport from the shore [14,15,16,17,18]. The sand is composed of fractions of different grain sizes, and each fraction has a particular distribution along the coastline. The distribution decreases towards the dune and offshore, up to 6 m deep, where its percentage increases again towards the sea. The maximum in the relative distribution is located around the coastline (0 m depth).
Due to its similarity to sea sand, silica sand was chosen for the scale tests. A total of 1 ton of limestone sand and 4 tons of silica sand were used. These weights were necessary to fill the pool to carry out the tests. This choice was because silica sand does not have a large amount of fines and sea sand has fines [19]. Therefore, the grain size was 0.769 mm.
Nowadays, a large number of tests, such as those of PISA (Pile Soil Analysis) [14] have been carried out. The PISA project consists of scale tests of pile driving to learn the behavior of the soil. These tests were carried out onshore. Due to this, the tests carried out in this article were carried out in submerged conditions.
The most important conclusions obtained in Pisa Project were as follows: the results obtained in the onshore tests provide a new database with which design models in clay and sand can be compared, developed and validated; and adoption of the PISA design approach will allow for optimization of the design of monopiles for the development of wind farms.
The amortization period of the installation of a wind farm is also an important calculation to take into account when carrying out windfarm feasibility studies [20].
The aim of this article is to reproduce some scale submerged tests with characteristics and restrictions related to those of PISA, as described in Section 2.2.1.

2. Materials and Methods

2.1. Previous Tests

Various tests were carried out to determine the mechanical and granulometric characteristics of the sand [21,22,23,24,25] (Table 1).

2.2. Scale Tests

2.2.1. PISA Model: Dimensions and Speed Test

In PISA project [14], 28 piles were tested with varied wall thickness, length and diameter, with both monotonic and cyclic loads.
It was accepted that the trials would be carried out onshore on a reduced scale due to the technical limitations of the equipment that could be mobilized onshore and the high cost of offshore testing. Scaled pile geometries and loading regimes were adopted, which were commensurate with offshore wind foundations, including:
  • Velocity load: diameter/300 or diameter/500 per minute;
  • Pile diameters of 0.27 m, 0.76 m and 2 m;
  • Pile thickness of 0.7 cm to 3.8 cm, with the condition of 30 < diameter/thickness < 80
  • Entered lengths between 1.43 m and 10.5 m with the condition of 3 < length entered/diameter < 10.

2.2.2. Characteristics and Dimensions of Scale Submerged Test

  • Characteristics of pool (Figure 1):
    2 × 2 × 1 m pool and 5 mm thickness;
    Plate of 2.3 × 2.3 and 3 mm thickness that serves as the base of the pool.
Figure 1. Scheme of steel pool.
Energies 16 04612 g001
There is no standardized test to be found in the ABS or DNV-GL. These pool dimensions were enough to avoid the contour effects with the side walls and the floor.
The gauges were placed on strips perpendicular to each other, installed at a height of 50 cm and halfway between the center of the pool and the side, as can be seen in Figure 2.
There were three tubes employed, with the following characteristics (Table 2):
Table 2 shows that the thicknesses chosen for this test achieved the restrictions given by the PISA test [26] (mentioned in Section 2.2.1). The thickness of the tubes can easily be found in factories, and the tubes chosen were not excessively large. In addition, the tubes were closed at one end. A flat position denotes where it is carried out using the closed side and a hollow position denotes where the driving is carried out using the open side.
The penetration speeds for the tests were different from the PISA project, where D/300 per minute and D/500 per minute were chosen. In our case, these speeds reproduced very long tests. Therefore, an estimate was made on the basis of the three diameters, and speeds of 5, 10 and 20 mm/min were obtained with test durations of 1 h, 30 min and 15 min, respectively [27].
The depth of the penetration was 325 mm. This length was sufficient to determine the mechanical behavior of the steel tube with the sand, and thus avoid contour effects. As the test was submerged, there was a thickness of water of 15 cm above the sand.

2.2.3. Scale Test

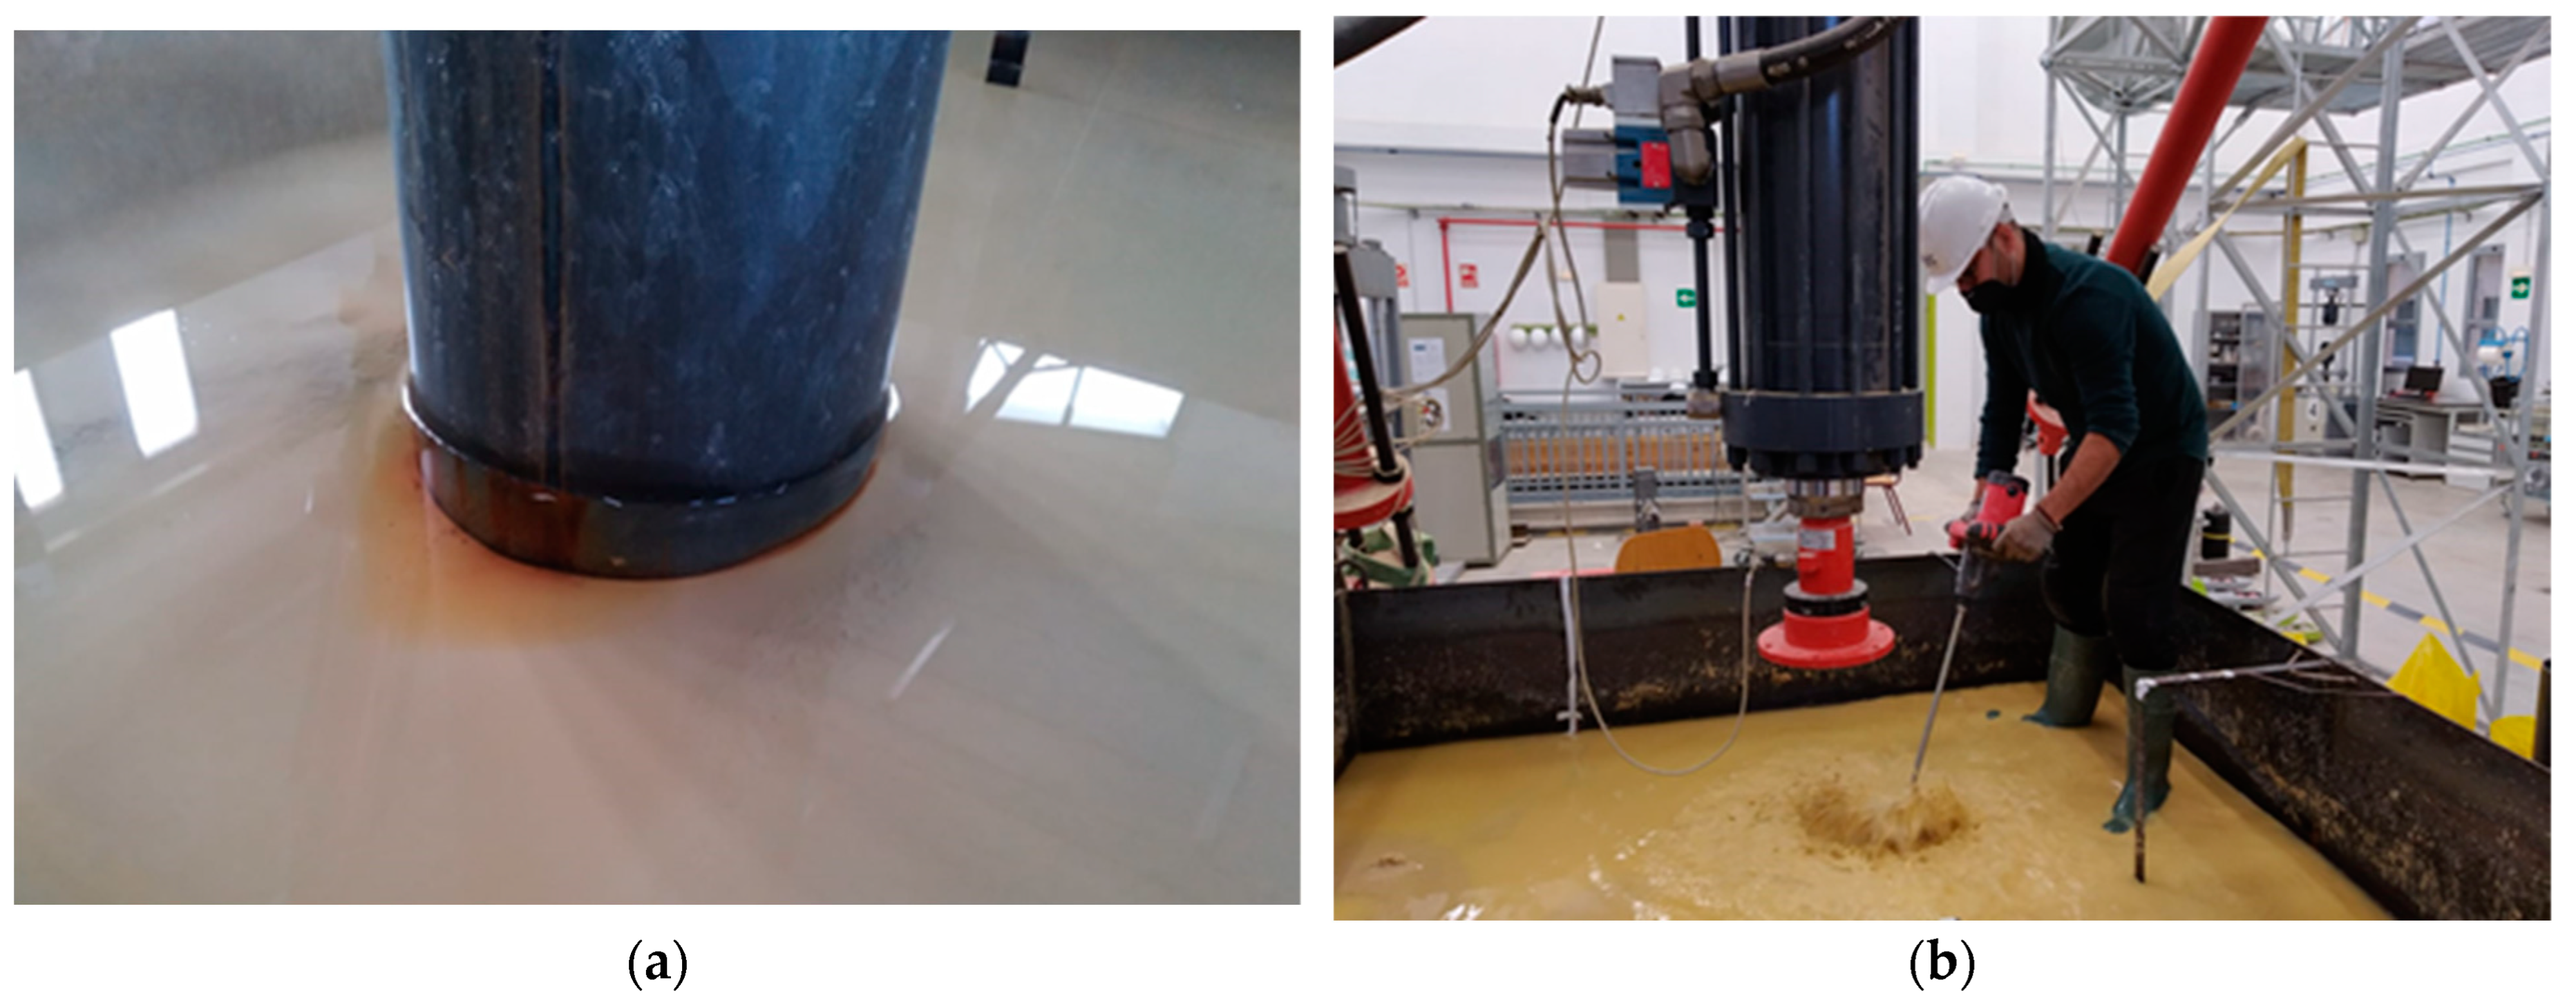
The test consisted of using a hydraulic press (Figure 3); the penetration of the steel tube into the sand was carried out. A distributor plate was placed on top of each tube to avoid eccentricities. The nomenclature used for each test was as follows: 5–10–20 mm/min (three speeds), 80–115–194 mm (three tube diameters) and H-F (hollow–flat) [9,28]. Each time a penetration was made, the soil was compacted. To solve this problem, a kneading machine was used to release the sand particles and loosen the soil (Figure 3b) [29].

2.2.4. Finite Element Modeling (FEM)

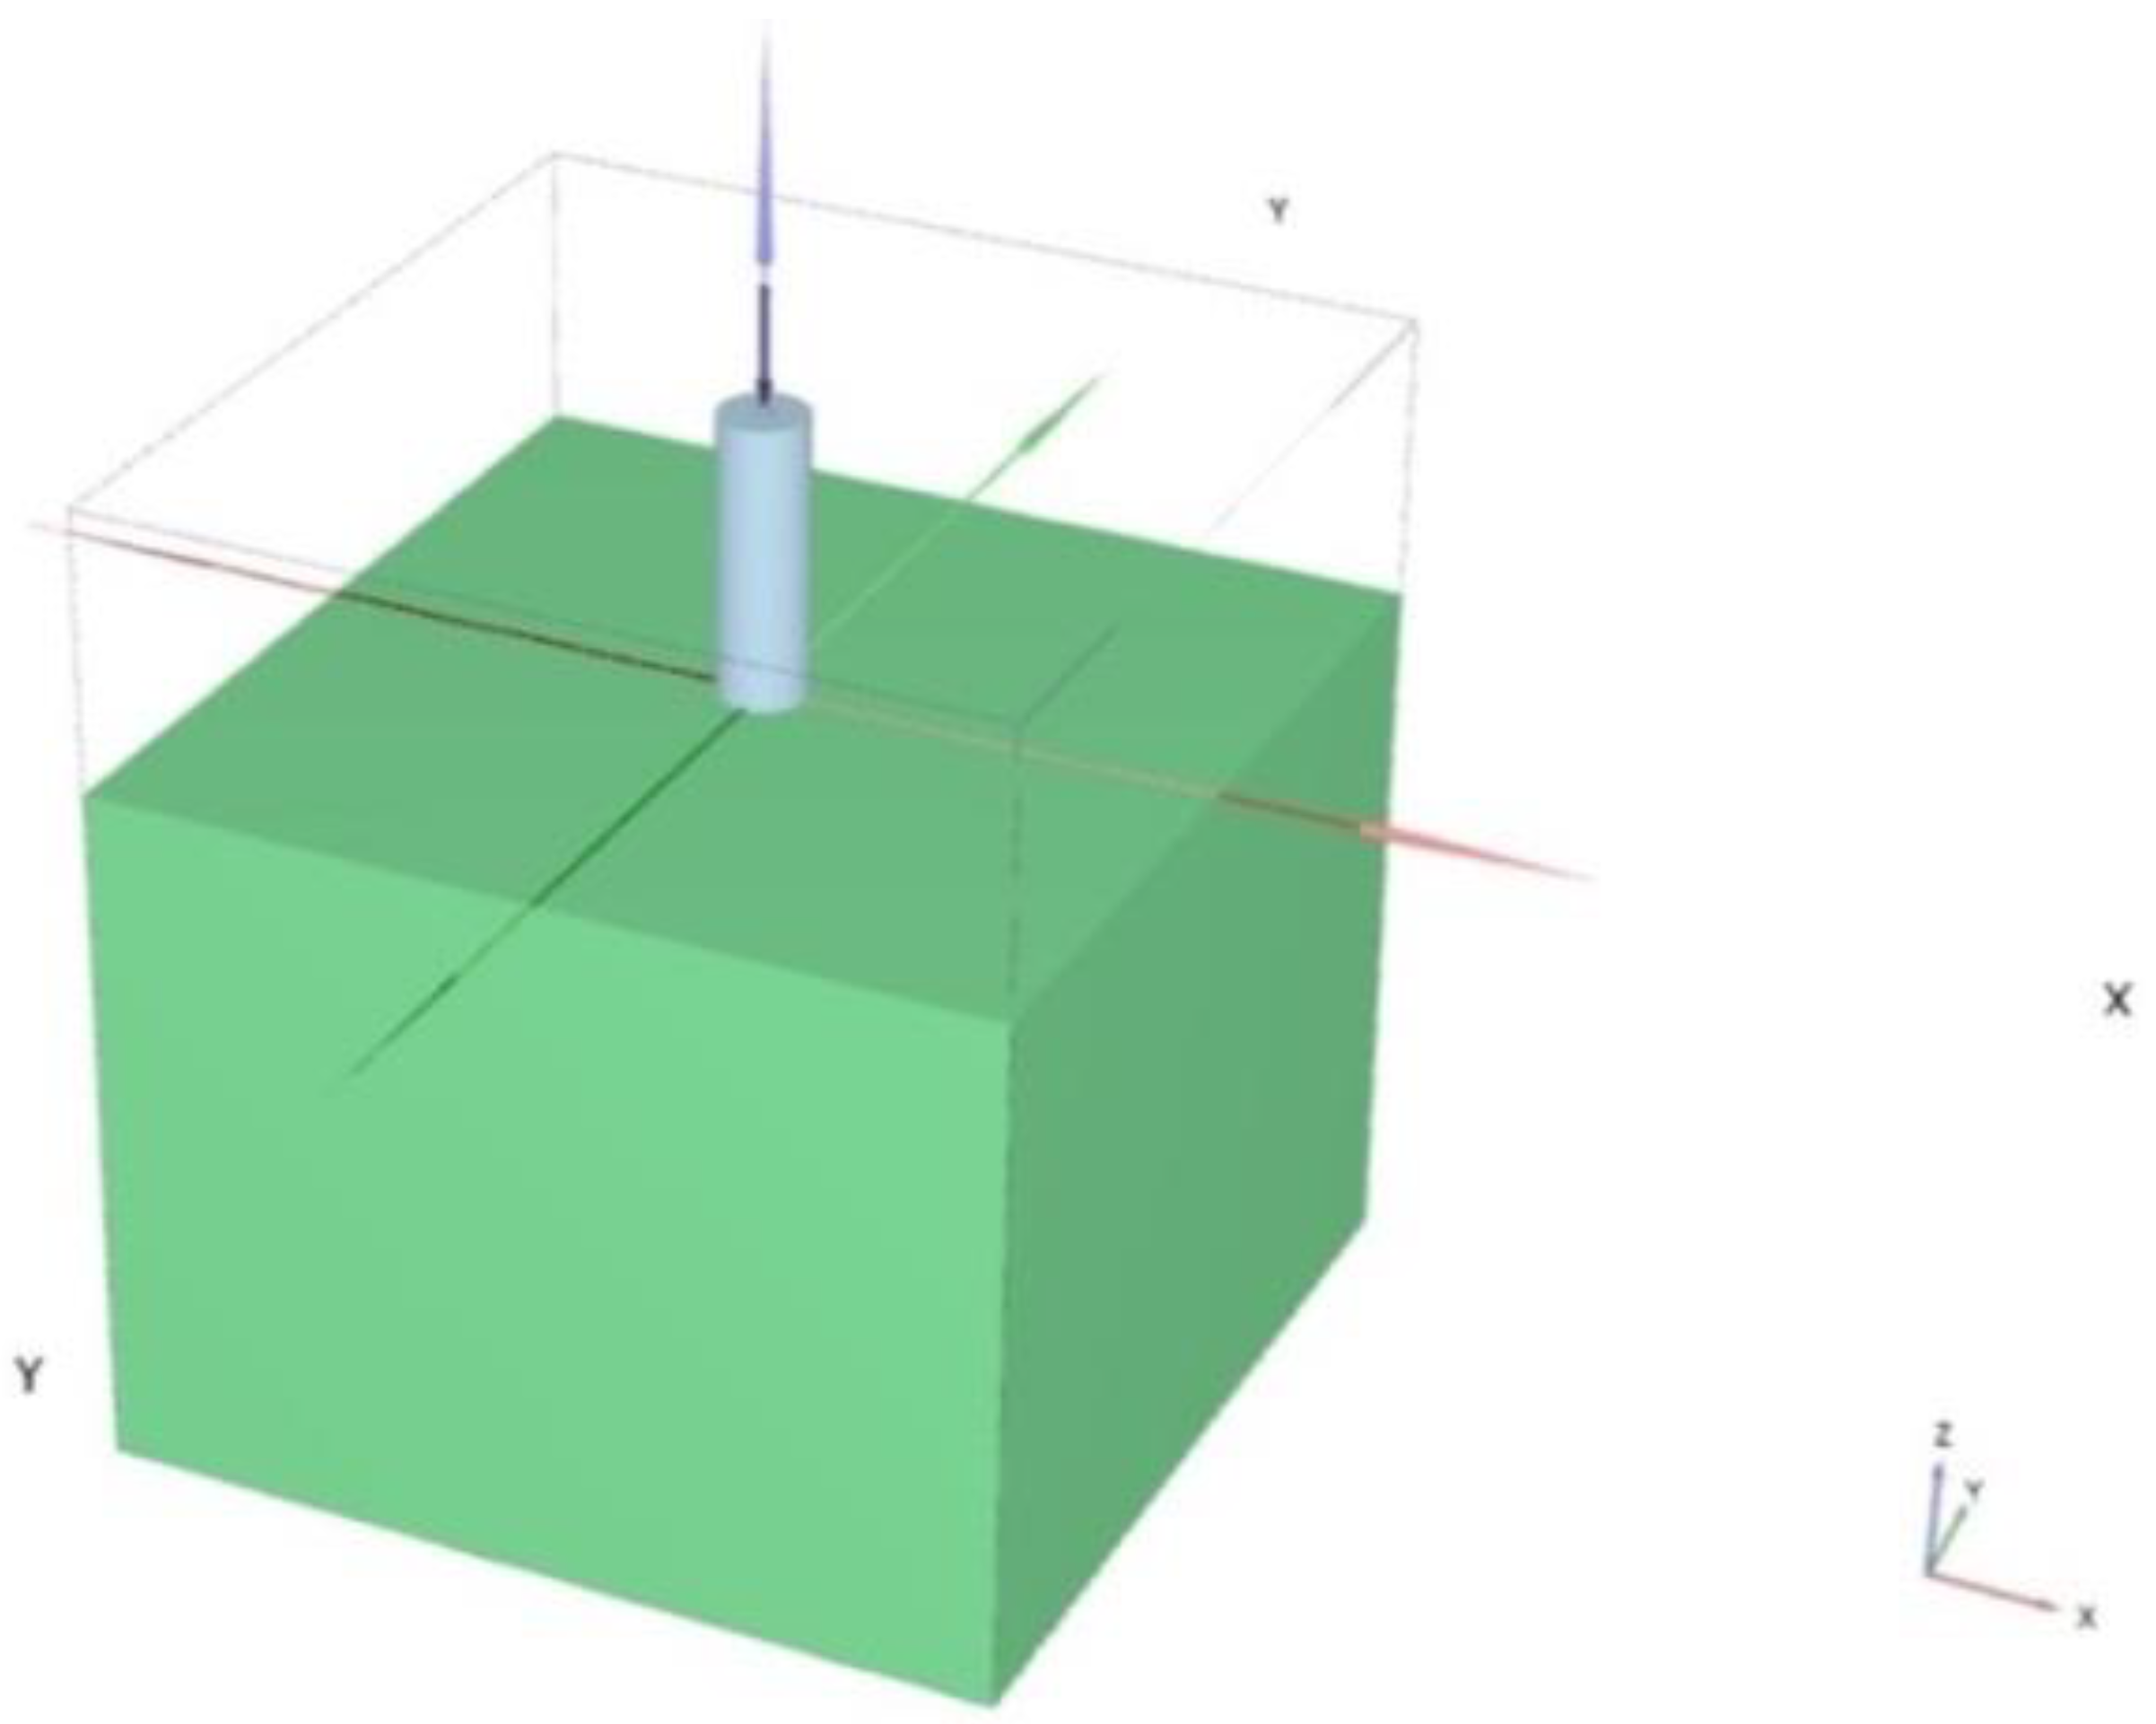
The tests carried out in the laboratory were modeled using Plaxis, a finite element software (release 2023.1.0.136). The aim was to compare the results obtained in the scale tests with those corresponding to the finite element models. The scale tests were measured by gauges inserted in frames in the ground. The dimensions of the model are the same as those used in the scale tests (2 × 2 × 1 m) (Figure 4). Two types of pile models were used in the scale tests: hollow and closed at the bottom. The pile material had the same mechanical and geometric characteristics as the one used in the tests. The calculation procedure was the one corresponding to prescribed displacements, applying displacement values between 0 and 30 cm with load steps of 5 cm. The average number of nodes in each case was 11,650, with an average size of each element of 0.2022 m and a minimum of 0.0402 m.
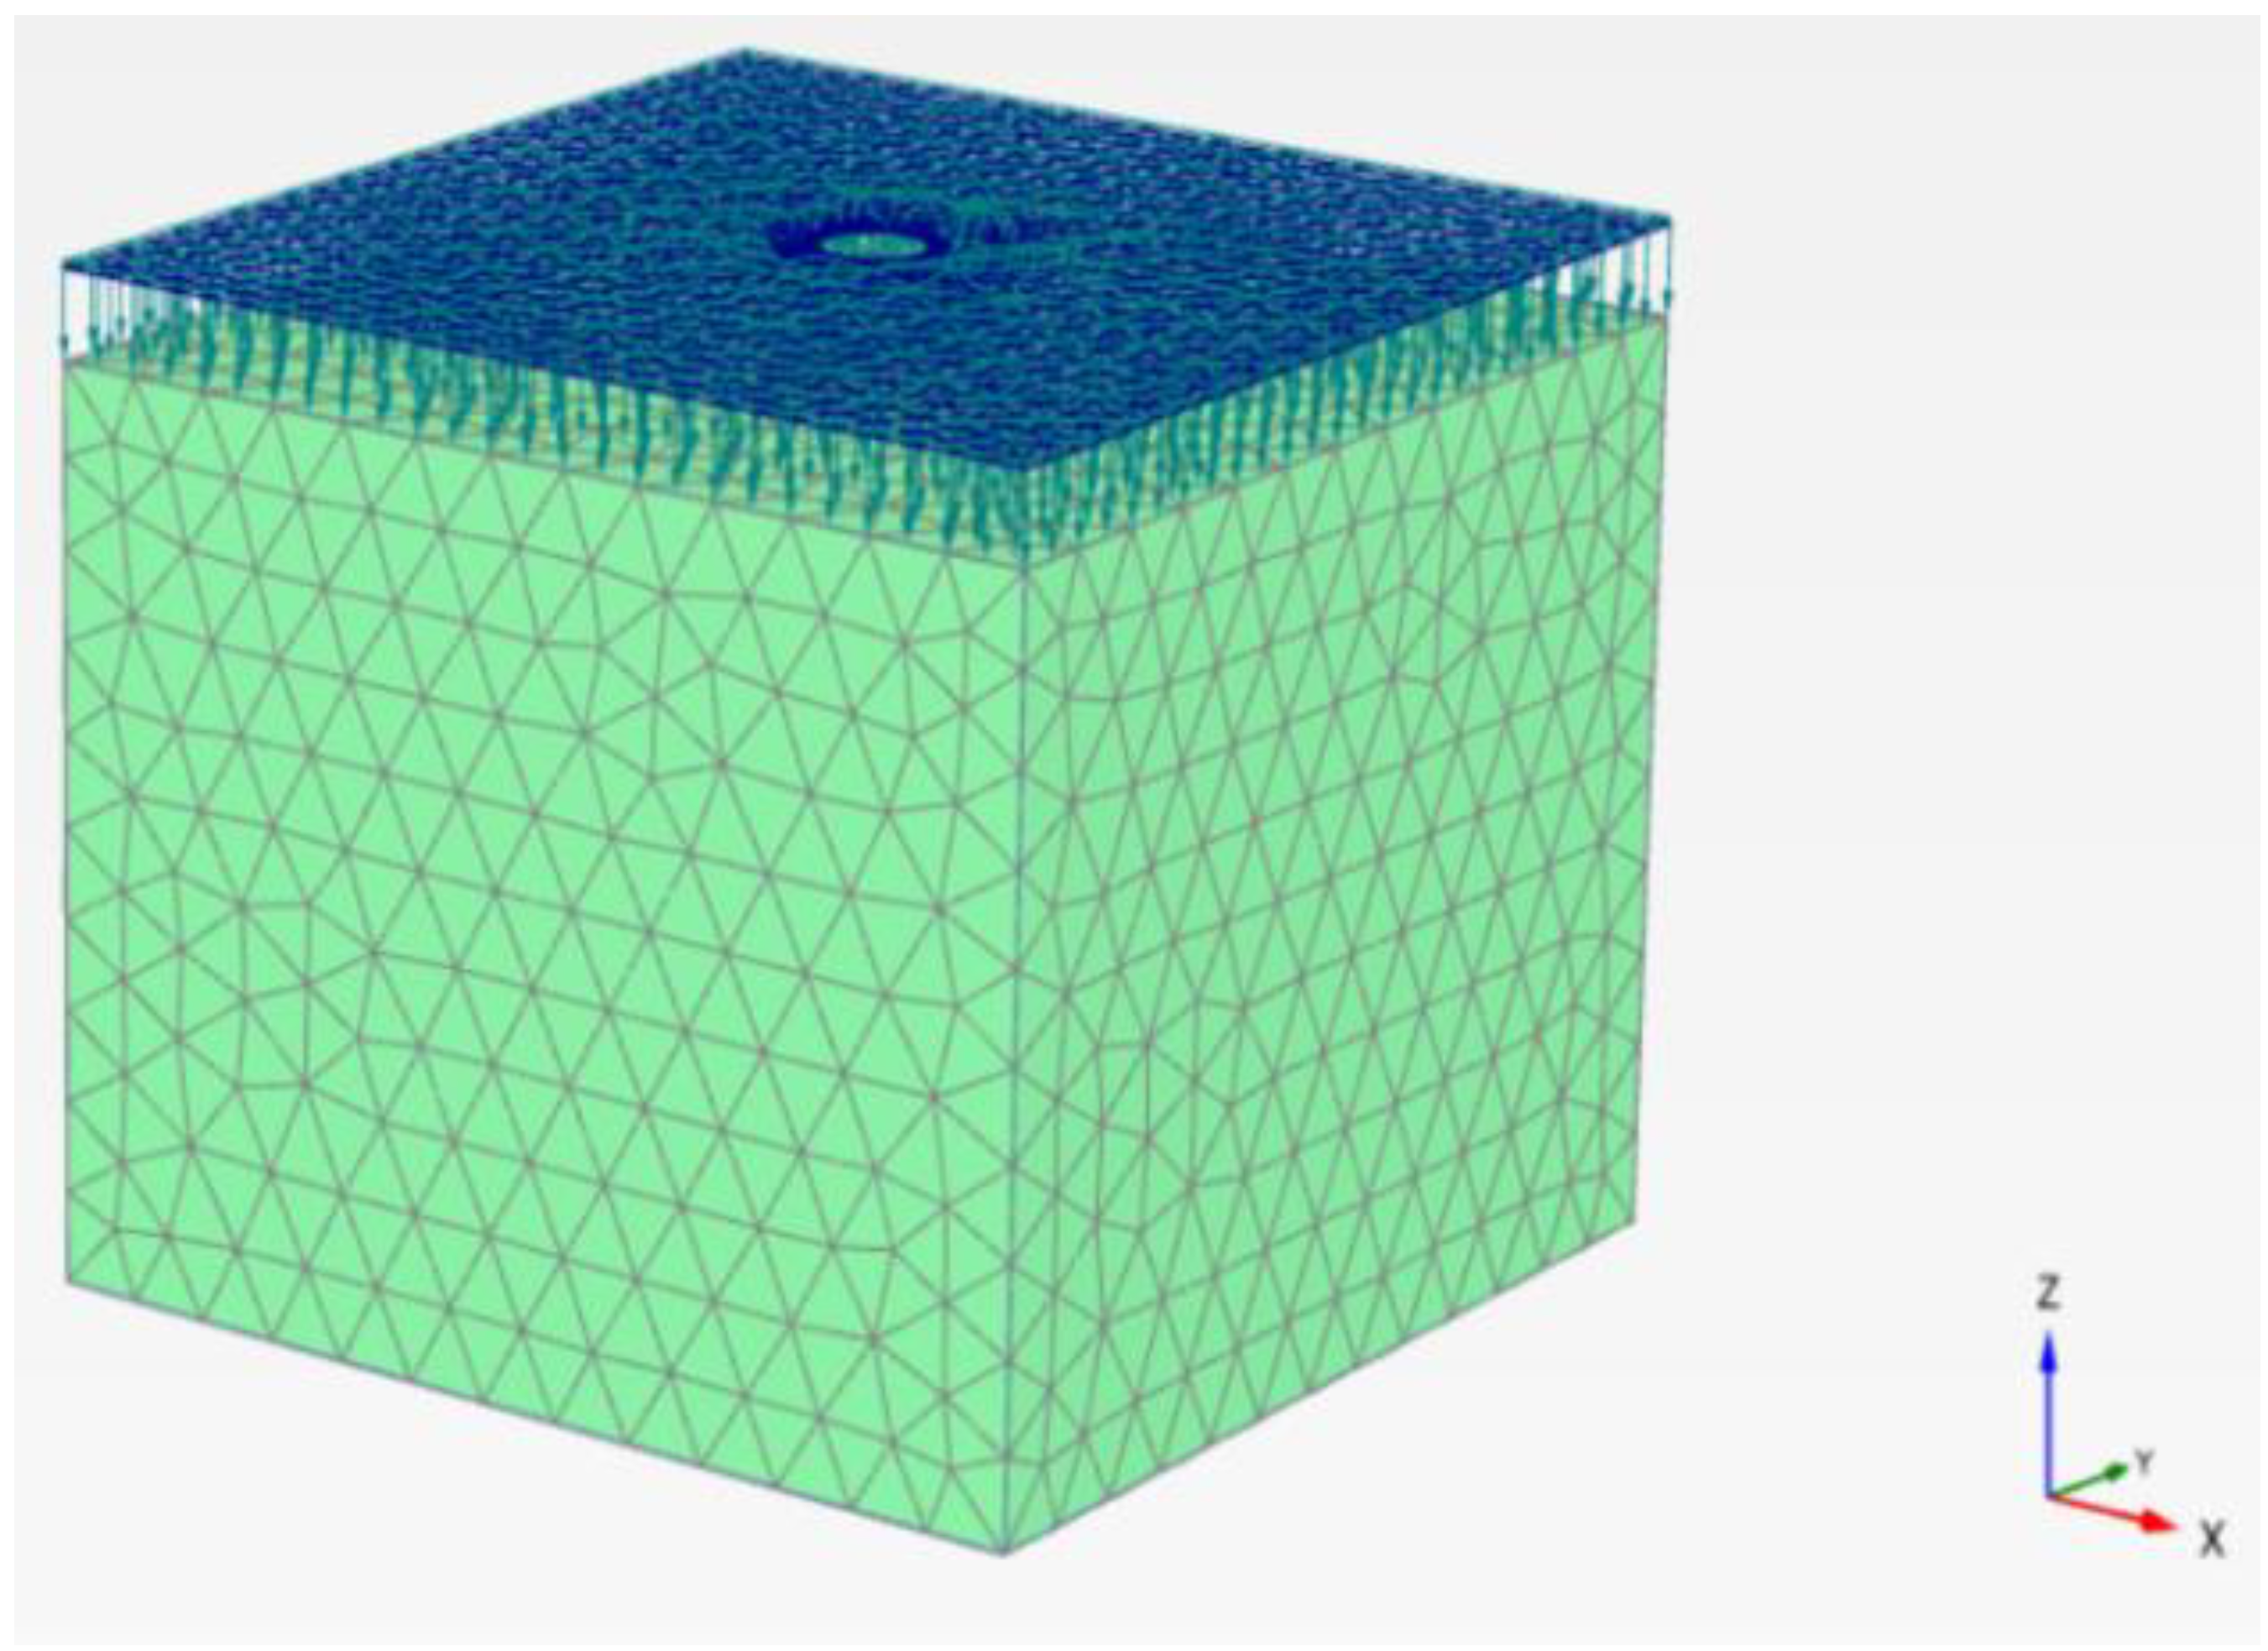
Two types of models were used: totally hollow and closed at the bottom, simulating the two fundamental procedures for driving existing piles. The existence of water was considered, as it appears in Figure 3 and Figure 5, with the mechanical and geometric parameters of the modeled elements being those used in the scale tests (see Table 1).
Once the tests were carried out, the results obtained in the in situ tests were compared with those corresponding to the finite element models. To carry this out, the nodes closest to the coordinates of the gauges in each of the models were selected, as can be seen in Table 3. This is the case of the flat tube model of 115 and 194 mm in diameter, in the dry and submerged tests. The positions of gauges 5 and 6 are not included because of reading errors occurring during the tests.

3. Results

3.1. Scale Submerged Tests

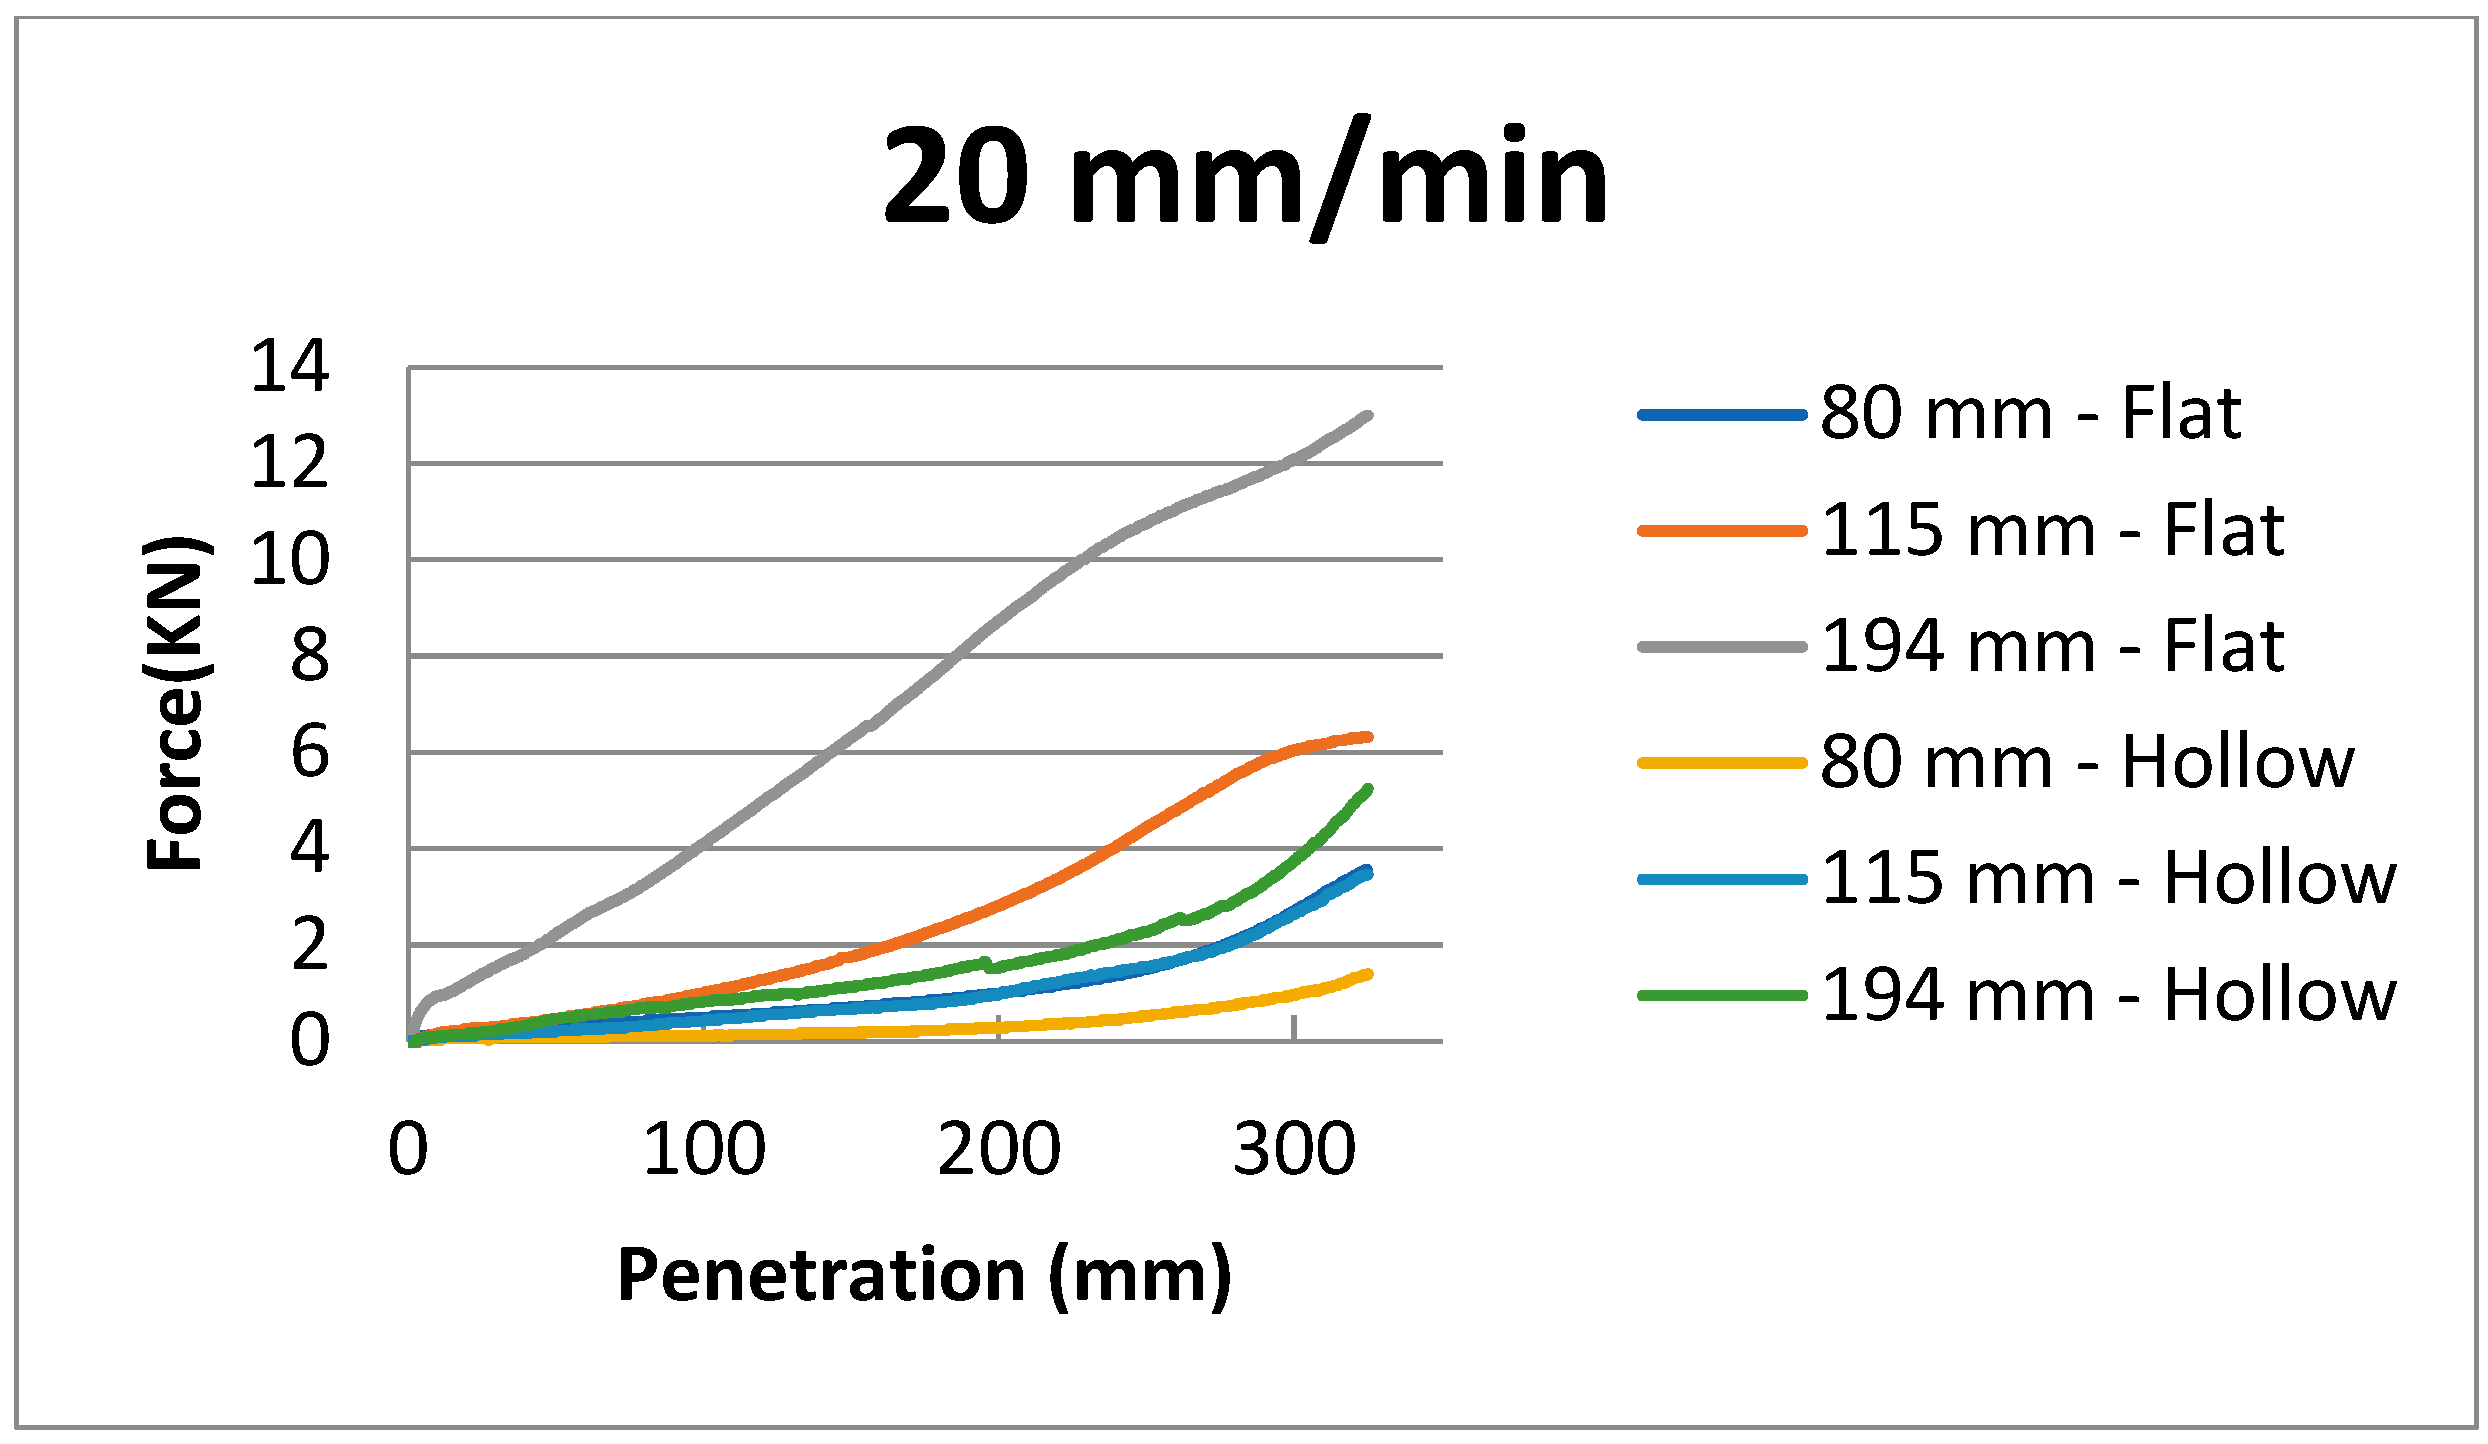
The results obtained in the 18 submerged tests are shown below. First, the comparison between the three tubes is shown for each velocity and type (H or F) (Figure 6, Figure 7 and Figure 8).
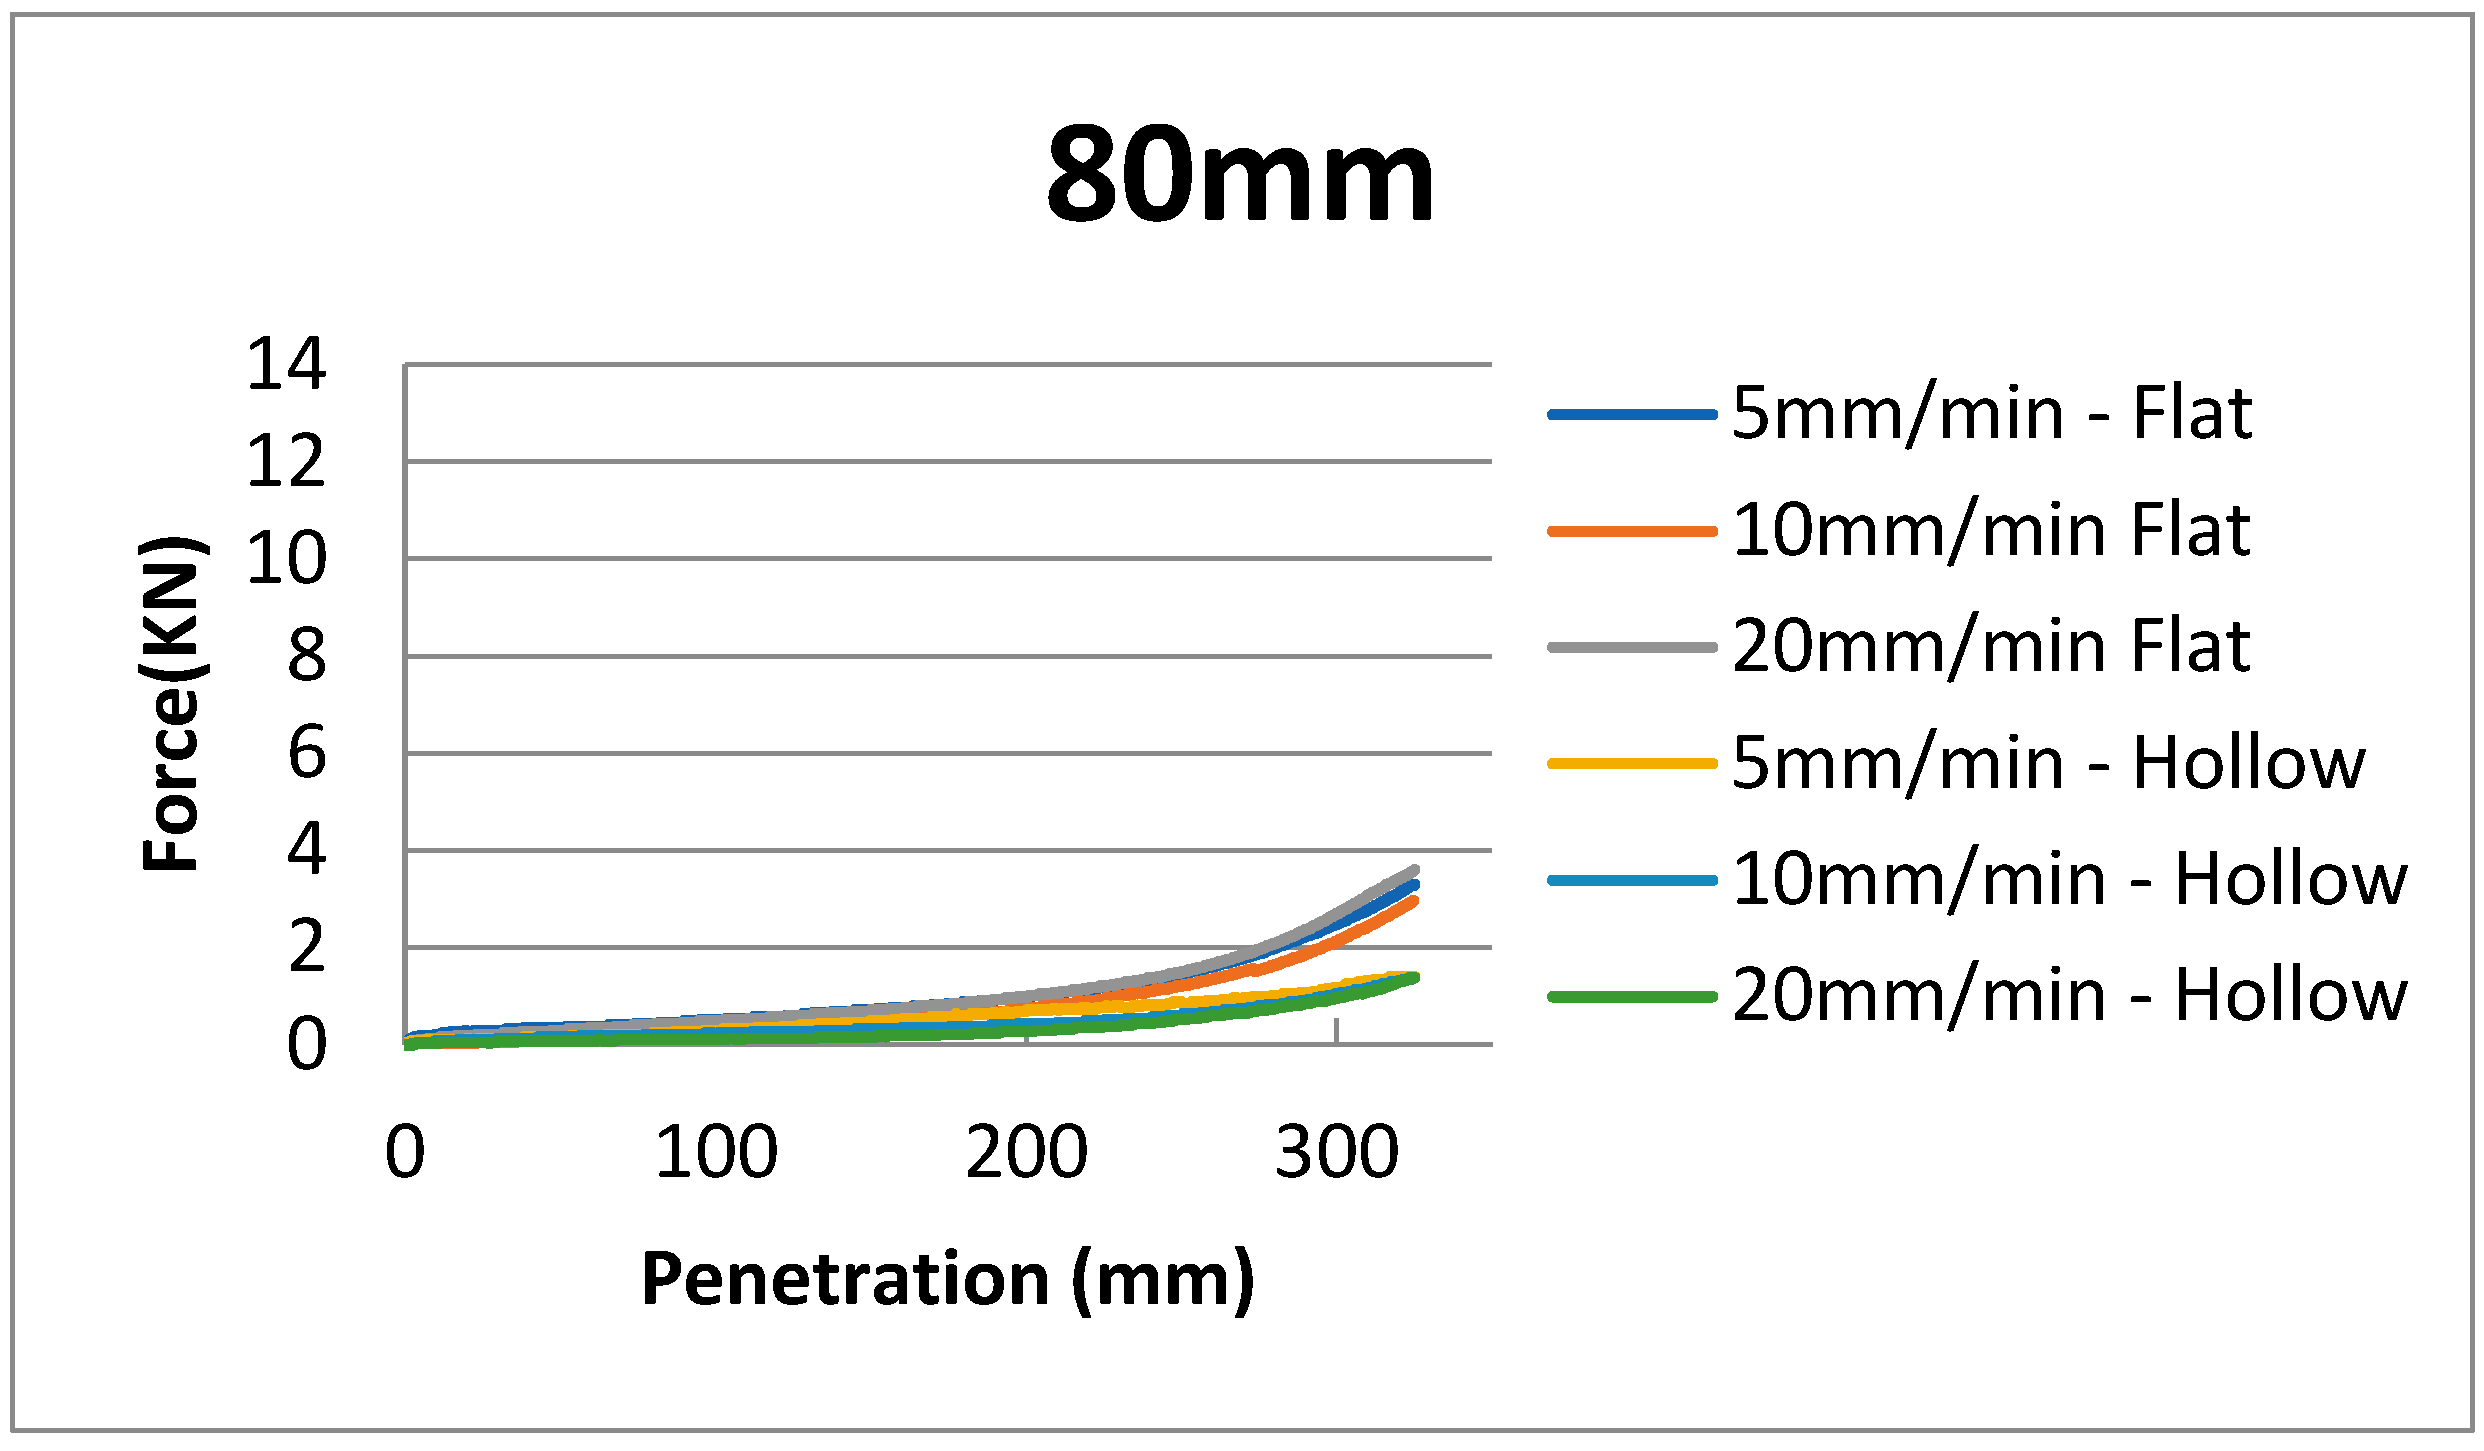
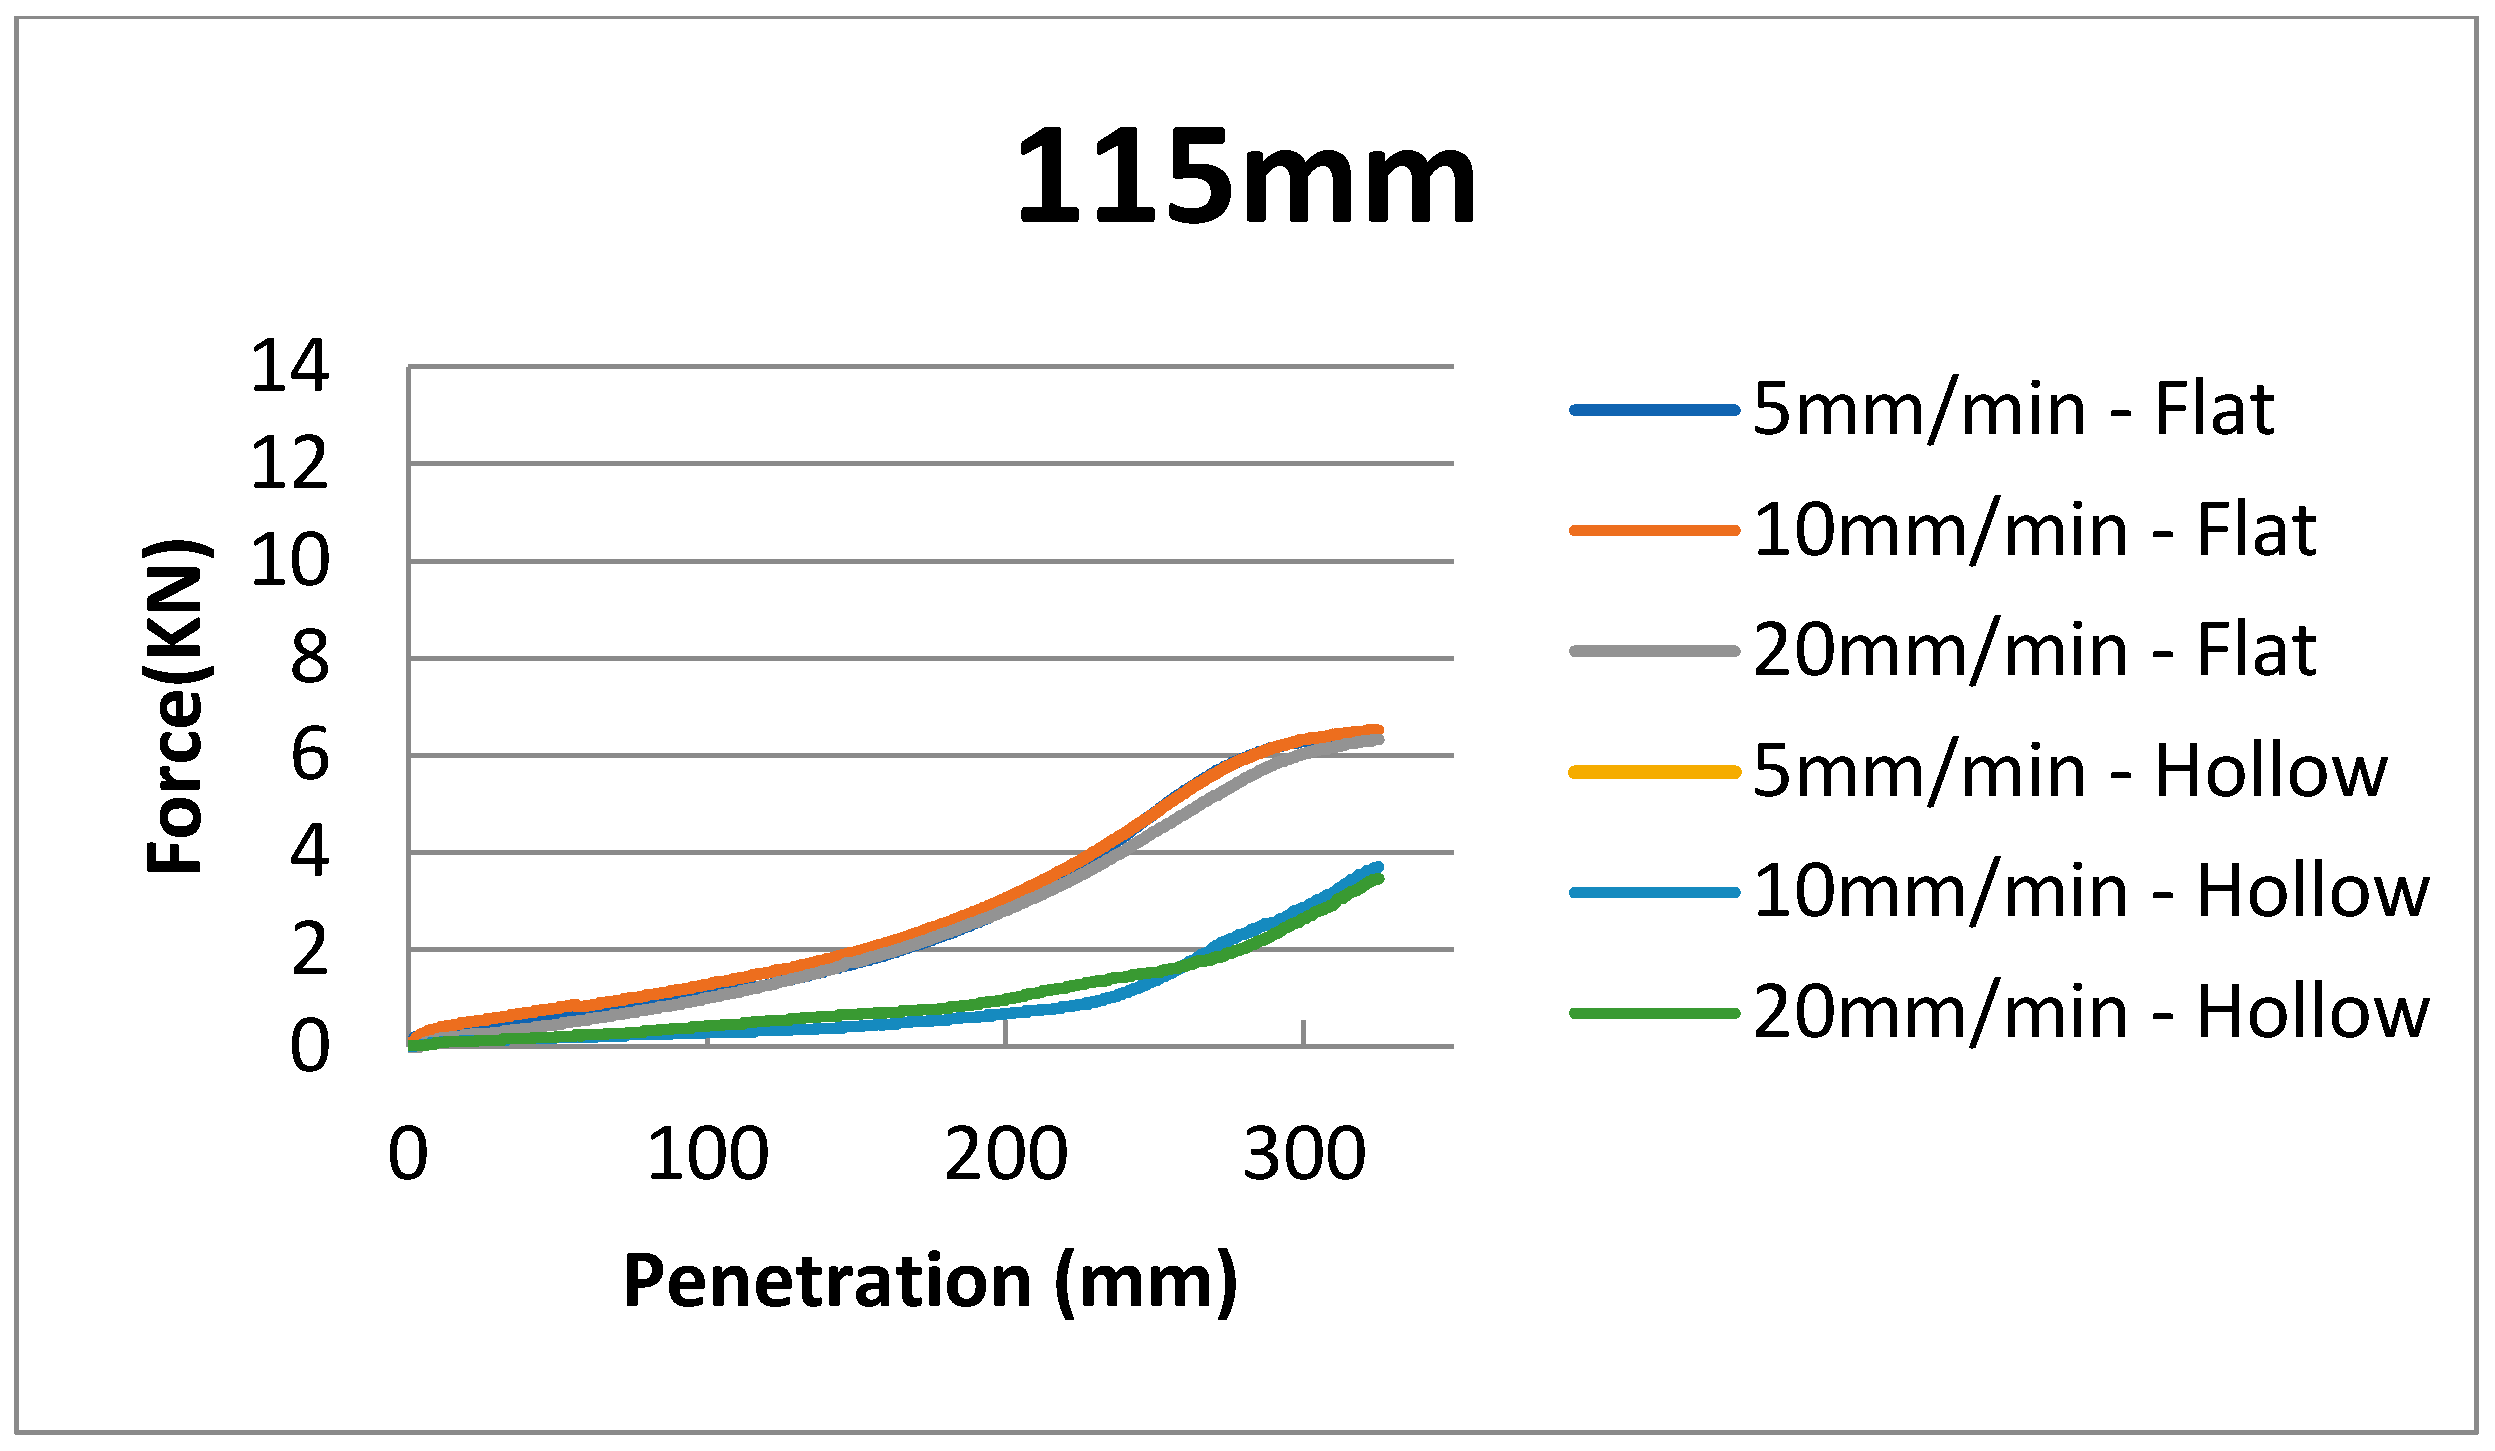
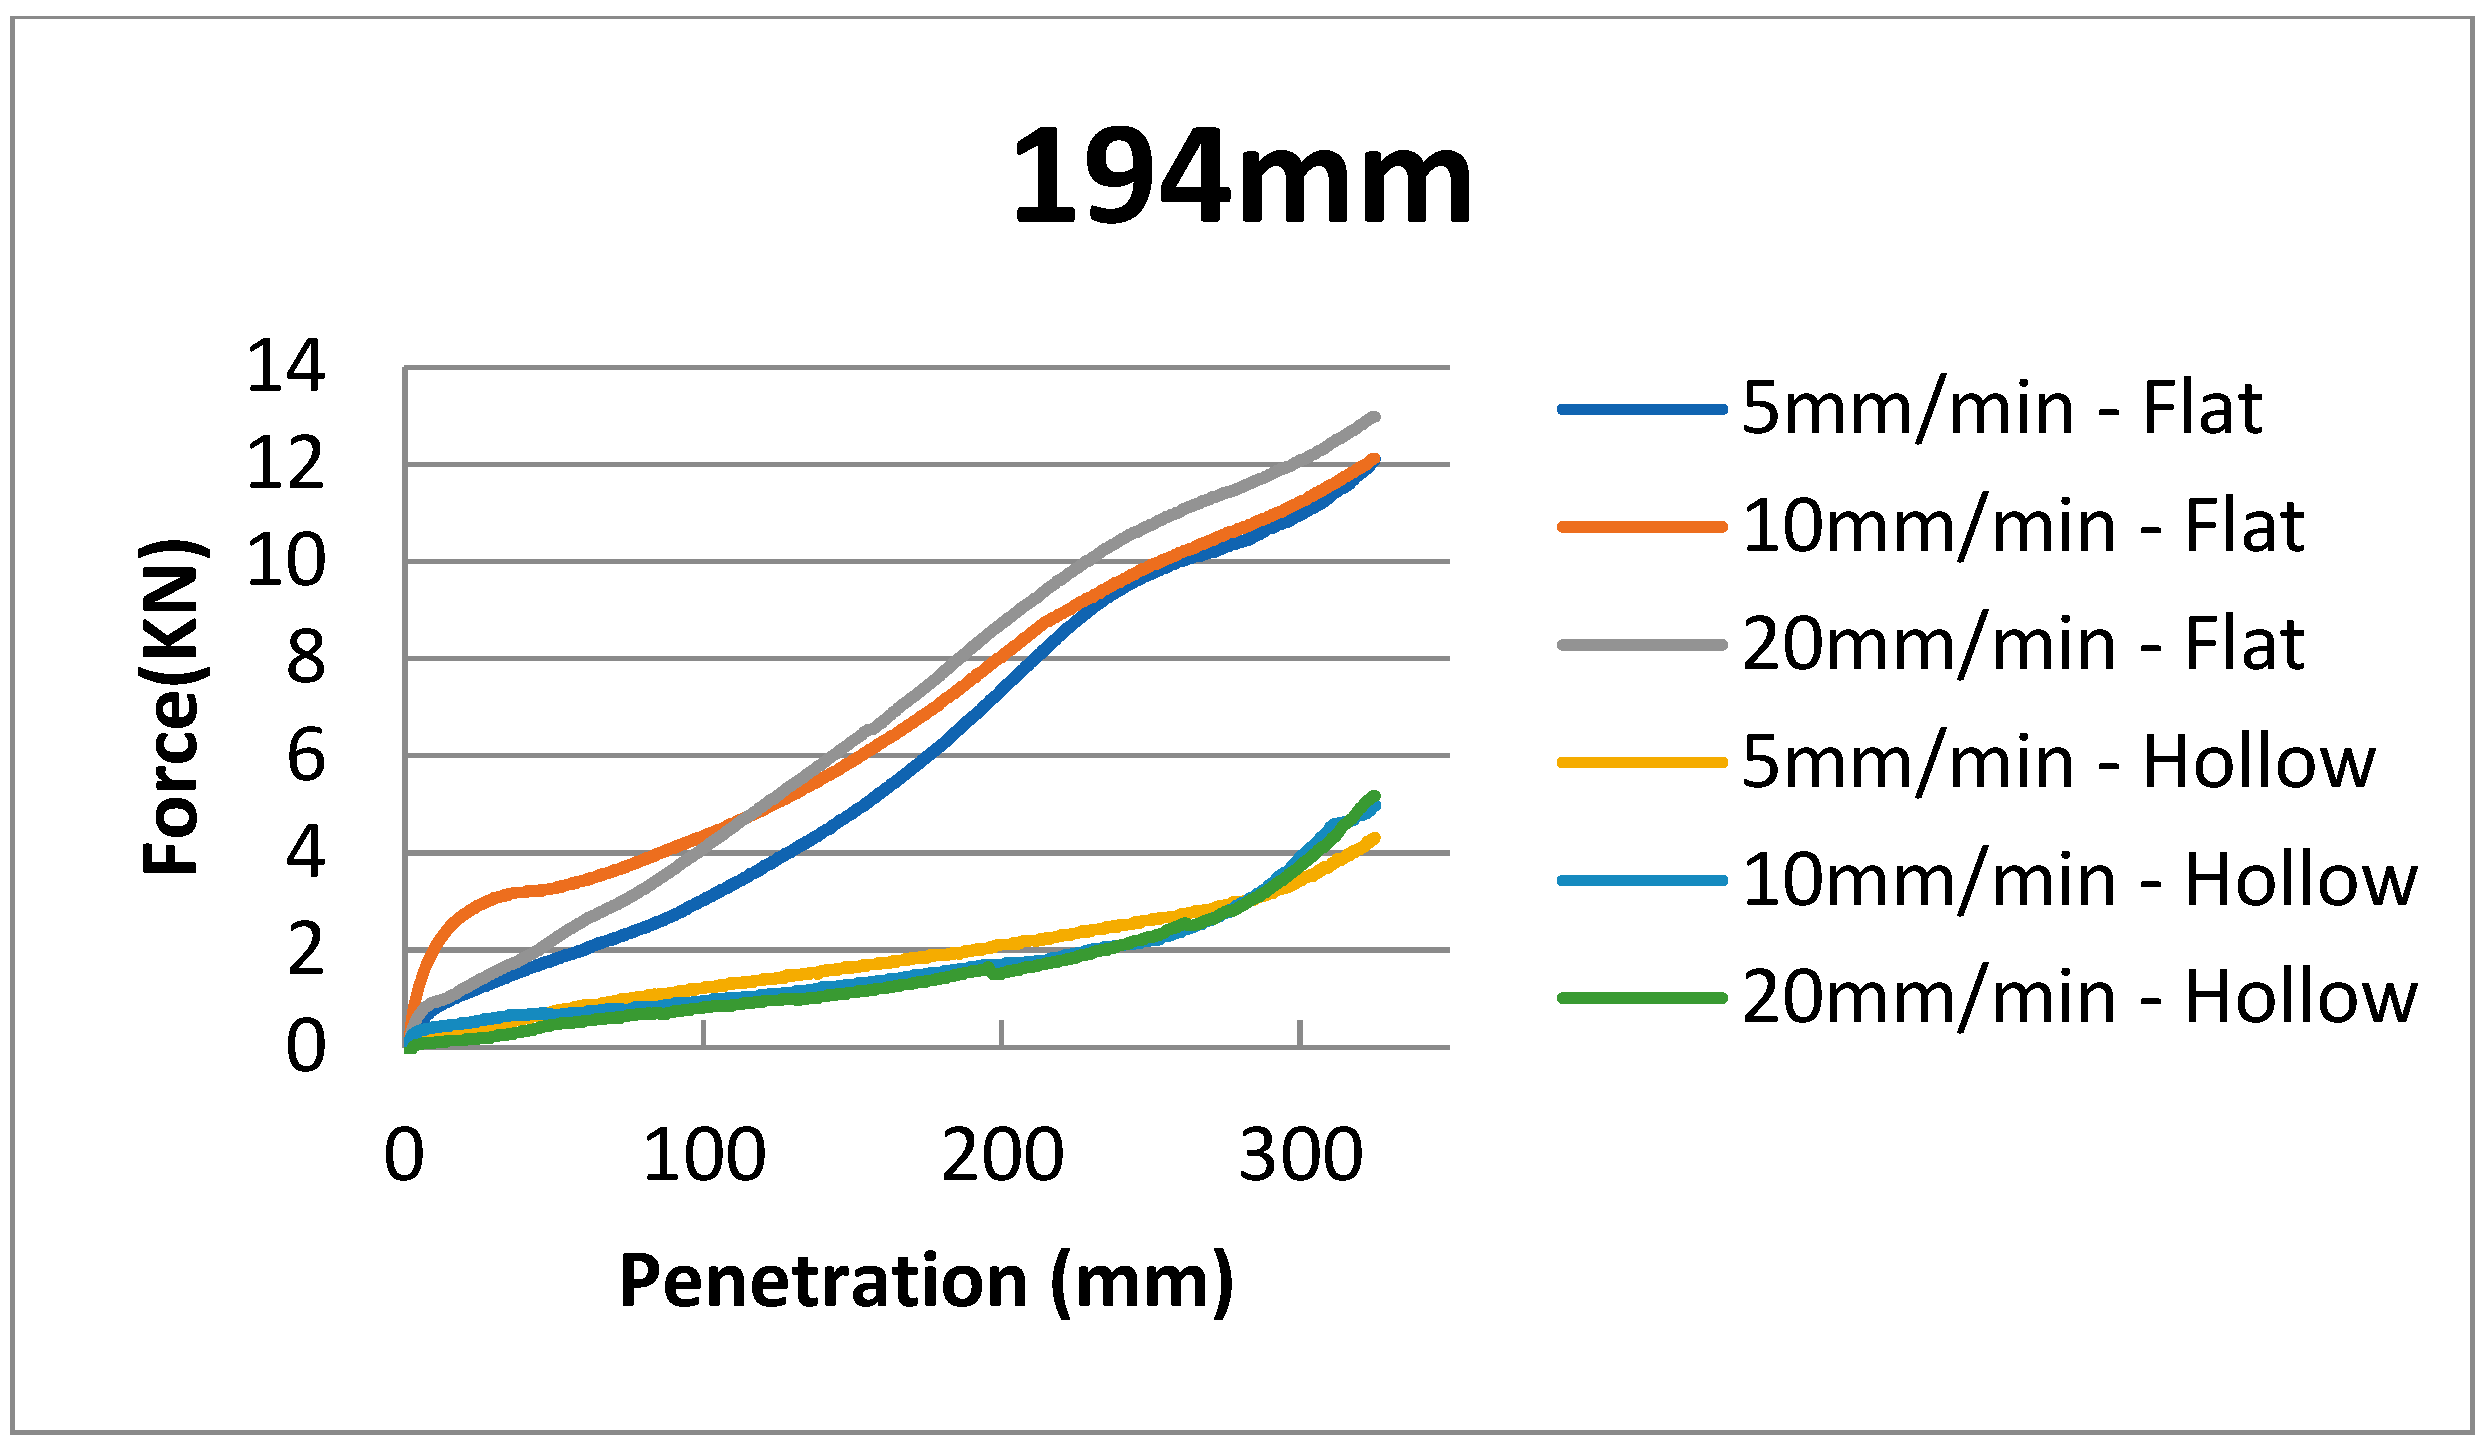
The comparison between the three velocities is shown for each tube and position (hollow or flat) in the graphs below (Figure 9, Figure 10 and Figure 11).
It was verified that when a greater diameter of the tube led to a greater penetration force, for the same tube, a higher penetration speed would lead to greater force. On the other hand, it was verified that for the same tube, a higher penetration speed would lead to greater force. However, it was shown that for the same tube, the driving force was practically the same for the different speeds.
For the case with a 194 mm diameter in the flat position, the maximum value of penetration force obtained was 12.98 kN, and for the case with a 80 mm diameter in the hollow position, the minimum value obtained was 1.38 kN.

3.2. Finite Element Models

The values obtained in the models show disparity of the results with respect to those obtained in the scale tests. The following Table 4, Table 5, Table 6 and Table 7 show a summary in the case of a tube closed at the bottom for the diameters of 115 and 194 mm in a dry and submerged conditions.
The results in the 80mm diameter tube, in the flat and hollow positions, were clearly affected by the scale factor between the diameter of the tube (with the corresponding thickness) and the granulometry of the soil in which it was located. Furthermore, the values were practically identical in the tests at different speeds for the different diameters, so only the most significant ones have been reflected, which correspond to the speed of 20 mm/min and diameters of 115 and 194 mm.
The order of magnitude is similar in the results, although in some cases, as in gauges 1 and 3 in the submerged test for both diameters, these are very close, with practically the same values between those obtained in the tests and those of the finite element models (ratio ≈ 100%, red line). Figure 12 shows the relationship between the values obtained in the tests with respect to the models for the same position of the gauges and the nodes.
However, the results obtained in the case of a hollow position in finite element models cannot be compared with those obtained in scale tests. There are differences in the measurements well above 500% (i.e., five times) in all of the gauges, as is the case in those corresponding to the closed tube of 80 mm.

4. Discussion

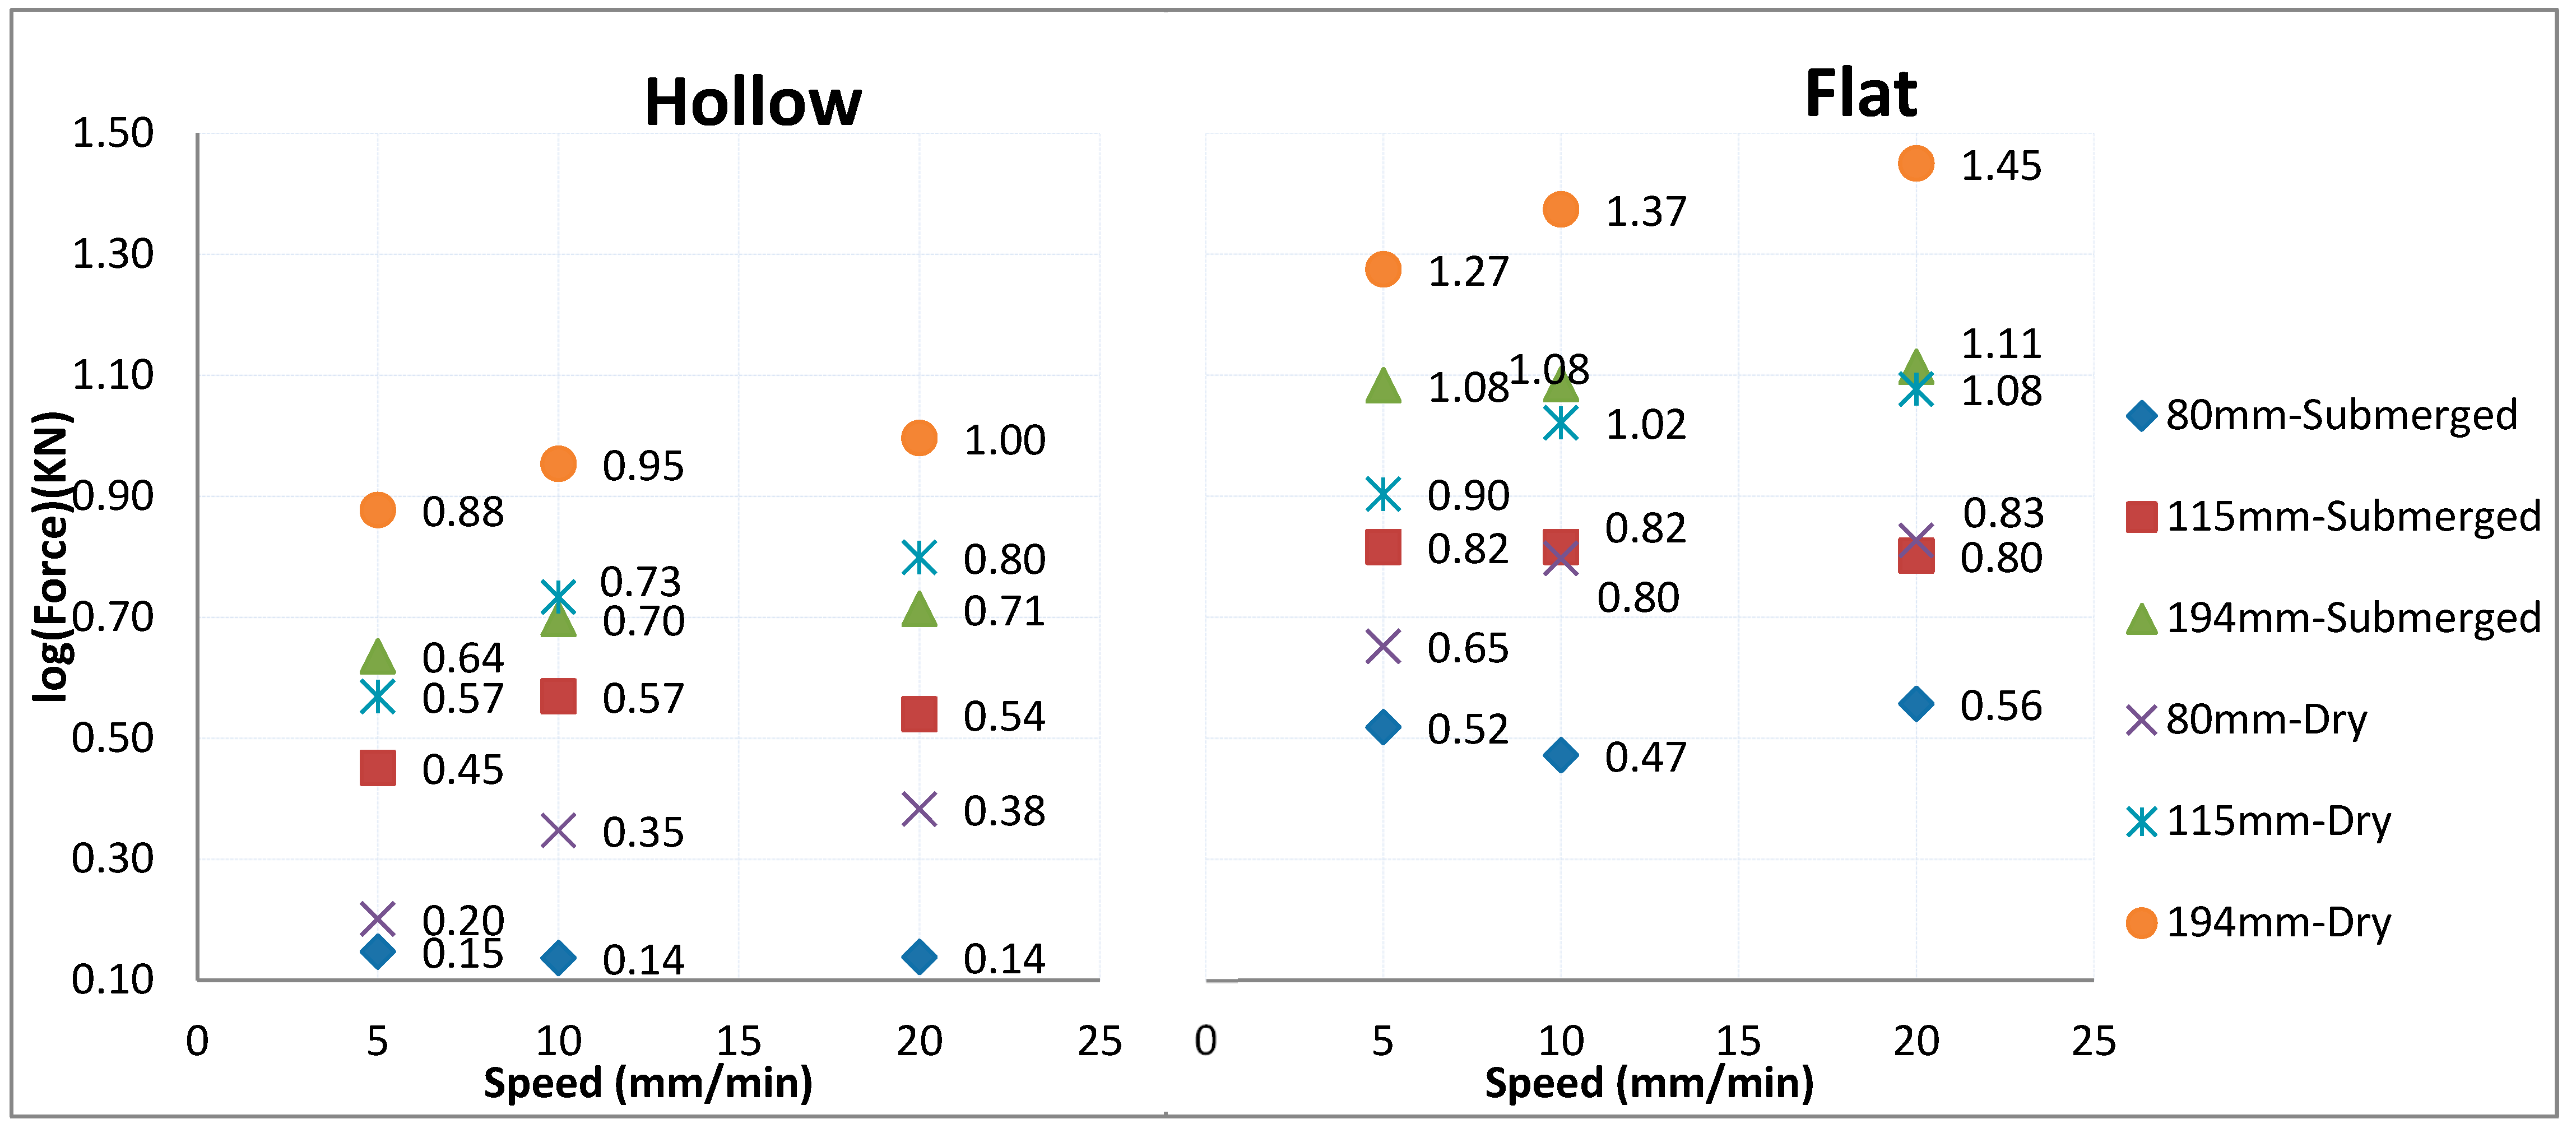
The results obtained across 325 mm of deformation are recapitulated in Figure 13 and Figure 14. These figures show the logarithm of the force for each tube and each type in the dry conditions [13] and submerged conditions.
For the y axis, a 10 logarithmic scale is used so that a good correlation of results can be observed since the values are very different.
Figure 13 shows the variation as a function of speed, with 0.9 or 1.31 greater values obtained at a speed of 10 mm/min and 0.97 or 1.23 greater values obtained at a speed of 20 mm/min with respect to 5 mm/min in submerged conditions.
Figure 14 instead shows the variation as a function of diameter, with 1.76 and 2.71 greater values obtained at a diameter of 115 mm and 3.08 and 4.10 greater values obtained at a diameter of 194 mm with respect to 80 mm in submerged conditions.
In this study, some of the results obtained previously were compared with those derived from the presence of water and their comparison with finite element models. The object of the study was to be able to optimize the driving procedure and the monopile elements, for which displacement measurements were carried out on the ground in the presence of water (the real situation of the monopile). This situation has not occurred before, since the tests in water show how the values of displacements obtained in the finite element models in dry material are much higher than the real ones.

5. Conclusions

5.1. Submerged Tests

Figure 13 shows that for the same tube, the driving force was practically similar for the different speeds to reach a penetration of 325 mm [30]. For example, for a tube in a hollow position with 80 mm diameter and a speed of 5 mm/min, a log10 force of 0.15 (1.40 kN) was obtained; in contrast, at a speed of 20 mm/min, a log10 force of 0.14 (1.38 kN) was obtained.
In addition, there were differences in the results obtained for the hollow and flat situations. For flat penetration, a greater force was required to achieve the same drive length, which is a vital factor to take into account when designing offshore structures. The ratio for a force in a flat position and a force in a hollow position is about 2 times.
In terms of diameter, for the 194 diameter, the increase in force in relation to the small diameter is 3.7 times. For the 115 tube, the ratio is 2 to 2.2 times. This ratio is very important for the estimation of penetration force values for larger-diameter tubes such as those used in offshore foundations.

5.2. Comparison between Dry and Submerged Tests

As can be seen in Figure 13 and Figure 14, the dry tests provide much higher values than the submerged tests. For example, for a diameter of 194 and a speed of 20 mm/min, a value of log10 force of 1 (9.91 kN) is required for dry testing and a log10 force of 0.71 (5.17) kN is required for submerged testing in a hollow position.
This is the most important conclusion. For a real study of driving offshore platform foundations, the presence of water is necessary. In addition, the presence of water improves the driving of the pile, which reduces the dimensioning of both the substructure and the offshore structure, as well as the elements and hammers necessary for driving it into the seabed.

5.3. Comparison Scale Tests with Finite Elements Models

The results show the feasibility of applying finite element models in the analysis of tests at the scale of pile driving, although some comments should be made regarding the results obtained.
The best results (194-CA and 115-CA) were produced in the models with the presence of water (a situation very similar to the real one that occurs in a marine environment during the process of driving the monopiles), and especially in gauges 1 and 3, with values very similar to those obtained in laboratory tests (81 and 102%; 104 and 98%, respectively). However, these values differed considerably in the cases of gauges 2 and 4 (23 and 19%; 32 and 22%, respectively). This situation is due to the physical location of the gauges, which, in the case of gauges 1 and 3, were perpendicular to the closed tube used in the test. In the cases of gauges 2 and 4, these were at an angle of 45° with respect to the closed tube used; this circumstance led to gauges 2 and 4 being located at much greater distances than those of gauges 1 and 3 with respect to the closed tube, specifically √2, resulting in much lower deformations, and therefore, displacements. The values obtained in the tests in the driving processes at different speeds were very similar to those presented in this section.
However, the displacement values in the cases of tests without water (194-SA and 115-SA) were clearly higher than those obtained in submerged tests in all gauges, as can be seen in Figure 12. This circumstance is due to the fact that the granular structure of the test ground, compacted by the weight of the material, is capable of transmitting the force due to the displacement of the material entirely during the process of driving the test tube. In the case of submerged tests, part of the force is assumed by the water, which transmits a lower horizontal force than the vertical force transmitted by the tube in the process of driving the test.
Furthermore, the results in the 80 mm diameter tube, in flat and hollow positions, were clearly affected by the scale factor between the diameter of the tube (with the corresponding thickness) and the granulometry of the soil in which it was located. Tests were carried out. For this reason, in subsequent studies, only the largest tube sizes will be used, in flat and hollow positions.
Finally, the feasibility of using finite element models to simulate the mechanical and deformational behavior of the ground in a simulated pile driving situation was demonstrated. The next step will be the optimization of the driving process to reduce the force (load) used, through the use of different execution procedures. This will make it possible to compare the results obtained through scale tests with the estimation of results in the finite element models.
Therefore, the most important conclusions are:
  • Results in submerged conditions are smaller than results in dry conditions;
  • Results in a flat position are more reliable than those in a hollow position;
  • Finite element models can be applied, since the results were consistent in simulating the same conditions as full-scale tests;
  • For the same tube, the driving force was practically the same for the different speeds.
The objective for the future is to be able to verify the results obtained in power plants in the sea, but we still do not have aid from companies or the state to be able to carry out these tests on a real scale because they are more expensive.

Author Contributions

Conceptualization, J.S.V.; Methodology, J.S.V. and A.F.; Software, J.G.B. and W.D.C.; Validation, J.S.V.; Formal analysis, J.G.B. and W.D.C.; Investigation, J.S.V. and A.F.; Resources, J.S.V. and A.F.; Writing—original draft, J.S.V.; Visualization, J.G.B. and W.D.C.; Supervision, J.G.B. All authors have read and agreed to the published version of the manuscript.

Funding

This research received no external funding.

Conflicts of Interest

The authors declare no conflict of interest.

References

  1. Luengo Frades, J.; Negro Valdecantos, V.; García Barba, J.; Soriano Vicedo, J.; Martín-Antón, M. Blue economy: Compatibility between the Increasing Offshore Wind Technology and the Achievement of the SDG. J. Coast. Res. 2020, 95, 1490–1494. [Google Scholar] [CrossRef]
  2. Lam, I.P.O. Diameter effects on p-y curves. In Deep Marine Foundations—A Perspective on the Design and Construction of Deep Marine Foundations, Proceedings of the Third International Symposium on Frontiers in Offshore Geotechnics (ISFOG 2015), Oslo, Norway, 10–12 June 2015; Deep Foundations Institute: Hawthorne, NJ, USA, 2013. [Google Scholar]
  3. Luengo Frades, J.; Negro Valdecantos, V.; García Barba, J.; Lopez Guiterrez, J.S.; Esteban, M.D. New detected uncertainties in the design of foundations for offshore wind turbines. Renew. Energy 2019, 131, 667–677. [Google Scholar]
  4. Zhang, X.; Liu, C.; Ye, J. Model Test Study of Offshore Wind Turbine Foundation under the Combined Action of Wind Wave and Current. Appl. Sci. 2022, 12, 5197. [Google Scholar] [CrossRef]
  5. DNVGL-ST-0126; Support Structure for Wind Turbines. Det Norske Veritas: Oslo, Norway, 2016.
  6. API. RP 2A-WSD—Recommended Practice for Planning, Designing and Constructing Fixed Offshore Platforms; American Petroleum Institute: Washington, DC, USA, 2010. [Google Scholar]
  7. Arroyo, M.; Abadías, D.; Alcoverrro, J.; Gens, A. Shallow foundations for offshore wind towers. In Proceedings of the 18th International Conference on Soil Mechanics and Geotechnical Engineering, Paris, France, 2–6 September 2013. [Google Scholar]
  8. Randolph, M.F. Science and empiricism in pile foundation design. Géotechnique 2003, 53, 847–875. [Google Scholar] [CrossRef]
  9. Bülow, L.; Jorgensen, L.; Gravessen, H. Kriegers Flak Offshore Wind Farm. Basic Data for Conceptual Design of Foundations; Vattenfall Vindkraft AB: Stockholm, Sweden, 2009. [Google Scholar]
  10. Lesny, K. Foundations for Offshore Wind Turbines: Tools for Planning and Design; VGE: Essen, Germany, 2010. [Google Scholar]
  11. Lesny, K. Design approaches of Eurocode 7 and their effect on the safety of shallow foundations, ICASP10. In Applications of Statistics and Probability in Civil Engineering; Taylor & Francis: Abingdon-on-Thames, UK, 2007. [Google Scholar]
  12. Passon, P.; Branner, K.; Larsen, S.E.; Hvenekær Rasmussen, J. Offshore Wind Turbine Foundation Design; DTU Wind Energy: Roskilde, Denmark, 2015. [Google Scholar]
  13. Soriano Vicedo, J.; García Barba, J.; Luengo Frades, J.; Negro Valdecantos, V. Scale Tests to Estimate Penetration Force and Stress State of the Silica Sand in Windfarm Foundations. Energies 2021, 14, 5904. [Google Scholar] [CrossRef]
  14. Byrne, B.W.; McAdam, R.; Burd, H.J.; Houlsby, G.T. PISA-New Design Methods for Offshore Wind Turbines. In Proceedings of the 8th International Conference, Royal Geographical Society, London, UK, 1 January 2017. [Google Scholar]
  15. Taborda, D.M.G.; Zdravkovi, L.; Kontoe, S.; Potts, D.M. Computational study on the modification of a bounding surface plasticity model for sands. Comput. Geotech. 2014, 59, 145–160. [Google Scholar] [CrossRef] [Green Version]
  16. Chow, F.C. Investigations into the Behaviour of Displacement Piles for Offshore Foundations. Ph.D. Thesis, Imperial College, London, UK, 1997. [Google Scholar]
  17. Jardine, R.J.; Standing, J.R.; Chow, F.C. Some observations of the effects of time on the capacity of piles driven in sand. Géotechnique 2006, 554, 227–244. [Google Scholar] [CrossRef]
  18. Guillen, J.; Hoekstra, P. The equilibrium distribution of grain size fractions and its implications for cross-shore sediment transport: A conceptual model. Mar. Geol. 1996, 135, 15–33. [Google Scholar] [CrossRef]
  19. Lopez, I.; Lopez, M.; Aragones, L.; García-Barba, J.; Lopez, M.P.; Sánchez, I. The erosion of the beaches on the coast of Alicante: Study of themechanisms of weathering by accelerated laboratory tests. Sci. Total Environ. 2016, 567, 191–204. [Google Scholar] [CrossRef] [PubMed]
  20. Klyuev, R.V.; Bosikov, I.I.; Gavrina, O.A. Use of wind power stations for energy supply to consumers in mountain territories. In Proceedings of the 2019 International Ural Conference on Electrical Power Engineering (UralCon), Chelyabinsk, Russia, 1–3 October 2019. [Google Scholar]
  21. UNE 103 401; Determinación de los Parámetros Resistentes al Esfuerzo Cortante de Una Muestra de Suelo en la Caja de Corte Directo (Determination of the Shear Resistant Parameters of a Soil Sample in the Direct Cutting Box). UNE: Madrid, Spain, 2019.
  22. UNE-EN ISO 17892-9:2019; Investigación y Ensayos Geotécnicos. Ensayos de Laboratorio de Suelos. Parte 9: Ensayos de Compresión Triaxial Consolidados en Suelos Saturados de Agua (Geotechnical Investigation and Testing—Laboratory Testing of Soil—Part 9: Consolidated Triaxial Compression Tests on Water Saturated Soils. Part 6: Determination of Particle Density and Water Absorption). Asociacion Espanola de Normalizacion: Madrid, Spain, 2019.
  23. UNE-EN 1097-6; Ensayos Para Determinar las Propiedades Mecánicas y Físicas de los Aridos. Parte 6: Determinacion de la Densidad de Partículas y la Absorción de Agua (Tests to Determine the Mechanical and Physical Properties of Aggregates). UNE: Madrid, Spain, 2022.
  24. UNE-EN 933-1; Ensayos para Determinar las Propiedades Geométricas de los Áridos (Tests to Determine the Geometric Properties of Aggregates). UNE: Madrid, Spain, 2012.
  25. UNE-EN ISO 6892-1:2020; Materiales Metálicos. Ensayo de Tracción. Parte 1: Método de Ensayo a Temperatura Ambiente (Metallic Materials—Tensile Testing—Part 1: Method of Test at Room Temperature). UNE: Madrid, Spain, 2020.
  26. Kelly, R.B.; Houlsby, G.T.; Byrne, B.W. A comparison of field and laboratory caisson tests in sand and clay. Géotechnique 2006, 9, 617–626. [Google Scholar]
  27. Butlanska, J.; Arroyo, M.; Gens, A.; O’Sullivan, C. Multi-scale analysis of cone penetration test (CPT) in a virtual calibration chamber. Can. Geotech. J. 2014, 51, 51–66. [Google Scholar] [CrossRef]
  28. Phuong, N.T.V.; Van Tol, A.F.; Elkadi, A.S.K.; Rohe, A. Numerical investigation of pile installation effects in sand using material point method. Comput. Geotech. 2016, 73, 58–71. [Google Scholar] [CrossRef]
  29. Jiang, M.J.; Harris, D.; Zhu, H.H. Future continuum models for granular materials in penetration analyses. Granul. Matter 2007, 9, 97–108. [Google Scholar] [CrossRef]
  30. Soriano Vicedo, J.; Luengo Frades, J.; García Barba, J.; Negro Valdecantos, V. Modified soil test for scour analysis on offshore windfarm foundations. Trans. Eng. Sci. 2019, 125, 185–194. [Google Scholar]
Figure 2. Distribution of gauges.
Energies 16 04612 g002
Figure 3. Phases of project: (a) testing a pile of 80 mm in submerged conditions; (b) sand decompressing.
Energies 16 04612 g003
Figure 4. Model of pool in Plaxis.
Energies 16 04612 g004
Figure 5. Model with water to simulate marine conditions.
Energies 16 04612 g005
Figure 6. Force and penetration at velocity of 5 mm/minute.
Energies 16 04612 g006
Figure 7. Force and penetration at velocity of 10 mm/minute.
Energies 16 04612 g007
Figure 8. Force and penetration at velocity of 20 mm/minute.
Energies 16 04612 g008
Figure 9. Force and penetration at diameter of 80 mm.
Energies 16 04612 g009
Figure 10. Force and penetration at diameter of 115 mm.
Energies 16 04612 g010
Figure 11. Force and penetration at diameter of 194 mm.
Energies 16 04612 g011
Figure 12. Relationship between the values obtained in the tests with modeling values.
Energies 16 04612 g012
Figure 13. Values of all scale tests. Variation between speeds.
Energies 16 04612 g013
Figure 14. Values of all scale tests. Variation between speeds.
Energies 16 04612 g014
Table 1. Summary of the main characteristics of material test.
Mechanical and Granulometric Characteristics of the Sand
Granulometric AnalysisDensity TestDirect Shear TestTriaxial Shear Test
Grain Diameter (D50)Uniformity Coefficient (Cu)Coefficient of Curvature (Cc)DensityFriction Angle (ϕ)Cohesion (c)Young’s Modulus (E)
0.769 mm2.9351.3672.626 g/cm334.08°0 kg/cm221,570 kN/m2
Table 2. Tube characteristics and PISA conditions.
Dimensions (mm)T1T2T3
Total length910700600
Entered length450375350
Diameter19411580
Thickness433
3 < E, length/diam < 102.33.264.06
30 < Diam/thick < 8048.538.326.7
Table 3. Gauge position (scale test) and node position (FEM).
GAUGE POSITIONNODE POSITION
AXISGAUGEX (m)Y (m)Z (m)194-Submerged194-Dry115-Submerged115-Dry
X1−0.50−0.554121412171037103
X2−0.50.5−0.556956695672257225
Y300.5−0.57064706440304030
Y4−0.50.5−0.56956695699519951
Table 4. Displacements to scale test and FEM to 194 mm and submerged conditions.
194-SubmergedGauge_1Gauge_2Gauge_3Gauge_4
NODE4121695670646956
Force (kN)0.6960.6960.6960.696
Nodal Displacement9.1090 × 10−52.2710 × 10−57.2610 × 10−52.7160 × 10⁻⁵
Real Displacement7.4124 × 10−55.1947 × 10−67.4124 × 10−55.1947 × 10⁻⁶
Table 5. Displacements to scale test and FEM to 194 mm and dry conditions.
194-DryGauge_1Gauge_2Gauge_3Gauge_4
NODE4121695670646956
Force (kN)5.8245.8245.8245.824
Nodal Displacement2.5250 × 10−47.2110 × 10−52.7760 × 10−46.5070 × 10⁻⁵
Real Displacement6.2026 × 10−44.3469 × 10−56.2026 × 10−44.3469 × 10⁻⁵
Table 6. Displacements to scale test and FEM to 115 mm and submerged conditions.
115-SubmergedGauge_1Gauge_2Gauge_3Gauge_4
NODE7103722540309951
Force (kN)0.2970.2970.2970.297
Nodal Displacement1.2800 × 10−56.8590 × 10−63.2340 × 10−59.9330 × 10⁻⁶
Real Displacement1.3312 × 10−52.2167 × 10−63.1631 × 10−52.2167 × 10⁻⁶
Table 7. Displacements to scale test and FEM to 115 mm and dry conditions.
115-DryGauge_1Gauge_2Gauge_3Gauge_4
NODE7103722540309951
Force (kN)2.1702.1702.1702.170
Nodal Displacement8.3450 × 10−53.2190 × 10−58.0750 × 10−53.8550 × 10⁻⁵
Real Displacement2.3110 × 10−41.6196 × 10−52.3110 × 10−41.6196 × 10⁻⁵
Disclaimer/Publisher’s Note: The statements, opinions and data contained in all publications are solely those of the individual author(s) and contributor(s) and not of MDPI and/or the editor(s). MDPI and/or the editor(s) disclaim responsibility for any injury to people or property resulting from any ideas, methods, instructions or products referred to in the content.