Article

Multi-Degree-of-Freedom Load Reproduction by Electrohydraulic Digital-Servo Loading for Wind Turbine Drivetrain

1
The State Key Laboratory of Fluid Power and Mechatronic Systems, Zhejiang University, Hangzhou 310027, China
2
Ocean Academy, Zhejiang University, Zhoushan 316021, China
3
Nanjing High Accurate Marine Equipment Co., Ltd., Nanjing 211100, China
*
Authors to whom correspondence should be addressed.
Energies 2023, 16(12), 4659; https://doi.org/10.3390/en16124659
Submission received: 10 May 2023 / Revised: 5 June 2023 / Accepted: 9 June 2023 / Published: 12 June 2023
(This article belongs to the Section A3: Wind, Wave and Tidal Energy)

Abstract

:
Many drivetrain testing facilities have been built to reproduce multi-degree-of-freedom loads, thus simulating real wind conditions for evaluations of the reliability and durability of turbine subsystems. In this paper, the electrohydraulic schemes for the non-torque loading of a wind turbine’s drivetrain test benches are first analyzed. To deal with the control inaccuracy caused by the drastically increasing loading force, along with the rapid development of large-scale wind turbines, a multi-cylinder electrohydraulic digital-servo loading (MEDSL) technology is proposed. A novel electrohydraulic digital-servo cylinders group is designed. The proposed MEDSL can provide continuous and accurate load recurrence under wider wind conditions by varying the operational area of the cylinders group. Moreover, a sliding mode controller (SMC) is designed to realize the large dynamic loading of the MEDSL system. By comparing the SMC to a traditional PID controller in a servo-valve controlled cylinder, both simulation and experiment results proved the advantage of the proposed SMC. Accordingly, extensive experiments with a 4-cylinder case were carried out on a real full-loading bench using the SMC-based MEDSL device. The excellent tracking performance under complicated signals that represent the real wind loads demonstrated the feasibility and effectiveness of the proposed MEDSL technology and the SMC method.

1. Introduction

The global installed wind power capacity constantly increased during the last decade. The additional installations of 93.6 GW in 2021 have expanded the worldwide cumulative capacity of wind power generation to 837 GW [1]. The largest offshore wind turbine is the MySE16.0-242 with an unprecedented 16 megawatts (MW) nameplate capacity, which was launched by MingYang Smart Energy in 2021 [2]. It is predicted that, by 2025, wind turbines with a single capacity of 20 MW will be available [3,4]. The development of wind turbines is geared towards being large-scale with the increasing demand for renewable energy.
However, concerning this trend, the complexity of construction, operation, maintenance, and inspection has increased because tower heights, rotor radius, and overall weights have amplified in size and capacity [5]. Larger wind turbines tend to have more frequent structural collapses and component failures, and they require higher maintenance costs [6]. Thus, it is necessary to accurately reproduce the specified wind loads on the ground at the pre-production prototype phase to evaluate the reliability and durability of turbine subsystems.
As the growing scale of wind turbines sets corresponding high requirements on the drivetrain testing system, many countries have built national six degree-of-freedom (DOF) ground test facilities for the drivetrain of large wind turbines. The establishment of a 4 MW wind turbine test bench was initiated in 2014 by the Center for Wind Power Drives located at RWTH Aachen University [7,8]. A non-torque loading (NTL) system and a driving motor were utilized as a load application system to replace the rotor of the wind turbine. A hardware-in-the-loop (HiL) system was integrated as a mechanical-level component to simulate the effect of the rotor at the test bench. Through a series of tests involving the model depth and wind field characteristics within the HiL-System, it was concluded that the certification measurements could feasibly be performed on system test benches [9]. Additionally, the control effect was realized by the coordinate transformation of a geometric model. Besides, Germany’s Fraunhofer Dynamic Nacelle Testing Laboratory combined mechanical and grid emulators to test wind turbines up to 10 MW [10].
In America, the 7.5 and 15 MW wind turbine drivetrain test benches have been conducted at Clemson University [11]. The load application units featured in the 15 MW test bench display the capacity to apply thrust forces extending up to ±4000 kN, radial forces up to ±8000 kN, and bending moments reaching ±50,000 kNm all at a frequency of 1 Hz [12]. A sliding mode controller (SMC) was developed on the overactuated system to replicate the full-scale time-varying wind loads of the 7.5 MW test bench. The maximum nominal error is approximately 25 kN forces and 25 kNm moments, or roughly 5% of the requested signals’ amplitude for a specific test profile [13]. Bibo et al. provided a comprehensive assessment of the uncertainty and inaccuracies in applied loads and measured responses, as well as their significance relative to established predefined limits for repetition for a drivetrain exposed to both static and dynamic loads on the 7.5 MW test bench [14]. The experimental results were applied to evaluate the tracking error on the test bench and the cross-coupling occurring between bending moments and forces [15]. The maximum tracking error for the commanded inputs was about 7%, which was the nodding moment [16]. Additionally, by joining the Duke Energy eGRID Center, it was possible to apply realistic loads concurrently to both the mechanical and electrical interfaces of a complete nacelle [17,18].
For the UK, the Offshore Renewable Energy (ORE) Catapult is at the forefront of drivetrain testing, validation, innovation, and research. They have a 15 MW drivetrain testing bench for offshore wind turbine systems with 6 DOF loading. The highly accelerated lifetime testing, power curve, efficiency assessment, and grid compliant tests were carried out to validate and enhance the advanced and complex wind turbine powertrain systems [19]. The National Renewable Energy Center in Spain devised and erected a test bench capable of examining the drivetrain and electrical components of wind turbines reaching up to 8 MW. The powertrain test bench was intended for conducting accelerated durability examinations of mechanical constituents, as well as functional evaluations of high-speed shaft brakes, generator bearings, and high-speed shaft couplings [20].
In Denmark, Lindø Offshore Renewable Center (LORC) Nacelle Testing included three test facilities, the 14 MW, 16 MW, and 25 MW test benches. The 25 MW test facility, installed in January 2021, could supply a torque of 32 MNm, 85 MNm tilt-moment, and 65 MNm yaw moment. The facility offered testing of the drivetrain components up to 16–18 MW, as well as functionality test of nacelles up to about 20 MW [21]. The development of a powertrain and gearbox test bench with a capacity of 30 MW is currently underway by Danish wind turbine testing expert R&D Test Systems. Upon completion, the test bench will host the most potent validation test rig for wind turbines. The machine’s capabilities will allow it to imitate the variety of wind forces that a nacelle powertrain may encounter during its lifespan. Expected to be delivered in 2024, the test bench is hoped to enhance product durability, as well as expedite time to market [22].
Although these aforementioned wind turbine test benches were constructed, and they performed certification activities, the loading design, operating principle, and control strategy were not fully published. Additionally, the dynamics and potential of the loading actuators were not comprehensively addressed. Since the torque simulator of wind turbine has been studied [23], the critical research lies in simulating the other five DOF loads, akin to those encountered during standard operations or severe wind occasions. Yin et al. proposed a loading system and decomposition strategy to accurately simulate five DOF loads. The mean absolute percentage error of five DOF loads could be well kept within 6.6% [24]. However, the advanced control strategy was not involved, and experimental conditions were not fully detailed. Furthermore, when it is applied to the NTL for larger-scale wind turbines, many problems, such as tracking error and response speed, will be exposed. Some co-simulation has been studied for servo valves. A numerical approach was proposed for the multi-domain physical problem of the valve [25]. The particle swarm algorithm was applied to the design optimization of a solenoid actuator [26], and the design of experiments was developed [27]. However, it is difficult to achieve downward compatibility, namely, it can be difficult to realize high-accuracy, as well as quick and continuous loading, for each capacity class.
Aiming to solve the cons mentioned above, the NTL structural schemes were first introduced and analyzed. To deal with the problem of control inaccuracy caused by the drastically increasing loading force along with the rapid development of wind turbines of ten MW-class, a novel multi-cylinder electrohydraulic digital-servo loading (MEDSL) technology was proposed for each loading point. Combined with applying a SMC to the servo-valve controlled (SVC) cylinder, the loading accuracy of the MEDSL was well performed. The results of the simulations and experiments showed the advantages of the MEDSL.
This paper is organized as follows. Three main NTL structural schemes are introduced in Section 2. In Section 3, the structure of the MEDSL technology and the modified loading principle are represented. In Section 4, the effect of the proposed SMC strategy is studied, based on AMESim and SIMULINK co-simulation. In Section 5, experiments of the MEDSL with SMC have been displayed and exhibited encouraging results. Section 6 discusses the conclusion and outlook.

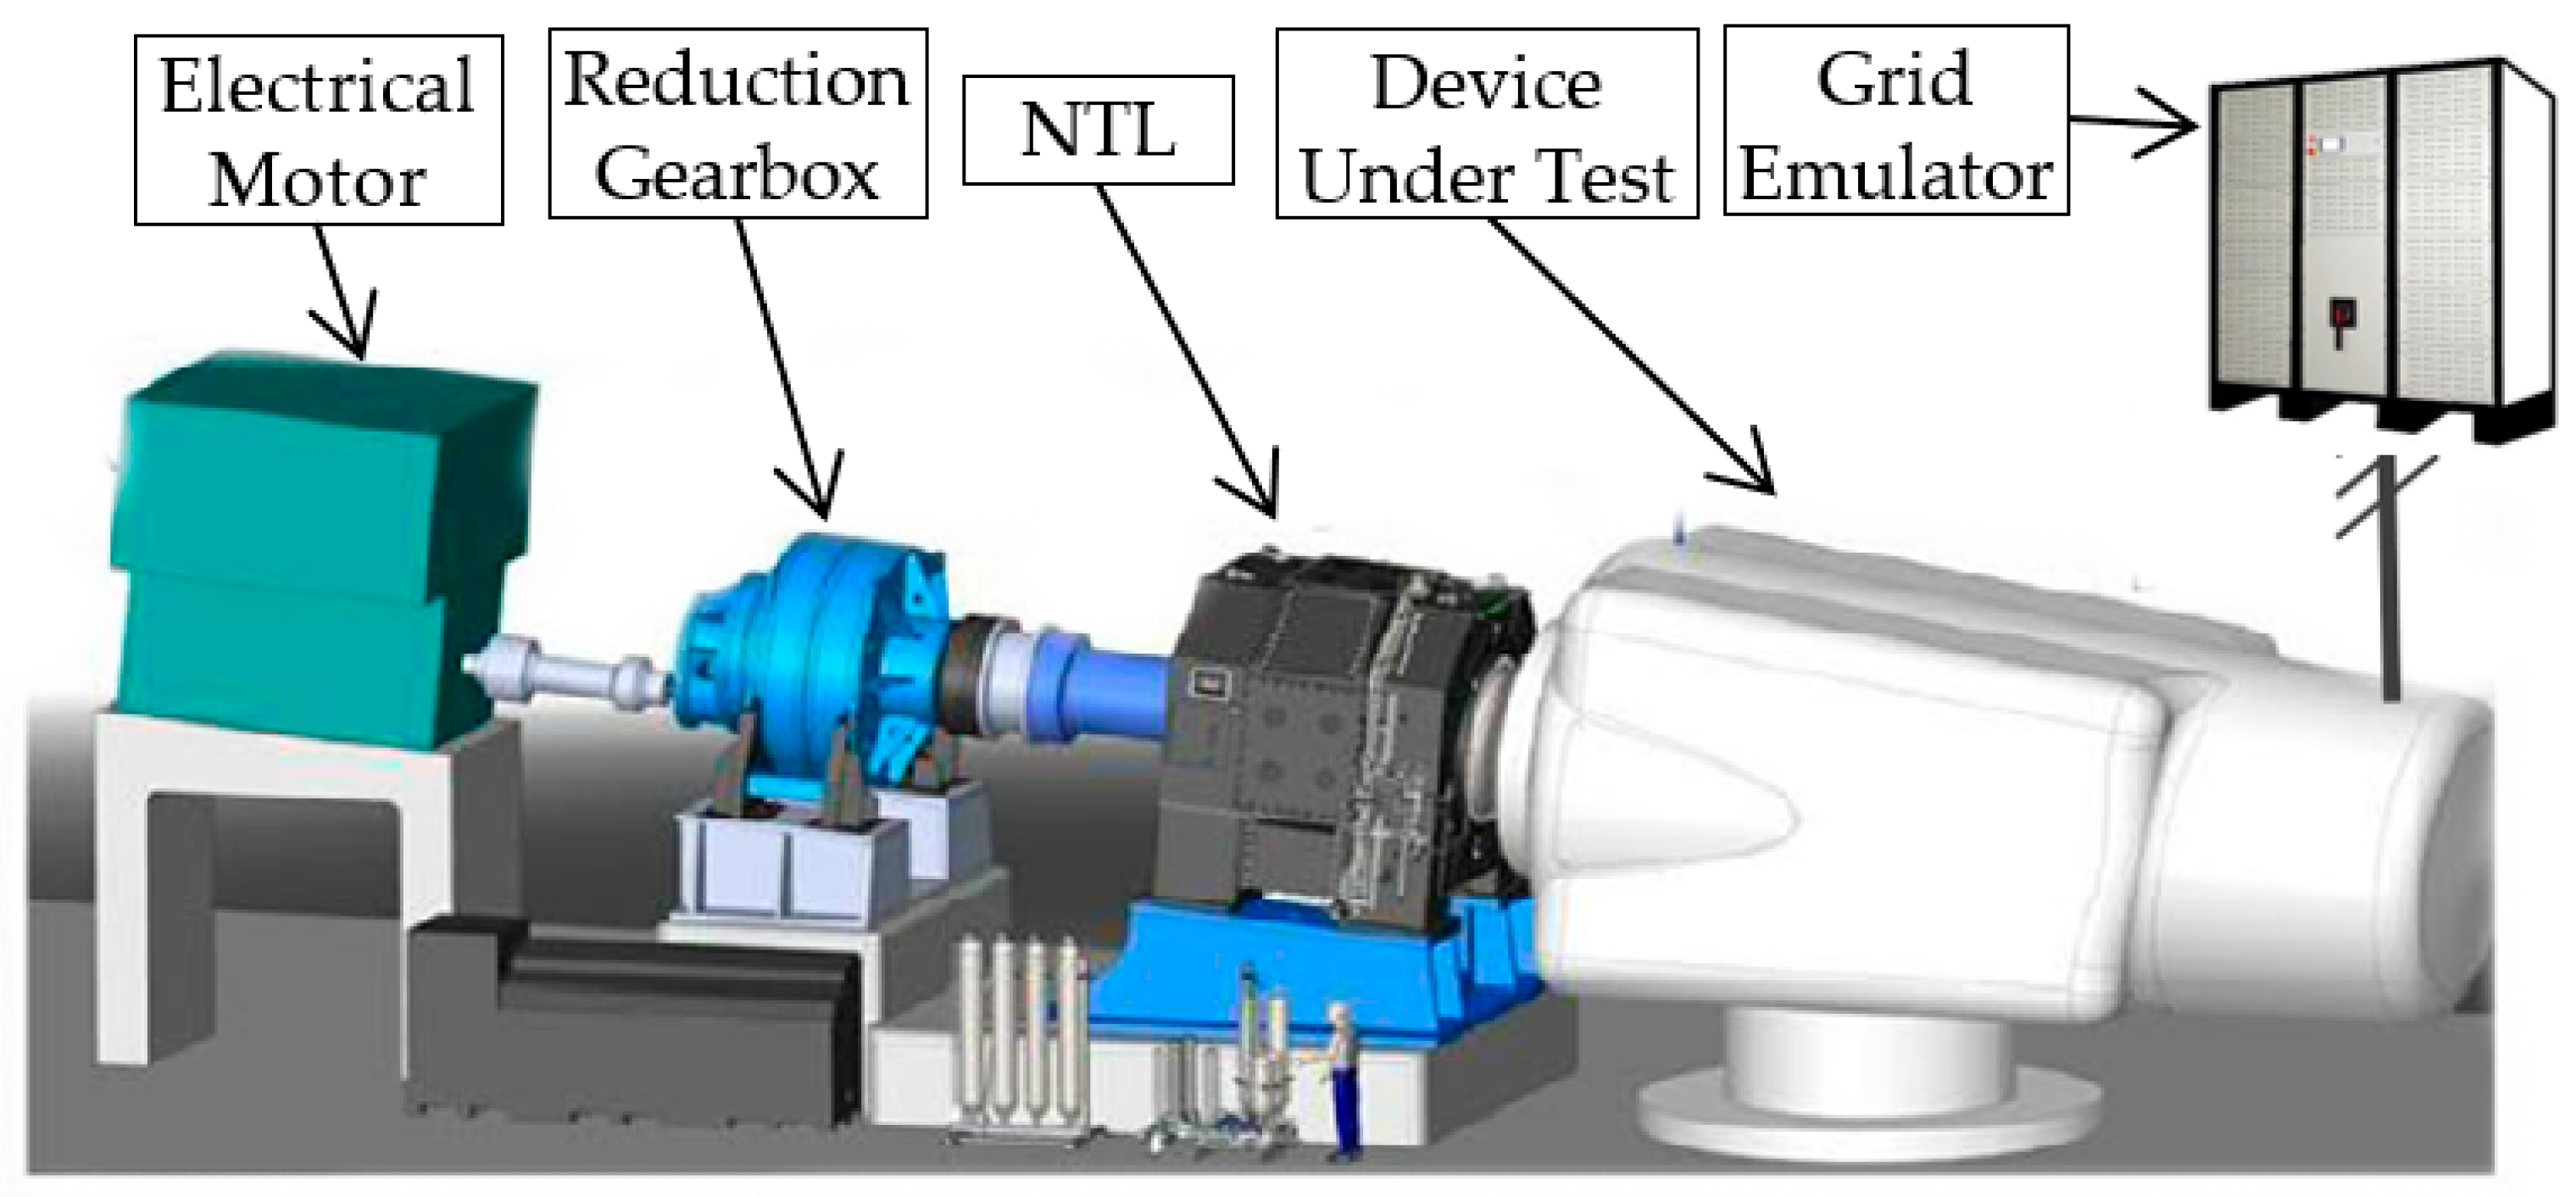
2. Structural Schemes for NTL

Wind turbine loads are primarily derived from a combination of various factors, such as aerodynamic forces, gravitational forces, dynamic interactions, and mechanical controls. Apart from the turbine torque, the majority of loads on the turbine can be categorized into five degrees of freedom components. These components comprise three orthogonal force constituents, as well as two orthogonal moment components [28]. The structure of the wind turbine drivetrain test system is shown in Figure 1, and an electrical motor is developed for the purpose of replicating the actual wind turbine’s rotational speed and shaft torque. Through the reduction gearbox, the other five DOF loads on the rotating surface of the wind turbine are reproduced by the electrohydraulic system in the NTL bench. As the loading target of NTL, the loading disk is fixed on the main drive shaft to involve the mass and inertia effects of the real rotating wind rotor and blades. The remainder of the wind turbine subsystems, including the device under test and the grid emulator are deemed test articles. The NTL application unit built by different countries has various loading forms, as represented in Figure 2.
By analyzing the dynamic structure and loading information, it is concluded that most of the existing NTL technology simulates the five DOF loads of the wind turbine under different operating conditions through the following three layout schemes of electrohydraulic loading actuators.

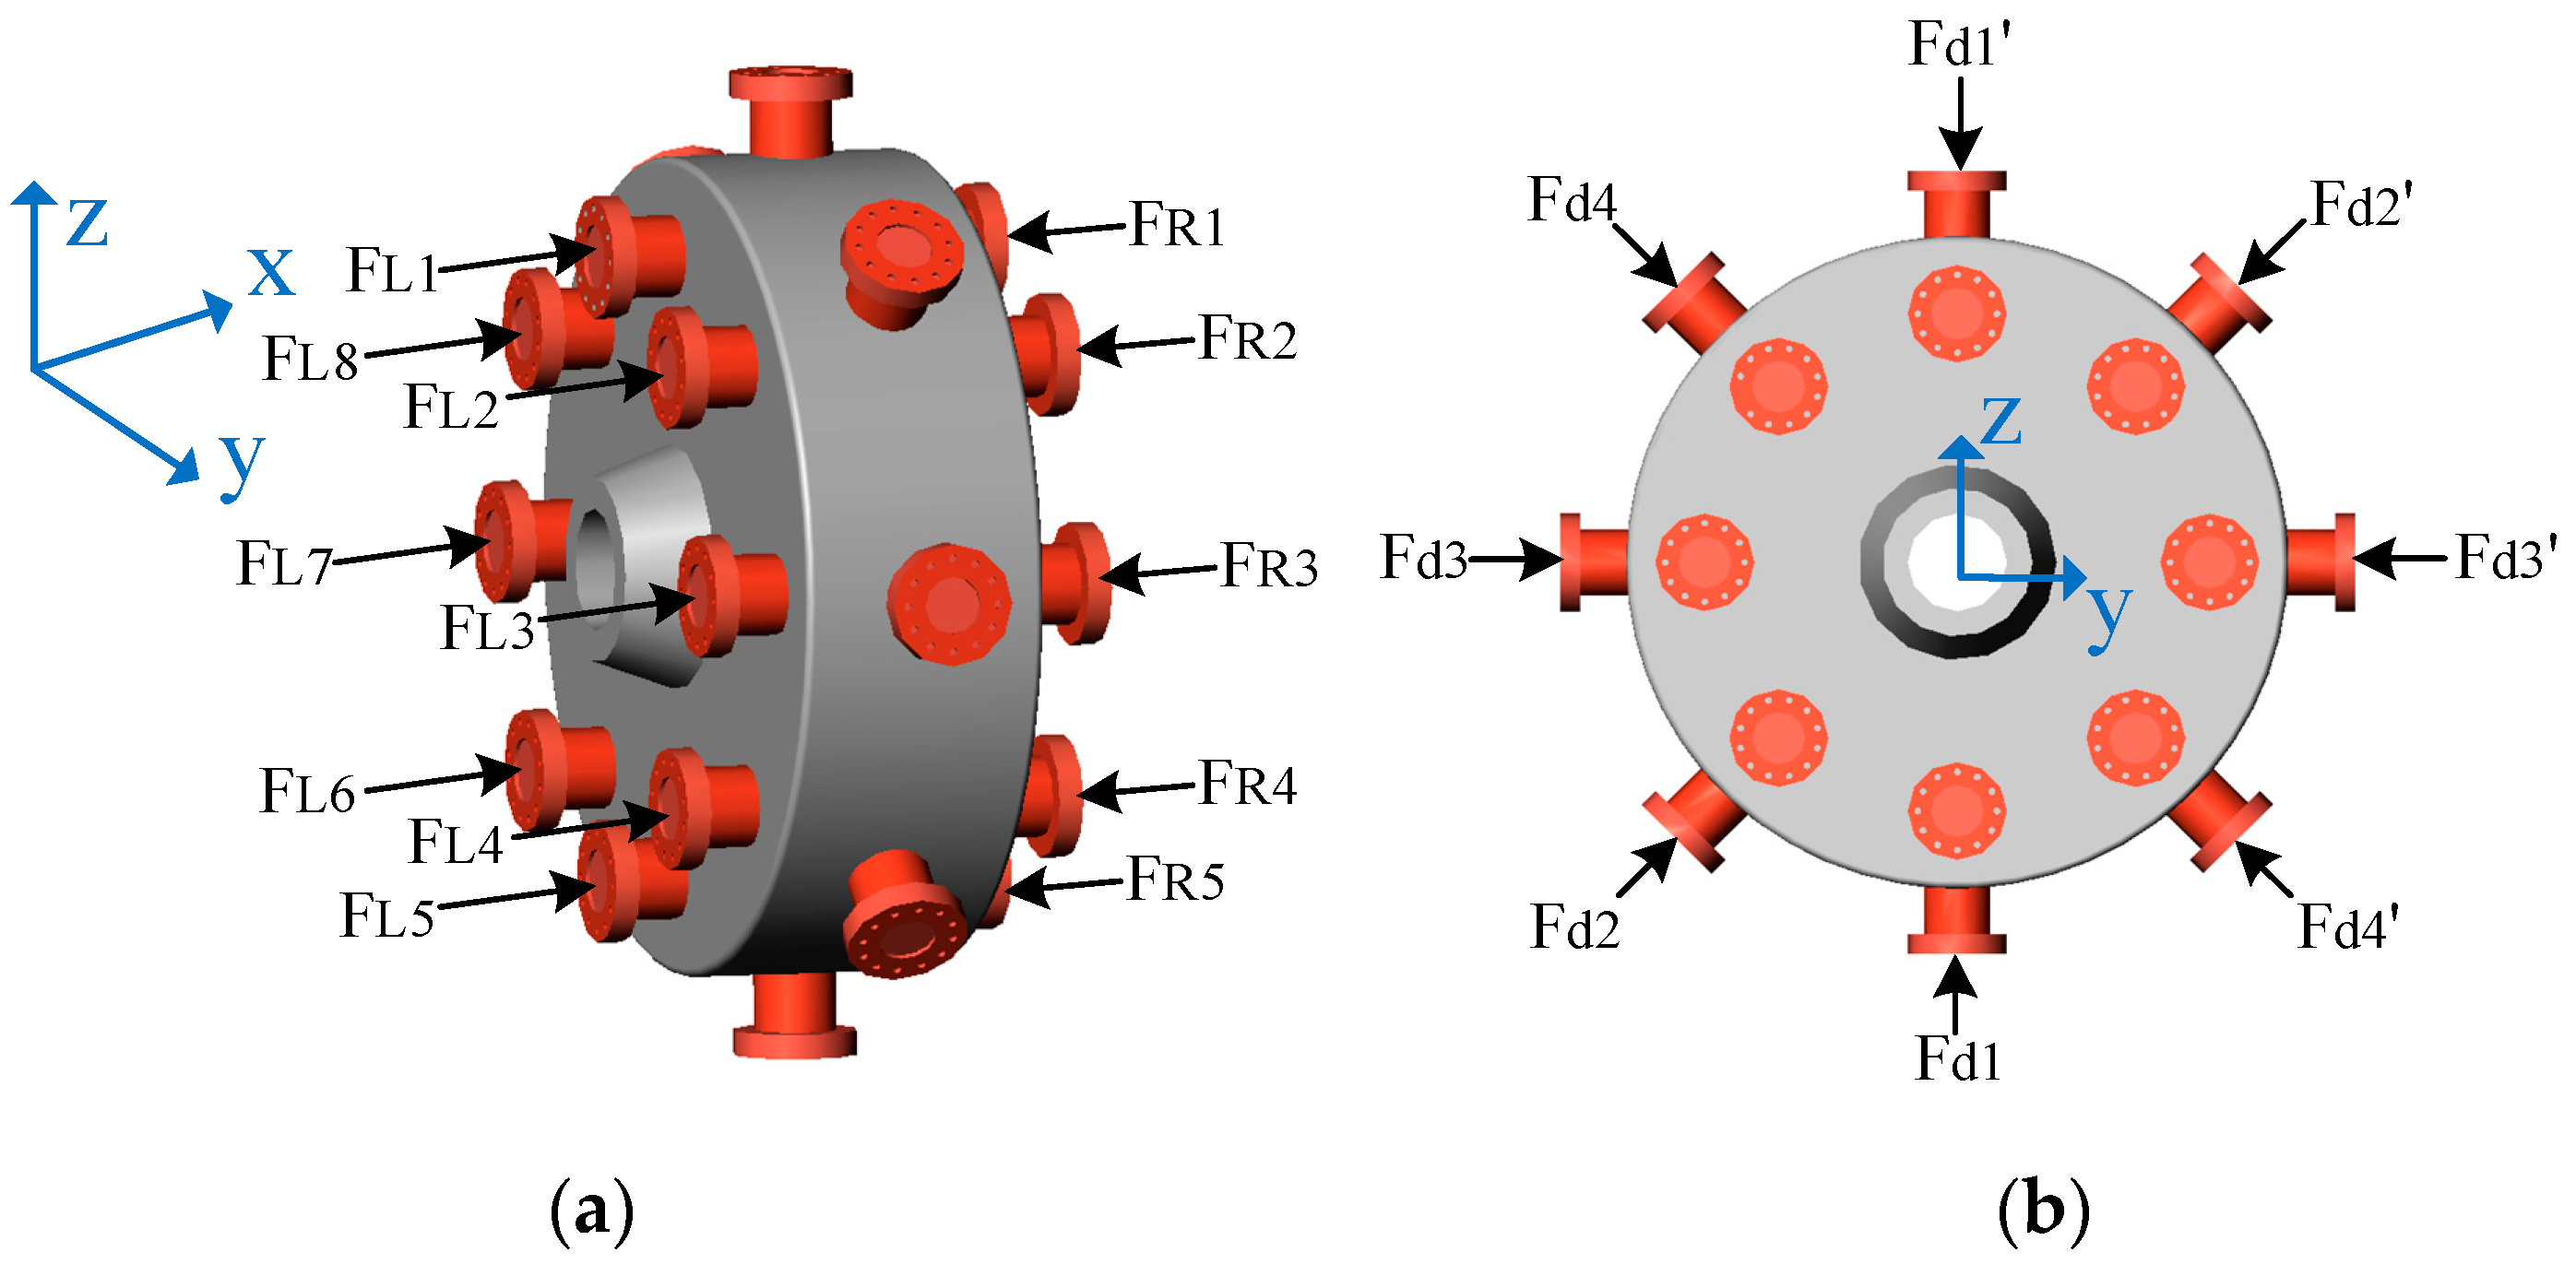
2.1. Symmetrical Loading Scheme

The symmetrical loading scheme is conducted by twenty-four hydraulic actuators. Sixteen axial electro-hydraulic actuators are symmetrically positioned on the left and right sides of the rotating disk, coupled with the distribution of eight radial actuators across its circumferential surface as illustrated in Figure 3.
The force of axial force FLi and its symmetrically distributed counterpart FRi compose the axial loading force FAi = FLiFRi (i = 1~8). The same pair of radial forces Fdi and Fdi’ along the axis of the rotation disk can be defined as the radial loading force Fri = FdiFdi’ (i = 1~4). Hence, the balance equation between the five DOF (i.e., Fx Fy Fz My, and Mz) loads and the twelve force pairs are governed by Equation (1), where r is the loading radius of the rotating disk [28].
[ F x F y F z M y M z ] = [ i = 1 8 F A i F r 3 + 2 2 ( F r 2 + F r 4 ) F r 1 + 2 2 ( F r 2 F r 4 ) ( F A 5 F A 1 ) r + 2 2 ( F A 4 + F A 6 F A 2 F A 8 ) r ( F A 3 F A 7 ) r + 2 2 ( F A 2 + F A 4 F A 6 F A 8 ) r ]
As presented in Figure 2a, the symmetrical loading scheme is applied by Clemson University. Each loading actuator in this scheme is relatively independent, which simplifies the solving procedures. However, because the five DOF loads must be replicated simultaneously with shaft torque loading, the hydrostatic supports should be set to allow the rotating disk to hover over the actuators in order to accurately replicate the cantilevered turbine rotor’s operating conditions [28]. In this case, the thickness of the oil film should be strictly controlled to ensure that the loads are eventually conveyed to the disk and distributed across its annular surface through these supports.

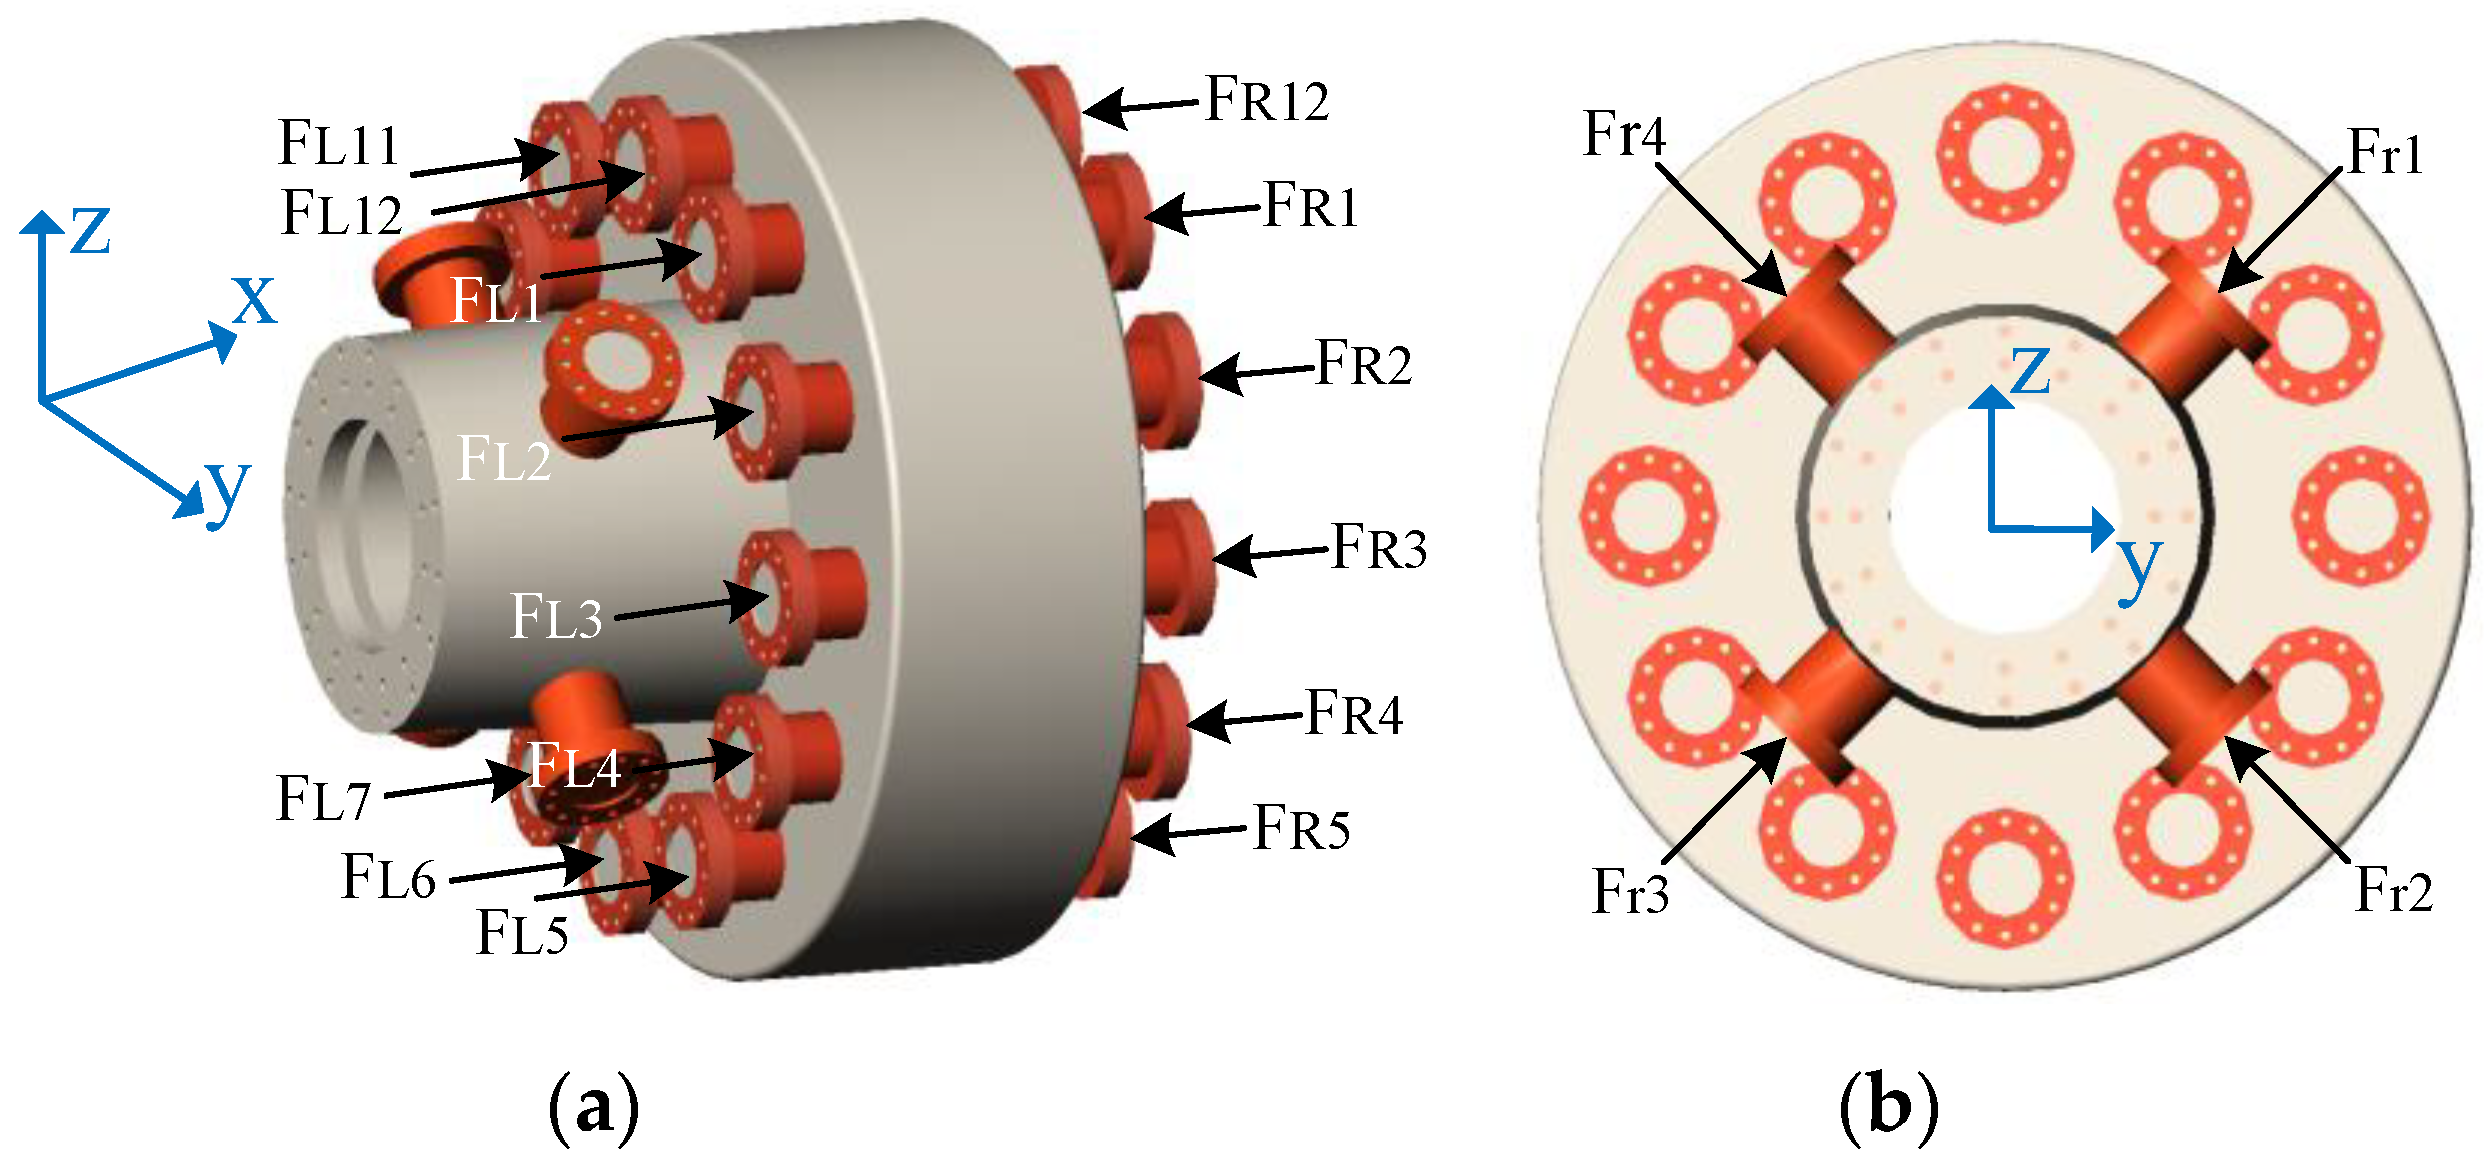
2.2. Radial Eccentric Loading Scheme

The radial eccentric loading scheme is carried out by twenty-eight hydraulic actuators. Twelve actuators are arranged on each side of the rotating disk, but only four hydraulic actuators are used in the radial direction, and the loading line is not on the circumferential surface of the rotating disk, as shown in Figure 4.
The loading force vectors on the front and rear sides of the disk make up the axial force FAi = FLiFRi (i = 1~12). Additionally, the four radial loading force vectors are Fri (i = 1~4). Thus, the solution equations can be derived as Equation (2), where r refers to the loading radius and L denotes the eccentricity of radial loading.
[ F x F y F z M y M z ] = [ i = 1 12 F A i 2 2 ( F r 3 + F r 4 F r 1 F r 2 ) 2 2 ( F r 2 + F r 3 F r 1 F r 4 ) ( F A 6 F A 12 ) r + 3 2 ( F A 5 + F A 7 F A 1 F A 11 ) r + 1 2 ( F A 4 + F A 8 F A 2 F A 10 ) r + 2 2 ( F r 1 + F r 4 F r 2 F r 3 ) L ( F A 3 F A 9 ) r + 3 2 ( F A 2 + F A 4 F A 8 F A 10 ) r + 1 2 ( F A 1 + F A 5 F A 7 F A 11 ) r + 2 2 ( F r 3 + F r 4 F r 1 F r 2 ) L ]
A typical example is the ORE Catapult in the UK, as shown in Figure 2b. There is also another version of radial eccentric loading, wherein four cylinders are on each axial side, representing twelve cylinders in total, which are employed by the 4 MW test facility at RWTH Aachen University [8]. In this loading scheme, the loading force vector of the radial cylinder has a certain eccentric displacement, so it does not need higher oil pressure while providing a larger bending moment. Nevertheless, the five DOF loads in the solving equation are coupled with each other. Thus, the calculation process is more complex than that of the symmetric loading scheme.

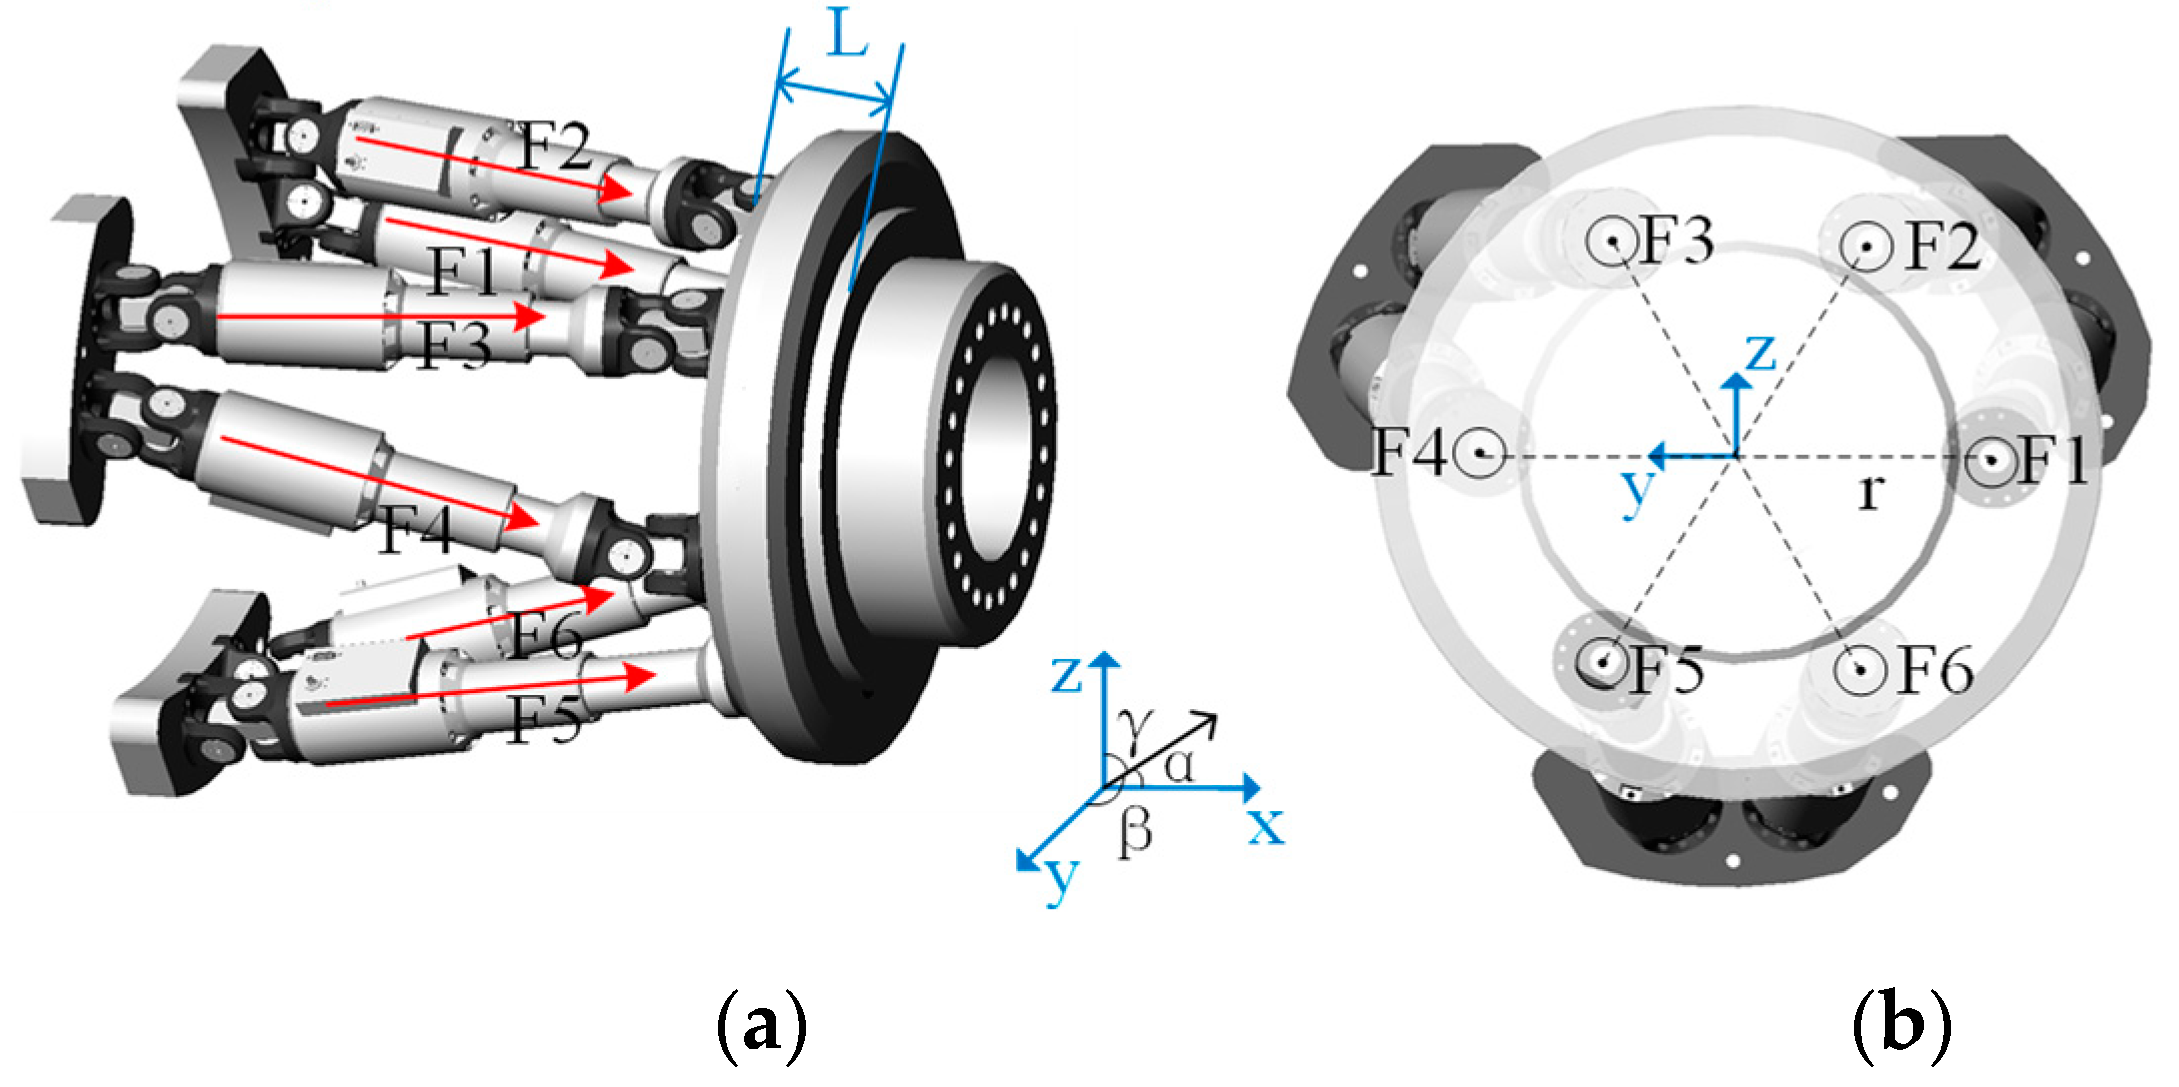
2.3. Parallel Six-Hydraulic-Cylinder Loading Scheme

The parallel six-hydraulic-cylinder loading scheme changes the orientation of the rotating disk by controlling six loading force vectors, as depicted in Figure 5. The five DOF loads’ decomposition calculation of this scheme needs to be carried out in the spatial coordinate system.
The decomposition of five DOF loads can be expressed as Equation (3), where Fi (i = 1~6) denotes loading force vectors; and α, β, and γ are the angles between the vector and the x axis, y axis and z axis, respectively; r refers to the radial distance between the action point of the loading force vectors and the loading disk center. L denotes the eccentricity of radial loading. The loading disk calculation center of the 5 DOF load is marked in a red dot in the left part of Figure 5. L means the distance between the loading force vectors and the loading disk center.
[ F x F y F z M y M z ] = [ i = 1 6 F i cos α i i = 1 6 F i cos β i i = 1 6 F i cos γ i i = 5 6 3 2 F i cos α i r i = 2 3 3 2 F i cos α i r i = 1 6 F i cos γ i L i = 1 6 F i cos β i L + F 4 cos α 4 r F 1 cos α 1 r + i = 3 , 5 1 2 F i cos α i r i = 2 , 6 1 2 F i cos α i r ]
This scheme is applied by the loading bench of LORC in Denmark, as presented in Figure 2c. This loading method can achieve the predetermined loading target through a few hydraulic cylinders, which is easy to control. However, the five DOF loads are highly coupled with each other, thus, the calculation process is more complex than the previous two schemes. Meanwhile, the platform has a large displacement, which needs to be equipped with customized coupling.
Each of the schemes introduced above has different numbers of loading actuators and vectors, which are listed in Table 1. The advantages and disadvantages of these schemes are also exhibited.

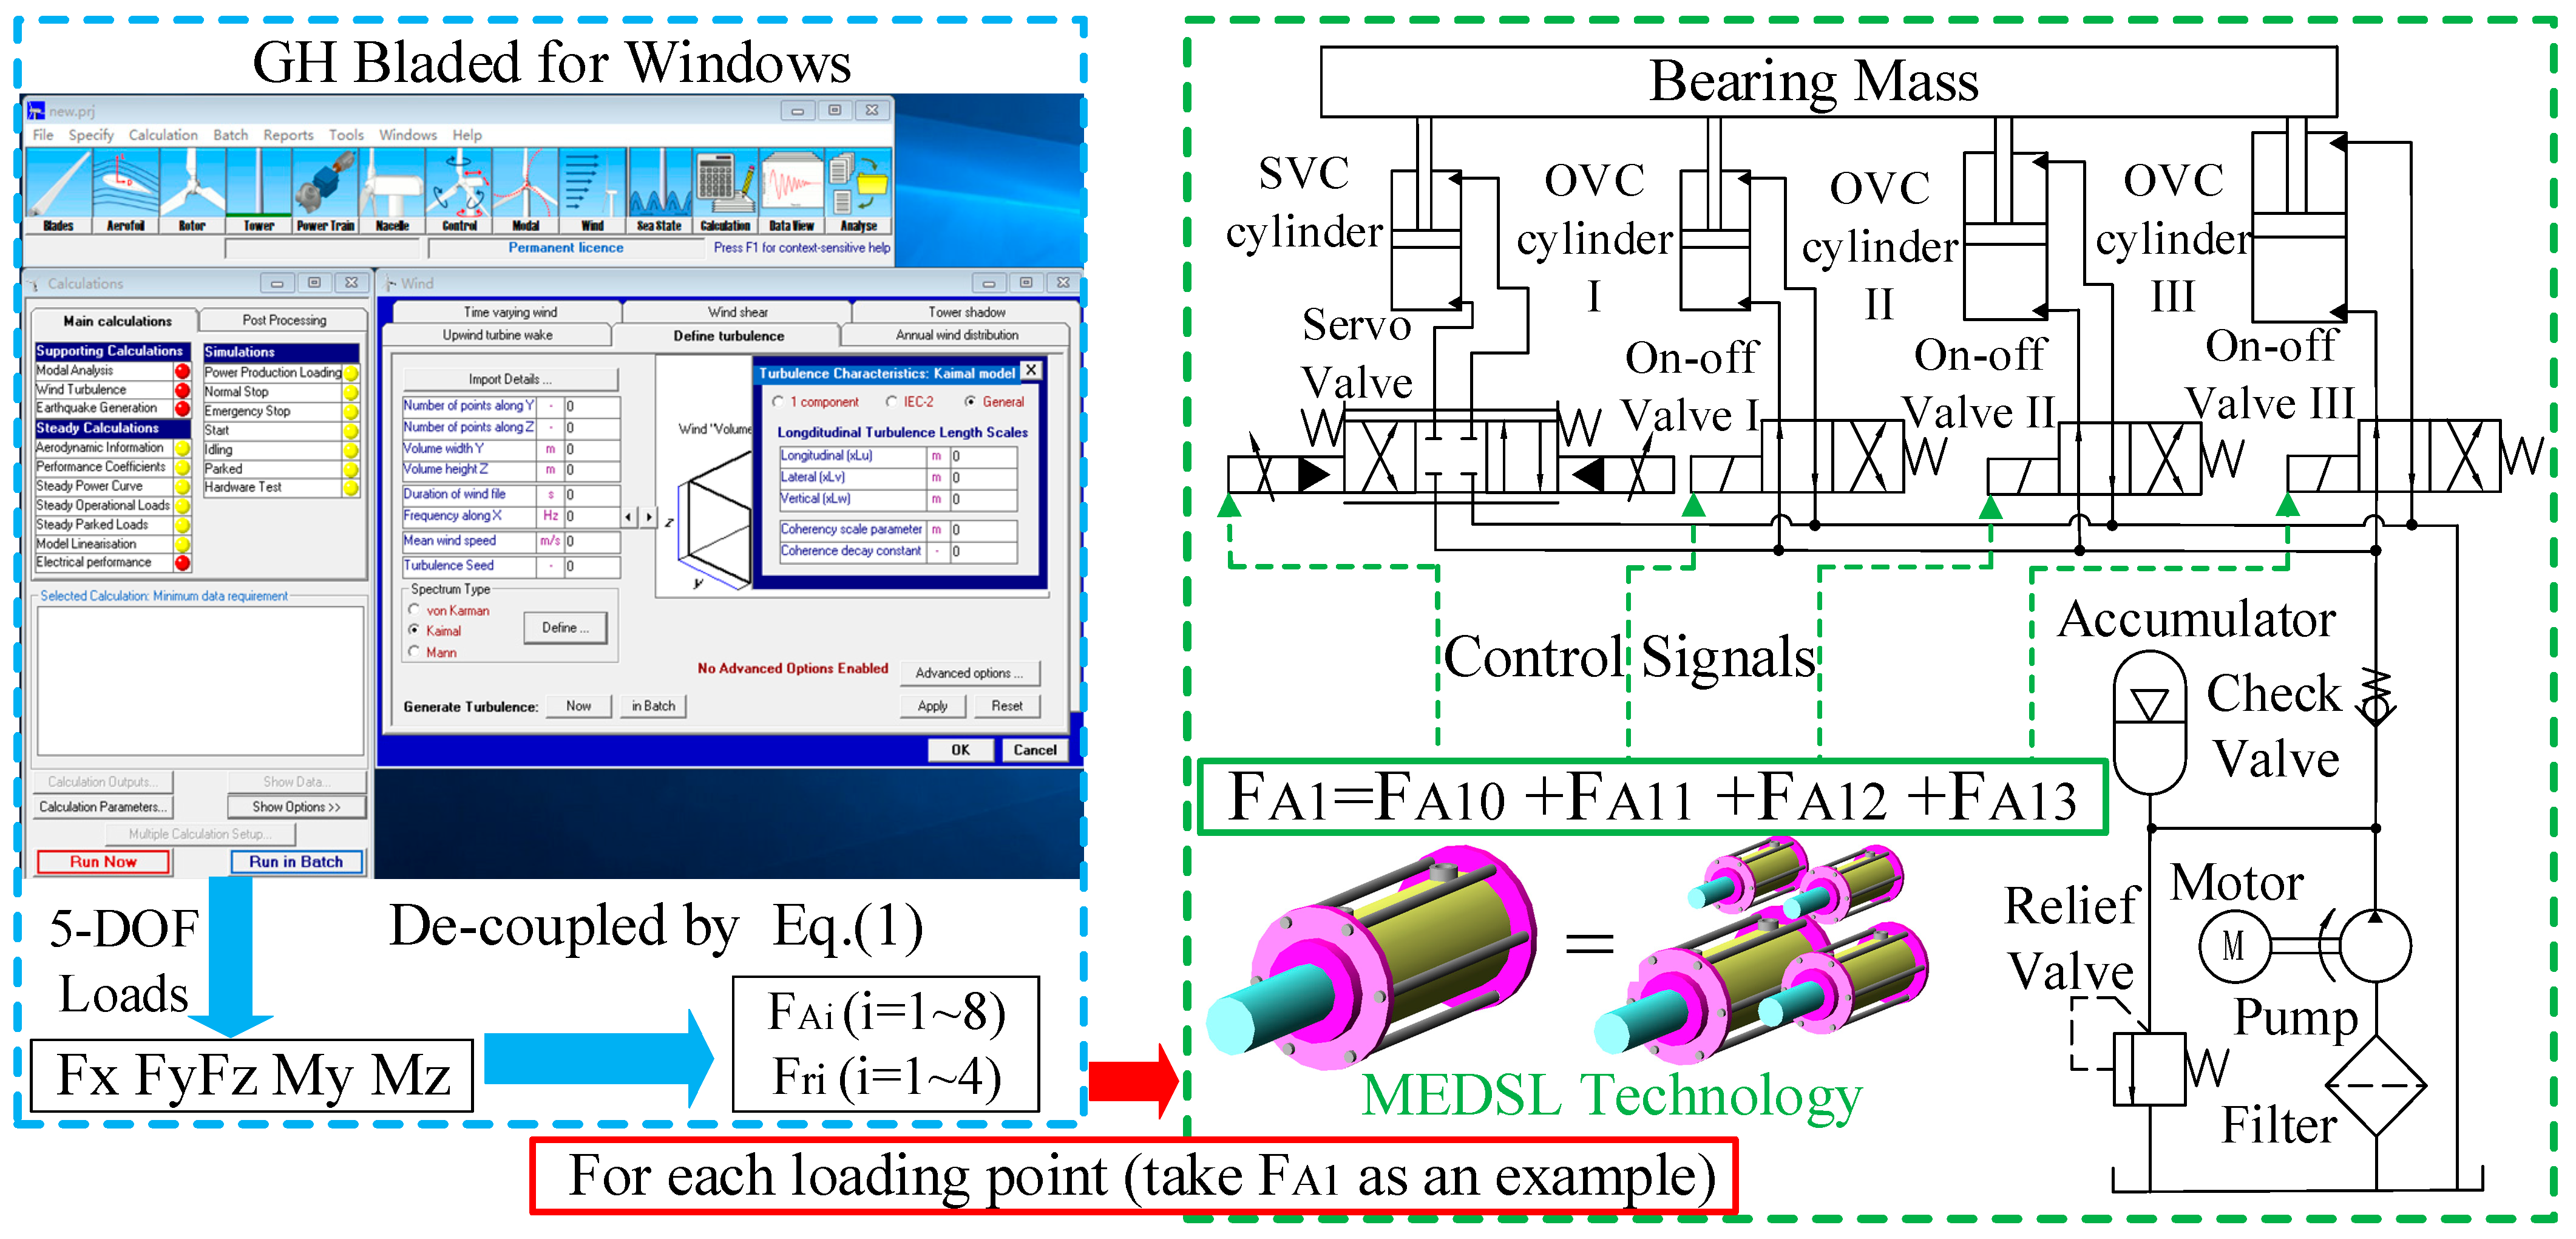
3. MEDSL Technology for Large-Scale Wind Turbine Test Bench
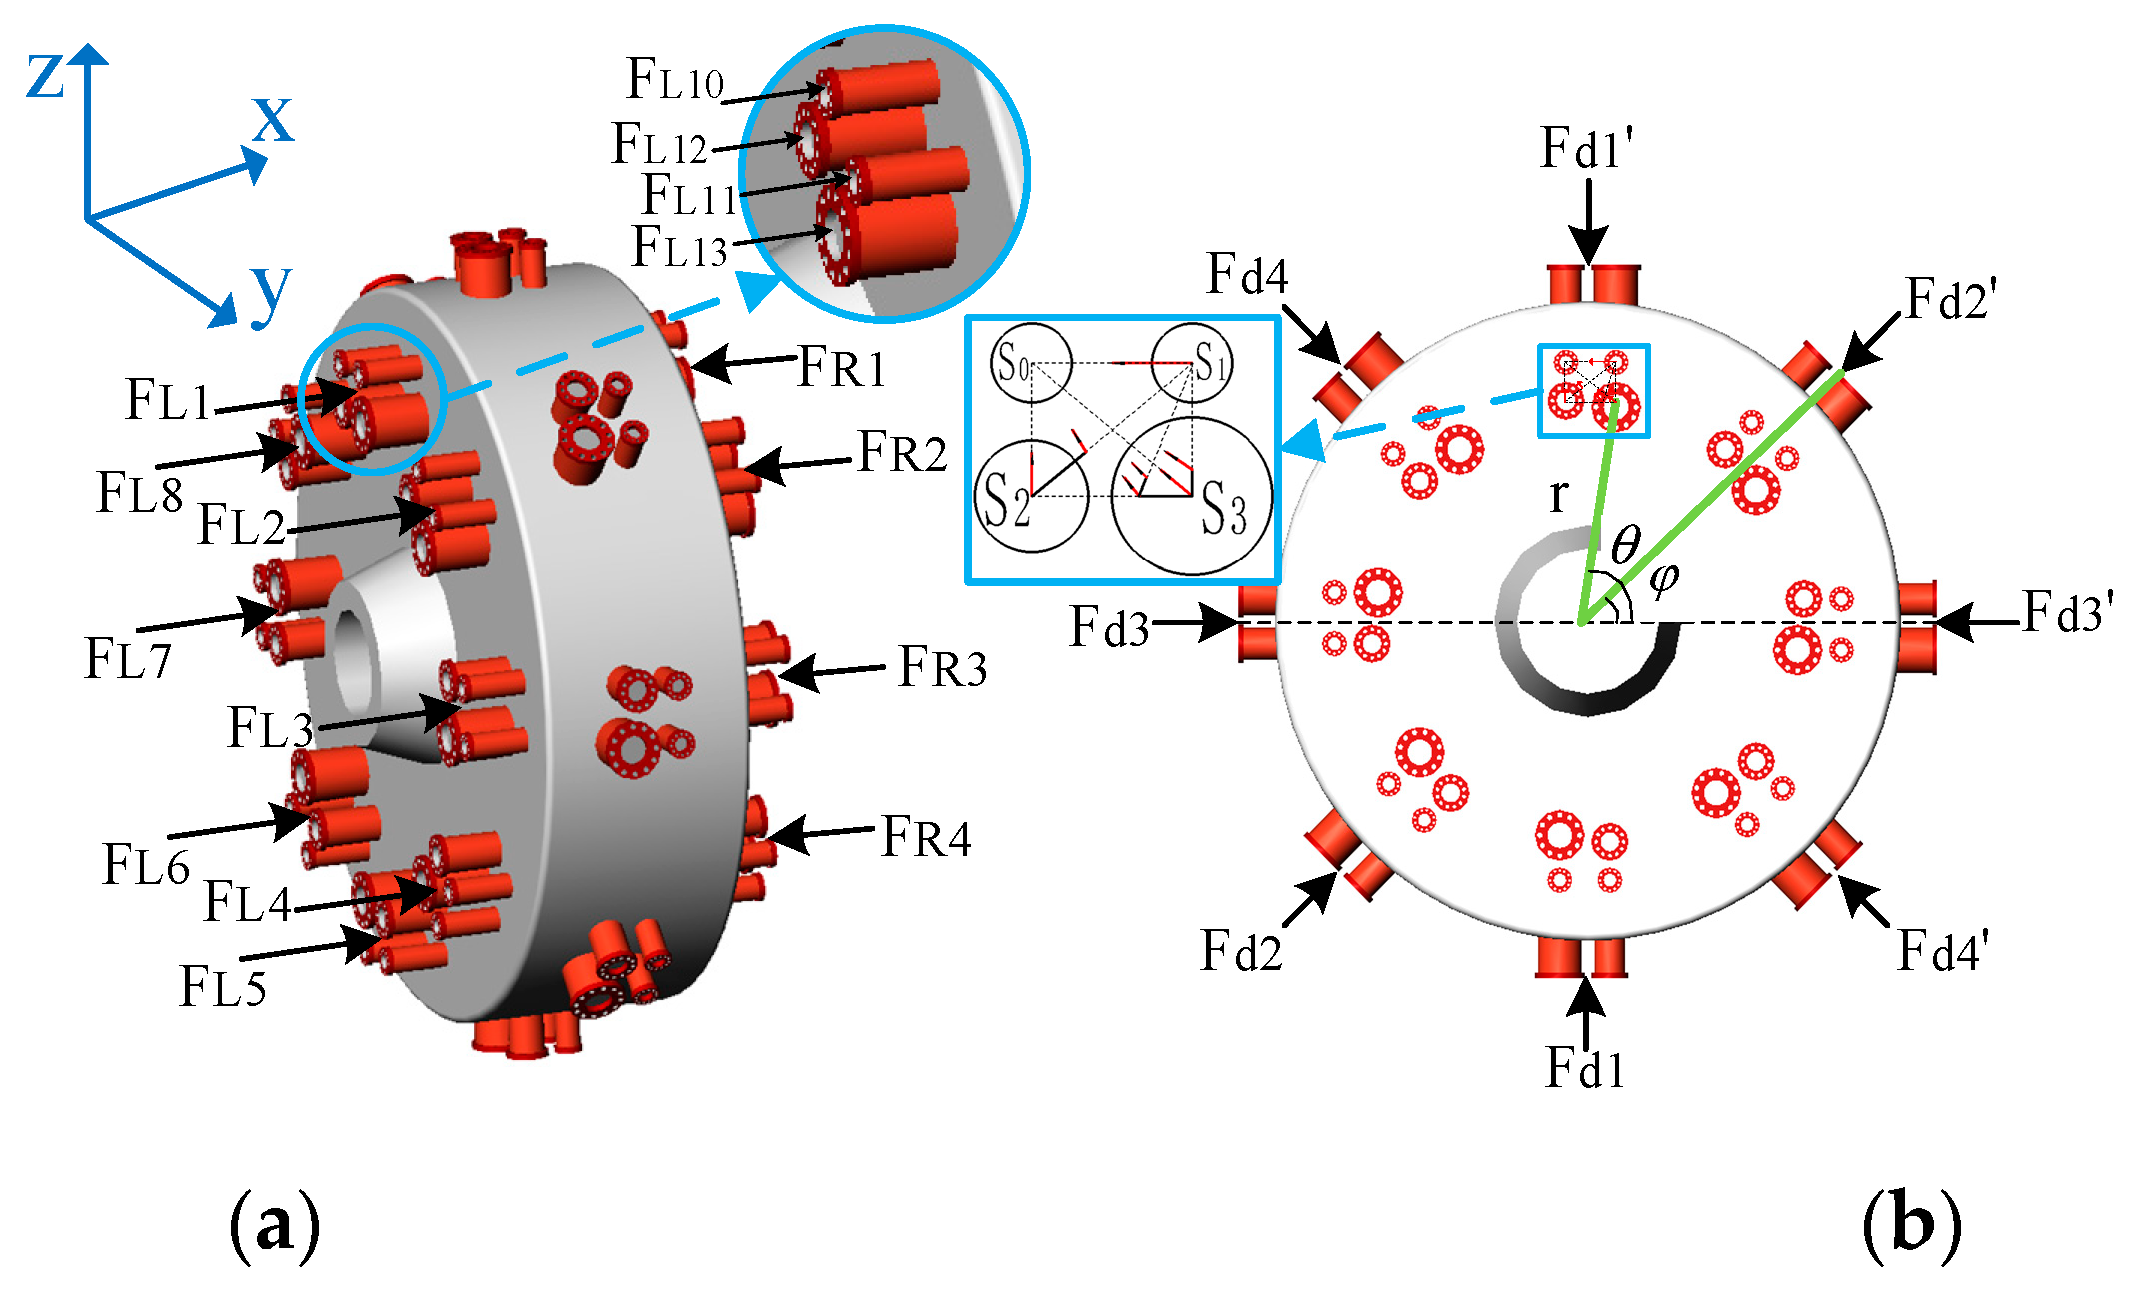
3.1. Structure

The three NTL schemes discussed in Section 2 are loaded with multiple SVC cylinders by different arrangements to reproduce real wind loads. The basic loading unit is an SVC cylinder, consisting of an electrohydraulic servo-valve and an asymmetric cylinder.
However, the reproduced loading force ramps up as the equipped capacity of the wind turbine grows. Since the maximum pressure that the hydraulic system can provide is limited, a larger hydraulic cylinder may be the only option [29]. Nevertheless, this solution requires customized large cylinders and servo-valves. Besides, in the case of light wind, the required loading force is very small, and the response speed of a large SVC cylinder is slower due to the large volume and the huge flow demand compared with a small SVC cylinder. Namely, a single large cylinder has no downward compatibility, and it can hardly realize accurate, quick, and continuous loading for different capacity classes.
Moreover, there exists an inevitable control error for the SVC cylinder because of the nonlinear factors [30]. Additionally, the increment of the cylinder area will enlarge the control error and amplify the loading error of the electrohydraulic system. To improve the basic mechanism of electrohydraulic loading, the MEDSL technology was proposed for each SVC cylinder loading point to deal with the problem of inaccuracy control and to realize precise load recurrence under a wider wind load condition.
The reproduction process of non-torque loads with MEDSL technology can be exhibited in Figure 6. The blue box is the load calculation process. For each loading point, the green box presents the FA1 example application of MEDSL technology in the case of a four-cylinder combination. The actual five DOF loads are calculated by defining specific working conditions in GH Bladed software. Due to the simple solving procedure of the symmetrical loading scheme, the loads can be decoupled with the case of the symmetrical loading scheme i.e., Equation (1), to obtain the loading force of each point, including eight axial and four radial force points. Because the applied process of every force is identical, the application of MEDSL technology is exhibited with the FA1 example. The traditional large hydraulic cylinder FA1 is replaced by several small cylinders (take four-cylinders—FA10, FA11, FA12, and FA13—as examples). Among them, the FA10 is exerted by a SVC cylinder, and FA11, FA12, and FA13 are provided by (on-off valve controlled) OVC cylinders I, II, and III, respectively. The force of the SVC cylinder FA10 can be regulated indefinitely, whereas the three OVC cylinders process solely two loading force states, namely, no loading force or maximum loading force. Thus, the total loading force is continuous by the electrohydraulic and digital combination. The industrial computer can generate loading control signals to determine the spool displacement of the servo valve and the status of the three on-off valves based on the MEDSL structure.
In the case of applying MEDSL technology to the symmetrical loading scheme, the twenty-four hydraulic cylinder groups were designed to substitute the traditional twenty-four SVC hydraulic actuators. Moreover, because of the randomness of the wind load, the reproduced five DOF loads can change over a wide range. Thus, for the small reference loading force, the MEDSL only uses the small SVC cylinder, thus it will greatly improve the response speed in comparison with a single large cylinder. The high precision and downward compatibility are particularly important in the multi-stage MW-class wind turbine drivetrain testing.

3.2. Loading Principle

The basic loading principle of the MEDSL technology is concluded, and the four-cylinder case has been investigated in the section. A traditionally used single cylinder loading is replaced by the novel electrohydraulic digital-servo cylinders group at each basic loading point [31]. In each loading point within the cylinders group, there are N hydraulic cylinders present. One of these cylinders is governed by the electrohydraulic servo valve, whereas the remaining (N − 1) cylinders are controlled through the on-off valve. For each loading point, the total loading force FLi includes two parts, one is the SVC cylinder, and the other is the sum of the force of the OVC cylinders.
As shown in Figure 7, the force on each loading point consists of the total loading force of a cylinder group. Take the left side of the loading disk as an example, and, thus, the axial force FLi (i = 1~8) can be defined as:
F L i = F L i   0 + n = 1 N 1 F L i   n
where; FLi0 is the exerted force of the SVC cylinder; FLin is the output force of the OVC cylinder; and N is the number of cylinders in a group. In Figure 7, N is set to 4. The forces exerted on the right side (FRi) and the radial side (Fdi/Fdi′) of the disk are defined in the same way. The axial loading forces can be composed as FAi = FLiFRi (i = 1~8). The radial loading forces are Fri = FdiFdi′ (i = 1~4). Due to the areas of the OVC cylinders increasing twice compared to the previous one, the number of the cylinders should be selected as:
N = log 2 [ ( F max / p max ) / S 0 ] + 1
where; Fmax is the maximum loading force for the loading point; Fa is the control precision; pmax is the pressure of the hydraulic source; the area of the SVC cylinder is S0 = Fa/pa; represents rounding up. The integer N obtained can calculate S0* inversely as:
S 0 * = ( F max / p max ) / 2 ( N 1 )
However, there exists a minor eccentric moment due to the installation distance between cylinders in each cylinder group. As can be seen from the blue box in Figure 7, the actual loading point at each point will change with the magnitude of the loading force. This loading point will move from the center of each cylinder or some specific force equivalent points to S0. Thus, the distance between the actual loading point of each cylinder group and the center of the loading disk (r(FAi)), and the angle with the coordinate axis, become nonlinear functions, varying with the loading force. Therefore, the five DOF loads loading formula also needs to be modified as:
[ F x F y F z M y M z ] = [ i = 1 8 F A i i = 1 4 F r i cos φ ( F r i ) i = 1 4 F r i sin φ ( F r i ) i = 4 , 5 , 6 F A i r ( F A i ) sin θ ( F A i ) i = 1 , 2 , 8 F A i i r ( F A i ) sin θ ( F A i ) + i = 3 , 7 F A i r ( F A i ) sin θ ( F A i ) + i = 1 4 M yi i = 2 , 3 , 4 F A i r ( F A i ) cos θ ( F A i ) i = 6 , 7 , 8 F A i r ( F A i ) cos θ ( F A i ) + i = 1 , 5 F A i r ( F A i ) cos θ ( F A i ) + i = 1 4 M zi ]
where; θ ( F A i ) is the angle between the actual loading point of each axial cylinders group and the y-axis; φ ( F A i ) is the angle between the actual loading point of each radial cylinders group and the z-axis; M y i is the additional bending moment produced by the i-th cylinders group in the y-direction; M z i is the additional bending moment produced by the i-th cylinders group in the z-direction.
Generally, the MEDSL technology improves the structure of each basic unit of the wind turbine NTL electrohydraulic system. It provides a new scheme for the drivetrain testing system of large-scale wind turbines. Furthermore, the accuracy of the novel loading scheme using MEDSL mainly depends on two aspects. Firstly, the loading formula could be modified and recalculated in real-time to ensure the implementation of accurate reproduction of five DOF loads under the coordination and integration of multiple hydraulic cylinder groups. Secondly, the accuracy of each hydraulic cylinder group is quite important. The advanced controller should be adopted to enhance the loading performance of each loading point.

4. Controller Development

The control performance of the proposed MEDSL technology lies in the precise control of the SVC cylinder pressure system. Since there exists an inevitable control error caused by typical nonlinear factors for electrohydraulic servo systems, while the OVC cylinder does not have this error. Therefore, it is essential to design an advanced control algorithm to deal with parameter uncertainty and system nonlinearity. Sliding mode variable structure control has the benefits of high control accuracy and simple structure with strong robustness, which has been widely used in electromechanical and electrohydraulic servo control [32,33].

4.1. Model of the SVC Cylinder Pressure System

Assuming constant supply pressure, the flow equation of a SVC cylinder can be expressed as [34]:
q L = K q x v K c p L
where; qL is the load flow rate; Kq and Kc are flow gain and the flow-pressure coefficient, respectively; xv is defined as the spool displacement of the servo-valve; pL is called the load pressure. The load flow continuity equation includes the flow that pushes the piston, the leakage flow, and the compression flow, which can be given as:
q L = A p d x p d t + C t p p L + V t 4 β e d p L d t
where; Ap is the effective area of the piston; xp is the displacement of the piston rod; Ctp is the total leakage coefficient of the hydraulic cylinder; Vt is the total volume of compressed fluid in the circuit; βe is the oil effective bulk modulus. The force balance equation can be derived as:
A p p L = m t d 2 x p d t 2 + B p d x p d t + K x p + F L
where; mt is the equivalent mass; Bp and K are the equivalent viscous damping coefficient and the load stiffness; FL denotes the external force. The pressure–flow characteristic equation of the servo-valve can be written as:
q L = C d W x v 1 ρ ( p s x v | x v | p L )
where; Cd is the flow discharge coefficient; W is the valve orifice area gradient; ρ is the fluid density; ps is the supply pressure; xv = τu, τ is the proportional coefficient between the spool displacement and control signal u. The flow nonlinear part of the servo-valve is induced into a separate expression as follows to simplify the modeling process.
g ( u ) = p s sgn ( u ) p L
Due to the proximity of the natural frequency of the servo-valve and the hydraulic cylinder’s frequency, it is reasonable to represent the load flow transfer function of the servo-valve as a second-order oscillation component whilst still retaining the flow’s nonlinear properties [35].
q ¨ L = k B q ˙ L k k q L + k s u g ( u )
where; kB, kk, and ks are the servo coefficients. The Laplace transform of Equation (11) can be written as:
q L = k s S 2 + k B S + k k u g ( u )
Taking the Laplace transform Equation (12) into (14), the third derivative of load pressure pL can be obtained. Define a set of state variables as x = [ x 1 , x 2 , x 3 , x 4 , x 5 ] T = [ x p , x ˙ p , p L , p ˙ L , p ¨ L ] T . The external disturbance is much smaller than the static loading force. When the loading disk is attached without a hydrostatic support system, the external force FL is 0. Therefore, by ignoring the influence of external force, the pressure control system of the SVC cylinder can be described by combining Equations (8)–(14) in state–space form as:
{ x ˙ 1 = x 2 x ˙ 2 = 1 m t ( K x 1 B p x 2 + A p x 3 ) x ˙ 3 = 4 β e V t ( A p x 2 C t p x 3 + q L ) x ˙ 4 = x 5 x ˙ 5 = a 1 x 1 a 2 x 2 a 3 x 3 a 4 x 4 a 5 x 5 + 4 β e k s V t u g ( u )
where a 1 = 4 K A p β e m t V t k B 4 B p K A p β e m t 2 V t , a 2 = 4 A p β e V t k k 4 K A p β e m t V t 4 B p A p β e m t V t k B + 4 B p 2 A p β e m t 2 V t , a 3 = 4 C t p β e V t k k 4 B p A p 2 β e m t 2 V t   + 4 A p 2 β e m t V t k B , a 4 = k k + 4 C t p β e V t k B + 4 A p 2 β e m t V t , a 5 = k B + 4 C t p β e V t .

4.2. SMC Design

Set pr as the expected output pressure of the SVC cylinder, and the tracking error and its derivatives are given by:
{ e 1 = p r p L e 2 = p ˙ r p ˙ L e 3 = p ¨ r p ¨ L
Design the sliding mode switching function of the hydraulic cylinder output pressure system as:
s = c 1 e 1 + c 2 e 2 + e 3
where; c1 and c2 are the switching function coefficients, positive real numbers. The derivative of the switching function is given by:
s ˙ = c 1 e 2 + c 2 e 3 + p r ( a 1 x 1 a 2 x 2 a 3 x 3 a 4 x 4 a 5 x 5 + 4 β e k s V t u g ( u ) )
In order to force the states to arrive at a state of equilibrium on a sliding surface and remain on it thereafter, the reaching law is used to obtain SMC:
s ˙ = ε s a t ( s ϕ ) k s
where; ε > 0 ,   k > 0 are reaching law designable parameters, and ϕ is the thickness of the boundary layer. Additionally, the saturation function is defined as follows to eliminate the chattering problem [36]:
s a t ( s ϕ ) = { s ϕ sgn ( s ϕ ) if | s ϕ | < 1 , if | s ϕ | 1 ,
The expression of the SMC for the SVC cylinder output pressure system can be obtained as:
u = 1 4 β e k s V t g ( u ) ( ( a 1 x 1 a 2 x 2 a 3 x 3 a 4 x 4 a 5 x 5 ) + c 1 e 2 + c 2 e 3 + p r + ε s a t ( s ϕ ) + k s )

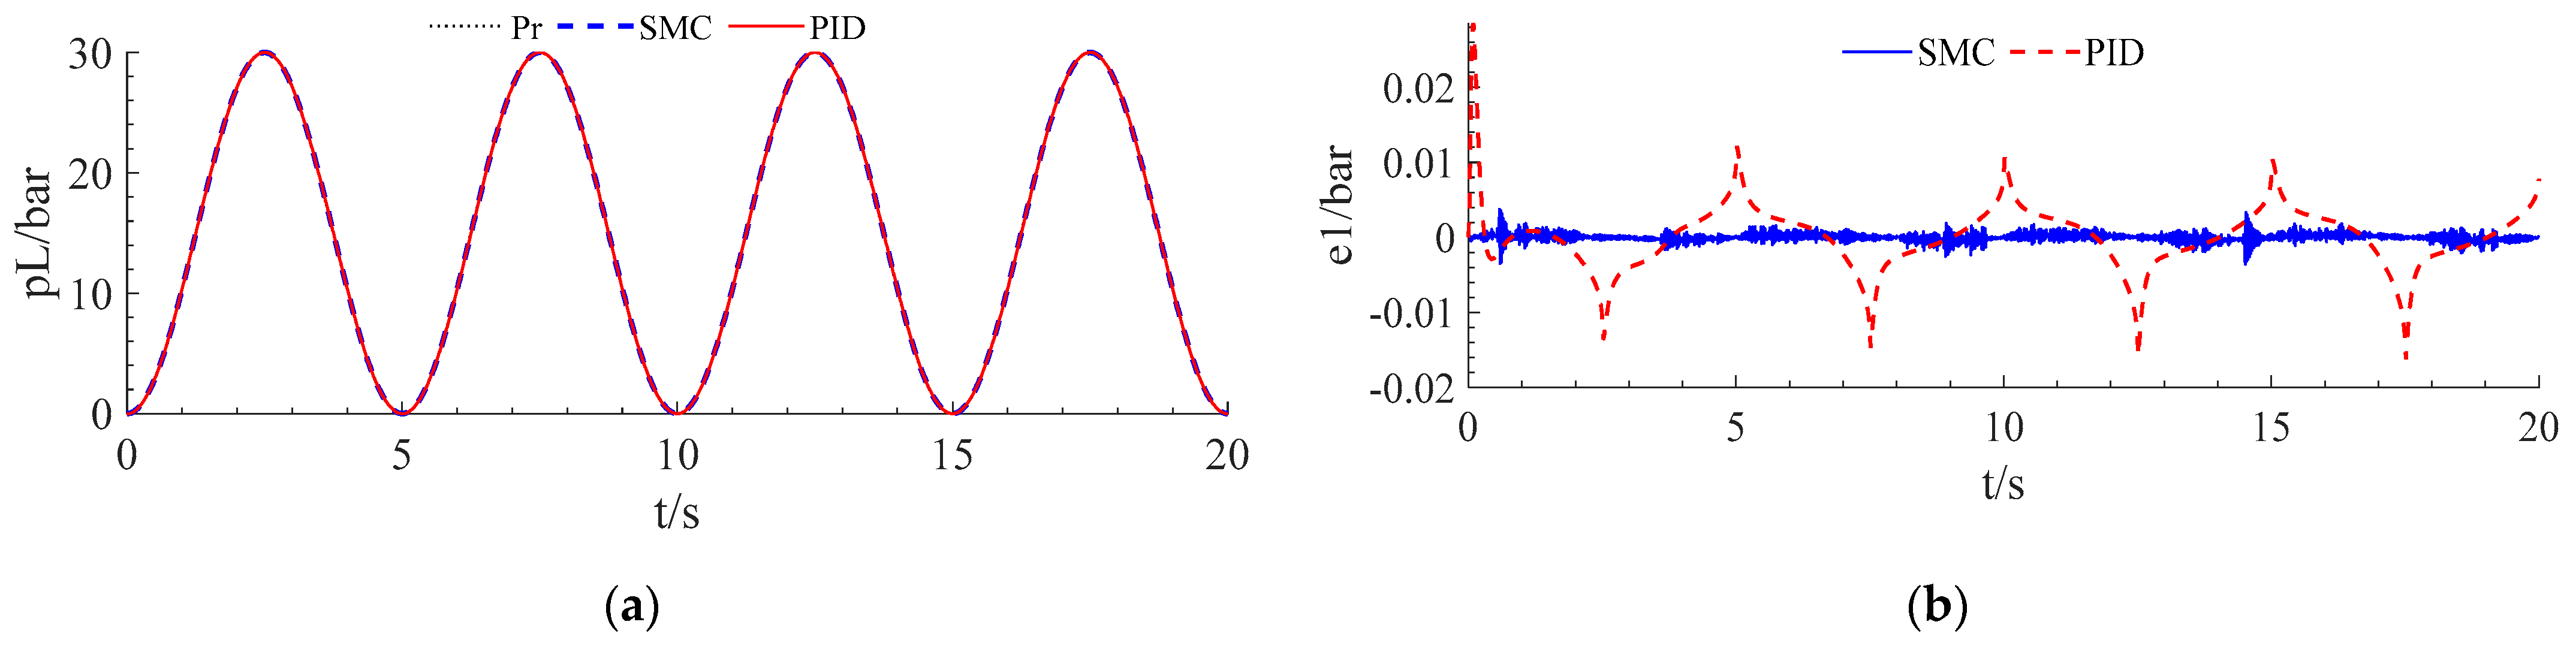
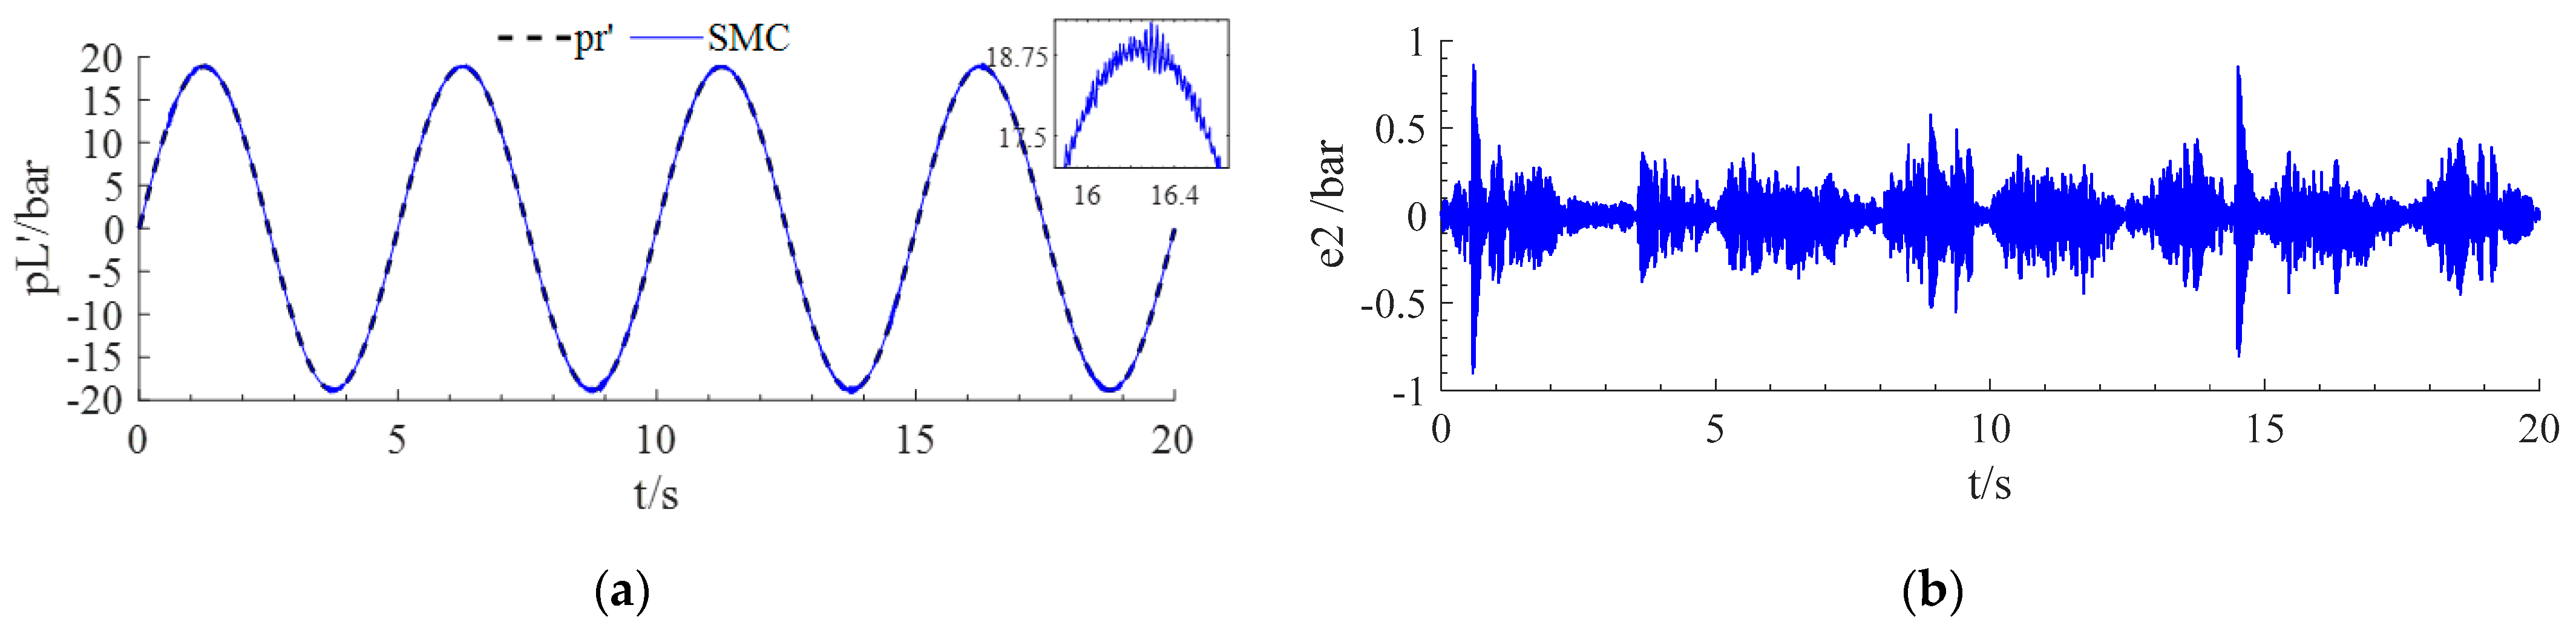
4.3. Simulation Verification

A hydraulic system model of the SVC cylinder under SMC was built through AMESim and SIMULINK co-simulation to verify the accuracy performance of pressure control. The details of the parameter settings are listed in Table 2.
The comparison results of tracking performance under the target value p r = 15 ( 1 cos ( 0.4 π t ) ) bar between SMC and proportional-integral-derivative (PID) have been illustrated in Figure 8a. Additionally, Figure 8b gives the corresponding tracking errors of SMC and PID. In contrast, the tracking error of SMC is kept within 0.005 bar, and that of PID is kept within 0.015 bar, the accuracy is increased by 67%, which proves the strength of the proposed SMC strategy for the SVC system.
For the tracking characteristics of the derivatives of pr as shown in Figure 9a, it can be found that SMC can generally track p ˙ r well, and the tracking pressure has an error of ±0.9 bar, as seen in Figure 9b. The advantages of applying the proposed SMC to the SVC cylinder have been validated in the co-simulation.

5. Experimental Study and Discussion

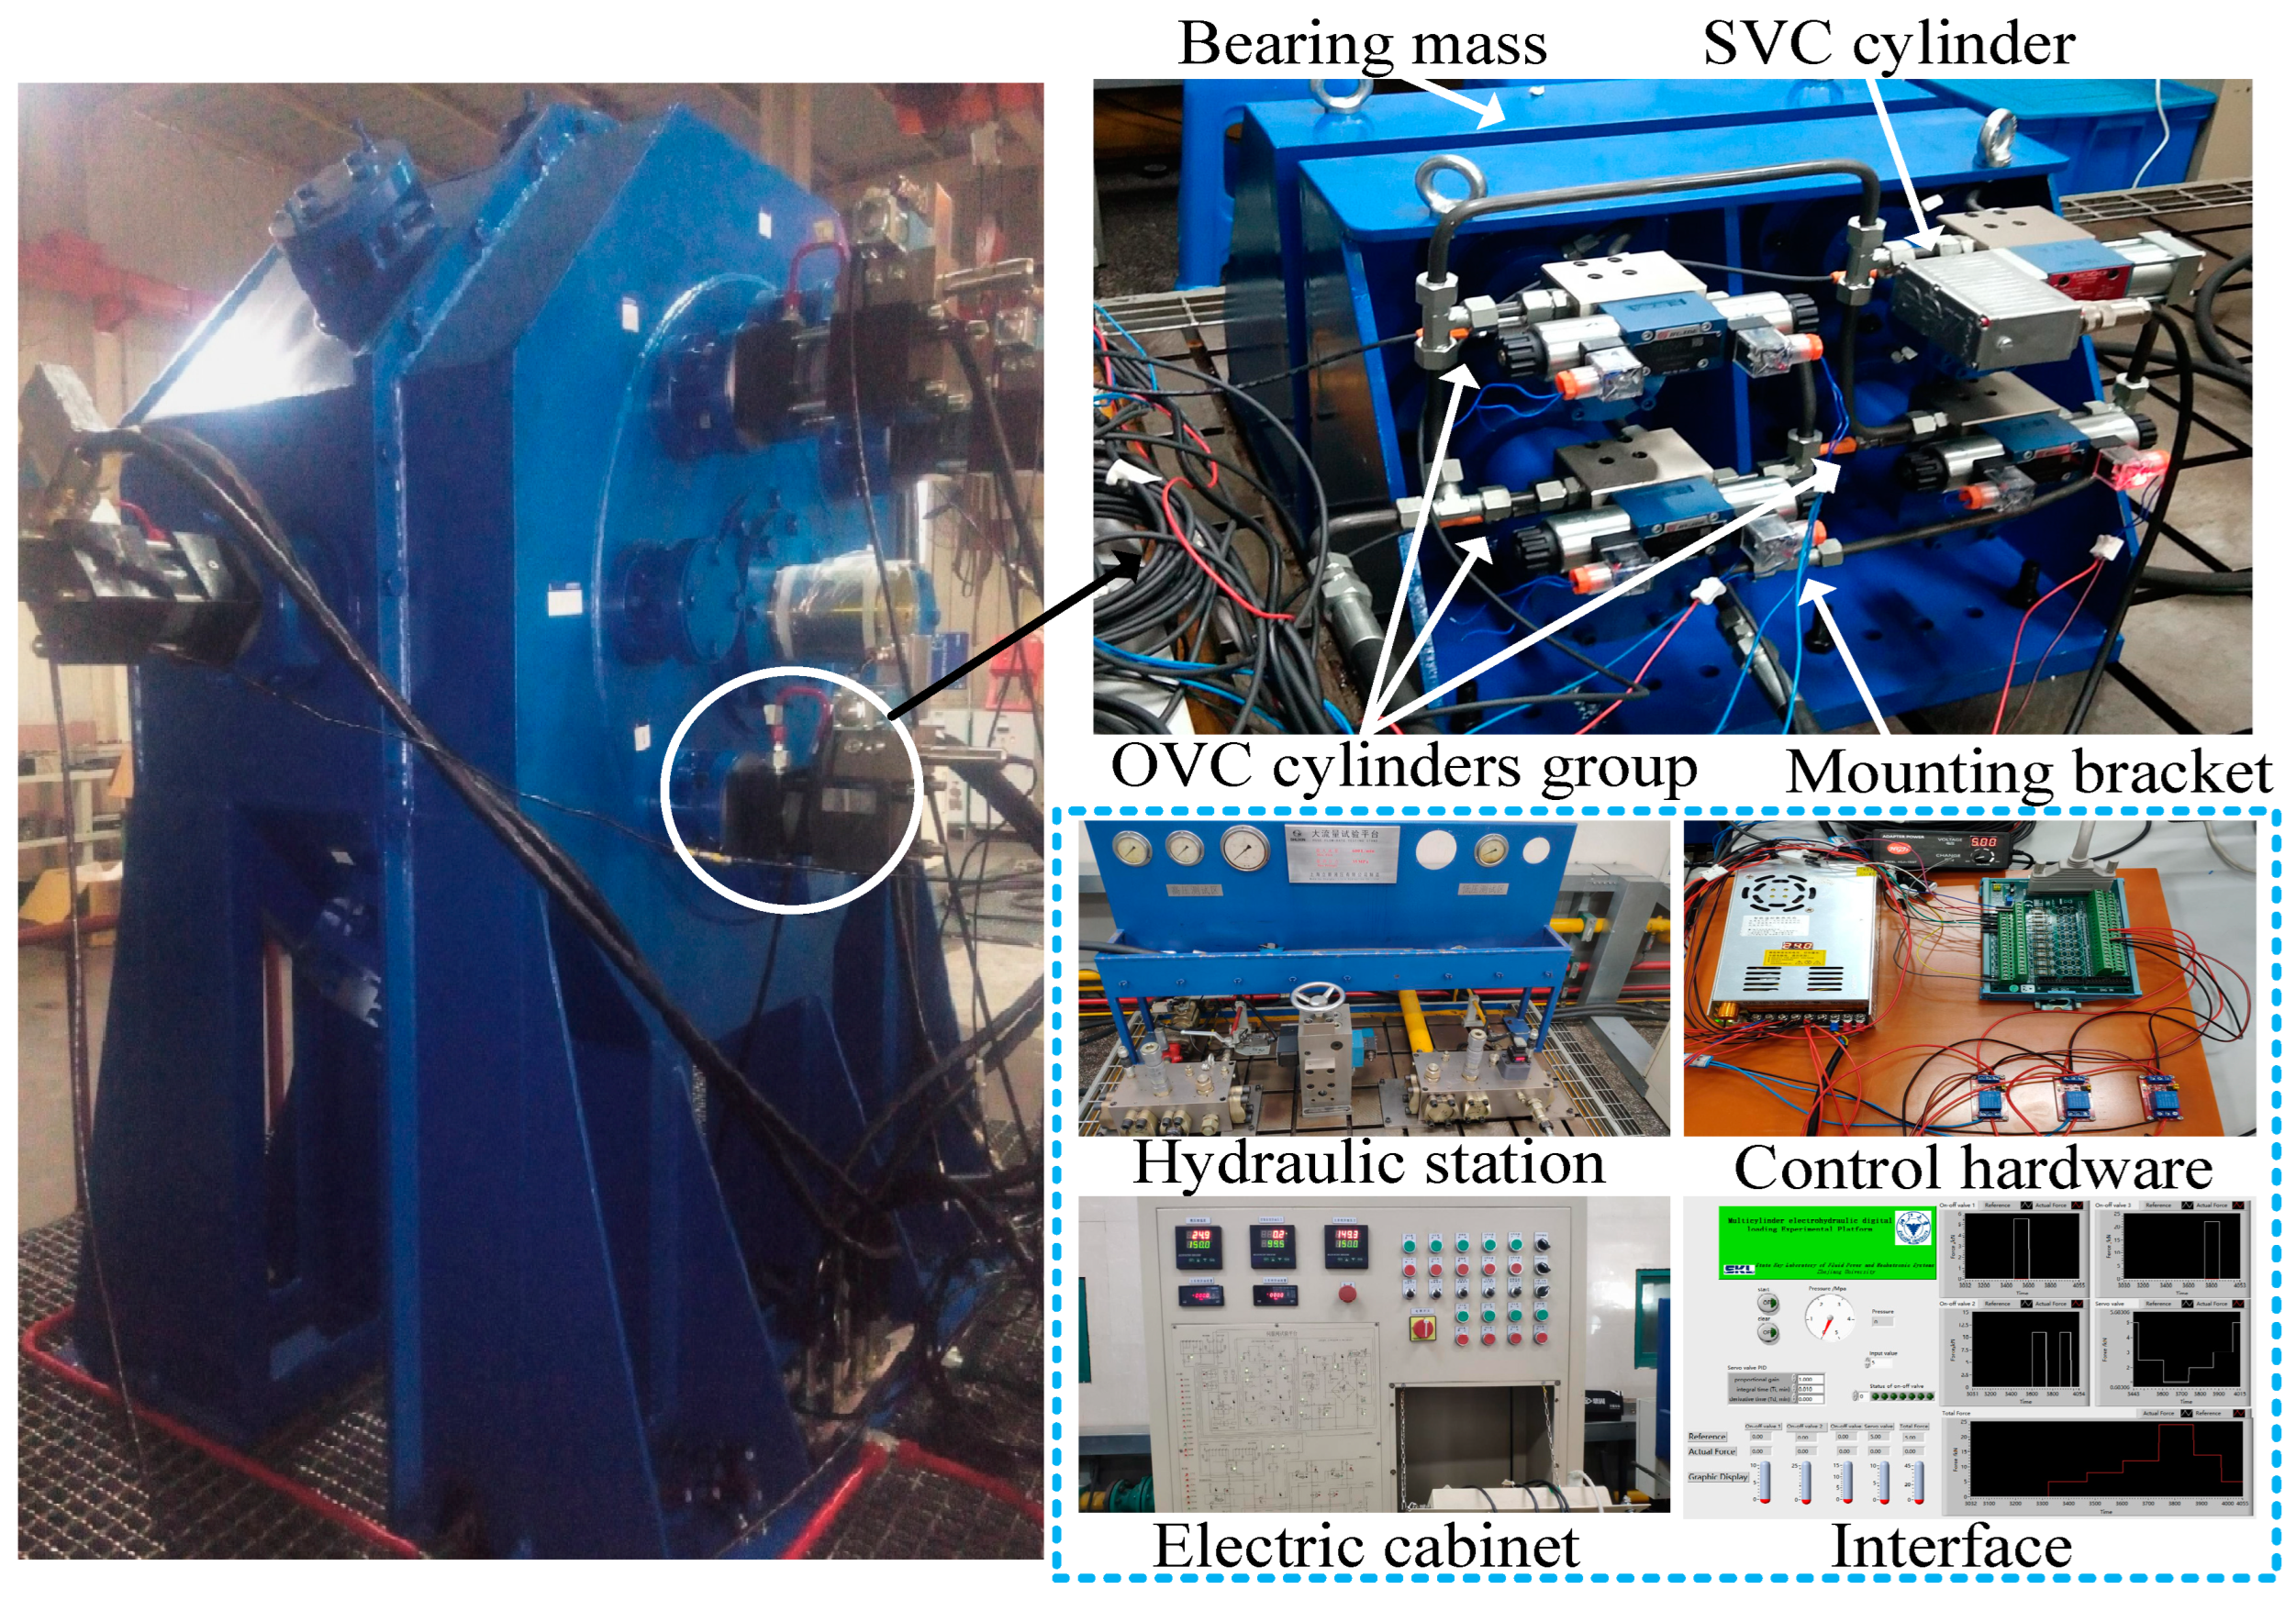
5.1. Experimental Setup

As illustrated in the left photo of Figure 10, experiments were first conducted in an NTL test bench to verify the analysis of the symmetrical loading scheme in the reproduction of the five DOF loads for a 100 kW wind turbine under normal operating conditions [24]. The reference force of each cylinder was derived by the GH Bladed software and therein calculated by Equation (1). The reproduced actual forces precisely tracked the five DOF reference loads. Thus, the loading scheme was capable of reproducing the five DOF wind loads with high tracking accuracy. Furthermore, to verify the effectiveness and the capability of the MEDSL technology and the SMC strategy, an experimental bench of a loading point was manufactured based on the study of four-cylinder loading, as shown in the right part of Figure 10. The single-point single cylinder was replaced by single-point four cylinders by using MEDSL technology as the white circle and black arrow indicated. The next four parts were the main components of the MEDSL device. The hydraulic station provided a hydraulic oil power source for the experiment, which was controlled by the electric cabinet. The control hardware included 5 V and 24 V DC power supply, acquisition card terminal board, and relay. The control system adopted an Advantech 610H industrial personal computer and a PCLD-8710 wiring terminal board. Then, the interface of the industrial computer through the LabVIEW program was presented.
The procedures behind the LabVIEW interface could be divided into the following steps. Firstly, according to Equation (6), the control signal u was determined by dividing the reference force to be replicated by a value pmax·S0. The load distribution consisted of eight cases, which were categorized according to the value of u. Secondly, in each signal case, the decimal portion was provided by the SVC cylinder, while the integer portion was determined by the OVC cylinders. Through the adjustment of both the spool displacement of the servo valve and the on-off valve states, the cylinders could activate in a case-dependent manner. Finally, the force error was generated by the comparison between the reference force and the actual total force of four cylinders. This error was subsequently employed in the SMC to formulate the loading control command, which was ultimately dispatched to the SVC cylinder.
To measure the loading force signals exerted by each hydraulic actuator piston, the strain gauges were affixed to their respective end points of pistons. The error between the actual force and the reference force can be calculated by the industrial computer. Feedback force signals were processed by the computer, which applied the SMC method in LabVIEW software to generate loading control commands. Subsequent to their generation, the valves could receive the loading control commands through data acquisition cards to regulate how much force the SVC cylinder outputs and decide the states of the remaining OVC cylinders. Therefore, the closed-loop control of four-cylinder loading was completed and eventually drove the actuators to accurately produce the given loading forces.

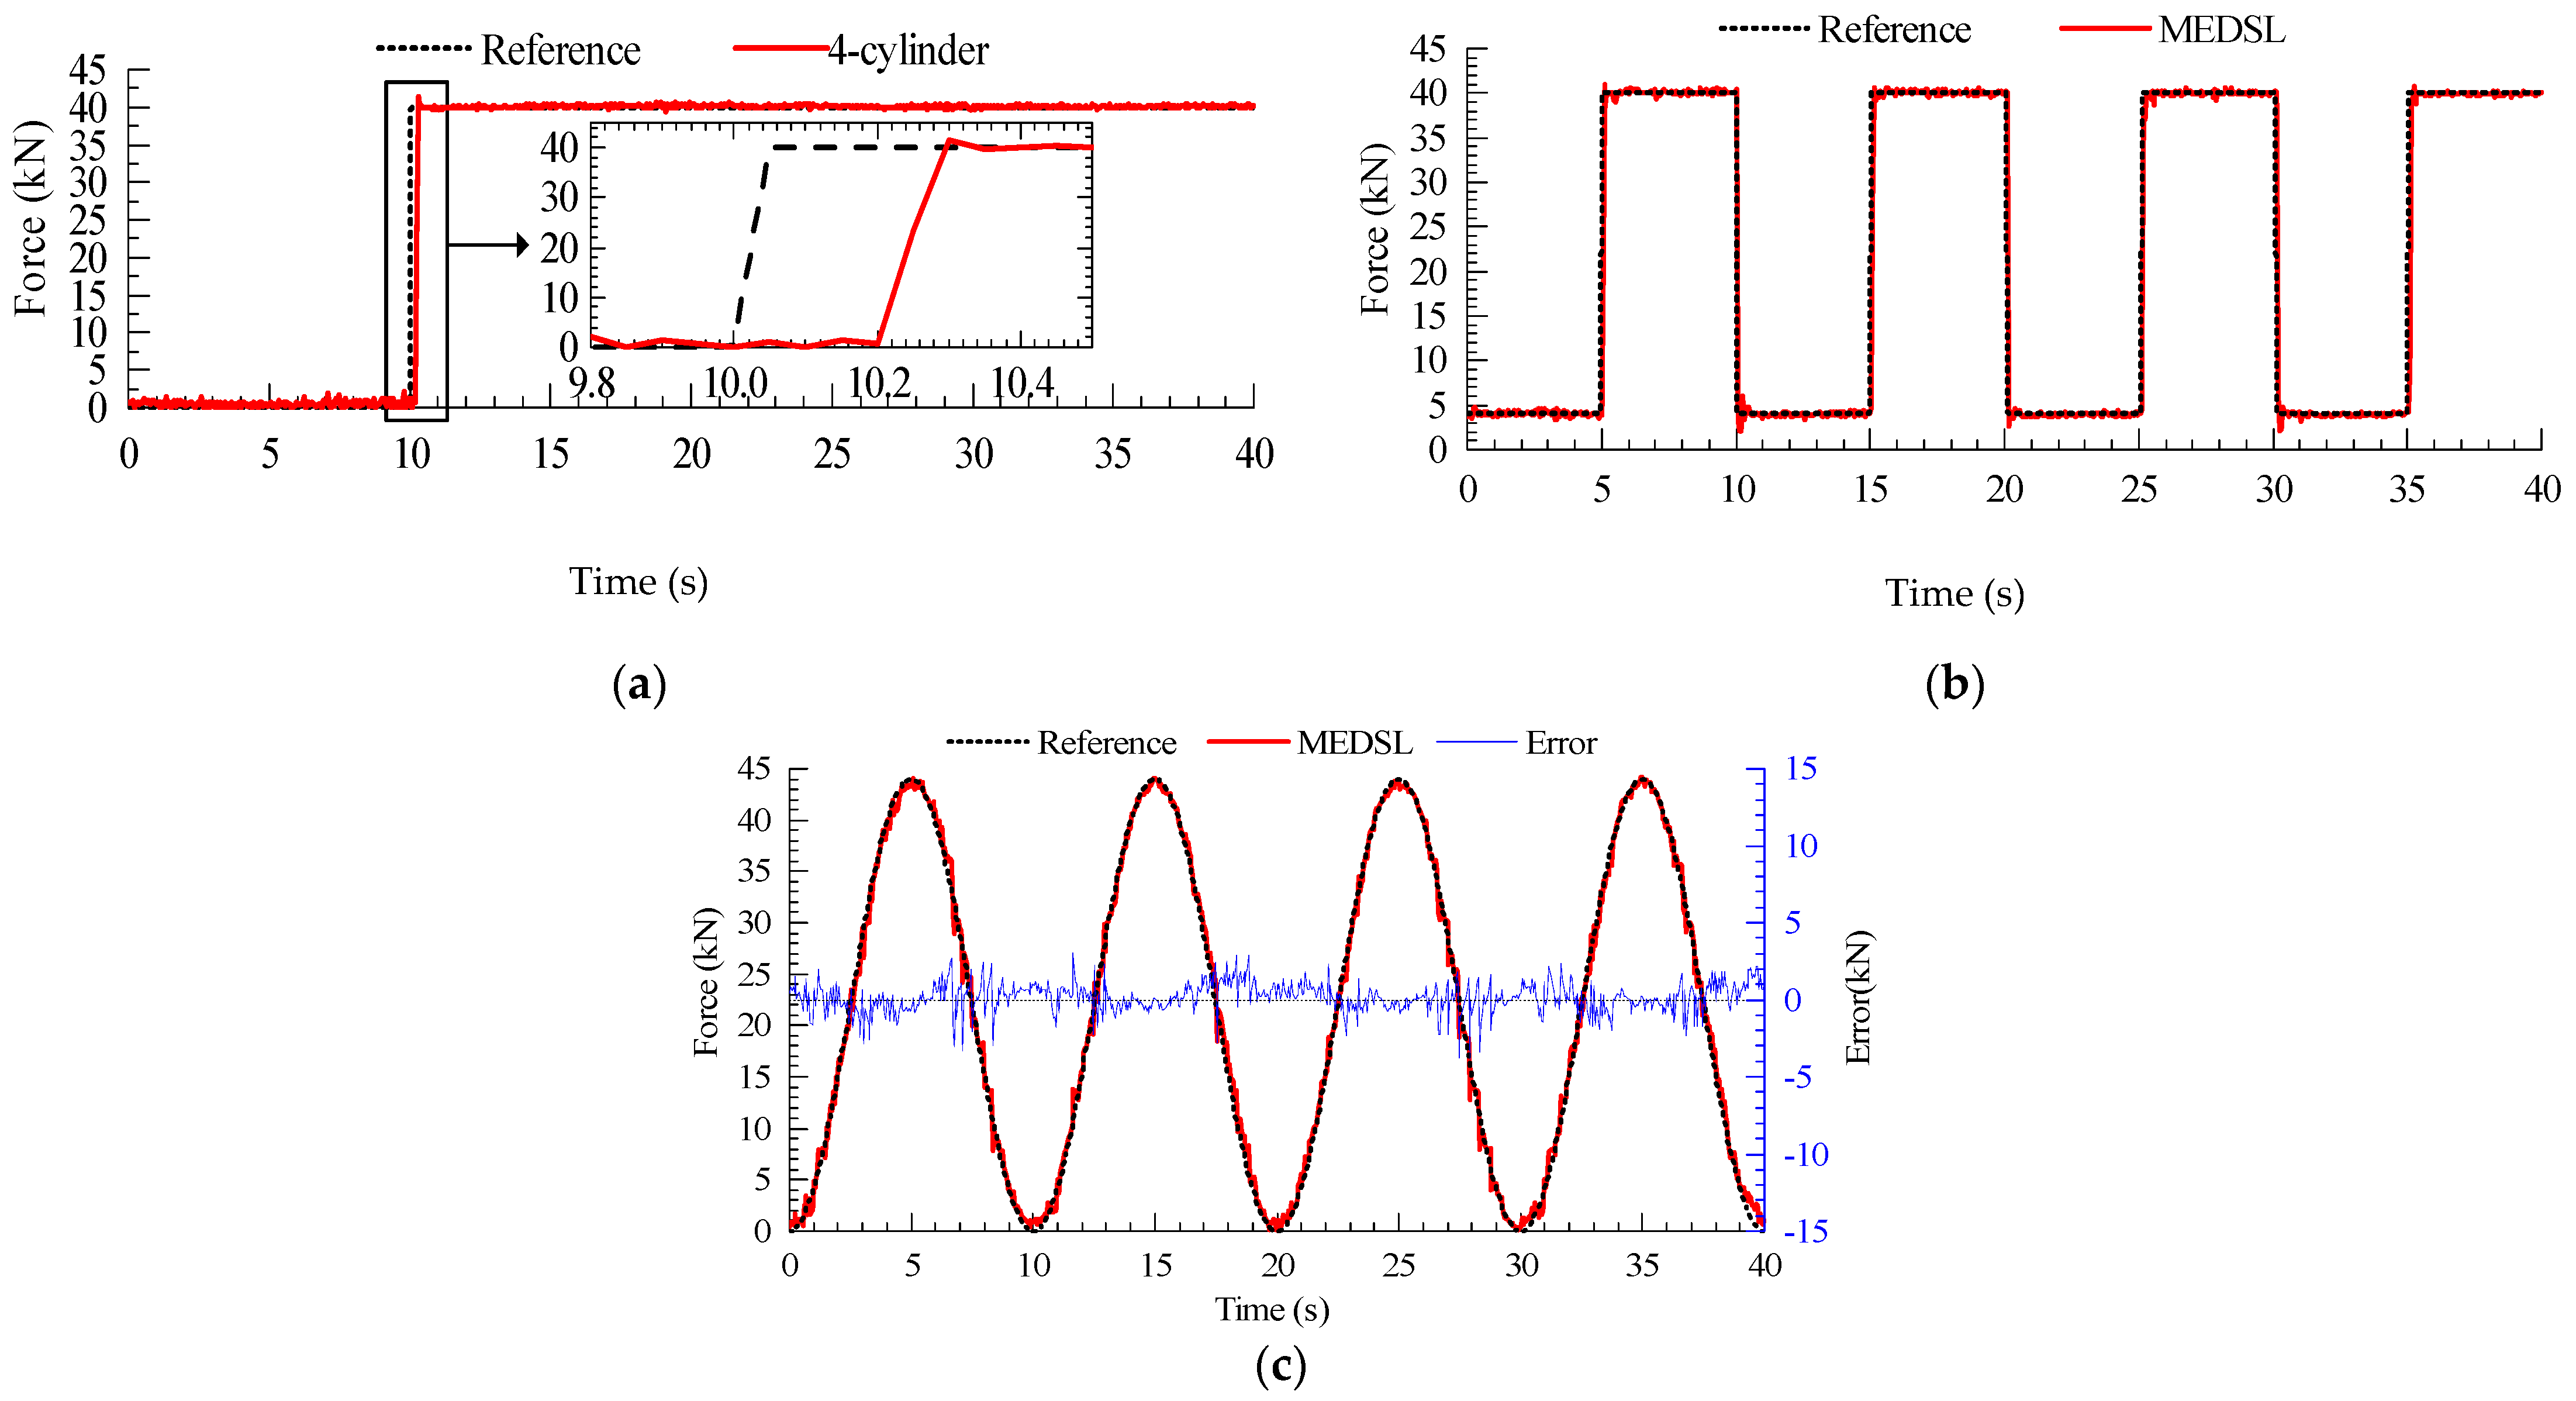
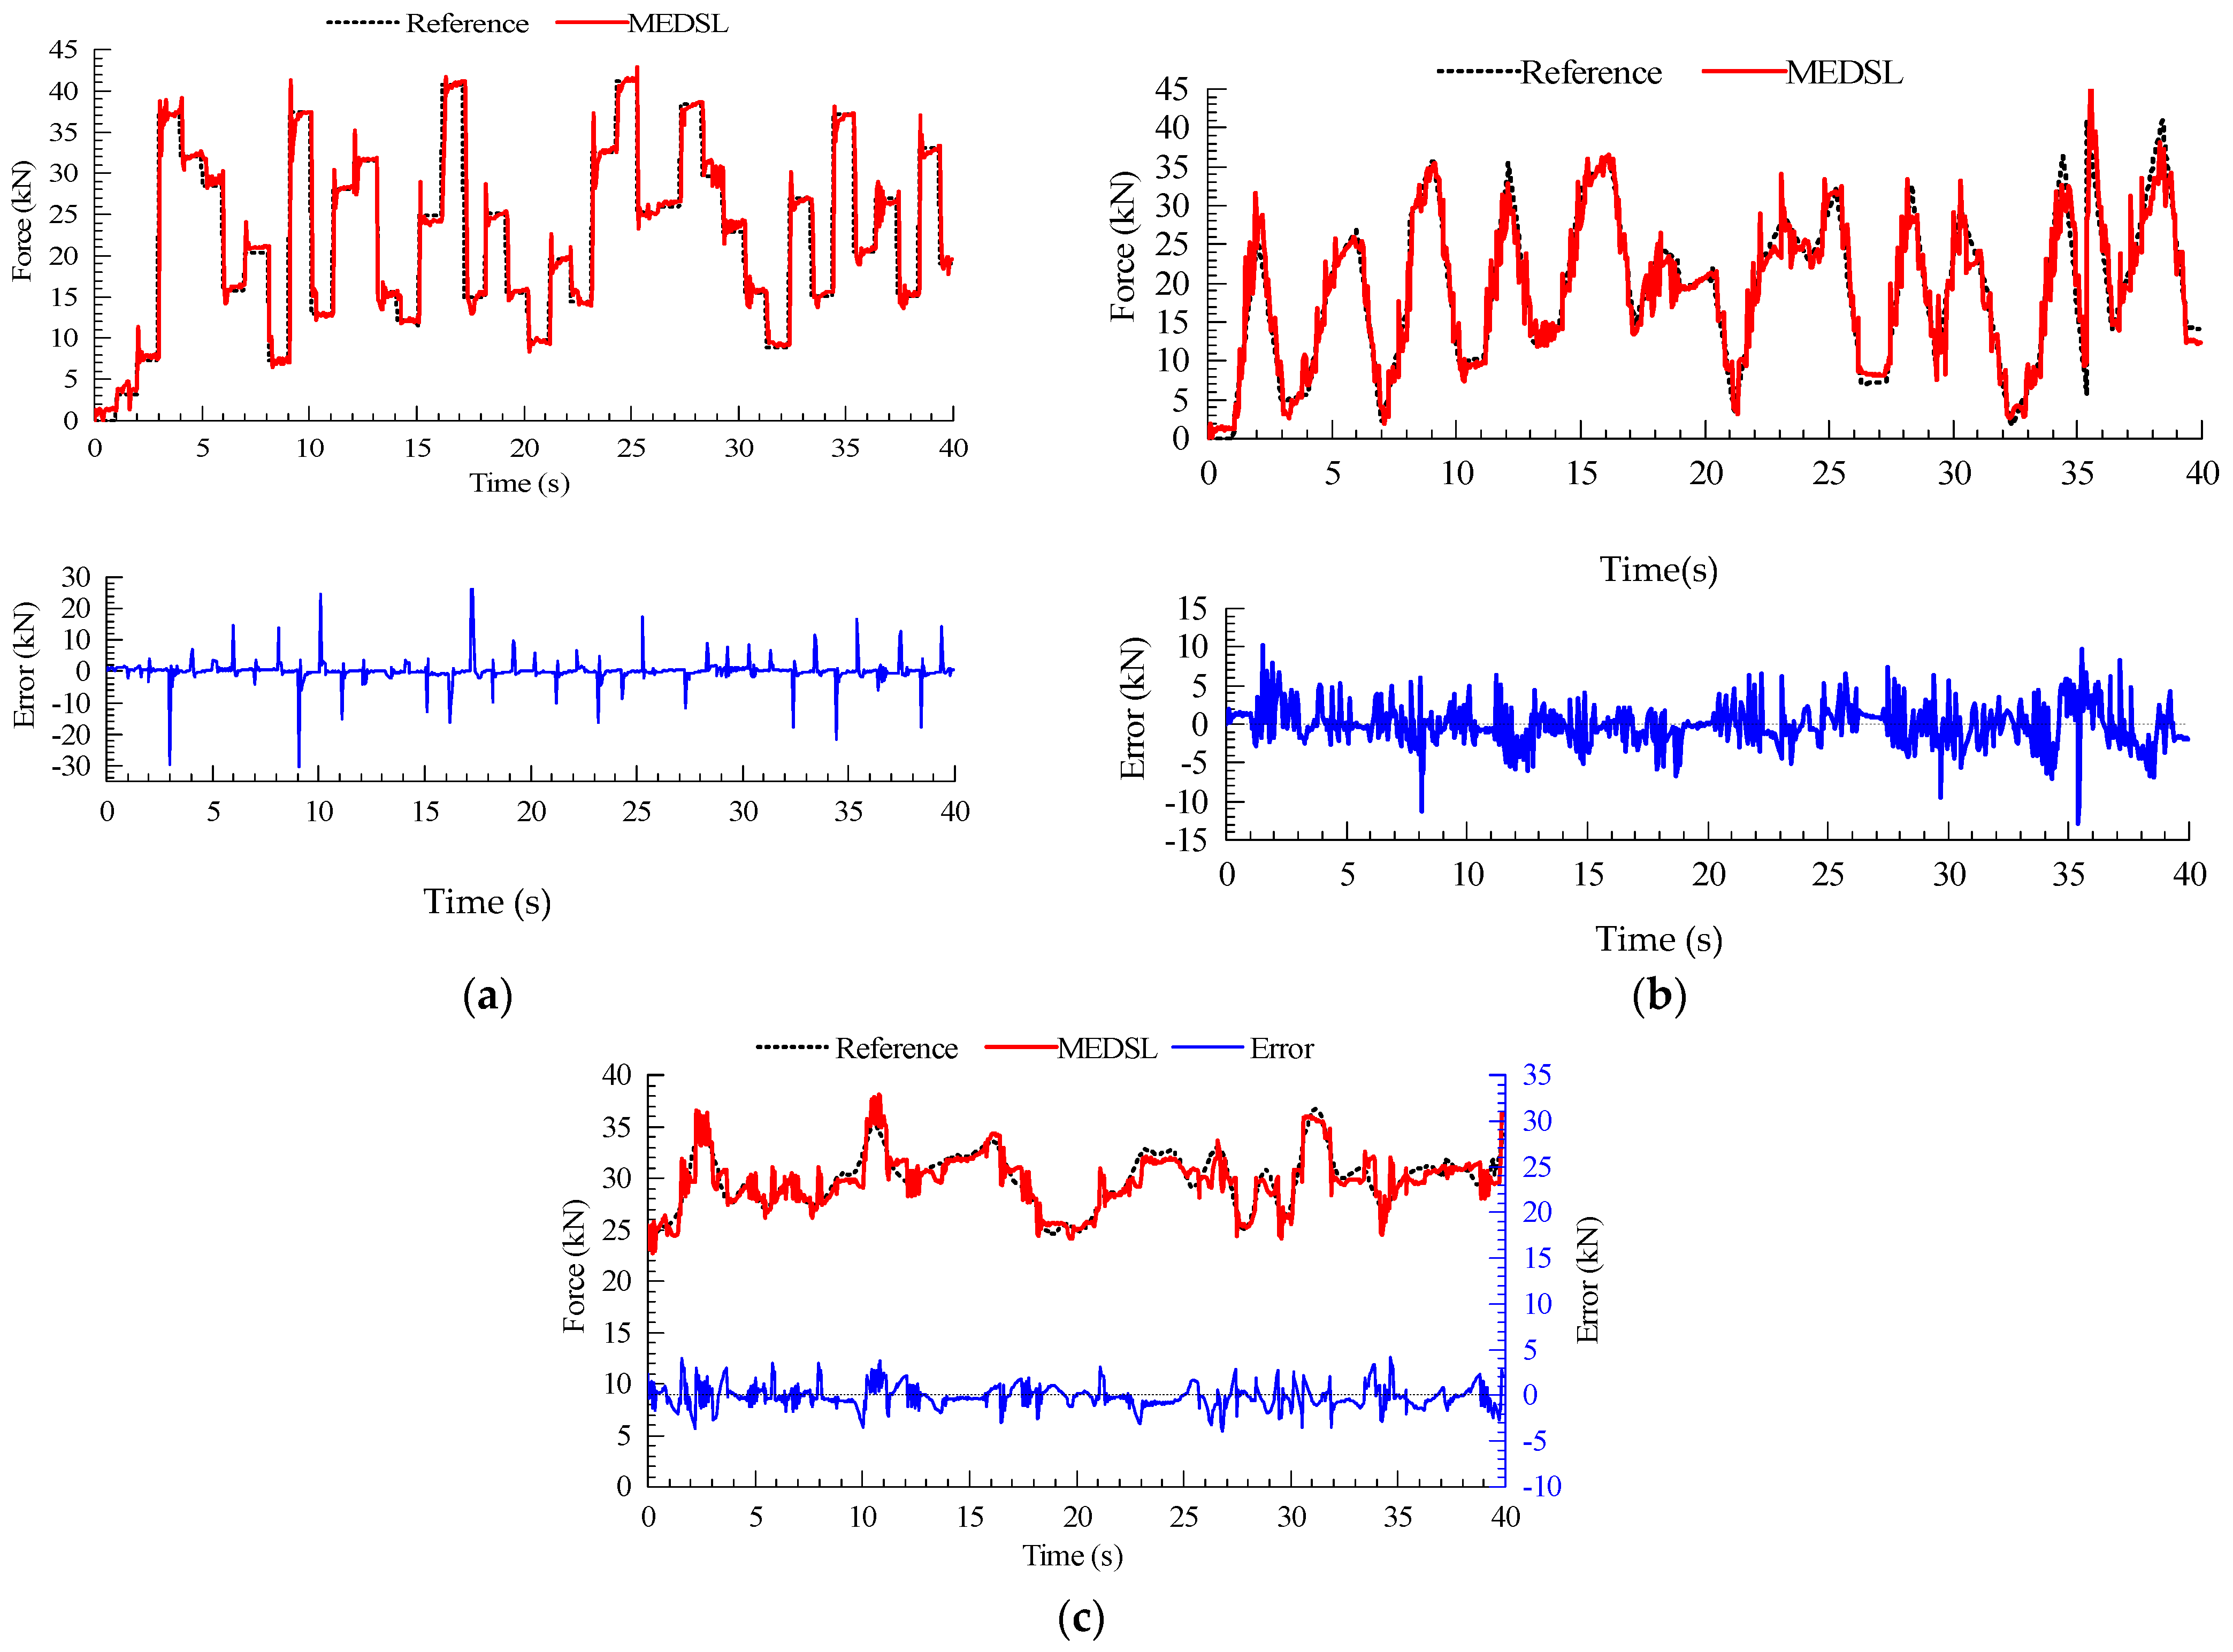
5.2. Experimental Results

The verification method of the controller was to use some basic signals, such as step, square wave, triangle wave, and sinusoidal wave, to validate the performance of the controller in the aspect of response time, overshoot, tracking error, and other characteristics. This paper evaluated the performance of the response time and overshoot by the step and square tests. Meanwhile, the tracking error and the time delay were assessed by the sinusoidal signal. To validate the improvement of accuracy for the proposed SMC method experimentally, the traditional used PID controller was applied in the experiment for comparison. A test of 5 kN step load for the SVC cylinder was first carried out, as illustrated in Figure 11a. The performance of the SMC was better compared with the PID controller. The response time of PID was twice as much as that of SMC. Additionally, the overshoot was about four times as that of SMC. Moreover, the loading error under SMC was much smaller than that of the PID, as shown in Table 3.
Meanwhile, other types of loads checked for the SVC cylinder are square and sine inputs, as presented in Figure 11b,c. It was observed that the tracking performance of the PID controller had a larger overshoot and more steady-state error for the square wave. Besides, the lag was obvious for the sinusoidal input of the PID controller. The loading average accuracy was improved by 66.4%, approximately, calculated in Table 3. This verified that the feasibility and the effectiveness of the proposed SMC, and the tracking performance could meet the demands of accurate control of loading force for MEDSL technology.
Extensive experiments have been conducted on the MEDSL bench under the SMC method. The MEDSL tracking for a 40 kN steady load was displayed in Figure 12a. The response time of four-cylinder loading was about 0.3 s. This was mainly because the response speed of the servo-valve was faster than that of the three on-off valves. As for control accuracy, due to the linear relationship between force and area, the loading error of a single large SVC cylinder was considered as eight times of the error values under SMC in Figure 11a, which is about 0.312 kN error average and 2.512 kN error range. Hence, the loading average accuracy was improved by 67%.
The tracking for square signal exhibited excellent results in Figure 12b. Although the response time was longer, there was almost no overshoot since the proportion of the SVC cylinder was greatly reduced. Besides, compared with eight times error values of the large SVC cylinder which was an 11.936 kN error range and 0.416 kN error average, the steady-state error immensely decreased. The results implicated that the loading range and average accuracy were increased by 58.7% and 54.6%, respectively.
The tracking behavior for the sine load was shown in Figure 12c. There were some small load sudden changes caused by the asynchronization of valve opening and closing. However, the whole tracking performance showed that the MEDSL precisely follows the reference force. For comparison, the error of a single large SVC cylinder was considered as eight times of the error values in Figure 11c, which is about 1.008 kN error average and 7.392 kN error range. The error average was reduced by 28%. Besides, compared with the results under the same 0.1 Hz sinusoidal loading condition without SMC [31], which was 9.182 kN error range and 1.445 kN error average, the loading accuracy was raised by 25.2% and 49.6%. The improvement demonstrated that the SMC is more effective than the previous full closed-loop PID controller.
Furthermore, based on the research on the variation frequency of actual wind load [37], 1 Hz dynamic loading frequency can meet the requirements of the wind turbine drivetrain test bench. Therefore, three types of random signals representing real wind loads have been conducted on the MEDSL test bench. Firstly, random loads were tested in step form, as shown in Figure 13a. There were peak values at each switching point due to the existence of the load response time. However, the steady-state error was relatively small, and the total error average value was only 1.352 kN. Random loads II and III were shown in Figure 13b,c, and both results revealed good tracking performance, and the error average of random load III was less than 1 kN.
The above results show that the loading error of the four-cylinder was less than the single SVC cylinder, and the SMC has a better effect compared with traditional PID. The experimental results have good agreement with the aforementioned discussion and simulation, and again validate the effectiveness and the feasibility of the presented MEDSL technology. In addition, the excellent loading performance of a single point builds a theoretical and experimental foundation for global loading.

6. Conclusions

In this paper, three main NTL structural schemes are introduced, based on dynamic structural analysis and loading information. To deal with the control inaccuracy in hydraulic loading systems due to the growing scale of the wind turbine, aiming at each loading point, this paper proposed a MEDSL technology for the precise reproduction of multi-DOF large loads representing real continuously turbulent wind loads. The successive accurate large loading can be realized by varying the loading area of the proposed cylinder group. Additionally, its downward compatibility is essential to the multi-stage drivetrain testing of MW-class wind turbines.
An SMC is proposed to further improve the loading accuracy of the SVC cylinder. The accuracy was increased by 67% in the 0.2 Hz sinusoidal loading simulation, as well as about 62% in the 5 kN steady-state load experiment compared with the PID controller. Both results under static and dynamic signals proved the excellent dynamic performance of the electrohydraulic system and the effectiveness of the proposed SMC. Based on the good reproducing performance of the five DOF wind loads on the NTL test bench, extensive experiments with an N = 4 case were conducted on a real full-loading bench using the designed SMC, which validated the feasibility and effectiveness of the proposed MEDSL technology. The results implicated the loading average accuracy was improved by 54.6% compared with a single SVC cylinder for the 0.1 Hz square loads. Additionally, the MEDSL exhibited excellent tracking performance for three random signals representing real wind loads. It builds a theoretical and technical foundation for the drivetrain testing system of MW-class wind turbines.

Author Contributions

Conceptualization, D.L. and Y.L.; methodology, D.L.; software, D.L.; validation, D.L. and Y.L.; formal analysis, J.S.; investigation, H.L.; resources, Y.S.; data curation, D.L.; writing—original draft preparation, D.L.; writing—review and editing, D.L. and Y.G.; visualization, J.S.; supervision, H.L.; project administration, Y.S.; funding acquisition, Y.L., Y.G., H.L. and Y.S. All authors have read and agreed to the published version of the manuscript.

Funding

This study was supported in part by the National Natural Science Foundation of China under Grant U22A20178, in part by the Science and Technology Project of Zhejiang Province under Grant 2023C01123, in part by the Natural Science Foundation of Zhejiang Province under Grant LY22E090001, in part by the Basic Public Welfare Research Program of Zhejiang Province under Grant LHZ21E090004, and in part by the Key R&D Program of Zhejiang Province under Grant 2021C03182.

Data Availability Statement

The data that support the findings of this study are available on request from the corresponding author.

Acknowledgments

We would like to thank Xiangheng Feng and Yong Sun for their support.

Conflicts of Interest

The authors declare no conflict of interest.

References

  1. Global Wind Energy Council. Global Wind Report 2022. Available online: https://gwec.net/global-wind-report-2022/ (accessed on 4 April 2022).
  2. Hybrid Drives the World MySE 16.0-242 Offshore Wind Turbine. Available online: https://news.bjx.com.cn/html/20210820/1171553.shtml (accessed on 20 August 2021).
  3. The Target of Offshore Wind Turbine is 20MW. Available online: https://wind.in-en.com/html/wind-2405805.shtml (accessed on 16 August 2021).
  4. Zhang, D.H.; Wang, J.Q.; Lin, Y.G.; Si, Y.L.; Huang, C.; Yang, J.; Huang, B.; Li, W. Present situation and future prospect of renewable energy in China. Renew. Sustain. Energy Rev. 2017, 76, 865–871. [Google Scholar] [CrossRef]
  5. Pérez, J.M.P.; Márquez, F.P.G.; Tobias, A.; Papaelias, M. Wind turbine reliability analysis. Renew. Sustain. Energy Rev. 2013, 23, 463–472. [Google Scholar] [CrossRef]
  6. Oh, K.Y.; Lee, J.K.; Bang, H.J.; Park, J.Y.; Lee, J.S.; Epureanu, B.I. Development of a 20 kW wind turbine simulator with similarities to a 3 MW wind turbine. Renew. Energy 2014, 62, 379–387. [Google Scholar] [CrossRef]
  7. Pagitsch, M.; Jacobs, G.; Schelenz, R.; Bosse, D.; Liewen, C.; Reisch, S.; Deicke, M. Feasibility of large-scale calorimetric efficiency measurement for wind turbine generator drivetrains. J. Phys. Conf. Ser. 2016, 753, 072011. [Google Scholar] [CrossRef] [Green Version]
  8. Averous, N.R.; Stieneker, M.; Kock, S.; Andrei, C.; Helmedag, A.; De Doncker, R.W.; Hameyer, K.; Jacobs, G.; Monti, A. Development of a 4 MW full-Size wind-turbine test bench. IEEE J. Emerg. Sel. Top. Power Electron. 2017, 5, 600–609. [Google Scholar] [CrossRef] [Green Version]
  9. Jassmann, U.; Frehn, A.; Röttgers, H.; Santjer, F.; Mehler, C.; Beißel, T.; Kaven, L.; von den Hoff, D.; Frühmann, R.; Azarian, S.; et al. CertBench: Conclusions from the comparison of certification results derived on system test benches and in the field. Forsch. Ingenieurwes. 2021, 85, 353–371. [Google Scholar] [CrossRef]
  10. Fraunhofer Institute for Wind Energy Systems, Nacelle Testing and Examination of Electrical Characteristics [EB/OL]. Available online: https://www.iwes.fraunhofer.de/en/test-centers-and-measurements/nacelle-testing-and-certification-of-electrical-characteristics.html (accessed on 4 August 2018).
  11. McKinney, M.H.; Fox, J.C.; Collins, E.R.; Bulgakov, K.; Salem, T.E. Design, development, and commissioning of a multimegawatt test facility for renewable energy research. IEEE Trans. Ind. Appl. 2016, 52, 11–17. [Google Scholar] [CrossRef]
  12. Schkoda, R.F.; Fox, C. Integration of mechanical and electrical hardware for testing full scale wind turbine nacelles. In Proceedings of the 2014 Clemson University Power Systems Conference, Clemson, SC, USA, 11–14 March 2014; pp. 1–8. [Google Scholar]
  13. Schkoda, R.F. Sliding mode control of a hydraulically actuated load application unit with application to wind turbine drivetrain testing. IEEE Trans. Control Syst. Technol. 2015, 23, 2203–2215. [Google Scholar] [CrossRef]
  14. Bibo, A.; Panyam, M. Evaluation of dynamic testing of full-scale wind turbine drivetrains with hardware-in-the-loop. Wind Eng. 2022, 46, 1550–1569. [Google Scholar] [CrossRef]
  15. Giguère, P.; Wagner, J.R. Experimental verification of predicted capability of a wind turbine drivetrain test bench to replicate dynamic loads onto multi-megawatt nacelles. Wind Eng. 2022, 46, 1047–1064. [Google Scholar] [CrossRef]
  16. Giguère, P.; Wagner, J.R. Acceptance criteria for the tracking error of wind turbine drivetrain test bench when replicating dynamic loads. Wind Eng. 2021, 46, 160–176. [Google Scholar] [CrossRef]
  17. Schkoda, R.F. Static uncertainty analysis of a wind turbine test bench’s load. In Proceedings of the 2015 American Control Conference (ACC), Chicago, IL, USA, 1–3 July 2015; pp. 3150–3155. [Google Scholar]
  18. 5Wind Turbine Test Beds: 15 MW Test Rig, 7.5 MW Test Rig. Available online: http://clemsonenergy.com/wind-turbine-test-beds (accessed on 10 September 2017).
  19. Offshorre Renewable Energy, Powertrain Testing Services. Available online: https://ore.catapult.org.uk/what-we-do/testing-validation/powertrain-facilities/ (accessed on 14 January 2019).
  20. National Renewable Energy Cener, Powertrain Test Laboratories and Electrical Testing. Available online: http://www.cener.com/en/wind-turbine-test-laboratory-lea/powertrain-test-laboratories-and-electrical-testing/ (accessed on 24 January 2019).
  21. R&D Test Systems is Developing the World’s Largest Test Bench for LORC. Available online: https://www.rd-as.com/insights/worlds-largest-test-bench-lorc/ (accessed on 17 March 2020).
  22. ZF Wind Power and R&D Test Systems to Develop 30MW Test Bench. Available online: https://www.rd-as.com/insights/zf-wind-power-and-rd-test-systems-to-develop-30mw-test-bench/ (accessed on 7 September 2022).
  23. Jassmann, U.; Reiter, M.; Abel, D. Driving torque control for a nacelle test bench. J. Phys. Conf. Ser. 2014, 524, 012068–012079. [Google Scholar] [CrossRef]
  24. Yin, X.; Lin, Y.; Li, W.; Ye, H. Loading system and control strategy for simulating wind turbine loads. J. Vib. Control 2015, 23, 1739–1752. [Google Scholar] [CrossRef]
  25. Xu, X.; Han, X.; Liu, Y.; Liu, Y.; Liu, Y. Modeling and dynamic analysis on the direct operating solenoid valve for improving the performance of the shifting control system. Appl. Sci. 2017, 7, 1266. [Google Scholar] [CrossRef] [Green Version]
  26. Abedinifar, M.; Ertugrul, S.; Tayyar, G.T. Design optimization of a solenoid actuator using particle swarm optimization algorithm with multiple objectives. Adv. Mech. Eng. 2022, 14, 1–12. [Google Scholar] [CrossRef]
  27. Oh, U.; Nonaka, N.; Ishimoto, J. Valve Optimization with System-fluid-magnetic Co-simulation and Design of Experiments. Int. J. Automot. Technol. 2022, 23, 683–692. [Google Scholar] [CrossRef]
  28. Yin, X.; Lin, Y.; Li, W.; Ye, H.; Gu, Y.; Liu, H. Reproduction of five degree-of-freedom loads for wind turbine using equispaced electro-hydraulic actuators. Renew. Energy 2015, 83, 626–637. [Google Scholar] [CrossRef]
  29. Liu, H.; Li, Y.; Lin, Y.; Bao, J.; Li, W.; Wang, Y. The application of the digital controlled hydraulic cylinders group in pendulum wave energy. IEEE/ASME Trans. Mechatron. 2020, 25, 673–682. [Google Scholar] [CrossRef]
  30. Yao, J.; Jiao, Z.; Ma, D.; Yan, L. High-accuracy tracking control of hydraulic rotary actuators with modeling uncertainties. IEEE/ASME Trans. Mechatron. 2014, 19, 633–641. [Google Scholar] [CrossRef]
  31. Lin, Y.; Li, D.; Gu, Y.; Liu, H.; Feng, X.; Ding, J. Multi-cylinder electrohydraulic digital loading technology for reproduction of large load. Mechatronics 2021, 76, 102559. [Google Scholar] [CrossRef]
  32. Xiao, L.; Lu, B.; Yu, B.; Ye, Z. Cascaded sliding mode force control for a single-rod electrohydraulic actuator. Neurocomputing 2015, 156, 117–120. [Google Scholar] [CrossRef]
  33. Lyu, L.; Chen, Z.; Yao, B. Advanced valves and pump coordinated hydraulic control design to simultaneously achieve high accuracy and high efficiency. IEEE Trans. Control Syst. Technol. 2021, 29, 236–248. [Google Scholar] [CrossRef]
  34. Gu, Y.; Lin, Y.; Xu, Q.; Liu, H.; Li, W. Blade-pitch system for tidal current turbines with reduced variation pitch control strategy based on tidal current velocity preview. Renew. Energy 2018, 115, 149–158. [Google Scholar] [CrossRef]
  35. Deng, P.; Zeng, L.; Liu, Y. RBF neural network backstepping sliding mode adaptive control for dynamic pressure cylinder electrohydraulic servo pressure system. Complexity 2018, 2018, 4159639. [Google Scholar] [CrossRef]
  36. Cerman, O.; Hušek, P. Adaptive fuzzy sliding mode control for electro-hydraulic servo mechanism. Expert Syst. Appl. 2012, 39, 10269–10277. [Google Scholar] [CrossRef]
  37. Hau, E. Wind Turbines: Fundamentals, Technologies, Application, Economics; Springer: Berlin/Heidelberg, Germany, 2013; pp. 528–533. [Google Scholar]
Figure 1. Schematic of wind turbine drivetrain test bench.
Energies 16 04659 g001
Figure 2. Photographs of the NTL schemes. (a) 7.5 MW test bench in Clemson University [18], (b) 15 MW wind turbine nacelle test facility in ORE Catapult [19], (c) 10 MW LORC nacelle function test rig [21].
Energies 16 04659 g002
Figure 3. Loading diagram of the symmetrical loading scheme. (a) axial loading; (b) radial loading.
Energies 16 04659 g003
Figure 4. Loading diagram of the radial eccentric loading scheme. (a) axial loading; (b) radial loading.
Energies 16 04659 g004
Figure 5. Loading diagram of the parallel six-hydraulic-cylinder loading scheme. (a) axial loading; (b) radial loading.
Energies 16 04659 g005
Figure 6. The schematic of the MEDSL loading (case N = 4) for the NTL bench.
Energies 16 04659 g006
Figure 7. Loading diagram of the MEDSL. (a) axial loading; (b) radial loading.
Energies 16 04659 g007
Figure 8. Simulation results of pL tracking performance between SMC and PID. (a) tracking result of pL; (b) tracking error of pL.
Energies 16 04659 g008
Figure 9. Simulation results of p ˙ L tracking performance between SMC and PID. (a) tracking result of p ˙ L ; (b) tracking error of p ˙ L .
Energies 16 04659 g009
Figure 10. Experimental platform of the NTL and the MEDSL device.
Energies 16 04659 g010
Figure 11. Experimental results of the SVC cylinder in response to (a) 5 kN steady-state load, (b) 0.1 Hz square load, and (c) 0.1 Hz sinusoidal load.
Energies 16 04659 g011
Figure 12. Experimental results of four-cylinder loading in response to (a) 40 kN steady-state load, (b) 0.1 Hz square load, and (c) 0.1 Hz sine load.
Energies 16 04659 g012
Figure 13. Experimental results of four-cylinder loading in response to (a) random load I and its loading error, (b) random load II and its loading error, and (c) random load III and its loading error.
Energies 16 04659 g013
Table 1. Character of NTL loading schemes.
Loading SchemeLoading ActuatorsLoading VectorsAdvantageDisadvantage
Symmetrical scheme2412Simple solving procedureDifficult hydrostatic support
Radial eccentric scheme2816Can provide large bending momentComplex calculation process
Parallel six-hydraulic-cylinder scheme66Few control vectorsLarge displacement of the platform and complicated decoupling process
Table 2. Parameters of the SVC cylinder pressure system.
ComponentParameterValueComponentParameterValue
Hydraulic oilDensity/kg·m−3850Hydraulic sourcePressure source/MPa5
Bulk modulus/MPa800Pump displacement cc/rev100
SVC cylinderPiston diameter/mm50Typical speed of pump rev/min1500
Rod diameter/mm32
Cylinder stroke/mm50LoadMass/kg20,000
a11646SMC c150,000
a23.156 × 1014c210
a3363,100 ε 10,000
a411,460k20
a5147.4 ϕ 0.001
Table 3. Experiment results.
TypeSingle SVC CylinderMEDSL
Index5 kN steady-state loadSquare loadSinusoidal load40 kN steady-state loadSquare loadSinusoidal loadRandom load
PIDSMCPIDSMCPIDSMCIIIIII
FigureFigure 11aFigure 11bFigure 11cFigure 12aFigure 12bFigure 12cFigure 13aFigure 13bFigure 13c
Response time (s)0.300.150.1630.10 0.300.425
Overshoot9.31%2.24%13.21%6.68%3.36%1.03%
Error range (kN)1.3280.3143.1291.4922.4130.9241.1854.9326.87056.64423.1158.147
Error average (kN)0.1030.0390.0750.0520.3760.1260.1030.1890.7281.3521.9790.963
Disclaimer/Publisher’s Note: The statements, opinions and data contained in all publications are solely those of the individual author(s) and contributor(s) and not of MDPI and/or the editor(s). MDPI and/or the editor(s) disclaim responsibility for any injury to people or property resulting from any ideas, methods, instructions or products referred to in the content.

