Article

Validation of the CFD Tools against In-House Experiments for Predicting Condensing Steam Flows in Nozzles

1
Department of Power Engineering and Turbomachinery, Silesian University of Technology, 44-100 Gliwice, Poland
2
Center of Computational Energy, Department of Mechanical Engineering, Hakim Sabzevari University, Sabzevar 9617976487, Iran
3
Department of Mechanical Engineering, Andong National University, Andong 36729, Republic of Korea
4
School of Mechanical and Power Engineering, Zhengzhou University, Zhengzhou 450001, China
*
Author to whom correspondence should be addressed.
Energies 2023, 16(12), 4690; https://doi.org/10.3390/en16124690
Submission received: 24 May 2023 / Revised: 9 June 2023 / Accepted: 9 June 2023 / Published: 13 June 2023
(This article belongs to the Section J1: Heat and Mass Transfer)

Abstract

:
The issues addressed in this work concern the condensing steam flows as a flow of a two-phase medium, i.e., consisting of a gaseous phase and a dispersed phase in the form of liquid droplets. The two-phase character and the necessity to treat steam as a real gas make the numerical modeling of the flow in the last steam turbine channels very difficult. There are many approaches known to solve this problem numerically, mainly based on the RANS method with the Eulerian approach. In this paper, the two Eulerian approaches were compared. In in-house CFD code, the flow governing equations were defined for a gas–liquid mixture, whereas in ANSYS CFX code, individual equations were defined for the gas and liquid phase (except momentum equations). In both codes, it was assumed that there was no velocity slip between phases. The main aim of this study was to show how the different numerical schemes and different governing equations can affect the modeling of wet steam flows and how difficult and sensitive this type of computation is. The numerical results of condensing steam flows were compared against in-house experimental data for nozzles determined at the Department of Power Engineering and Turbomachinery of the Silesian University of Technology. The presented experimental data can be used as a benchmark test for researchers to model wet steam flows. The geometries of two half nozzles and an International Wet Steam Experimental Project (IWSEP) nozzle were used for the comparisons. The static pressure measurements on the walls of the nozzles, the Schlieren technique, and the droplet size measurement were used to qualitatively identify the location of the condensation onset and its intensity. The CFD results obtained by means of both codes showed their good capabilities in terms of proper prediction of the condensation process; however, there were some visible differences in both codes in the flow field parameters. In ANSYS CFX, the condensation wave location in the half nozzles occurred much earlier compared to the experiments. However, the in-house code showed good agreement with the experiments in this region. In addition, the results of the in-house code for the mean droplet diameter in the IWSEP nozzle were closer to the experimental data.

1. Introduction

Due to its thermodynamic properties and availability, steam is often used as a working medium in many industrial installations, especially in power units such as fossil fuel, nuclear, and thermal solar power plants. An important field of application is its use as a thermodynamic medium in power machinery and equipment, primarily in steam turbines, steam boilers, steam cooling facilities, nuclear power plant cycles, condensing equipment, cooling towers, etc. [1,2,3,4]. The arising wet steam structure is most often characterized by the occurrence of different fractions of the liquid phase; i.e., groups of droplets that differ from each other in size, concentration, and thermal parameters due to different phenomena responsible for the droplet formation. The typical way in which the first liquid droplets appear in flow channels is their spontaneous homogeneous condensation during the rapid expansion of dry steam in the low-pressure stages of steam turbines [5,6,7,8,9]. This leads to the formation of so-called nuclei, which are a collection of molecules capable of further growth under the conditions of the surrounding gaseous phase. Further growth of nuclei by steam condensation on their surfaces occurs very rapidly and hence is treated as a discontinuous phenomenon in the flow (the condensation wave) that leads to thermodynamic and aerodynamic losses in steam turbines [10,11,12]. Predicting the condensation phenomenon as accurately as possible is of particular importance because it has a significant impact on the development of highly efficient steam turbines. Despite the many research projects that has been conducted in this field, further efforts to improve the numerical models are always necessary because there are still shortcomings and uncertainties in the modeling of wet steam condensing flows.
In recent decades, researchers have continually been trying to improve their condensation models using different CFD software to predict the condensation phenomenon with high accuracy. The problem of discrepancies in the results obtained in the CFD using various commercial and numerical codes is generally discussed quite often in various types of publications. In addition, there are often large discrepancies in the results of numerical calculations for numerical codes using similar turbulence models and process settings. Furthermore, the calculations are usually inconsistent with the results of experimental research. One of the most important of the latest papers devoted to numerical research on condensing steam flows in nozzles is the paper by Starzmann et al. [13] that summarized the result of the International Wet Steam Modeling Project (IWSMP). Investigations were carried out with international cooperation of the ability of computational methods to predict condensing steam flows. Most of the condensation models presented in the concluding article achieved qualitatively satisfactory agreement with experimental data; however, the authors showed that there were some discrepancies in the results of individual calculations. Many of these differences were due to the different condensation models adopted, but it seemed that some of them were also due to different approaches to the implementation of these models and the underlying solvers in which they were used. The authors point outed the great need to work on the unification of the codes used and more precisely refine selected calculation parameters to better match the results of their calculations. A definite conclusion was that research on numerical modeling and experimental testing of the steam condensing flow should be continued.
Many different types of tests conducted for different nozzle geometries or blade channels with the flow of a two-phase wet steam medium also confirmed the observed imperfections in the calculation results. However, they were usually carried out only with the use of a single code or commercial CFD code or were not compared at all with the results of experimental research. Halama et al. [14,15] developed the numerical method for the modeling of wet steam transonic flows. They simulated wet steam flows through nozzles, turbine cascades, and turbine stages using their in-house CFD code. Similar studies on the numerical comparison with an experiment for a convergent–divergent nozzle were conducted by Zhang et al. [16]. Grübel et al. [17] investigated numerically wet steam models in the low-pressure steam turbine stages using ANSYS CFX software. The numerical calculations performed under the project provided significantly different results despite the fact that the results were obtained using very similar methods and computational models. Ihm et al. [18] proposed a scheme to simulate gas–liquid two-phase flows at all speeds using their in-house CFD code. There also have been many studies on flows in steam turbine stages showing the aforementioned dependencies; e.g., Li et al. [19] or Yamamoto [20]. Wu et al. [21] simulated wet steam flow in a supersonic turbine cascade by using an in-house CFD code, and the effect of inlet supercooling on the self-excited oscillation of wet steam flow was analyzed. The authors of all these studies confirmed in their conclusions the need for further work on improving the condensation models used, especially with a validation process against new experimental data. The relatively new experimental research on the condensing steam flow in nozzles and the linear cascade was carried out by a group of researchers from SUT [22,23,24]. The numerical results were obtained by means of an in-house CFD code. The performed comparison of the in-house CFD results and experimental data resulted in a satisfactory conclusion regarding the agreement between static pressure distributions as well as the wetness fraction quantity. However, there was a necessity to use another CFD code to make the validation process more reliable.
Unlike the previous studies, examples of which were mentioned above, in the current research two numerical codes including the SUT in-house CFD code and the ANSYS CFX were used to model the steam condensing flows in two types of nozzles. The results of the two codes were compared with the SUT in-house experiments, and finally a discussion about which case offered more reliable results is presented. The aim of this research was not to show which CFD code was better but to show how difficult and sensitive this type of computation is. The difference between the numerical results obtained from the academic in-house code and the commercial code justified the reason for conducting experimental testing of this type of flows, among other things, to enable verification of the methods and validation of the computational models implemented in CFD codes.

2. Experimental Facility

Selected test chambers with two types of nozzles for testing steam condensing flows were used. For this purpose, the research steam tunnel located in the SUT Thermal Machinery Hall was used. Research using this installation has been extensively described in publications over the last several years [22,23,24]. The experimental testing facility (Figure 1) is a part of a small condensing steam power plant and was designed to perform experiments for condensing steam flows in nozzles or linear cascades. Superheated steam is supplied from a 1 MW Velox-type boiler. The steam maximum mass flow rate is about 3 kg/s. The superheated steam conditions are controlled under sliding pressure in the boiler and desuperheater (14) at the steam pipeline. The parameters upstream of the testing facility are controlled precisely by means of a control valve (1) and an additional desuperheater. The condensate chemical analysis makes it possible to assume that the condensation process taking place in the flow through the cascade has a purely homogeneous character. The total inlet pressure can vary in the range of 70–150 kPa(a) and the total temperature between 70–120 °C.
The measuring chambers were designed while considering the possibility of visualizing the flow field using the Schlieren technique [23,24], the measurements of selected parameters of the flow field, and the static pressure distribution on the surfaces of tested elements. Two types of nozzles were selected for testing in the measuring chambers: a half nozzle with different geometries and a nozzle used in the aforementioned IWSEP.

2.1. The Half Nozzles

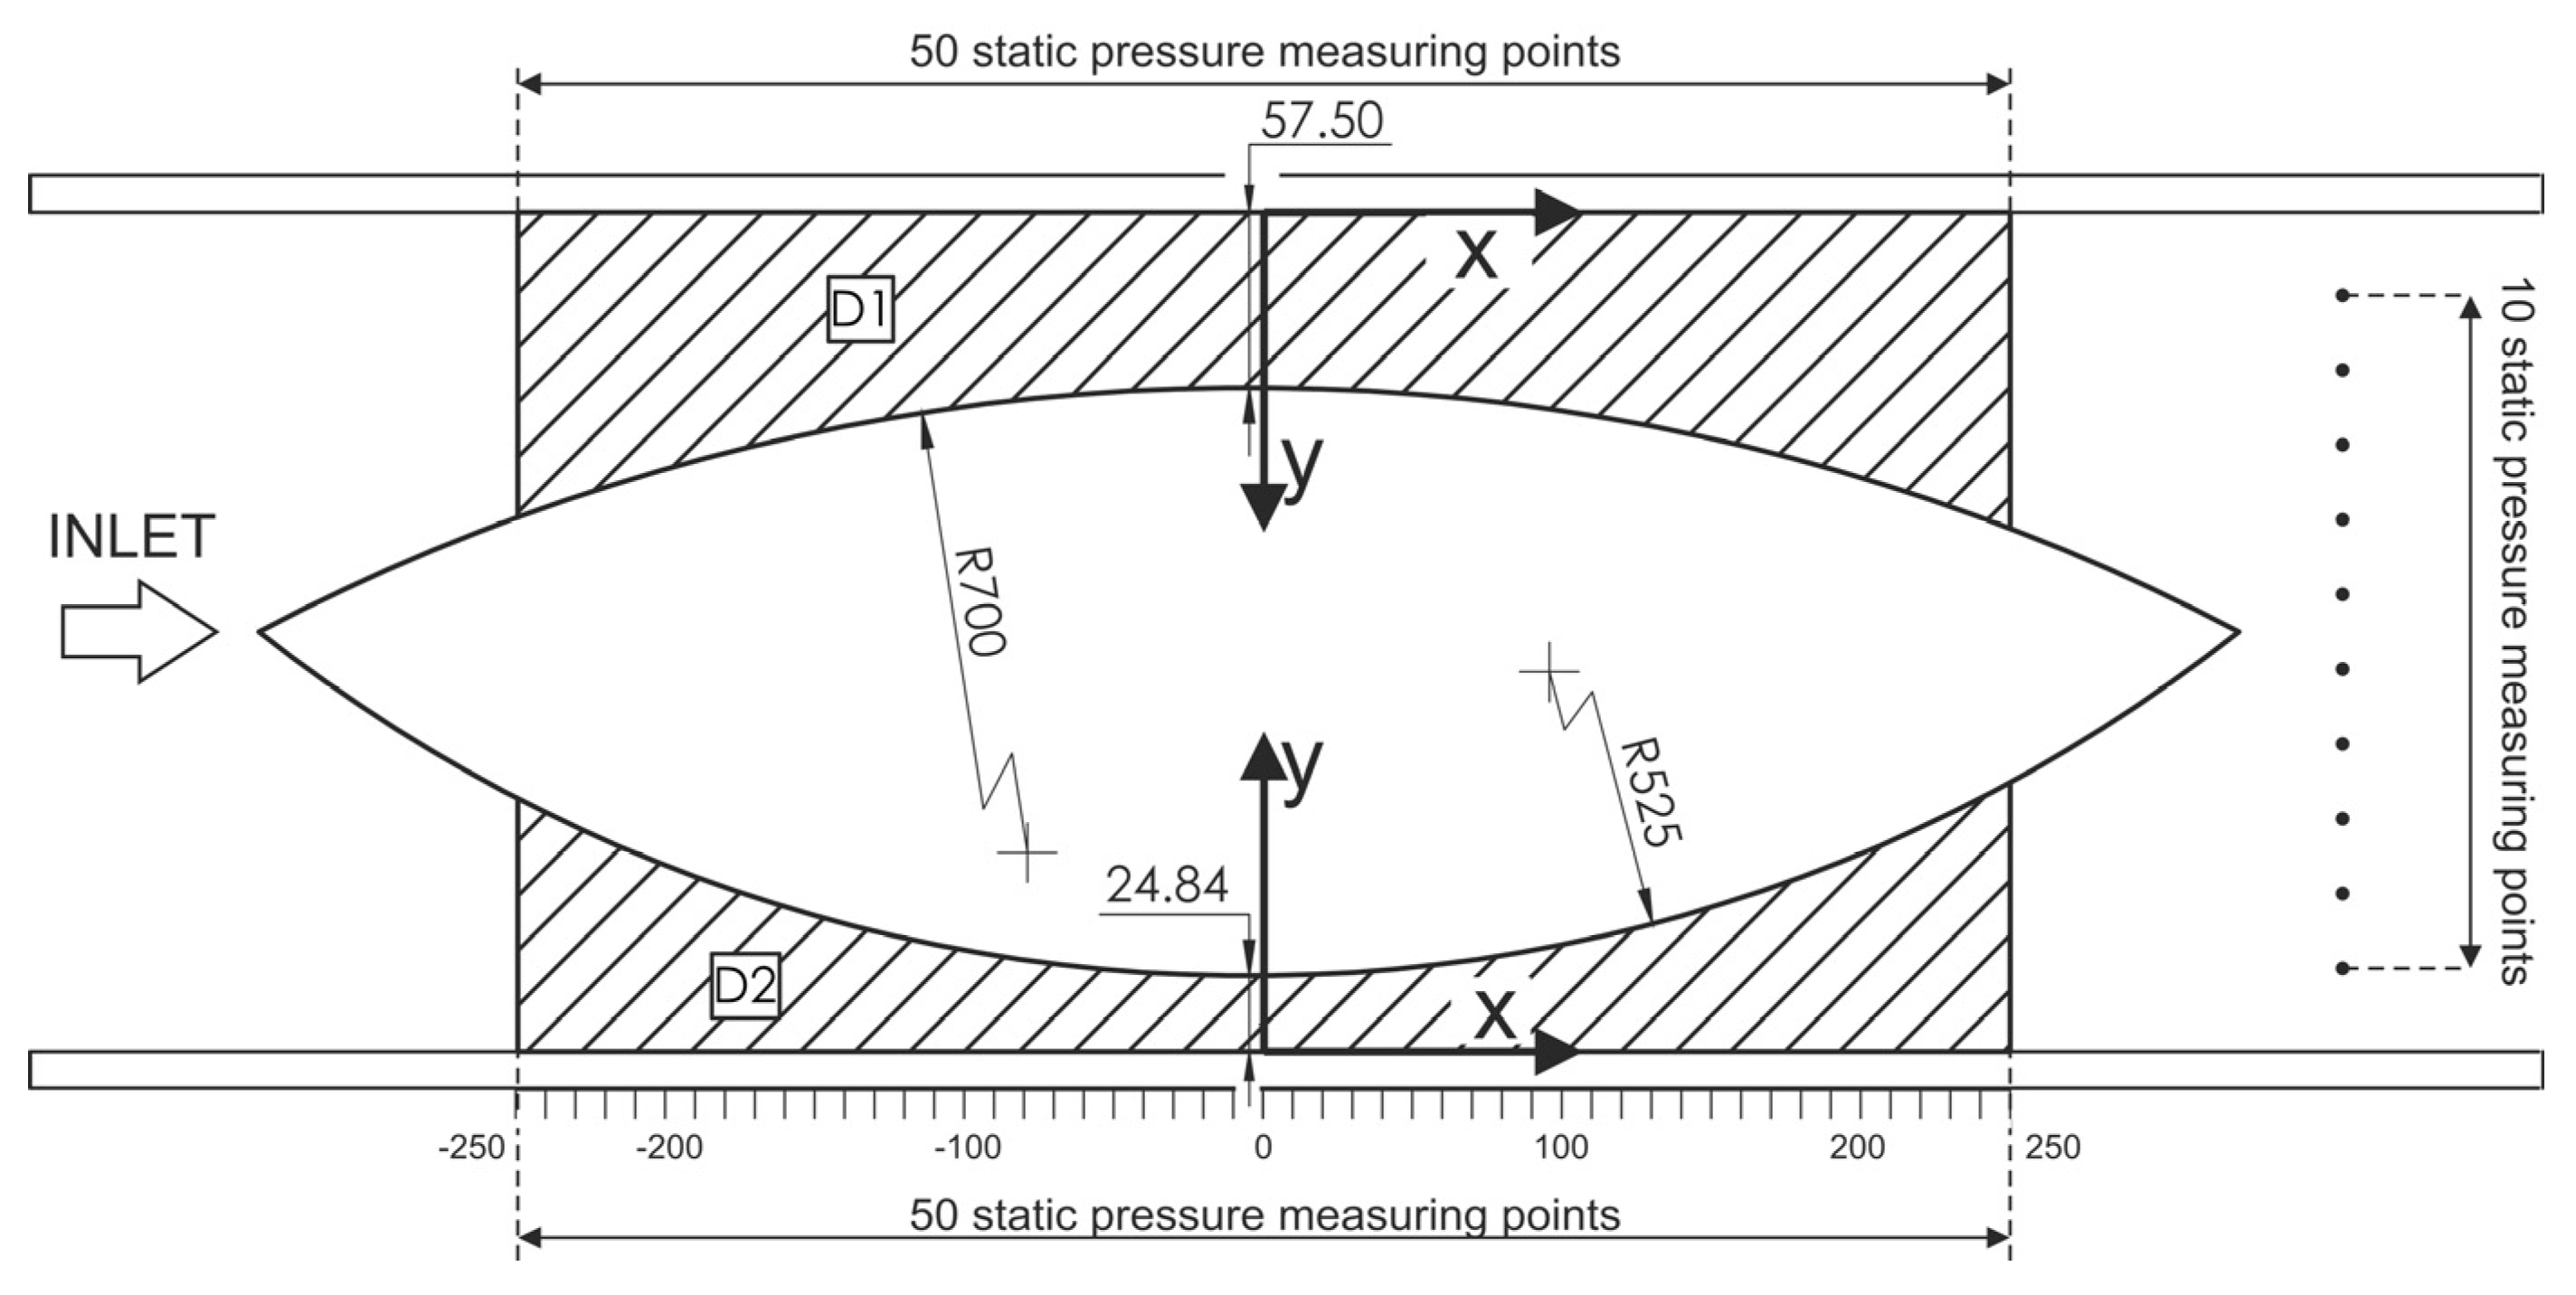
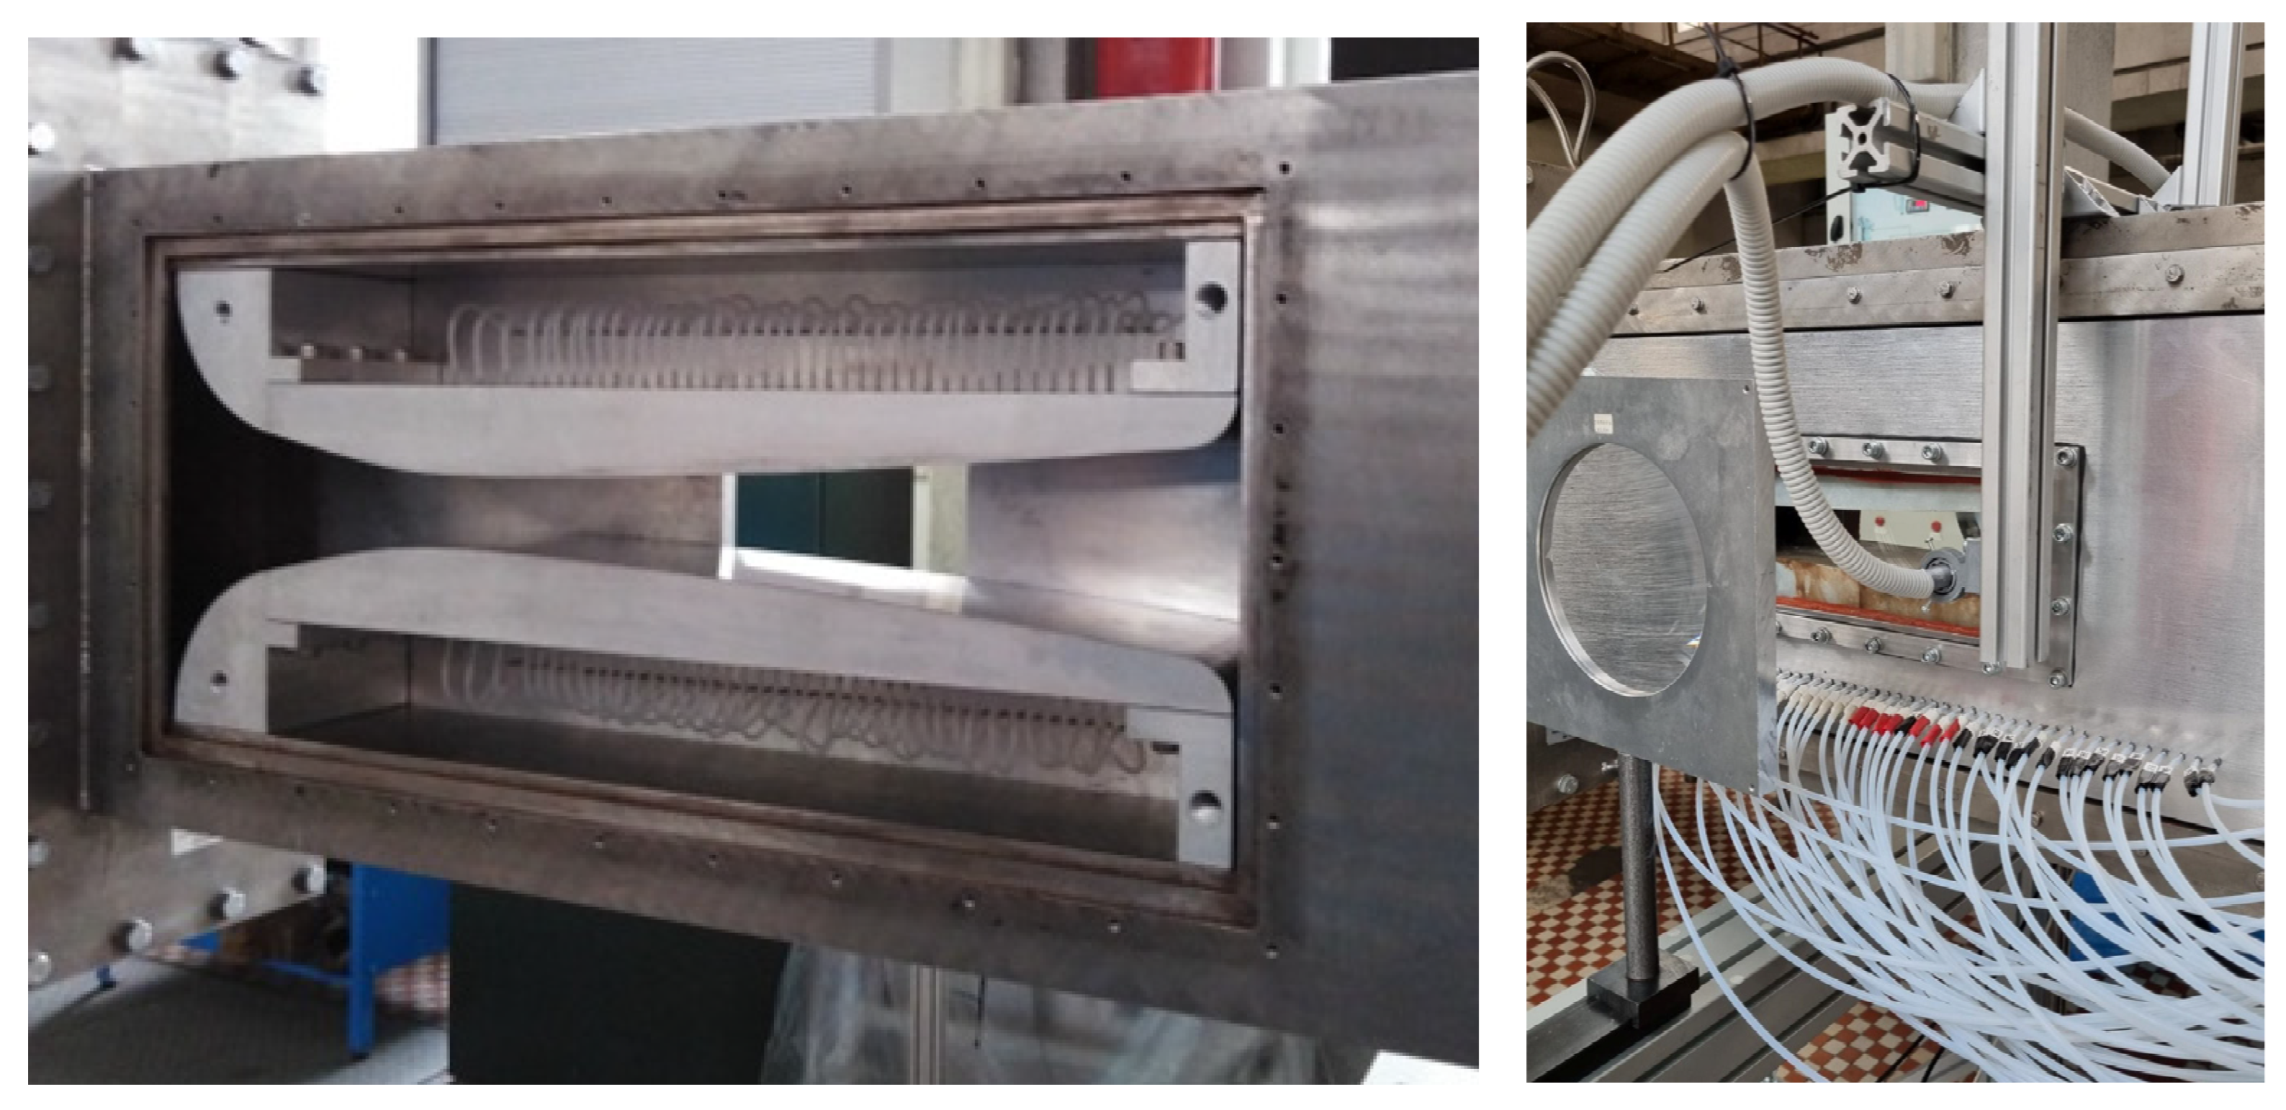
To carry out experimental testing of the wet steam flow through convergent–divergent nozzles, a special measuring chamber was designed to enable installation of any geometry of de Laval nozzles (Figure 2). The chamber design made it possible, among other things, to install in it two half-nozzles with different critical cross sections. The main advantage of such an arrangement is the possibility of performing measurements in two nozzles with different expansion rates with the same inlet and outlet parameters at the same time. Therefore, the flow section of the measuring chamber consisted of two “halves” of de Laval nozzles, the dimensions of which are shown in Figure 3. The nozzles were marked as D1 and D2. The width of the test section was 110 mm, which was sufficient to avoid the impact of the boundary layer formed on the side walls on the measurement of the flow field parameters in the middle of the channel width. It was also the optimal size due to the quality of the visualization of the flow field using the Schlieren technique, for which too wide of a channel makes it very difficult to correctly visualize three-dimensional flow phenomena due to their significant variability along the channel width.
Particular emphasis in the tested geometries was placed on obtaining the static pressure distribution along the nozzles. For this purpose, the measuring chamber was equipped with a set of pulse tubes connected to high-speed signal block in the measuring system. It collected the signals from 50 Honeywell 243PC15M high-speed pressure transducers (HFPTs), the total parameters of the measuring probe at the inlet to the measuring channel, and the pressure and temperature at the outlet. The resolution of the used static pressure transducers was ±100 Pa. This resolution was achieved by additional incremental calibration while considering the hysteresis phenomenon of each of the transducers in its entire measuring range of 0 ÷ −100 kPa(g). In order to obtain the absolute pressure value, the atmospheric pressure was additionally measured. Each measurement series lasted 30 s and the static pressure was measured with a frequency of 400 Hz, which provided 12,000 samples. The measurement accuracy within one series was calculated as the difference between the maximum and minimum values plus the accuracy of the sensor. In this article, in the figures showing the distribution of static pressure on the wall, the sizes of symbols illustrating experimental data corresponding to the range of the maximum measurement error are presented. All pressure tubes used in the measurement system were equipped with an automatic purging system, which cleaned the tubes during the measurement because of water condensing during the wet steam flow. The transducers were evenly spaced in relation to the nozzle, enabling measurements both partially at the nozzle inlet and, most importantly, in the area of the divergent part of the nozzle. Individual measurement points used for comparisons in subsequent chapters were selected depending on the type of nozzle and are presented in coordinates relative to the critical cross-section. The distribution of the pressure measuring points for the nozzles is shown in Figure 3. The coordinate systems used made it possible to determine the first of the pressure measuring points at x = 0 and y = 0 for each nozzle. Subsequent measuring points were 10 mm apart from each other along the x-axis, which (assuming an equal length of the nozzles of 500 mm) provided 50 measuring points for nozzle D1 and 50 measuring points for nozzle D2. It should be noted that the static pressure measurement along the nozzles was conducted at the same time, and the proper matching of the Schlieren images to the pressure measurement results was done by comparing the recording times owing to the initial time synchronization of the two techniques.

2.2. The IWSEP Nozzle

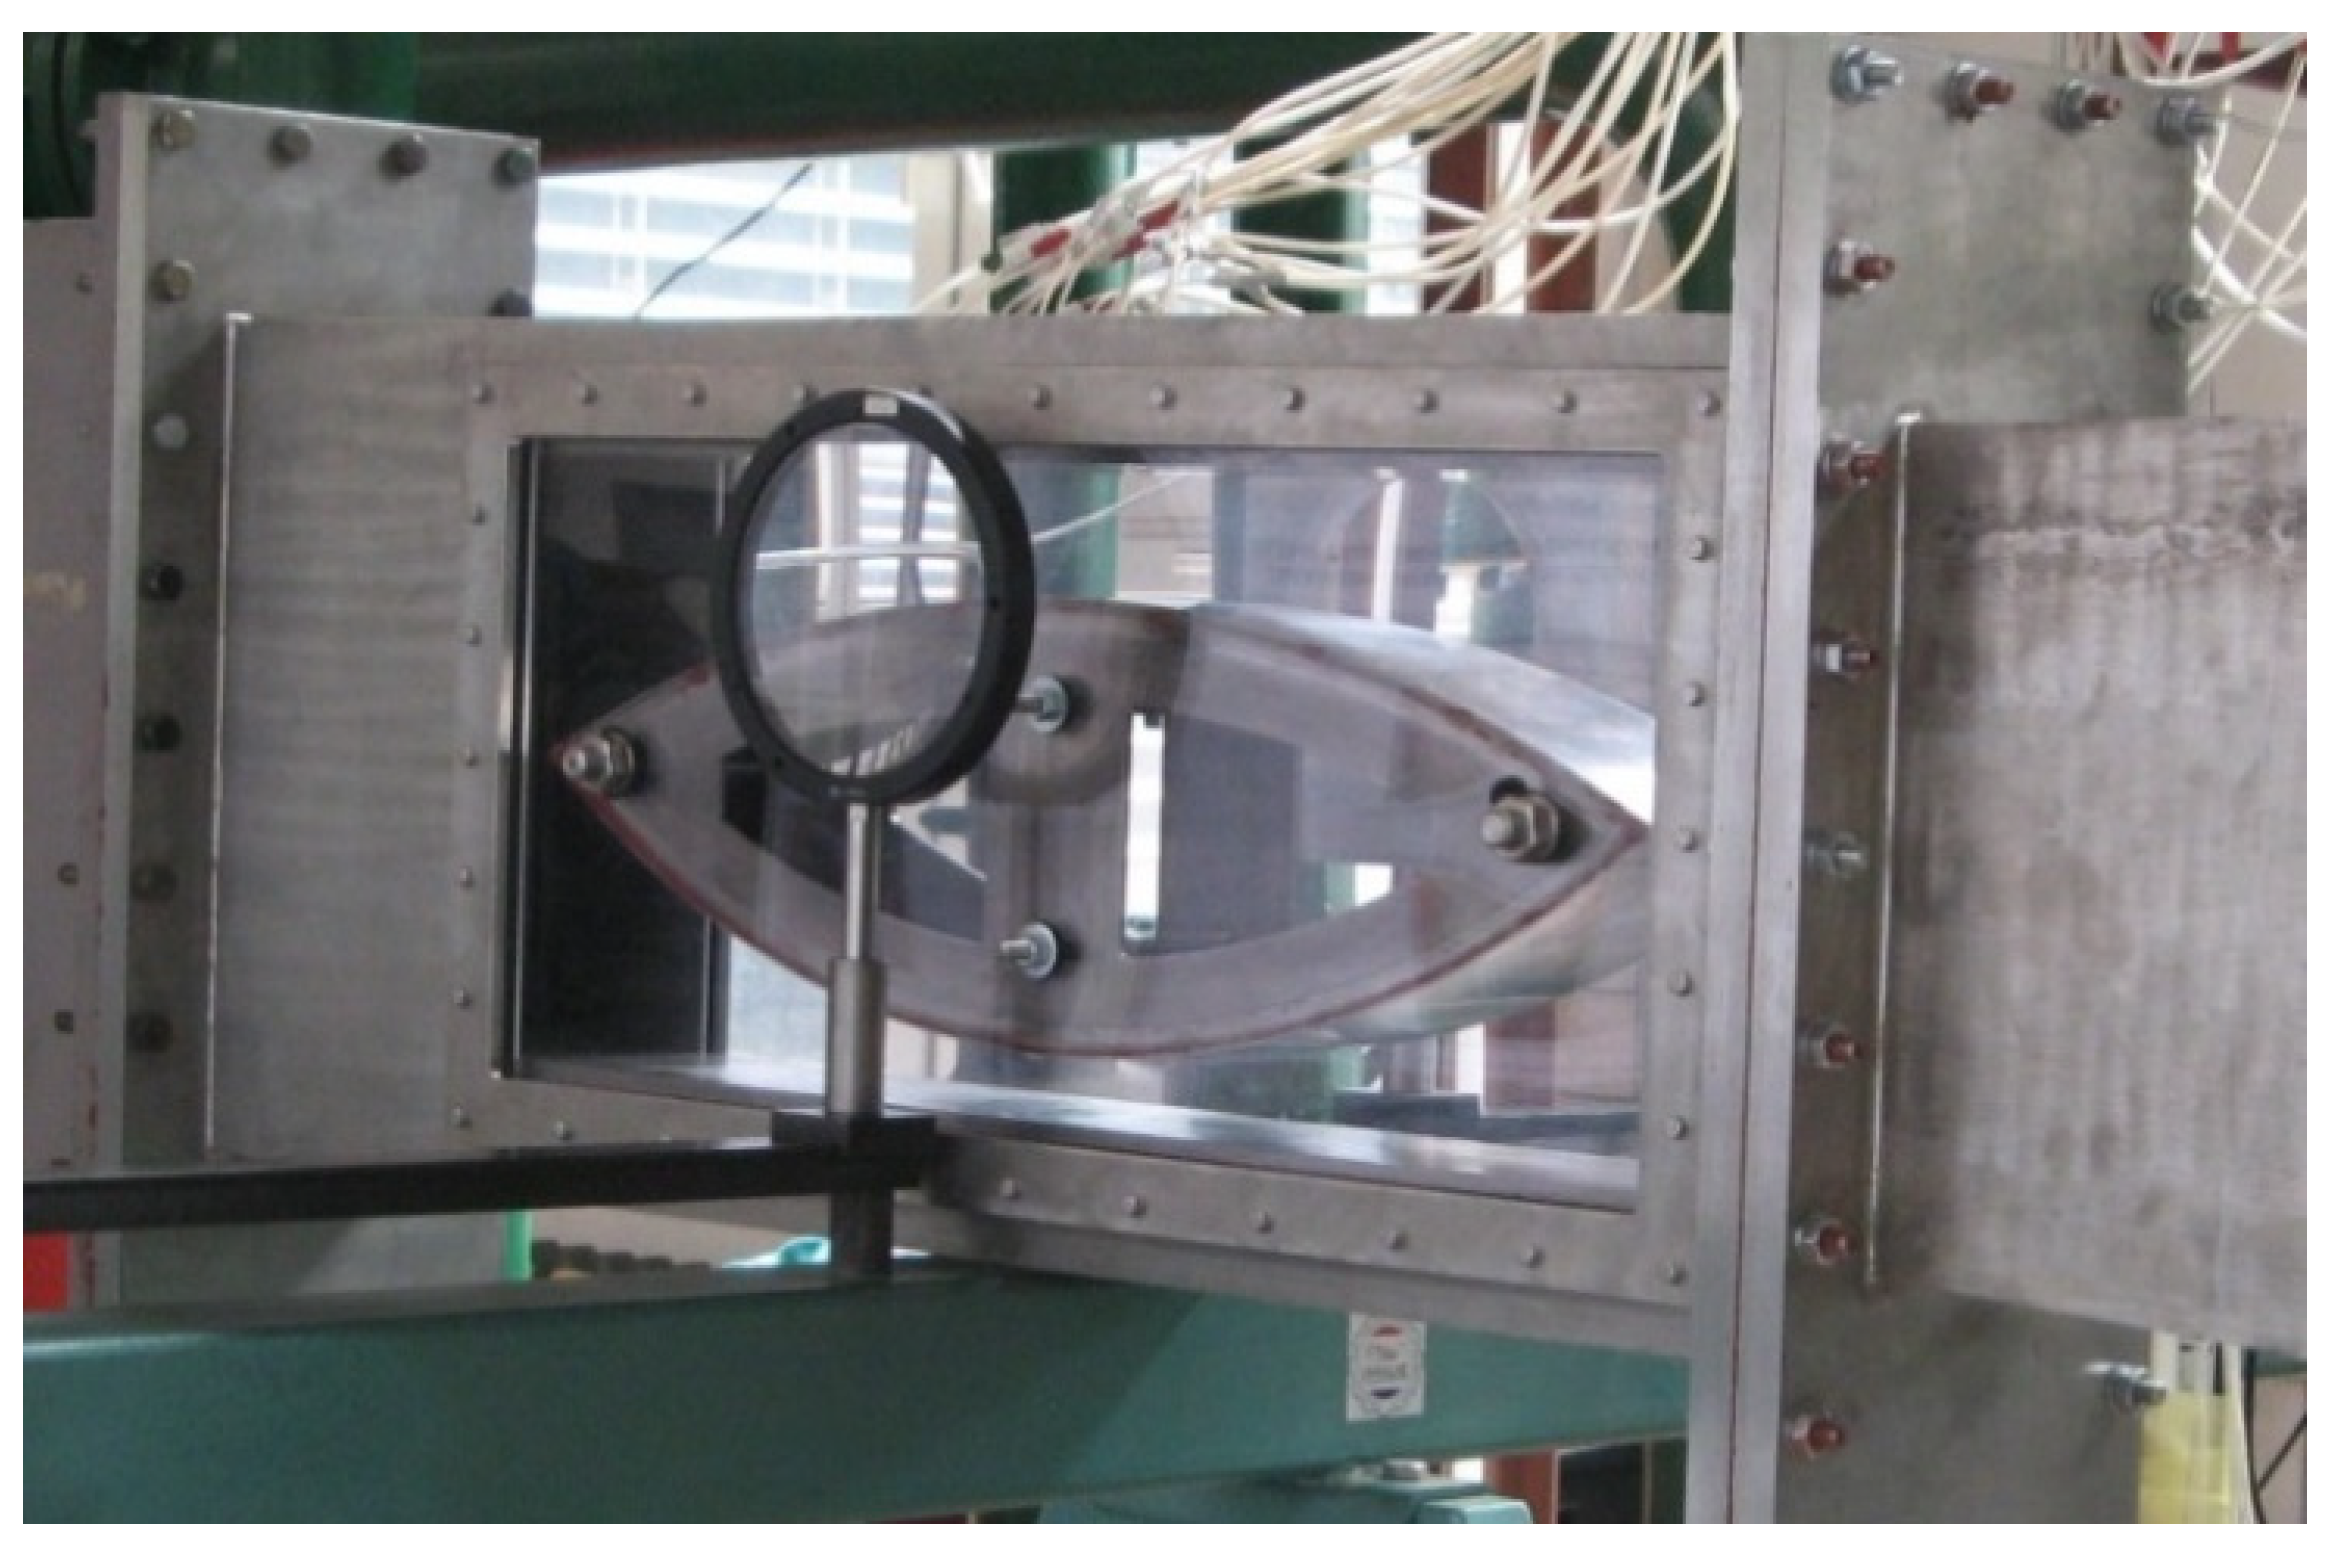
The second type of geometry considered in this study was the IWSEP nozzle, which is a convergent–divergent nozzle with a 3000 s−1 expansion rate and 40 mm throat height. To determine the distribution of static pressure on both the top and bottom walls, the system for measuring included a total of 40 pressure sensors (243PC15M)—20 sensors assigned to each wall for measuring purposes. In the measurements, identical pressure transducers and other test equipment were used as in the case of the half nozzle, which was part of the complete test system presented earlier. The measurement was performed at intervals of 10 mm along the nozzle with the starting point at x = 0 m, which was the nozzle throat. Another probe was utilized to measure the content of the liquid phase along the nozzle midline using the in-house light extinction probe [25]. The SUT extinction probe measuring system included elements of the lighting system in the form of a deuterium–halogen illuminator and a spectrometer as well as a traverse system. In addition, probe software was created to automate the measurement process and conduct on-line signal analysis. It was an external measurement type probe for which all the optics were outside the chamber area and thus did not interfere with the flow itself. The system, which was prepared and checked for correct operation, was subjected to test and calibration measurements in a medium stream with a known droplet diameter and concentration as well as in a specially prepared vacuum test chamber. In the main research, the values of the droplet diameter and their concentration were determined using static tests. For this purpose, polystyrene particles with a known diameter D ≅ 2 μm ± 0.05 μm (N = 1.2 × 10¹¹ m−3) suspended in an aqueous medium were used. Satisfactory test results for those particles were achieved, for which the error was 5.75% and the number of particles was 12.1%. Figure 4 shows the IWSEP nozzle in the test section, the pressure tubes, and the extinction probe; Figure 5 shows the geometry of the nozzle in the XY coordinate system.

3. Numerical Model

The numerical calculations of the wet steam flow in the geometries considered herein were carried out using the ANSYS CFX 2022 R1 software—a commercial CFD code that is widely used in the academic community—and a SUT in-house code.

3.1. Flow-Governing Equations

The numerical model was applied both in the in-house code and in the ANSYS CFX commercial code and described the steady state, compressible, viscous, turbulent and non-equilibrium flow of steam. These equations (shown in Table 1) were as follows:
  • The mass, momentum, and energy conservation equations (compressible Navier–Stokes equations) for the vapor–liquid mixture (RANS in Table 1) in the in-house code and for the vapor and liquid separately in ANSYS CFX;
  • The turbulence model equations;
  • The transport equations for the liquid phase arising due to homogeneous condensation (transport equations in Table 1);
  • The equation of state (EOS in Table 1);
  • The relations modeling the condensation process (condensation model in Table 1).
The variables of the equations of Table 1 are presented in Table 2. The two-phase flow model assumed a no-slip flow. As the velocity difference between the two phases was small and negligible, the droplet–steam relative velocity was omitted; i.e., a droplet moved at the same velocity as water vapor. This assumption considered the velocity of the two phases to be equal, so it simplified our flow-governing equations. Another assumption was that compared to the volume of the gaseous phase, the liquid phase volume was small and could therefore be ignored. The gaseous phase pressure (of supercooled steam) was equal to the liquid phase pressure: p = pv = pl.
Table 1. Flow-governing equations.
Case 1—Implemented in In-House CodeCase 2—Implemented in ANSYS CFX
RANSMass
conservation
equations
t ρ m + x j ρ m u j = 0 ( 1 α ) ρ v t + x j ( 1 α ) ρ v u j = S m ( 1 α ) m l J
α ρ l t + x j α ρ l u j = S m + α m l J
Momentum
conservation
equations
t ρ m u i + x j ρ m u i u j + δ i j p τ i j = 0 t ρ m u i + x j ρ m u i u j + δ i j p τ i j = 0
Energy
conservation
equations
t ρ m E m + x j ρ m E m u j + u j p = x j λ m x j T m + τ i j u i ( 1 α ) ρ v H v t ( 1 α ) p t + x j ( 1 α ) ρ v u j H v = x j ( 1 α ) λ v T v x j + S H α ρ l H l t α p t + x j α ρ l u j H l = x j α λ l T l x j S H
Transport equations ρ m y t + x j ρ m u j y = S y ρ m n t + x j ρ m u j n = S n ρ l n t + x j ρ l u j n = ( 1 α ) ρ l J
Equation of state (EOS)Local real gas EOS: p ρ R T = z T , ρ ) = A ( T + B ( T ) ρ IAPWS-IF97
The database implemented in CFX covers temperatures ranging from 273.15 to 1073.15 K and pressures ranging from 611 Pa to 100 MPa.
Condensation modelNucleation rate J = C α c 2 σ π m v 3 ρ v 2 ρ l e x p 4 π β c r 2 σ 3 k B T v
Droplet growth rateGyarmathy model:
d r d t = 1 1 + 3.18 K n λ v r 1 ρ l 1 r r R T v 2 L 2 l n p v p s ( T v )
In ANSYS CFX, the physical properties of steam and water were computed based on the Industrial Formulation for Thermodynamic Properties of Water and Steam (IAPWS97) formulations [26]. As the IAPWS formulations cannot predict the thermodynamic properties of the gas phase in the wet steam region (i.e., the region below the saturation line), a local real gas equation of state (EOS in Table 1) was defined in our in-house code to cover this region [27]. For the condensation model as shown in Table 1, J is the nucleation rate (the number of new droplets per unit volume per second) and in both codes was calculated according to the classical homogeneous nucleation theory [28] (nucleation rate in Table 1) and adjusted for non-isothermal effects (C is the non-isothermal Kantrowitz correction factor in the nucleation rate in Table 1) [29]. For the droplet growth rate, the Gyarmathy droplet growth correction function was employed in both codes (droplet growth rate in Table 1) [30].
In ANSYS CFX for the phase-change model, the droplets-based non-equilibrium phase-change solver was employed. This solver is appropriate for homogeneous nucleation and droplet growth in a rapid expanding fluid. In the case of the ANSYS CFX commercial code, it was possible to define the model of the physical flow according to the settings of the in-house program; in the case of the numerical model, there were some differences that are presented in Table 3. In the calculations presented herein, both CFD codes used the same numerical mesh—a structured mesh prepared by means of the ICEM CFD software.

3.2. Numerical Mesh and Boundary Conditions

All the adopted computational domains were symmetrical geometries in the Z direction; i.e., the channel depth, which was 110 mm in each case. Therefore, assuming the two-dimensionality of the occurring flow phenomena, the size of all the computational domains in the Z direction was 5 mm and was discretized using five control volumes. When discretizing the adopted computational domains, care was also taken to provide a solution independent of a further increase in the number of control volumes of the numerical meshes; i.e., an adequate density of the meshes in the near-wall layer region (y+ ~ 1) and in the areas of strong discontinuities such as condensation waves and shock waves. The numerical mesh for the investigated geometries was prepared in the ICEM CFD program and is presented in Figure 6, Figure 7 and Figure 8. The mesh independence study was previously conducted in [16].
The nozzle walls were considered as adiabatic, smooth, and no-slip surfaces. For both surfaces of the nozzles used in the experimental tests, the surface roughness corresponded to the quality of fine machining and fine grinding, for which Re was about 0.63. At the inlet, the values for total pressure, total temperature, and 5% turbulence intensity were set. The values of the inlet boundary conditions are listed in Table 4.

4. Results and Discussion

In this section, the results of the CFD calculations obtained using the in-house academic code and the commercial code ANSYS CFX are presented and compared with the experimental data obtained in the SUT in-house experimental test rig. In the figures showing the distributions of selected flow field parameters, to facilitate identification and analysis, the distributions obtained by means of the ANSYS CFX commercial code are shown with a blue background. The flow field images obtained using the academic in-house code were prepared in Tecplot in the same manner as in the ANSYS CFX program postprocessor; i.e., for the same range and number of divisions.

4.1. The Half Nozzles

The D1 “half” nozzle had a lower expansion velocity than the D2 nozzle, so a less rapid pressure drop along the nozzle and lower Mach number values were expected. Consequently, the steam condensation process in the D1 nozzle would occur later and less rapidly compared to the D2 nozzle. In the following sections, the results for the D1 and D2 nozzles are presented separately.

4.1.1. D1 Nozzle

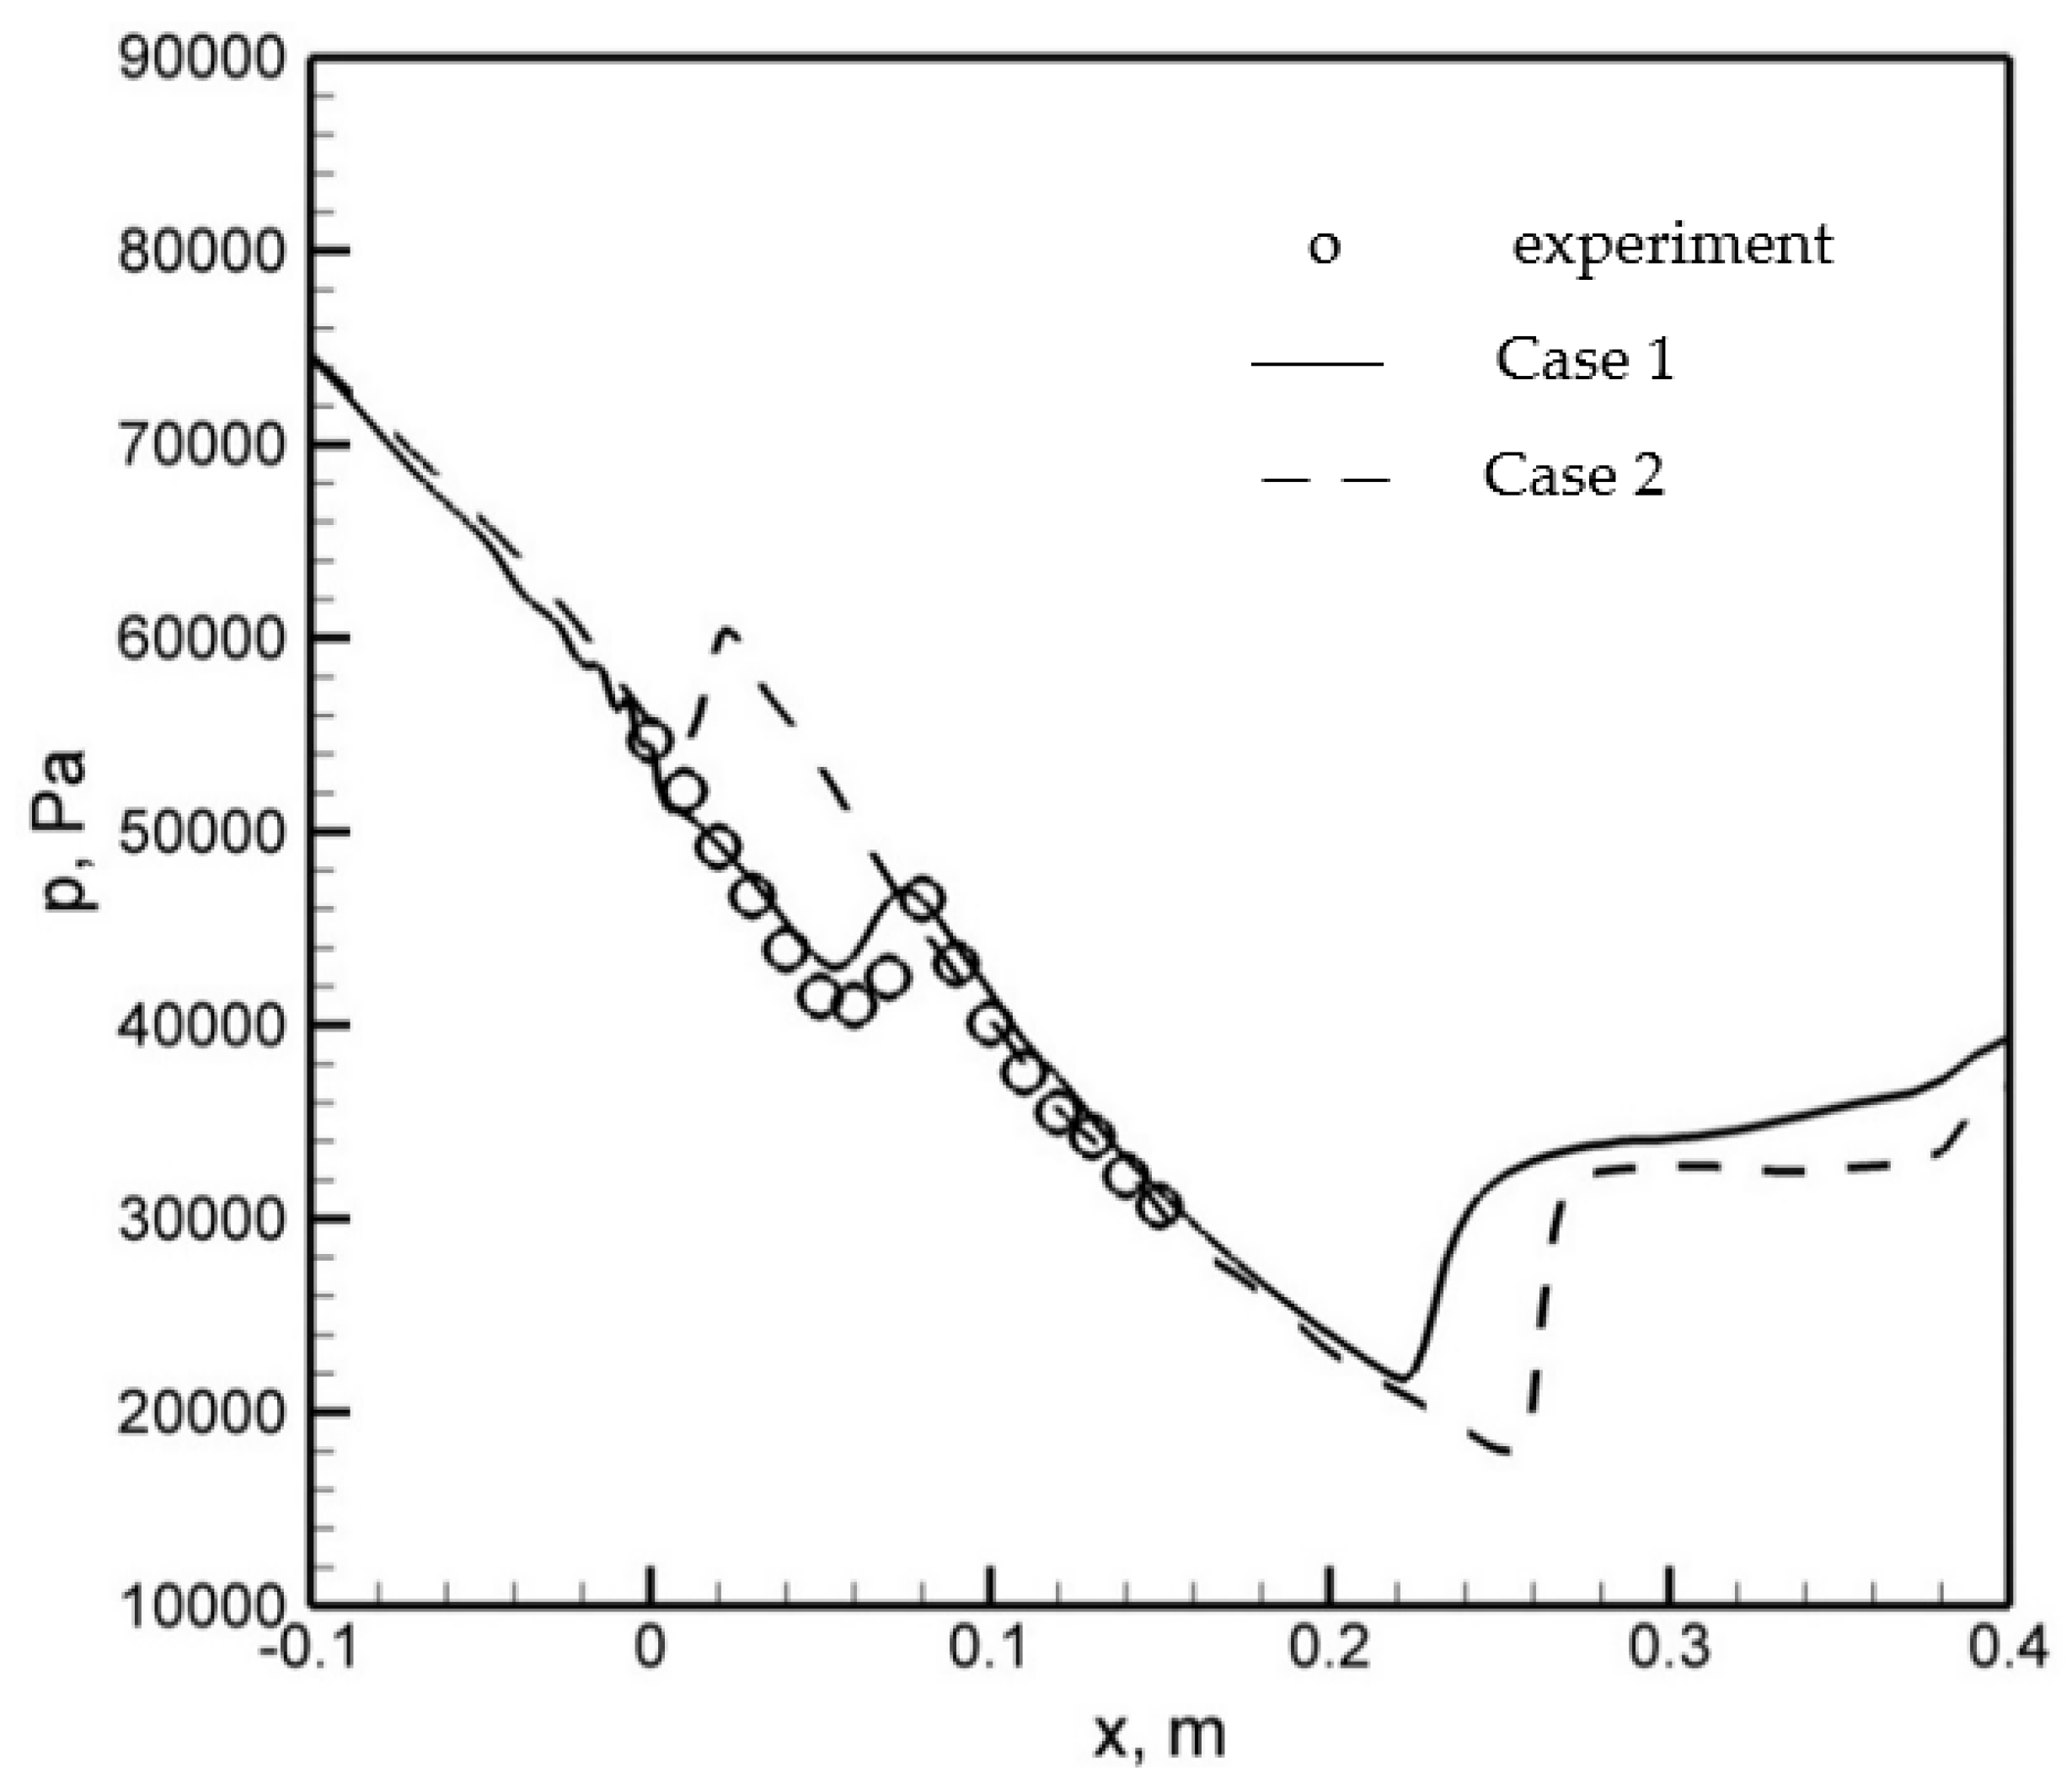
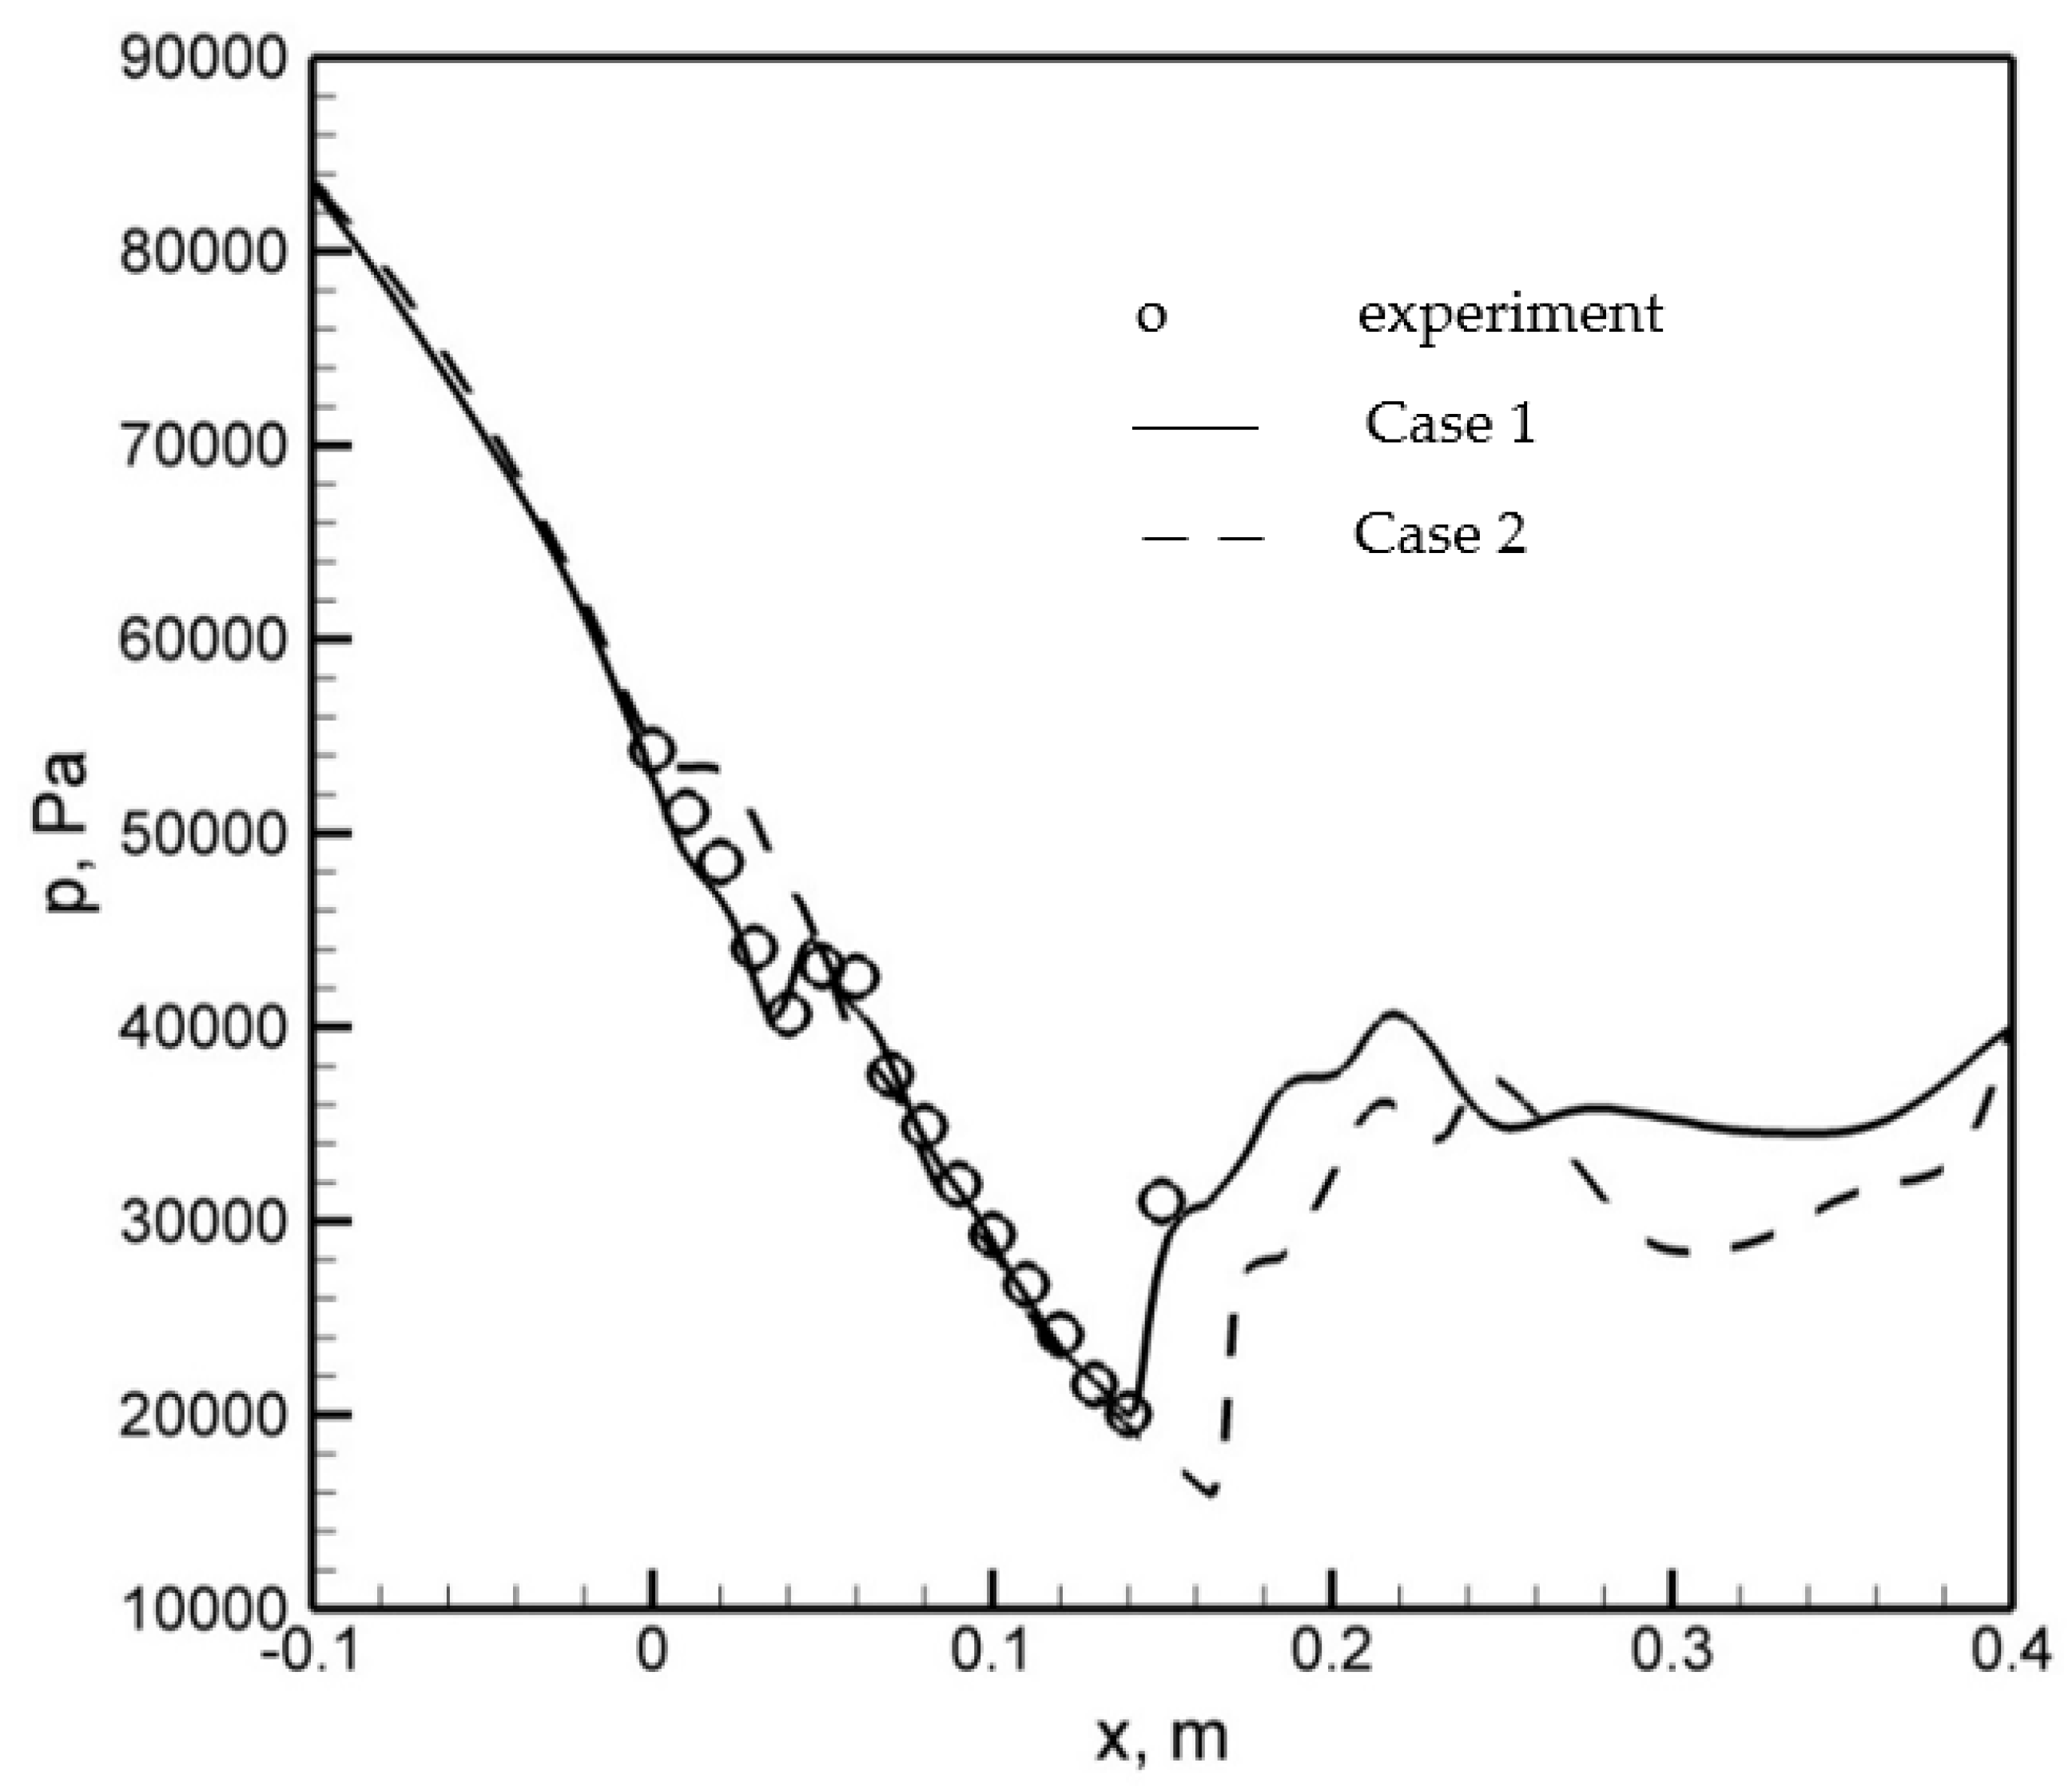
Figure 9 shows the static pressure distribution along the flat wall of the “half” D1 nozzle in the middle of its width. The critical cross section of the nozzle (nozzle throat) for all the cases was located for the value of the nozzle length x = 0 m. It can be seen clearly that in the case of the ANSYS CFX commercial code, the condensation wave location occurred much earlier (just after the critical cross section of the nozzle), while in the case of the academic in-house code, the position of the condensation wave corresponded well to the position resulting from the measurement of static pressure during the experiments. Therefore, it can be concluded that ANSYS CFX shifted the condensation wave upstream.
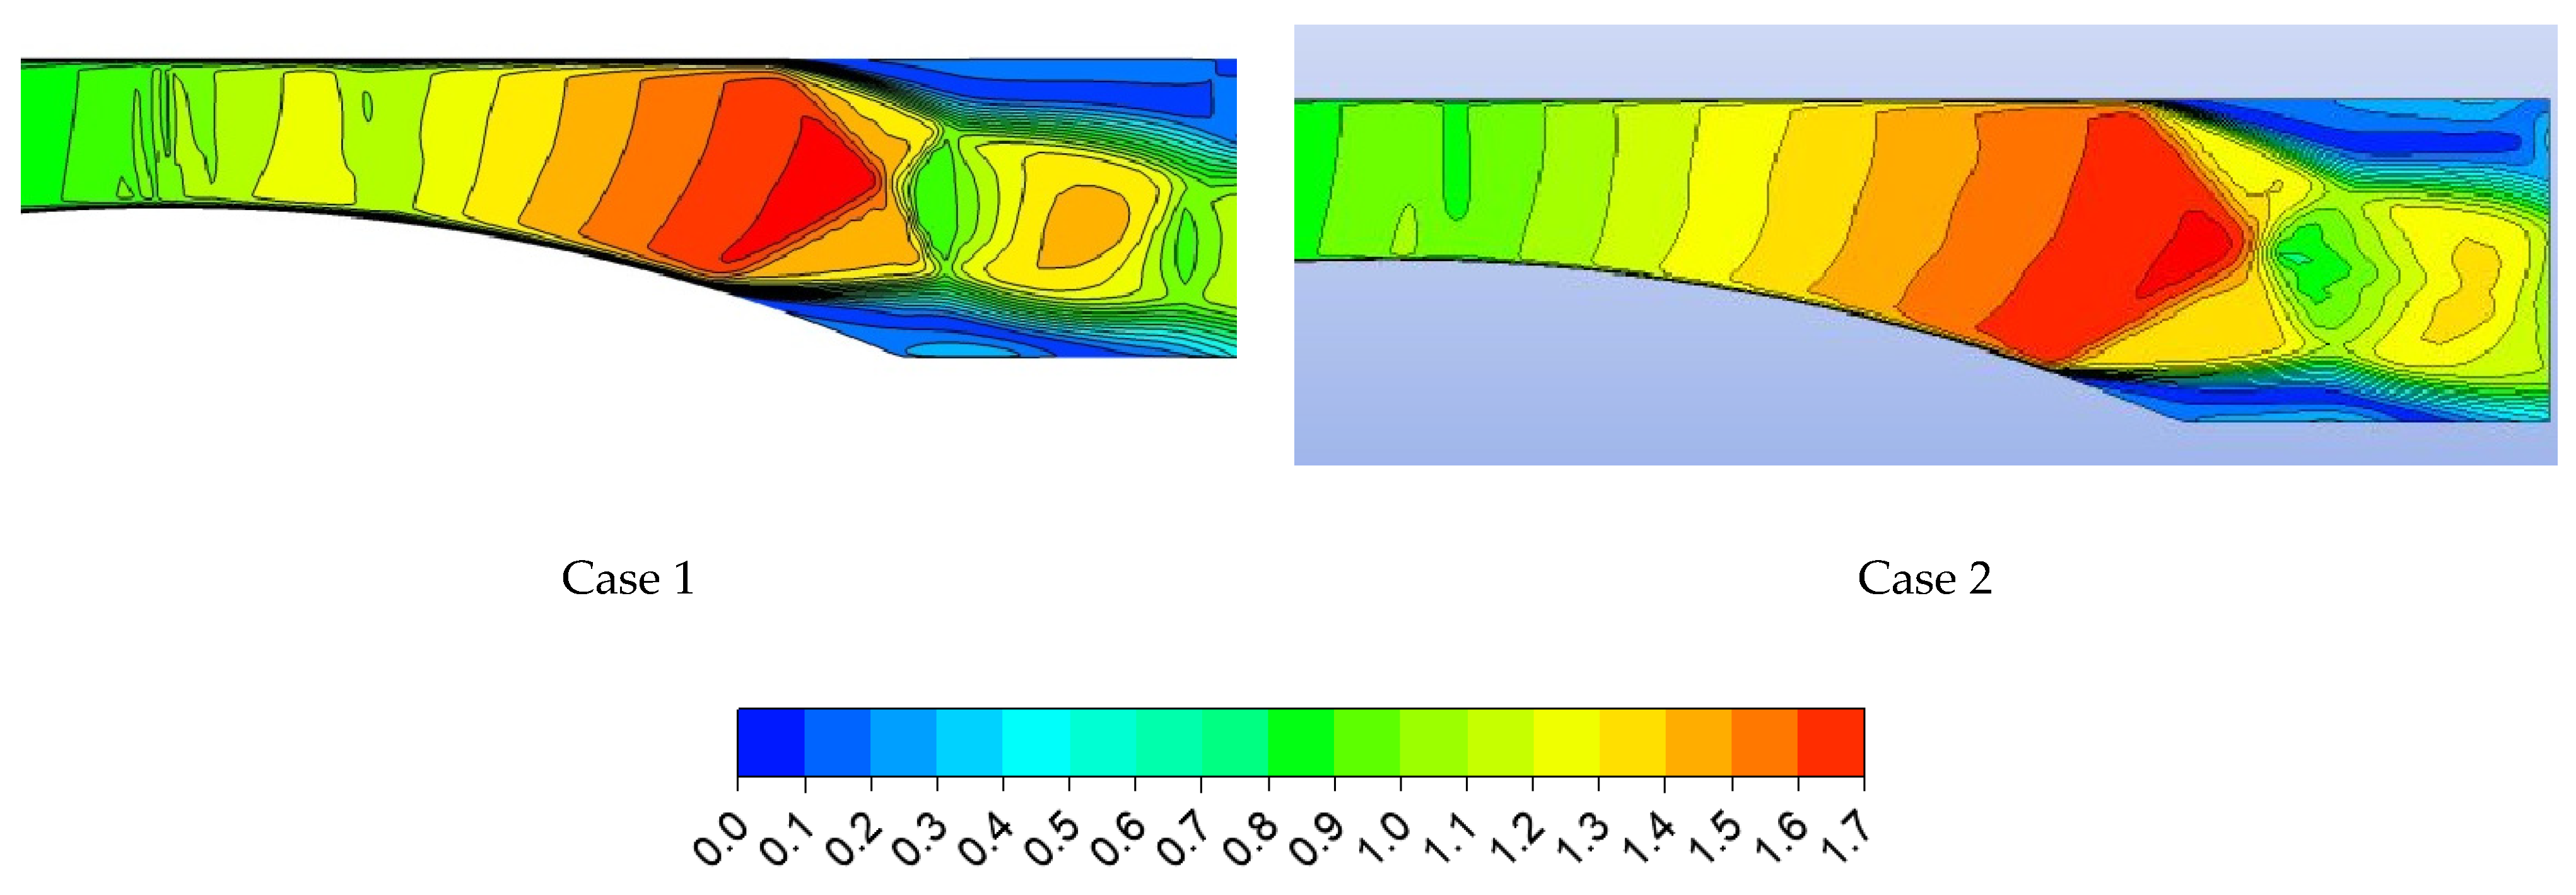
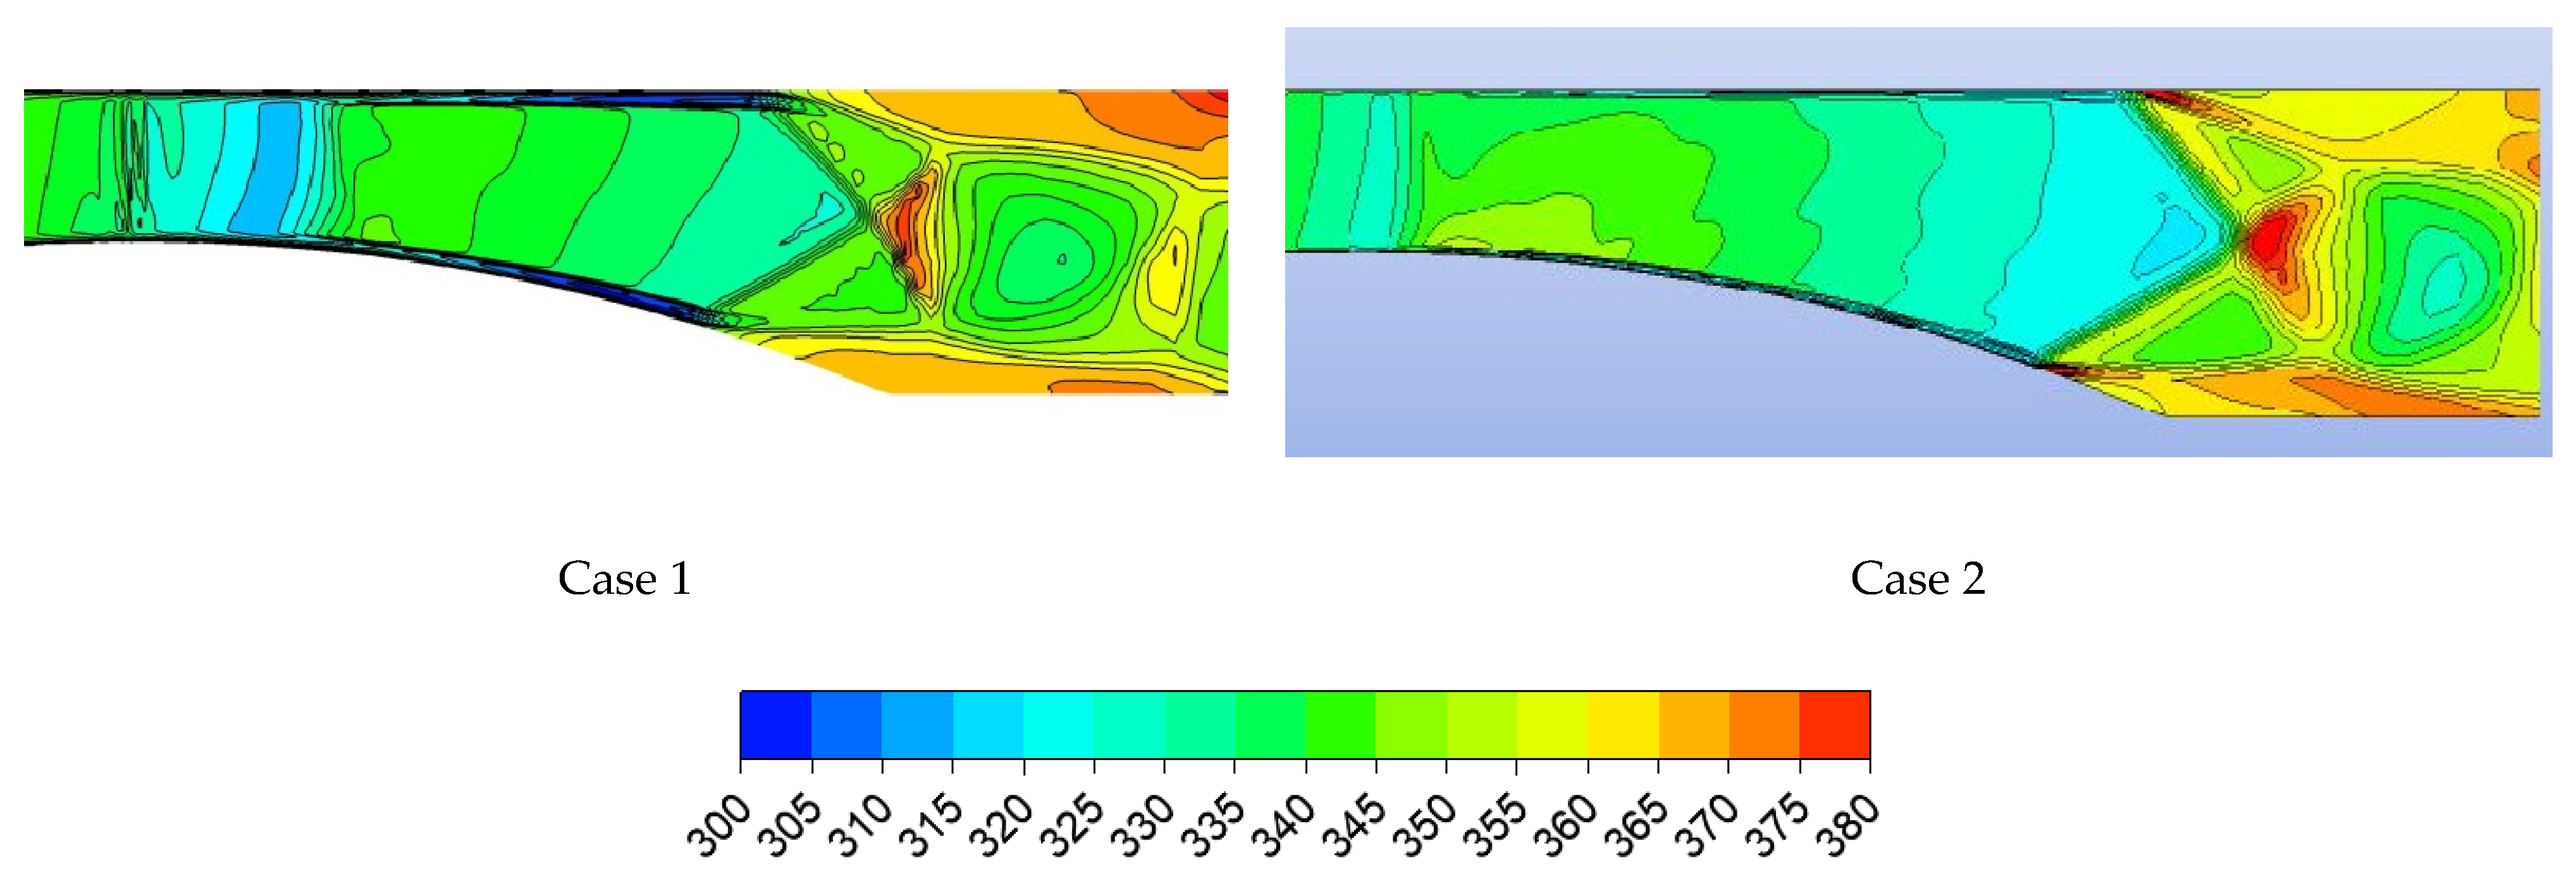
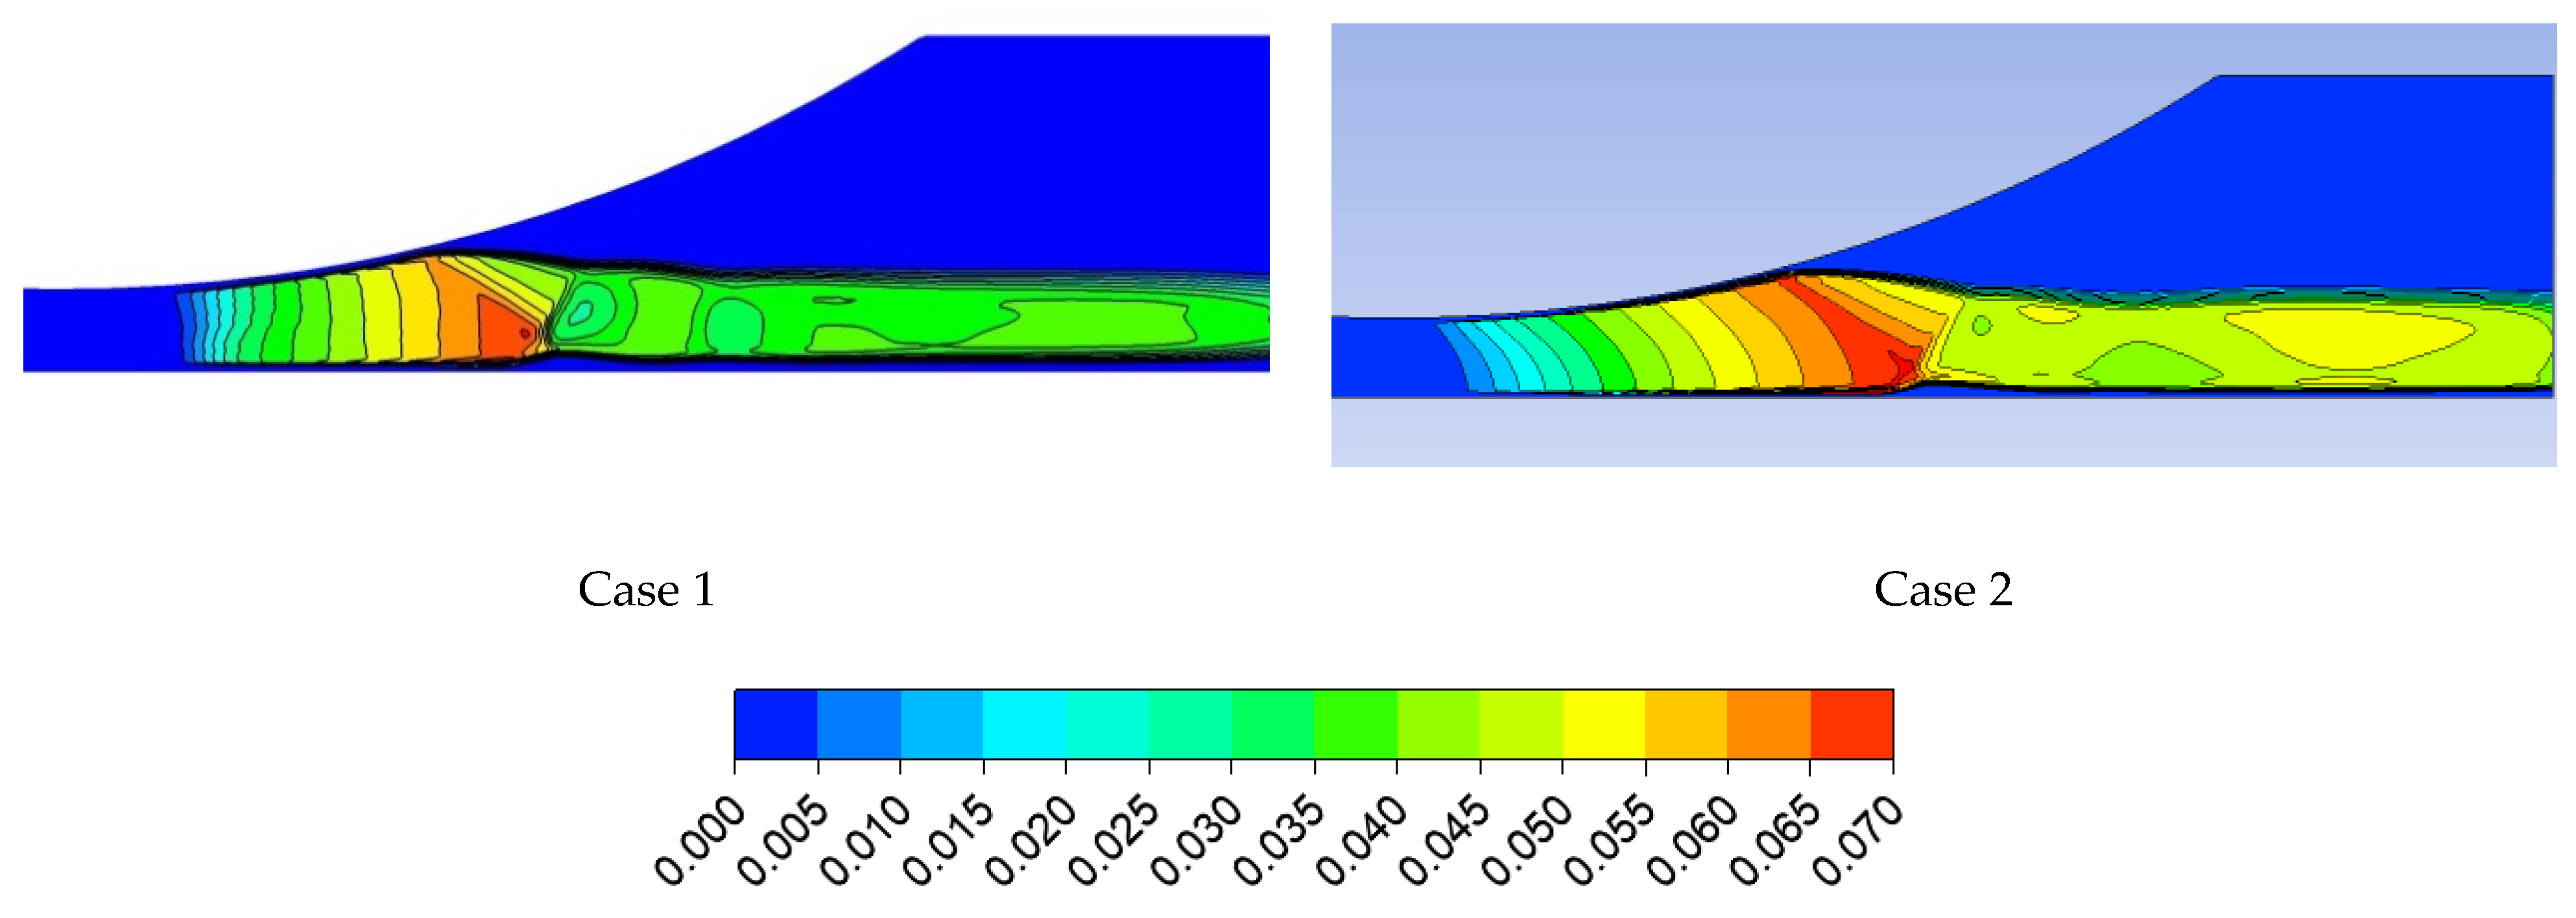
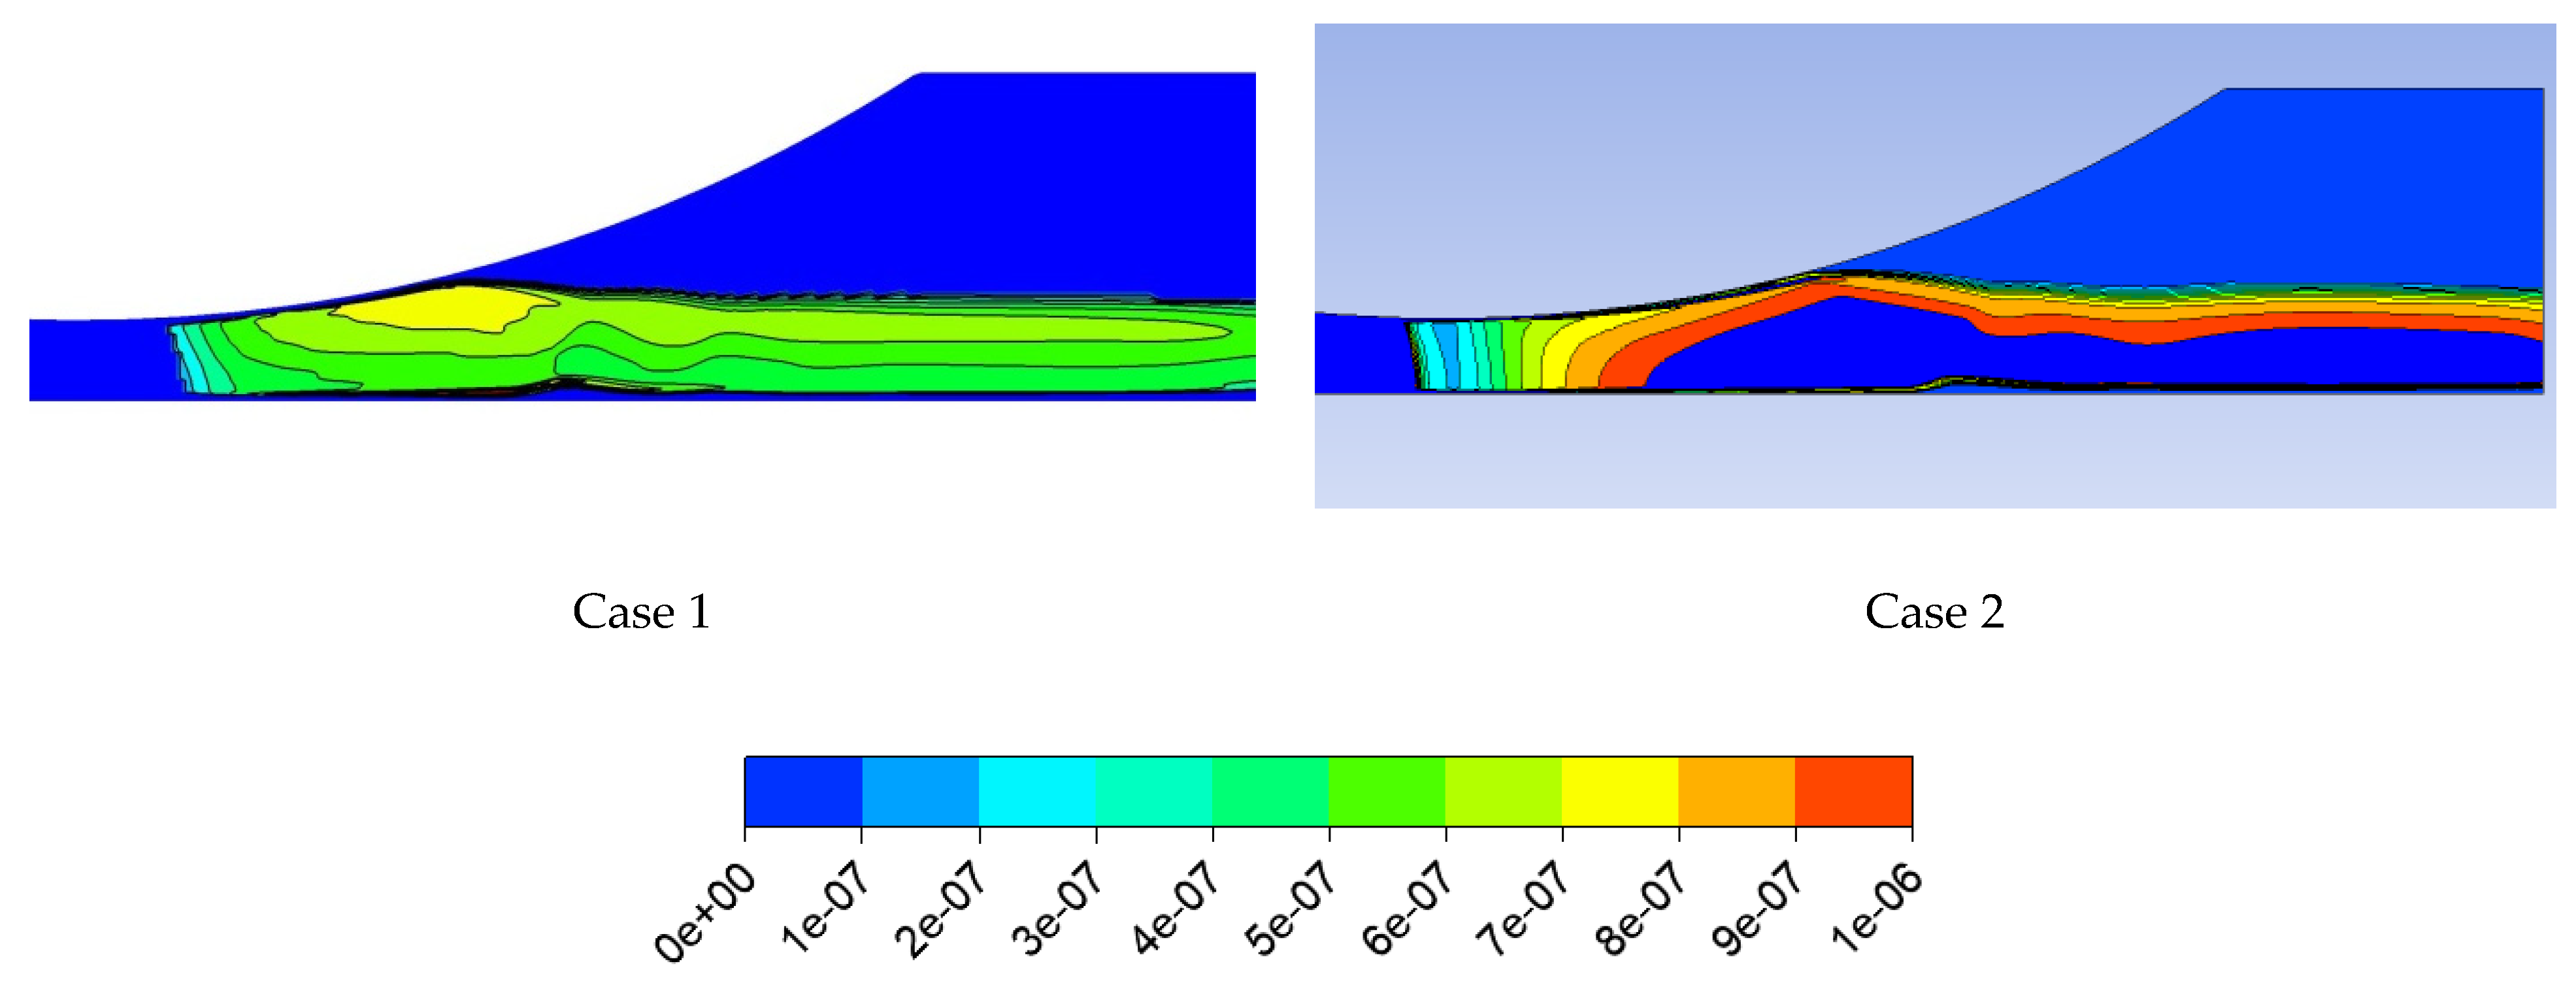
The differences visible in the location and intensity of the condensation wave between the calculations performed using the in-house academic code and the commercial code must affect other flow parameters such as the Mach number (Figure 10), the static temperature (Figure 11), or the parameters of the liquid phase arising due to the spontaneous condensation process (Figure 12 and Figure 13). As can be seen in the following contours, the in-house CFD code contours have different quality than the ANSYS CFX contours, and the changes in variables are shown more precisely and more visible. A significant difference between the two cases in the following contours can be seen in the critical cross section of the nozzle: the condensation wave in ANSYS CFX occurred near this region and much earlier than in the in-house CFD code. The difference between the results of the two codes for the gaseous phase static temperature distribution shown in Figure 11 was due to the fact that in the in-house code, a local real gas equation of state (Table 1) was used, while in ANSYS CFX, IAPWS IF-97 was employed to calculate the gas phase thermodynamic properties. The difference between the results of the two codes shown in Figure 12 for the wetness mass fraction and in Figure 13 for the mean droplet radius was due to the different methods of calculating these two parameters in the two codes. In the in-house code, the wetness mass fraction (y) was directly obtained from the transport equations (Table 1), and then the mean droplet radius was calculated based on the wetness mass fraction. However, in the ANSYS CFX code, first the liquid volume fraction (α) was calculated using the transport and conservation equations (Table 1), and then the wetness mass fraction and mean droplet radius were obtained based on the liquid volume fraction. Figure 14 shows the flow field images, which present the absolute value of the density gradient for the CFD calculations. Again, near the critical cross section of the nozzle, a difference can be seen. It is also possible to observe a slightly different position of the shock wave formed at the nozzle outlet due to an excessive value of the outlet static pressure, and this situation is also visible at the nozzle outlet in Figure 9.

4.1.2. D2 Nozzle

According to what was stated earlier, the D2 nozzle had a higher expansion velocity, which resulted in a more violent and faster (earlier) condensation process. This can be seen in Figure 15, which shows the static pressure distributions along the nozzle’s flat wall. As can be seen in this figure, again the condensation wave in ANSYS CFX occurred much earlier and near the critical cross section of the nozzle. Furthermore, the intensity of the condensation wave in ANSYS CFX was much lower than in the in-house CFD code and experiments. Differences in the location and intensity of the condensation wave between the results of modeling with the in-house CFD code and ANSYS CFX must have resulted in differences in the distributions of the flow field parameters. This can be observed in the distributions shown in Figure 16, Figure 17, Figure 18, Figure 19 and Figure 20. The following contours present the Mach number isolines (Figure 16), gaseous phase static temperature isolines (Figure 17), wetness mass fraction isolines (Figure 18), and mean droplet radius isolines (Figure 19) for the D2 nozzle. Again, as for the D1 nozzle, a significant difference between the two cases can be seen in the critical cross section of the nozzle. It should also be noted that as mentioned in the previous section, the difference between the results of the two codes for the gaseous phase was due to the different methods used (Table 1) for calculating the previously mentioned parameters. Figure 20 shows the flow field images, which present the absolute value of the density gradient for the CFD calculations. In this figure, a slightly different position of the shock wave formed at the nozzle outlet can be seen between the two cases, and this situation is also visible at the nozzle outlet in Figure 15.

4.2. IWSEP Nozzle

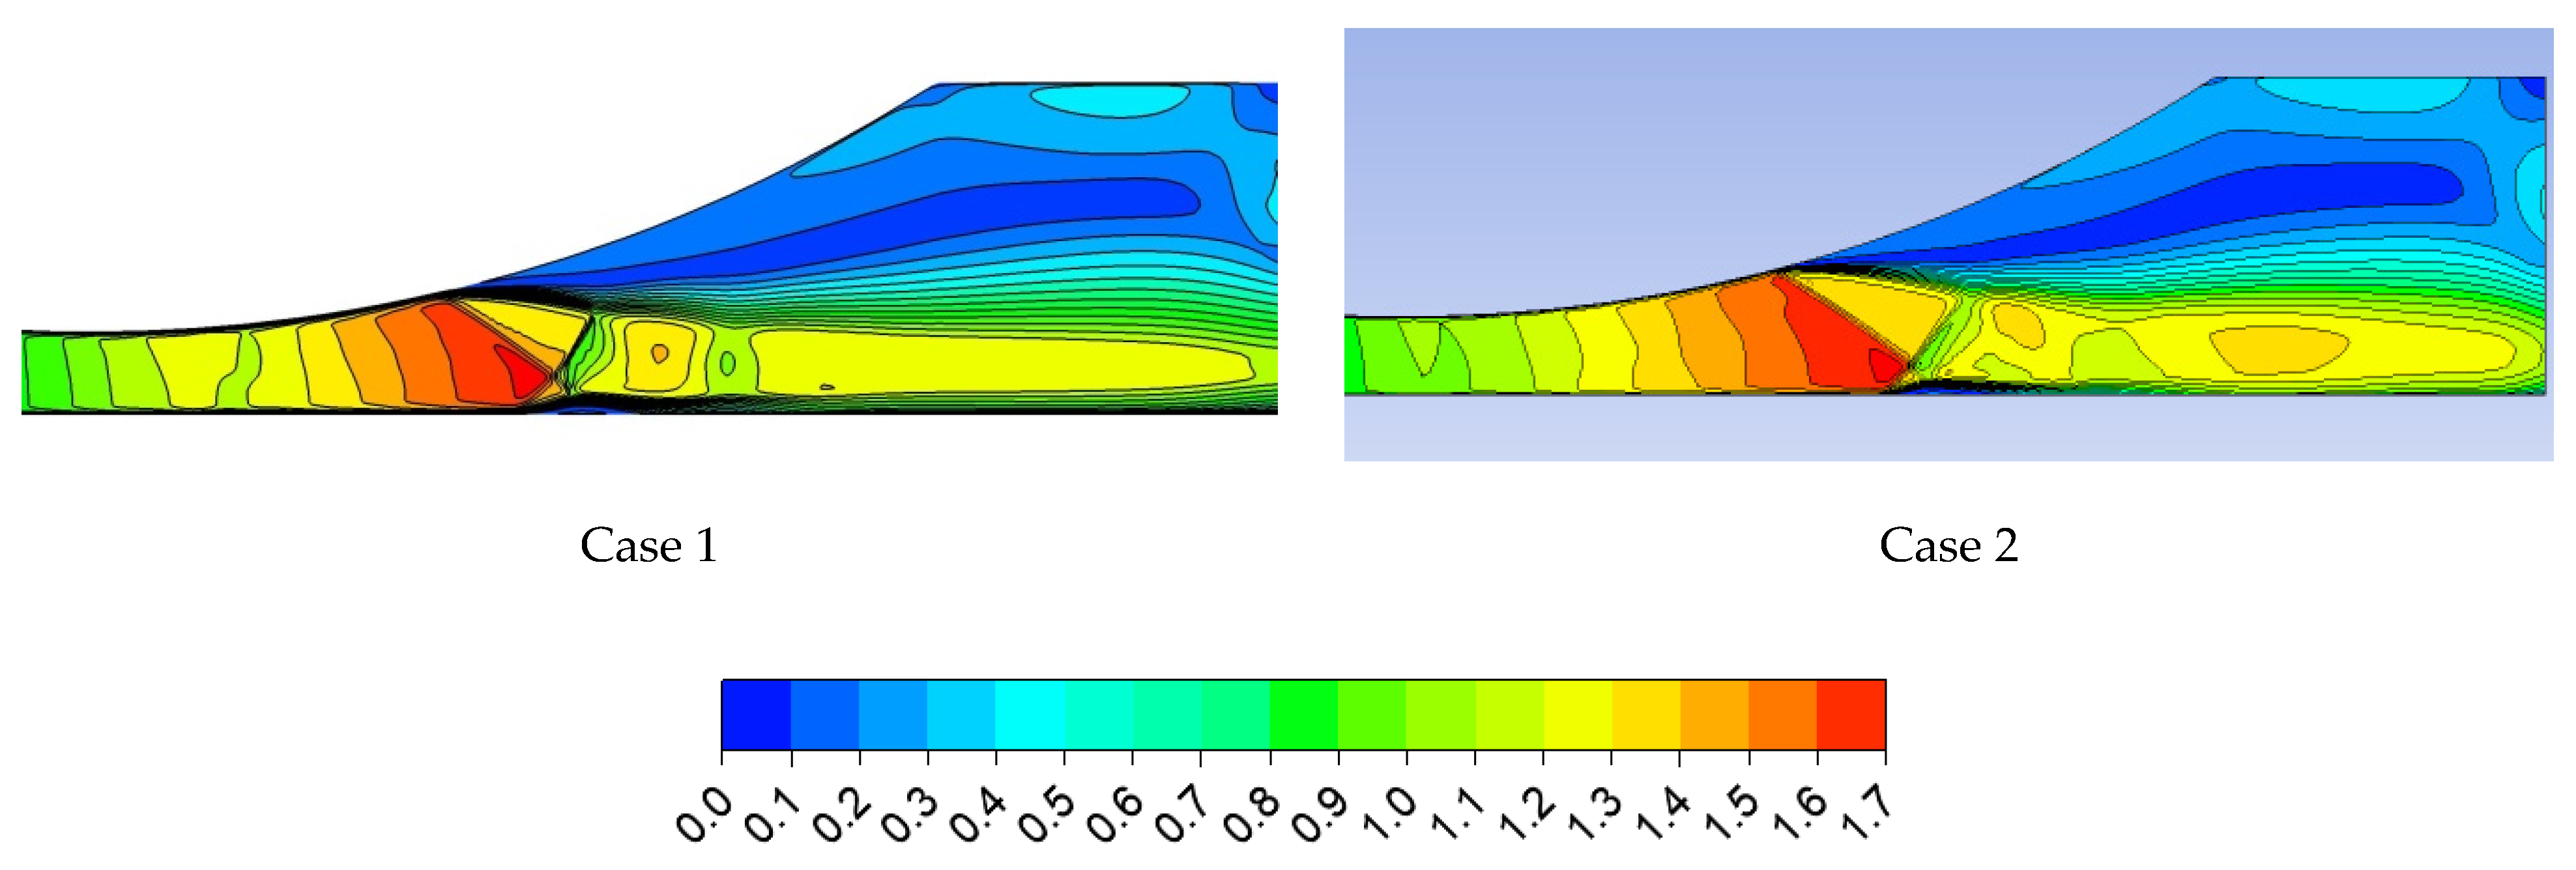
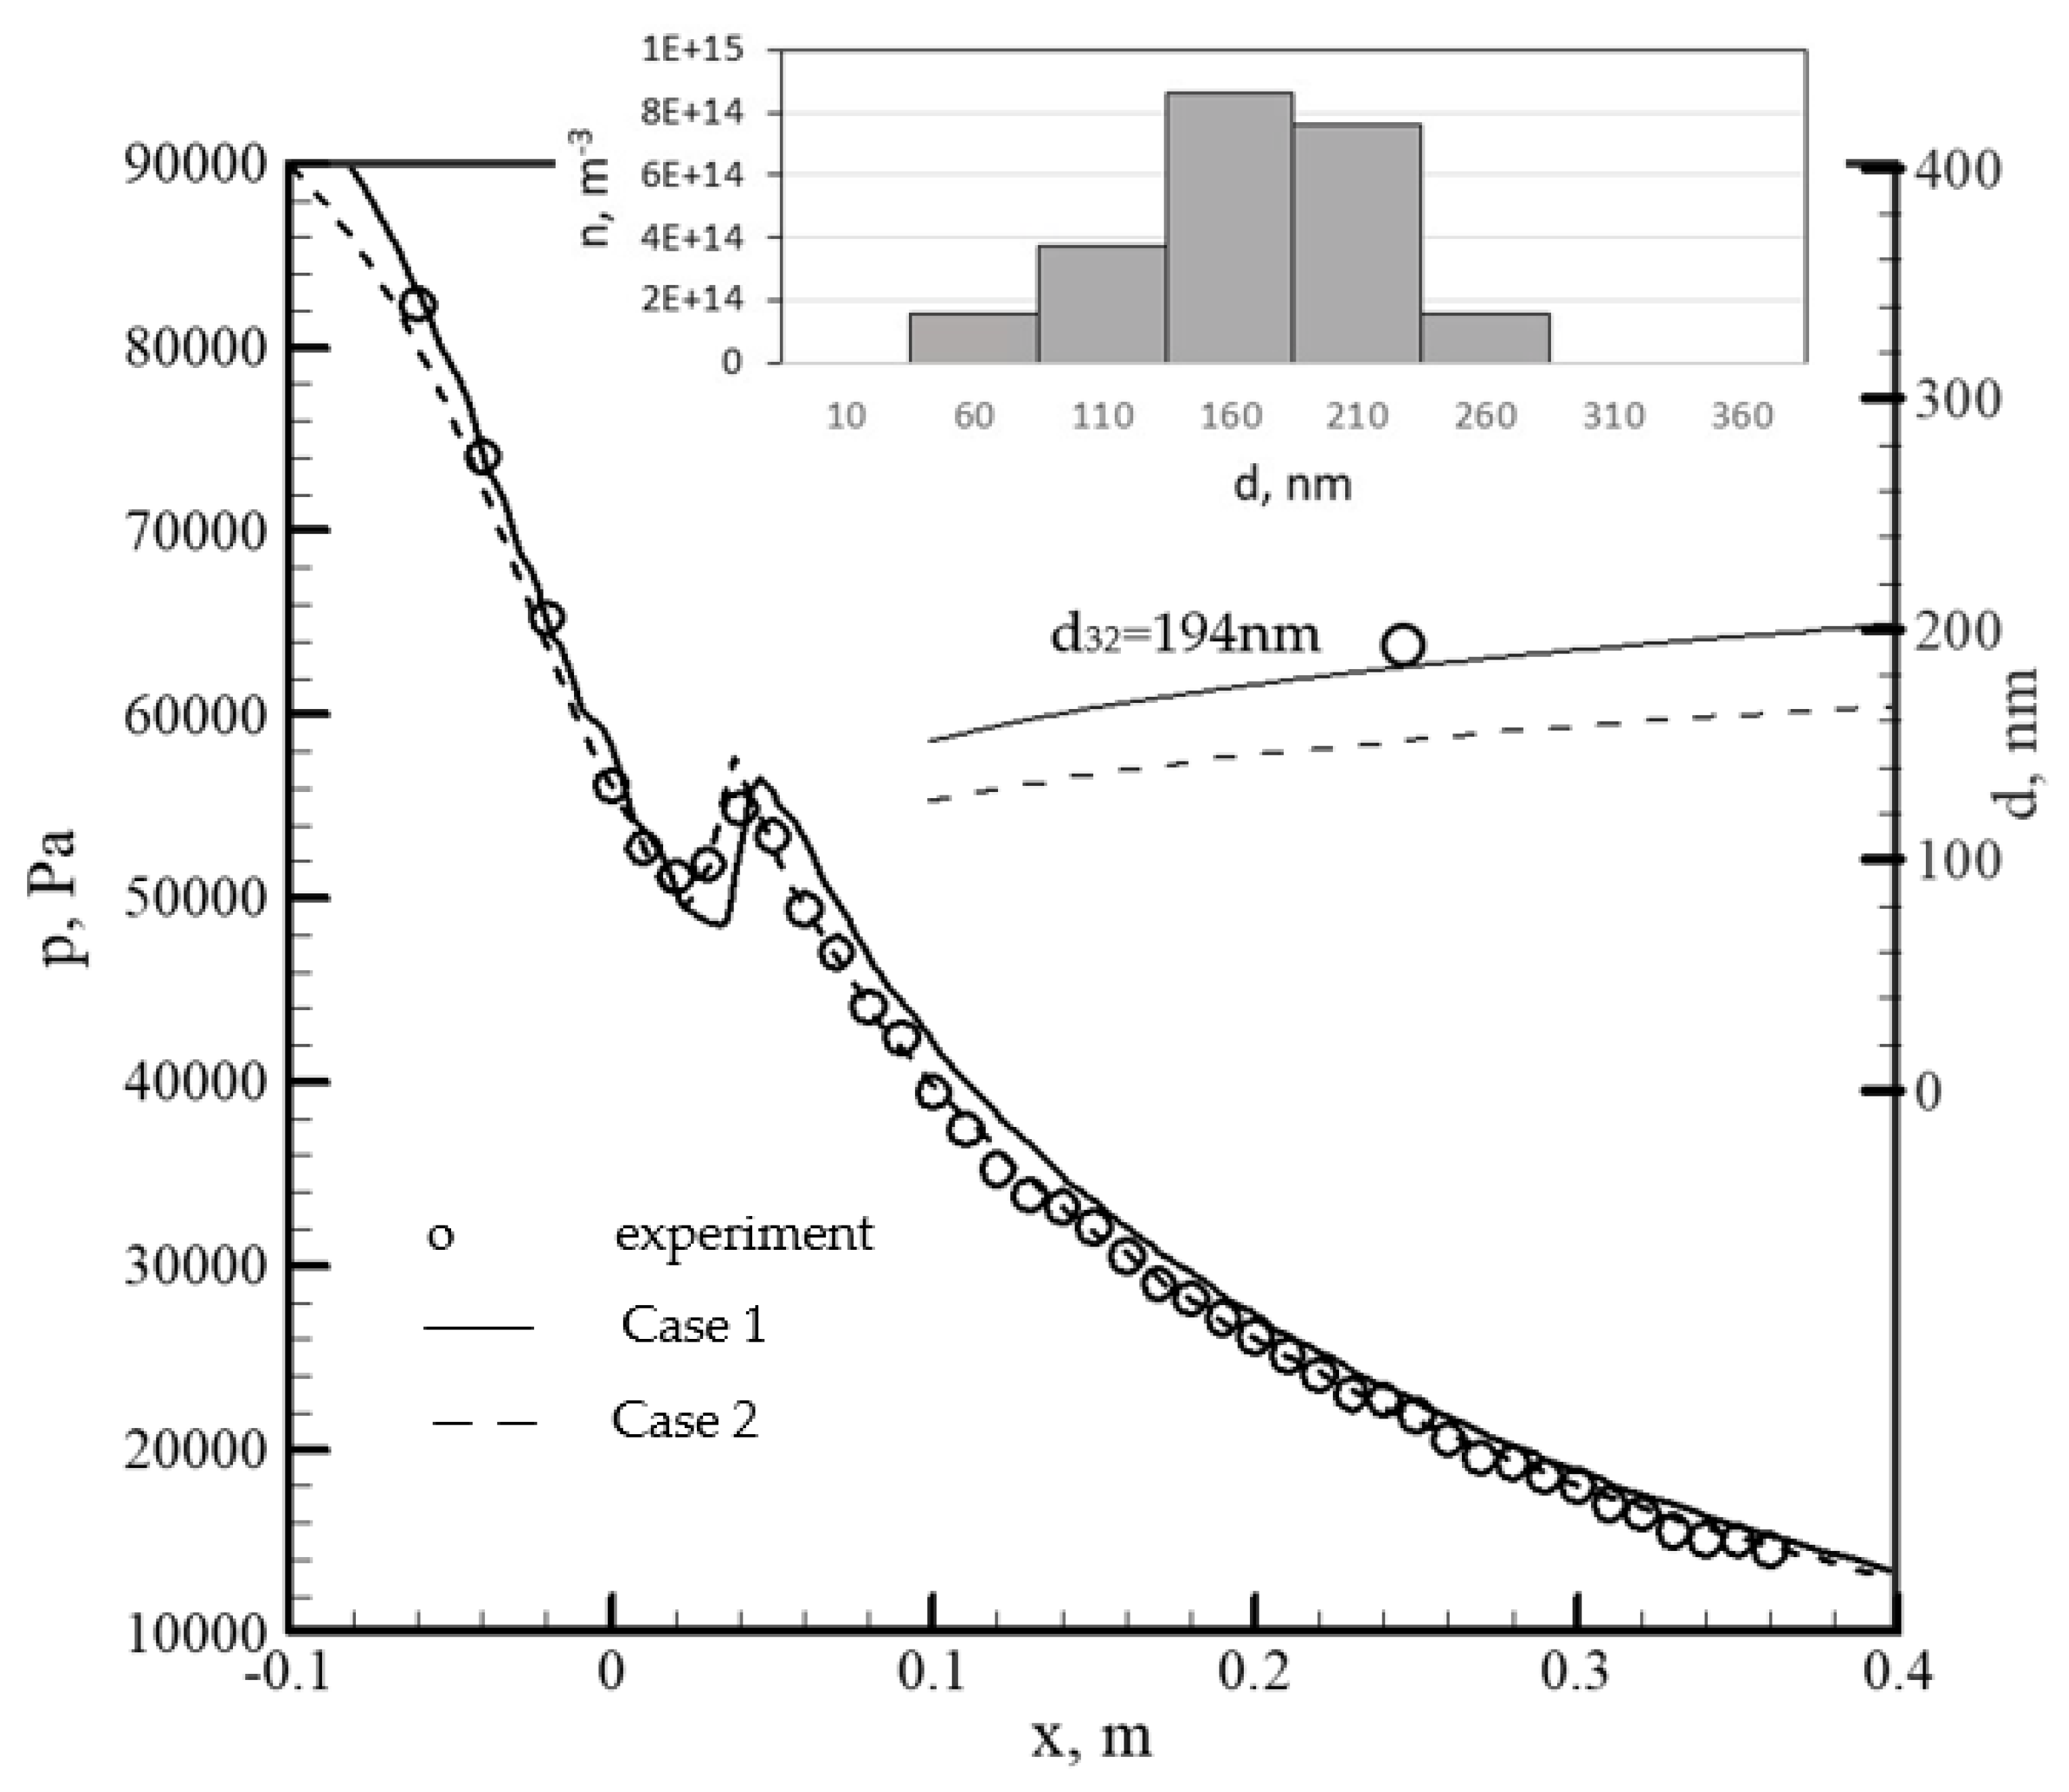
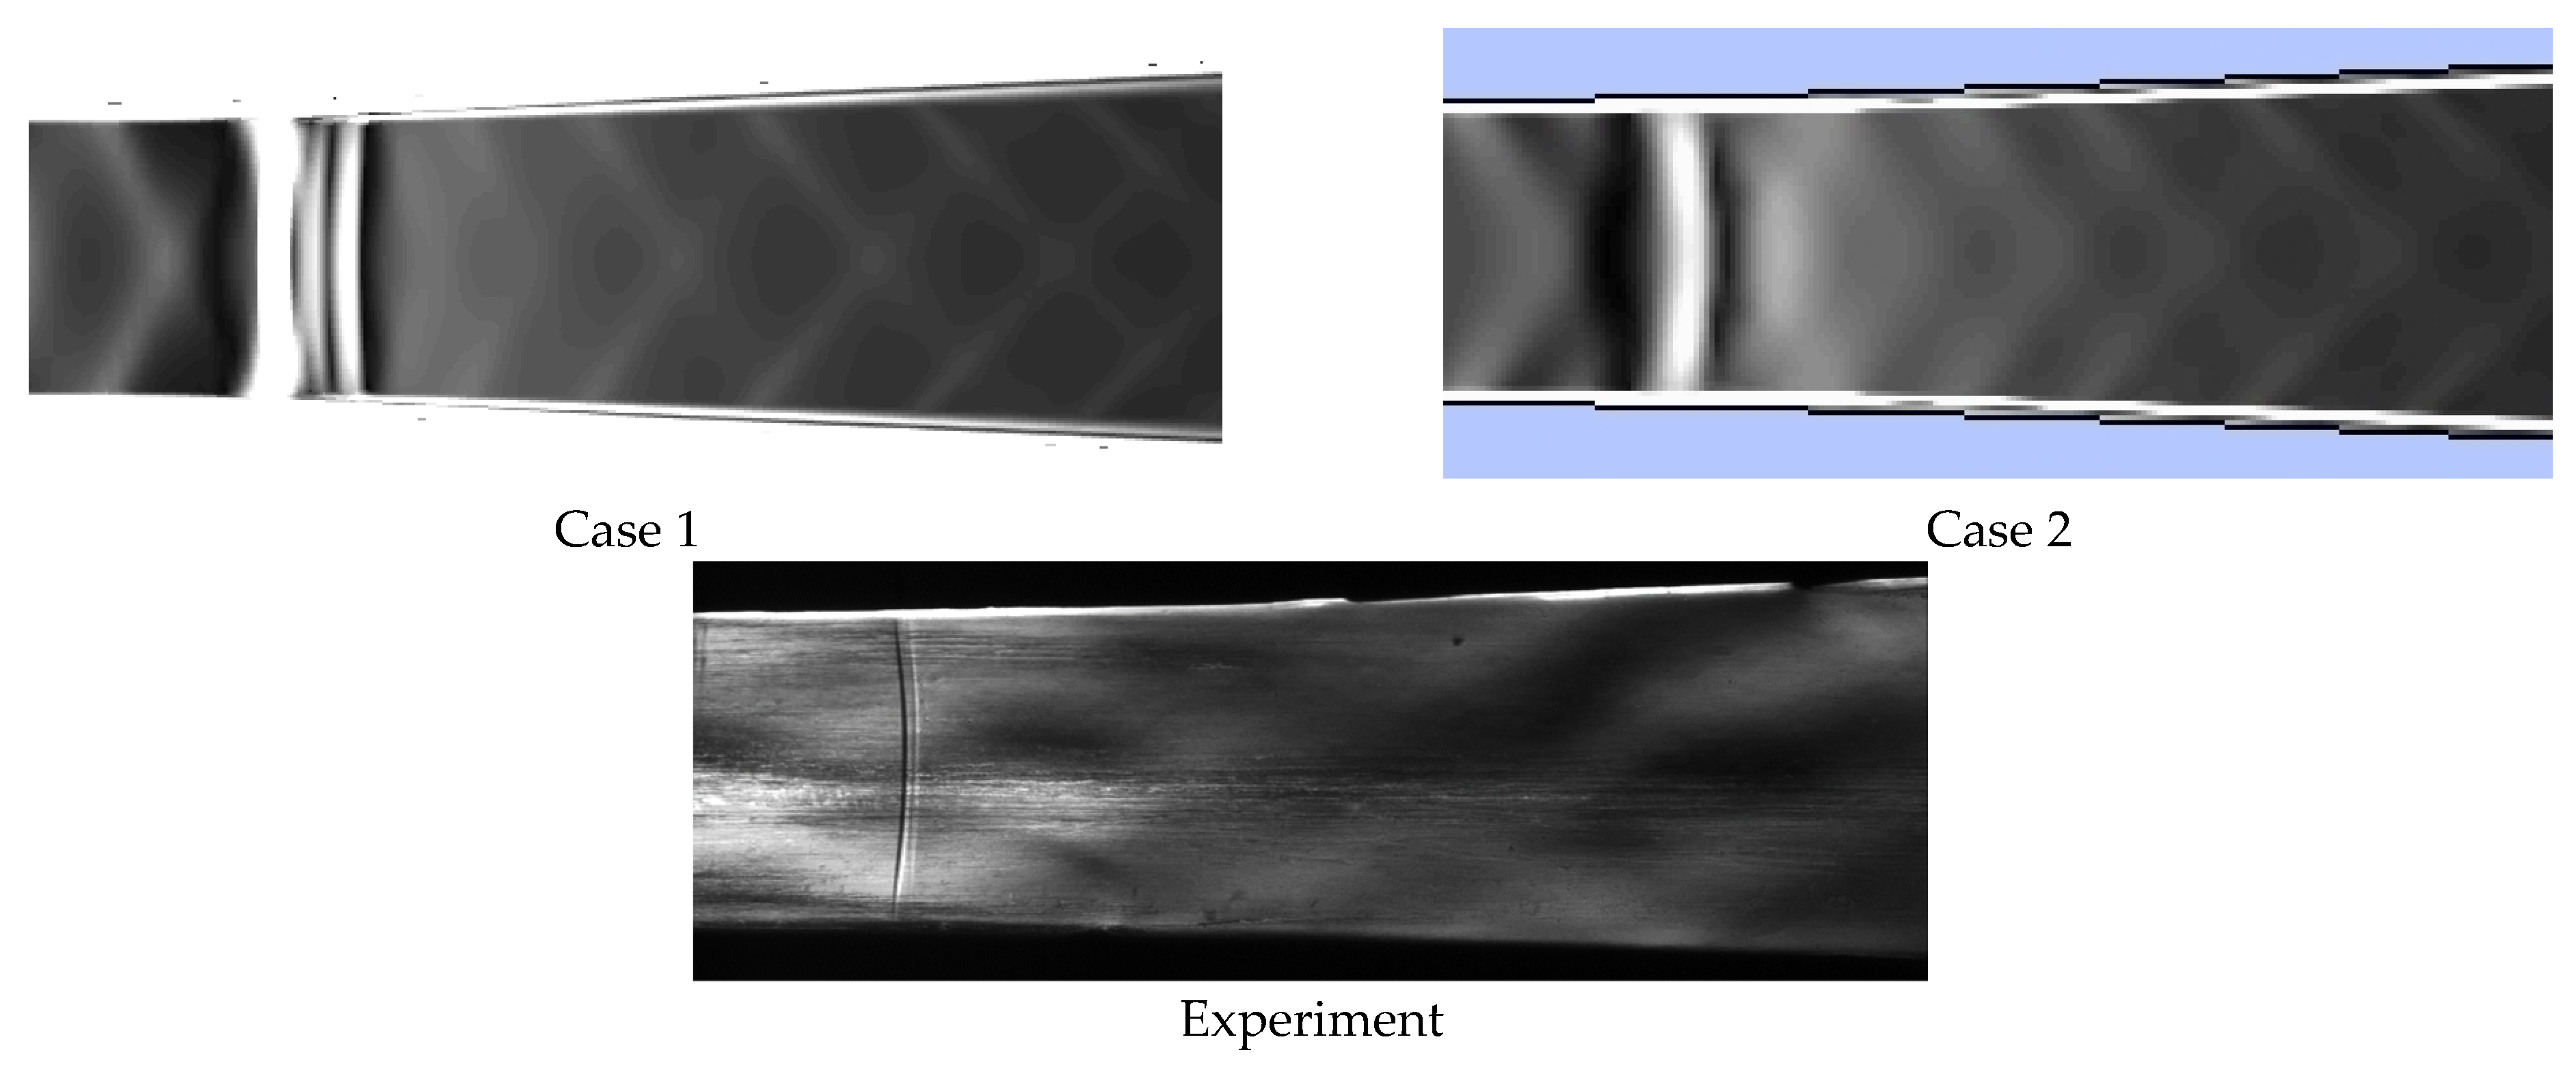
Figure 21 shows the static pressure distribution along the IWSEP nozzle wall and droplet diameter distribution through the nozzle midline and compares the results for the in-house code and ANSYS CFX with the experimental data. As can be seen, the results of the two codes for the static pressure distribution had a good agreement with the experiment. ANSYS CFX predicted the condensation wave location very well, but the in-house code predicted it a bit later than the ANSYS CFX results and experiments. However, the results of the in-house code for the mean droplet diameter were closer to the experimental data (Sauter mean diameter d32). The following contours present the Mach number isolines (Figure 22), gaseous phase static temprature isolines (Figure 23), wetness mass fraction isolines (Figure 24), and mean droplet diameter isolines (Figure 25). As can be seen in all contours, some differences between the two codes are visible in the region where the condensation wave occurred. This was due to the different locations and intensities of the condensation waves that the two codes predicted. The difference in the static temperature distribution of the two codes shown in Figure 23 was due to the different procedures for calculating the thermodynamic properties of the gas phase. The in-house code used the local real gas equation of state (Table 1), while the ANSYS CFX used IAPWS IF-97. The differences between the results for the wetness mass fraction (Figure 24) and the mean droplet diameter (Figure 25) were due to the different methods of calculating these two parameters in the two codes, similar to what was described for the case of the “half” nozzles in Section 4.1.1. Figure 26 shows the flow field images that present the absolute value of the density gradient for the CFD calculations and the flow field images obtained using the Schlieren technique for experiments. As can be seen in this figure, the two codes predicted the condensation wave very well compared to the Schlieren images.

5. Conclusions

The main aim of this paper was to employ two CFD codes (including our in-house CFD code and ANSYS CFX software) to model the steam condensing flow through two geometries. The geometries investigated in this study were half nozzles and the IWSEP nozzle. There were some differences between the two codes in terms of the flow-governing equations and numerical schemes. The RANS equations were written in the in-house code for the flow mixture, while in ANSYS CFX, the vapor and liquid phases were considered as separate phases, and these equations were written for each phase separately. The wetness mass fraction and number of droplets in the in-house code were calculated directly using the transport equations, while in ANSYS CFX, these two parameters were calculated based on the liquid volume fraction. In ANSYS CFX, the steam thermodynamic properties were calculated based on the IAPWS IF-97 formulations, while in in-house code, they were calculated using a local real gas equation of state that could predict the steam properties accurately below the saturation line. The results of the two codes were compared with each other and validated using experimental data obtained in our in-house test rig. The following remarks can be made:
  • Some differences were observed between the two codes in the parameter distributions, especially in the areas of the flow field strong discontinuities; i.e., in the area of the occurrence of condensation waves. This was due to the different methods used in the two codes to calculate the steam thermodynamic properties below the saturation line.
  • For the half nozzles, in ANSYS CFX commercial code, the condensation wave location occurred much earlier (just after the critical cross section of the nozzle), while the in-house CFD code had a good agreement with the experiments in this region.
  • For the IWSEP nozzle, the results of the two codes for the static pressure distribution had a good agreement with the experiments. ANSYS CFX predicted the condensation wave location very well, but the in-house code predicted it a bit later than the ANSYS CFX results and experiments. However, the results of the in-house code for the mean droplet diameter were closer to the experimental data.

Author Contributions

Conceptualization, S.S.; methodology, M.M. and S.D.; software, S.S.; validation, S.S.; formal analysis, S.S.; investigation, S.S.; resources, M.M., K.S. and S.D; data curation, S.S.; writing—original draft preparation, S.S.; writing—review and editing, S.S., M.M., S.D., E.L. and G.Z.; visualization, S.S.; supervision, M.M., S.D. and E.L.; project administration, M.M. and S.D. All authors have read and agreed to the published version of the manuscript.

Funding

This research was supported by the National Science Centre of Poland under number 2020/37/B/ST8/02369 and by statutory research funds for young scientists.

Data Availability Statement

The data that support the findings of this study are available from the corresponding author upon reasonable request.

Conflicts of Interest

The authors declare no conflict of interest.

Nomenclature

dDroplet diameter, m
ETotal internal energy, J kg−1
HTotal enthalpy, J kg−1
JNucleation rate, m−3s−1
kBBoltzmann constant, J K−1
KnKnudsen number
LLatent heat, J kg−1
mMolecular mass, kg
nNumber of droplets, m−3
pPressure, pa
rDroplet radius, m
r*Critical droplet radius, m
RGas constant, J kg−1K−1
TTemperature, K
tTime, s
uVelocity vector, m s−1
VVolume of the phases, m3
xAxial coordinate, m
yLiquid mass fraction
Greek symbols
αLiquid volume fraction
γRatio of specific heat
δKronecker delta
λThermal conductivity, W m−1K−1
μDynamic viscosity, kg m−1s−1
ρDensity, kg m−3
σSurface tension, N m−1
τStress tensor, Pa
Subscripts
lLiquid
mMixture
sSaturation
vVapor

References

  1. Vijayan, V.; Vivekanandan, M.; Venkatesh, R.; Rajaguru, K.; Godwin, A. CFD modeling and analysis of a two-phase vapor separator. J. Therm. Anal. Calorim. 2021, 145, 2719–2726. [Google Scholar] [CrossRef]
  2. Zhang, Y.; Yu, G.; Jin, R.; Zhang, Y.; Dong, K.; Cheng, T.; Wang, B. Water vapor distribution and particle condensation growth in turbulent pipe flow. Powder Technol. 2022, 403, 117401. [Google Scholar] [CrossRef]
  3. Pakhomov, M.A.; Lobanov, P.D. Gas-Liquid Two-Phase Flow in a Pipe or Channel. Water 2021, 13, 3382. [Google Scholar] [CrossRef]
  4. Liu, H.; Wen, C.; Yuen, A.C.Y.; Han, Y.; Cheung, S.C.-P.; Kook, S.; Yeoh, G.H. A novel thermal management system for battery packs in hybrid electrical vehicles utilising waste heat recovery. Int. J. Heat Mass Transf. 2022, 195, 123199. [Google Scholar] [CrossRef]
  5. Young, J.B. The spontaneous condensation of steam in supersonic nozzles. Phys. Chem. Hydrodyn. 1982, 3, 57–82. [Google Scholar]
  6. Babenko, V.A.; Habibulin, V.S. Formation of water droplets in steam turbines. Heat Transf. Res. 2016, 47, 485–497. [Google Scholar]
  7. Chen, C.-K.; Yang, S.-A. Laminar film condensation inside a horizontal elliptical tube with variable wall temperature. Int. J. Heat Fluid Flow 1994, 15, 75–78. [Google Scholar] [CrossRef]
  8. Li, Z.; Yang, W.; Chen, X. Experimental study on the mechanism of water droplets formation in steam turbines. J. Energy Resour. Technol. 2016, 138. [Google Scholar] [CrossRef]
  9. Sumer, B.M.; Bayraktar, H. Droplet formation in steam turbine flow channels. ASME J. Fluids Eng. 2003, 125, 467–474. [Google Scholar]
  10. Denton, J.D. Loss Mechanisms in Turbomachines. In Proceedings of the ASME 1993 International Gas Turbine and Aeroengine Congress and Exposition, Cincinnati, OH, USA, 24–27 May 1993. [Google Scholar] [CrossRef] [Green Version]
  11. Srinivasan, N.R.; Suresh, S.; Kumar, T.D. Steam Turbine Condensation Effects on Power Plant Performance. Int. J. Appl. Eng. Res. 2014, 9, 20557–20572. [Google Scholar]
  12. Gupta, A.K.; Bhatnagar, A.K. Condensation Phenomenon and Its Effect on the Performance of Steam Turbines. Int. J. Therm. Sci. 2009, 48, 213–222. [Google Scholar]
  13. Starzmann, J.; Hughes, F.R.; Schuster, S.; White, A.J.; Halama, J.; Hric, V.; Kolovratník, M.; Lee, H.; Sova, L.; Št’astný, M.; et al. Results of the International Wet Steam Modeling Project. Proc. Inst. Mech. Eng. Part A J. Power Energy 2018, 232, 550–570. [Google Scholar] [CrossRef] [Green Version]
  14. Halama, J.; Benkhaldoun, F.; Fořt, J. Numerical modeling of two-phase transonic flow. Math. Comput. Simul. 2010, 80, 1624–1635. [Google Scholar] [CrossRef]
  15. Halama, J.; Benkhaldoun, F.; Fořt, J. Flux schemes based finite volume method for internal transonic flow with condensation. Int. J. Numer. Methods Fluids 2011, 65, 953–968. [Google Scholar] [CrossRef]
  16. Zhang, G.; Dykas, S.; Majkut, M.; Smołka, K.; Cai, X. Experimental and numerical research on the effect of the inlet steam superheat degree on the spontaneous condensation in the IWSEP nozzle. Int. J. Heat Mass Transf. 2021, 165, 120654. [Google Scholar] [CrossRef]
  17. Grübel, M.; Starzmann, J.; Schatz, M.; Eberle, T.; Vogt, D.M.; Sieverding, F. Two-Phase Flow Modeling and Measurements in Low-Pressure Turbines—Part I: Numerical Validation of Wet Steam Models and Turbine Modeling. J. Eng. Gas Turbines Power 2015, 137, 042602. [Google Scholar] [CrossRef]
  18. Ihm, S.-W.; Kim, C. Computations of Homogeneous-Equilibrium Two-Phase Flows with Accurate and Efficient Shock-Stable Schemes. AIAA J. 2008, 46, 3012–3037. [Google Scholar] [CrossRef]
  19. Li, L.; Feng, Z.; Li, G. Study on Effects of Spontaneous Condensation on Performance of Low Pressure Stages in a Steam Turbine. In Proceedings of the ASME Turbo Expo 2006: Power for Land, Sea, and Air, Barcelona, Spain, 8–11 May 2006; pp. 1545–1553. [Google Scholar] [CrossRef]
  20. Yamamoto, S. Computation of practical flow problems with release of latent heat. Energy 2005, 30, 197–208. [Google Scholar] [CrossRef]
  21. Wu, X.; Li, L.; Li, G.; Feng, Z. Numerical investigation of the effect of inlet condition on self-excited oscillation of wet steam flow a supersonic turbine cascade. Int. J. Numer. Methods Fluids 2009, 60, 1334–1350. [Google Scholar]
  22. Dykas, S.; Majkut, M.; Smołka, K.; Strozik, M. An attempt to make a reliable assessment of the wet steam flow field in the de Laval nozzle. Heat Mass Transf. 2018, 54, 2675–2681. [Google Scholar] [CrossRef] [Green Version]
  23. Dykas, S.; Majkut, M.; Smolka, K.; Strozik, M. Experimental Research on Wet Steam Flow With Shock Wave. Exp. Heat Transf. 2014, 28, 417–429. [Google Scholar] [CrossRef]
  24. Dykas, S.; Majkut, M.; Strozik, M.; Smołka, K. Experimental study of condensing steam flow in nozzles and linear blade cascade. Int. J. Heat Mass Transf. 2015, 80, 50–57. [Google Scholar] [CrossRef] [Green Version]
  25. Majkut, M.; Dykas, S.; Smołka, K.; Strozik, M. Identification of the liquid mass fraction content in the wet steam. E3S Web Conf. 2019, 137, 01003. [Google Scholar] [CrossRef]
  26. ANSYS CFX-Solver Theory Guide, release 15 November 2013.
  27. Shabani, S.; Majkut, M.; Dykas, S.; Wiśniewski, P.; Smołka, K.; Cai, X.; Zhang, G. Numerical Analysis of the Condensing Steam Flow by Means of ANSYS Fluent and in-House Academic Codes with Respect to the Capacity for Thermodynamic Assessment. Front. Energy Res. 2022, 10, 2629. [Google Scholar] [CrossRef]
  28. Bakhtar, F.; Young, J.B.; White, A.; Simpson, D.A. Classical Nucleation Theory and Its Application to Condensing Steam Flow Calculations. Proc. Inst. Mech. Eng. Part C J. Mech. Eng. Sci. 2005, 219, 1315–1333. [Google Scholar] [CrossRef]
  29. Kantrowitz, A. Nucleation in very rapid vapor expansions. J. Chem. Phys. 1951, 19, 1097–1100. [Google Scholar] [CrossRef]
  30. Gyarmathy, G. Grundlagen einer Theorie der Nassdampfturbine. Ph.D. Thesis, Eidgenössische Technische Hochschule Zürich, Zürich, Switzerland, 1962. [Google Scholar] [CrossRef]
Figure 1. Steam tunnel with auxiliary devices: (1) control valve; (2) by-pass; (3) stop gate valve; (4) stop gate valve at by-pass; (5) inlet nozzle; (6) test section; (7) outlet elbow; (8) water injector; (9) pipe; (10) safety valve; (11) condenser; (12) suction line; (13) throttle valve; (14) desuperheater; (15) condensate tank; (16) control system of condensate level; (17) condensate pump; (18) discharge line; (19) stop valve; (20) water injector pump; (21) cooling water pump; (22) condensate pump; (23) pump.
Energies 16 04690 g001
Figure 2. View of the half nozzles in the test section.
Energies 16 04690 g002
Figure 3. Dimensions of the tested nozzles (in mm) and the location of static pressure taps along the nozzles.
Energies 16 04690 g003
Figure 4. View of IWSEP nozzle in the test section and the setup of the extinction probe.
Energies 16 04690 g004
Figure 5. IWSEP nozzle profile shape.
Energies 16 04690 g005
Figure 6. Numerical mesh for nozzle D1.
Energies 16 04690 g006
Figure 7. Numerical mesh for nozzle D2.
Energies 16 04690 g007
Figure 8. Numerical mesh for IWSEP nozzle.
Energies 16 04690 g008
Figure 9. Comparison of the static pressure distributions on the D1 nozzle wall.
Energies 16 04690 g009
Figure 10. Mach number isolines for D1 nozzle (M = 0–1.7; ΔM = 0.1).
Energies 16 04690 g010
Figure 11. Gaseous phase static temperature isolines for D1 nozzle (T = 300–380 K; ΔT = 5 K).
Energies 16 04690 g011
Figure 12. Wetness mass fraction isolines for D1 nozzle (y = 0–0.07; Δy = 0.005).
Energies 16 04690 g012
Figure 13. Mean droplet radius isolines for D1 nozzle (r = 0–1 × 10⁻⁷ m; Δr = 1 × 10⁻⁸ m).
Energies 16 04690 g013
Figure 14. Gaseous phase density gradient for D1 nozzle.
Energies 16 04690 g014
Figure 15. Comparison of the static pressure distribution on the D2 nozzle wall.
Energies 16 04690 g015
Figure 16. Mach number isolines for D2 nozzle (M = 0–1.7; ΔM = 0.1).
Energies 16 04690 g016
Figure 17. Gaseous phase static temperature isolines for D2 nozzle (T = 300–380 K; ΔT = 5 K).
Energies 16 04690 g017
Figure 18. Wetness mass fraction isolines for D2 nozzle (y = 0–0.07; Δy = 0.005).
Energies 16 04690 g018
Figure 19. Mean droplet radius isolines for D2 nozzle (r = 0–1 × 10⁻⁷ m; Δr = 1 × 10⁻⁸ m).
Energies 16 04690 g019
Figure 20. Gaseous phase density gradient for D2 nozzle.
Energies 16 04690 g020
Figure 21. Static pressure distribution along the IWSEP nozzle wall and the droplet diameter distribution through the nozzle midline.
Energies 16 04690 g021
Figure 22. Mach number isolines for IWSEP nozzle (M = 0–1.7; ΔM = 0.1).
Energies 16 04690 g022
Figure 23. Gaseous phase static temperature isolines for IWSEP nozzle (T = 300–380 K; ΔT = 5 K).
Energies 16 04690 g023
Figure 24. Wetness mass fraction isolines for IWSEP nozzle (y = 0.02–0.09; Δy = 0.005).
Energies 16 04690 g024
Figure 25. Mean droplet diameter isolines for IWSEP nozzle (d = 7 × 10⁻⁸–1.7 × 10⁻⁷ m; Δd = 1 × 10⁻⁸ m).
Energies 16 04690 g025
Figure 26. Gaseous phase density gradients for CFD and Schlieren images of experiments for IWSEP nozzle.
Energies 16 04690 g026
Table 2. Definition of supplementary variables and source terms.
Case 1—Implemented in In-House CodeCase 2—Implemented in ANSYS CFX
RANS E m = 1 y e v + y e l + 1 2 u j 2
y = m l m m
ρ m = ρ v / 1 y
α = V l V m
S m = ρ l 3 α r d r d t
S H = S m H u + 3 α r Q
H u is an upwinded total enthalpy; its value either for the continuous or dispersed phase depends on the direction of the interphase mass transfer.
Q is the heat transfer between the liquid and vapor phase:
Q = λ v r ( 1 + ξ K n ) ( T l T v ) , where ξ is the empirical constant.
Transport equations S y = 4 3 π ρ l r * 3 J + 4 π ρ l n r 2 d r d t
S n = ρ m J
r = 2 σ ρ l R T v l n p v p s ( T v )
------------
EOS A T = a 0 + a 1 T + a 2 T 2 ,
B T = b 0 + b 1 T + b 2 T 2 .
Coefficients a0..2 and b0..2 of polynomials A(T) and B(T) depend on temperature only and can be found by extrapolating steam properties (given in the IAPWS-IF97) from the superheated region into the supercooled one.
------------
Nucleation rate α c is the condensation coefficient, which is equal to 1. β c is empirical correction factor, which is equal to 1. This coefficient strongly depends on the pressure at the starting point of spontaneous nucleation. C is non-isothermal Kantrowitz correction factor:
C = 1 + 2 γ v 1 γ v + 1 L R T v L R T v 1 2 1
Droplet growth rate K n is the Knudsen number as follows, where l s is the mean free path of steam molecules.
K n = l s 2 r = μ v p v 9 π R T v 8 2 r
Table 3. Comparison between the numerical schemes.
Case 1—Implemented in In-House CodeCase 2—Implemented in ANSYS CFX
CalculationsIn seriesParallel
SolverDensity-basedPressure-based
Integration with respect to timeSecond-order Runge–Kutta explicit methodSecond-order Euler backward implicit scheme
Space discretizationFinite volume method (FVM)Finite volume method (FVM)
Control volume central to a node—cell-centered methodBalance of fluxes in the node—cell vortices scheme
Upwind scheme with the third-order Riemann-MUSCL exact solutionSecond-order high-resolution scheme
Table 4. Boundary conditions for the test cases.
Half NozzlesIWSEP Nozzle
Nozzle inletP0 = 98 kPa
T0 = 105 °C
Turbulent intensity = 5%
P0 = 105.8 kPa
T0 = 111.2 °C
Turbulent intensity = 5%
Nozzle wallsAdiabatic, smooth, and no-slipAdiabatic, smooth, and no-slip
Nozzle outletPout = 40 kPaSupersonic
Disclaimer/Publisher’s Note: The statements, opinions and data contained in all publications are solely those of the individual author(s) and contributor(s) and not of MDPI and/or the editor(s). MDPI and/or the editor(s) disclaim responsibility for any injury to people or property resulting from any ideas, methods, instructions or products referred to in the content.