Article

Improvement of Power Recovery by Applying a Multi-Pulse Electric Field in the Thermoelectric Cycle Power Generation Process with Pyroelectric Materials

by
Buddhika Amila Kumara Sodige
1,2,*,
Hideto Furuno
1,
Nguyen Chi Trung Ngo
1,
Hironari Sugiyama
1,
Masaaki Baba
3,
Koichi Niihara
1 and
Tadachika Nakayama
1,*
1
Extreme Energy–Density Research Institute (EDI), Nagaoka University of Technology, 1603-1, Kamitomioka, Nagaoka 940-2188, Niigata, Japan
2
Department of Materials and Mechanical Technology, Faculty of Technology, University of Sri Jayewardenepura, Nugegoda 10250, Sri Lanka
3
Department of Mechanical Engineering, Nagaoka University of Technology, 1603-1, Kamitomioka, Nagaoka 940-2188, Niigata, Japan
*
Authors to whom correspondence should be addressed.
Energies 2023, 16(12), 4728; https://doi.org/10.3390/en16124728
Submission received: 29 May 2023 / Revised: 11 June 2023 / Accepted: 13 June 2023 / Published: 15 June 2023
(This article belongs to the Section F: Electrical Engineering)

Abstract

:
Nanogenerator energy harvesting technologies that transform thermal energies into electricity may help address the growing need for green power. Therefore, this research aims to increase power generation by combining waste heat with pyroelectric nanogenerators as a sustainable energy source. Under optimal conditions, an external multi-pulse electric field can be utilized to generate power using thermoelectric cycle power generation. The greatest power may be gathered by applying various pulses of the external electric field at temperature changes on the surface of the pyroelectric materials. To generate pyroelectric power, a C9 BZT sample was used, and the lowest temperature difference for accomplishing this was 20 °C, with all measurements made on a sample with a lower limit of 120 °C. The maximum generation density was 0.104 mJ/cm2°CkV for a pulse width of 10 ms and 20 pulses of a low voltage (250 V/mm) input electric field. A multi-pulse electric field with low input voltage increases the power generation performance ratio (η) with the pulse count. At the largest number of pulses, the greatest η value for 250 V/mm was 7.834. Finally, it was determined that the developed pyroelectric power generation system may be more effective if a low-voltage, multi-pulse electric field is used.

1. Introduction

The increasing need for renewable energy has spurred the study and development of energy harvesting systems that make use of the environment. Due to rising energy demands and dwindling fossil fuel reserves, new renewable energy technologies are being developed. Incorporating a small-scale physical change into the generation of electricity may be possible with the help of digitally enhanced applications; these nanogenerators, including piezoelectric [1,2,3], triboelectric [4,5,6,7], and pyroelectric ones [8,9,10,11,12], transform thermal and mechanical energy into electricity. To combat the difficulty of recovering useful heat from byproducts, pyroelectric power production devices have emerged as a possible option. The improvement of power recovery and analysis of the performance of pyroelectric power generation for the recovery of waste heat are presented in this paper.

1.1. Pyroelectric Energy Harvesting

The method of converting time-dependent temperature variations into electrical energy is known as pyroelectric power production, which falls within the category of energy harvesting. When their temperatures change, pyroelectric materials generate an electric charge that may be used to generate energy. This phenomenon has been observed for well over a century, but it has only recently come to the attention of experts as a feasible alternative for renewable energy generation. Pyroelectric materials are often crystals or ceramics with a non-centrosymmetric crystal structure. This guarantees that the material’s electric dipole moments are not distributed equally across the crystalline structure. Temperature changes generate a shift in the distribution of electric dipole moments in pyroelectric products in an electric field.
Multiple researchers have investigated the potential of pyroelectricity to produce electrical energy. Olsen et al. [13] were one of the first groups to apply the concept of a heat cycle to pyroelectric materials. They employed a lead-based material to achieve an energy density of 100 mJ/cm3. Likewise, Lee et al. [14] achieved another extremely high energy density of 1014 mJ/cm3 when conducting studies with the same Olsen cycle. The greatest power production levels, 11 mW/cm3 and 10.8 mW/cm3, were achieved from PNZST and PLZST samples under temperature difference (ΔT) = 40 °C, applied electric field (EH) = 12 kV/cm and ΔT = 40 °C, EH = 20 kV/cm, respectively [15,16]. Power recovery from pyroelectric materials is primarily accomplished using the Olsen and Stirling thermoelectric cycle approaches [13,17,18,19,20,21]. Additionally, utilizing a circuit with a diode and two switches, Yoonho Kim et al. revealed a unique electro-thermodynamic power generation technique that combined Stirling and Olsen thermoelectric cycles and had a greater power generation efficiency than the Olsen electro-thermodynamic cycle method [22,23]. These studies show that pyroelectric power generation has the potential to be a practical way to generate energy from temperature changes. However, issues still need to be resolved, such as enhancing the capability and stability of pyroelectric materials and apparatus. More research is necessary to increase the effectiveness of pyroelectric power generation and explore its potential uses in real-world settings.

1.2. Pyroelectric Effect

The term “pyroelectric effect” describes how temperature changes in pyroelectric materials cause a change in spontaneous polarization [24,25]. Pyroelectric materials contain dipole moments that pile up naturally in the direction perpendicular to a flat surface to produce a net electrical polarization. This is known as spontaneous electric polarization. Electric dipoles only sporadically oscillate close to their aligning axes at a constant temperature, producing a steady overall spontaneous polarization. There is no developed electric field in the substance. When the materials are heated, the electric dipoles shift at wider angles, reducing the spontaneous polarization and the number of bound surface charges. As a result, the free charges rearrange in order to make up for the bound charges, resulting in a pyroelectric current. Similarly, if the materials are cooled rather than heated, a pyroelectric current [26,27,28] flows in the opposite direction. As a result of their electric dipole moments, pyroelectric materials exhibit temperature-dependent spontaneous polarization, with the direction of the polarization switching depending on the applied field. Figure 1 depicts the relationship between the pyroelectric material’s electric displacement (D) and electric field (E) at two distinct temperature levels (high and low). The electro-thermodynamic Equation (1) is a representation of the relationship between D and E. The displacement, electric field, temperature, time, permittivity, and pyroelectric coefficient are denoted as D, E, T, t, ε, and p, respectively.
D t = ε E t + p T t

1.3. Thermoelectric Cycle for the Power Generation Process

By employing thermoelectric cycles, the viability of employing ferroelectric materials in pyroelectric energy harvesting has been examined. The Olsen cycle, commonly regarded as the most extensively utilized thermoelectric cycle, is able to gain energy density throughout the power generation process. Two isothermal processes and two isoelectric processes make up the Olsen cycle [13,17,18]. The Olsen cycle is seen in the ABDEA region of Figure 1. The Stirling cycle is a different type of electro-thermodynamic cycle. Two isothermal steps and two iso-displacement steps are also included in the process [19,20,21]. The ABCDA region of Figure 1 contains an illustration of this cycle. Yoonho Kim et al. constructed a unique electro-thermodynamic cycle by merging the Olsen and Stirling cycles with a circuit made up of a diode and two switches (DSW circuit) [22,23,29,30,31,32,33]. According to Figure 1, the Kim cycle consists of four processes: two isothermal processes (A-B and C-E), one iso-displacement process (B-C), and two isoelectric processes (E-A). Compared with the conventional Olsen cycle, this cycle can produce more pyroelectric energy from ferroelectric materials. In this work, the electro-thermodynamic cycle, represented by ABCDEA in Figure 1, has been put to experimental use. Equation (2) provides a definition of the resulting energy density during these operations. ND stands for energy density, E stands for the electric field, and D stands for electric displacement.
N D = E · d D

1.4. Pulse Electric Field for Enhancing Energy Harvesting Efficiency

Previously, pulsed electric fields have been employed in triboelectric, piezoelectric, and thermoelectric energy harvesting methods and applications. By comparison, pyroelectric energy harvesting devices are rarely studied. On the other hand, the concept of a pulse electric field may be used to improve the performance of pyroelectric energy harvesting devices. The pulse electric field can be used to align dipole moments to improve the pyroelectric properties of materials [34,35,36]. As a result, pulse electric fields have the potential to increase energy harvesting efficiency. The cyclic temperature fluctuations used in pyroelectric energy harvesting cause a change in polarization and the generation of an electric charge. During cyclic temperature variations, a pulsed electric field can increase charge separation and accumulation inside the pyroelectric material. This improved charge separation might lead to improved energy conversion and harvesting efficiency. As a result, the use of pulse electric fields to boost the energy-harvesting performance of pyroelectric materials would need to be validated by study and experimental testing. It is crucial to carefully optimize the pulse width, number of pulses, amplitude, and frequency to achieve the desired outcomes without damaging the pyroelectric material.
The main objective of this study is to improve pyroelectric power generation in relation to an externally applied multi-pulse electric field using a newly developed experimental setup since there has been no reported pyroelectric-power-generating experiment employing this concept.

2. Methodology

A newly designed power-generating apparatus is shown in Figure 2. The net pyroelectric power was measured by applying a multi-pulse electric field to the material and monitoring its response. The pulse detector circuit, the switching control unit, and the cooling and heating systems are the three primary components of the power generation system. This technique was tested using a typical C-9 BZT Fuji ceramic sample with dimensions of 20 mm length, 20 mm height, and 0.5 mm thickness. The sample was mounted on the sample holder. Two infrared heat spot lamps were used as the heat source to maintain the high and low temperatures of the sample surfaces. A pulsed electric field was applied using a Matsusada Precision HK-2N pulsed power source.
Equation (3) can be used to determine the net electric power generated. A YOKOGAWA DL850 ScopeCorder was used to measure and record the VR2, Vi, and Vshunt parameters. Pin and Pout represent the input power supplied to the pyroelectric body through an external pulsed electric field and the output power generated by the sample’s temperature change. Figure 2 depicts high-accuracy fixed resistors R1, R2, and Rshunt. The input voltage of the multi-pulse electric field, the voltage through R2, and the shunt resistance voltage are denoted as Vi, VR2, and Vshunt, respectively.
P n e t = P o u t P i n = V R 2 2 ( R 1 + R 2 R 2 2 ) V i × V s h u n t R s h u n t
The first step was to set the heating and cooling systems to operate at a temperature difference of 20 °C on the sample surface. Every 10 s, the temperature would rise and then fall. As a pseudo sinusoidal function, the temperature fluctuation had a periodic time in the order of 20 s. The heating and cooling system kept the surface of the sample at a temperature between the low end (120 °C) and the high end (140 °C). The C9 sample received a certain number of electric pulses from the newly developed system when the temperature was at its lowest point (120 °C). The experimental setup’s control system was then automatically managed in accordance with an embedded program on the main possessing board. The average values from five power generation cycles were used to compute the input power (Pin), output power (Pout), and average net generated power (Pnet).

Operational Steps in the Power Generation System according to the Thermoelectric Cycle

With the aid of the pulse power source and the signal generator, the pulse width, number of pulses, and amplitude of the external pulse electric field were initially set up. After this, the pulse electric field was detected by a circuit that acts as a pulse detector. The thermoelectric cycle was started at the same time as the controlling system’s in-built algorithm for power generation. The following four processes were carried out in order on the heating and cooling system and the designated SW1, SW2, and SW3 switches in line with the electro-thermodynamic cycle, as shown in Figure 1.
  • Process A–B: Isothermal Step
When the temperature is at its lowest level (120 °C), the switch SW1 is closed and the switches SW2 and SW3 are opened. An external multi-pulse electric field is applied to the sample just as the temperature begins to rise. After applying the pulse electric field to the sample, SW1 is opened and SW2 and SW3 are left unchanged. The sample will then have attained its maximum amount of polarization.
  • Process B–C: Iso-displacement Step
The heating and cooling systems gradually raise and lower the temperature of the material. The SW1, SW2, and SW3 switches are opened up until the temperature reaches its maximum setting (140 °C). As the temperature of the sample is increased, the voltage increases as a result of the pyroelectric effect of the material, as shown in Figure 1.
  • Process C–E: Isothermal Step
Switch SW1 is opened and switches SW2 and SW3 are closed when the sample temperature reaches its maximum. Simultaneously, the polarization decreases as the components begin to discharge. When the sample is quickly discharged through resistors R1 and R2, the net generating power is measured.
  • Process E–A: Isoelectric Step
During this process, the SW2 and SW3 switches are closed and SW1 is opened. The temperature of the sample gradually decreases to its lowest level. After discharging the generated electrical charge, the next cycle begins at point A in Figure 1 and applies an external multi-pulse electric field to the sample.
Table 1 shows the switches’ settings and how the circuit operates throughout a single thermoelectric cycle. The system may produce substantially more electric energy when the BCDB area is extended during the course of the single power generation cycle depicted in Figure 1.

3. Results and Discussion

3.1. Dielectric Measurements

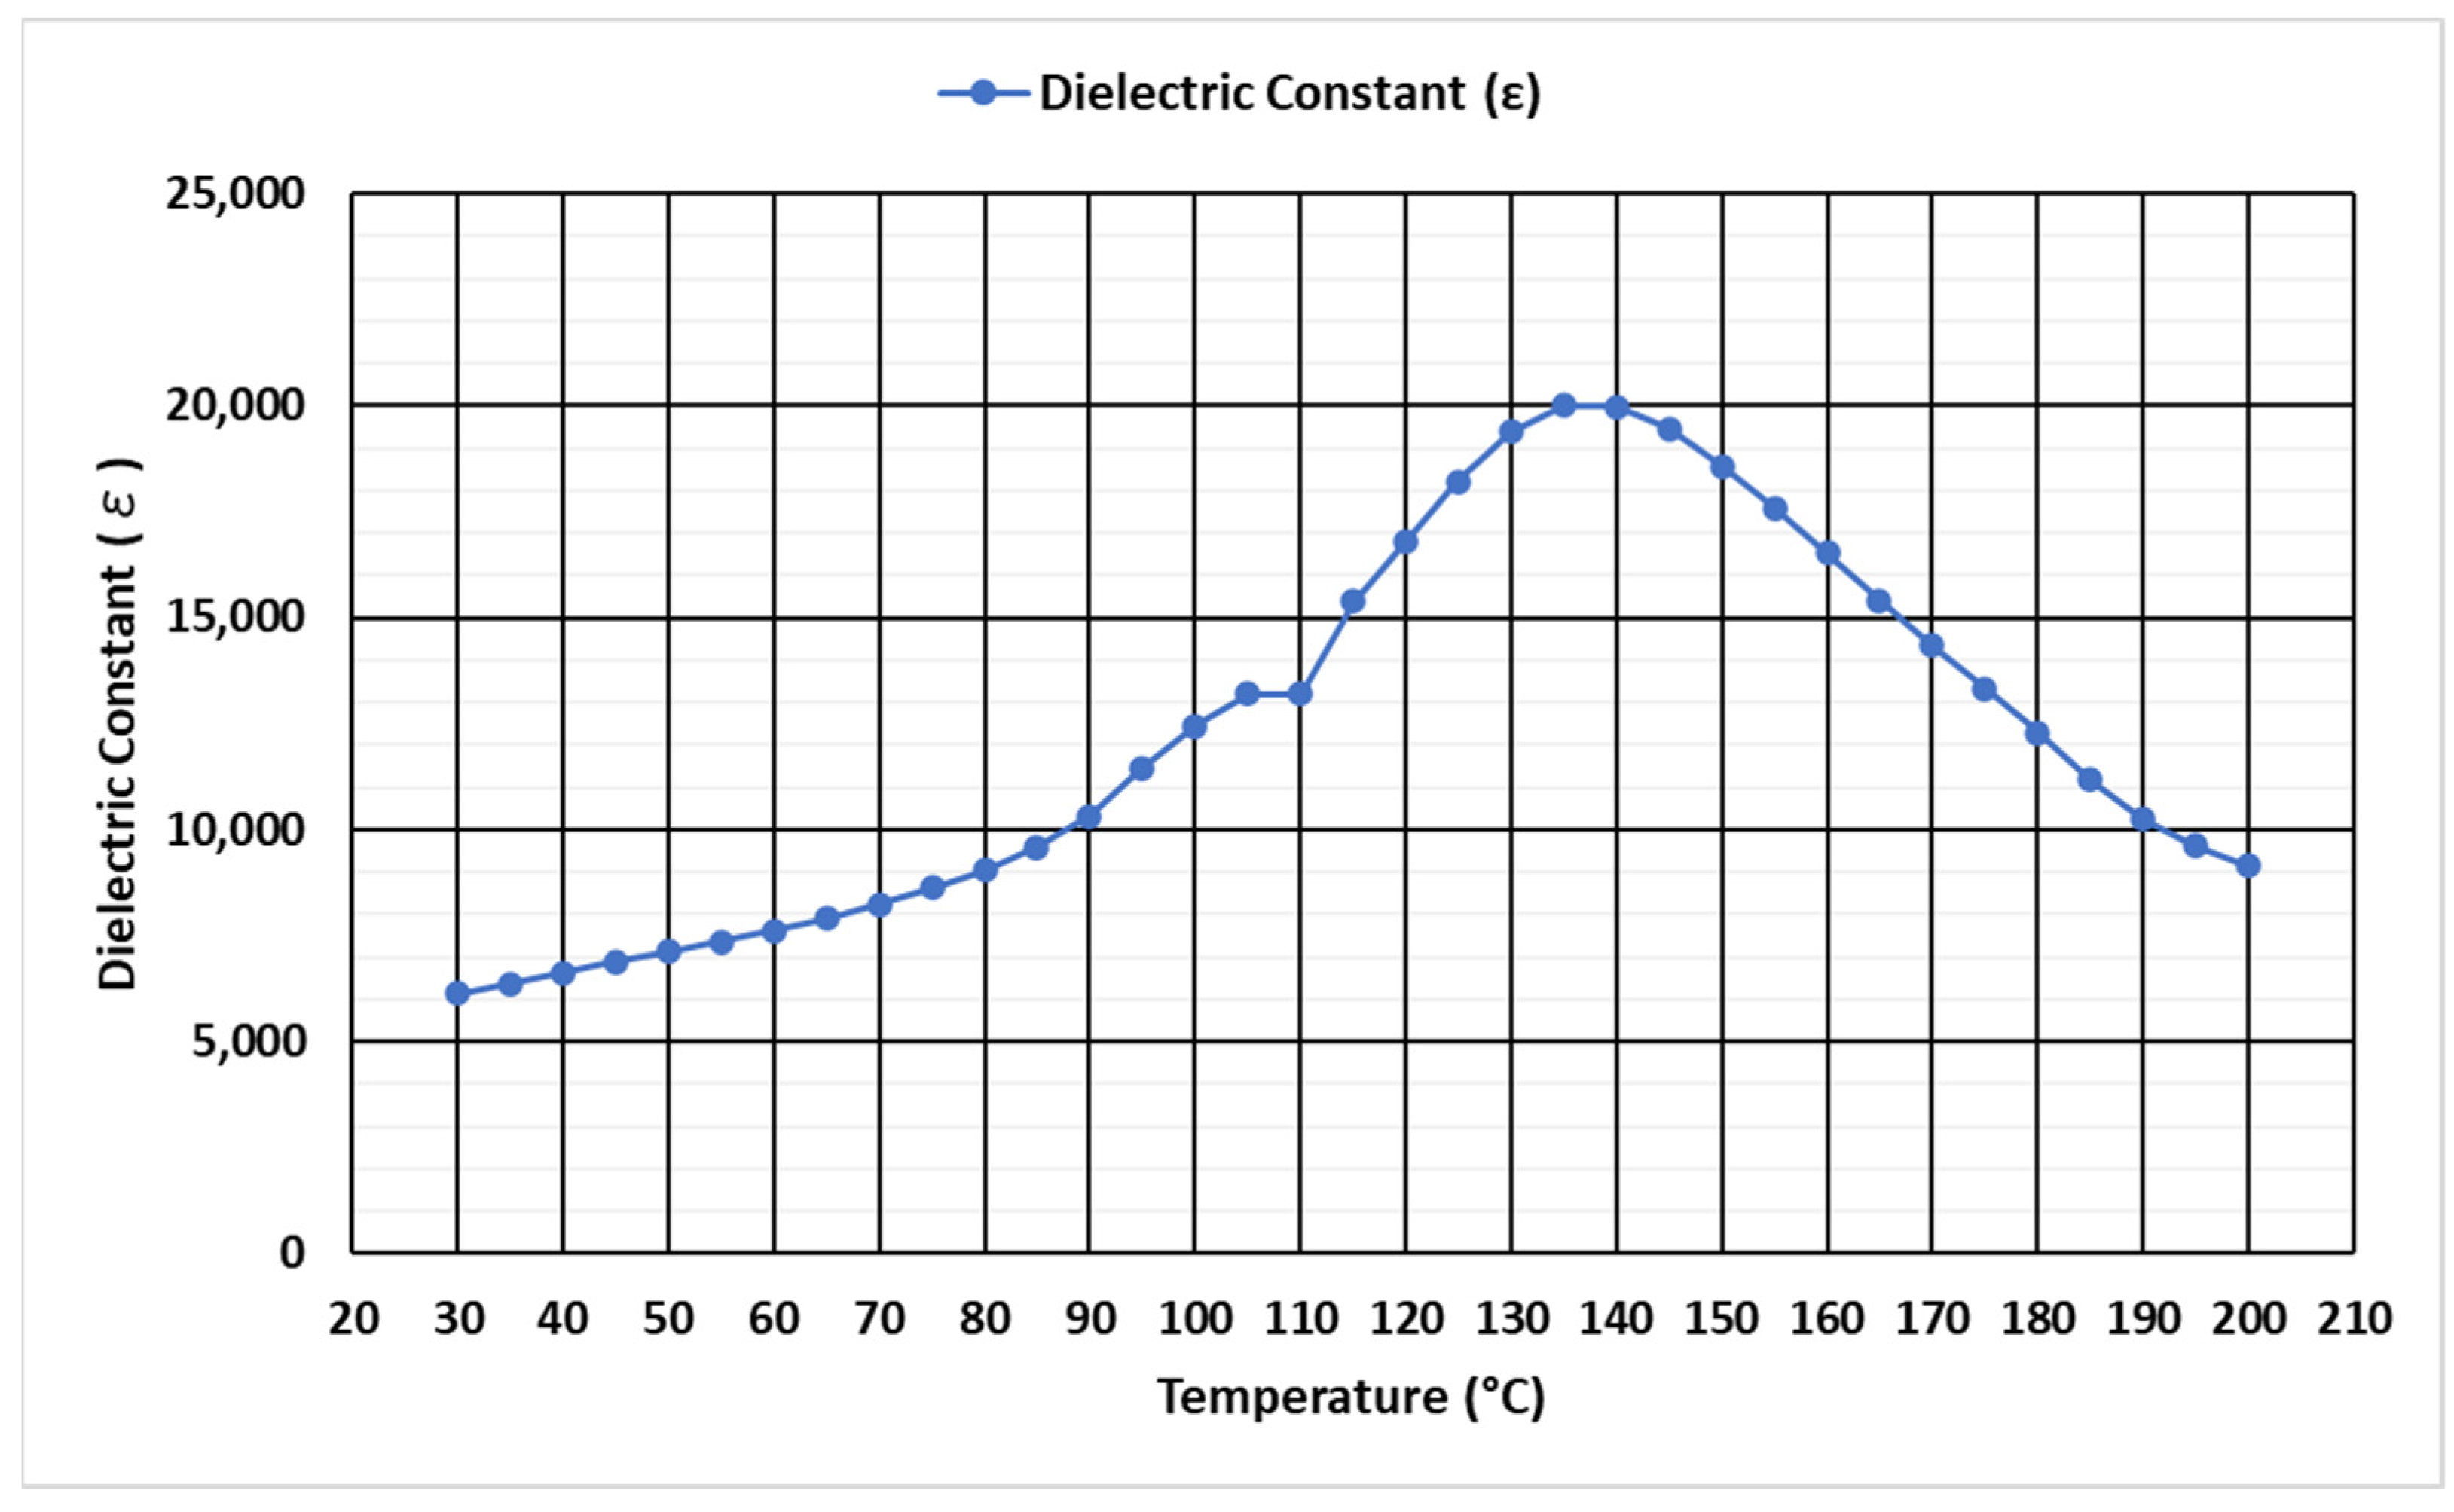
Figure 3 shows the variation in dielectric constant with temperature for a C9 sample. These readings were obtained at a frequency of 1 kHz while the temperature was rising. The dielectric constant was 6138 at 30 °C and became larger as the temperature climbed. When the temperature reached 135 °C, the greatest value was 20,000. The phase transition at the Curie temperature caused a single peak to appear in the dielectric constant curve for the C9 sample. The curve started to decline after the dielectric curve reached the transition temperature. This result led to the determination that the C9 sample’s Curie temperature was around 135 °C.

3.2. Measurement of Sample Voltage against the Multi-Pulse Electric Field over Five Cycles

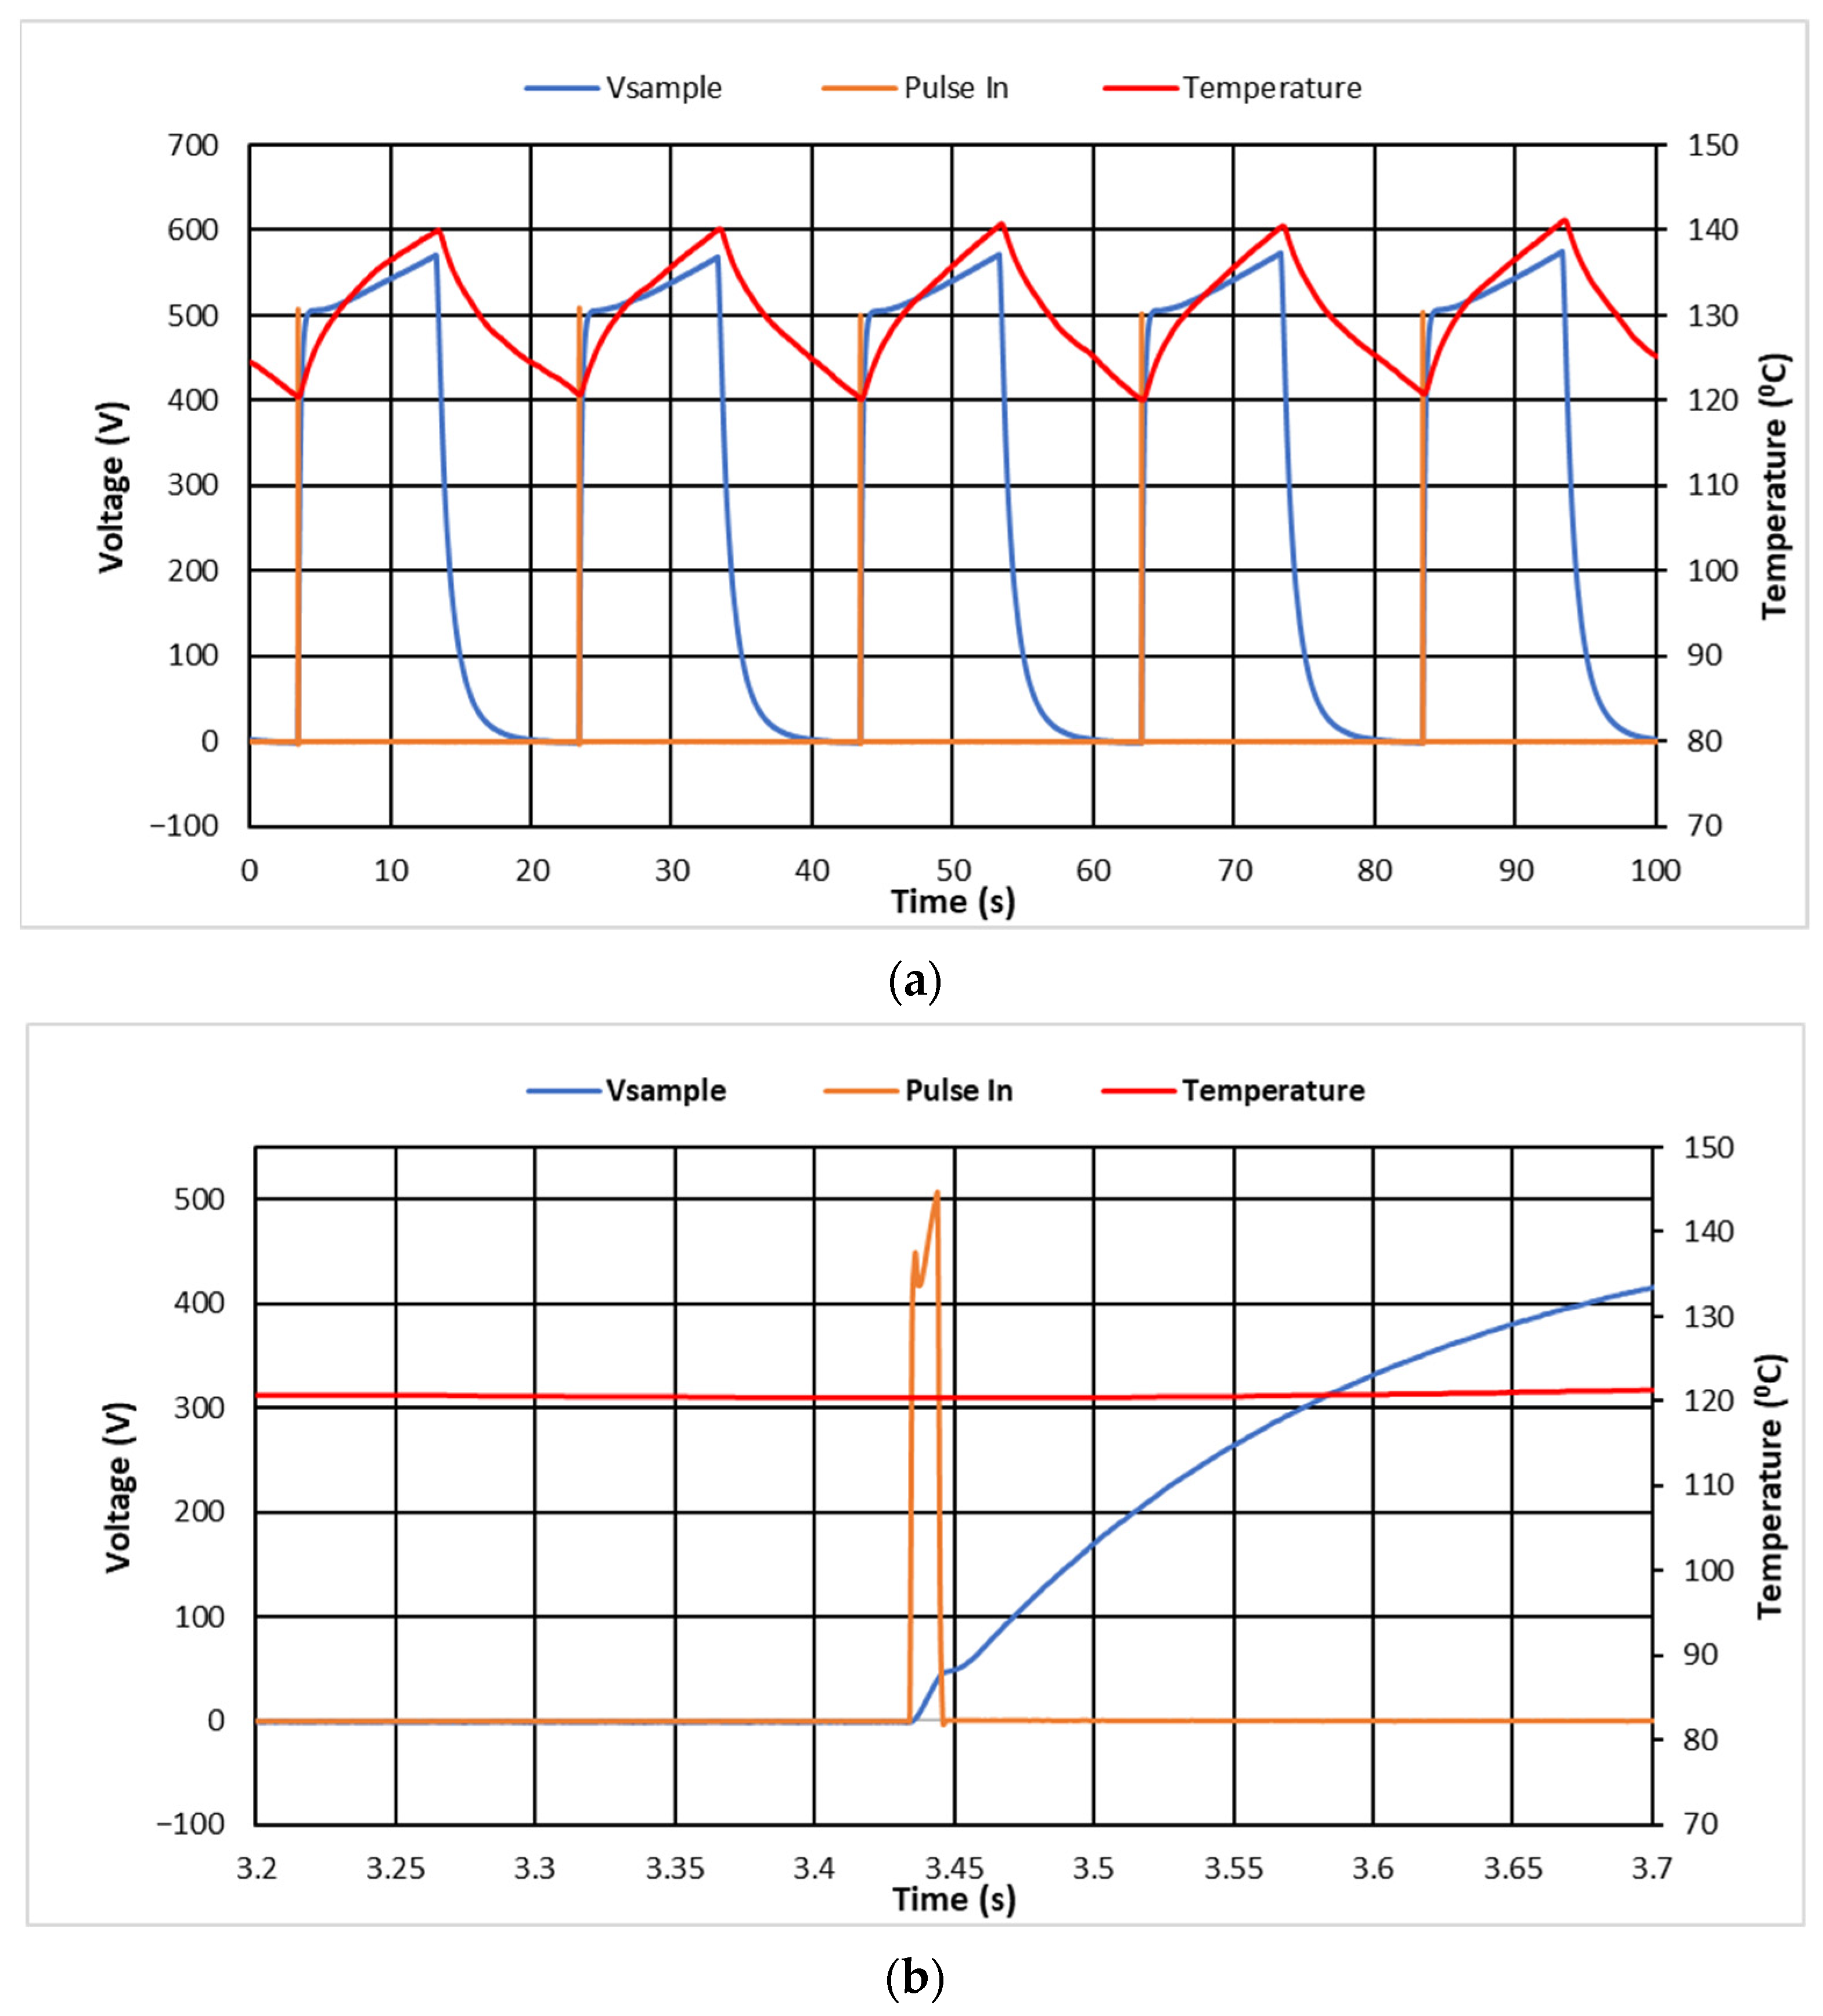
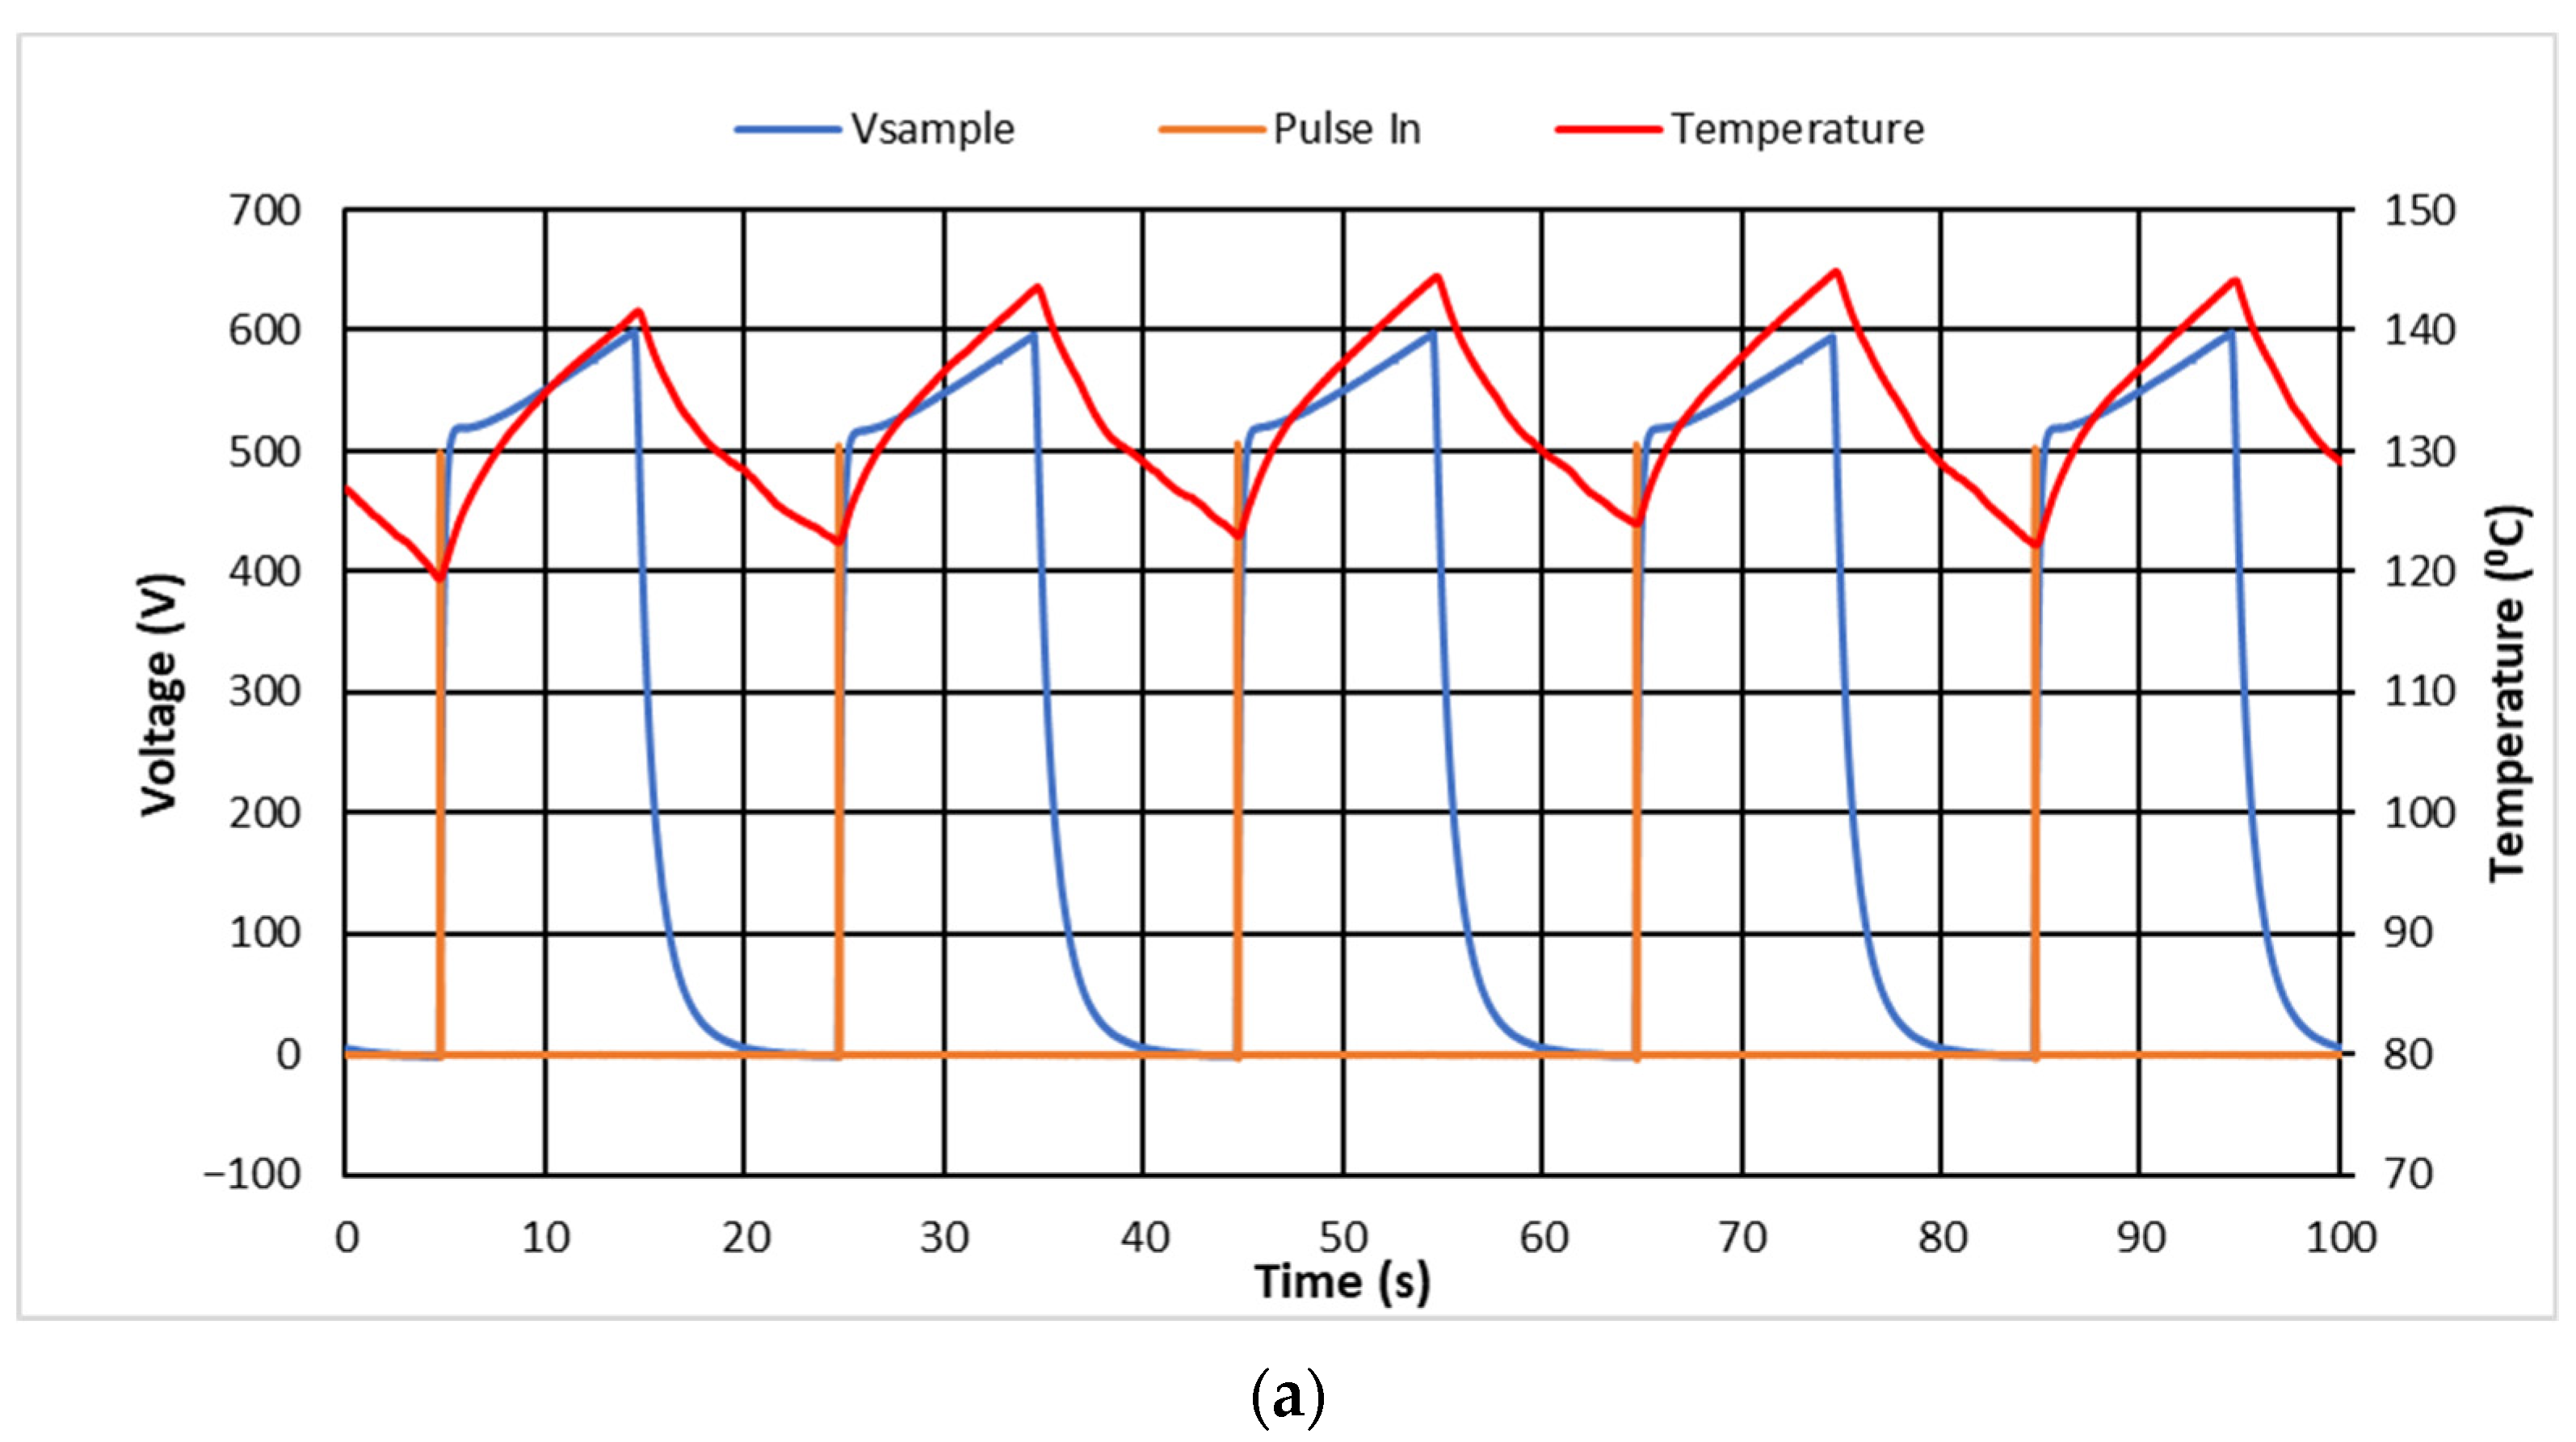
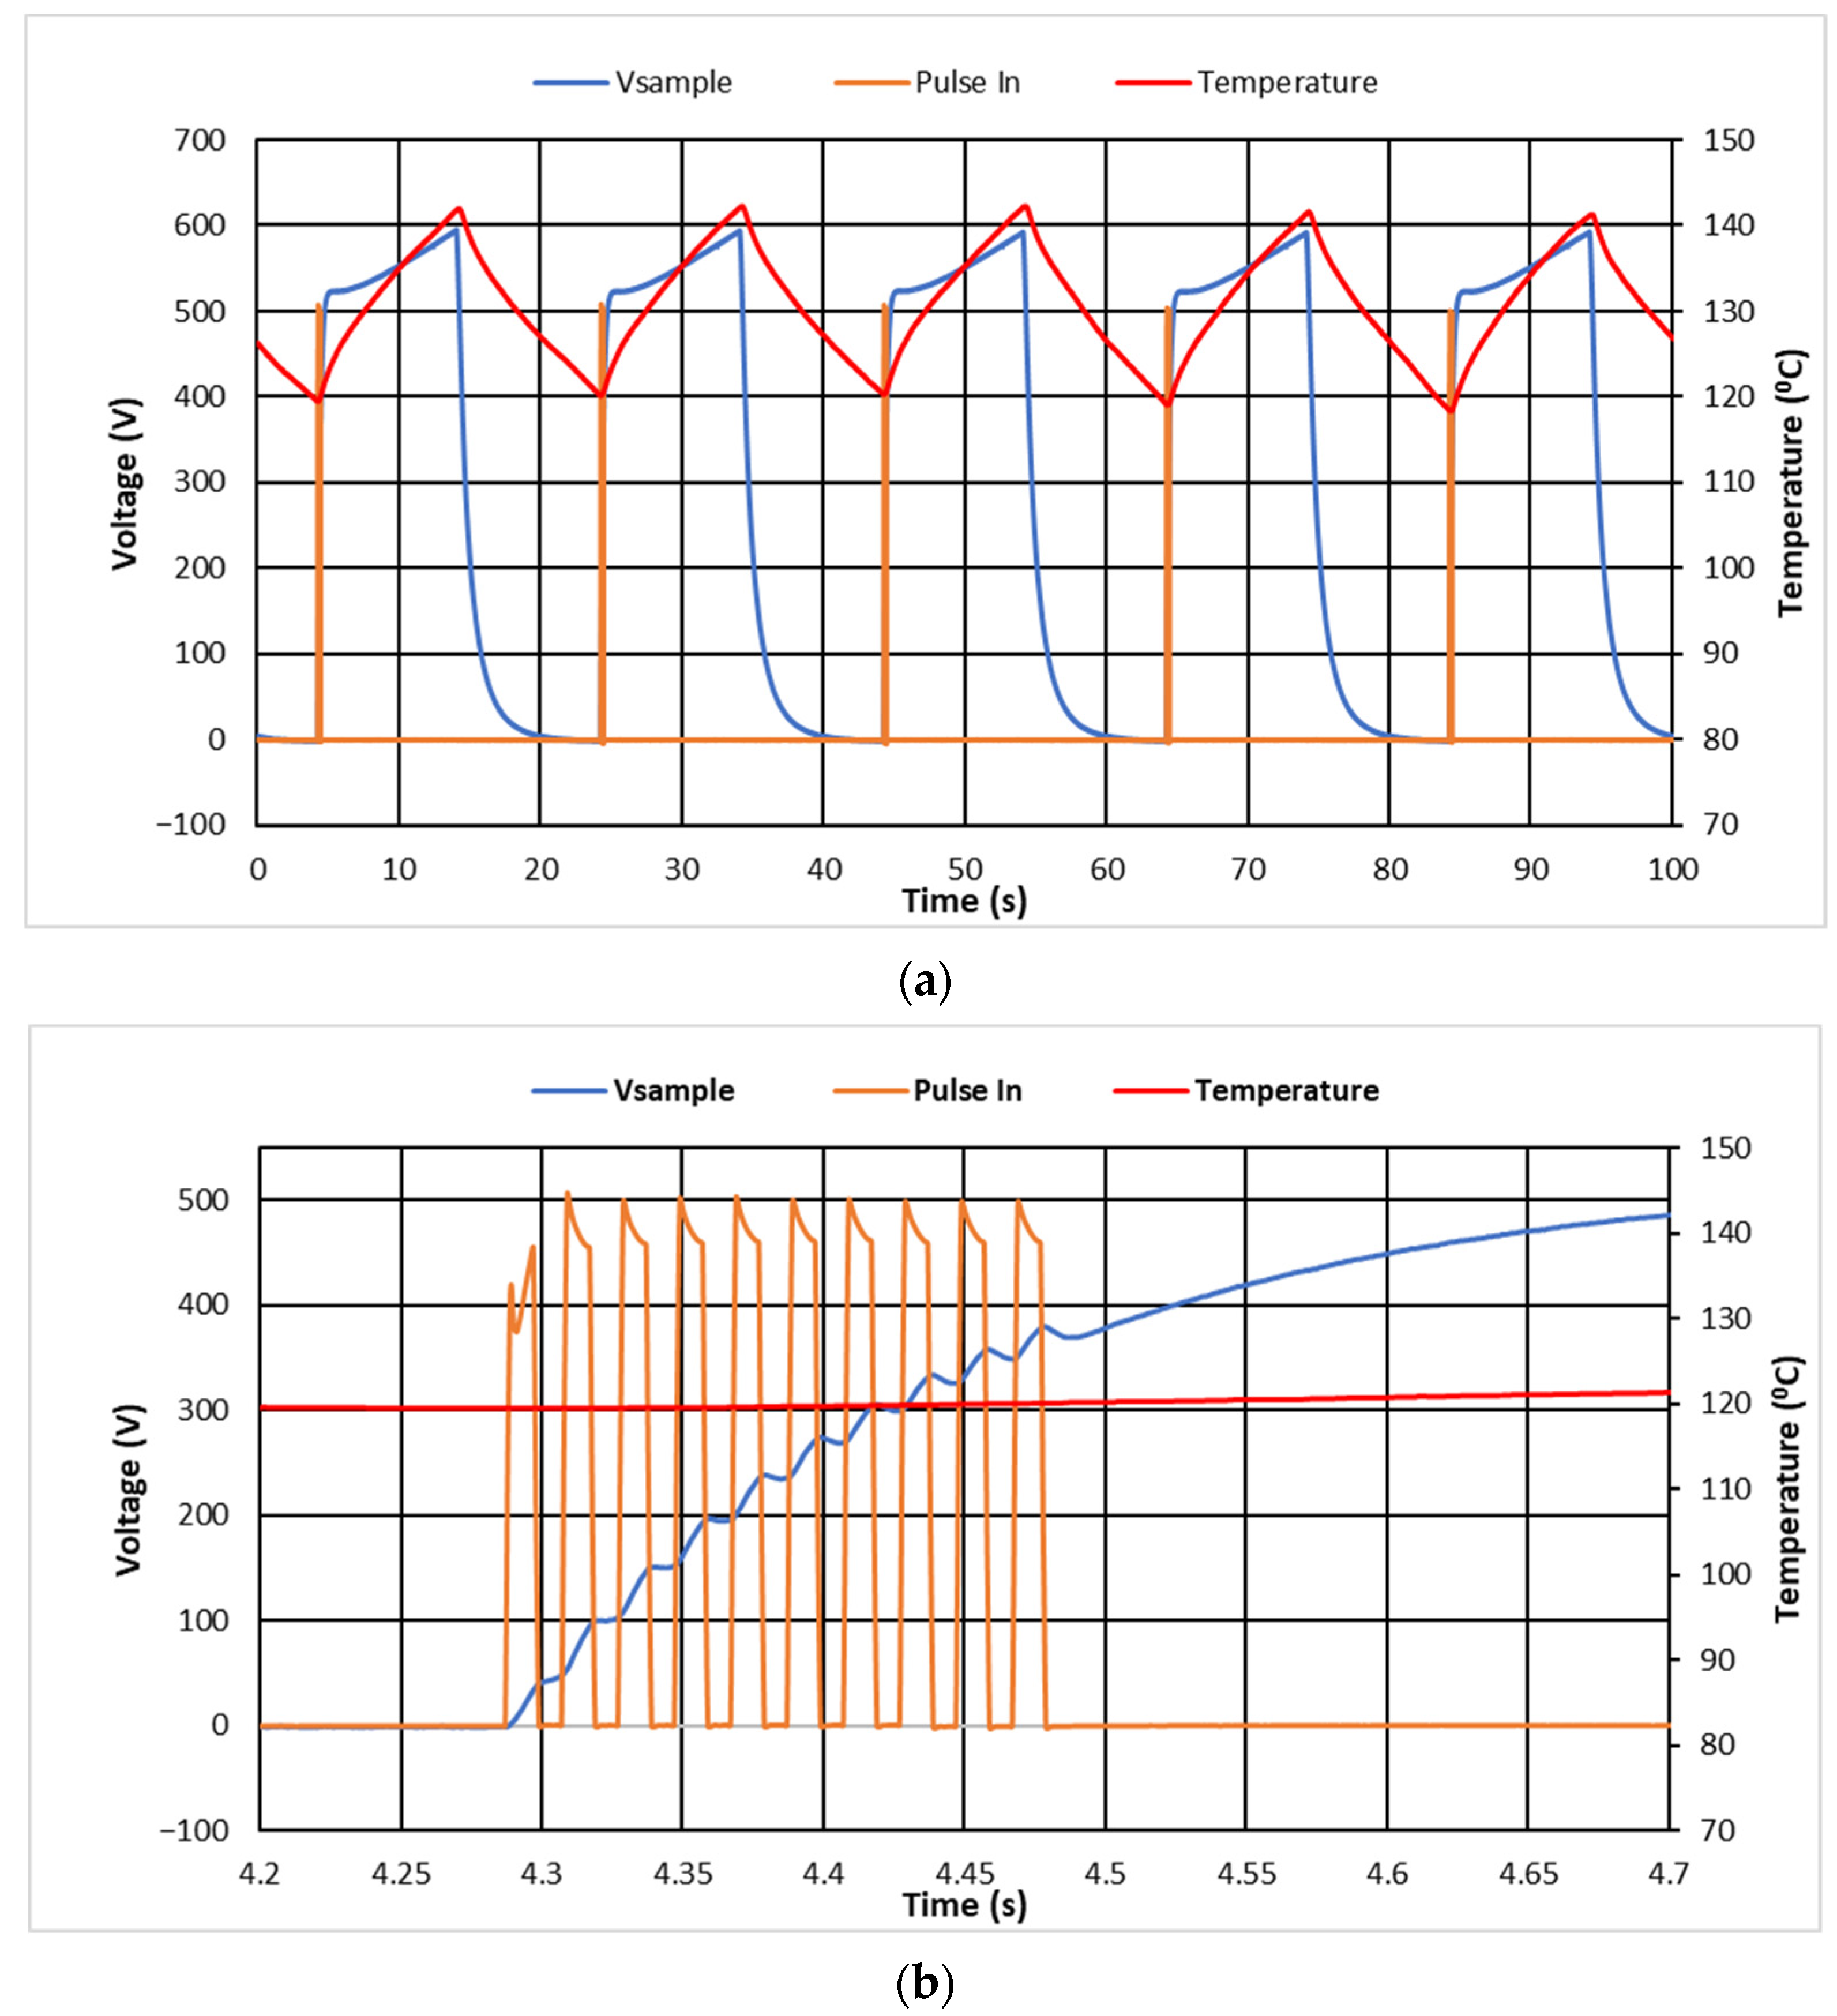
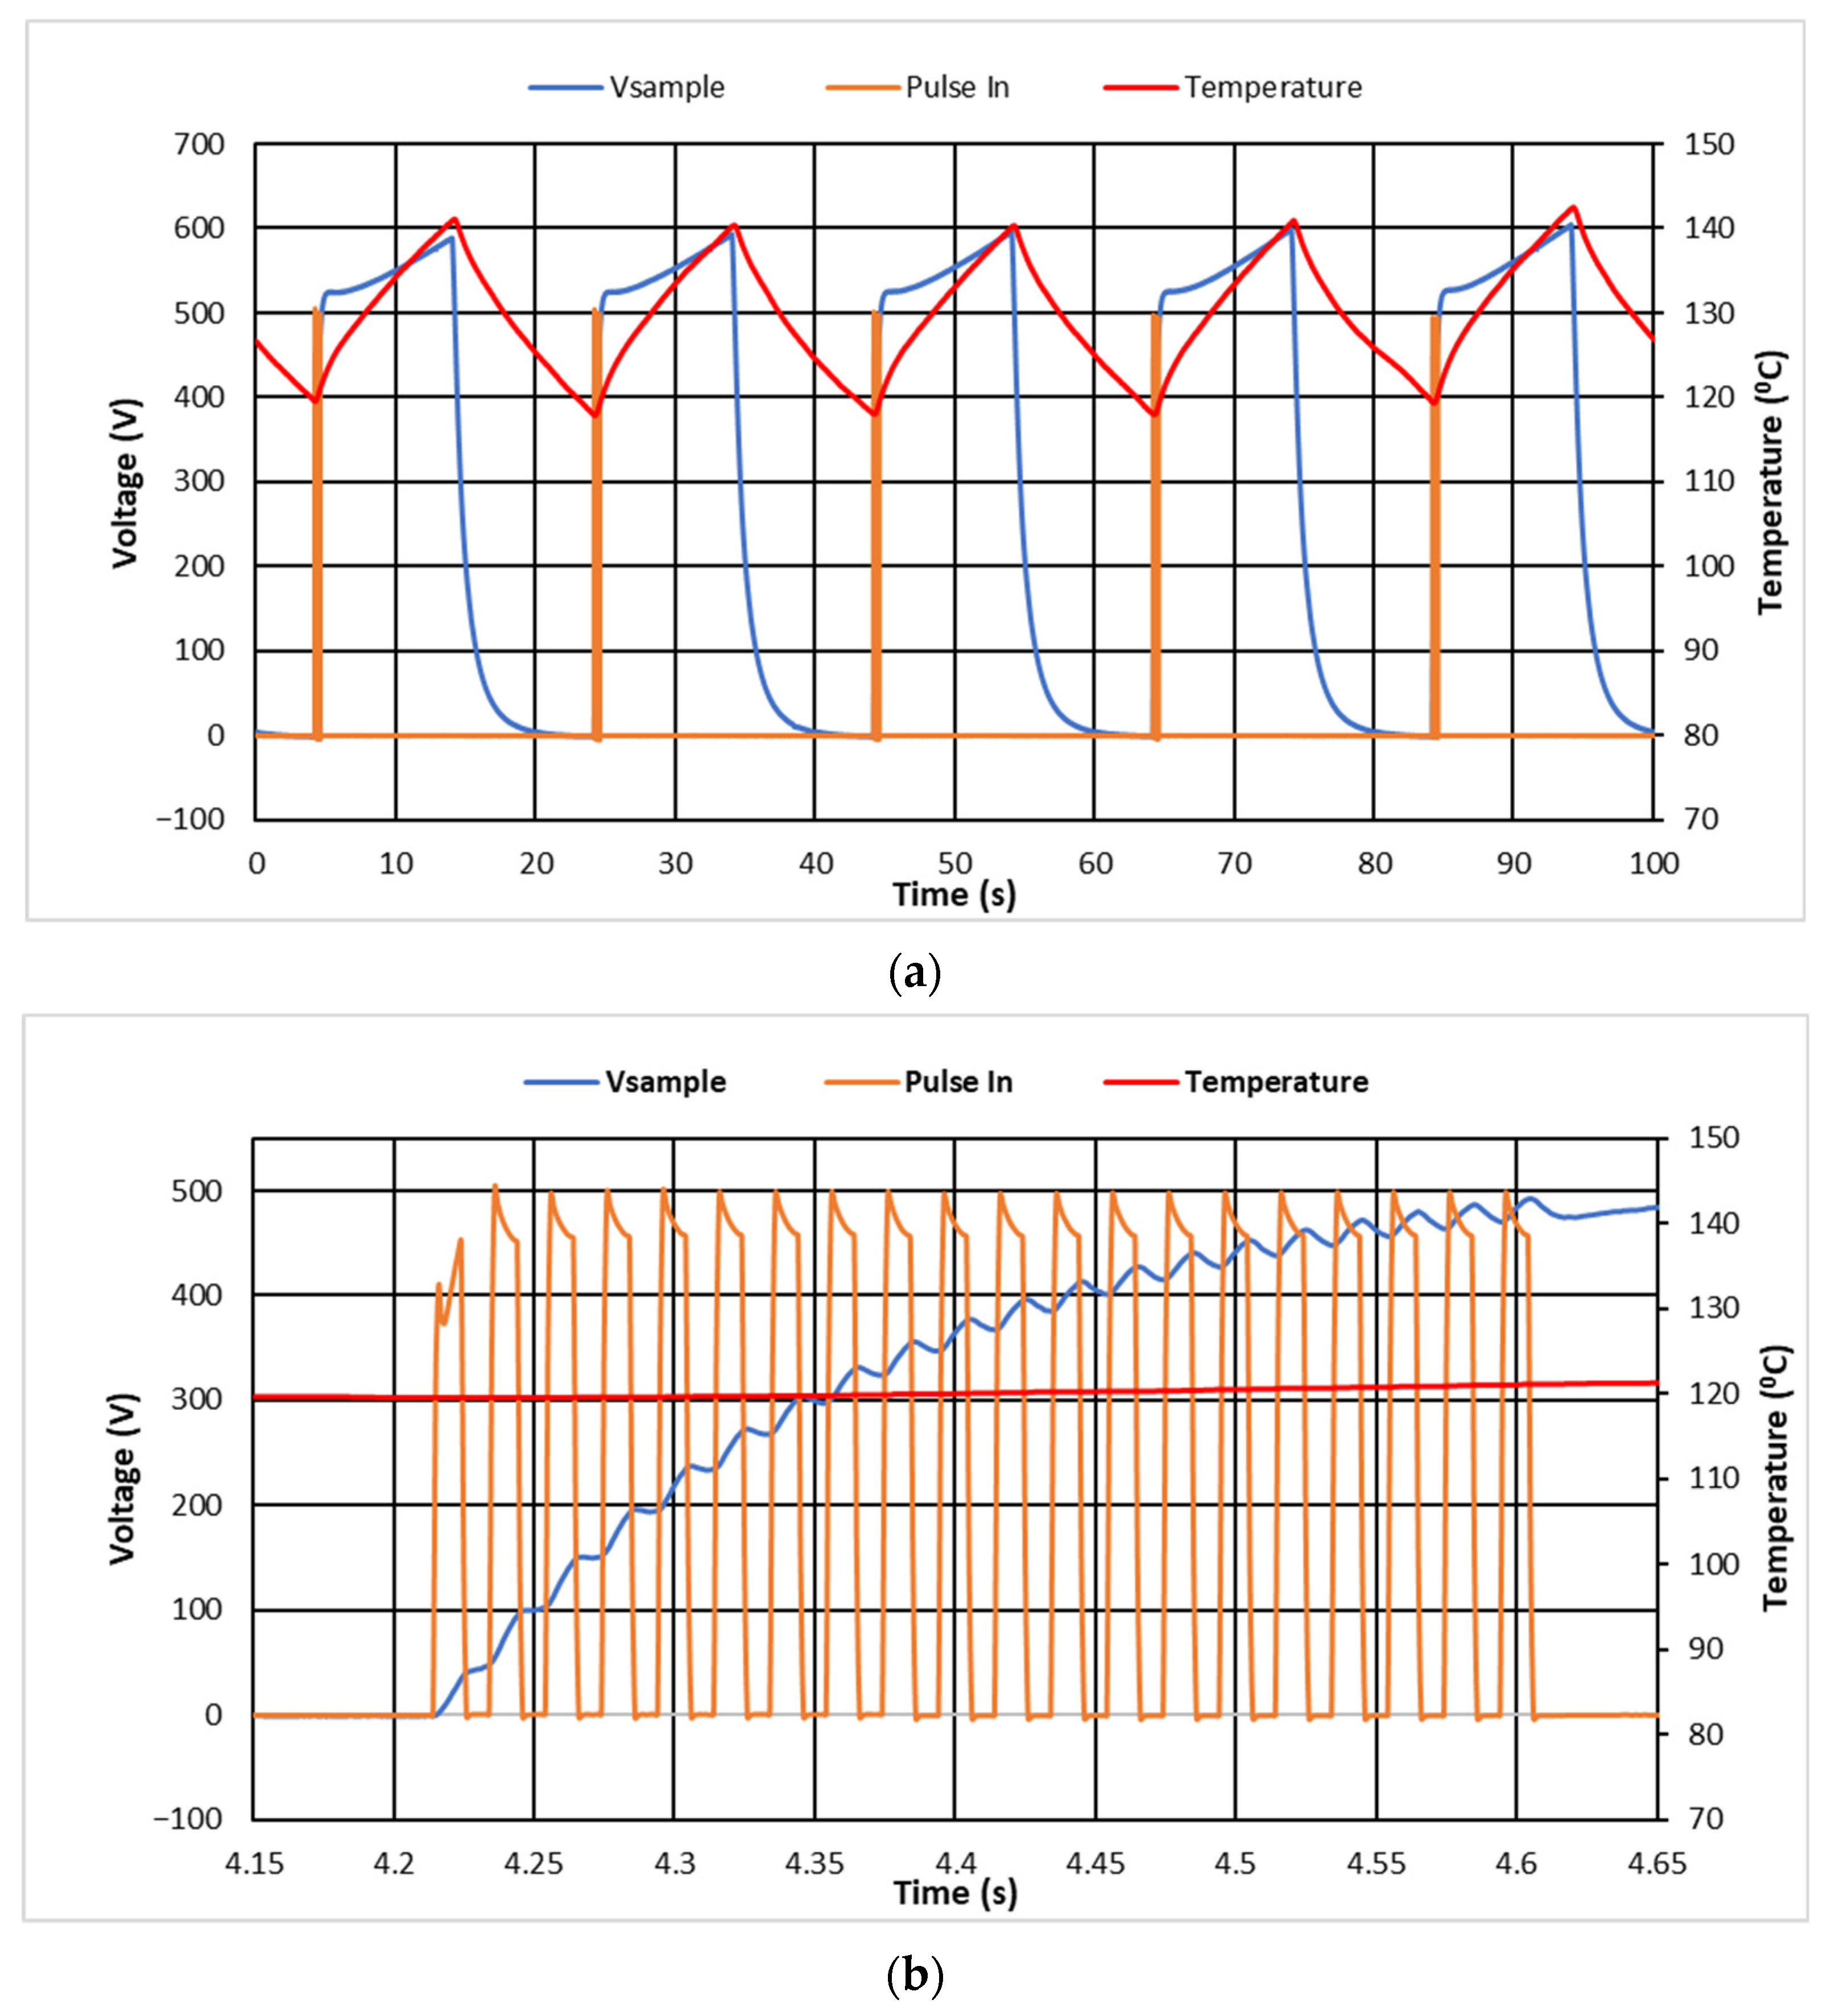
The C9 sample voltage (blue line), input pulsed electric field (orange line), and temperature variation (red line) during continuous five-cycle measurements are shown in Figure 4,Figure 5,Figure 6,Figure 7 and Figure 8a. This could be described as a pulse electric field supplied at a fixed temperature level and the initial point of the electro-thermodynamic cycle based on the fluctuations of the parameters indicated in Figure 4,Figure 5,Figure 6,Figure 7 and Figure 8b throughout a time duration of 500 ms. For one cycle, the low-level temperature (TL) was 120 °C and the temperature difference (ΔT) was 20 °C. For a 10 ms single pulse width, the average amplitude of the input pulse electric field was 503 V, as shown in Figure 4. The sample was heated to its maximum temperature after the pulsed electric field was applied. As a result of the pyroelectric effect, the average sample voltage increased to 570 V for the five thermoelectric cycles in Figure 4. Furthermore, Table 2 shows a summary of the average amplitude of the input pulse electric field and maximum sample voltage for one, two, five, ten, and twenty pulses under the 120 °C low-temperature level with a 20 °C difference.

3.3. D-E Loop Measurement

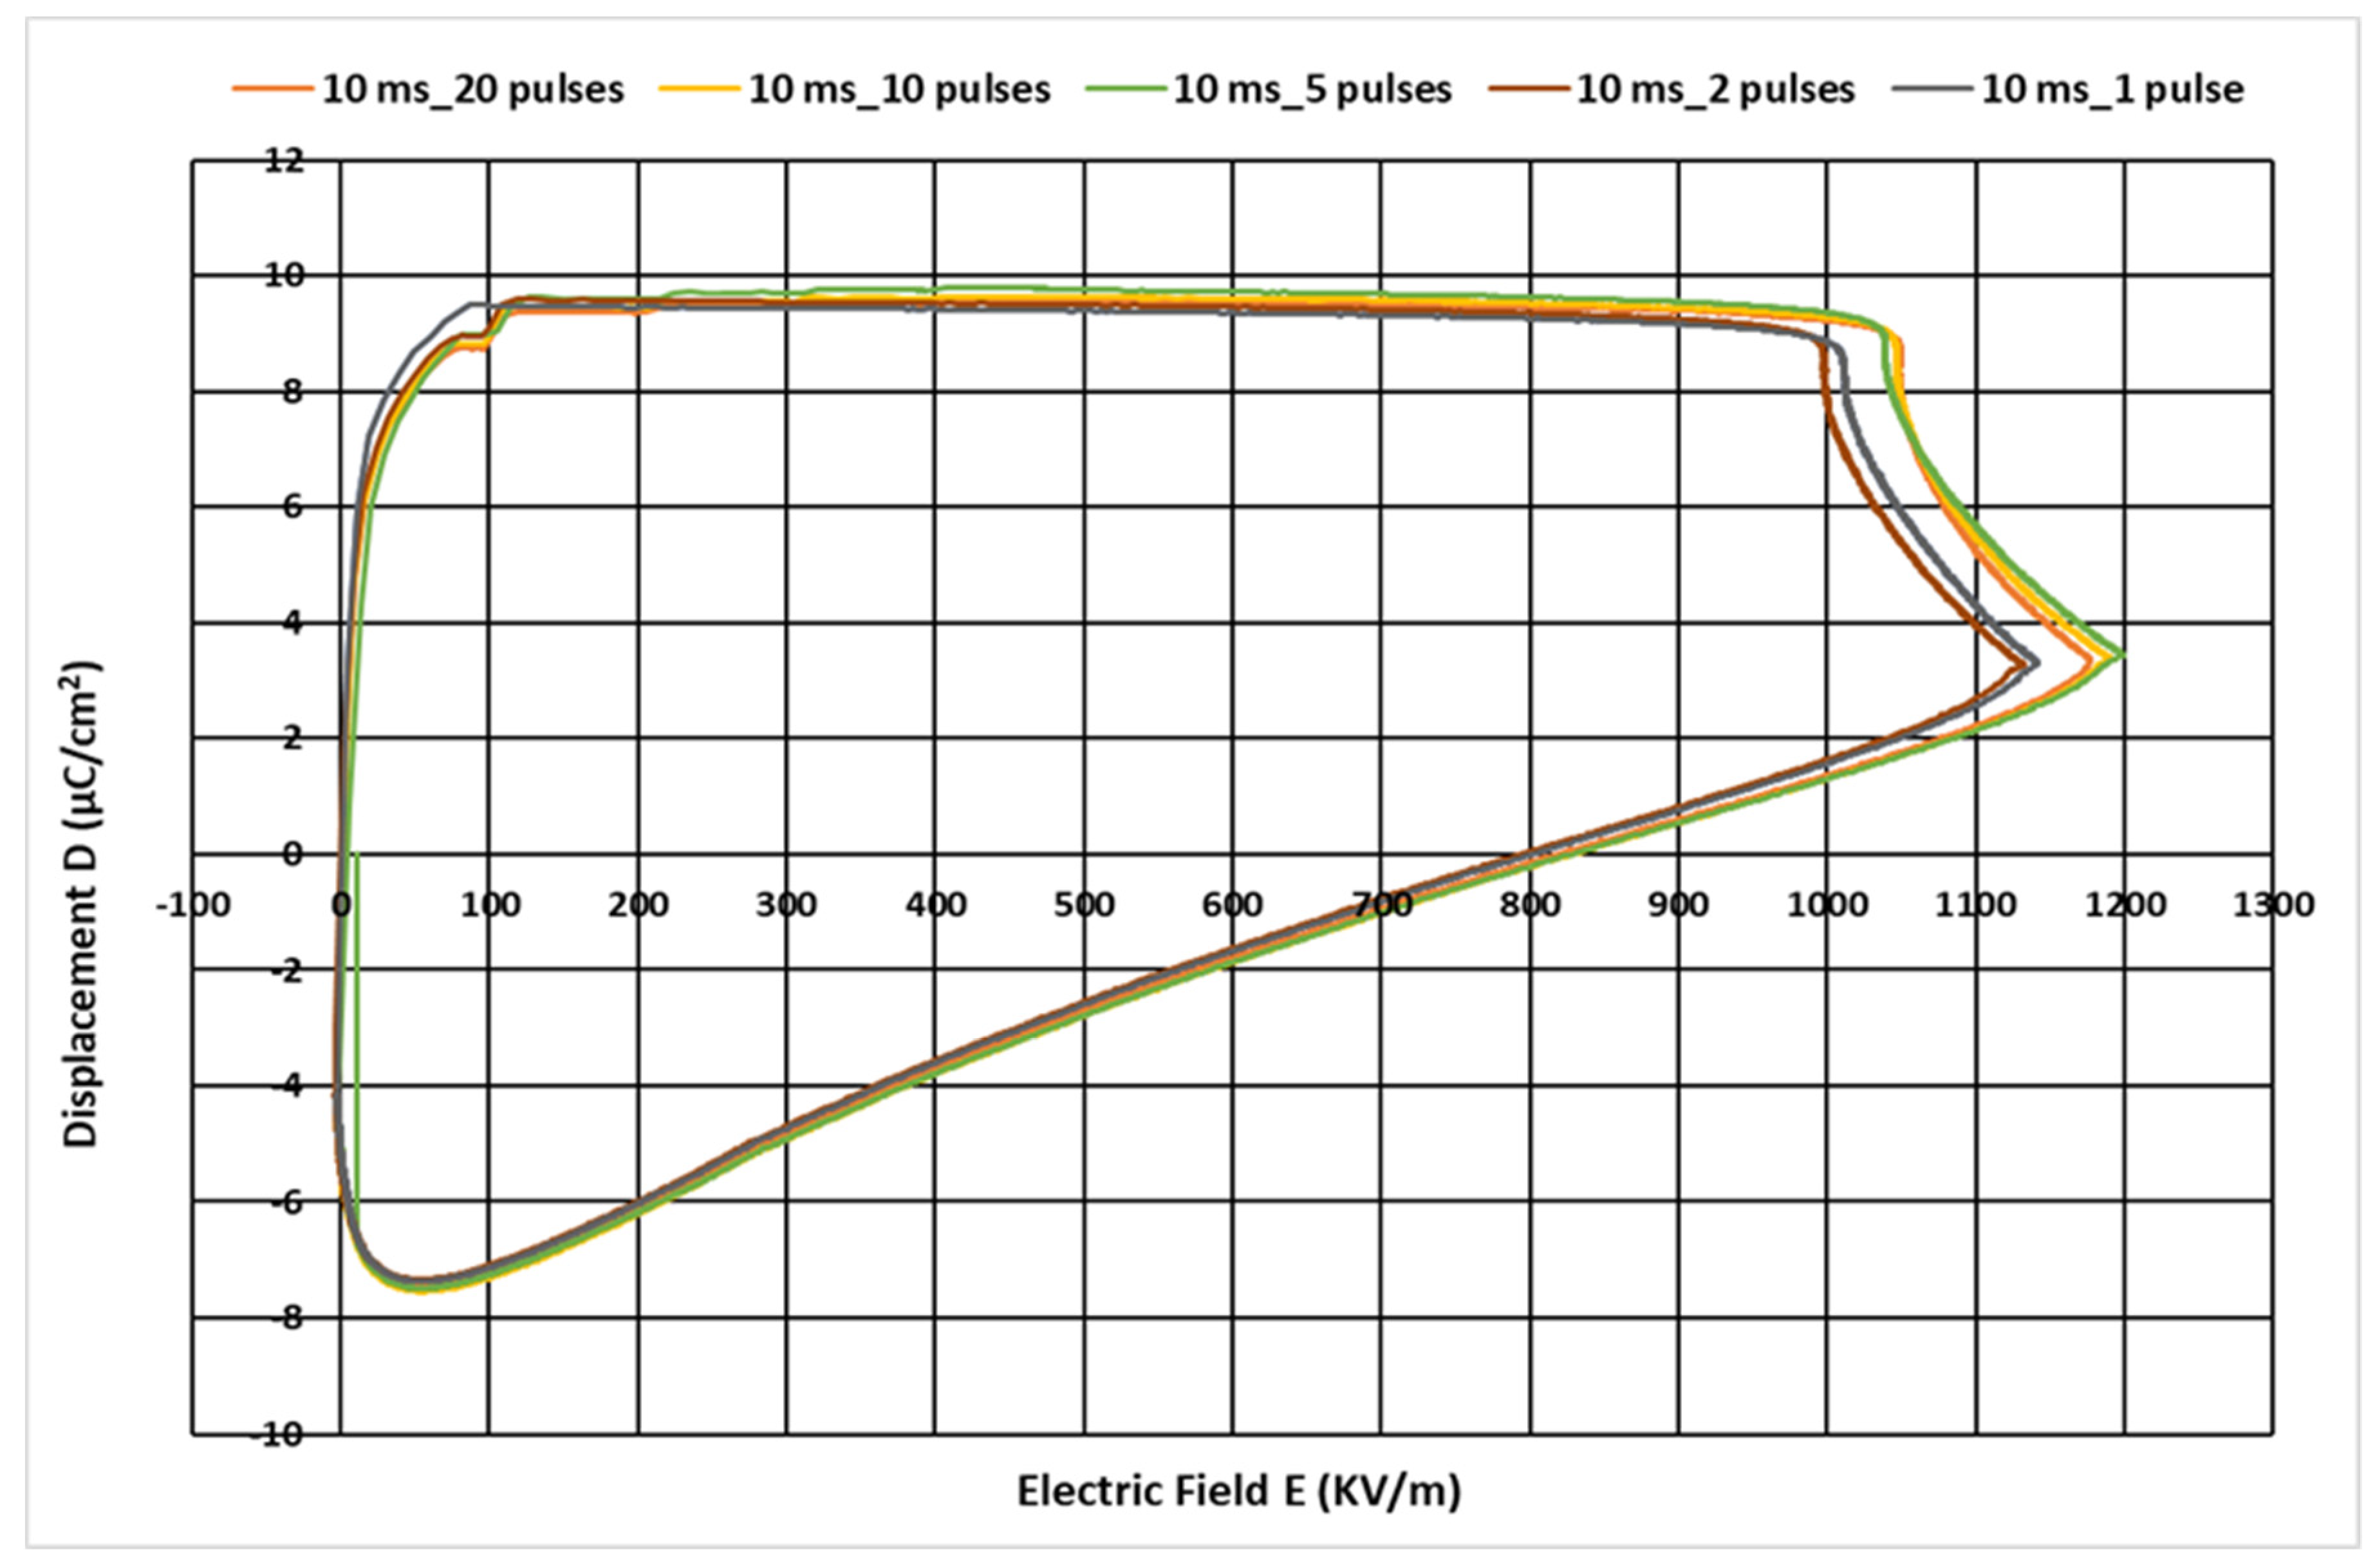
Figure 9 shows the electrical displacement of the C9 sample in relation to the electric field. The temperature of the power generation system varied from low to high (120 to 140 °C). The amplitude of the applied electric field was 1000 V/mm for each pulse (1 to 20 pulses), with a pulse width of 10 ms. Figure 9 depicts how the D-E loop area expanded as the number of pulses increased. As a result, the number of pulses in the pulse electric field increased the net generating power of the thermoelectric cycle. The number of pulses in the pulse electric field thus enhanced the net generating power of the thermoelectric cycle.

3.4. Pyroelectric Energy Generation via a Multi-Pulse Electric Field

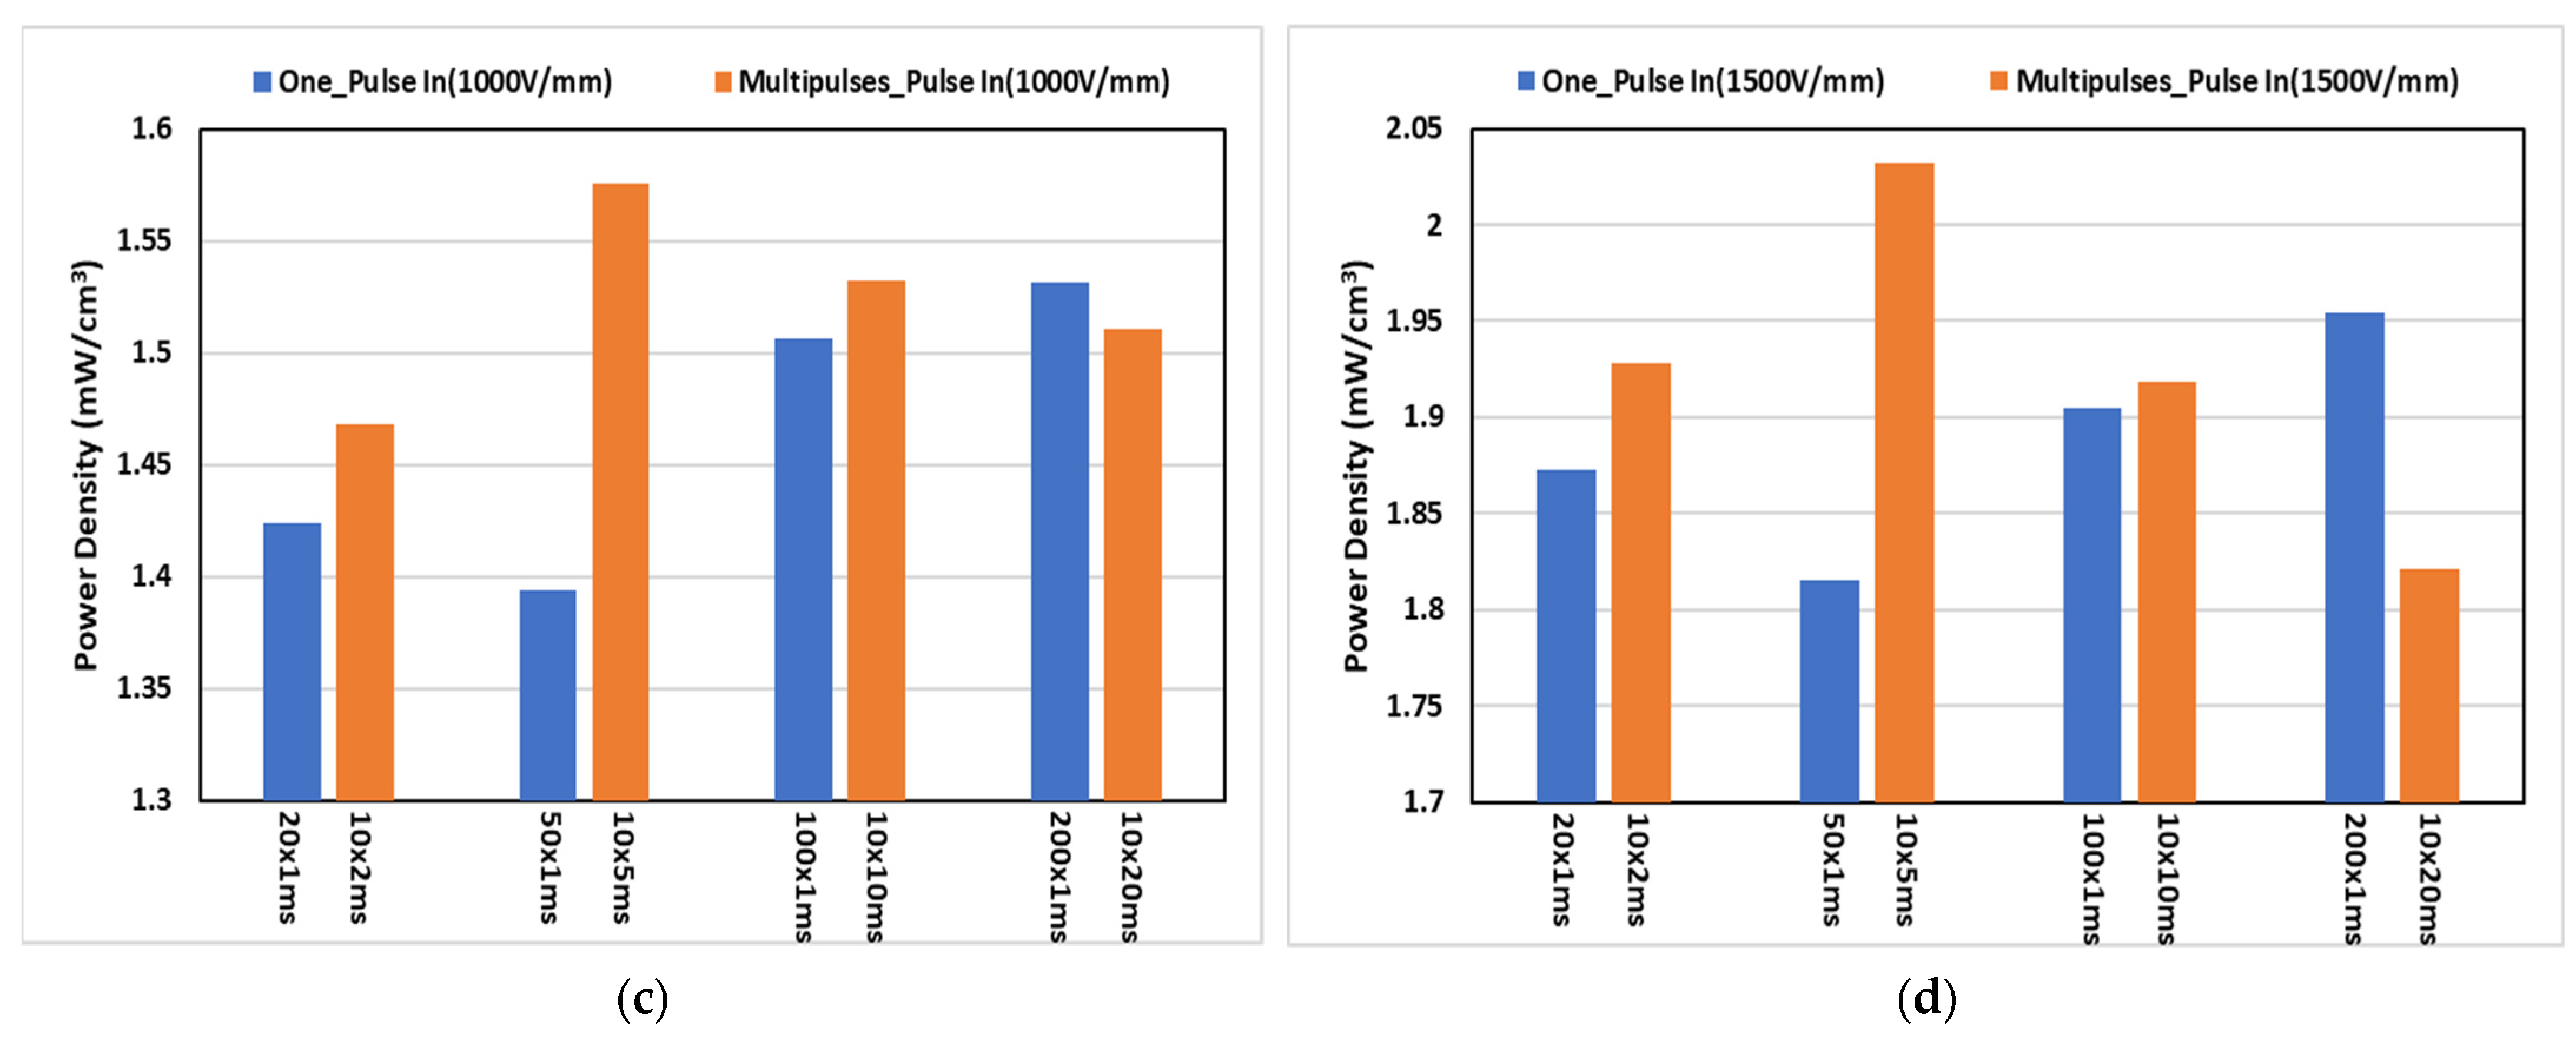
Figure 10 shows a comparison of the net generated power density for single pulses with durations of 20, 50, 100, and 200 ms and multiple 10 ms pulses with the multiplier set to equal the same field application over time (one 20 ms pulse vs. two 10 ms pulses, one 50 ms pulse vs. five 10 ms pulses, etc.). Net generated power is displayed in Figure 10a–d for pulse amplitudes of 250, 500, 1000, and 1500 V/mm, respectively. According to the graphs, the net generated power for multi-pulses was higher for low pulse widths of 10 ms and 50 ms for all input voltages. On the other hand, power generation for the 200 ms pulse width demonstrates poorer power density for the multi-pulse scheme.
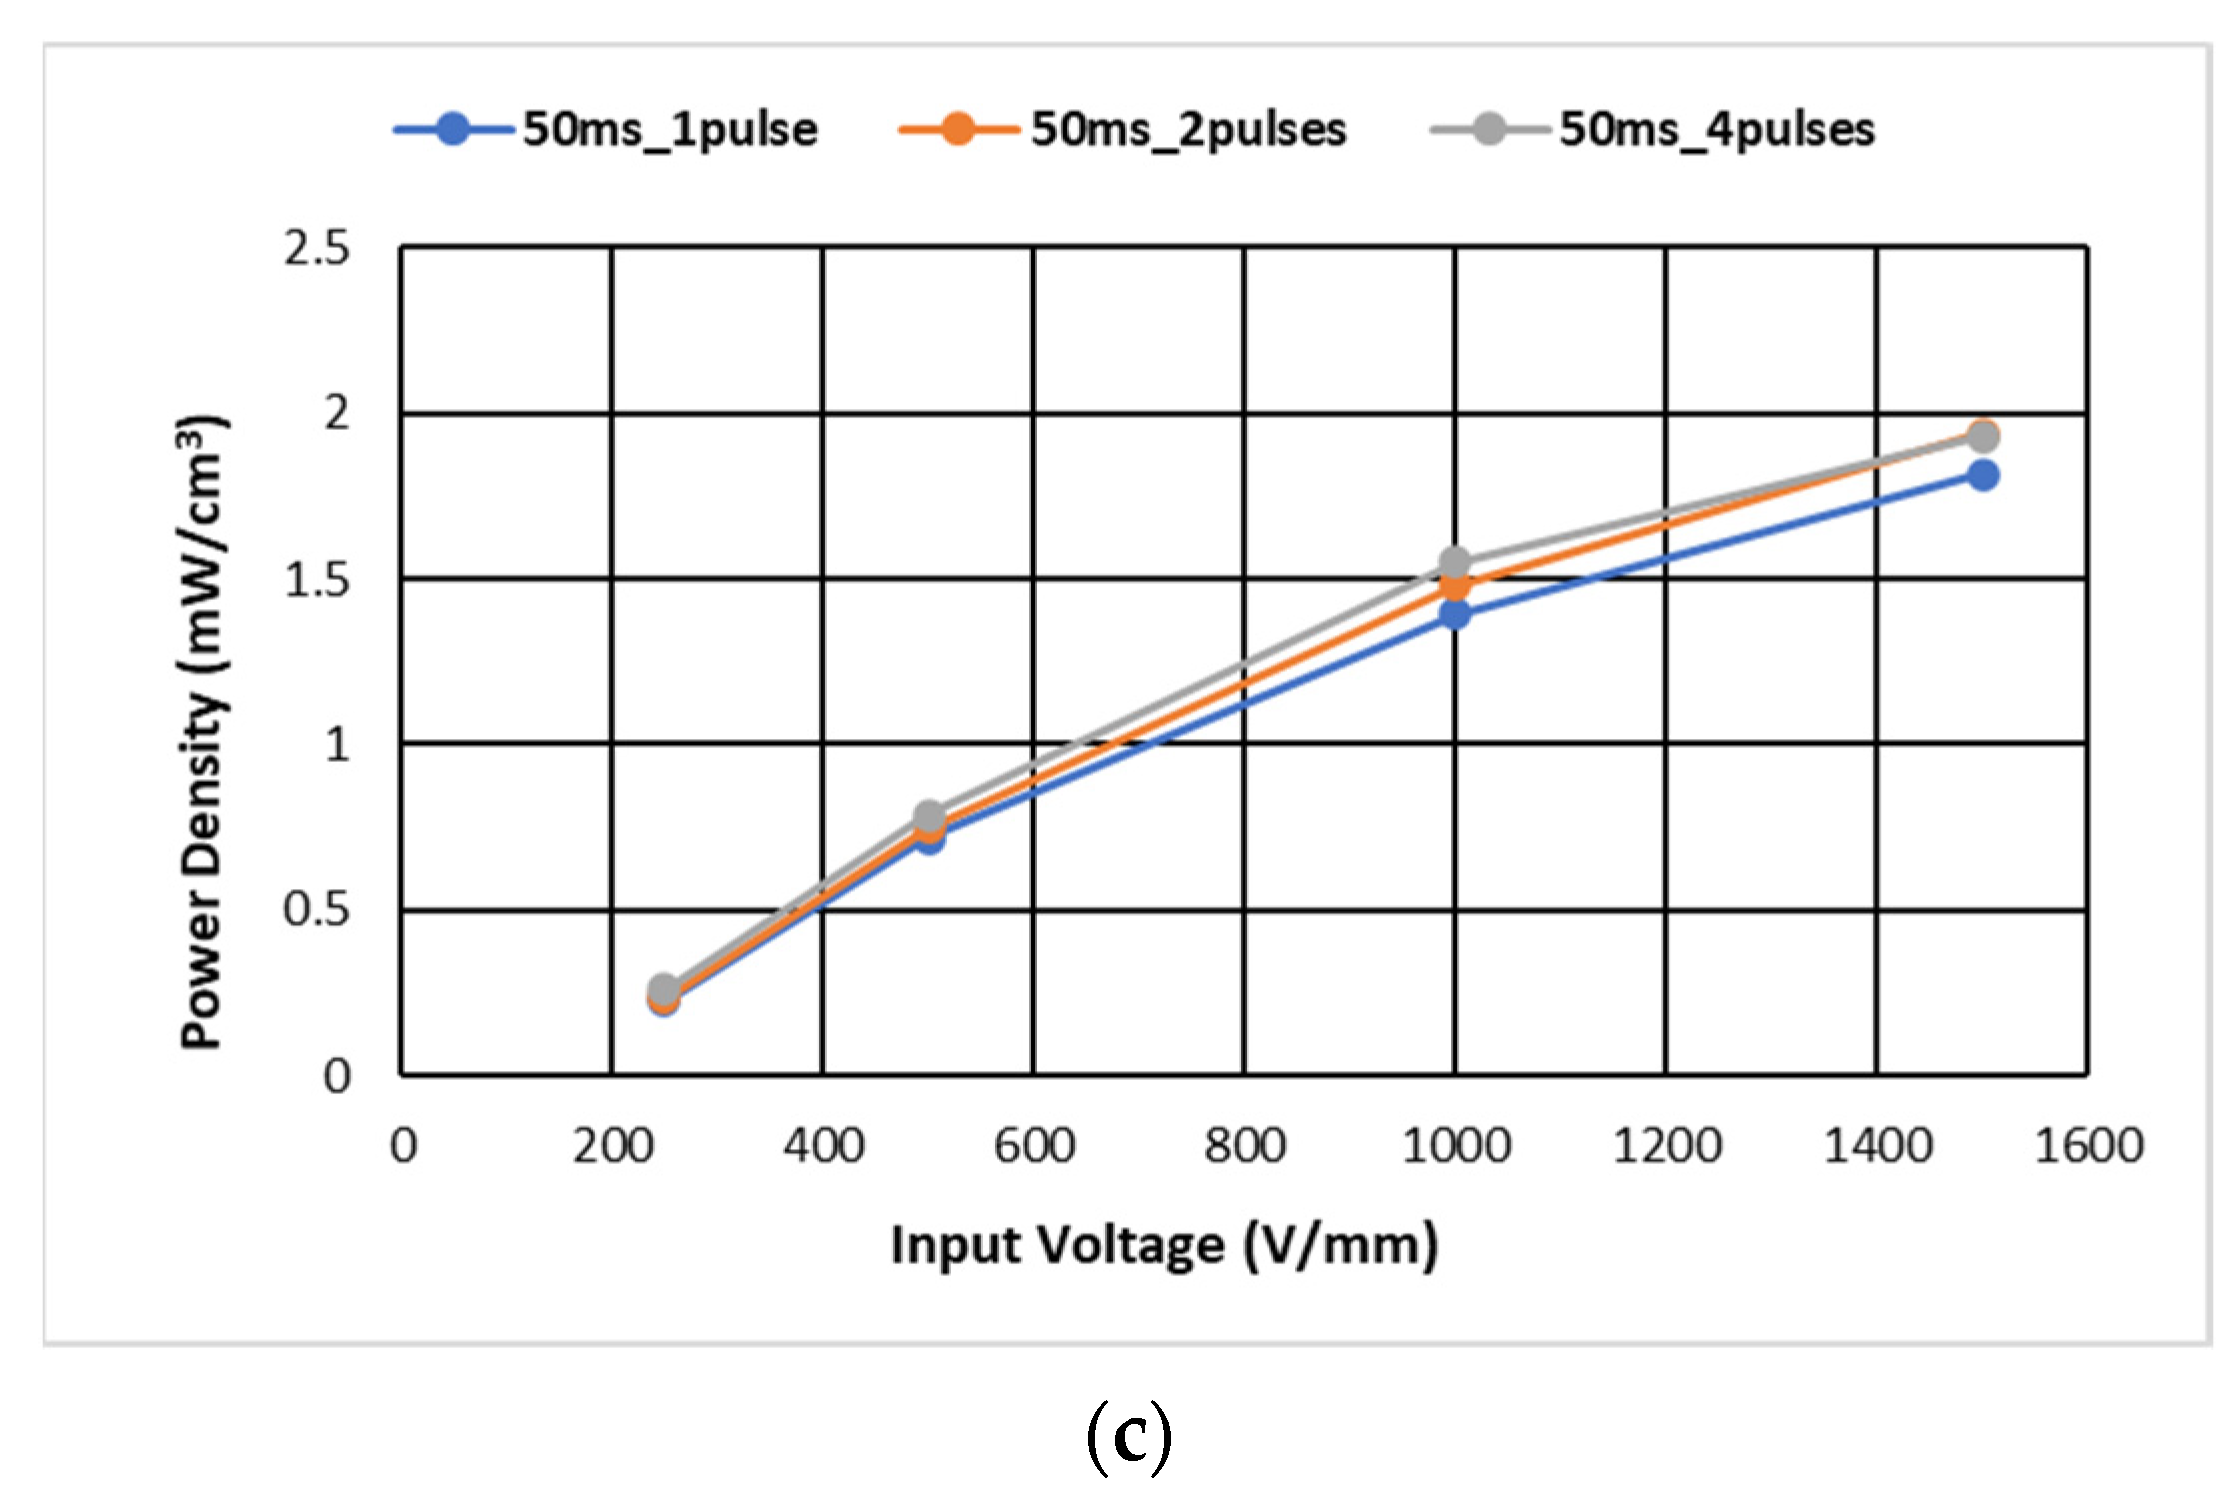
The net mean generated power density in relation to the input pulse electric fields is depicted in Figure 11a. One, two, five, ten, and twenty 10 ms pulses were employed to generate pyroelectric power with 250, 500, 1000, and 1500 V/mm pulsed electric fields. At low pulse electric field voltages, the power density generated by any given number of pulses was almost identical. The maximum and minimum power densities for twenty pulses and one pulse were 2.032 and 1.632 mWcm−3, respectively, for the higher voltage input pulse electric field (1500 V/mm). At the lowest voltage pulse input (250 V/mm), the maximum power density was 0.258 mW/cm3 for twenty pulses and the minimum power density was 0.191 mWcm−3 for one pulse. The net mean generated power densities for 20 ms and 50 ms pulses are shown in Figure 11b,c. No substantial difference in power density was exhibited as a function of the number of pulses. As demonstrated in Figure 11, the power generation rate dropped as the pulsed electric field input voltage increased.
Figure 12a,b show a comparison of power generation for 200 ms and 100 ms pulse widths in relation to the input pulse electric field at 250, 500, 1000, and 1500 V/mm. Twenty pulses with a 10 ms pulse width, ten pulses with a 20 ms pulse width, four pulses with a 50 ms pulse width, and two pulses with a 100 ms pulse width each were used to apply the 200 ms pulse width to the sample. Similarly, for a 100 ms pulse width, ten 10 ms pulses, five 20 ms pulses, two 50 ms pulses, and one 100 ms pulse were used. The power densities for twenty 10 ms pulses and one 200 ms pulse were 1.821 and 1.954 mW/cm3, respectively, for the higher voltage input pulse electric field (1500 V/mm). At the lowest pulse input (250 V/mm), the maximum power density was 0.261 mW/cm3 for twenty pulses and the minimum power density was 0.191 mW/cm3 for the one pulse, as shown in Figure 12a. According to Figure 12b, the results show no discernible changes in power density concerning the number of similar pulse widths. Additionally, as shown in Figure 12, the rate of generated power decreased as the pulsed electric field input voltage rose. The sample attained maximal polarization when the amplitude of the pulse electric field was increased. Consequently, after reaching the maximum polarization voltage level, the polarization rate was lowered. As a result, when the input voltage of the pulse electric field increased, the rate of power density produced dropped. For higher input voltages, the maximum power generation density was not attained either.

3.5. Power Generation Performance Analysis of the Pyroelectric Power Generation System under the Multi-Pulse Electric Field

Equation (4) is a representation of the ratio of the amount of power that is output to the amount of power that is entered. The “η” would be specified as a specific parameter of the capability of the power-generating system to generate power.
P o u t P i n = 1 + P n e t P i n = 1 + η ;   η = P n e t P i n
Pin—Input power (µW), Pout—Output Power (µW), Pnet—Net generating Power (µW).
When,
  • η ≤ 0: the power generation system produces no electrical power.
  • 0 < η < 1: although electricity is generated, the net generating power is less than the input power supplied to the power generation system.
  • η ≤ 0: the power generation system produces no electrical power.
  • η = 1: the amount of input power equals the amount of net generated power.
  • η > 1: the net amount of power generated is greater than the amount of power that was input.
Figure 13 depicts the power generating capabilities (η) of the power generation system in relation to the input multi-pulse electric field. To generate pyroelectric power, one, two, five, ten, and twenty pulses lasting 10 ms each were delivered at the pulses electric field amplitudes of 250, 500, 1000, and 1500 V/mm, respectively. The greatest η figure for a 250 V/mm pulse electric field at twenty 10 ms pulses was 7.834. It was discovered that the η value 7.458 was the second highest at ten 10 ms pulses for 250 V/mm. According to this graph, the η ratio is higher for an input-pulsed electric field with lower voltages (250, 500 V/mm) and a higher number of pulses. The value of η stays relatively constant regardless of the number of pulses when the electric fields are at higher voltage levels.
Figure 14a,b show the η values for 20 ms and 50 ms pulses, respectively. These graphs show that the η ratio is greater for a lower voltage (250 and 500 V/mm) input pulsed electric field. The highest η values were 6.829 and 6.582 for ten 20 ms pulses and four 50 ms pulses, respectively, at 250 V/mm. When the electric fields are at higher voltage levels, the value of η decreases as the pulsed electric field input voltage rises.

4. Conclusions

The power generation density was at its greatest when the highest number of pulses of the low voltage (250 V/mm) input multi-pulse electric field was applied to the sample. The net generated power density under the high-voltage pulse electric field did not vary significantly with the number of pulses. The maximum pyroelectric energy generation with a C9 PZT sample was achieved in the current work by employing a multi-pulse electric field. This occurred at a temperature difference of 20 °C, the lowest ever recorded for this feat, and all measurements were taken on a sample with a lower limit of TL = 120 °C. Moreover, with the lower-voltage pulse electric field, a power density of 0.104 mJ/cm2°CkV was achieved for a pulse width of 10 ms with 20 pulses. In addition, each of the findings demonstrated that the power generation rate declined as the pulsed electric field input voltage increased. This study computed the “η” parameter to analyze the input parameters of the multi-pulse electric field and how they influence output power generation. At the largest number of pulses, the greatest η value for a 250 V/mm pulse electric field was 7.834. According to the findings, the “η” ratio improves when increasing the pulse count in a pulsed electric field with low input voltage (250 and 500 V/mm). Additionally, it was concluded that applying a low-voltage, multi-pulse electric field to the developed pyroelectric power generation system may improve its efficiency. Consequently, by applying low voltages with a larger number of pulses to the sample, the greatest power generation efficiency would be attained under a 20 °C temperature fluctuation with a lower level of 120 °C and a 0.05 Hz frequency. This is because the sample has maximal polarization at a low voltage level with a higher number of pulses. In particular, the switching control unit of the power generation system must be maintained according to the processes of the thermoelectric cycle to achieve higher efficiency.
In the future, this type of power generation system can be applied to the study of how the quantity of power generated varies with nanosecond (ns) and microsecond (µs) pulse widths of an external multi-pulse electric field. It is possible to raise the voltage of the external electric field when a nano-pulse electric field is applied to a sample without causing dielectric breakdown. As a result, there is a chance that the net power generation may increase. In addition, the net produced power will be at its lowest when the nano-pulse electric field is applied to the sample. At the lowest input power condition, the net generation power efficiency can be utilized as a new research tool. By arranging multiple arrays of pyroelectric materials, it would be possible to create a large-scale power generation source.

Author Contributions

Conceptualization, B.A.K.S., K.N. and T.N.; Methodology, B.A.K.S., M.B. and T.N.; Validation, B.A.K.S., H.F., N.C.T.N., H.S. and M.B.; Formal analysis, H.F., N.C.T.N., H.S. and M.B.; Investigation, B.A.K.S.; Resources, K.N. and T.N.; Writing—original draft, B.A.K.S.; Writing—review & editing, B.A.K.S. and T.N.; Supervision, M.B. and T.N.; Project administration, K.N. and T.N. All authors have read and agreed to the published version of the manuscript.

Funding

This research received no external funding.

Data Availability Statement

The data presented in this study are available on request from the corresponding author.

Conflicts of Interest

The authors declare no conflict of interest.

References

  1. Pawar, O.Y.; Patil, S.L.; Redekar, R.S.; Patil, S.B.; Lim, S.; Tarwal, N.L. Strategic Development of Piezoelectric Nanogenerator and Biomedical Applications. Appl. Sci. 2023, 13, 2891. [Google Scholar] [CrossRef]
  2. Li, T.; Lee, P.S. Piezoelectric Energy Harvesting Technology: From Materials, Structures, to Applications. Small Struct. 2022, 3, 2100128. [Google Scholar] [CrossRef]
  3. Xu, Q.; Wen, J.; Qin, Y. Development and Outlook of High Output Piezoelectric Nanogenerators. Nano Energy 2021, 86, 106080. [Google Scholar] [CrossRef]
  4. Liang, X.; Liu, S.; Yang, H.; Jiang, T. Triboelectric Nanogenerators for Ocean Wave Energy Harvesting: Unit Integration and Network Construction. Electronics 2023, 12, 225. [Google Scholar] [CrossRef]
  5. Haroun, A.; Tarek, M.; Mosleh, M.; Ismail, F. Recent Progress on Triboelectric Nanogenerators for Vibration Energy Harvesting and Vibration Sensing. Nanomaterials 2022, 12, 2960. [Google Scholar] [CrossRef]
  6. Korkmaz, S.; Kariper, İ.A. Production and Applications of Flexible/Wearable Triboelectric Nanogenerator (TENGS). Synth. Met. 2021, 273, 116692. [Google Scholar] [CrossRef]
  7. Ren, Z.; Wu, L.; Zhang, J.; Wang, Y.; Wang, Y.; Li, Q.; Wang, F.; Liang, X.; Yang, R. Trapezoidal Cantilever-Structure Triboelectric Nanogenerator Integrated with a Power Management Module for Low-Frequency Vibration Energy Harvesting. ACS Appl. Mater. Interfaces 2022, 14, 5497–5505. [Google Scholar] [CrossRef]
  8. Korkmaz, S.; Kariper, İ.A. Pyroelectric Nanogenerators (PyNGs) in Converting Thermal Energy into Electrical Energy: Fundamentals and Current Status. Nano Energy 2021, 84, 105888. [Google Scholar] [CrossRef]
  9. Thakre, A.; Kumar, A.; Song, H.-C.; Jeong, D.-Y.; Ryu, J. Pyroelectric Energy Conversion and Its Applications—Flexible Energy Harvesters and Sensors. Sensors 2019, 19, 2170. [Google Scholar] [CrossRef]
  10. Hsiao, C.-C.; Jhang, J.-W. Pyroelectric Harvesters for Generating Cyclic Energy. Energies 2015, 8, 3489–3502. [Google Scholar] [CrossRef]
  11. Zhang, K.; Wang, Y.; Wang, Z.L.; Yang, Y. Standard and Figure-of-Merit for Quantifying the Performance of Pyroelectric Nanogenerators. Nano Energy 2019, 55, 534–540. [Google Scholar] [CrossRef]
  12. Siao, A.-S.; Hsiao, C.-C.; Chao, C.-K. Investigation and Evaluation of Pyroelectric Materials for Thermal Energy Harvesting. Phys. Status Solidi A 2019, 217, 1900716. [Google Scholar] [CrossRef]
  13. Olsen, R.B.; Bruno, D.A.; Briscoe, J.M. Pyroelectric Conversion Cycles. J. Appl. Phys. 1985, 58, 4709–4716. [Google Scholar] [CrossRef]
  14. Lee, F.Y.; Jo, H.R.; Lynch, C.S.; Pilon, L. Pyroelectric Energy Conversion Using PLZT Ceramics and the Ferroelectric–Ergodic Relaxor Phase Transition. Smart Mater. Struct. 2013, 22, 025038. [Google Scholar] [CrossRef] [Green Version]
  15. Kim, J.; Moro, T.; Kim, J.; Yamanaka, S.; Murayama, I.; Katou, T.; Nakayama, T.; Takeda, M.; Yamada, N.; Nishihata, Y.; et al. Temperature Stability of PIN-PMN-PT Ternary Ceramics during Pyroelectric Power Generation. J. Alloys Compd. 2018, 768, 22–27. [Google Scholar] [CrossRef]
  16. Sugiyama, H.; Kim, J.; Yamanaka, S.; Kim, Y.; Ngo, N.C.T.; Wiff, J.P.; Suzuki, T.; Baba, M.; Takeda, M.; Yamada, N.; et al. Pyroelectric Power Generation in PLZST Material by Temperature Dependent Phase Transformation. Ceram. Int. 2022, 48, 8689–8695. [Google Scholar] [CrossRef]
  17. Olsen, R.B.; Brown, D.D. High Efficieincy Direct Conversion of Heat to Electrical Energy-Related Pyroelectric Measurements. Ferroelectrics 1982, 40, 17–27. [Google Scholar] [CrossRef]
  18. Olsen, R.B.; Briscoe, J.M.; Bruno, D.A.; Butler, W.F. A Pyroelectric Energy Converter Which Employs Regeneration. Ferroelectrics 1981, 38, 975–978. [Google Scholar] [CrossRef]
  19. Clingman, W.H.; Moore, R.G. Application of Ferroelectricity to Energy Conversion Processes. J. Appl. Phys. 1961, 32, 675–681. [Google Scholar] [CrossRef]
  20. Childress, J.D. Application of a Ferroelectric Material in an Energy Conversion Device. J. Appl. Phys. 1962, 33, 1793–1798. [Google Scholar] [CrossRef]
  21. Hoh, S.R. Conversion of Thermal to Electrical Energy with Ferroelectric Materials. Proc. IEEE 1963, 51, 838–845. [Google Scholar] [CrossRef]
  22. Baba, M.; Ejima, M.; Murayama, I.; Fukuda, T.; Tanaka, H.; Sekino, T.; Kim, Y.; Yamada, N.; Takeda, M. Predicting Performance of Thermal-Electrical Cycles in Pyroelectric Power Generation. JPN J. Appl. Phys. 2020, 59, 094501. [Google Scholar] [CrossRef]
  23. Ngo, N.C.T.; Sugiyama, H.; Sodige, B.A.K.; Wiff, J.P.; Yamanaka, S.; Kim, Y.; Suzuki, T.; Baba, M.; Takeda, M.; Yamada, N.; et al. Sensitivity and Effectivity of Kim’s Novel Electro-Thermodynamic Cycle over Olsen Cycle on Waste Heat Recovering with High Fluctuating Temperature Source Using Lead-Free Pyroelectric Ba(Zr0.1Ti0.9)O3. AIP Adv. 2021, 11, 125310. [Google Scholar] [CrossRef]
  24. Meyer, V.; Sallese, J.-M.; Fazan, P.; Bard, D.; Pecheux, F. Modeling the Polarization in Ferroelectric Materials: A Novel Analytical Approach. Solid-State Electron. 2003, 47, 1479–1486. [Google Scholar] [CrossRef]
  25. Dawber, M.; Rabe, K.M.; Scott, J.F. Physics of Thin-Film Ferroelectric Oxides. Rev. Mod. Phys. 2005, 77, 1083–1130. [Google Scholar] [CrossRef]
  26. Wu, X.; Liu, L.; Li, X.; Zhao, X.; Lin, D.; Luo, H.; Huang, Y. The Influence of Defects on Ferroelectric and Pyroelectric Properties of Pb(Mg1/3Nb2/3)O3–0.28PbTiO3 Single Crystals. Mater. Chem. Phys. 2012, 132, 87–90. [Google Scholar] [CrossRef]
  27. Bowen, C.R.; Taylor, J.; LeBoulbar, E.; Zabek, D.; Chauhan, A.; Vaish, R. Pyroelectric Materials and Devices for Energy Harvesting Applications. Energy Environ. Sci. 2014, 7, 3836–3856. [Google Scholar] [CrossRef]
  28. Bei, B.-K.; Wang, H.-G.; Zhang, Z.-X. Two-Dimensional Crystallization in Finite-Sized Colloidal Systems. Acta Phys. Sin. 2019, 68, 106401. [Google Scholar] [CrossRef]
  29. Kim, Y.; Kim, J.; Yamanaka, S.; Nakajima, A.; Ogawa, T.; Serizawa, T.; Tanaka, H.; Baba, M.; Fukuda, T.; Yoshii, K.; et al. Novel Electrothermodynamic Power Generation. Adv. Energy Mater. 2015, 5, 1401942. [Google Scholar] [CrossRef]
  30. Sugiyama, H.; Kim, J.; Yamanaka, S.; Kim, Y.; Ngo, N.C.T.; Wiff, J.P.; Suzuki, T.; Baba, M.; Takeda, M.; Yamada, N.; et al. Examination of Pyroelectric Power Generation over a Wide Temperature Range by Controlling the Zr:Sn Composition Ratio of PLZST. J. Asian Ceram. Soc. 2021, 10, 99–107. [Google Scholar] [CrossRef]
  31. Ngo, N.C.T.; Sugiyama, H.; Sodige, B.A.K.; Wiff, J.P.; Yamanaka, S.; Kim, Y.; Suzuki, T.; Baba, M.; Takeda, M.; Yamada, N.; et al. Enhancing Low-temperature Energy Harvesting by Lead-free Ferroelectric Ba(Zr 0.1 Ti 0.9 )O 3. J. Am. Ceram. Soc. 2022, 106, 201–212. [Google Scholar] [CrossRef]
  32. Kim, J.; Yamanaka, S.; Nakajima, A.; Katou, T.; Kim, J.; Kim, Y.; Fukuda, T.; Yoshii, K.; Nishihata, Y.; Baba, M.; et al. Electrical and Crystallographic Study of an Electrothermodynamic Cycle for a Waste Heat Recovery. Adv. Sustain. Syst. 2018, 2, 1800067. [Google Scholar] [CrossRef]
  33. Ngo, N.C.T.; Sugiyama, H.; Sodige, B.A.K.; Wiff, J.P.; Furuno, H.; Yamanaka, S.; Kim, Y.; Suzuki, T.; Baba, M.; Takeda, M.; et al. Enhancing Low-Grade Waste Heat Recovery by Lead-Free Ferroelectric Ba(Zr0.1Ti0.9)O3 with Sr and Ca Isovalent Dopants. Ceram. Int. 2023, 49, 16290–16296. [Google Scholar] [CrossRef]
  34. He, H.; Lu, X.; Hanc, E.; Chen, C.; Zhang, H.; Lu, L. Advances in Lead-Free Pyroelectric Materials: A Comprehensive Review. J. Mater. Chem. C 2020, 8, 1494–1516. [Google Scholar] [CrossRef]
  35. Kishore, R.; Priya, S. A Review on Low-Grade Thermal Energy Harvesting: Materials, Methods and Devices. Materials 2018, 11, 1433. [Google Scholar] [CrossRef]
  36. Poprawski, W.; Gnutek, Z.; Radojewski, J.; Poprawski, R. Pyroelectric and Dielectric Energy Conversion—A New View of the Old Problem. Appl. Therm. Eng. 2015, 90, 858–868. [Google Scholar] [CrossRef]
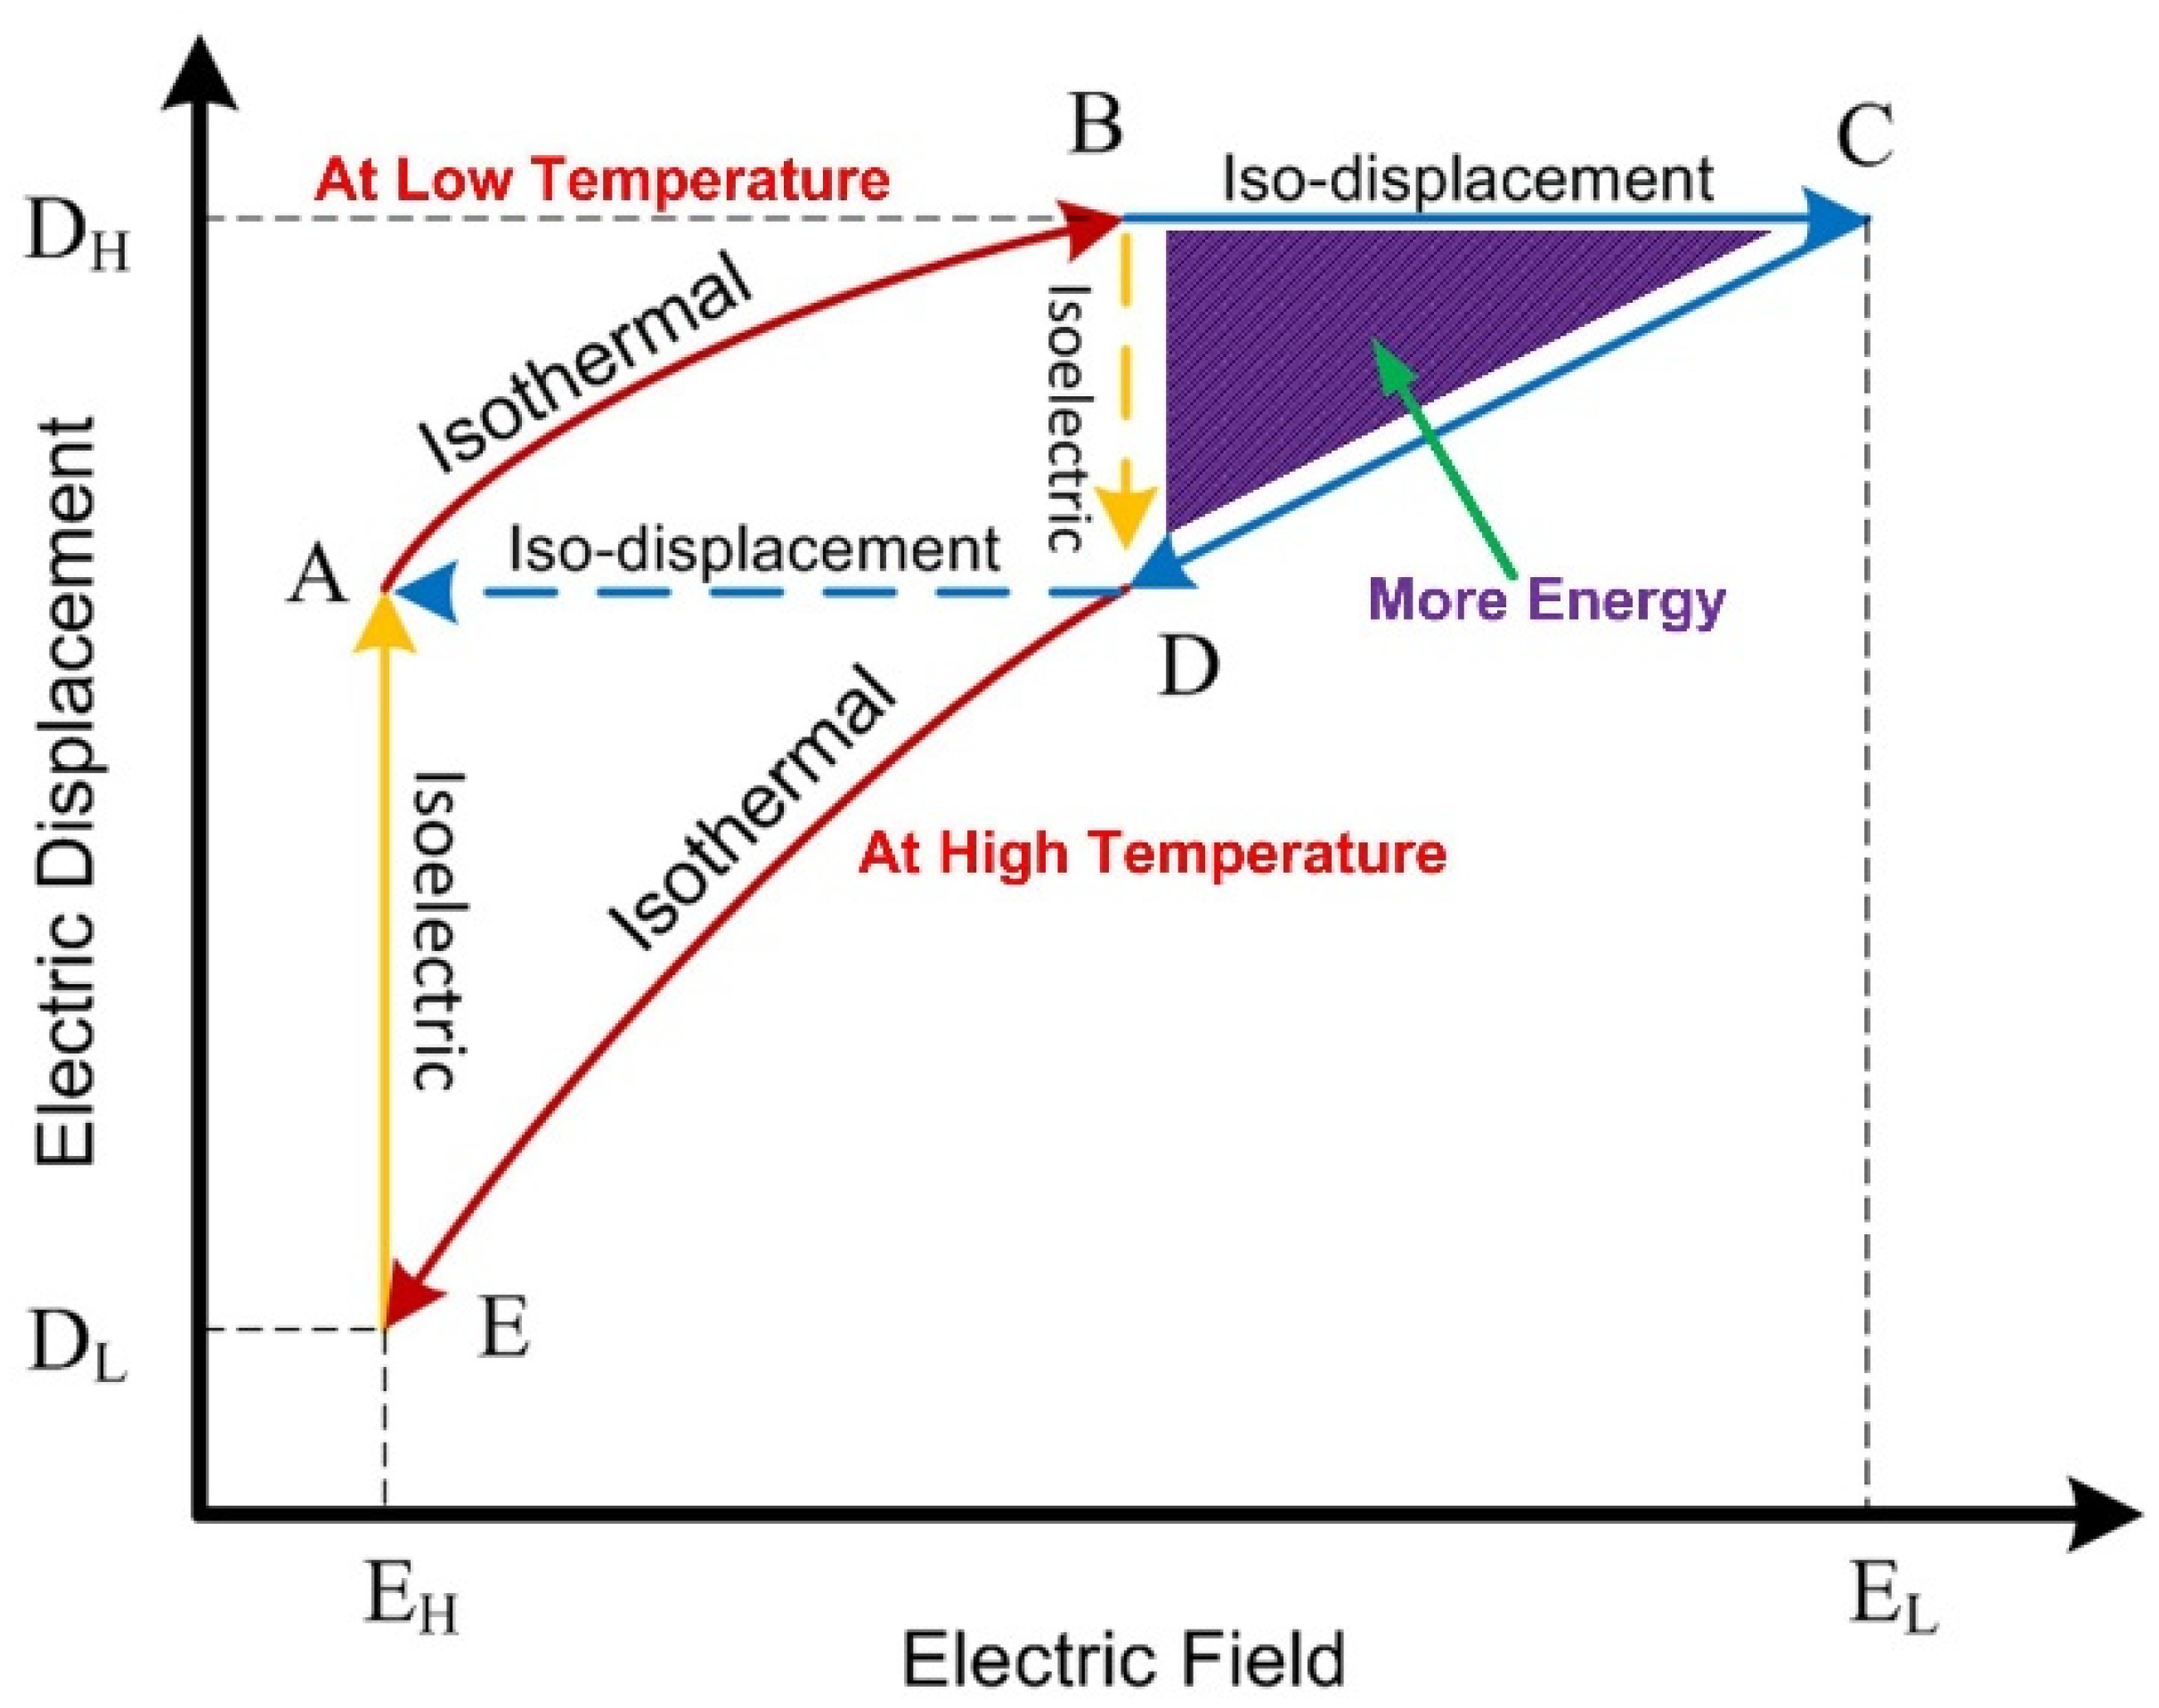
Figure 1. Thermoelectric cycles.
Energies 16 04728 g001
Figure 2. Schematic of the pyroelectric power generation system.
Energies 16 04728 g002
Figure 3. Measurement of dielectric constant change with temperature for the C9 sample.
Energies 16 04728 g003
Figure 4. Measurements of sample voltage under the 10 ms pulse width of one input pulse electric field, with temperature fluctuation for (a) five cycles (100 s) or (b) 500 ms time duration.
Energies 16 04728 g004
Figure 5. Measurement of sample voltage under two input pulses of the electric field at a 10 ms pulse width, with temperature fluctuation for (a) five cycles (100 s) or (b) 500 ms time duration.
Energies 16 04728 g005
Figure 6. Measurement of sample voltage under five input pulses of the electric field at a 10 ms pulse width, with temperature fluctuation for (a) five cycles (100 s) or (b) 500 ms time duration.
Energies 16 04728 g006aEnergies 16 04728 g006b
Figure 7. Measurements of sample voltage under ten input pulses of the electric field at a 10 ms pulse width, with temperature fluctuation for (a) five cycles (100 s) or (b) 500 ms time duration.
Energies 16 04728 g007
Figure 8. Measurement of sample voltage under twenty input pulses of the electric field at a 10 ms pulse width, with temperature fluctuation for (a) five cycles (100 s) or (b) 500 ms time duration.
Energies 16 04728 g008
Figure 9. Comparison of the D-E loop measurement for one cycle of the C9 sample at a 10 ms pulse width for one, two, five, ten, and twenty pulses of the pulse electric field.
Energies 16 04728 g009
Figure 10. Comparison of net generated power density with respect to single pulses of 20 ms, 50 ms, 100 ms, and 200 ms and pulse widths against multiple 10 ms for different pulse amplitudes: (a) 250 V/mm, (b) 500 v/mm, (c) 1000 V/mm, and (d) 1500 V/mm.
Energies 16 04728 g010aEnergies 16 04728 g010b
Figure 11. Net mean power density against the input pulse electric field for different numbers of pulses: (a) under a 10 ms pulse width, (b) under a 20 ms pulse width, and (c) under a 50 ms pulse width (cycle frequency = 0.05 Hz, low temperature = 120 °C, ΔT = 20 °C).
Energies 16 04728 g011aEnergies 16 04728 g011b
Figure 12. Comparison of the power generation density of a (a) 200 ms pulse width with respect to twenty 10 ms pulses, ten 20 ms pulses, four 50 ms pulses, two 100 ms pulses, and one 200 ms pulse (b) 100 ms pulse width with respect to ten 10 ms pulses, five 20 ms pulses, two 50 ms pulses, and one 100 ms pulse for different voltages of the pulsed electric field.
Energies 16 04728 g012
Figure 13. Power generation capability curves for four different pulsed input voltages (250, 500, 1000, and 1500 V/mm) under 1, 2, 5, 10, and 20 pulses of 10 ms pulse width.
Energies 16 04728 g013
Figure 14. Power generation capability curves of the power generation system at four different pulsed input voltages (250, 500, 1000, and 1500 V/mm) under different numbers of (a) 20 ms and (b) 50 ms pulses.
Energies 16 04728 g014
Table 1. Operation process and switching states of the power generation system.
Operation ProcessSwitching Status
SW1SW2SW3
IsothermalONOFFOFF
Iso-displacementOFFOFFOFF
IsothermalOFFONON
IsoelectricOFFONON
Table 2. Multi-pulse input voltage and maximum sample voltage with respect to the number of 10 ms pulses under the low-level temperature (TL = 120 °C) with a temperature difference (ΔT = 20 °C).
Number of Pulses for
10 ms Pulse Width
Pulse Input (V)Maximum Sample Voltage (V)
1503570
2503570
5502595
10502595
20502595
Disclaimer/Publisher’s Note: The statements, opinions and data contained in all publications are solely those of the individual author(s) and contributor(s) and not of MDPI and/or the editor(s). MDPI and/or the editor(s) disclaim responsibility for any injury to people or property resulting from any ideas, methods, instructions or products referred to in the content.