1. Introduction
Buildings account for over a third of global energy consumption and contribute approximately 36% of global CO
2 emissions. In the European Union (EU), buildings represent the largest end-use sector, consuming around 40% of total energy and 55% of electricity [
1]. However, energy consumption varies significantly among EU countries, ranging from 60–90 kWh/m
2 in warmer southern countries to 175–235 kWh/m
2 in colder northern and western European countries [
2]. Without action, this situation is expected to worsen due to climate change and rising energy costs. Italy had the highest average electricity price in 2022, surpassing all other countries at EUR 322/MWh [
3].
The variations in energy consumption among different places are mainly due to climate differences, but the differences in terms of building stock between countries are also significant. The European historic building heritage is extremely varied and covers several functions with corresponding variable energy needs [
4].
Despite ongoing efforts to improve energy efficiency and reduce emissions throughout the lifespan of buildings, energy consumption in Europe, especially in residential buildings, continues to increase. This increase can be attributed partly to the growing prevalence of electronic equipment, but economic, social, political, and management factors also play significant roles [
5]. Accurate prediction of energy use and energy efficiency retrofits are crucial for both existing and new buildings to enhance their energy performance and minimize environmental impact, as highlighted by various research studies [
6]. Additionally, new legislation in Europe aims to mitigate both the energy and environmental impacts of buildings [
7]. Due to the high levels of carbon dioxide in the atmosphere, the European Commission has set an objective of reducing CO
2 emissions by 90% for the building sector by the year 2050 [
8].
Therefore, building renovations should be thoroughly and comprehensively designed by considering the different effects of the retrofit strategies. A study about non-residential buildings considered interventions for energy efficiency, comfort, productivity, and cost reduction [
9], but did not assess the environmental impact. Another study showed that the use of passive and active strategies for energy reduction can increase the carbon emissions of the entire system by 6.16% to 30.42%, but this study did not consider indoor comfort and investment costs [
10]. A study conducted on existing buildings in the Mediterranean area showed a correlation between energy savings and indoor comfort but did not consider the environmental impact or investment costs [
11]. In [
12], the authors evaluated which retrofit interventions are most effective and reliable in the long term. Retrofit costs, energy savings, and thermal comfort of a residential building were studied, but not the environmental impact of the retrofit solutions [
12]. In [
13], the authors set holistic sustainability goals in the context of building renovation but did not study comfort and retrofit costs. To fill this gap, in this work, energy savings, indoor comfort analysis, investment costs, and environmental impact were considered jointly.
Most scientific research studies in environmental assessment focus on analyzing building retrofit strategies using the Life Cycle Assessment (LCA) approach. This involves examining the entire life cycle of a building, starting from the extraction of raw materials and encompassing processes of transformation, transport, and waste disposal. The total energy of a building’s life cycle includes the energy incorporated in its construction, the energy consumed during its operation, and the energy expended during the demolition phase [
14]. LCA also considers embodied carbon, operational carbon, and the overall carbon footprint when evaluating the environmental impact of a product, process, or system. Clearly defining the objectives and target audience of a study is crucial, as it determines the methodologies used, the study of impact categories, and the quality of the data.
The Life Cycle Inventory (LCI) phase involves collecting data, including primary impact processes such as product manufacturing and secondary impact processes such as energy consumption. Validating the collected data with respect to the selected process units is essential. The results obtained in the Life Cycle Inventory are then analyzed and compared to environmental impact indicators [
15]. In the Life Cycle Impact Assessment (LCIA) phase, emissions are classified into impact categories, which are further grouped for comparison. The EN 15084 [
16] standard provides a detailed description of the building life cycle, divided into phases and modules. It follows the principle of modularity, attributing processes influencing environmental performance to specific modules and associating resource consumption and emissions with the processes generating them. This European standard, also adopted in Italy, specifies the calculation method based on LCA and other quantitative environmental information to evaluate a building’s environmental performance and communicate assessment outcomes [
17]. By emphasizing embodied carbon, it represents the CO
2 equivalent (CO
2eq) associated with materials and construction processes throughout a building’s or infrastructure’s entire life cycle [
18]. It encompasses the CO
2 emissions produced from construction to end-of-life, including transportation and building techniques. Therefore, embodied carbon reflects a building’s or infrastructure’s carbon footprint before it becomes operational and after decommissioning when materials are recycled. Notably, with improvements in building energy efficiency leading to a reduction in operational carbon, recent data from the World Green Building Council indicate that embodied carbon constitutes a larger proportion of a building’s overall carbon footprint [
19].
In this framework, this study focuses on achieving high overall building retrofit performance in terms of indoor comfort, energy improvement, carbon footprint, and economic sustainability. The objective is to address not only the thermal energy behavior through efficient retrofit solutions but also the CO2eq emissions and social costs associated with the carbon footprint, considering suitable investment costs. The proposed methodological approach is tested on a unique building typology, a thermal bath building (usually called salus per acquam (SPA)) located in the south of Italy, which, to the authors’ knowledge, has not been previously addressed in the literature.
The proposed retrofit interventions aim to achieve building indoor comfort, reduce energy consumption, reduce environmental impact, and minimize the payback period. The methodological approach is based on a multi-parameter analysis combining different physical domains by implementing BIM. The simple model proposed is useful to evaluate the effectiveness of building retrofits.
2. Methods
This study proposes an approach to evaluating energy efficiency retrofit projects applied to existing buildings. The approach aims to address not only energy savings but also comfort enhancement, environmental impact reduction, and economic payback minimization.
This approach is aimed, among others, at professionals as the key target group. Therefore, the most commonly acknowledged and implemented retrofit strategies are considered. In this view, guidelines for energy refurbishment of existing buildings are proposed in terms of indications to be followed in the energy retrofit design process by taking into account the different dimensions of building energy and environmental impact—not only energy saving—to select retrofit solutions. However, the use of this dynamic multi-data analysis does not involve the direct use of mathematical optimization algorithms.
The initial phase involved an energy diagnosis to obtain adequate knowledge of the energy consumption of a building or group of buildings. The energy diagnosis helped identify and quantify the cost-benefit obtained from energy-saving measures. With increasing environmental policies, technicians are prompted to combine energy analysis activities with energy simulation to accurately calculate the energy consumption of buildings. The approach is based on the assessment of the existing building-plant system to identify all critical factors and energy-saving potential solutions. The economic effectiveness of each intervention was also checked and compared.
To standardize the qualification of suppliers and their execution modalities, the EU and global markets have created common codes. The European standard for energy audits is the group of standards EN 16247 [
20], which sets out the requirements and provides guidance for energy audits. The proposed approach included an energy diagnosis, an assessment of the existing building-plant system, the identification of critical factors and energy-saving potential solutions, and an economic effectiveness analysis. Standardization was achieved through common codes, such as the transposition in Italy of UNI CEI EN 16247 [
20].
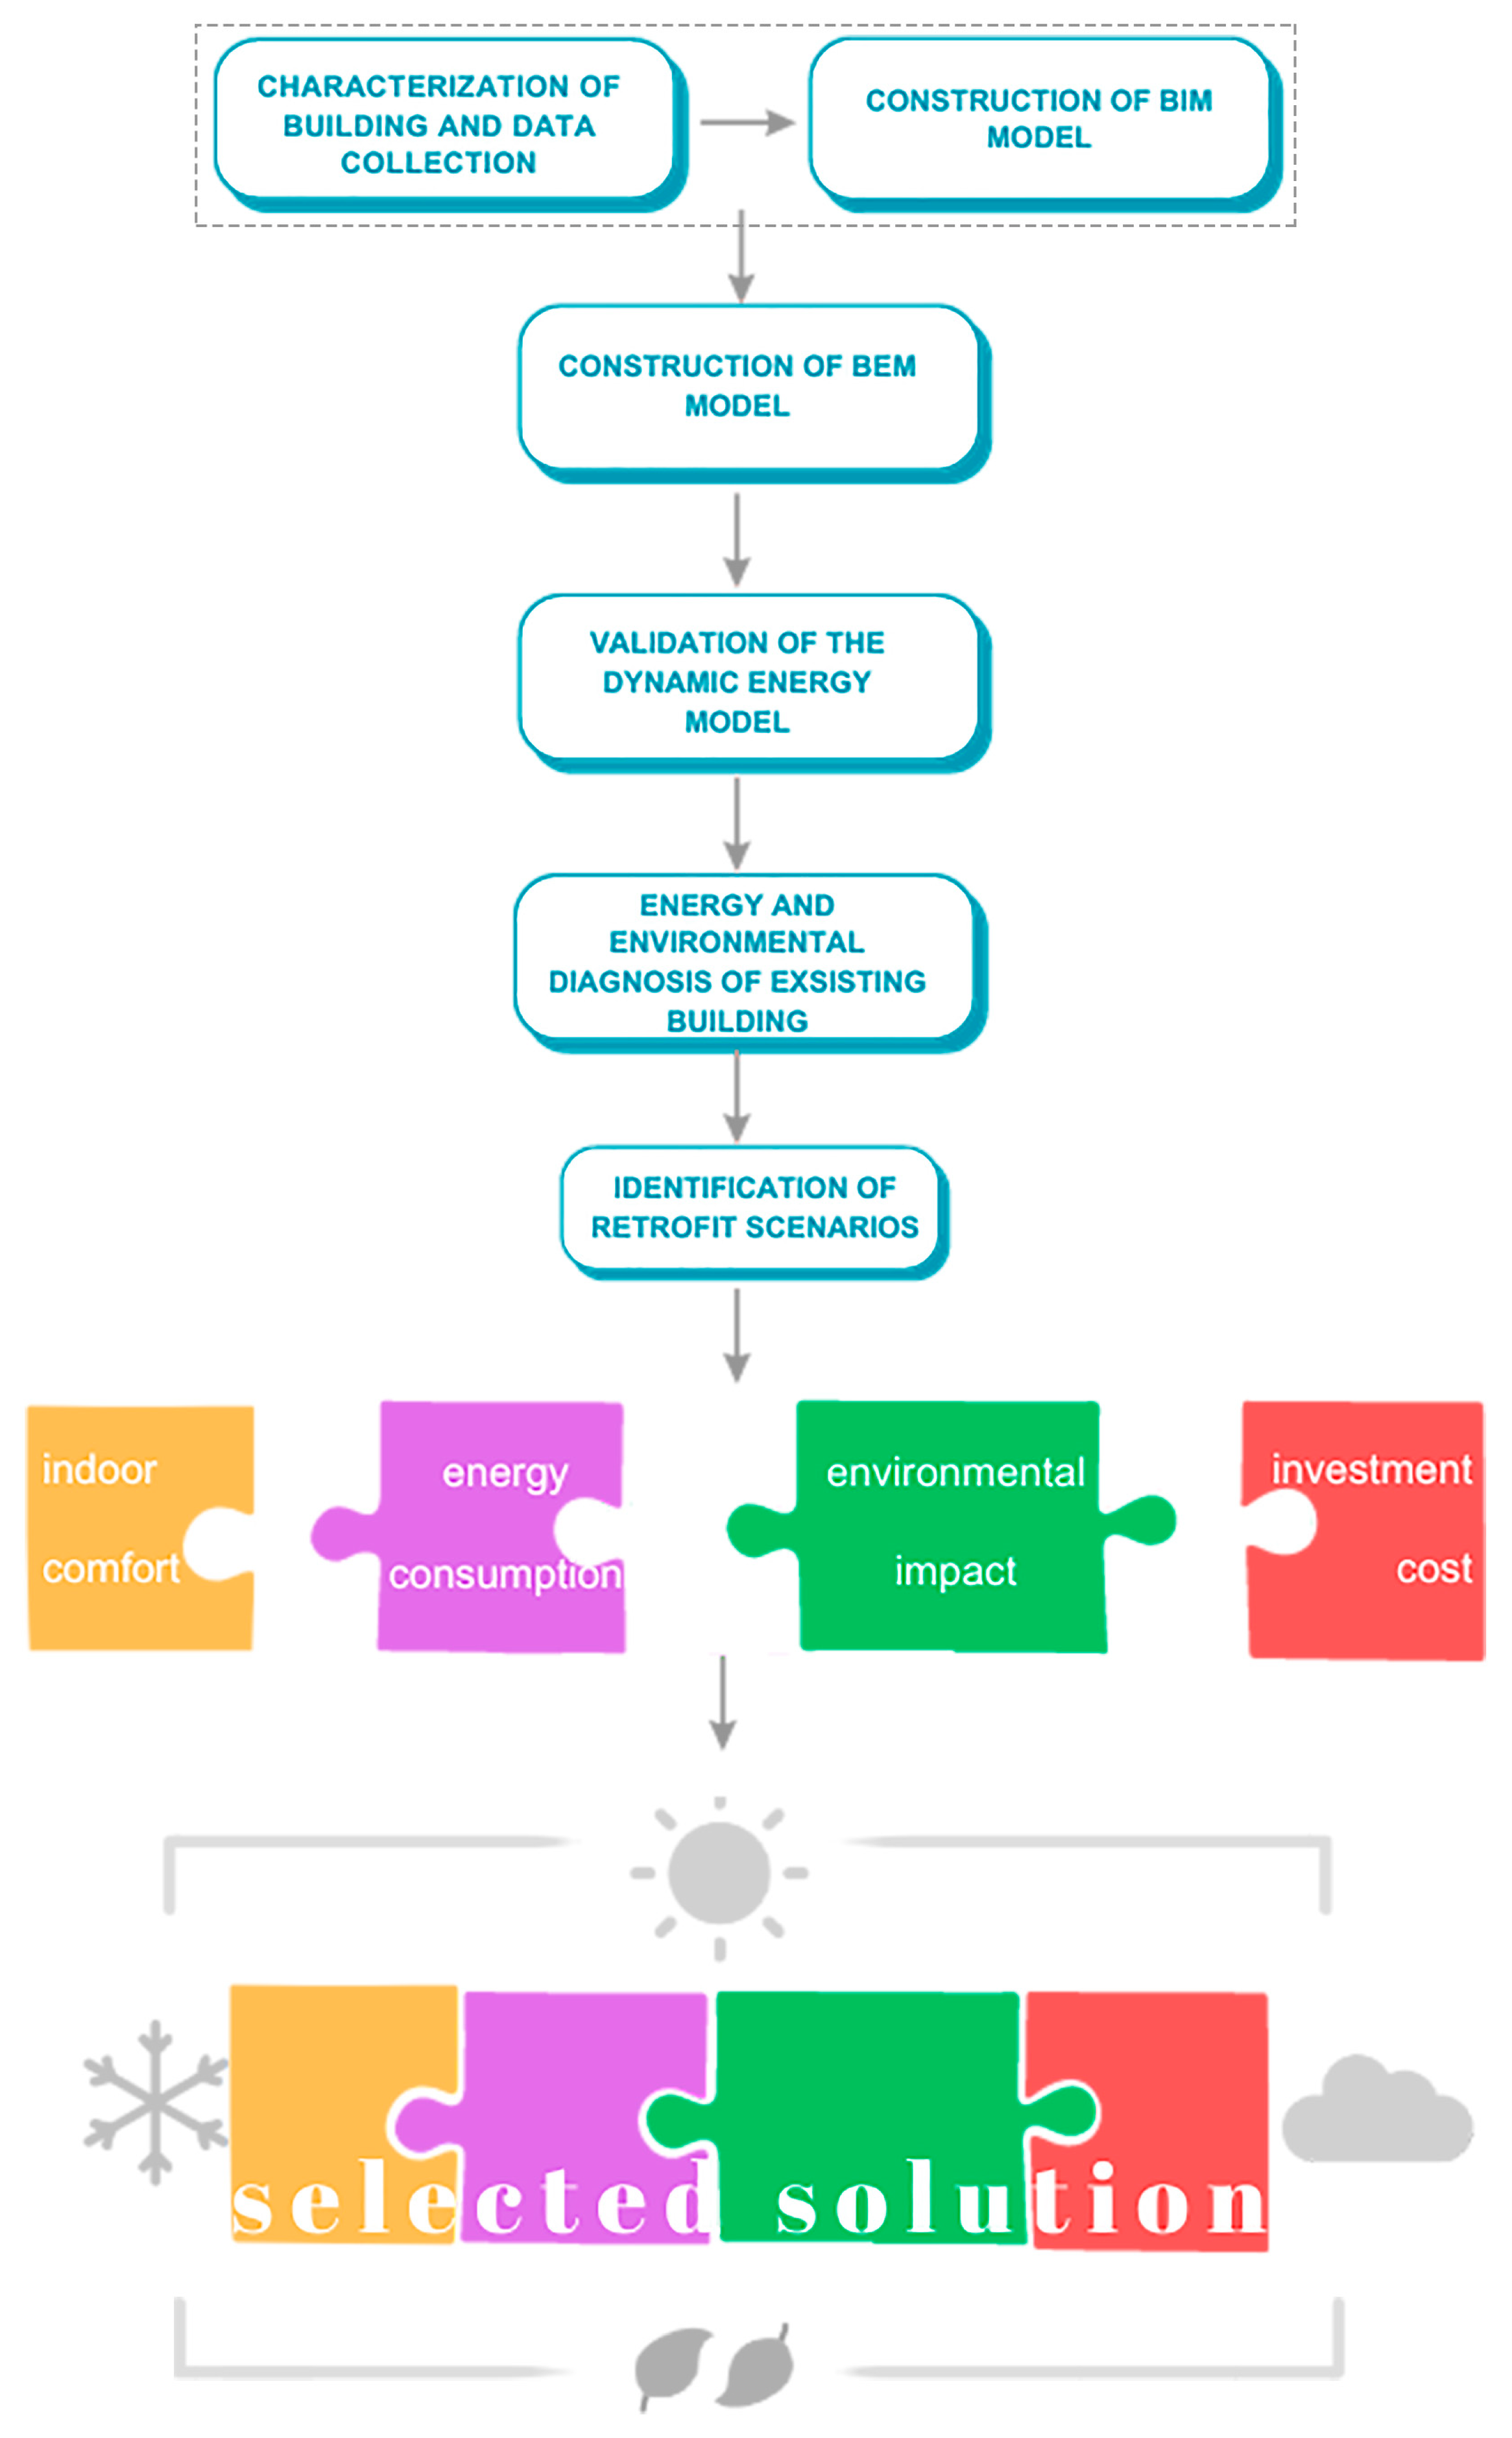
Accordingly, the proposed approach started with the building energy diagnosis and applied a BIM-based approach to the survey of documentation, technology, structure, and facilities of an existing building to obtain a virtual synoptic table as a fundamental database for different retrofit scenarios. With BIM technology and its interoperability, it was possible to design for sustainable requalification by simultaneously controlling the following crucial parameters (
Figure 1):
Energy efficiency;
Thermal comfort;
Environmental impact;
Investment cost.
Therefore, the study involved the use of BIM with a LOD300 depth level for data collection. Subsequently, the BIM model was imported into BEM simulation software to integrate the building energy system. BIM is widely accepted and recommended as one of the parametric tools [
21]. Another study [
22] used BIM to generate and evaluate optimal renovation scenarios specifically tailored to Danish dwellings. BIM enables an integrated design process, starting from the early stages, and addresses key issues such as information fragmentation, building performance prediction, and automated assembly [
23].
This approach was meticulously crafted to meet the specific needs of professionals operating in the field of energy retrofits, paying attention to the assessment and possible optimization of environmental and economic performance. The primary goal was to ensure that the basic content, data, and information provided could be easily accessible and practical to use. It is recognized that professionals require a deeper understanding of the subject matter and are actively seeking practical solutions that can be readily applied in their work environment. This approach transcends mere theoretical concepts. Instead, it strongly emphasized delivering actionable insights that professionals can directly implement in their day-to-day work. Moreover, it provided practical tips, cognitive support, and guidance to assist professionals in successfully navigating challenges and making informed decisions.
This approach was designed to bridge the gap between theory and practice, equipping professionals with the knowledge and tools necessary to excel in their respective fields.
2.1. Experimental Campaign
2.1.1. Indoor Microclimate Monitoring
First, indoor air temperature and relative humidity were monitored in the building to evaluate the actual indoor thermal conditions and validate the building energy model. To achieve this aim, sensors called “Tinytag Plus 2” were placed in different thermal zones to continuously measure air temperature and relative humidity for several months.
Table 1 shows the main characteristics of this sensor. The experimental monitoring campaign is described in detail in
Section 3.
2.1.2. Infrared Thermography
Infrared thermography is a well-known non-destructive technique for thermal bridge diagnostics and surface defect detection. Therefore, it is a tool to support building energy efficiency improvements [
24]. Infrared thermography inspections of building envelopes are used to detect heat losses, missing or damaged thermal insulation in walls and roofs, thermal bridges, air leakage, and moisture sources [
25].
During the monitoring campaign for energy diagnosis, it was used for the thermal detection of the opaque walls and to identify any problems concerning condensation phenomena, poor thermal insulation, or thermal bridges. A “FLIR ONE PRO” thermal imaging camera was used for the thermographic measurements. Its technical characteristics are summarized in
Table 2.
2.2. Validated Energy Simulation
A validated dynamic energy simulation was implemented to model the actual behavior of the existing building and to evaluate the effect of the proposed retrofit interventions in terms of energy savings and indoor comfort. The building energy model (BEM) for energy performance simulations was developed in the EnergyPlus simulation engine with the DesignBuilder graphical interface. The dynamic simulations were performed using the typical meteorological year (TMY) weather file from the EnergyPlus database for the closest available location.
To calibrate the simulation model, it was crucial to define the climatic conditions under which the building and its systems operate. To achieve this aim, weather data were collected from the external environment during the period of the measurement campaign. Data from a nearby weather station was utilized for this purpose. Therefore, the input weather file was adjusted by incorporating the measured data at specific time intervals. To ensure the reliability of the BEM, the calibration procedure was carried out in two steps [
26]. First, the sub-hourly simulated values of indoor air temperature were compared against the monitored values in free-running conditions through an iterative process to reduce the intensity of the error measured in terms of Mean Bias Error (MBE) [°C] and Root Mean Square Error (RMSE) [°C]. Thereafter, the same procedure was applied to the monthly energy consumption values. The calibrated model was achieved by referring to the procedure defined by the ASHRAE Guideline 14-2014 reference [
27]. If M
i is the i-th monitored data, S
i is the i-th simulation outcome, and N is the number of data, the MBE index is defined in Equation (1):
This is a bias measure (i.e., a sum of errors) between measured and simulated data for each measuring range and a good indicator of the overall bias in the model. It captures the mean difference between measured and simulated data points. However, positive biases compensate for negative biases (the so-called cancellation effect). Therefore, a further measure of model error is also required, as in Equation (2):
The RMSE is a measure of data variability. The error, or difference in paired data points, is calculated and squared for every measuring range. The sum of squared errors is then added for the total periods and divided by their respective number of points, yielding the mean squared error (MSE). Finally, the square root of the result is reported as the root mean squared error (RMSE). It overcomes the MBE weakness since it considers the absolute error values [
28]. According to the validation criteria specified in [
27], the chosen tolerance values for the indoor air temperature calibration corresponded to ±0.5 °C for MBE and to 1 °C for RMSE.
The calibration of energy consumption—to obtain a consumption trend as close as possible to the real one—was carried out according to the procedure in [
29,
30] by evaluating the Normalized Mean Bias Error (NMBE) [%] and the Coefficient of Variation of the Root Mean Square Error (CV(RMSE)) [%], calculated according to Equation (3) and Equation (4), respectively:
where M
mean is the mean of the measured values. The model can be considered calibrated when CV (RMSE) < 30% and NMBE < 10% when sub-hourly values are considered [
27]. The results of the calibration process are summarized in
Section 5.2.
For the indoor comfort evaluation, the indices of the acknowledged Fanger theory were assessed, i.e., the predicted mean vote (PMV) and the predicted percentage dissatisfied (PPD), which are commonly used to assess indoor comfort in “moderate environments” [
31]. They were calculated according to the EN ISO 7730 [
32] standard based on the results of the simulations.
2.3. Carbon Footprint Method
In this study, the LCA methodology was used to obtain science-based information about the environmental impact of the case study building in terms of greenhouse gas (GHG) emissions [kg CO
2eq], according to the standard EN 15978:2011 [
33]. The functional unit was considered to be one square meter of floor area over a service life of 50 years. The GHG emissions were evaluated using the Kyoto basket gases, weighted by their global warming potential (GWP), and aggregated to determine total GHG in terms of CO
2eq [
34]. For the current study, the building life cycle stages and boundary conditions were considered as shown in
Figure 2.
To carry out this analysis, OneClick software was used, considering GaBi and Ecoinvent databases, for various retrofit scenarios for the building. The GaBi database provides the most comprehensive coverage of life cycle databases across various industries worldwide [
35]. The Ecoinvent database gives access to unit measures to support cradle-to-gate inventories covering diverse industrialized regions [
36]. It contains LCI data on worldwide industrialized stocks, including information on energy supply, asset extraction, material inventory, transport services, etc.
OneClick is followed by Environmental Product Declarations (EPDs) according to the ISO 14040 [
37] and EN 15804 standards [
16]. Therefore, to evaluate the carbon footprint of the case study building (CO
2eq emissions), the amount of materials was estimated and computed at the construction stages, as well as the number of hours and fuel consumption at the transportation stages and the consumption of energy and water during the operational phase of the building.
The same analysis was conducted for possible retrofit scenarios to evaluate the environmental impact of each option. The analysis included both the embodied carbon assessment and the carbon social cost estimation. The latter expresses the total damage of CO
2 converted into euros. This term represents the economic cost caused by an additional ton of CO
2eq emissions or its equivalent [
38]. It can also be read as the change in the discounted value of economic welfare from an additional unit of CO
2eq emissions [
38]. The social cost of carbon is a central concept for understanding and implementing climate change policies.
2.4. Economic Assessment
Following the energy performance assessment, the project’s feasibility from an economic point of view was also assessed. A correct assessment of the economic feasibility of an investment involves different elements, including the costs of the system components and the analysis of the cash flows expected during the system’s life span.
The economic feasibility was studied using a net present value (NPV) analysis. The NPV is a calculation method that allows for assessing whether a project produces value in the time needed for its economic return [
39]. To achieve this aim, the payback period was calculated to evaluate the time needed to recover the cost of the initial investment and, thereafter, to have net gains from the cash flows. The NPV method establishes that the cash flow (CF) discount after the initial investment has been made must be returned to its value at the time of zero and the moment of the disbursement of the initial investment. This was conducted using the discount rate. The statistics of “Banca d’Italia” show that the current discount interest rate is about 3% [
40]. To analyze the payback period of multiple investments, the weighted average of the payback periods calculated for individual investments is considered. Additionally, this average was redefined based on the benefits that each retrofit scenario provides the building.
3. Case Study
A thermal bath building called “Terme Lucane” (henceforth SPA) located in Latronico, Italy, at a latitude of 40°05′20″ N and a longitude of 16°00′34″ E, is the case study. The city belongs to climate zone E, according to the Italian climate classification introduced by DPR 412/93 [
41] and Law 10/91 [
42]. Climate zone E includes areas characterized by Heating Degree Days (HDD) between 2101 and 3000. The value for Latronico is 2535 HDD; it is located in a cold climate zone.
The building includes the main thermal bath area, the central courtyard, and the various courtyards, for a total surface of about 6500 m
2, of which 4670 m
2 are heated and 1830 m
2 are not conditioned, leading to an air-conditioned gross volume of 14010 m
3. The window area is equal to 460 m
2. The structure is located within its wooded park of about 7 hectares in a green area. The building, shown in
Figure 3, suffers from 40 years of lack of maintenance.
The SPA building includes five pavilions: reception, diagnostic center, inhalation pavilion, hydroponic pavilion, and balneotherapy pavilion. The technical room for energy systems is located in an additional, separate building.
The load-bearing structure is made of reinforced concrete with reverse T foundations and an elevation structure consisting of pillars and beams. The roof is terraced, and the roof slab is of the “biblock” type with a waterproof membrane (10 mm) and a 50 mm rock wool insulation panel (λ = 0.033 W/m K) on the inner side with a steam shield. The external finishing of the roof is made with concrete slabs and brushed grit on the external face, joined with elastic joints. The total thickness is such as to contain the thickness of the load-bearing beams. In particular, the roof of the balneotherapy pavilion is made of staggered floors to allow greater ventilation and lighting in the treatment rooms. The external walls are made of solid bricks on the outside and perforated with two heads on the inside to form the typical empty chamber wall. The external coating is made of slabs of travertine laid with cementitious mortar. The pillars are incorporated into the lining and are equipped with a 30 mm panel of rock wool (λ = 0.034 W/m K) to limit thermal bridges. The internal partitions are made of perforated bricks and bastard mortar. As regards the floor, an insulating screed is provided by a mix of pumice and cement and the addition of an emulsifier diluted in water to obtain a cellular cement with a thickness of more than 50 mm (in compliance with the Italian circular 1769 of 30 April 1966 [
43]). In particular, the floor coverings of the healing units are protected by a waterproofing layer. For the finishing of the critical parts of the cover, zinc flashing strips are used. The windows are tape-type with rigid polyvinyl chloride (PVC) frames, shock-proof fixed elements, and reflective double glass (3-16-3). They are vasistas windows with an opening between 45 and 30 degrees.
Table 3 summarizes the characteristics of the main external envelope components.
The complex is equipped with two natural gas boilers, one for heating the water needed for thermal treatments and the other for zone heating. As regards the heating of the water provided for the thermal treatments, the thermal water is naturally available at 23 °C. Then, water is heated up to 70 °C with the boiler and distributed to the different pavilions for treatment. The zone emission systems are radiators, but they are located only in the balneotherapy pavilion and in the inhalation pavilion. The reception, the diagnostic center, and the hydroponic pavilion do not have heating systems. No cooling system serves the building. Due to its end-use, the building (some areas in particular) is characterized by high indoor air humidity levels and latent heat gains. However, the actual heating, ventilation, and air conditioning (HVAC) system is not able to overcome these loads.
The SPA is generally open to the public for treatments only from May to October, i.e., during the warm season, between 7:30 a.m. and 6:00 p.m. On the contrary, the office areas are open all year. Therefore, the study foresees an analysis also during the winter period, because in 2021 the structure continued to be operational until 31 December.
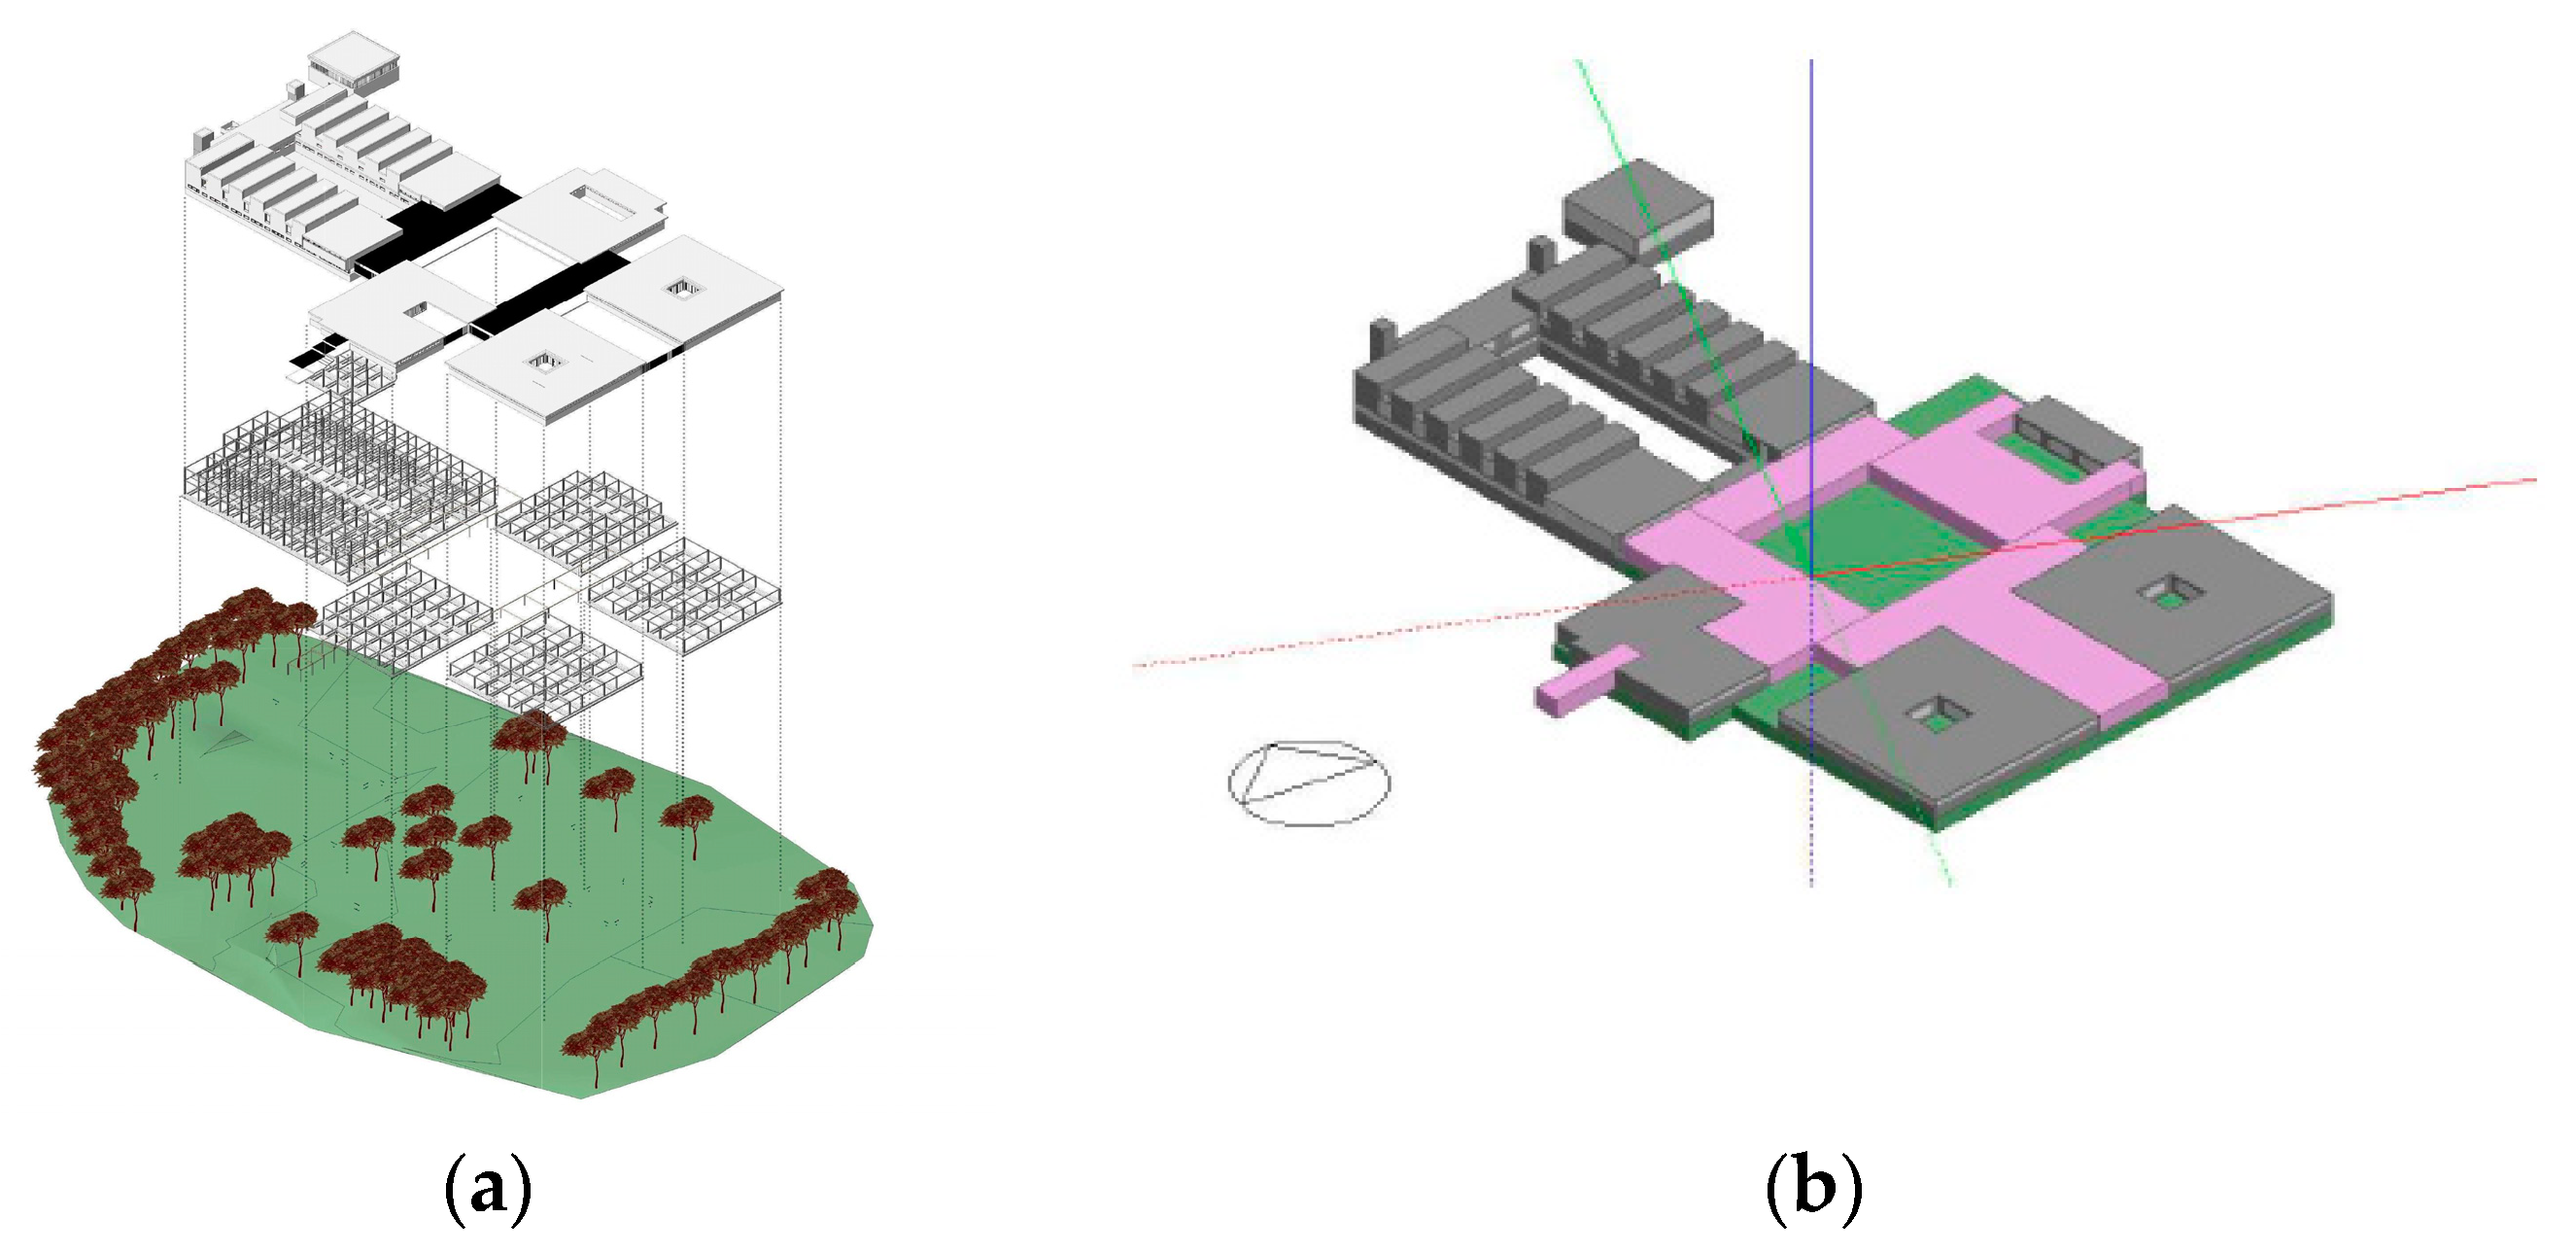
For the purpose of the study, as previously mentioned, the BIM and BEM models of the case study building were developed.
Figure 4 depicts the BIM and BEM models of the case study building used for the analyses.
To study indoor thermal conditions and validate the building energy model, two sensors, “Tinytag Plus 2”, were placed in two different zones of the building: one in the reception (a non-conditioned area) and the other in the inhalation pavilion (a heated area). The sensors were set to continuously acquire data every 30 min. The sensor in the reception zone acquired data continuously from 20 October 2021 to 7 April 2022. In the inhalation pavilion, the data collection campaign ran from 20 October 2021 to 10 January 2022. The different measurement periods were due to their different locations since the inhalation pavilion closed on 31 December, while the reception was (and is usually) operative all year round. Moreover, the different areas and pavilions have different microclimatic conditions due to the various activities performed and the different profiles of use during the day and the year. The sensors collected data during both the opening and closing times of the structure. However, the monitoring campaign in the reception was always carried out in free-floating conditions since this area is served by no HVAC system. The sensor located in the inhalation pavilion instead, during the opening hours, recorded internal air temperatures under heating system operating conditions.
4. Retrofit Scenarios
This section describes the selected retrofit scenarios. The proposed strategies are those most commonly used in practice for the energy retrofit of existing buildings. Passive, active, and renewable energy production strategies were considered, as well as their combinations. In this way, both the effects of individual strategies and their integration were assessed. This approach allowed for identifying and analyzing nine retrofit scenarios, described as follows and summarized in
Table 4:
Scenario 1 (S1)—Opaque envelope retrofit (passive strategy): it consists of the implementation of an external thermal coat on the external walls. The existing external walls have a thermal transmittance (U-value) of 1.020 W/m
2 K. Following DM 26/06/2015 [
44] (the Italian regulation that provides building minimum energy performance requirements) and considering climate zone E, the vertical wall U-value for retrofits must be ≤0.23 W/m
2 K. Therefore, an external EPS thermal insulation layer with graphite (λ = 0.031 W/m K) and a thickness of 14 cm is proposed to replace the finishing layer made of travertine slabs. In this way, the retrofitted external wall reaches a U-value of 0.181 W/m
2 K and, therefore, fully complies with the indications suggested in [
44];
Scenario 2 (S2)—Improved transparent envelope (passive strategy): It involves the replacement of the existing windows with more energy-efficient ones. In particular, PVC windows with triple glass and argon chambers are selected. This solution leads to a substantial improvement in their U-value, i.e., from 1.960 W/m
2 K to 0.804 W/m
2 K, which is consistent with the requirements for retrofits equal to a maximum of 1.40 W/m
2 K in climate zone E [
44];
Scenario 3 (S3)—New HVAC systems for heating, cooling, and ventilation (active strategy): this scenario proposes to improve the capabilities and efficiency of the HVAC system to provide benefits in terms of energy performance and thermal comfort. The system proposed to replace the existing HVAC system is an all-air system with an AHU (air handling unit) and diffusion terminals located in the conditioned zones. The proposed system is necessary due to the high values of indoor air humidity and the latent internal thermal loads. The characteristics of the AHU unit are 5000 m3/h air flow rate, 81% recovery efficiency, COP equal to 4.15 and EER equal to 3.90, total heating capacity equal to 88 kW, and total cooling capacity equal to 57 kW, identified based on the building thermal load requirements. The natural gas boiler intended for water heating is kept in its existing condition;
Scenario 4 (S4)—Photovoltaic (PV) system (renewable energy strategy): with a view to the green energy transition, a photovoltaic system was proposed in this scenario. The PV sizing was conducted by identifying the optimal areas for the installation of panels and designing the integration of the electricity network with storage systems. The solar energy availability was evaluated with BIM transient modeling by quantifying the total solar radiation on roof surfaces and, therefore, the optimal position for the PV panels. The study of solar radiation availability, depicted in
Figure 5, allowed the identification of the areas for the most effective installation of 280 panels for a total of 56 kWp. The dimensions of each PV panel are 1.70 m × 1.10 m, and the peak power of the single panel is 200 Wp;
Scenario 5 (S5)—Solar Thermal System (Renewable Energy Strategy): According to the case study building end-use, the natural gas consumption for water heating that is used for the treatments is the highest energy use. Indeed, a water temperature of at least 70 °C must be constantly guaranteed, considering the arrival temperature of 23 °C from the natural hot springs. To achieve this aim, this scenario proposes the implementation of a hybrid system with solar collectors supported by a natural gas boiler that always guarantees the required temperature but uses mostly renewable energy. Moreover, the actual operation of the structure mainly during the summer months allows for optimizing the performance of this system because the solar system can cover the total energy needed for water heating due to higher solar radiation availability during the summer. The solar thermal system is positioned above the building that houses the technical room to favor proximity to the systems and sun availability. Six systems were designed for a total of 1800 l. Each system has a capacity of 300 l;
Scenario 6 (S6)—Passive retrofit: combination of S1 and S2;
Scenario 7 (S7)—Passive and active retrofit: combination of S1, S2, and S3;
Scenario 8 (S8)—Renewable energy retrofit: combination of S4 and S5;
Scenario 9 (S9)—Passive, active, and renewable energy retrofit: the combination of all retrofit strategies, i.e., S1–S5.
The proposed retrofit scenarios involve commonly applied energy efficiency strategies that are mostly adaptable, reversible, easily movable, and installable and have reduced maintenance costs. Accordingly, they can be suitable for any similar building.
5. Results
The analysis aims to identify the most effective combination of the proposed retrofit strategies that leads to a balanced improvement in indoor thermal comfort, energy savings, CO2eq emission reduction during the entire life cycle, the social cost of carbon, and economic sustainability. First, the current state of the case study building is assessed. Thereafter, the model calibration is presented. Finally, the last sections provide the results for each scenario in each analyzed domain.
5.1. Existing Building Energy Diagnosis
This section summarized the energy diagnosis of the building in its existing condition according to the results of indoor microclimate monitoring and infrared thermography. The energy diagnosis of the building showed low thermal energy performance involving high energy consumption and an uncomfortable indoor environment due to four major criticalities:
None or low thermal insulation of the external envelope;
Thermal bridges and incorrectly installed windows;
Poorly functioning and inefficient heating system;
Absence of a cooling system;
Absence of a ventilation system to control indoor humidity.
The first four criticalities affect the factors of use and consumption of the gas boilers intended for heating. Moreover, the monitored data on indoor air temperature showed that indoor temperatures are outside the comfort range most of the time in winter—despite the operating heating system—and in summer. The last criticality involves the continuous opening of the windows by the users to reduce indoor humidity levels, which has negative effects in terms of heat losses/gains.
Figure 6 shows the most critical thermal bridges of the external envelope, located in the northeast wall. The greater or lesser heat loss through the wall surface was captured by the infrared camera, which translated the surface areas with different temperatures into thermographic images. This fact greatly affects the performance of the building by burdening consumption and internal comfort levels. In particular, the different temperatures in the thermal image in
Figure 6 stress the thermal bridge concerning the window frame and wall junction. The bright area around the window indicates a hotter surface temperature than the surrounding area, suggesting a higher heat dispersion in that area.
5.2. Energy Model Calibration
The energy model of the SPA building was validated by verifying the reliability of the sole building envelope modeling and the whole building system model. For validation, a specific weather file was developed by considering in-field monitored data from the Latronico weather station in the year 2021.
For the energy simulations, the input parameters were set to obtain the standard conditions for the usability of the structure. In particular, the inputs included: heating set-point temperature at 22 °C; cooling set-point temperature at 26 °C; infiltration rate equal to 0.7 m3/h; internal gains for the different areas equal to 2.50 W/m2 for the diagnostic center, 10 W/m2 for the inhalation pavilion, and 2.27 W/m2 for the reception area. Moreover, realistic profiles of windows opening, developed based on the outcomes of the energy diagnosis, were considered.
5.2.1. Temperature Calibration
The building energy model was calibrated based on the monitored indoor temperature data to achieve a more realistic prediction of the passive thermal energy behavior in free-floating conditions. For this purpose, some modifications to the initial model were necessary to adapt the BEM to the actual monitored performance based on the calculation of calibration indices, i.e., MBE and RMSE. As a result, the model was calibrated through iterative modifications. The calibration of the model was obtained through an iterative process where the various occupation profiles of the building and infiltrations were changed.
The calculated MBE and RMSE indices for the calibrated model, reported in
Table 5, were considered valid because they are widely included in the tolerance range according to the reference standard [
28].
5.2.2. Energy Consumption Calibration
The second step to obtaining a realistic energy model and assessing retrofit strategies was the validation in active operation, i.e., in terms of energy consumption. Therefore, the model was validated against the monthly energy bills.
The monthly consumption of electricity and natural gas recorded in the bills for the year 2021 was taken into account. These data show that in 2021, the building had a consumption per year of 72,548 kWh of electricity and 31382 cubic meters of standard methane gas [Stm3]. The simulated energy consumption of the final building energy model was 74,199 kWh/year of electricity and 31,279 Stm3/year of natural gas. The annual error for both electricity and natural gas consumption has been within the tolerance range since the initial model. However, a more accurate analysis of monthly values of electricity showed that the error was out of the acceptable range for some months of the year. For natural gas consumption, the simulated values were significantly outside the limits. Most likely, this fact was due to the initial underestimation of thermal losses during the cold season. Therefore, the model was verified and improved to calibrate its energy behavior and be closer to real consumption. In particular, the input data of the energy systems were updated in terms of the power of machinery and the schedules of system operation.
Table 6 shows the values of the calibration index for natural gas consumption and electricity consumption for the calibrated model. They are inside the tolerance range for all months.
5.3. Retrofit Scenarios Analysis
The validated energy model was used to analyze the thermal-energy behavior of the real building and the potential improvement due to the proposed retrofit scenarios. The simulation of the validated BEM allowed a better understanding of some criticalities. Therefore, this section presents and discusses the main results obtained for each scenario using the multi-parameter analysis, i.e., energy consumption, thermal comfort, environmental impact, and costs.
The annual dynamic simulations for the building thermal-energy performance assessment were carried out using the typical meteorological year (TMY) weather file from the EnergyPlus database for the closest available location of Potenza.
5.3.1. Indoor Comfort
The PMV and PPD were calculated for all the hours of the summer season (i.e., from 21 June to 21 September) and the winter season (i.e., from 21 December to 21 March).
Table 7 summarizes the average seasonal results for the relevant retrofit scenarios compared to the existing condition. The study of indoor comfort was performed only for crucial scenarios that could affect this domain. Therefore, scenarios S4, S5, and S8 were not considered. For scenarios S4, S5, and S8, the comfort indices do not vary from the existing condition because these scenarios do not introduce important changes affecting indoor comfort. PPD values appear mostly representative since PMV values sum positive and negative values in each month. Therefore, the average PMV values can appear misleading.
The obtained PMV and PPD average values show that the more efficient building envelope (S1, S2, and S6) has appreciable potential for improving thermal comfort during the winter but a negligible effect during the summer. Adequate comfort conditions inside the building are assured only with the implementation of a properly designed HVAC system (S3). Therefore, during the whole year, a more efficient, opaque, and transparent building envelope combined with a properly dimensioned HVAC system providing heating, cooling, and ventilation (S7) is required to obtain comfortable internal environmental conditions. It could be noted that the seasonal value of PPD in winter is higher than the reference value for thermal comfort, even in the best-performing scenario. This is because the schedule of operation of the HVAC system was kept equal to the current profile of use. Therefore, to ensure comfortable conditions all year round, the designed control and regulation system of the plant should be further improved.
5.3.2. Energy Consumption
Table 8 shows the annual electricity consumption (including the operation of the HVAC system, lighting, and equipment) in the retrofit scenarios vs. the existing building. Consistently, the study of electricity consumption reduction was performed for the scenarios that affect electricity consumption. Therefore, scenario S5 was not considered.
The results stress the need to install renewable energy systems to achieve significant energy savings. Indeed, the installation of PV panels (S4) allows for 44.9% electricity savings. On the contrary, scenarios S3 and S7 show a high increase in electricity consumption due to the new HVAC system being designed with the required power and capabilities, which are higher than the existing system. Therefore, the increase in electricity consumption connected to the newly proposed system solution is acceptable if compared with the existing building state, which has no cooling and ventilation system and an undersized heating system.
Accordingly, in scenario S9, the decrease in electricity consumption is lower than in scenarios S4 and S8, due to the increased HVAC system operation. However, these lower energy savings is necessary due to the correlated thermal comfort obtained both during summer and winter, which would not have been achieved without a properly designed HVAC system.
Table 9 reports the results of natural gas consumption in all the relevant scenarios. The most promising solution to reduce natural gas consumption is the installation of a solar thermal system to produce hot water (S5). Moreover, the combination of a more efficient building envelope, an effective HVAC system, and a solar thermal system to produce hot water (S9) maximizes energy savings. Indeed, scenario S9 provides almost 100% energy savings (exactly 99.58%) for natural gas.
In scenario S3, despite the presence of a new HVAC system that does not require the use of natural gas, the decrease in natural gas consumption is poor. This is because the production of hot water is still reliant on a dedicated natural gas boiler. Indeed, the new HVAC system only handles zones for heating, cooling, and ventilation. However, considering the end-use of the building, the natural gas consumption for hot water production represents the predominant energy consumption.
The result is achievable as a consequence of the availability of natural thermal water at a temperature of 23 °C for the whole year. This considerable result is also possible because the case study building is fully functional during the hours with major solar radiation (from 8:00 a.m. to 5:00 p.m.). In addition, the peak demand for hot water is during the summer, which is the period with the highest turnout.
5.3.3. Carbon Footprint
To determine the carbon footprint of the case study building, the projects were firstly analyzed to determine the carbon footprint of the existing building. The reconstruction of the building followed an iterative process by comparing the technical drawings and the calculation reports. To carry out a correct evaluation, the examination of the quantities was necessary, together with the evaluation of all the quantities and their origin/sourcing. When it was not possible to trace back to the place of origin of the material, assumptions were made by picking the materials present in the program’s database. The choice always converged on the use of local products as close as possible to the building site.
The modeling assumptions were adapted to the reference standard EN 15978 [
33] and, therefore, the following were considered: transports to and from the construction site with an average of 200 km, the presumed average production of construction waste of 5 kg/m
2 (concerning the gross floor area (GFA)), the assumed electricity consumption of 25 kWh/m
2 (concerning the GFA), and the assumed use of diesel equal to 3.5 L/m
2 (concerning the GFA). Moreover, the European average impacts for a temperate climate according to EN 15804 [
16] (Ecoinvent database) were taken into account.
Therefore, the carbon footprint was assessed for each retrofit scenario to evaluate its environmental impact.
Table 10 summarizes the embodied carbon and the social cost of carbon for the existing condition and the proposed retrofit scenarios.
The analysis of the embodied carbon related to the implementation of the proposed retrofit scenarios highlights the environmental impact increase for all the scenarios except S3 and S7. As shown in the previous sub-section, the replacement of the HVAC system leads to a decrease in the use of natural gas and, therefore, a decrease in CO2 emissions in the long term.
Scenario S9, which combines all the strategies, involves a small increase in embodied carbon due to the implementation of new materials and technologies for the retrofit and their final disposal, including transportation to the landfill, which negatively balances the benefits during operation. However, a significant decrease is obtained in the social cost of carbon due to the environmental impact reduction in the operational phase. Similarly, in scenarios S4, S5, and S8, the use of electricity produced from renewable sources leads to a significant decrease in the social cost of carbon, but the processes of production and disposal of these technologies generate an increase in embodied carbon.
Renewable energy systems are a solution that, as a result of the reduction of non-renewable energy use, allows for a reduction in CO2 emissions over the operational phase. However, the increase in embodied carbon due to production and disposal processes has a higher environmental impact when considering the entire life cycle. Therefore, it appears necessary to improve the manufacturing process of these technological solutions to make them really sustainable.
5.3.4. Investment Costs
The predicted investment cost for S1, i.e., the opaque envelope retrofit, is about EUR 400,000, including both the materials and the intervention costs. Similarly, the investment cost for S2, i.e., the improved transparent envelope, is about EUR 300,000, including both the materials and the intervention costs. The investment costs of scenarios S1 and S2 were derived from the sum of the calculation of the standard reference costs of materials and intervention based on “Regional prices of Regione Basilicata” [
45]. The expected investment cost for S3, i.e., the new HVAC system for heating, cooling, and ventilation, is about EUR 600,000, including both the materials and the intervention costs. The calculation of the investment cost in this scenario was based on standard average costs for an HVAC system with the same characteristics. This calculation provides a cost of about EUR 92/m
2 for S3. Even when considering national incentives for building energy efficiency, the investment payback period for S1, S2, and S3 is over 20 years.
For the photovoltaic system (S4), the calculation of the initial investment was carried out based on a deep market investigation that led to the estimation of the cost of EUR 2400/kWp. Therefore, the total initial investment is EUR 128,000 for the 56 kWp installed. The market investigation showed that the electricity price was EUR 0.25/kWh at the time of the analysis. Following the NPV method, the CF is about EUR 13,433. By taking into account the 50% tax incentive currently available in Italy for renewable energy system installation, the payback period is 8 years, which is quite advantageous.
In the case of the solar thermal system (S5), the market investigation showed that the natural gas price was EUR 0.11/kWh. In this case, the size of the plant was 47 m2 and 5.22 kWp at a cost of EUR 2000/kWp, so the initial investment is about EUR 10,444. By taking into account a reduction of natural gas consumption of 91% with this intervention, the CF calculated is about EUR 1411, according to the NPV method. Therefore, the economic feasibility study shows that it is possible to have a favorable payback period of 6 years.
Scenario S9 has a payback period of 18 years, taking into account the costs of all the necessary interventions. This duration can be justified by the building’s useful life of 50 years and by the fact that scenario S9 enables the year-round operation of the building. Given the current conditions, an 18-year return on investment is acceptable.
6. Discussion
Considering the complex development of multi-data analysis, it is necessary to analyze the above-mentioned results comprehensively. This approach allows for identifying the scenario that more efficiently achieves the multi-parameter benefits considered as a whole. Indeed, these aspects may involve contrasting results.
In other studies, such as [
46,
47], interesting methodologies have been presented for indoor comfort and energy-saving analysis, but without considering the environmental impact or the cost of interventions. In this study, the dynamic multi-parameter analysis simultaneously combines crucial results in indoor comfort, energy savings, environmental impact, and intervention costs. The multi-data analysis approach can sometimes result in the selection of solutions that favor certain parameters while penalizing others without neglecting them. Furthermore, the BIM approach offers the advantage of obtaining comprehensive knowledge about the interventions to be implemented. The integration of BIM modeling provides real-time and historical control over the building model and its characteristics, enabling a thorough analysis of all building components [
30]. The potential of BIM in this study greatly facilitates future energy management processes.
Scenario S1, on the one hand, shows a small increase in indoor comfort during the summer and a small decrease in energy consumption. On the other hand, it leads to a small increase in embodied carbon, which is not sufficient to provide comfortable conditions in winter.
Scenario S2 provides negligible improvements if not combined with other strategies. For instance, S7, which involves the combination of S1, S2, and S3, shows significant improvements in indoor comfort. Indeed, in a building characterized by high internal hygrometric loads, if the retrofit of the windows is not combined with a humidity control system and proper, effective mechanical ventilation, the users are led to open the windows for several hours during the day—even with unsuitable outdoor conditions—thus affecting comfort conditions and energy consumption, nullifying the benefits of improved thermal insulation.
Section 5.3.1 showed that to achieve acceptable levels of indoor comfort all year, scenario S3 is an essential strategy. Therefore, if the building is operating for the entire year, a new and properly sized HVAC system is necessary since the current system provides only heating and is undersized. Accordingly, to extend the time of use of the building during the entire year, at least scenario S7 is necessary to provide the required comfort conditions with lower energy use compared to scenario S3.
Furthermore, the implementation of renewable energy generation systems (both PV systems (S4) and solar thermal systems (S5)), in addition to energy conservation measures, involves fundamental energy savings in this application and a decrease in the social cost of carbon, with an appreciable payback period. Scenario S8 provides high energy efficiency and a 22% reduction in carbon emissions. The reduction in energy consumption and embodied carbon is mainly attributed to the on-site production of renewable energy through the utilization of both the photovoltaic system and the solar thermal system. However, scenarios S4, S5, and S8 do not bring improvements to acceptable comfort levels in winter if implemented alone. By the way, comfort remains acceptable in the summer, as in the existing condition. Therefore, scenario S8 can be considered the best solution with the limited summer opening of the SPA (as it is now). Indeed, as previously shown (
Section 5.3.1), the building is already able to provide a satisfactory level of thermal comfort to its occupants in the warm season. In the case of maintaining the same opening period, when the building already meets acceptable indoor comfort standards, it is advantageous to focus on maximizing energy efficiency and carbon emissions reduction. In this case, the integration of renewable energy systems in S8 allows for significant energy savings and a substantial reduction in carbon emissions without negatively impacting the comfort levels experienced during the summer season.
By maximizing energy efficiency without sacrificing comfort during the summer, scenario S8 presents a balanced approach that can yield positive environmental and economic outcomes. It ensures that the structure remains environmentally friendly and economically viable while continuing to provide a comfortable living or working environment for its occupants during the current operating period.
S9, instead, is the scenario that maximizes building energy efficiency and indoor comfort all year round. Therefore, if considering annual indoor comfort and energy performance, scenario S9 is the most appropriate solution, also due to the lower environmental impact. It allows 9% of electricity consumption savings and almost 100% of gas consumption savings, as well as comfort levels in both summer and winter. The investment costs are also acceptable—strategies with high payback periods are already required to ensure thermal comfort.
All in all, with the existing building operating period (only during the warm season), scenario S8 turns out to be the best retrofit solution because it maximizes energy savings and environmental impact reduction, with acceptable comfort conditions during the opening period, and with an appreciable payback period for the investment.
However, for the building to be operational throughout the year, scenario S9 is essential to ensure proper functioning during the winter. Currently, the building lacks a suitable heating system, which, when combined with a thermally insulated envelope, is necessary to provide comfortable conditions all year-round while minimizing energy consumption. During the monitoring campaign, it was observed that internal temperatures in the current condition reach a maximum of 17 °C during winter, with even lower temperatures during most of the hours of the day. However, according to the reference standard [
48], buildings intended for SPA purposes should maintain internal temperatures above 22 °C in the winter. Implementing scenario S9 incurs higher investment costs and embodied carbon compared to other scenarios, but without it, the building cannot be used during the winter.
On the other hand, extending the building’s operational period throughout the year has the potential to increase specific economic profitability and benefit the local tourism sector, providing a positive impact on the whole surrounding area. However, the cost/benefit effectiveness of this solution requires further verification through detailed economic and profitability analysis, which is beyond the scope of this study.
In all the scenarios, it is important to acknowledge that human-building interaction can influence the results [
49,
50,
51]. However, in the specific case study of a SPA facility, occupants have limited control over the operation of the main energy systems, equipment, and other interfaces, and their behavior does not impact the production of renewable energy systems. Therefore, variations in occupant behavior may have only a slight effect on the predicted results. Significant occupant control over building interfaces is limited to the office areas of the building, and in those areas, the real occupants’ behavior was taken into account through the calibration process.
7. Conclusions
This study introduces an approach that utilizes dynamic multi-data and parameter analysis, integrated with advanced Building Information Modeling (BIM) techniques, to evaluate the energy performance of existing buildings and determine the most effective retrofit strategies. By considering various aspects related to building energy efficiency and environmental sustainability, this approach achieves a balanced improvement in indoor comfort, energy efficiency, environmental impact reduction, and economic feasibility. The methodology was applied to a case study of a thermal bath building, where different retrofit scenarios were analyzed to identify the most effective multi-parameter combination of strategies.
The results of the analysis demonstrated the potential of the proposed approach in achieving energy savings, indoor comfort, and CO2eq emissions reduction with an acceptable payback period. By implementing a solar thermal system for hot water production and taking advantage of the availability of natural thermal water, the case study building achieved a nearly 100% reduction in natural gas consumption and associated GHG emissions. Strategically located photovoltaic panels also contributed to a substantial reduction in electricity consumption, offering important environmental and energy benefits.
To maximize overall performance throughout the year, a combination of passive, active, and renewable energy strategies is necessary. This finding holds relevance for similar buildings with comparable functions and boundary conditions. However, it is important to address the carbon footprint associated with the production and disposal of renewable energy technologies, particularly during the construction phases, to further enhance the environmental sustainability of the proposed solution.
In conclusion, the integration of dynamic multi-data and parameter analysis with BIM techniques provides a valuable tool for evaluating the energy performance of existing buildings and determining preferred retrofit strategies. The findings of this research have practical implications for designing and constructing efficient buildings, particularly in the context of energy-intensive structures such as thermal baths. By striking a balance between energy savings, indoor comfort, environmental impact reduction, and economic assessment, this approach contributes to the promotion of energy independence and environmental sustainability in the built environment.


 ,
, 


