Review

Renewable Energy Supply Chains—Text Mining and Co-Occurrence Analysis in the Context of the Sustainability

Institute of Management, Faculty of Economics, Finance and Management, University of Szczecin, 71-004 Szczecin, Poland
*
Author to whom correspondence should be addressed.
Energies 2023, 16(12), 4761; https://doi.org/10.3390/en16124761
Submission received: 20 April 2023 / Revised: 21 May 2023 / Accepted: 15 June 2023 / Published: 16 June 2023
(This article belongs to the Special Issue Renewable Energy Supply Chain)

Abstract

:
The topic of this study is energy supply chains in the context of sustainable development. The analysis is based on bilateral analysis methodology using the knowledge map visualization tool VoS Viewer and performance analysis. The aim is to investigate whether and to what extent there is interest in the research topic of renewable energy supply chains in the context of sustainability. An analysis of keyword associations, indexes, authors, and places of publication gives an overview of the current state of research in this area. It is valuable and new from the point of view of contributing to the development of the discipline to show the broad spectrum of terms and research topics related to the operation, management, and improvement of energy supply chains. The sustainability context also offers new possibilities for interpretation and application of other management tools in selected chains. Co-dependency and co-occurrence analysis and text mining provide an excellent background for further research in this area. At the same time, it allows data to be refined for further analysis and will provide an excellent starting point for further work in this area.

1. Introduction

Renewable energy supply chains are increasingly becoming part of academic considerations in the field and research area covering the topic of supply chains, particularly in terms of sustainability. Renewable energy is inextricably linked to the notion of sustainability and such a supply chain context. Both aspects play an important role in the literature. Economic changes, political changes, and increasing consumer awareness contribute to the fact that renewable energy supply chains (RESCs) have grown rapidly in recent years due to privatisation, energy market liberalisation, financial incentives, and energy policy initiatives [1].
Achieving sustainability can be made easier, quicker, and more complete if such chains function well, are properly managed, and, at the same time, meet the demands of various pressure groups: consumers, social and environmental activists, and politicians [2].
This does not mean that they do not face problems in their operation or management. The most important of these, in terms of managing them efficiently and effectively, include: a lack of knowledge of how to manage this type of chain, a lack of skills and willingness to share knowledge, a lack of transparency in the chains and transparency of processes, incompetent and inefficient management, as well as a low level of industrialization [3].
The most important feature of renewable energy sources is their renewability. However, it must be remembered that the use of this type of energy must also be balanced, taking into account the various alternatives (including the availability of particular types of energy in the region), as well as the problems of its acquisition, dependent use for production processes, and the trade-offs in management decisions [1]. Renewable energy as an alternative energy source makes it possible to reduce the need for traditional, fossil energy sources and to strive for increased energy efficiency. Renewable energy resources are vast and in constant movement. However, they are variable and unpredictable due to uncontrollable weather conditions and other factors on which electricity resources depend.
Energy supply and these types of chains require a different way of managing them. Traditionally, chain management has been associated with inventory, forecasting, transport, and network optimization [4]. In RESCs, the main focus and main tasks to be managed are the use and distribution of RES. Supply chain management issues must take into account uncontrolled variables and renewable energy performance related to conversion efficiency, which includes storage, distribution, performance, and efficiency of secondary applications [5]. Renewable energy supply chains include typical elements of traditional chain management, such as physical, information, and financial flows. In doing so, they fulfil the role of raising awareness of green production processes, logistics, and products in order to increase their efficiency [2].
The development of the supply chain concept necessitates addressing the topic of renewable energy supply chains and linking new activities in terms of sustainability. As shown in Figure 1, renewable energy and supply chains can be considered from different perspectives. Thus, renewable energy supply chains can be considered as sustainable renewable energy supply chains and renewable energy in sustainable supply chains. Both perspectives incorporate aspects of sustainability, renewable energy, and the supply chain.
This approach allows the supply chain to be viewed from different perspectives with renewable energy as a starting point. It is at the center of interest, and, due to its characteristics, it determines certain approaches, but it can also serve to achieve sustainable development goals.
The purpose of the deliberations is to systematically review and analyse the texts and bibliometric data of scientific articles related to renewable energy supply chains in terms of sustainability, taking into account the context shown in Figure 1. The aim is to investigate whether and to what extent there is interest in the research topic of renewable energy supply chains in the context of sustainability. As part of the deliberations, we identify the most important literature that relates to the research topic under consideration, highlighting the extent of co-occurrence between the most important keywords, authors, and research centers over the last 12 years.
The research gap In this area was identified as the lack of reflections and scientific texts covering the issues raised in the indicated perspective, using bibliometric analyses and text analysis. The identified research gap will allow the expansion of knowledge in the studied scope and research area. At the same time, it will allow the research questions accompanying the objective to be answered. The link between renewable energy, sustainability, and supply chains in the context of the literature analysis makes it possible to show which research directions in this field are preferred and are of interest for renewable energy supply chains with sustainability in mind.
The reflections are accompanied by the first research question. RQ1: Do global sustainability trends also attract research interest in conducting scientific analysis in the area of sustainable energy supply chains, and is renewable energy beginning to play a role in the area of sustainable supply chains? This is following by RQ2: Can research interest in the area of energy supply chains and sustainability be considered in the framework of co-occurrence analyses of keywords in scientific publications? What do the semantic maps in this area look similar to and what do these analyses consider?
The paper is organized as follows. Section 2 describes the methods, including their rationale and the research procedure. Section 3 contains the main results of the research in descriptive form, as well as using bibliometric analysis tools (VoS Viewer) to indicate correlations and to perform a co-occurrence analysis. Section 4 indicates limitation, findings, and future work directions. Finally, the discussion ends with Section 4, which contains the main conclusions.

2. Materials and Methods

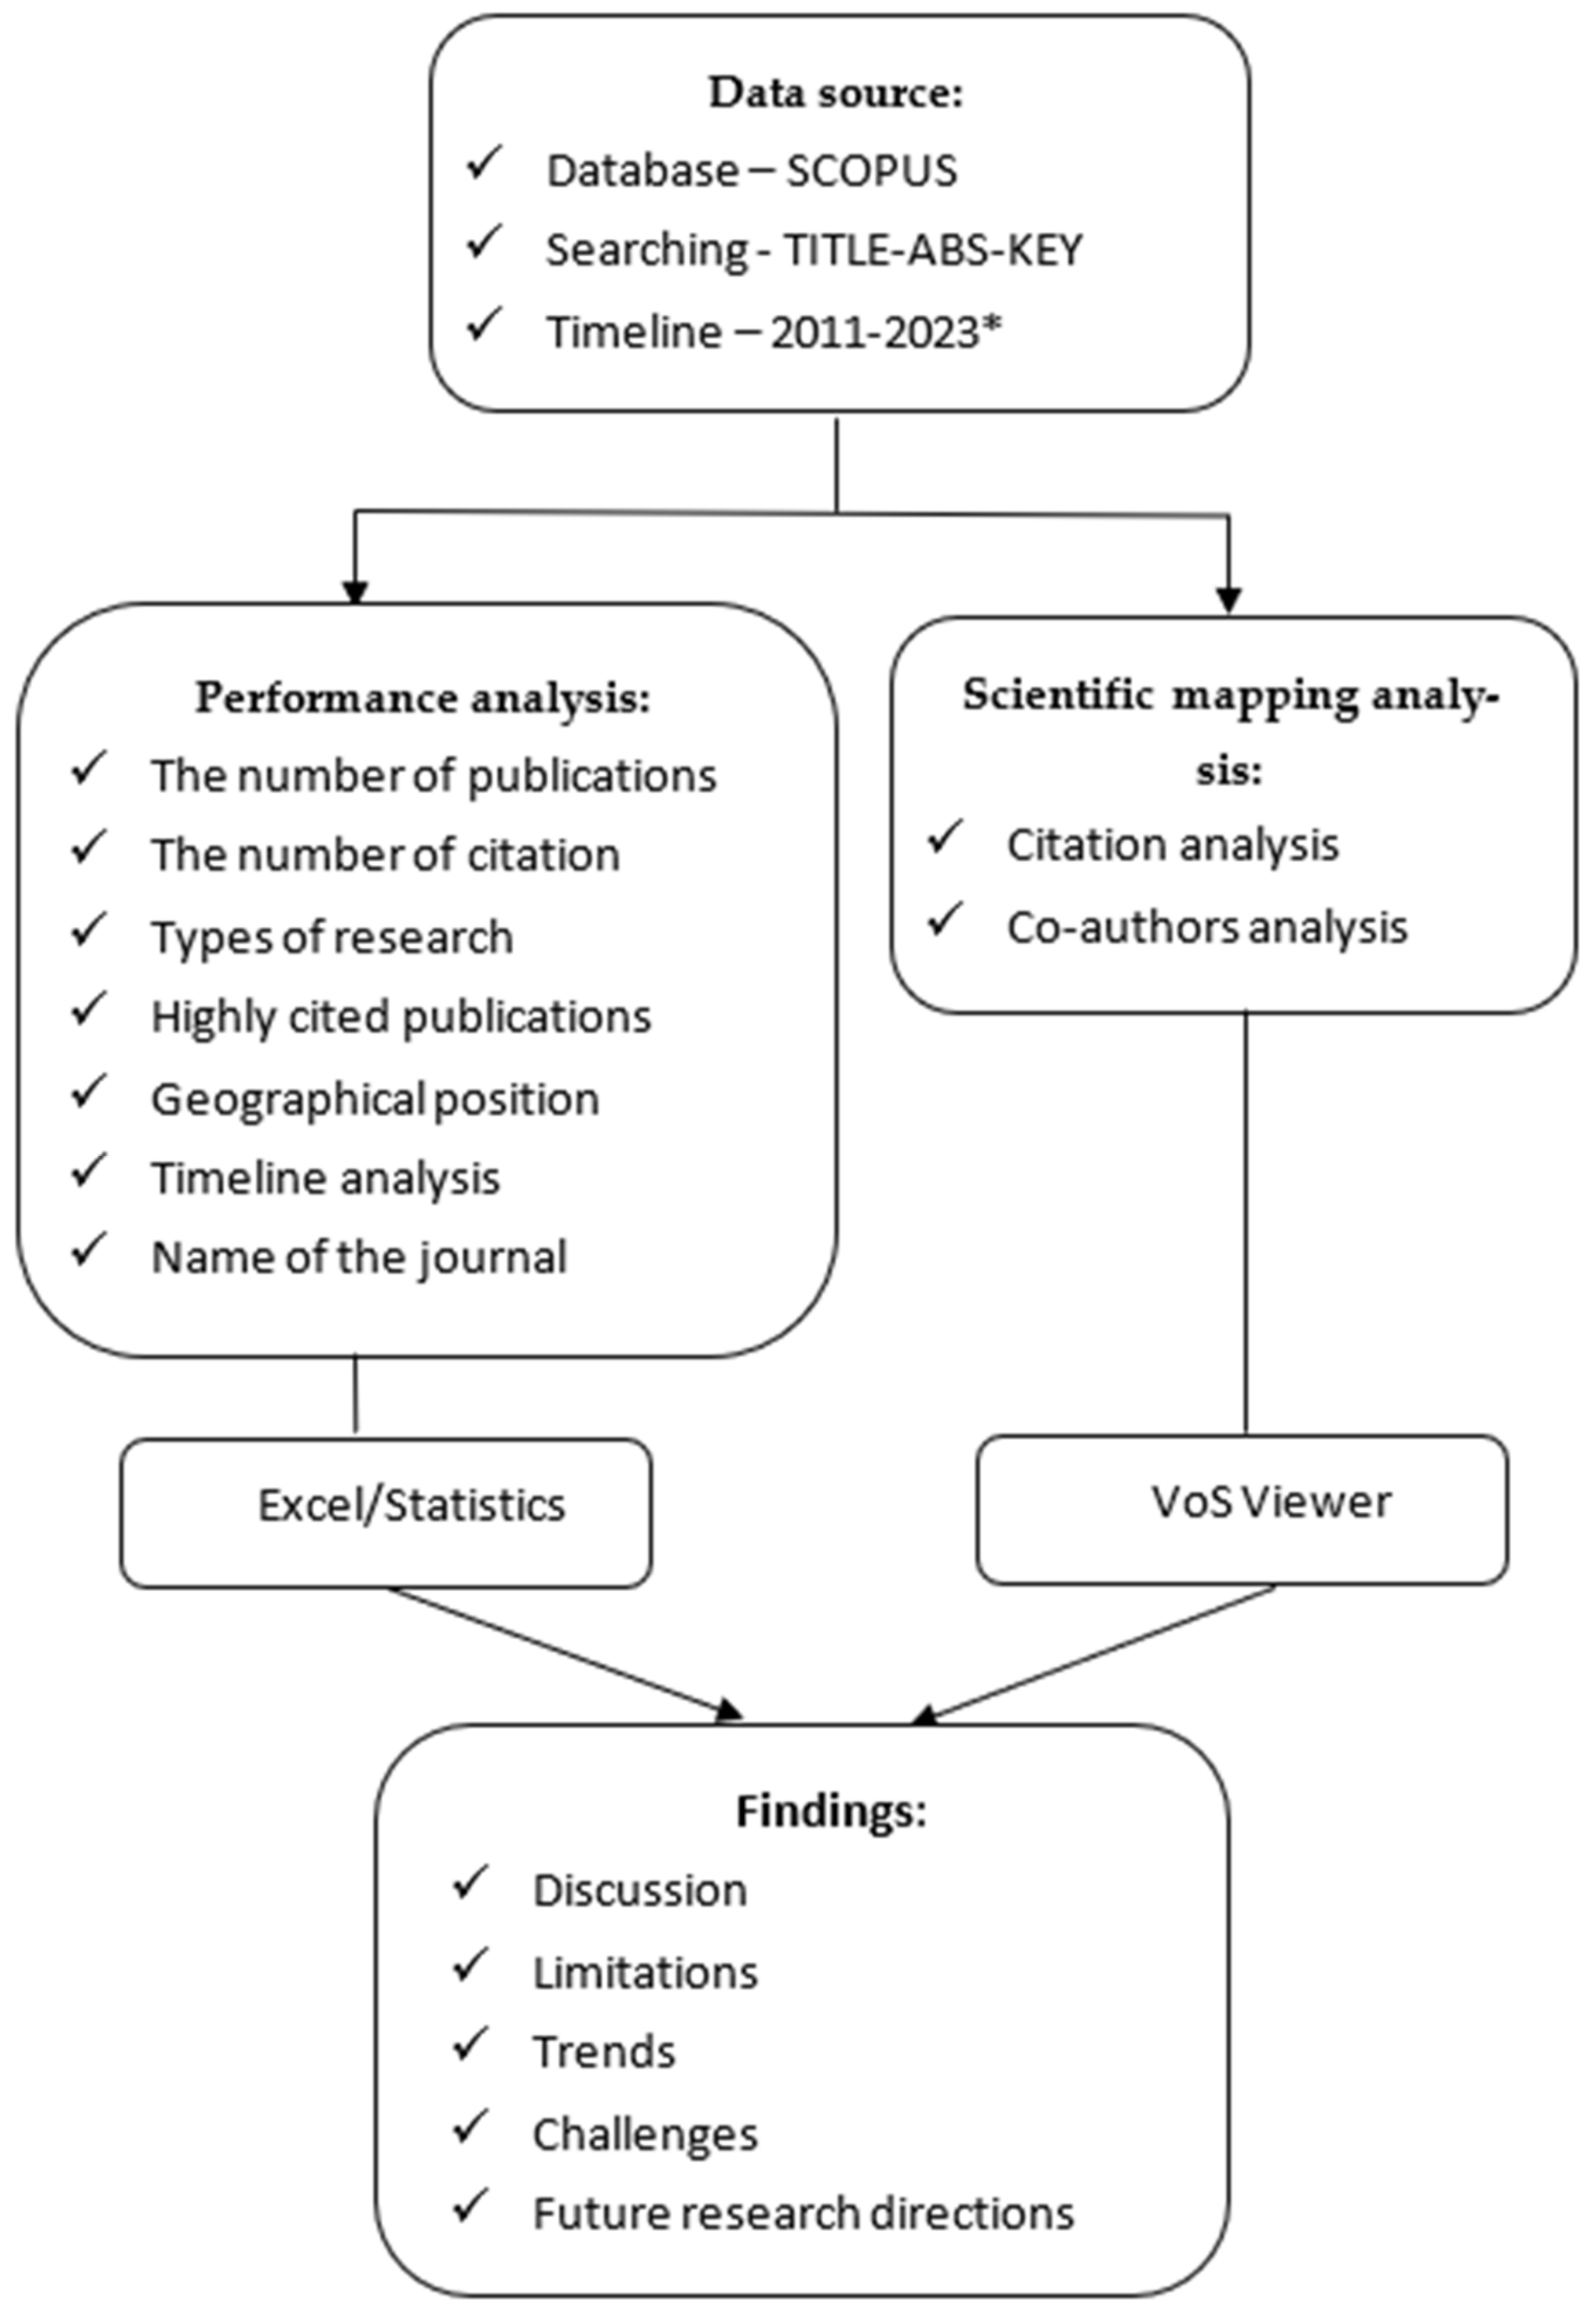
The bibliometric study and data analyses were carried out using data from the Scopus database. Publications published between 2012 and 2022 were included in the study. The bibliometric analysis included quantitative analysis methods on a wide range of topics, including the general aspect of the topic under study, citation, spatial and geographical distribution of publications and author affiliations, co-citation, author networks, and keyword analysis. In addition, in order to better illustrate the subject under study, the paper uses the method of mapping science in terms of bibliometric analyses [6] using the VOS Viewer tool [7,8]. It should be pointed out that the study was based on a systematic review of the literature [9] to enable replication of the research in other areas, or to be able to extend it in the future, or to use it for comparisons, including in the context of changes in the scope studied over time. Once the research gap was identified, the data for the study was selected and matched, the specific categories used for the subsequent quantification and analysis of scientific publications in the study area were identified, followed by the preparation of the bibliometric analysis, research benchmarks and opportunities and directions for future research. The bibliometric preparation and analysis were based on a four-stage methodology [10], in which (1) keywords are defined, (2) data are formatted and cleaned, (3) a preliminary analysis is performed, and (4) a final analysis is performed. The research framework of the methodology is shown in Figure 2. The research was based on the Scopus database, using a search covering: title, abstract, keywords. The selected database allows for citation analysis and includes journals from the Web of Science database, as well [11].
The research process for selecting publications and the constraints that were applied was as follows. The unit analysis for this. Publications only in English were taken into account. Publications from 2011 to 2023 (until 31 March 2023) were selected. When searching for data needed for analyses, the following were taken into account: “title, abstract, keywords”, found in the already indicated SCOPUS database. Document types were limited to: “ar”, “ch”, “cp”, “re”, and “bk” (article, chapter, conference paper, review, book chapter). In terms of fields and areas of publication, after analysis of the individual articles found there, due to the lack of connections with the main topic of the study, this scope was limited, and publications from subareas were excluded: “CHEM”, “BIOC”, “IMMU”, “MEDI”, “EART”, “MATE”, “ARTS”, “PHYS”, and “PSYC” (Chemical Engineering, Biochemistry, Genetics and Molecular Biology, Immunology and Microbiology, Medicine, Earth and Planetary Sciences, Mathematics, Arts and Humanities, Physics and Astronomy, Psychology). The following keywords were analysed by TITLE-ABS-KEY (“Title, Abstract, Keywords”): “renewable energy” or biomass or “bio-energy” or “biofuel” or “bioenergy” or “wind power” or “wind energy” or “solar energy” or “solar power” or “geothermal energy” or “heat energy” or “ocean-energy” or “hydropower” or “water- energy” or “water power” or “landfill gas” or “biodiesel” or “ethanol” or “photovoltaic cells” or “renewable resources” or “biogas” or “bioethanol” or “hydroelectric power” or “supply chain” or “sustainability”. The choice of keywords was based on an analysis of previous publications in this area [2,12,13]. This search identified 230 papers, and they were directly related to the scope of this review.
The study used a publication concentration analysis approach using performance analysis. The second context is thematic analysis, in which the content of the articles (keywords, abstracts, and titles) was examined and, based on this, conceptual maps of keywords and keyword co-occurrences were created, as well as linkage maps between authors and research affiliations (countries).

3. Results

3.1. Bibliometric Performance Analysis

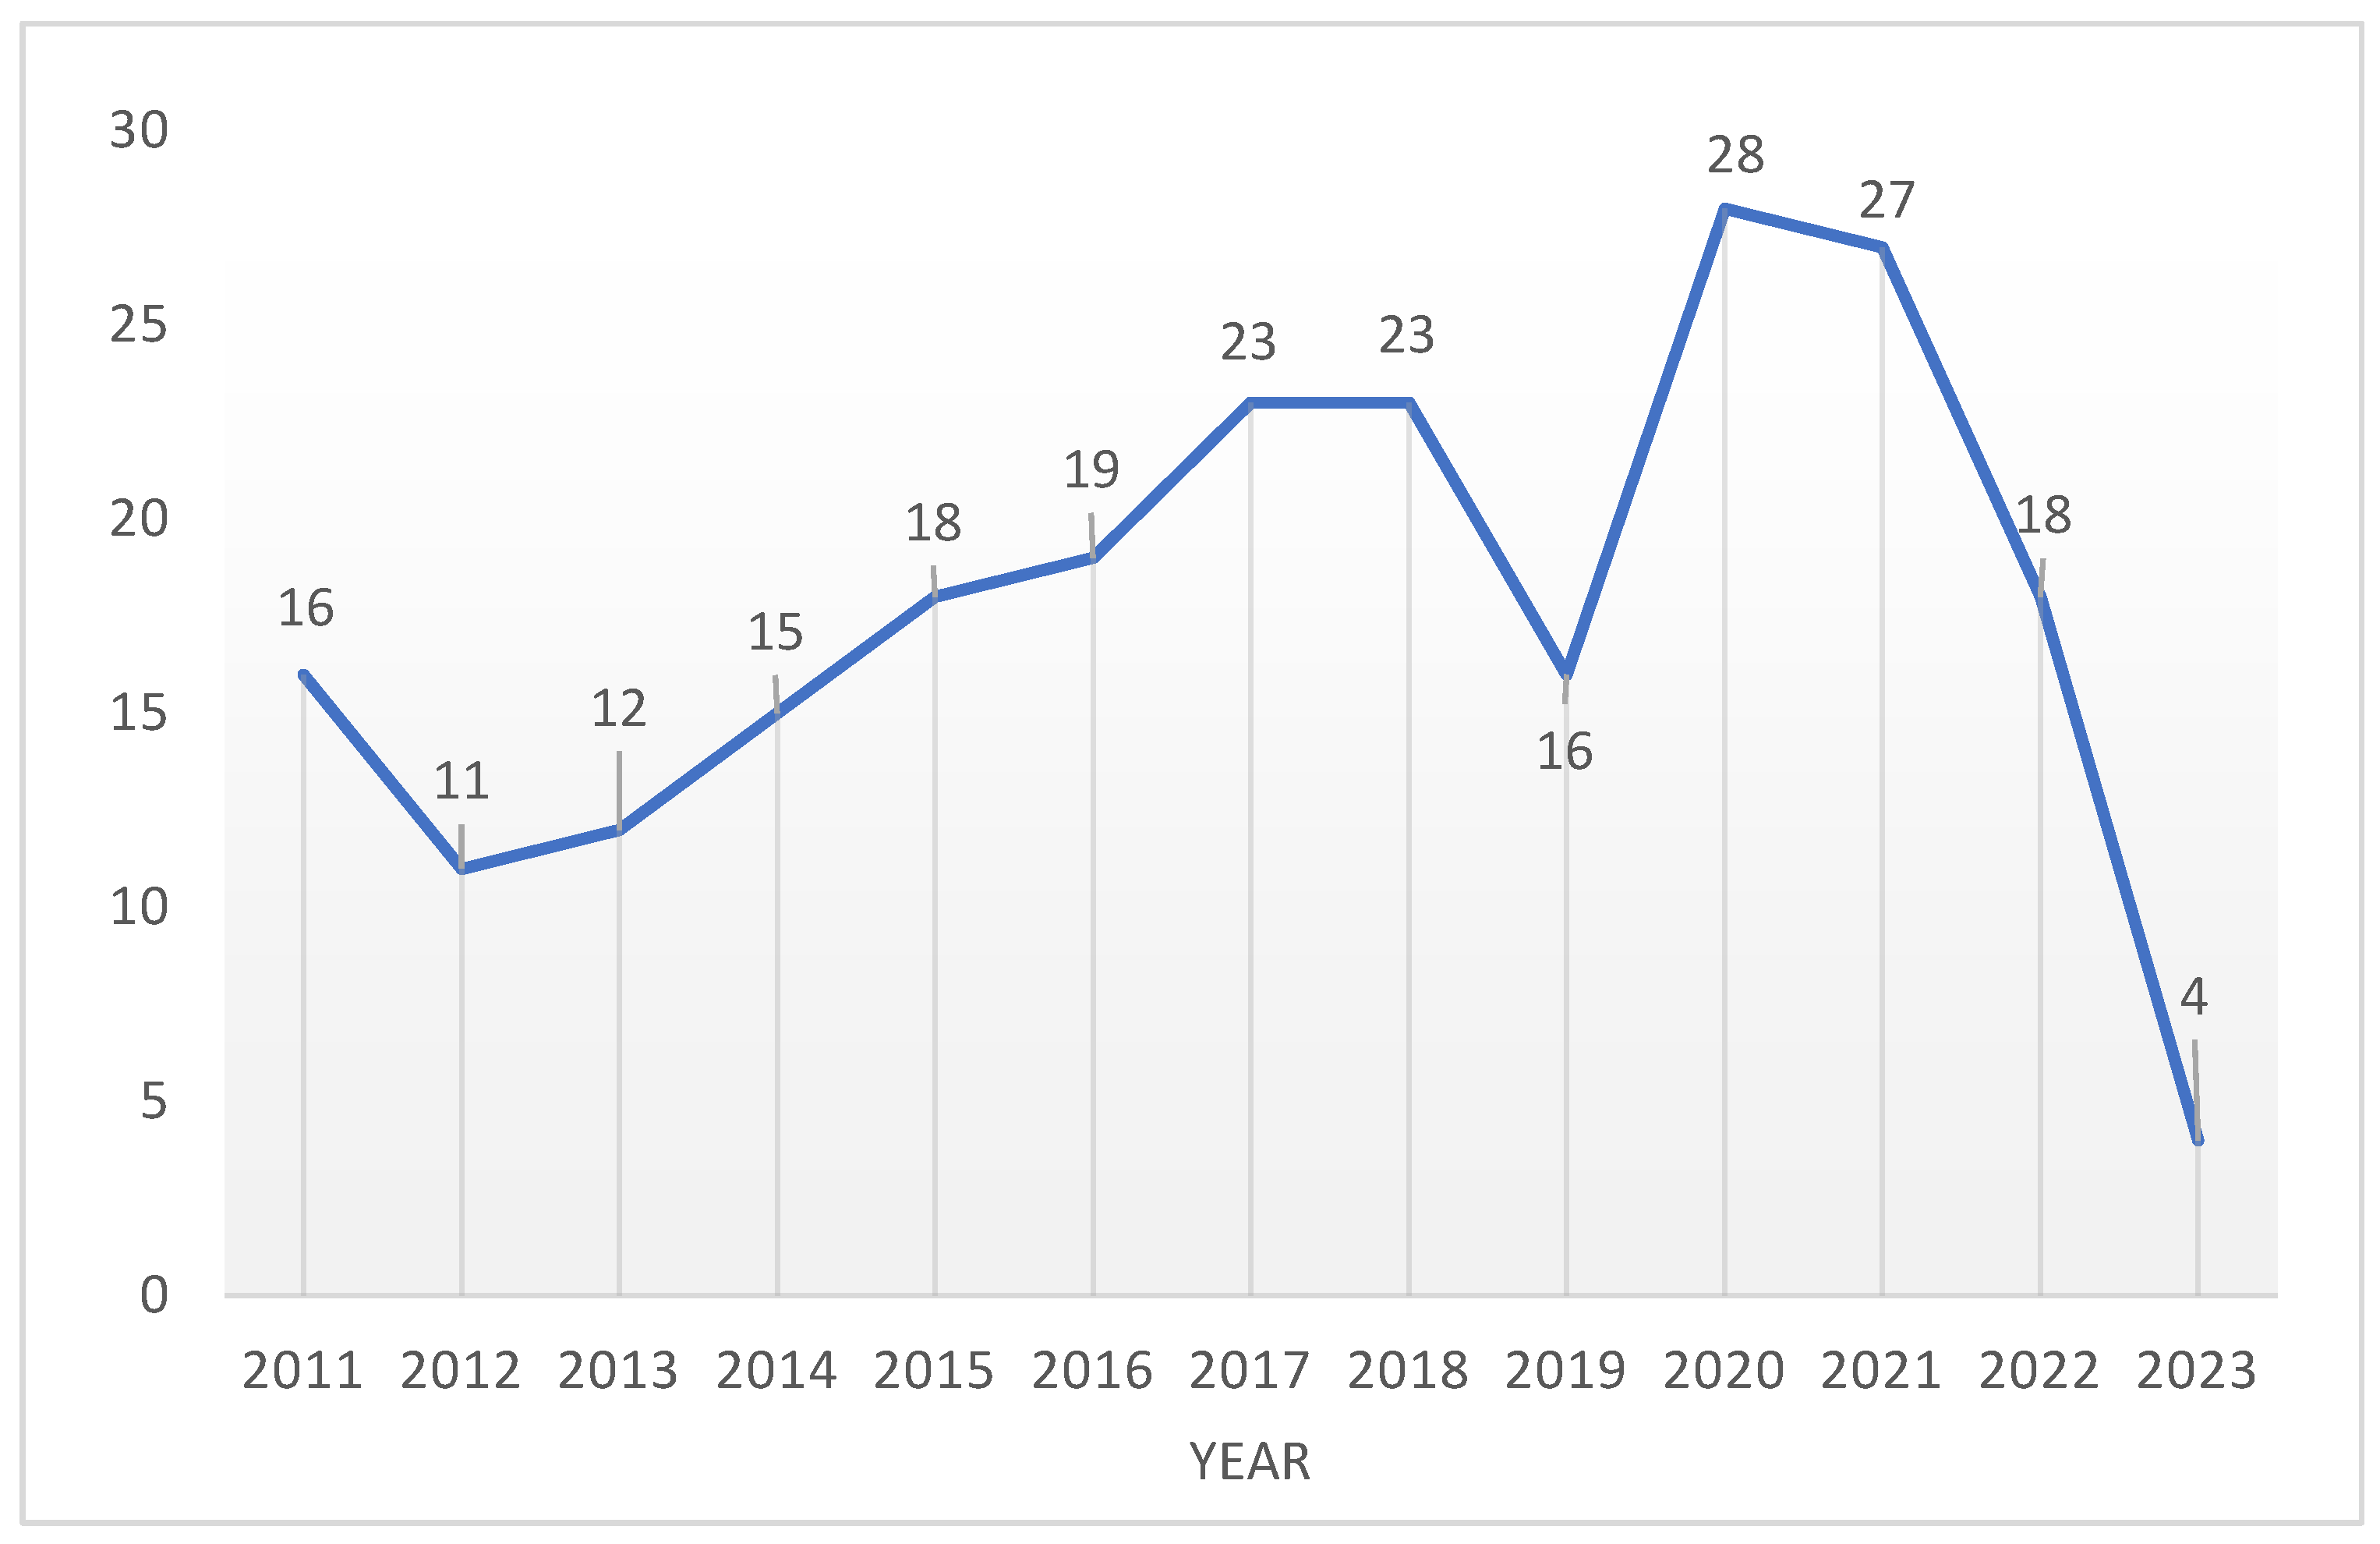
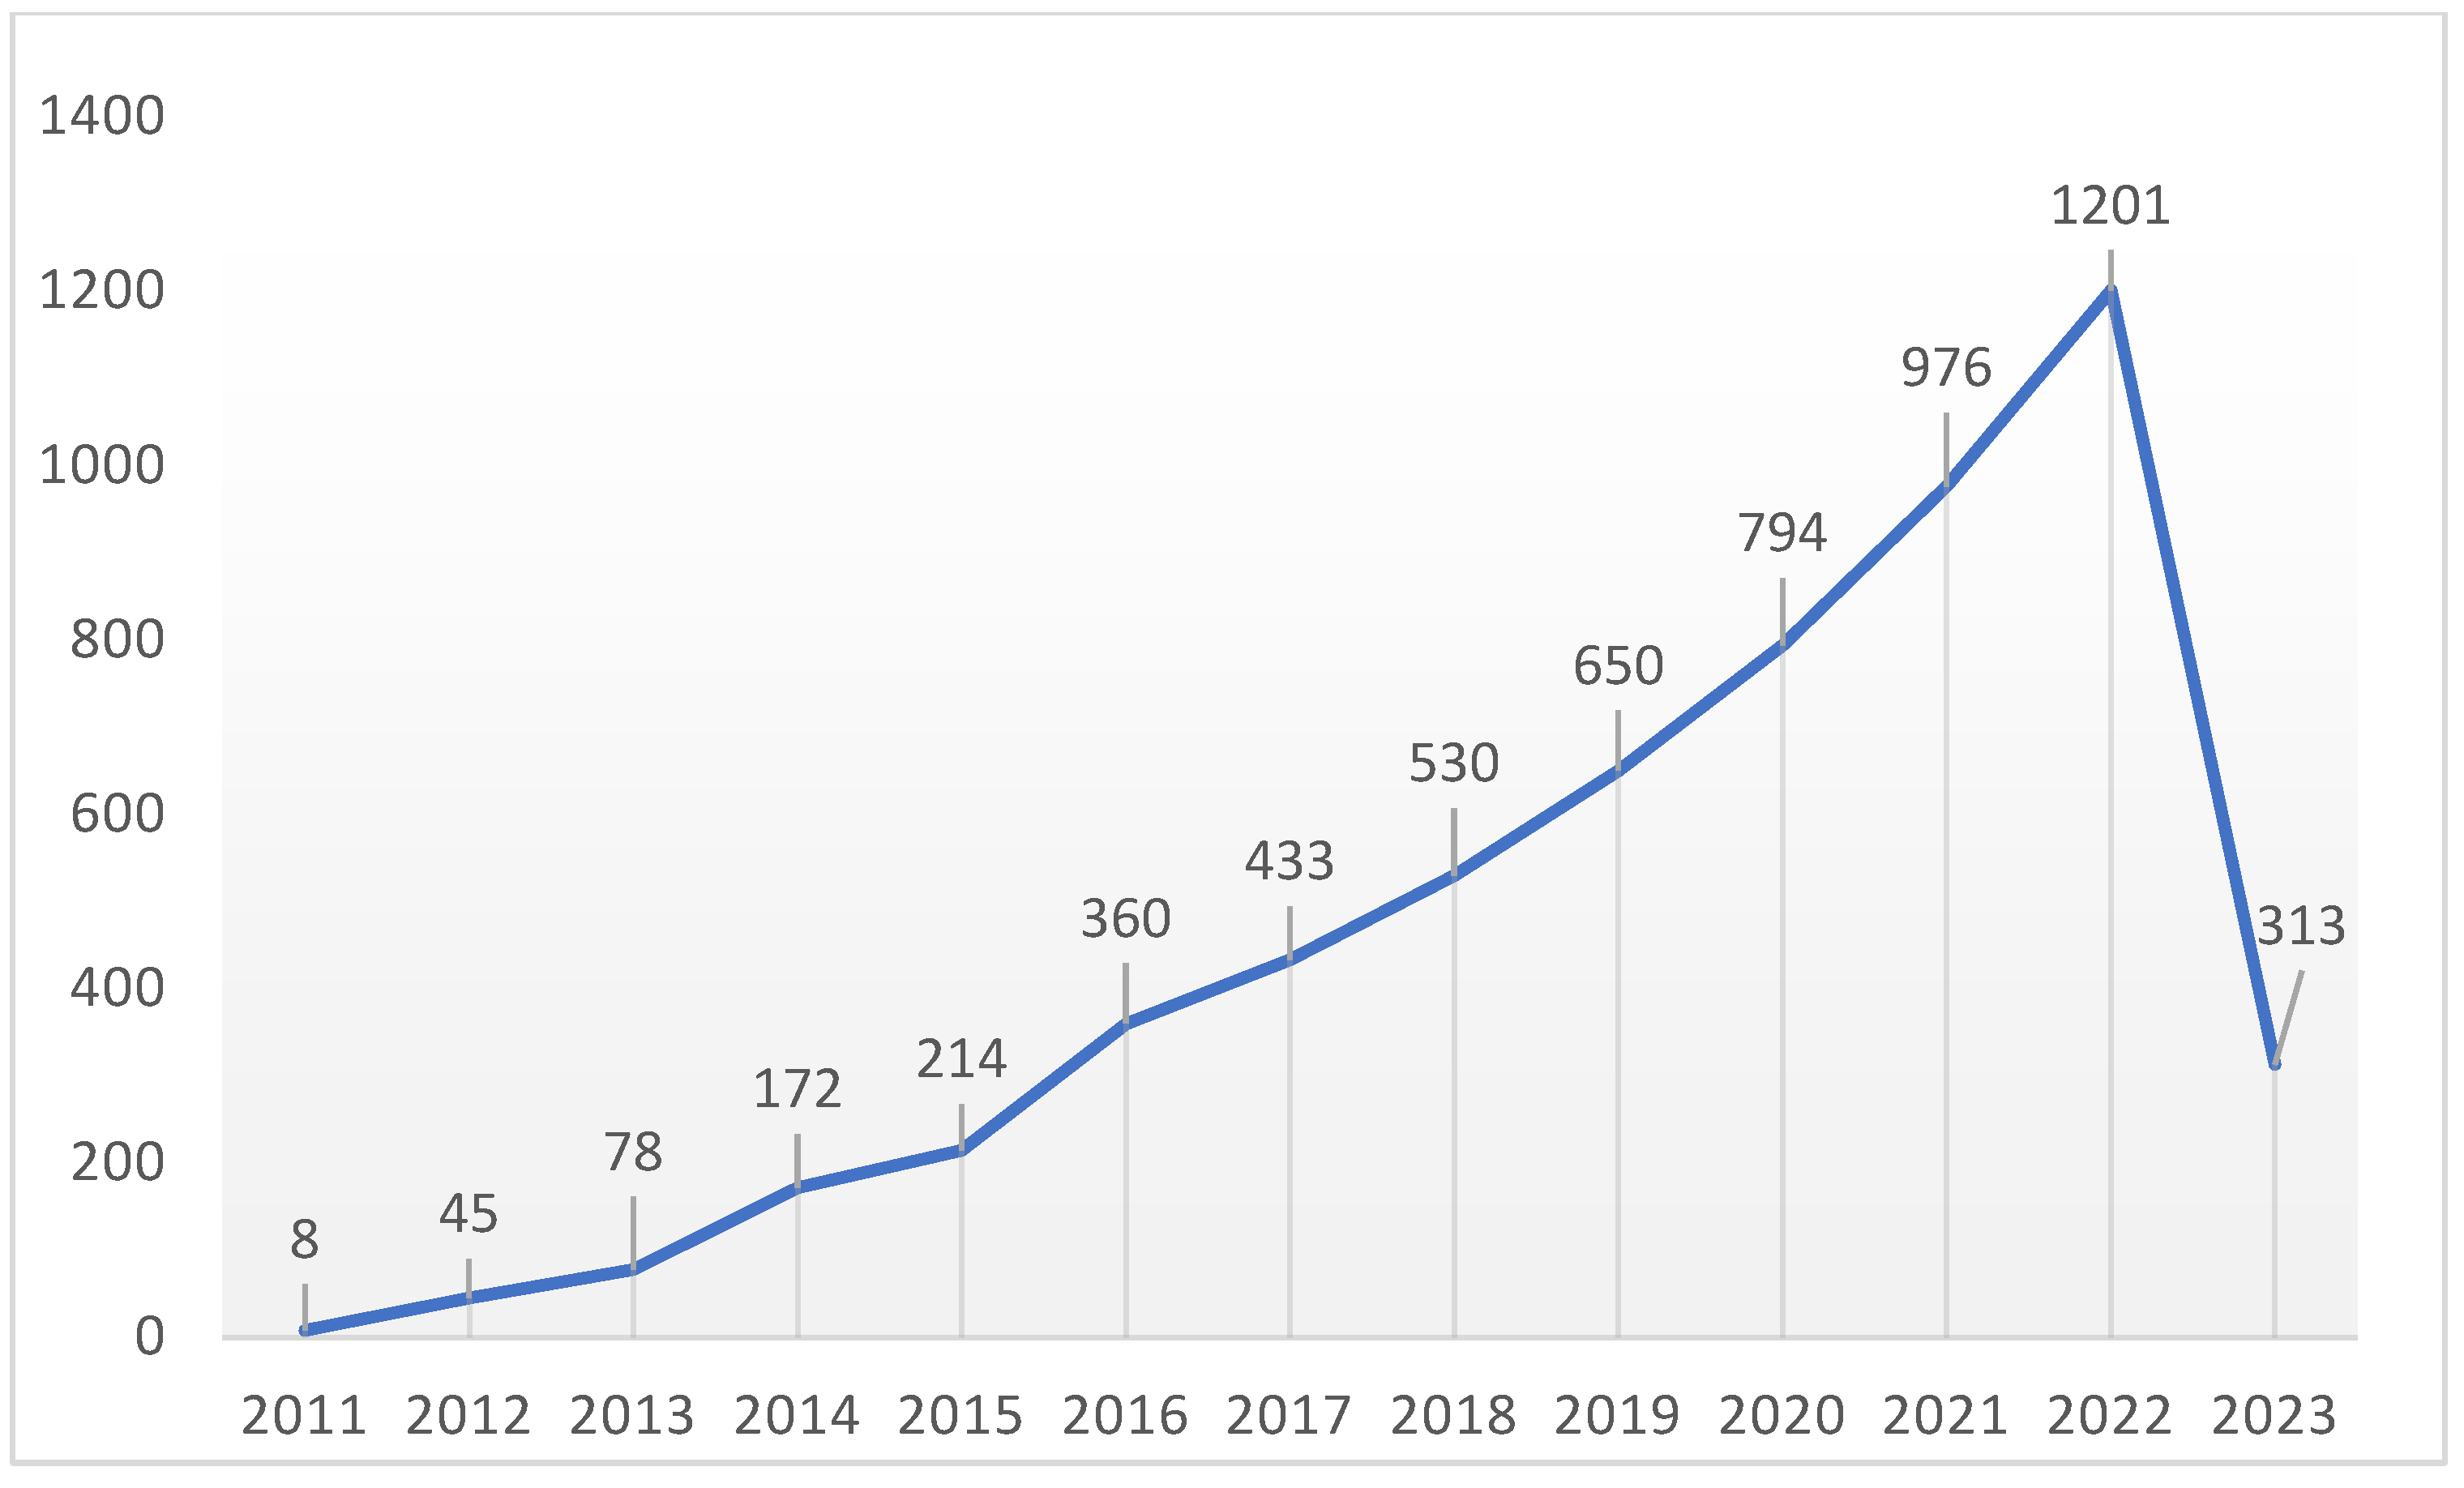
This section provides a performance analysis, which is based on activity indicators to measure the productivity and influence of publications through item analysis (country, institution, author, annual indicators, types, research areas, highly cited publications) [14,15]. This section presents bibliometric analysis results of the 230 selected papers. The number of publications showed an overall slow upward trend. There are no more than twenty publications before 2011, and Renewable Energy Supply Chains (RESCs) have not become a popular trend in recent years (Figure 3).
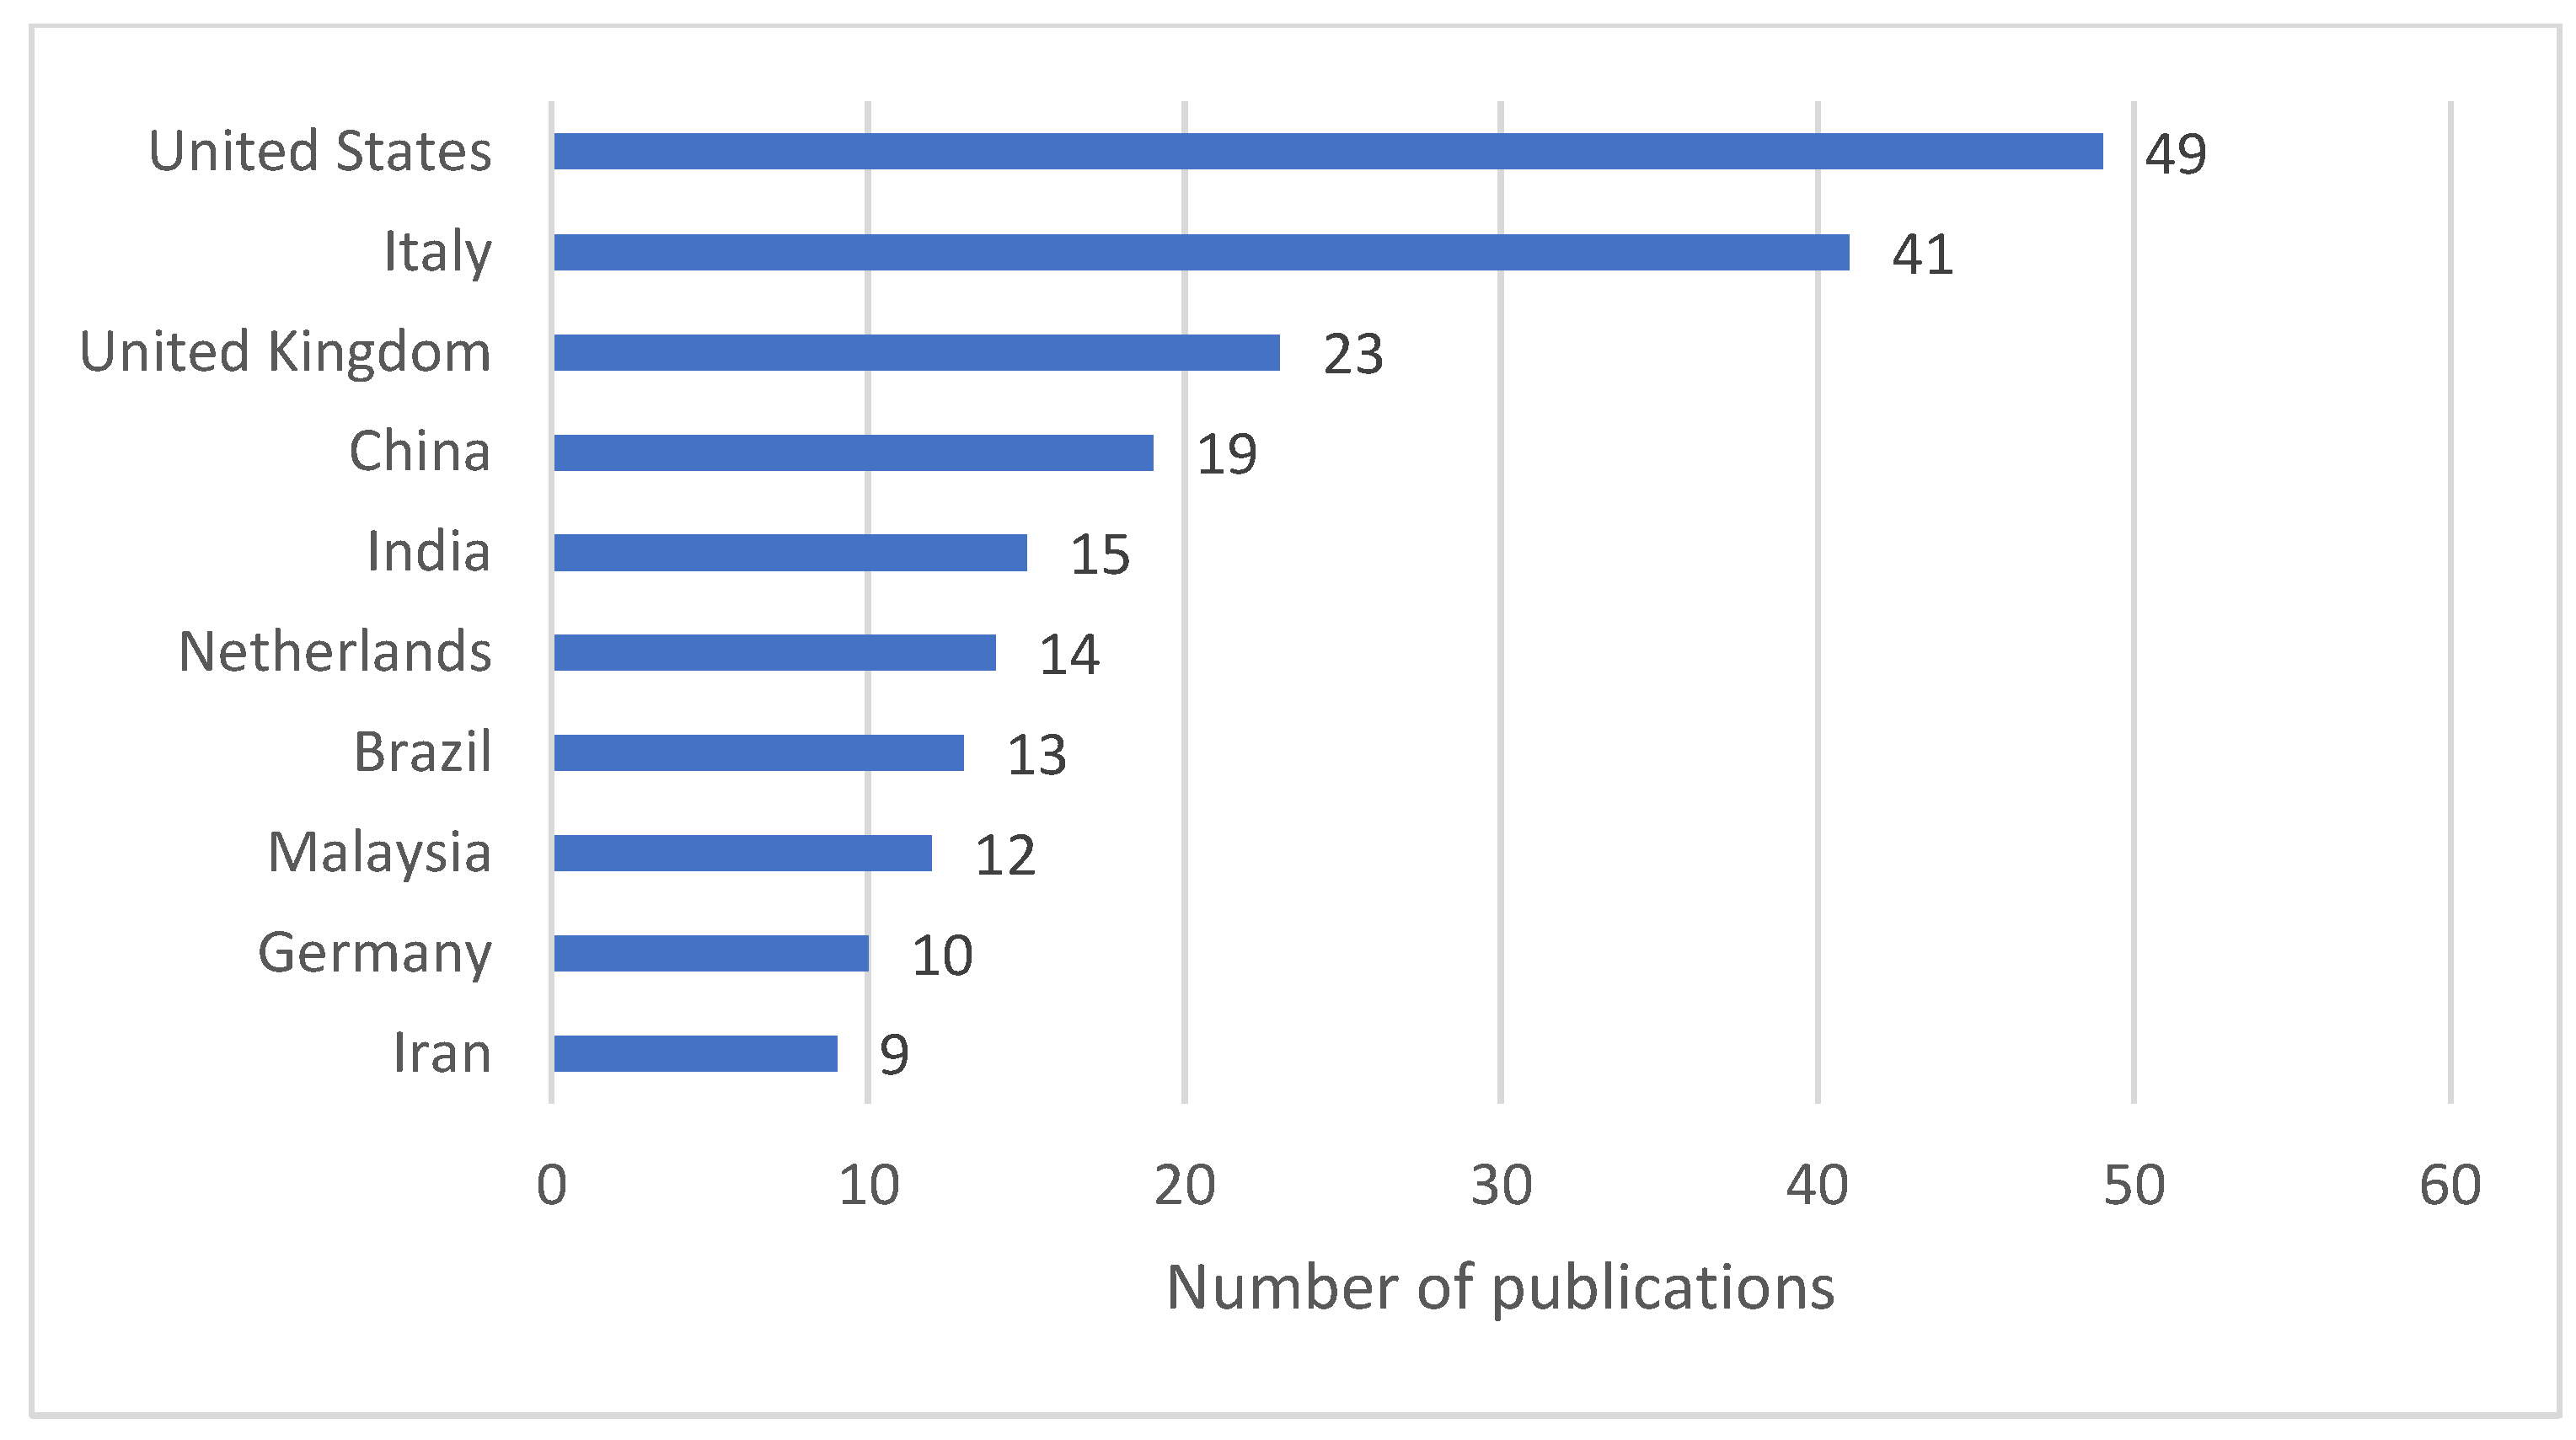
Figure 4 shows the number of publications by country (as a country of origin of the first author). It can be seen that the United States and Italy are definitely leading the way in describing the subject of RESCs. The next countries with the highest number of publications are United Kingdom, China, and India. It can be seen that, in the top 10, there are countries from all major continents. However, as shown in Figure 3, the total number of publications is not large.
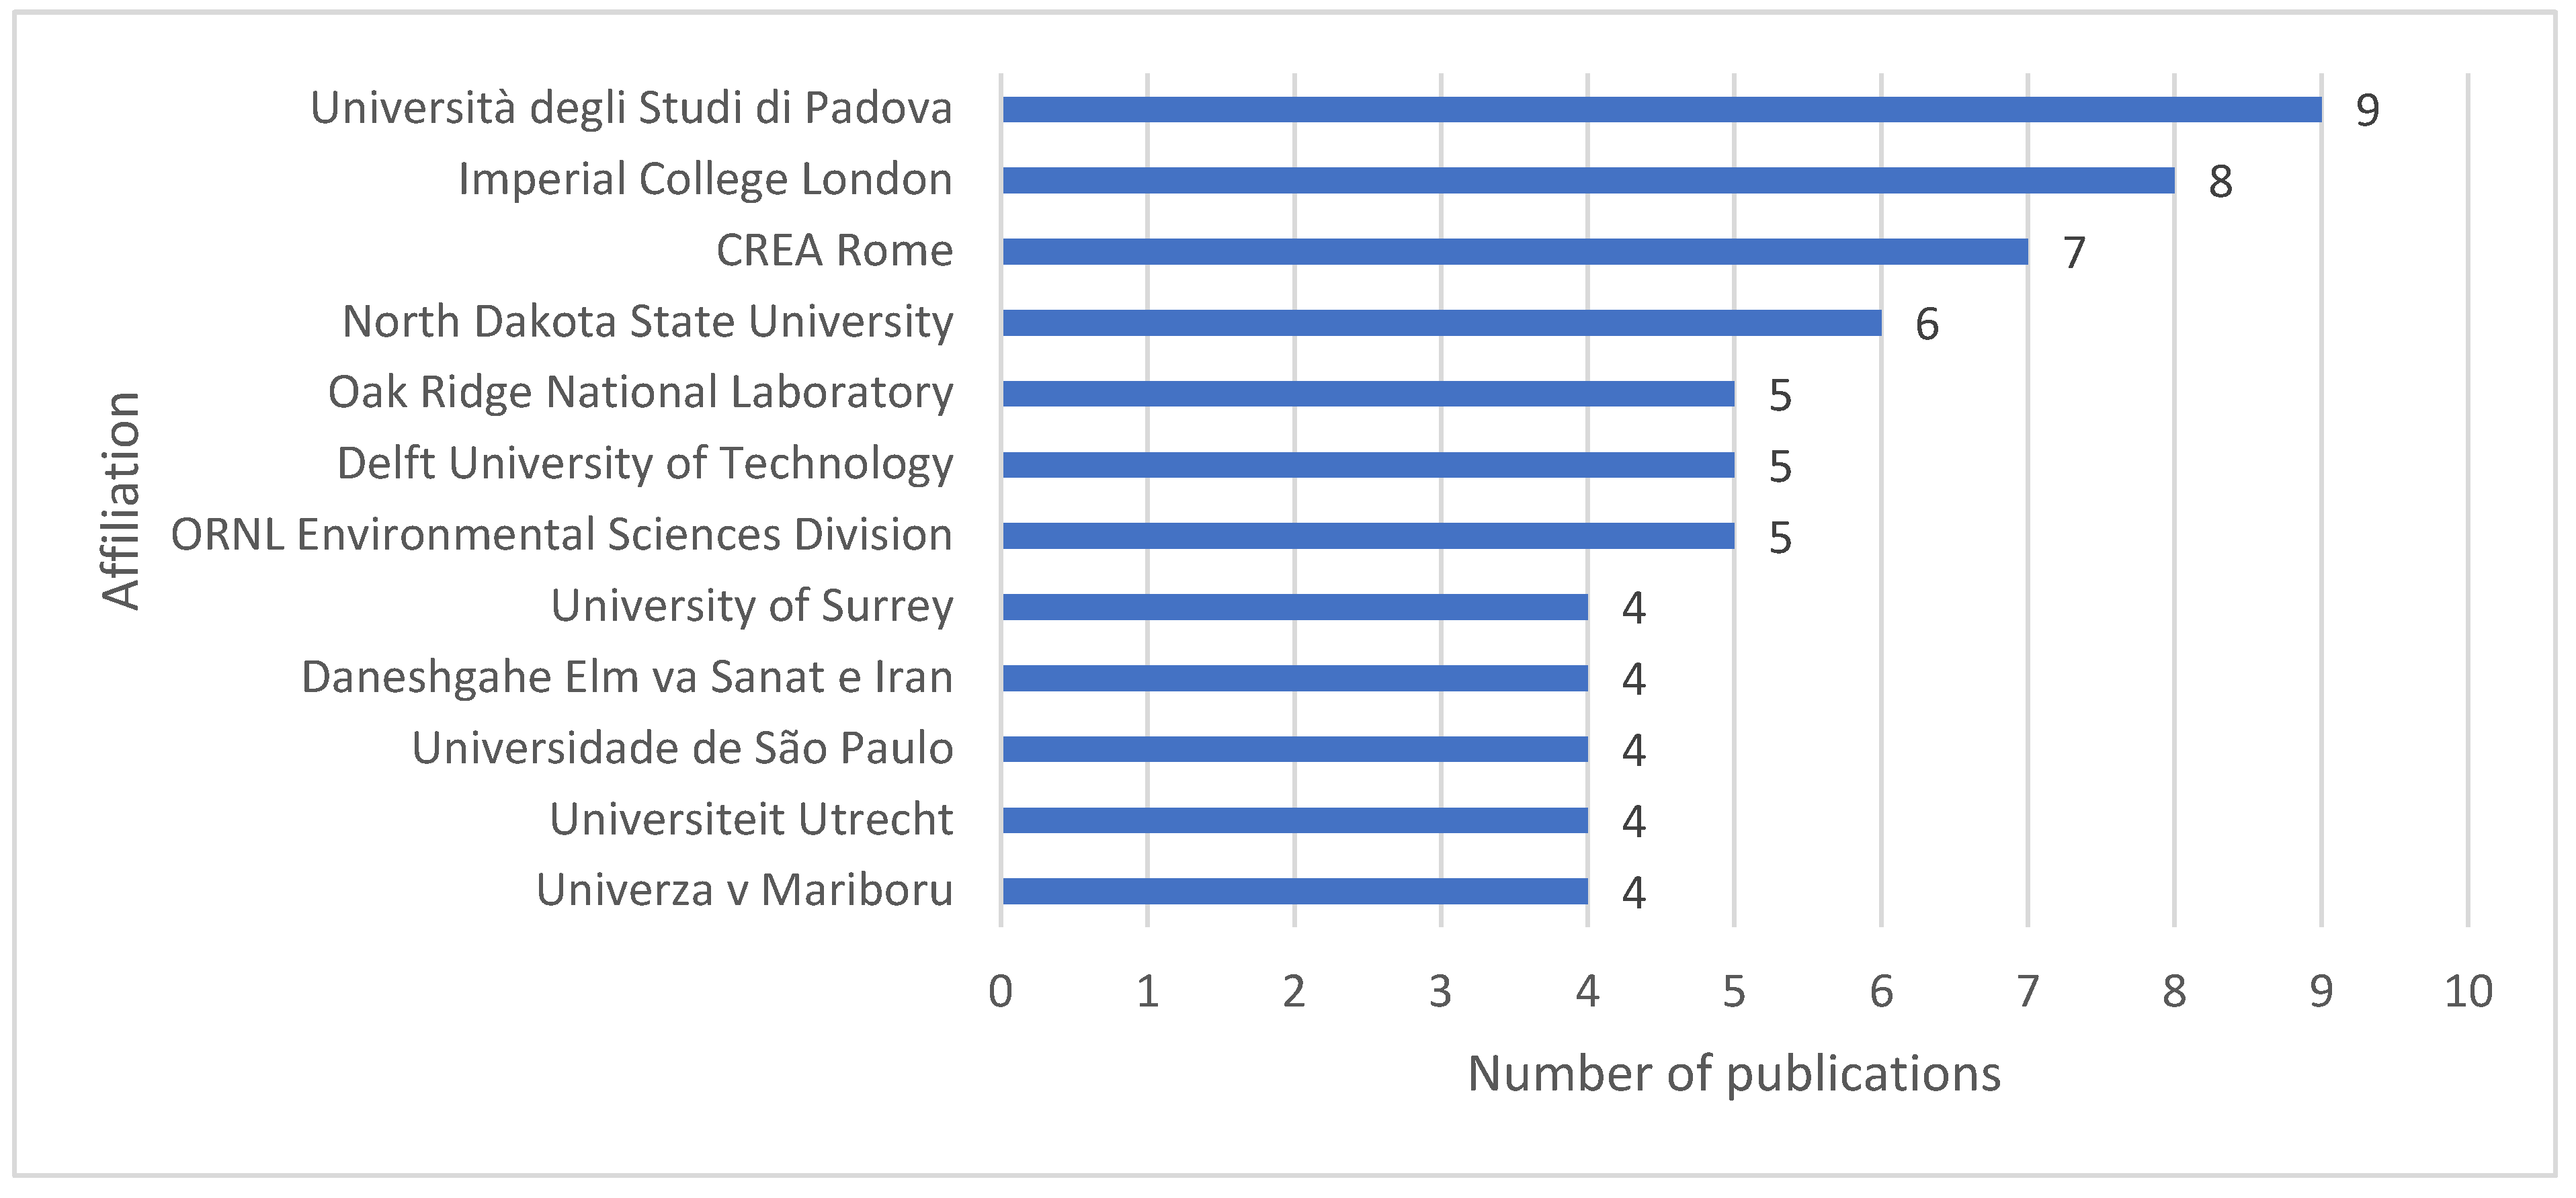
In Figure 5, you can see the 12 research centers from which the first author of the publication came. Subsequent institutions had only three or fewer articles. The top three are: Università degli Studi di Padova, Imperial College London, Consiglio per la Ricerca in Agricoltura e l’Analisi Dell’Economia Agraria CREA Rome. The placement of the institutes with the highest number of publications coincides with the data in Figure 4 on countries of origin (the top five include institutions from Italy, the Unified Kingdom, and the United States).
The average increase in the number of citations compared to the previous year (of the last 8 years since 2013) was 28.3%. This gives a steady increase in the number of citations (Figure 6). However, there has not been a time when there has been a rapid increase in the number of citations on this topic, which still gives a wide scope for research in this area.
In the SCOPUS database, publications are categorized by specific types. The distribution of publication types on the search query (RESCs), presented earlier, is shown in Table 1. Five publication types were distinguished, with articles having the largest share (162, 70.4%). This is followed by book chapters (twenty-four, 10.4%) conference papers (twenty-two, 9.6%), reviews (twenty, 8.7%), and books (two, 0.9%).
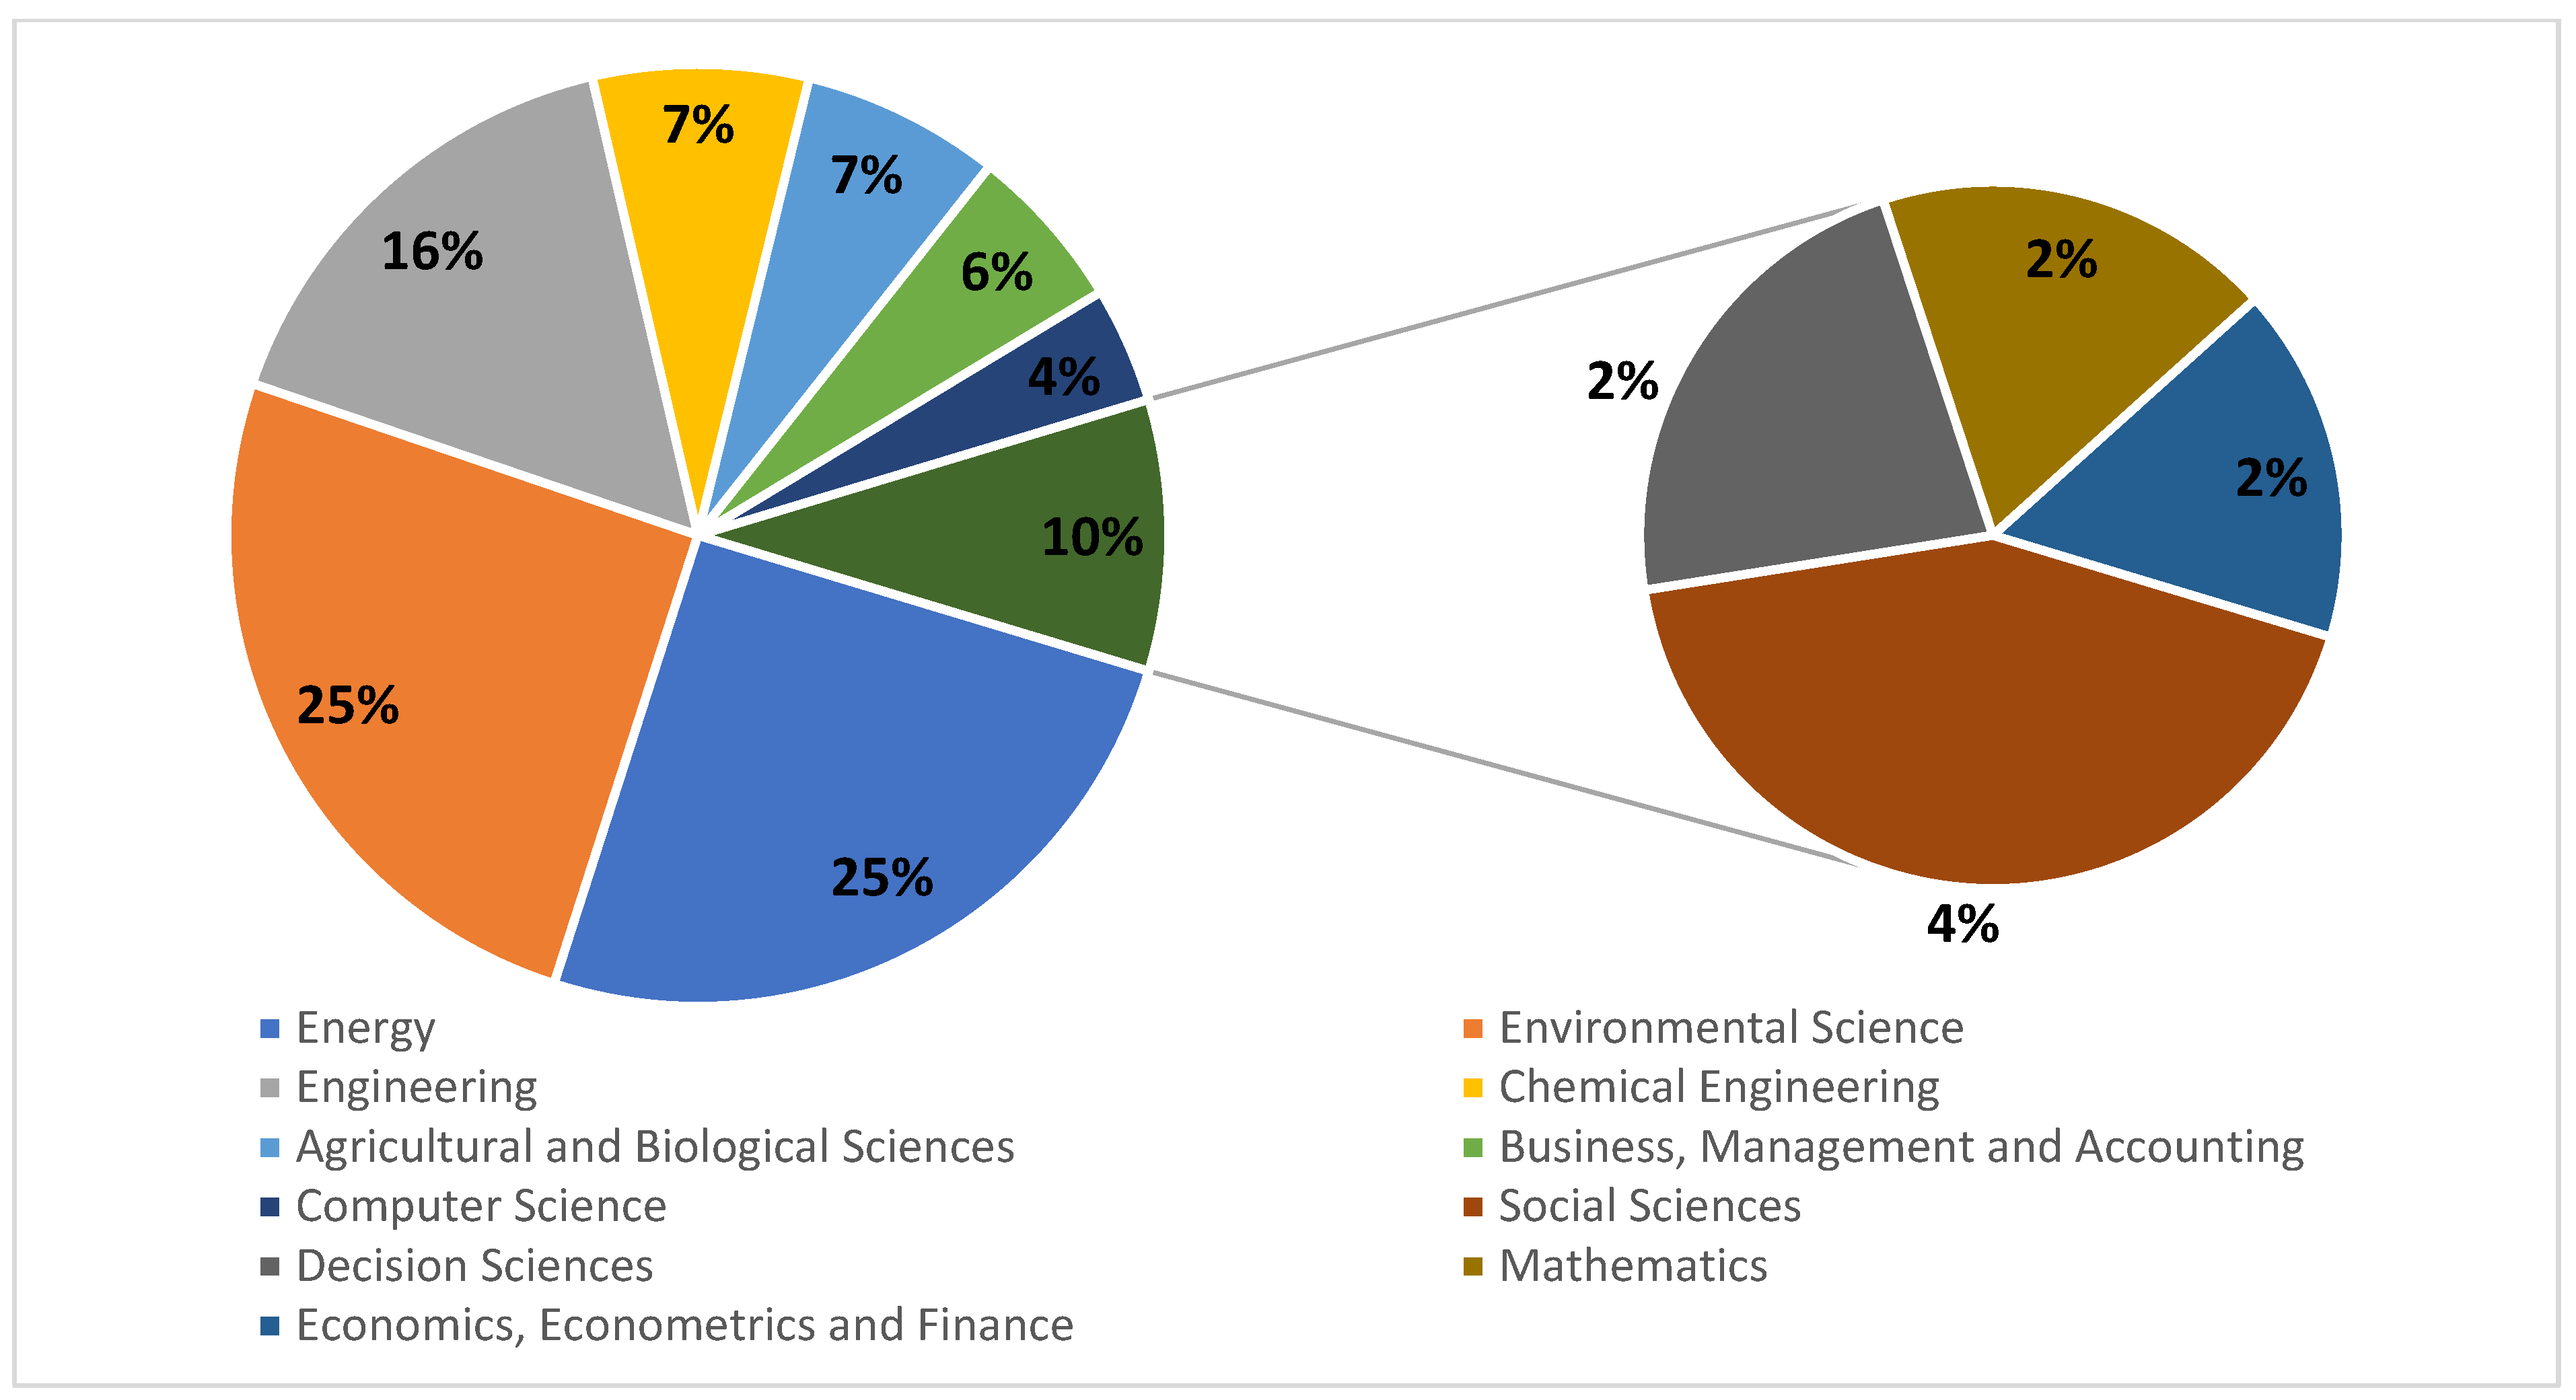
Each of these publications is also assigned in the database to the corresponding research area (Figure 7). The two most popular areas accounting for just over half of the publications are energy and environmental science. This is followed by areas such as: engineering, chemical engineering, agricultural and biological sciences, business, management, and accounting. Publications in the subsequent areas are already less numerous (less than 5%).
Table 2 presents the 14 most productive journals that have published RESCs-related papers. The largest number of publications was in the following, respectively: Applied Energy, Journal of Cleaner Production, and Sustainability (Switzerland). The remaining journals had fewer than four articles.
Table 3 shows the 10 most cited publications. A document is recognized when it is cited by others frequently. Therefore, the number of citations is an important indicator for measuring the influence of a publication [16]. It should be noted that the first three items account for more than 16% of the citations of all publications since 2011. Additionally, the top 14 publications account for as much as more than 30% of all citations in the distinguished area of RESCs. In order to prevent errors caused by analyzing citations based only on the total number of citations (in which case older publications have a better chance of being cited), a method of normalizing the number of citations was also used. The number of citations of the document divided by the average number of citations of all documents published in the same year and included in the analyzed data set (last column in Table 3).
The publication with the highest number of citations is “Selection of renewable energy sources for sustainable development of electricity generation system using analytic hierarchy process: A case of Malaysia” [17] from Universiti Malaysia (number of citations: 357). The next most cited papers are “Powering the Future with Liquid Sunshine” [18] and “Optimal planning and site selection for distributed multiproduct biorefineries involving economic, environmental and social objectives” [19]. The two publications listed also have the highest normalized citation counts. It should be noted that the second item in the table has this index, which is by far the highest of all the other articles, which means a large increase in the number of citations in a relatively small time frame—five years. In the near future, this item should top the list of the most cited publications with regards to RESCs topics.
The publications shown in Table 3 mainly focus on the area of optimizing supply chains [19,21,23,24,25], as well as topics addressing the use of alternative fuels, such as bioethanol, biorefineries, and biomass [19,20,21,23,24,25,26]. Publications related to the subject of RESCs optimization in the context of biomass, as well as biofuels described, are elaborated on. These include an optimization model to design and plan sustainable biorefinery supply chains [19], an optimization framework for the strategic design of a biofuel supply chain [24], optimization of supply chain/logistics decisions to minimize the total cost/maximize expected profit of switchgrass-based bioethanol supply chain [21,25], multi objective optimization design of the biomass supply chain, as it is crucial to ensure long term viability of such a project [23]. Additionally, included in Table 3, there are works that address other topics related to renewable energy, such as wastewater treatment plants and their supply chain and the valorization of their “products”. These involved the production of electricity out of biogas from sludge digestion and the associated stabilized digestate, applied as agricultural fertilizer [22], or they involved discussion about the sustainability aspect of biorefinery systems with focus on biomass supply chains [20]. The last item in Table 3 is a review [26], summarizing the existing research by identifying patterns, themes, and issues, thus also determining the conceptual content of the field greenhouse gas emissions in biorefinery production chains. The most cited publication by Ahmad et al. [17] considers the electricity generation system in Malaysia. An overview of various renewable sources was provided, along with the challenges for their development from the perspective of four major resources—hydropower, solar, wind, and biomass (including biogas and municipal solid waste). The second-most cited publication by Shih et al. [18] describes the technology of liquid sunshine, which is the vision of combining the sun’s energy with carbon dioxide and water to produce green liquid fuels. Authors said that the efficient conversion of solar radiation into stable, energy dense liquid energy carriers that can use existing or adapt global supply chains for storage, shipping, and distribution is the key to large-scale deployment of solar energy at gigaton levels.
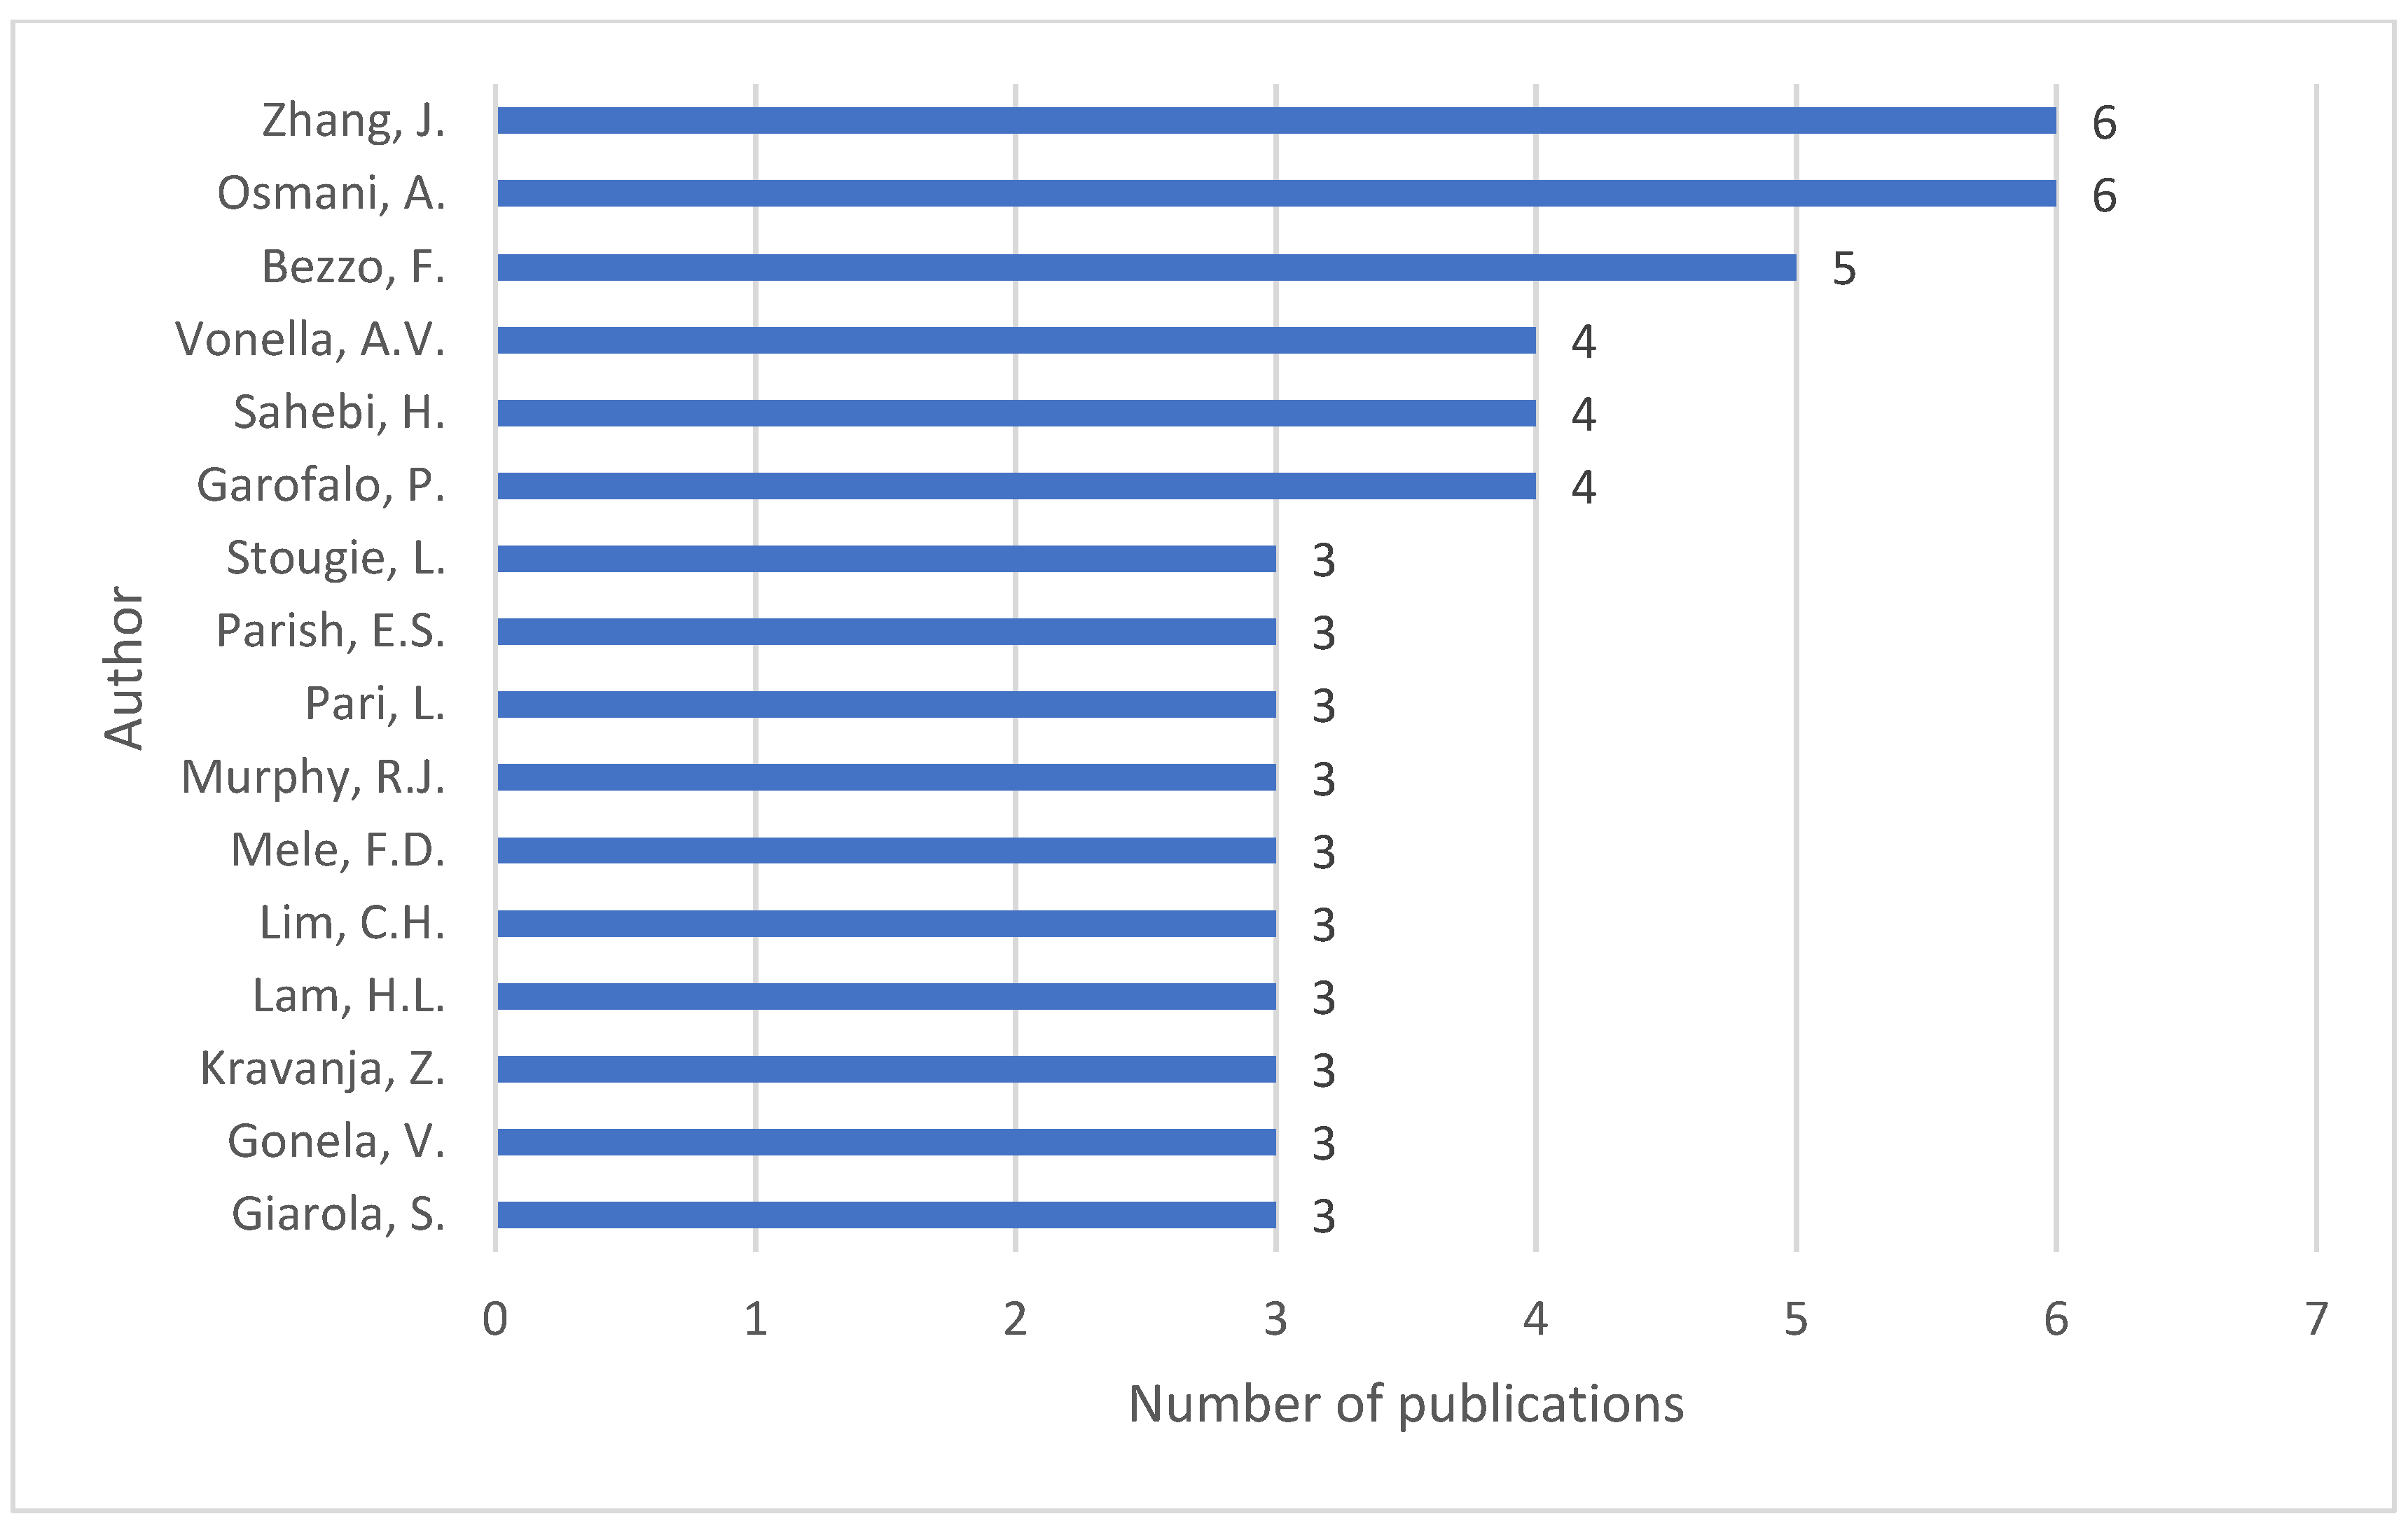
The lack of work related to the RESCs as a whole suggests that many researchers have not covered this area. There is also the possibility to indicate the authors with the highest number of publications in this area. Figure 8 shows 16 authors whose number of publications is at least 3. Two authors have six publications each: Zhang Jun and Osmani Atif from the Department of Industrial and Manufacturing Engineering, North Dakota State University, who mostly write together. Another author has five publications, Bezzo Fabrizio, from the Department of Industrial Engineering, University of Padova. The mentioned authors in their publications deal with bioethanol production and bioethanol supply chains.
To find studies that could be references in the area of Renewable Energy Supply Chains (RESCs), it became important to determine if there were any patterns in the keywords the authors used.

3.2. Knowledge Maps—Analysis of the Bibliographic Data

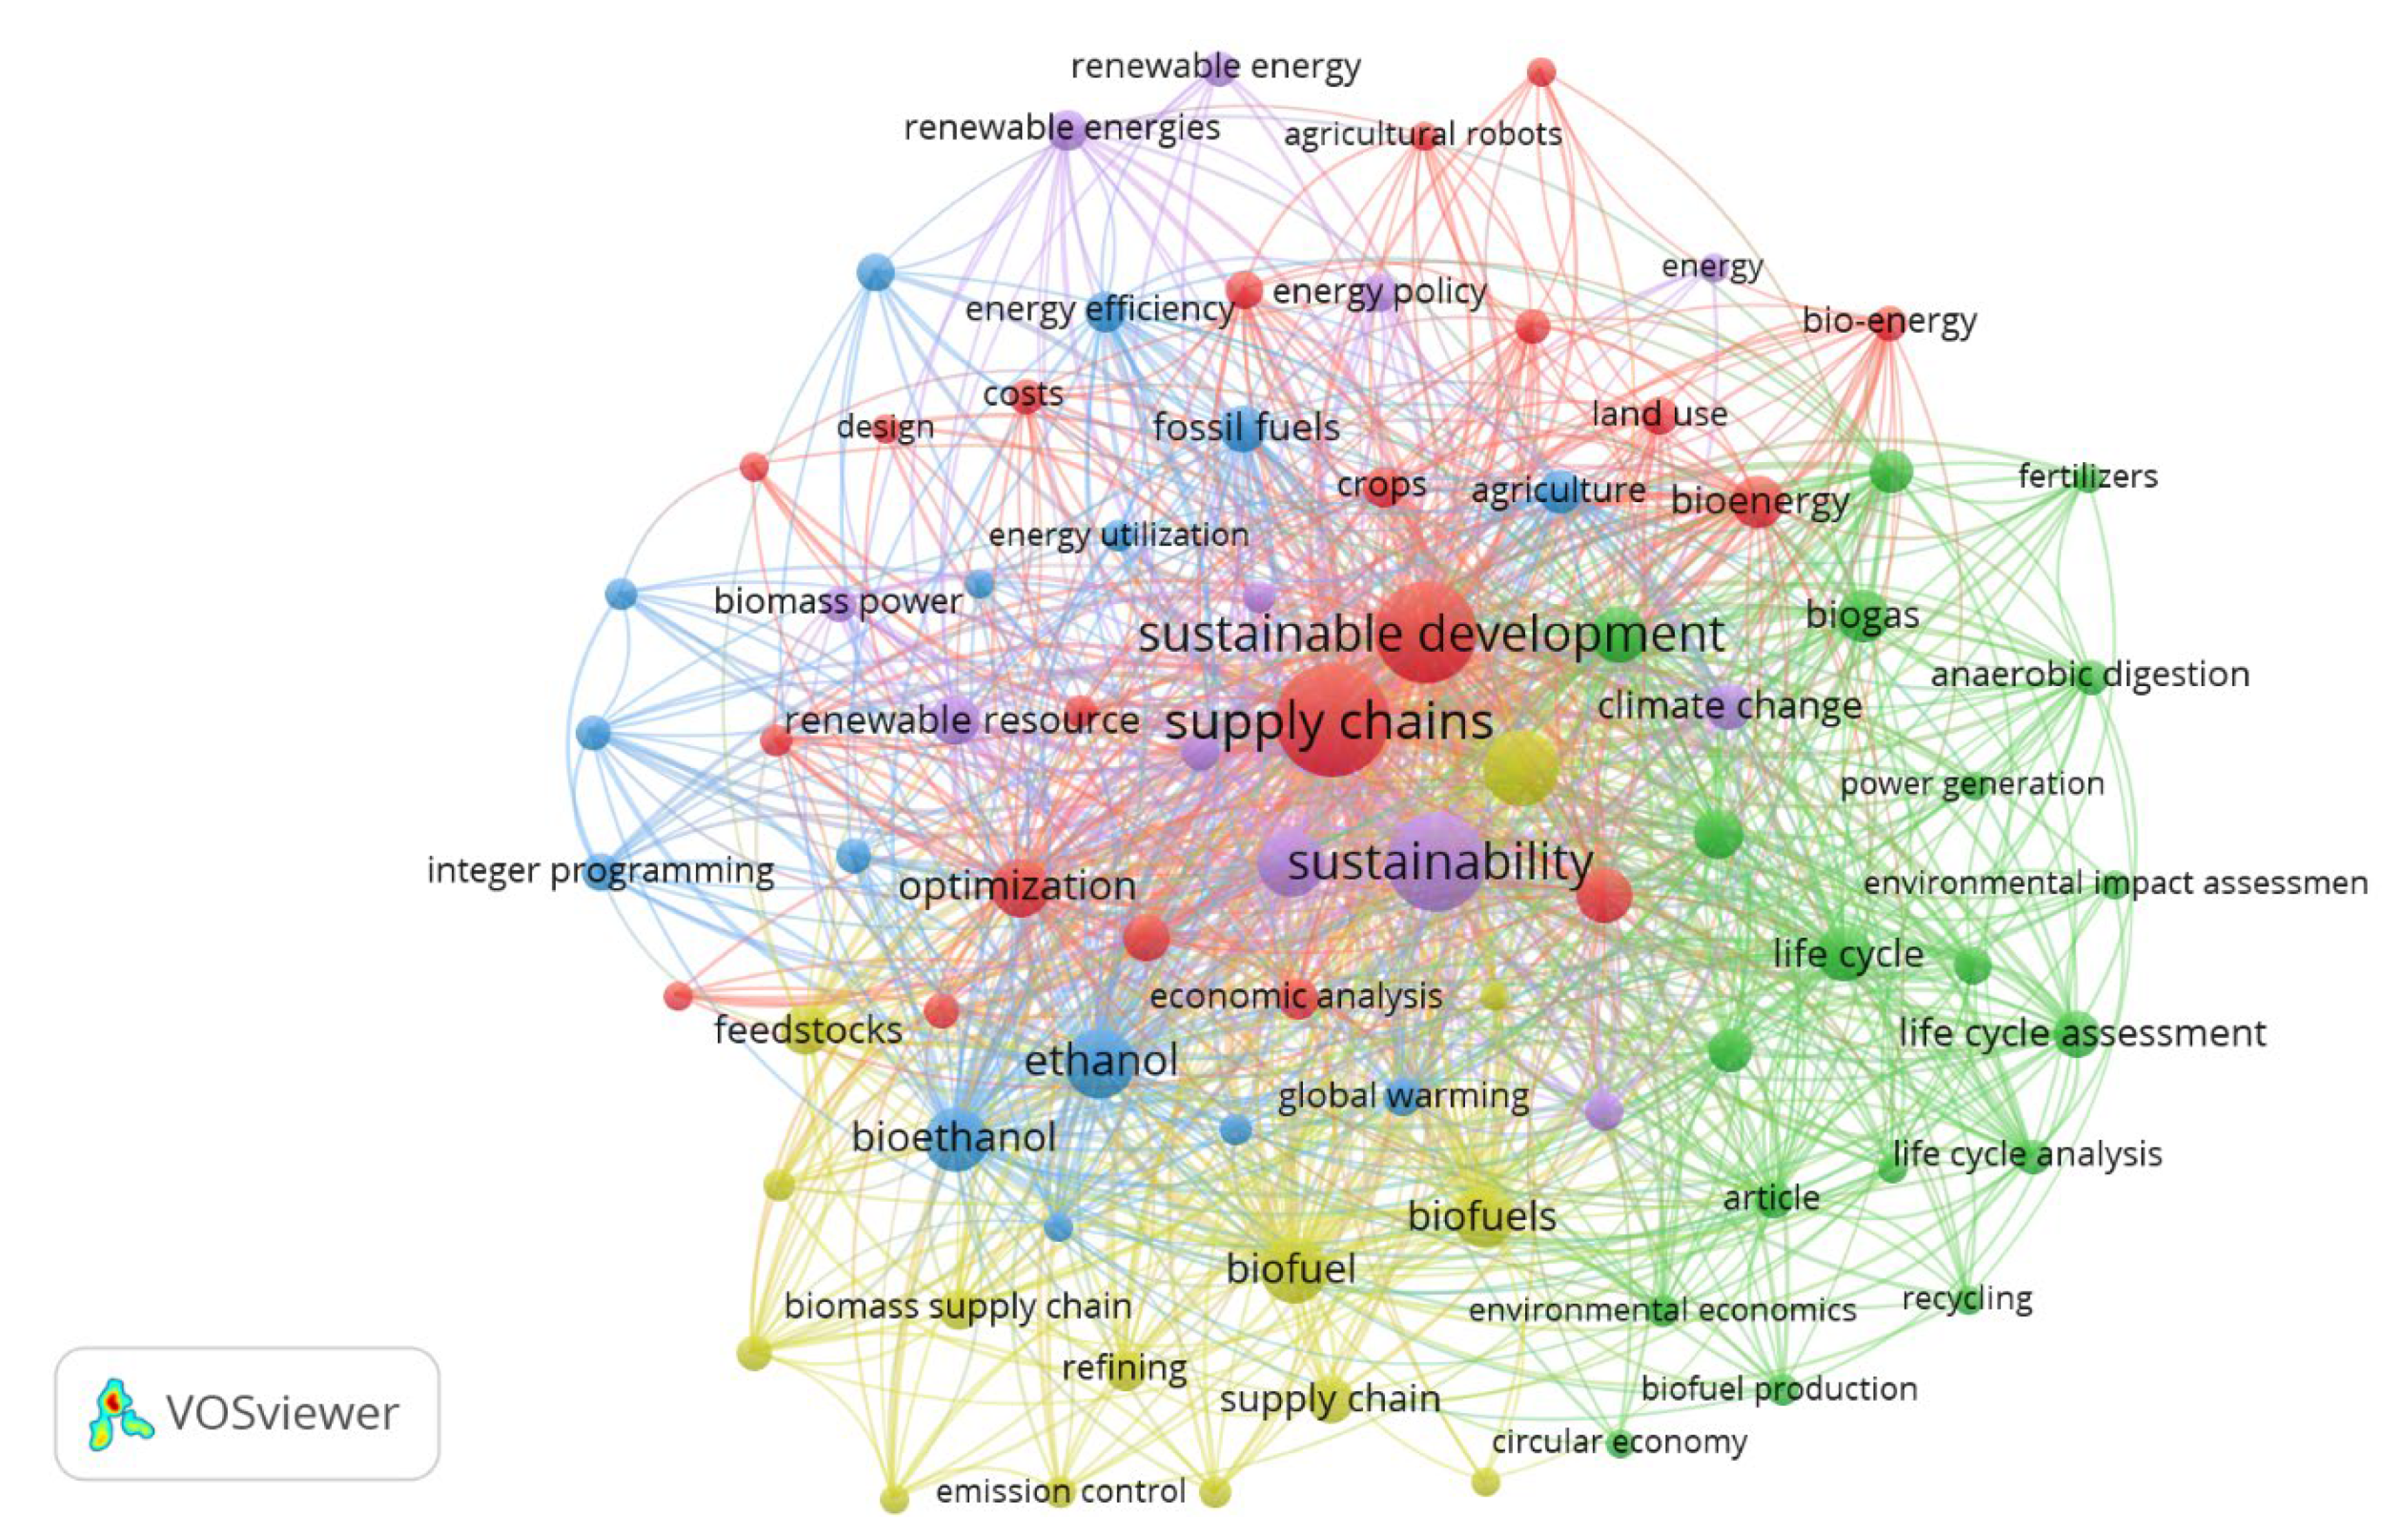
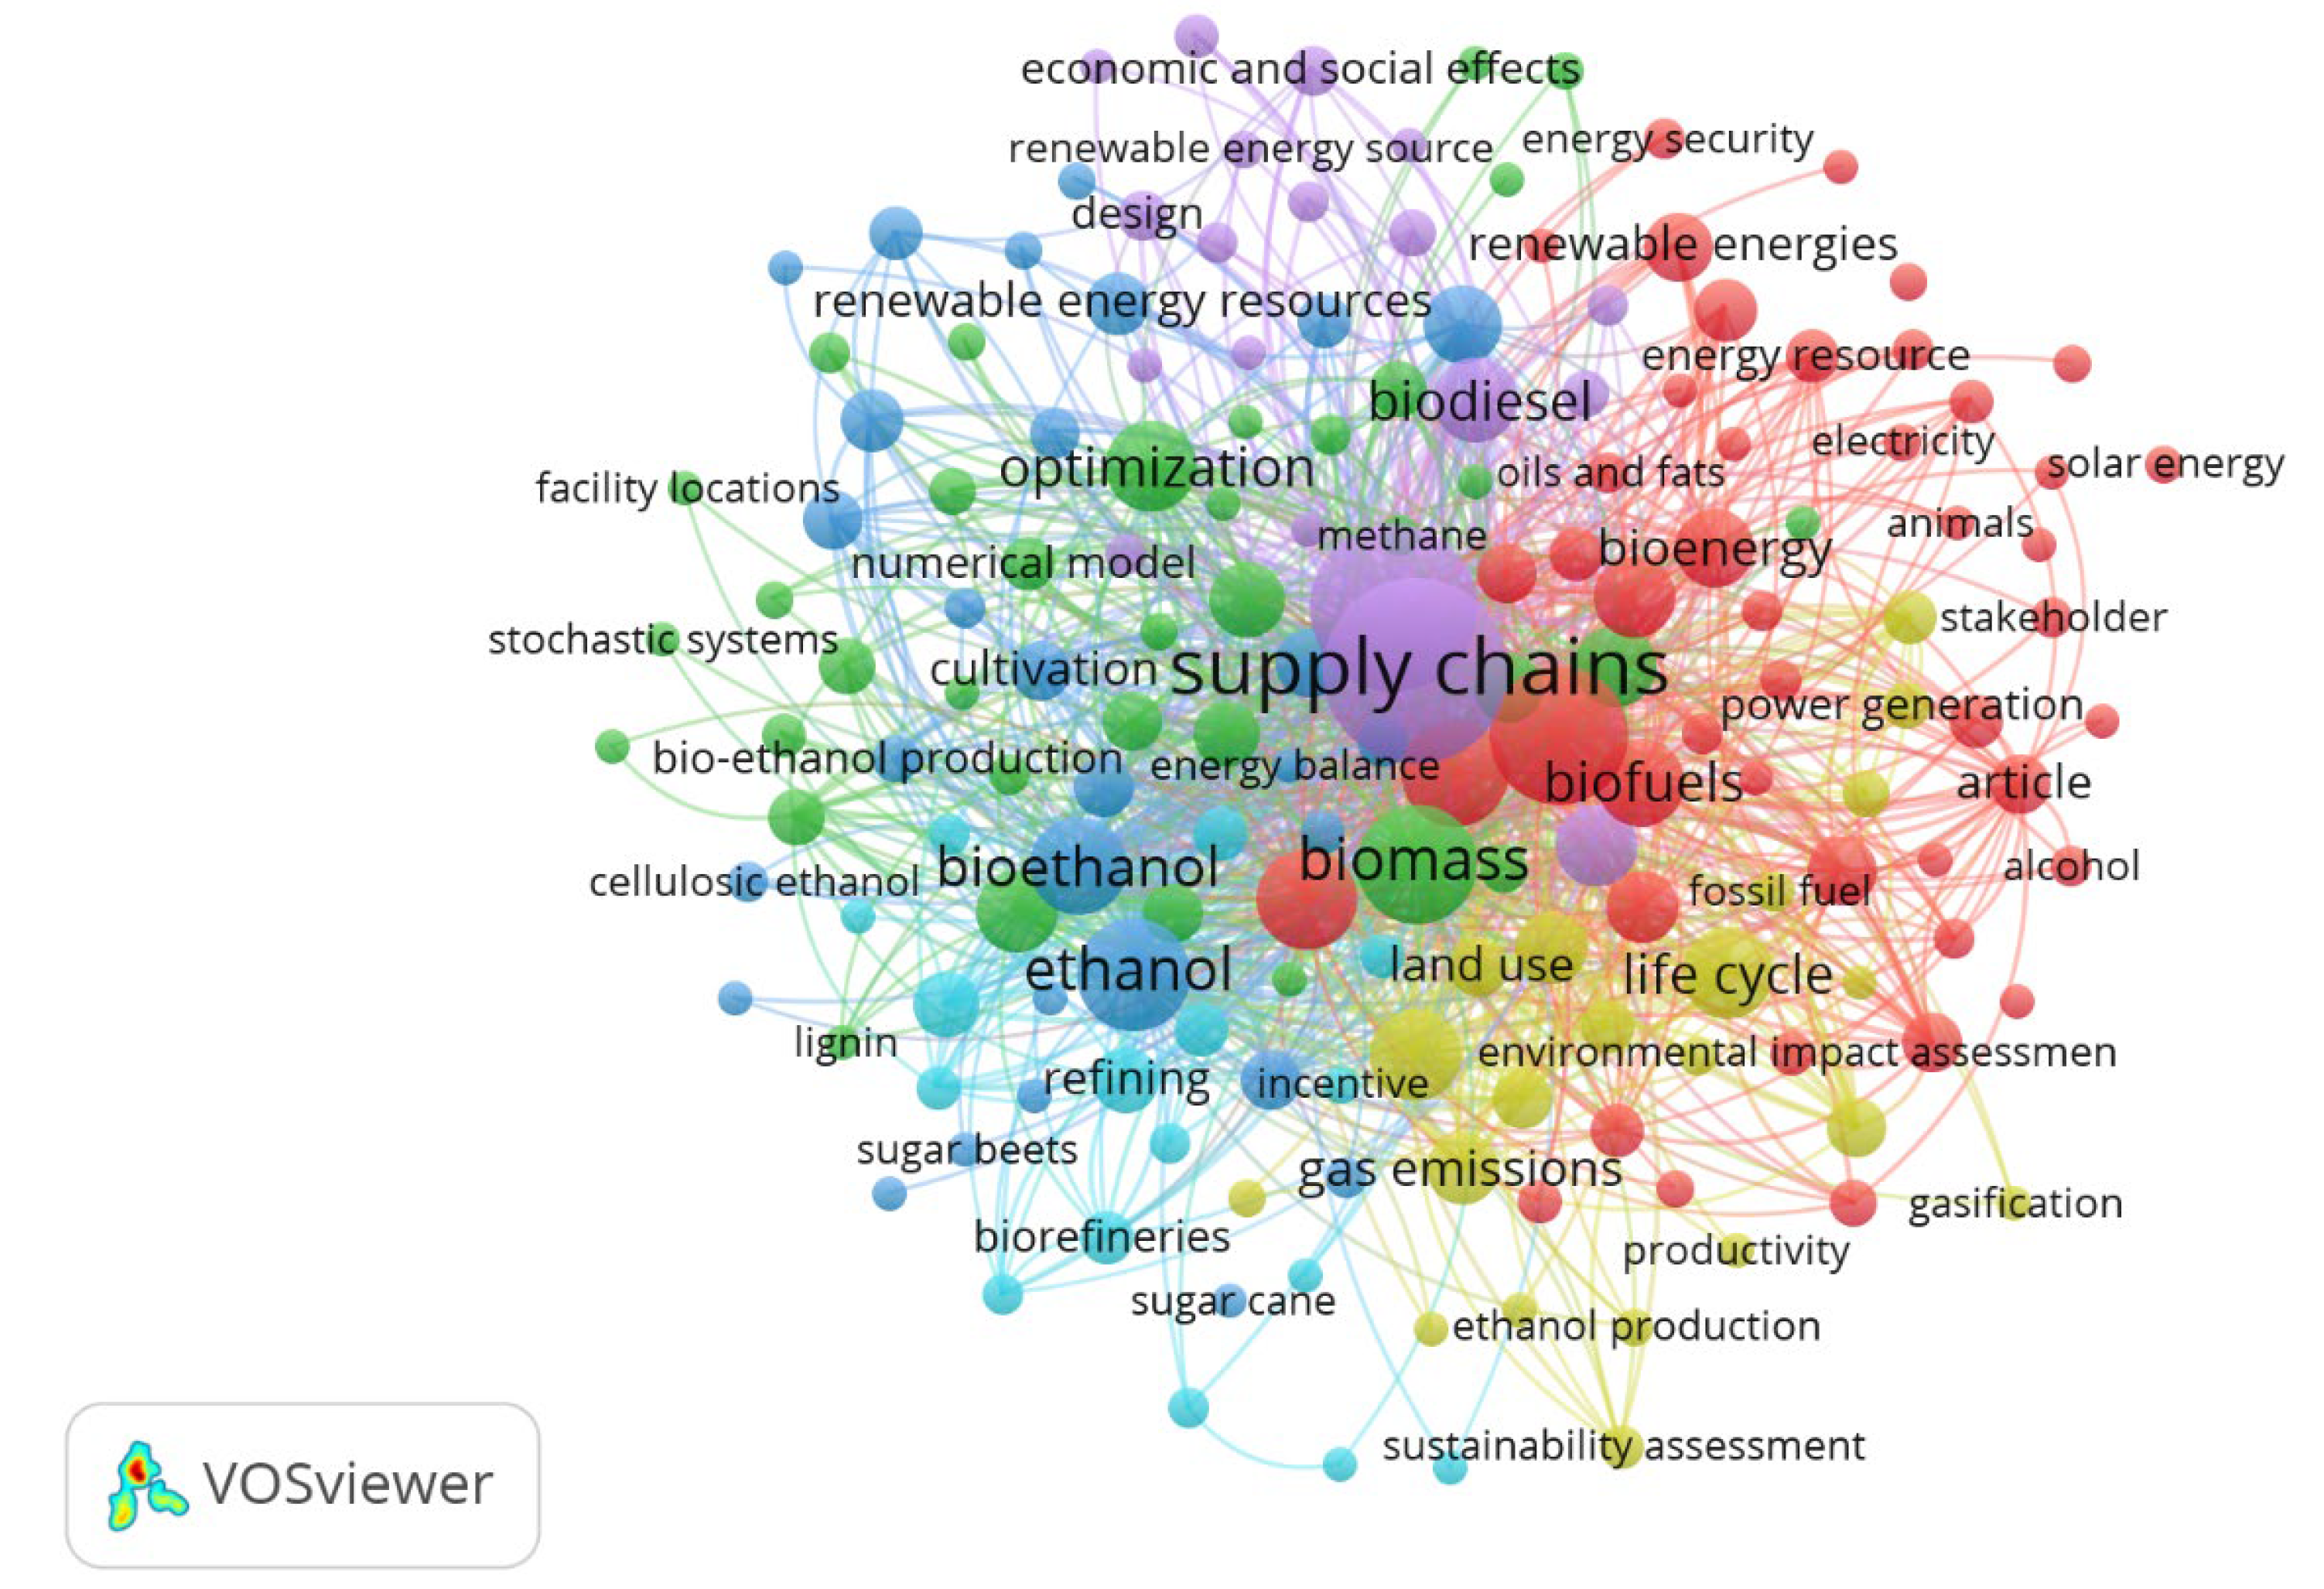
Given the limitation to the indicated 230 publications, keywords were selected for the individual maps and analyses, which formed the lexical map in the next step. A minimum number of occurrences of 10 was set for publications, resulting in 2289 phrases with 81 keywords combined with others. Figure 9 shows the map, along with identified clusters, for the most frequent keywords meeting the boundary conditions of the analysis. Words were related to the broad fields of renewable energy, sustainability, and supply chains. All of the keywords presented in the map that are part of the five clusters have links, reflecting groups of emerging research themes in the scope indicated.
Table 4 shows, for each cluster, the five most frequently co-occurring keywords in each cluster, together with the map building conditions met. To start the map analysis, it should be pointed out that, when using the VoS Viewer tool to survey publications from the last twelve years, five clusters were obtained that reflected groups of research topics reflecting research topics on energy supply chains with sustainability aspects. The clusters are shown in Figure 10 (highlighted in highlighted colours). Table 4 shows the identified clusters that meet the research limitations regarding the map construction criteria, as well as the map identifier (cluster colour) and the number of all phrases appearing in a given cluster. The five most frequently occurring and related keywords were adopted for analysis. The clusters were characterised in terms of two criteria: total link straight and occurrence. As already indicated, five clusters were identified, the content and visualisation of which allows discussion and conclusions to be drawn regarding the interest of energy supply chains in terms of sustainable development in the period 2012–2023.
Starting the analysis of individual clusters (Table 4), it should be pointed out that, in the case of cluster 1 (red), the research was devoted to the supply chain and sustainability and optimization of activities undertaken in this area, but an interesting element is that the research focused on bioenergy, both renewable and traditional (biodiesel). This means that, in such a narrowed research focus, these topics are of particular interest, and this type of chain has the largest share of analysis on the functioning of energy supply chains. Green cluster number 2 focuses on the pollution aspect and life cycle analysis in the context of environmental impacts. The profile of this cluster clearly indicates an interest in research on environmental emissions, life cycles, and their assessment and environmental impacts. In blue cluster number 3, the research topics focus on gas emissions, ethanol and bioethanol, fossil fuels, and agriculture. The research profile is oriented towards these areas. In yellow cluster 4, we are again dealing with biofuels and biomass, as well as fuel refining and raw materials and the supply chain. It can be seen, therefore, that the focus of these issues is on the use of renewable energy chains, or their green equivalents. Purple cluster 5 again addresses issues of sustainability, supply chain management of climate change, renewable raw materials, and gas emissions.
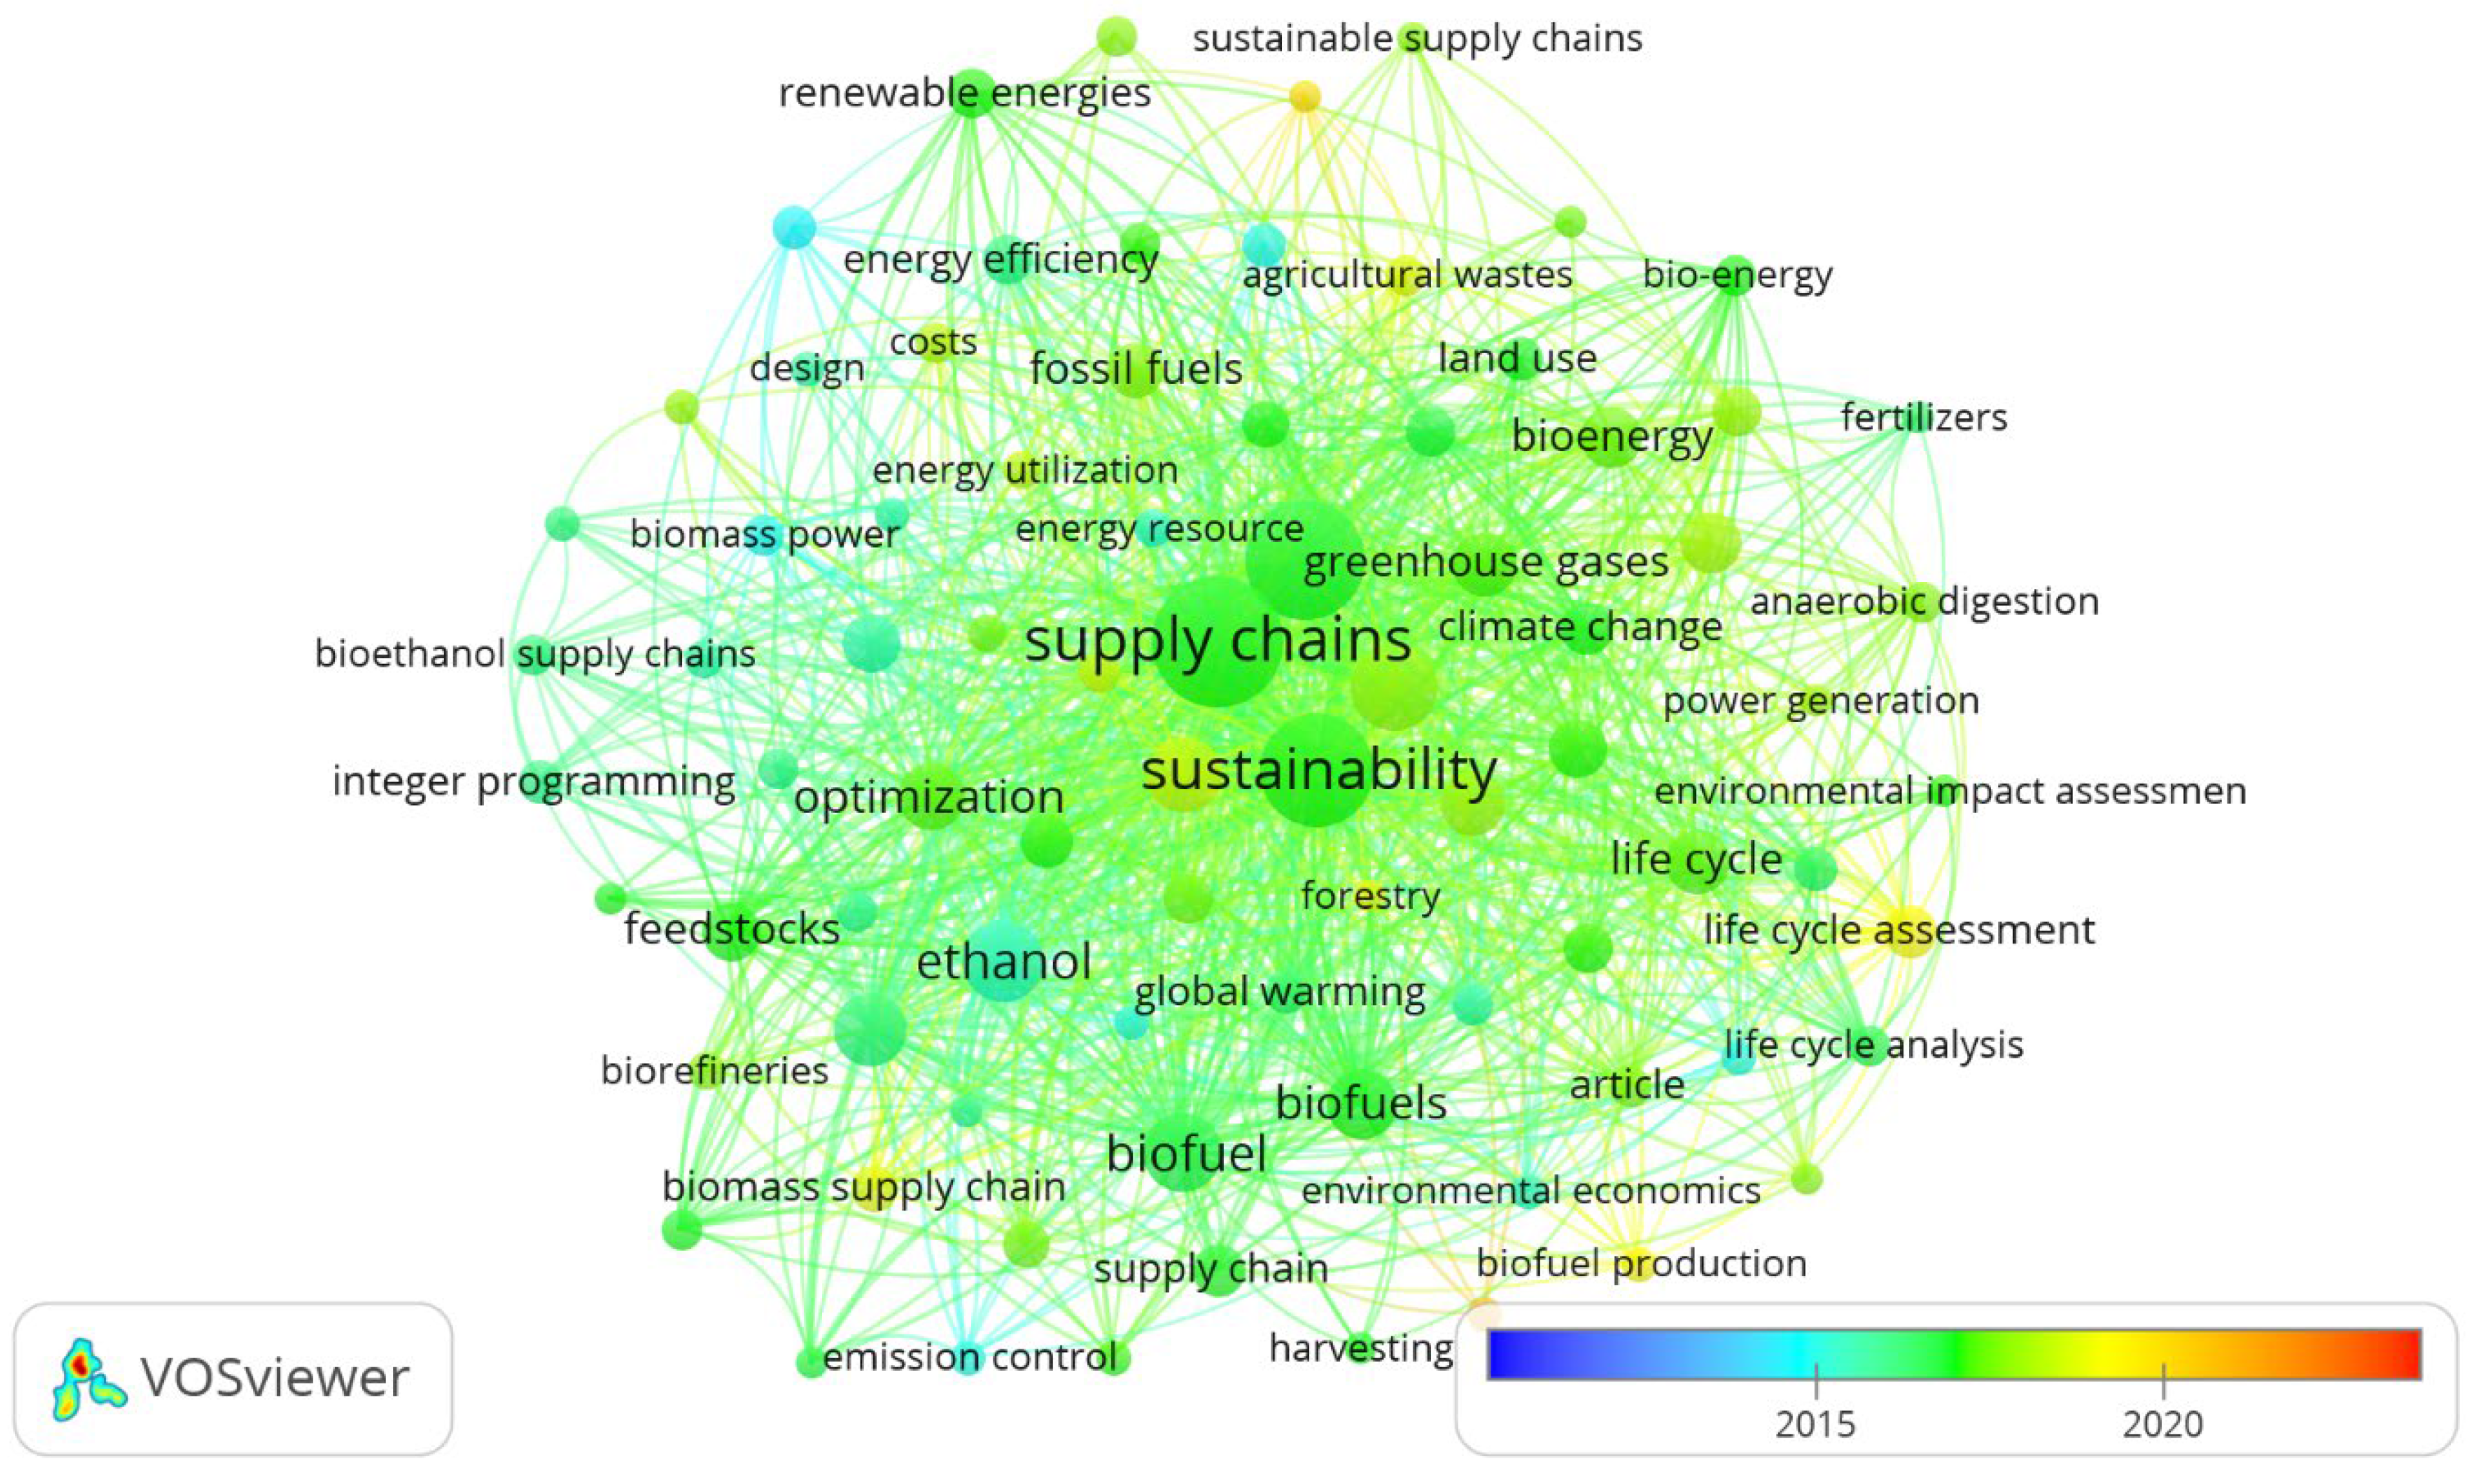
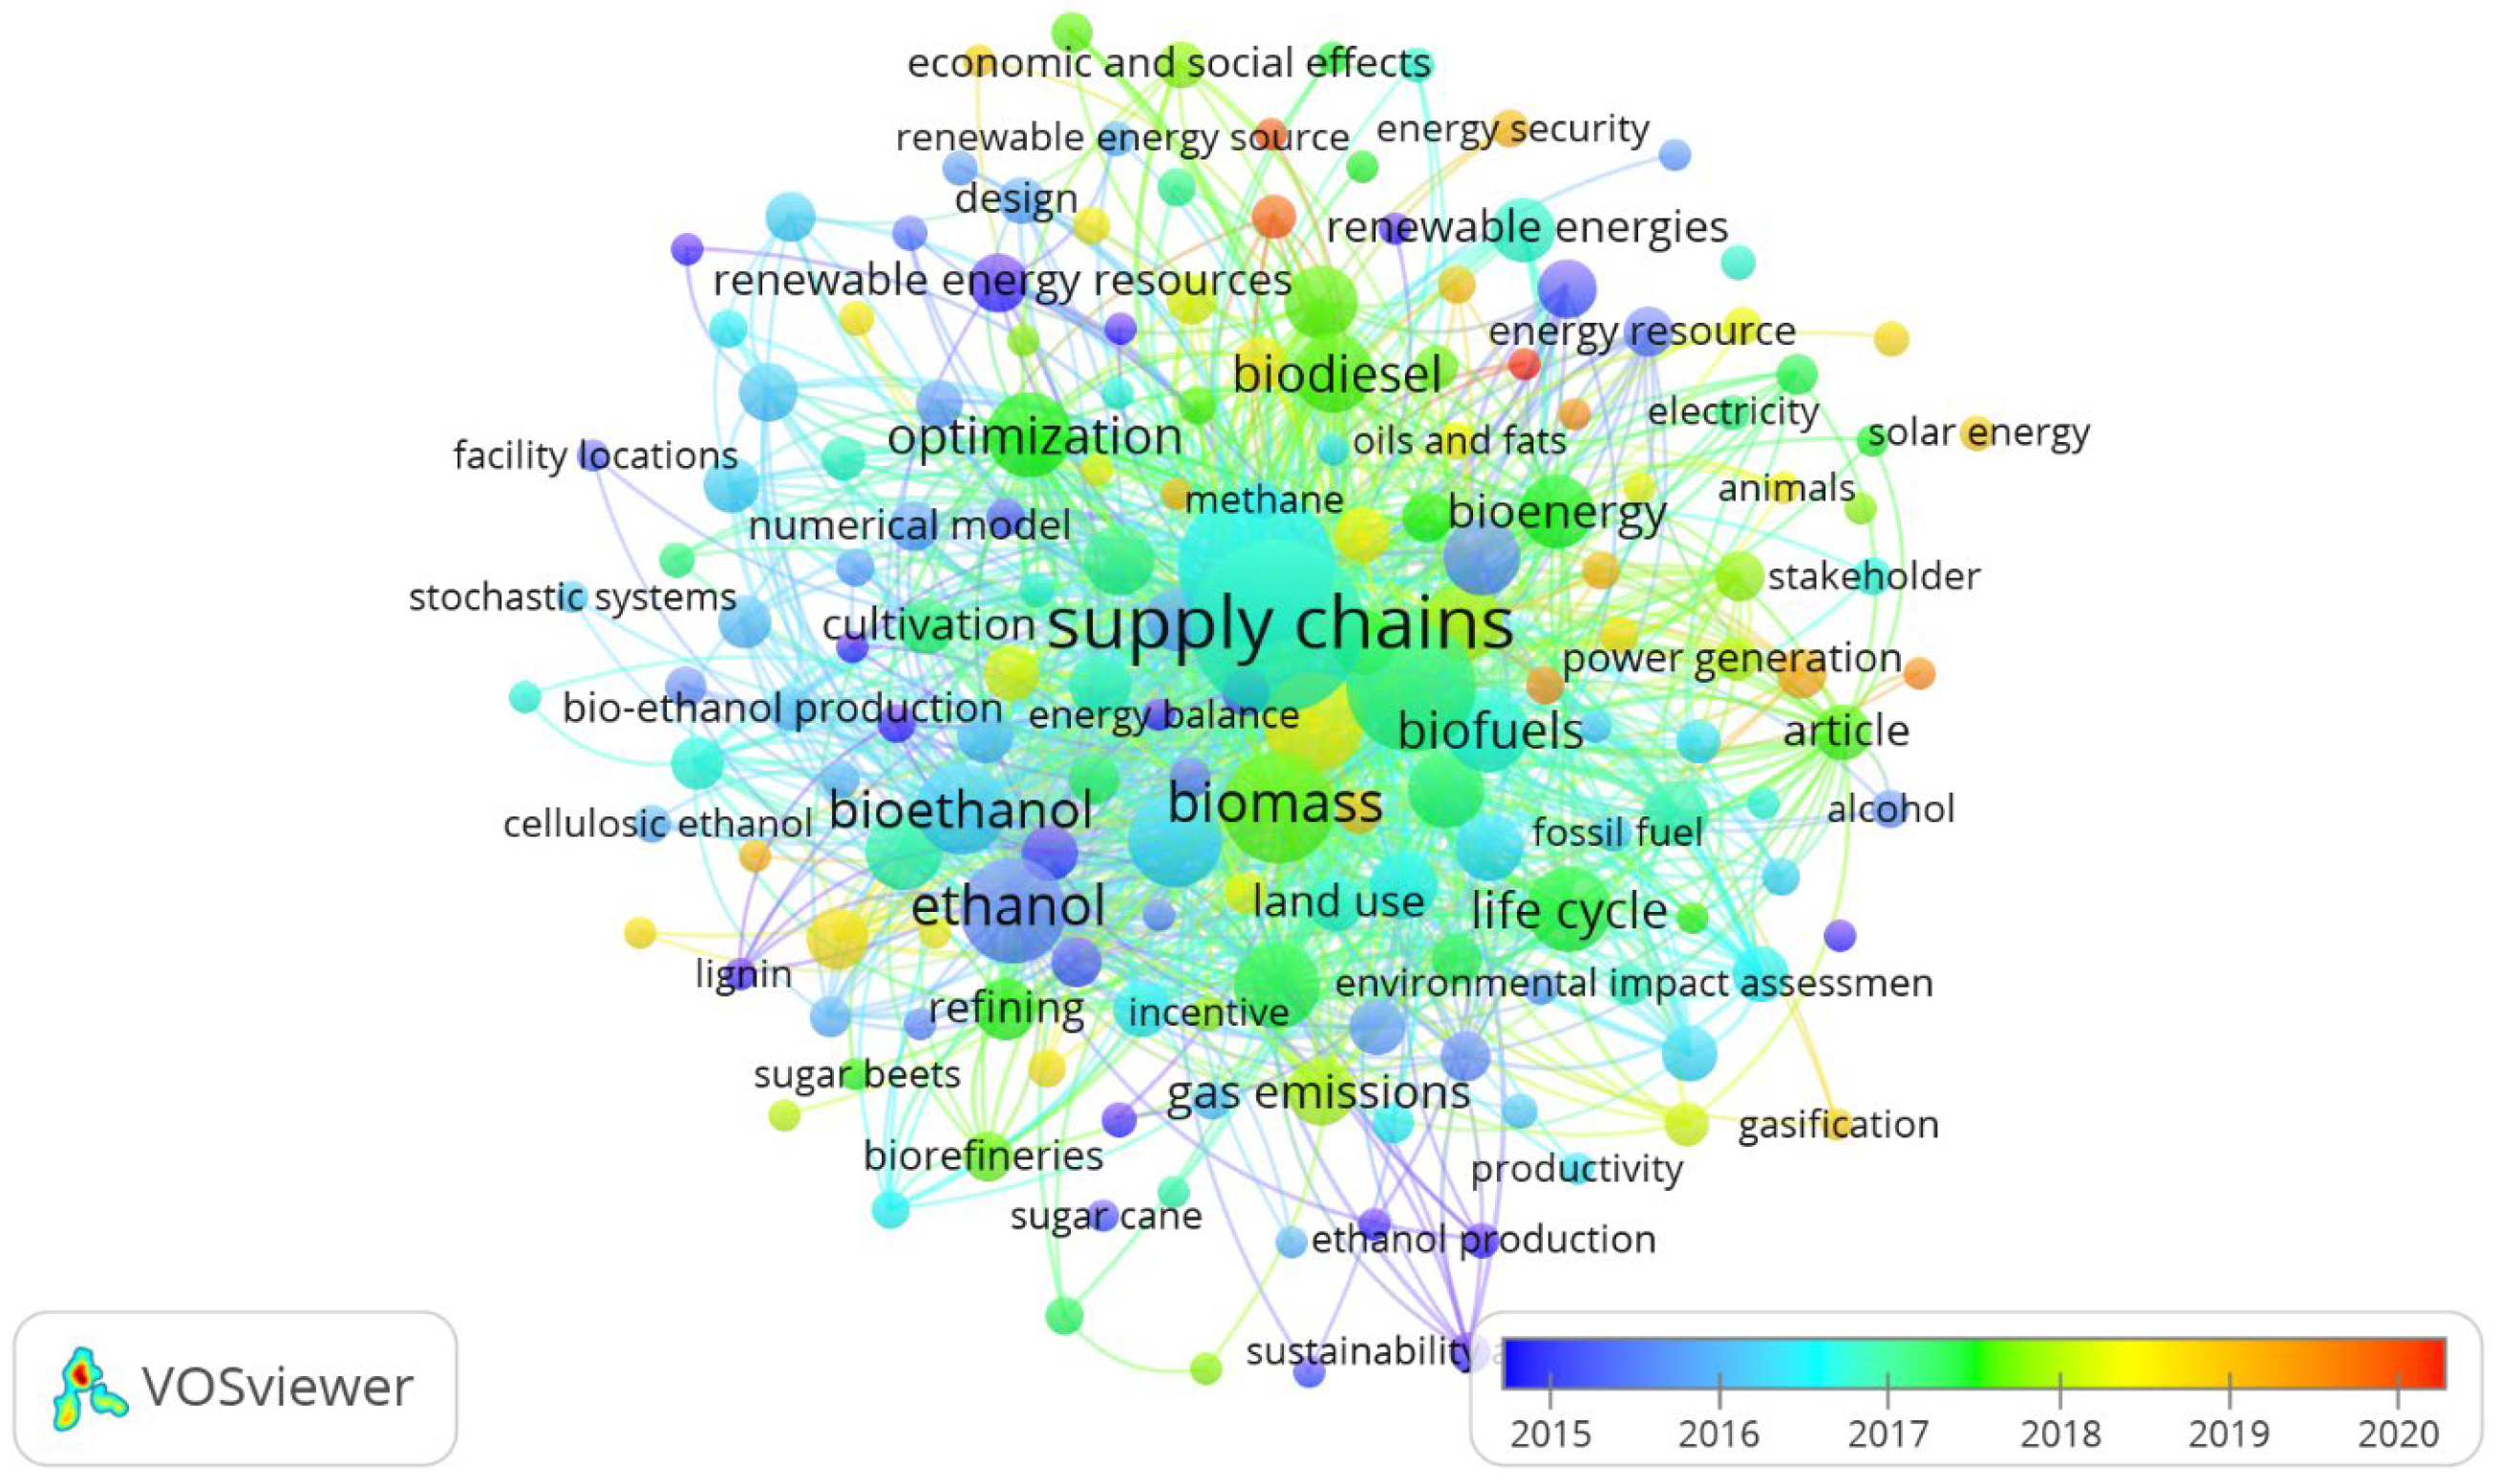
Figure 10 shows a network indicating the dynamics of research development over time. Its colouring indicates the average publication per year in which the keyword occurs. Referring to the overall map, it can therefore be concluded that the greatest dynamics occurred between 2016 and 2019, in terms of the variety and occurrence of keywords. In the following years, this dynamic decreased, and the colours become more homogeneous, meaning that new terms are not coming in, but the already indicated base is used in the research.
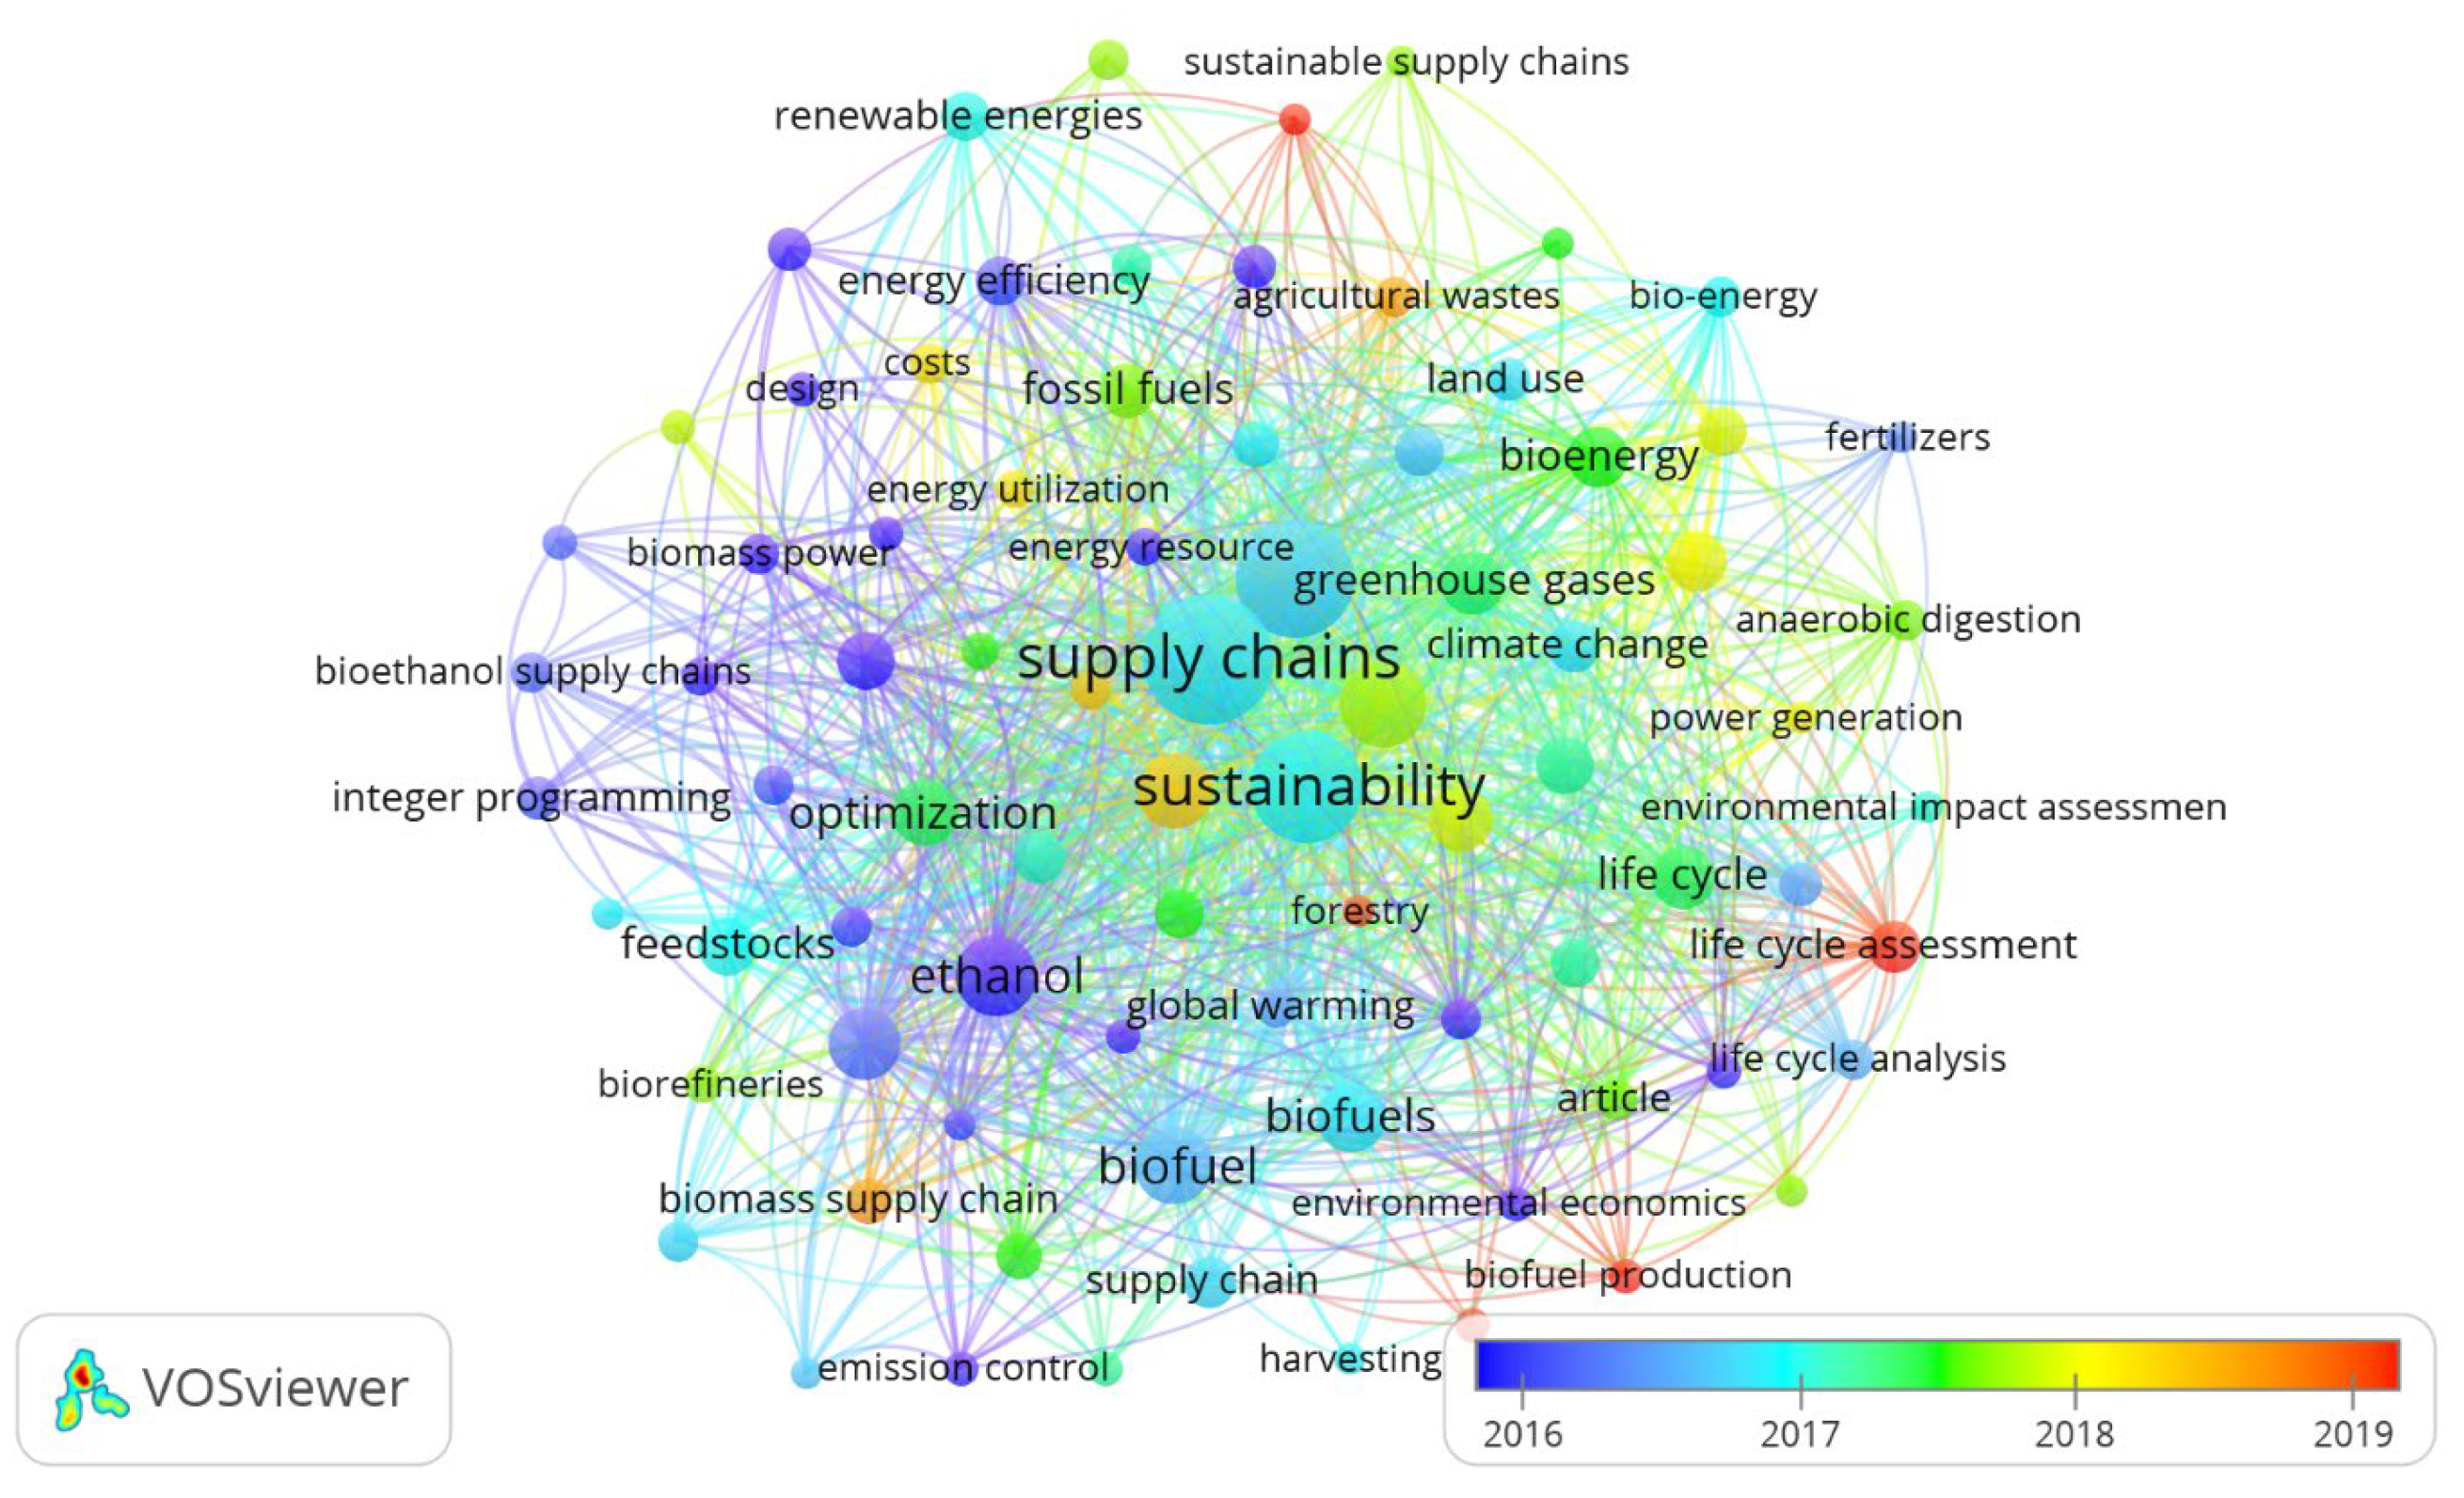
Figure 11, on the other hand, shows more detailed, and actually time-limited, linkages and dynamics of keywords in 2016–2019. The time network shown in Figure 10 and Figure 11 illustrates the dynamics of research development. This is the same map, based on the same assumptions, as map on Figure 9, but its coloring indicates the average year of publication of the documents in which the keyword or term specified in the assumptions appeared.
Another element of the co-occurrence analysis is its reference to the author’s keywords. Based on the same data, the following analyses were performed.
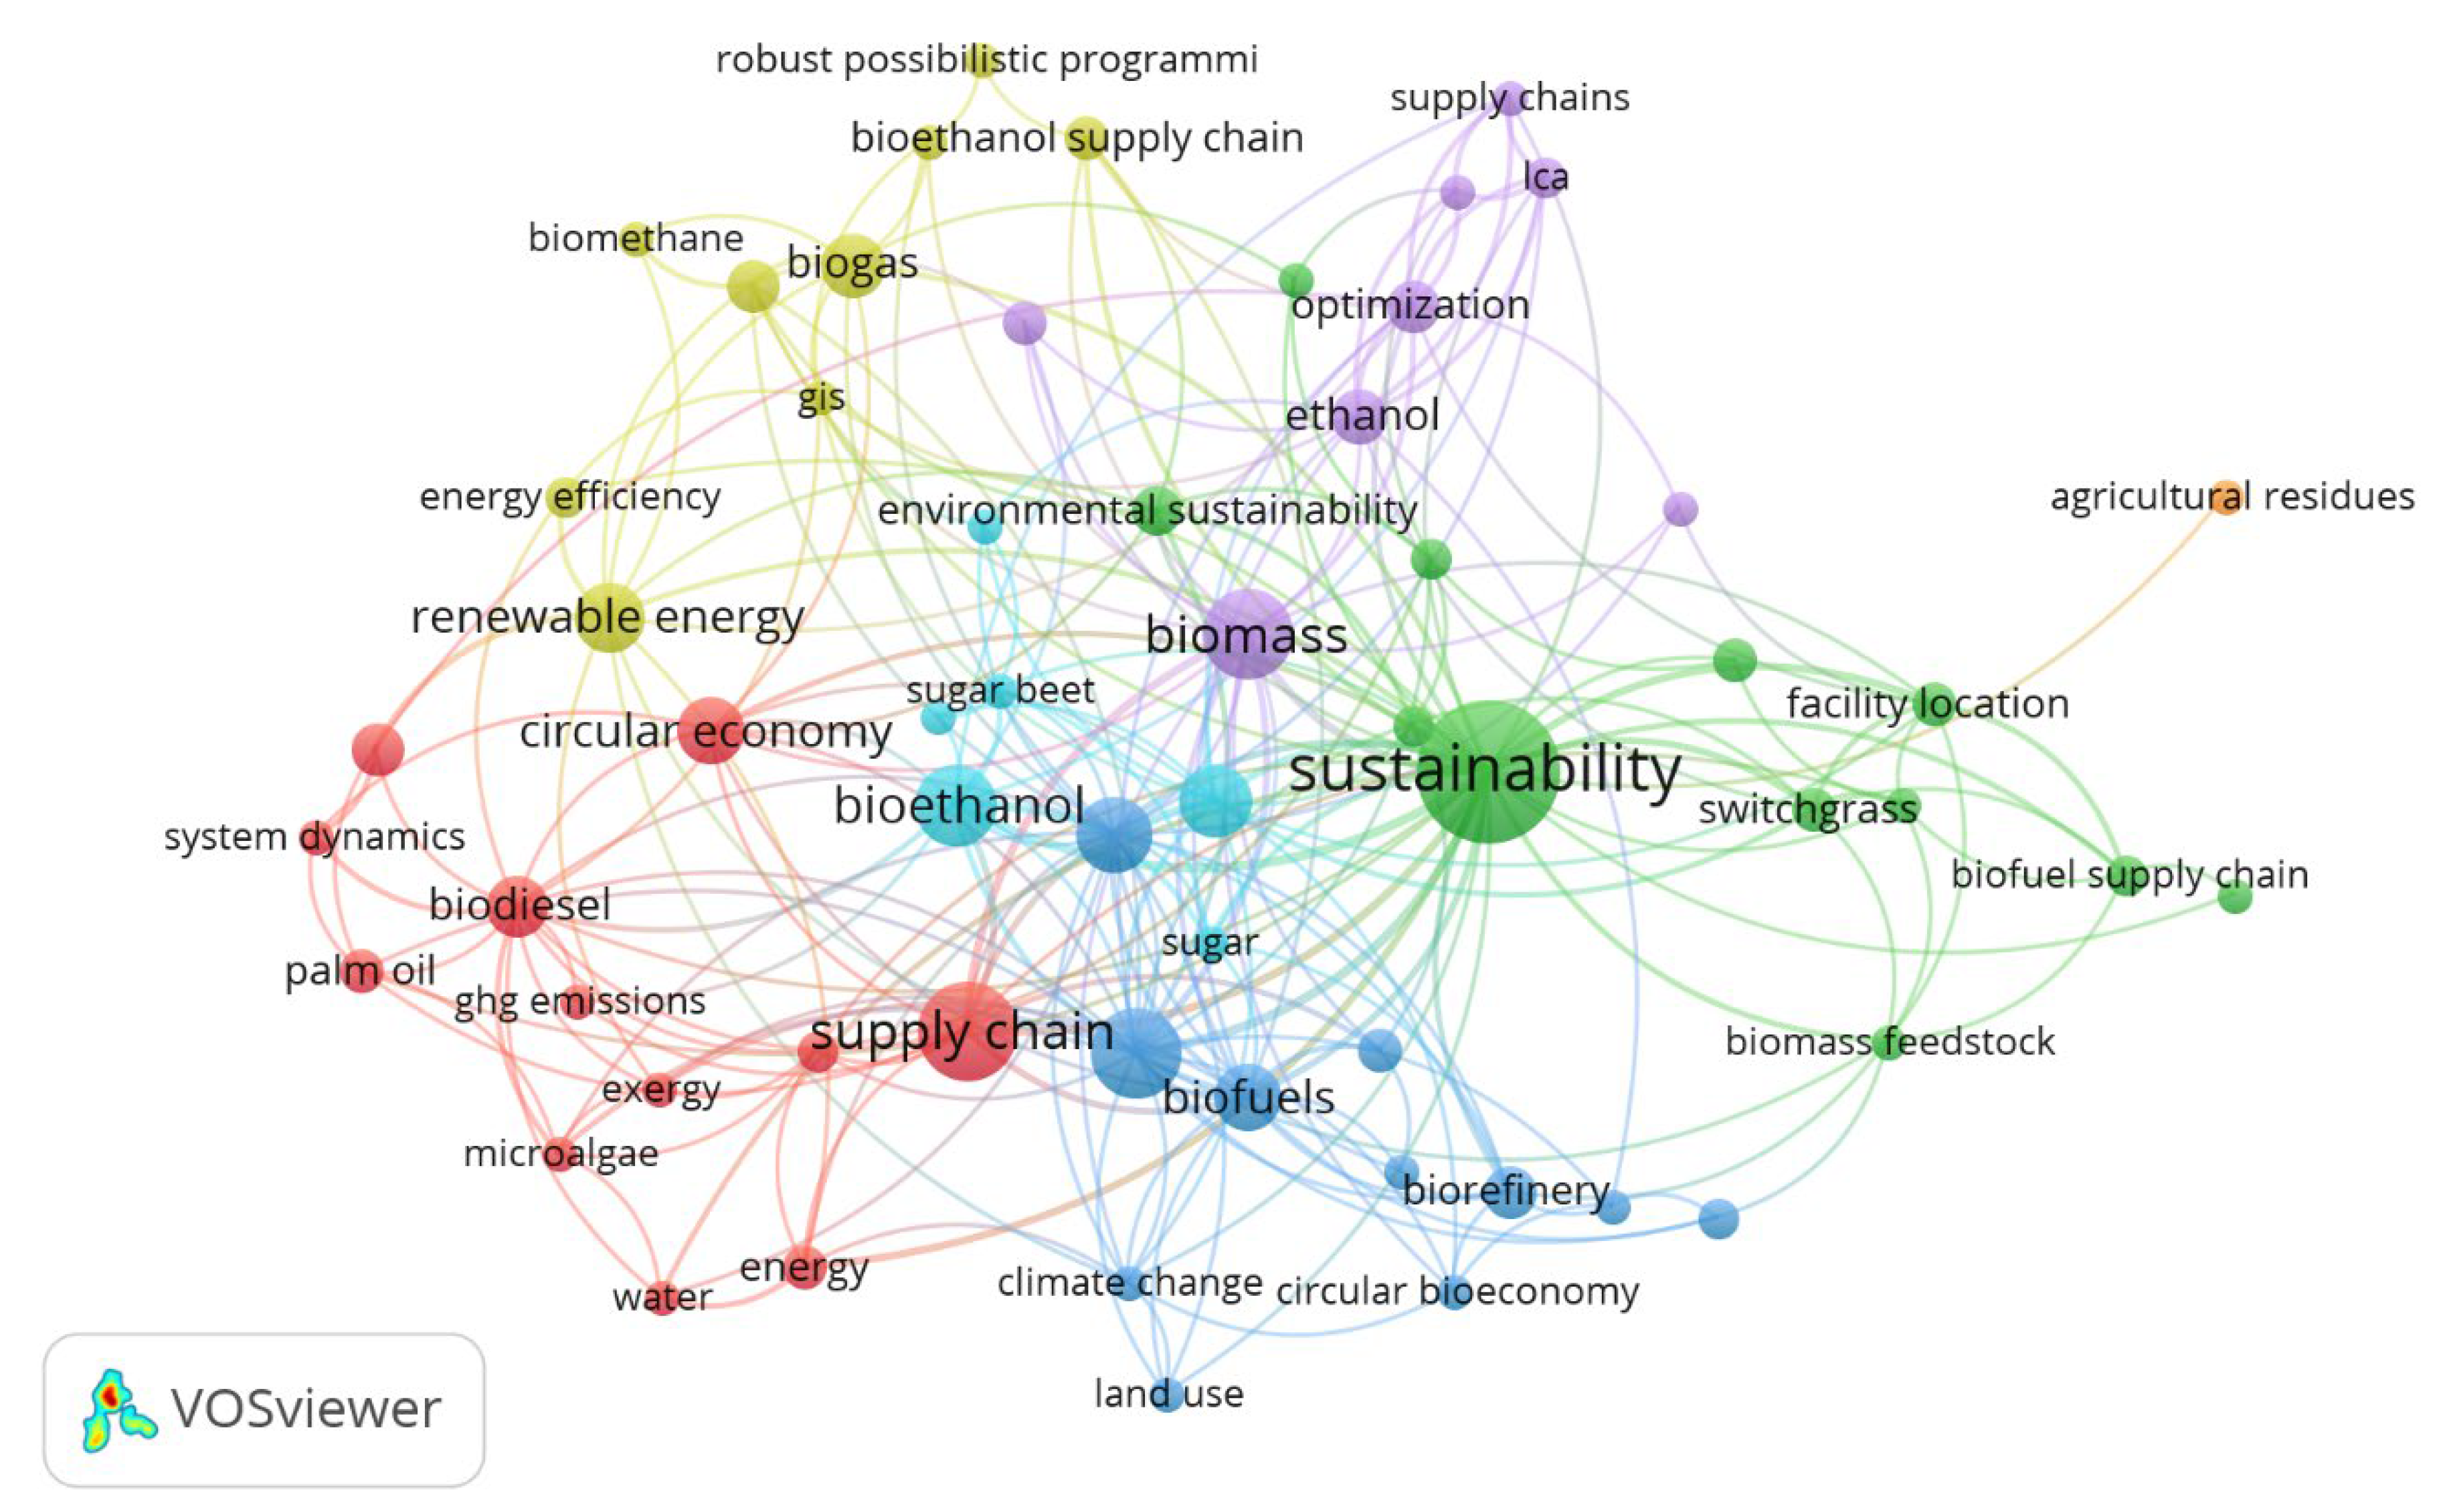
Bearing in mind the limitation to the indicated 230 publications, keywords were selected for the individual maps and analyses, which formed the lexical map in the next step. A minimum number of occurrences of three was set for the publications, resulting in 744 keywords, of which 59 were linked. Figure 12 shows the co-occurrence map, along with identified clusters, for the most frequent keywords of authors meeting the boundary conditions of the analysis. The words related broadly to renewable energy, sustainability, and supply chains. For 59 keywords, the total strength of co-occurrence links with the other keywords was calculated. The keyword with the greatest total link strength will be selected. All the keywords presented on the map are part of the seven clusters that have links to each other, reflecting groups of emerging research topics in the scope indicated.
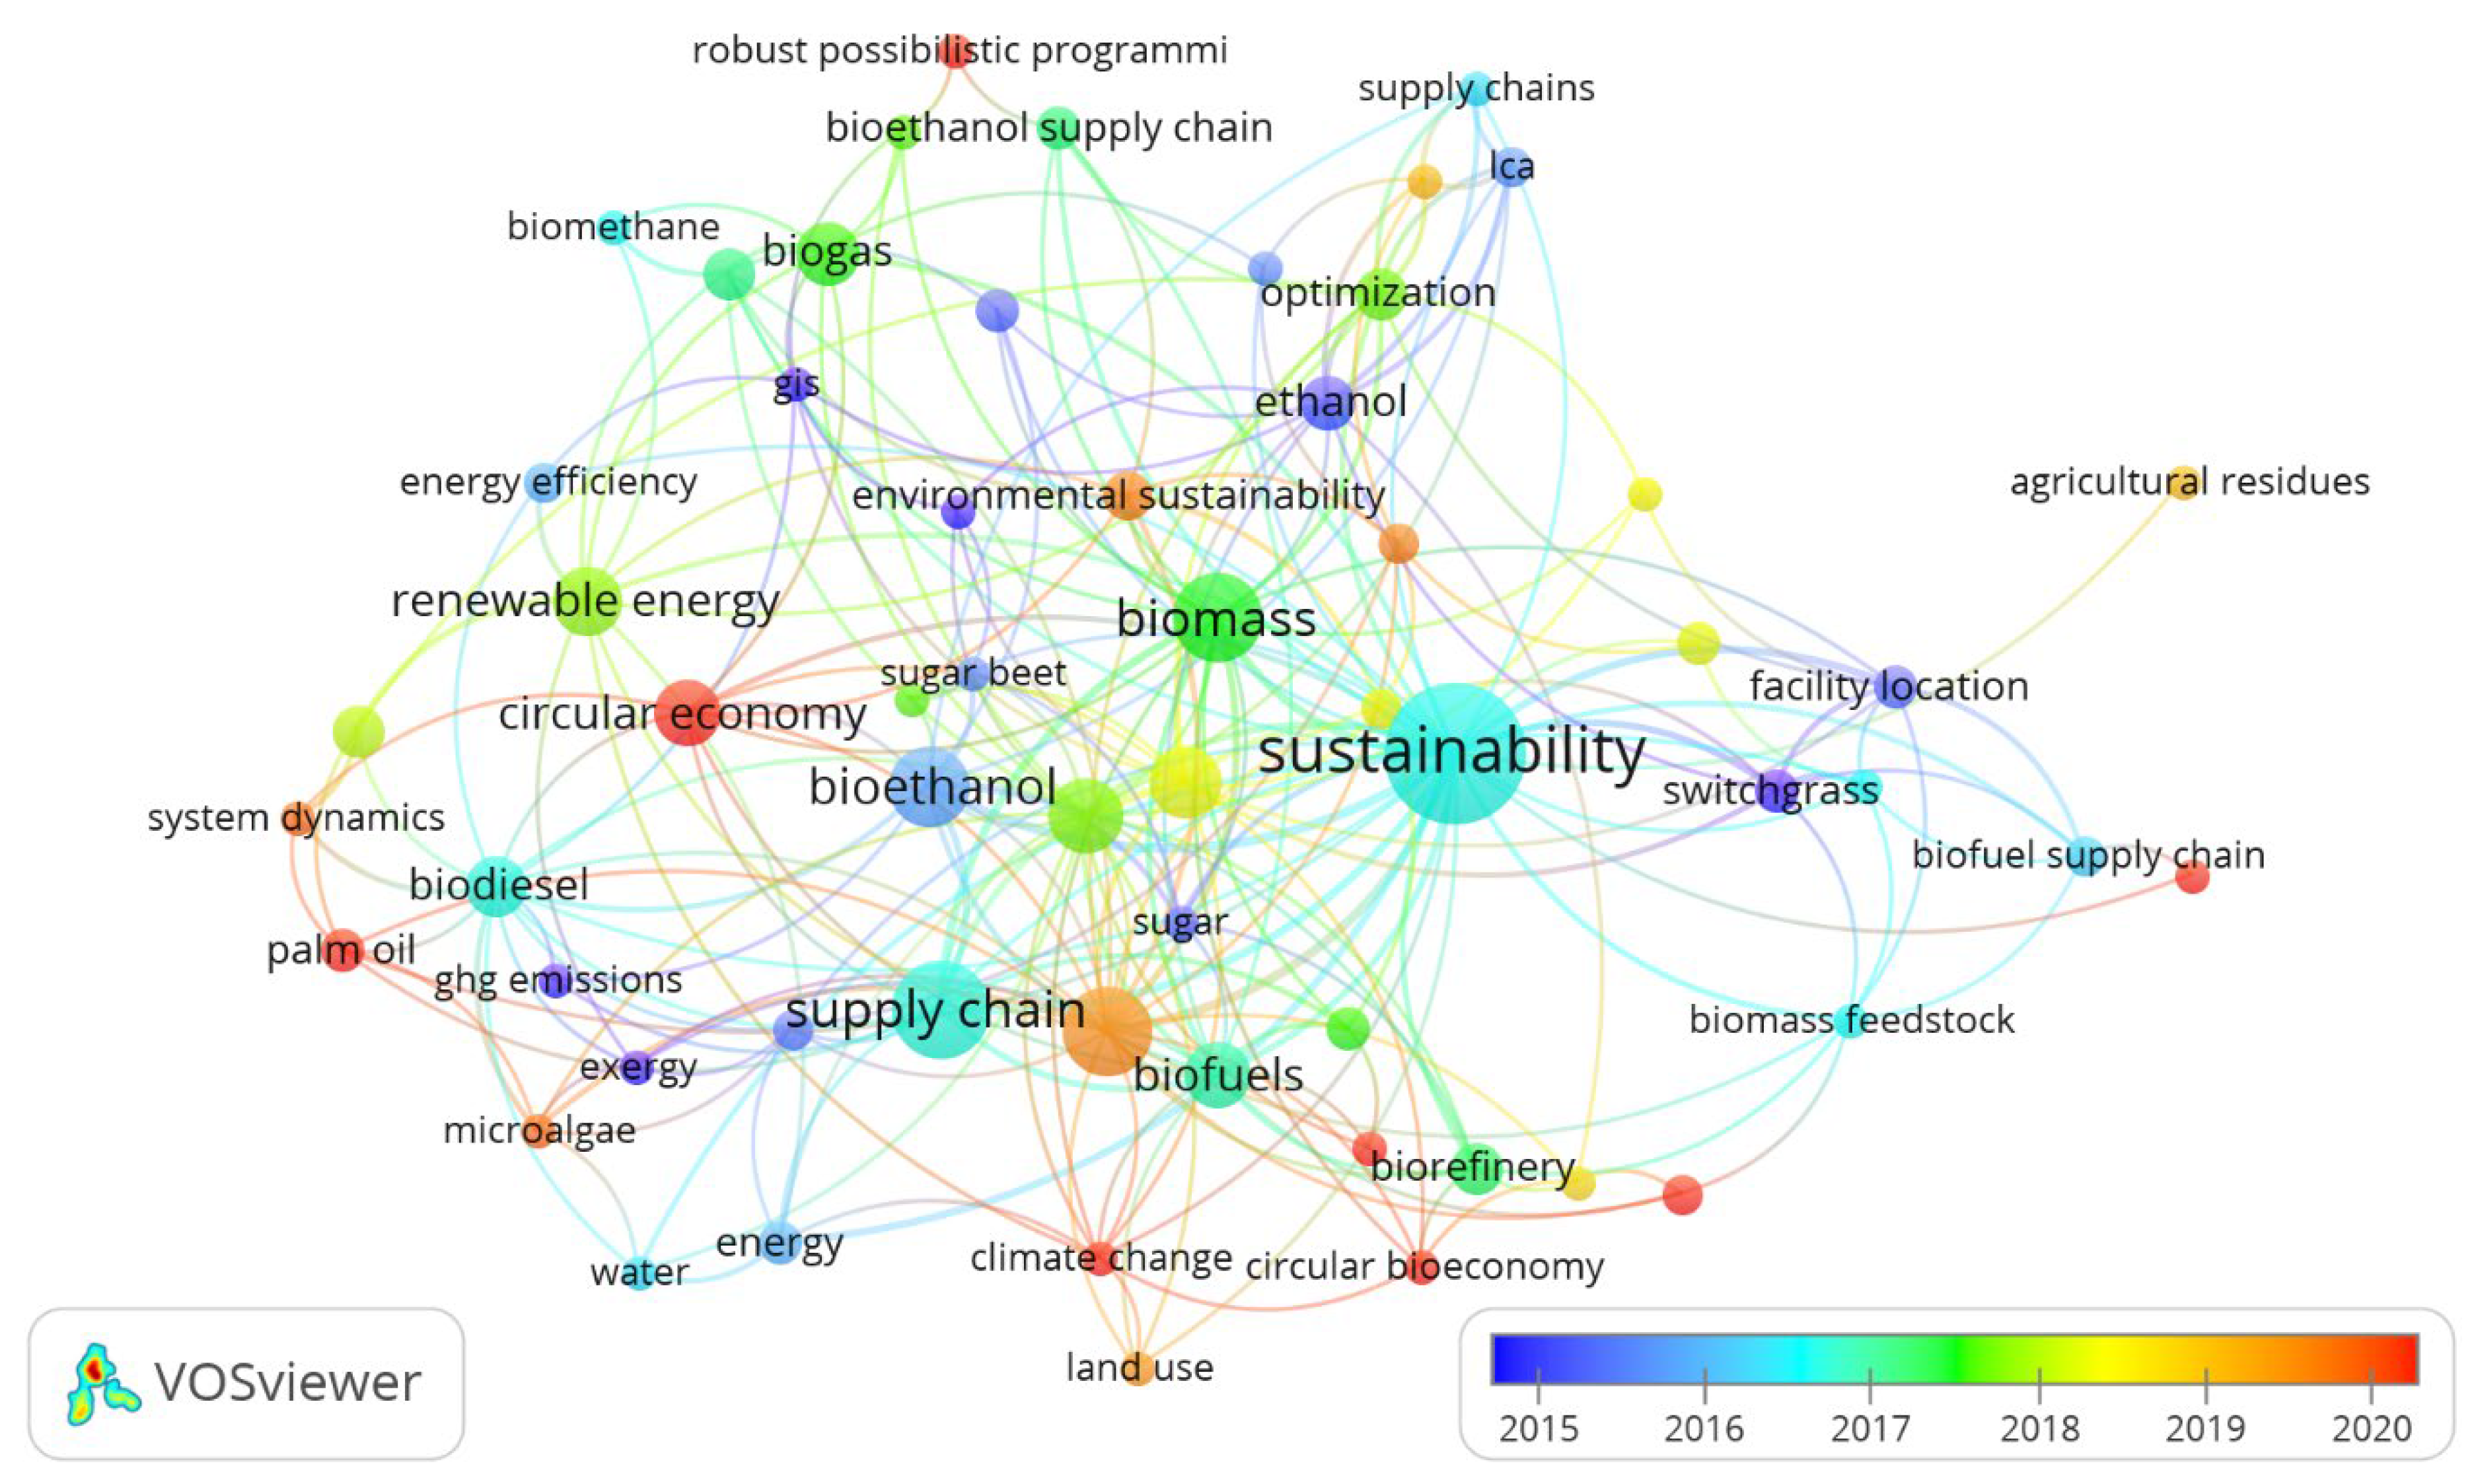
In terms of time, the analysis of the author’s co-occurrence and keywords is presented in Figure 13. The time period taken into account is 2015–2020, as this is when the greatest dynamics in this area occurred, and the map also shows in which years what new words appeared in scientific publications.
Another analysis in terms of co-occurrence can be referred to the keyword index. Figure 14 presents the results of the study, with the following boundary conditions: a minimum number of occurrences of five, resulting in 1917 keywords, of which 167 were co-related. For 167 keywords, the total strength of co-occurrence links with the other keywords was calculated. The keyword with the greatest total link strength will be selected. All the keywords presented on the map are part of the six clusters that have links to each other, reflecting groups of emerging research topics in the scope indicated.
An analysis of the time dynamics in the range indicated for the analysis presented in Figure 14 is presented in Figure 15. The time period indicated is 2015–2020.
The second aspect of the analysis relates to analyses of co-authorship and authors, organizations, and countries’ links.
When starting the analyses in this area, co-authorship and authors were analysed. In this respect, collected data from 230 scientific publications were used. The boundary conditions that were established were:
Minimum number of documents of an author:here, the most important limitation is made, as the total number of authors is 799. Do-analysis shows that some of the authors have no connections. The largest set of connected items consists of three items.
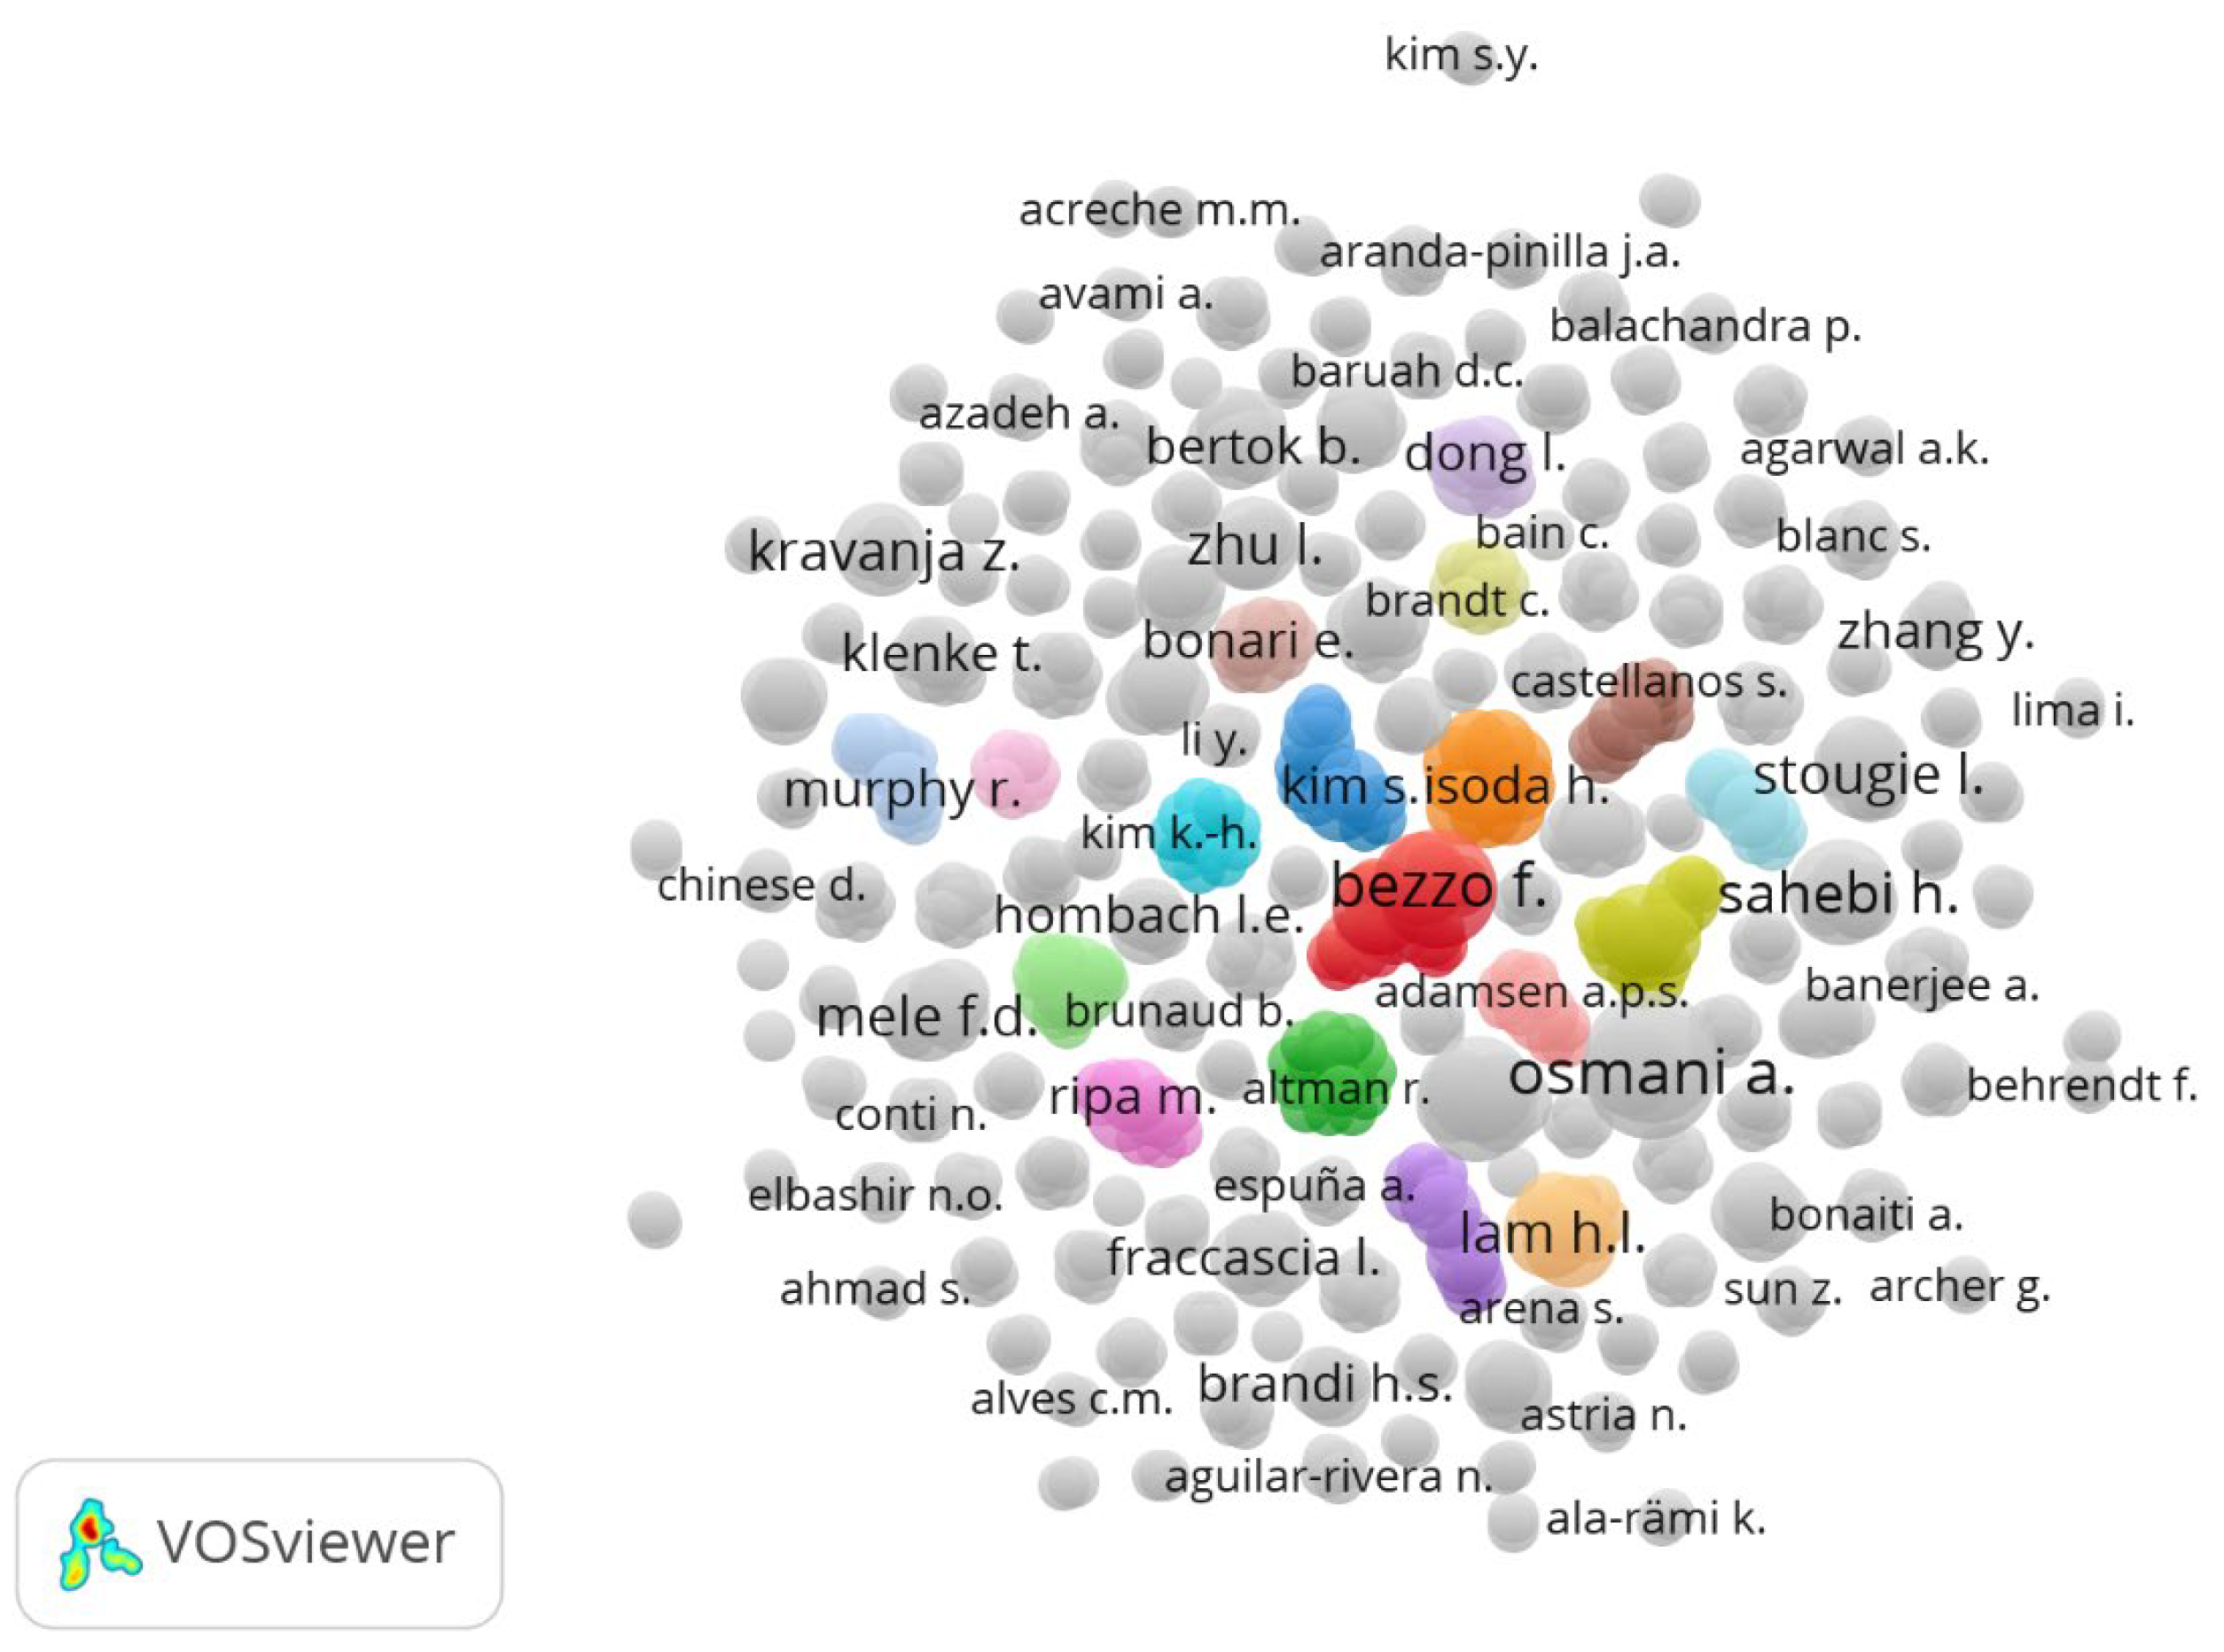
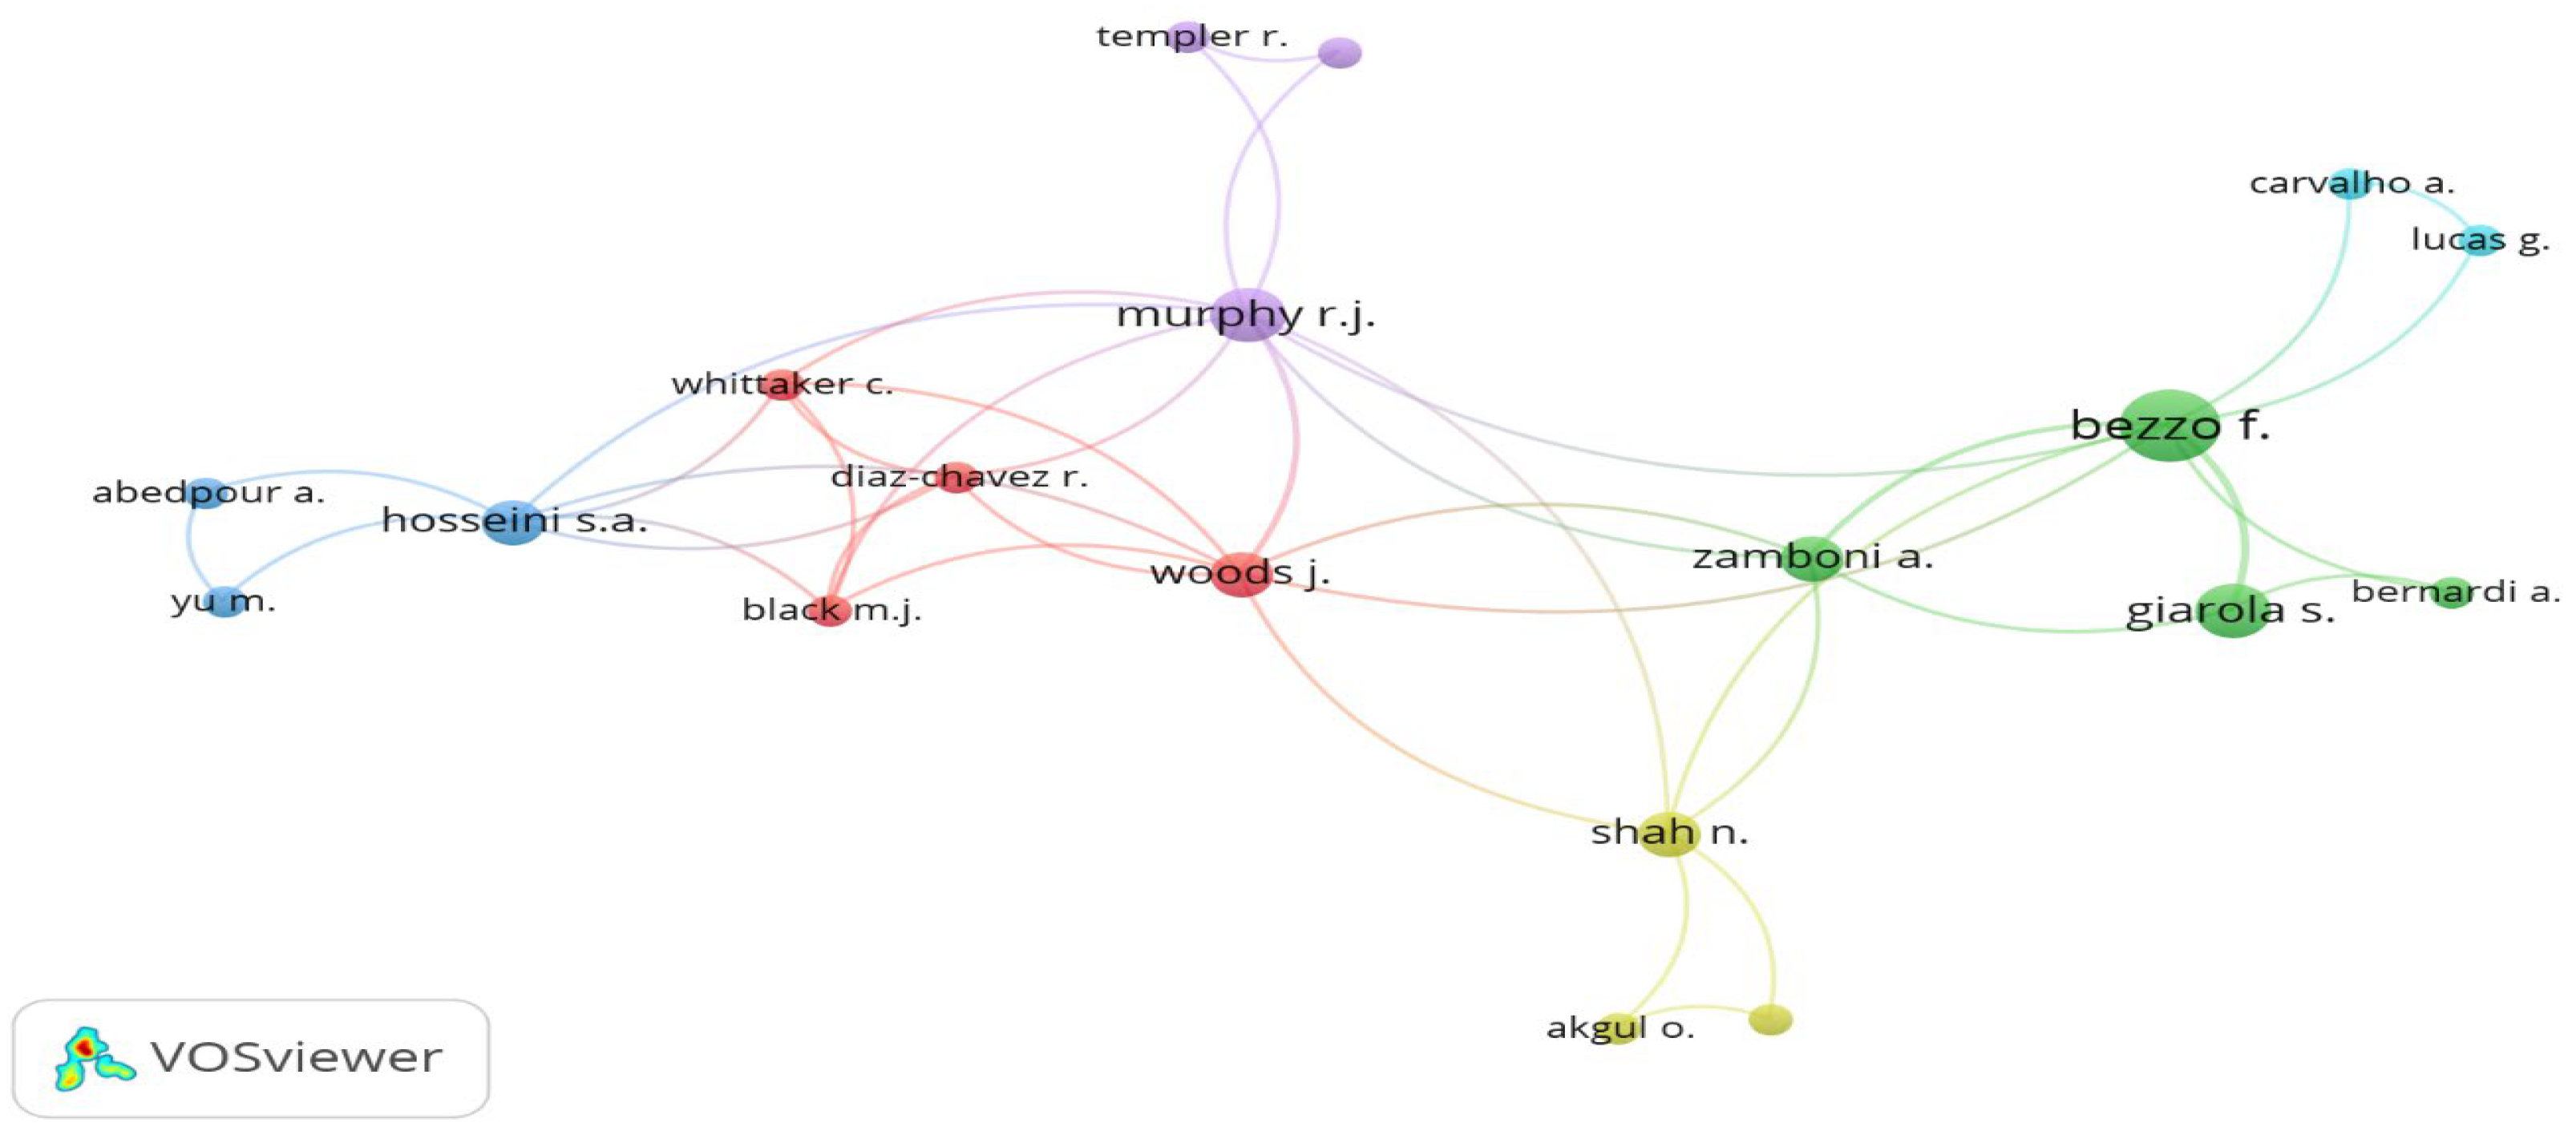
The largest set of connected items consists of 19 items, presented in Figure 16.
Such a map indicates that there are many authors with no links, and this may mean that there is a wide interest in our world in the subject under study and that the indicated phenomena are studied independently in many research centers.
By eliminating missing links in Figure 17, we show the interactions between authors, while also indicating which authors are collaborating in the study of specific phenomena.
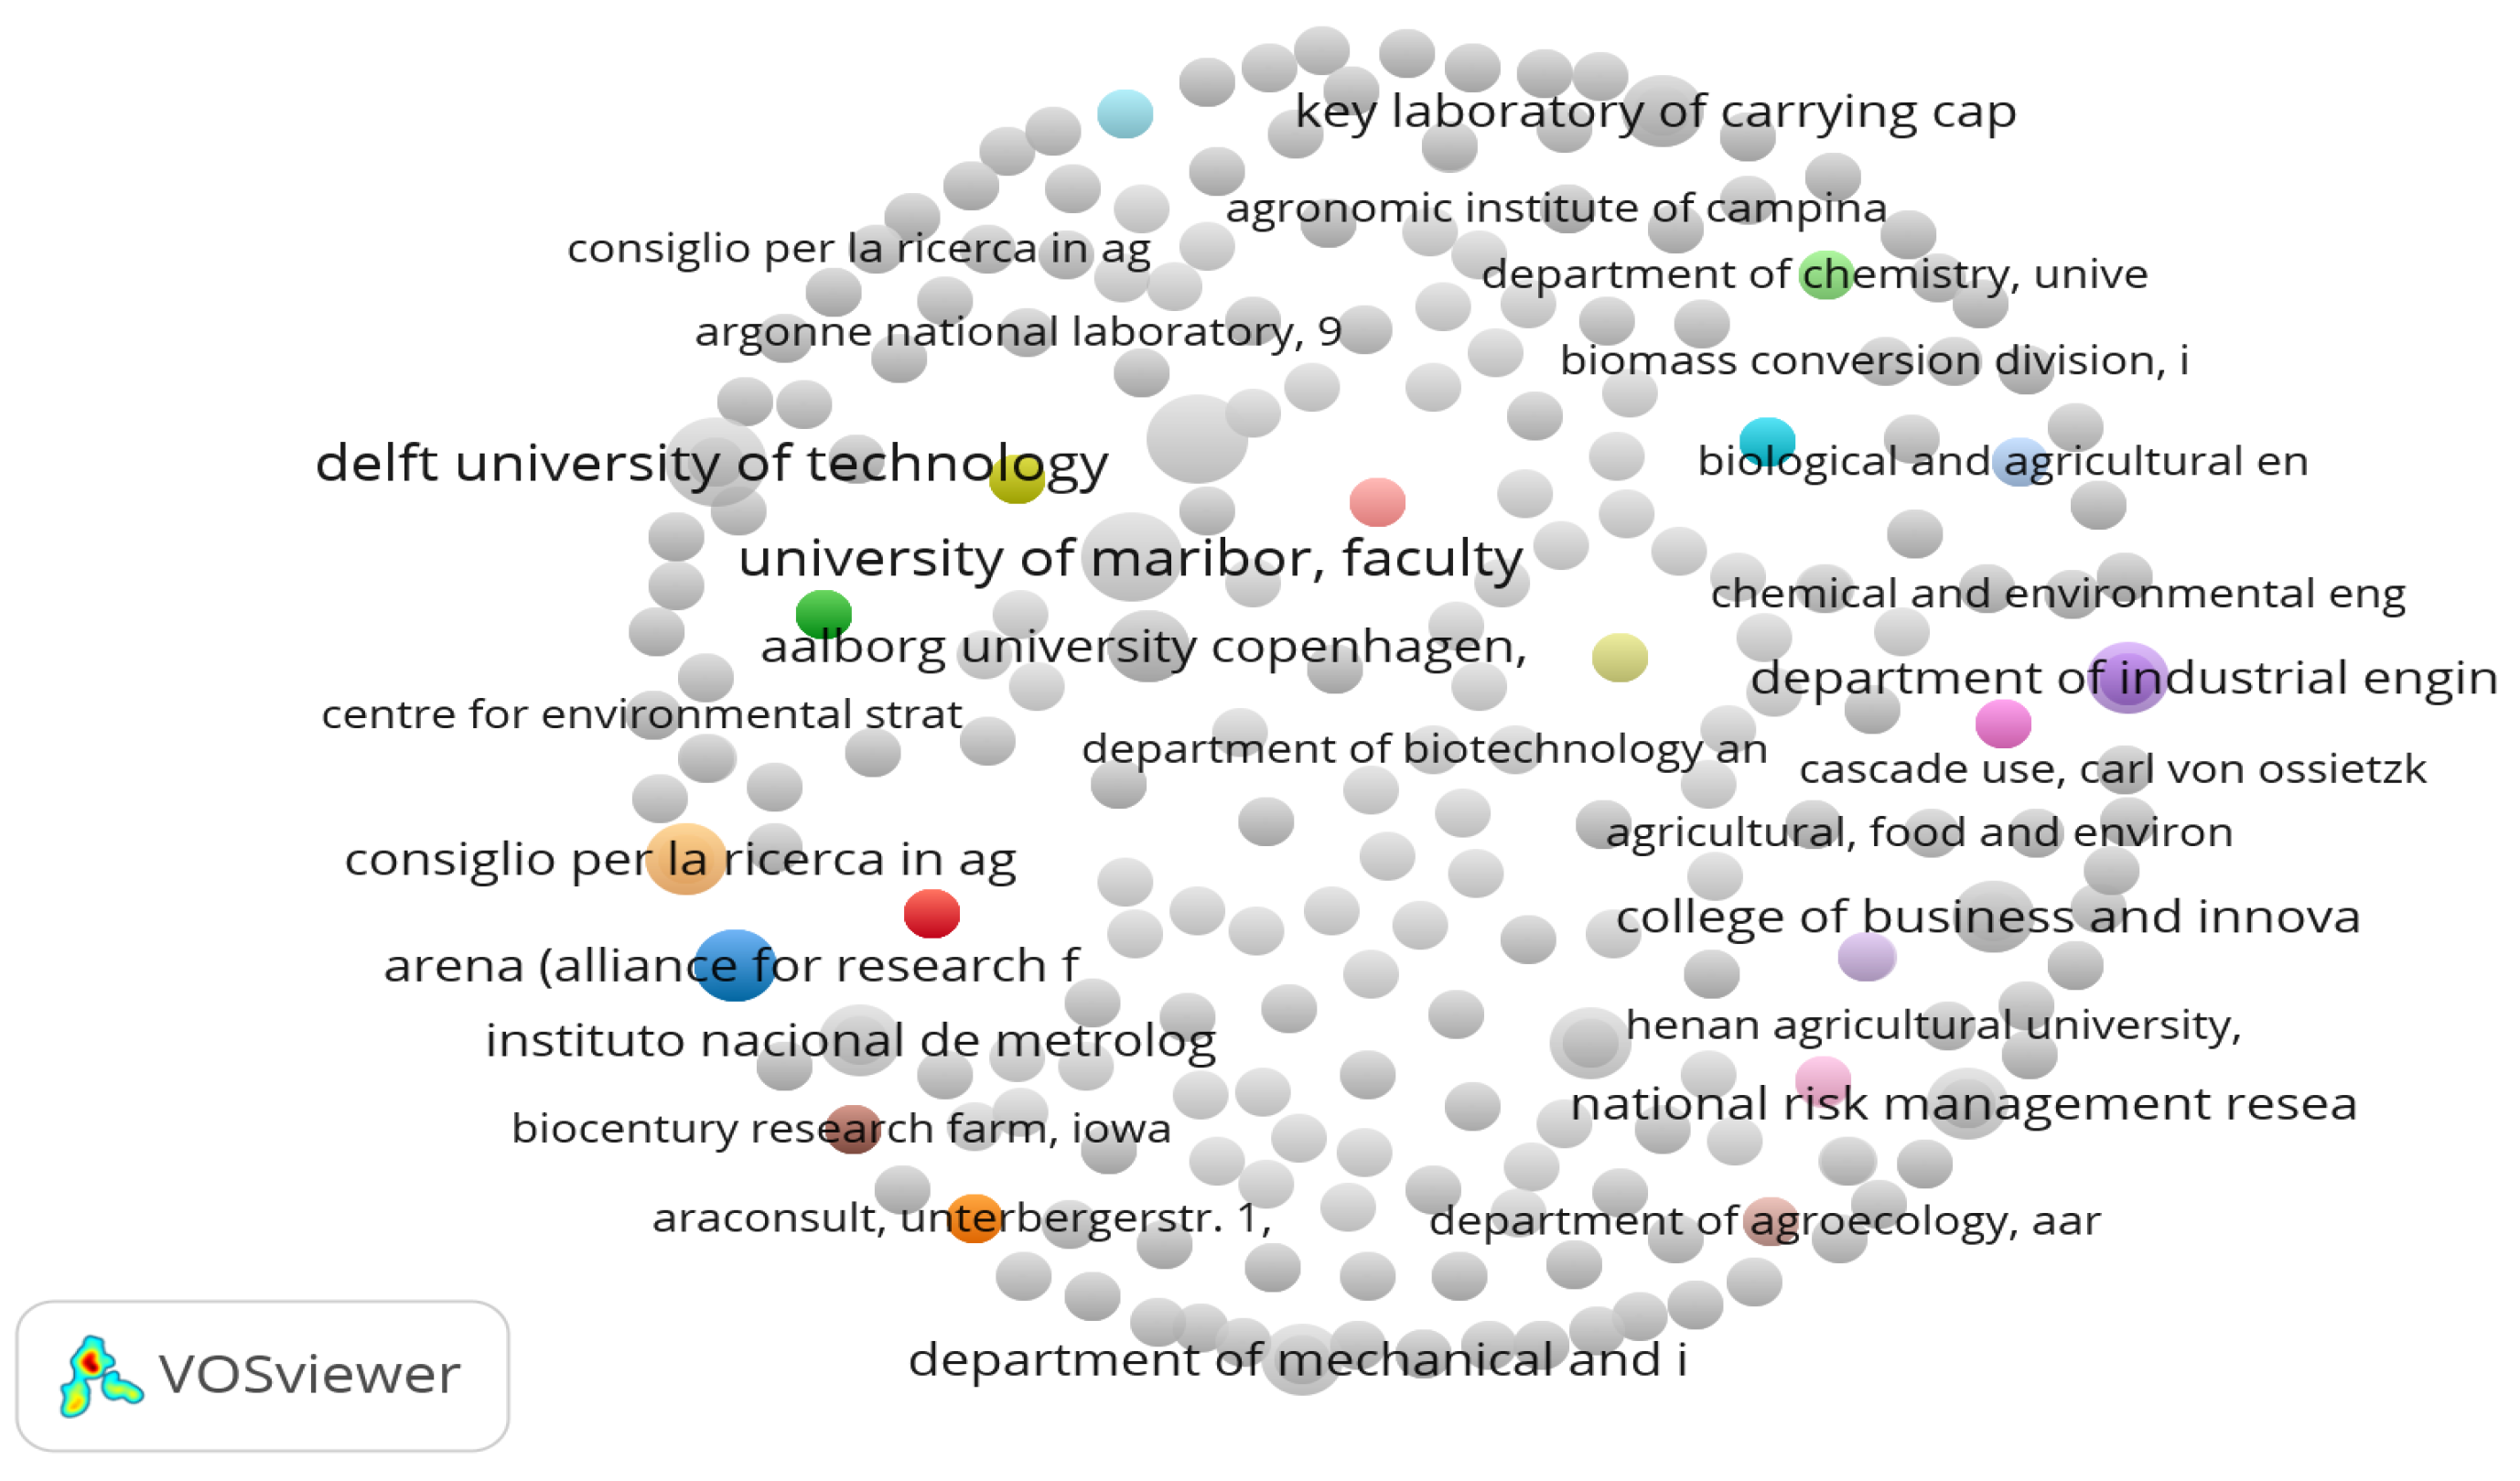
Another analysis relates to co-authorship and organisation (Figure 18). The total number of organizations is 538. Such a large number of organizations again indicates a wide interest in the subject matter, virtually worldwide.
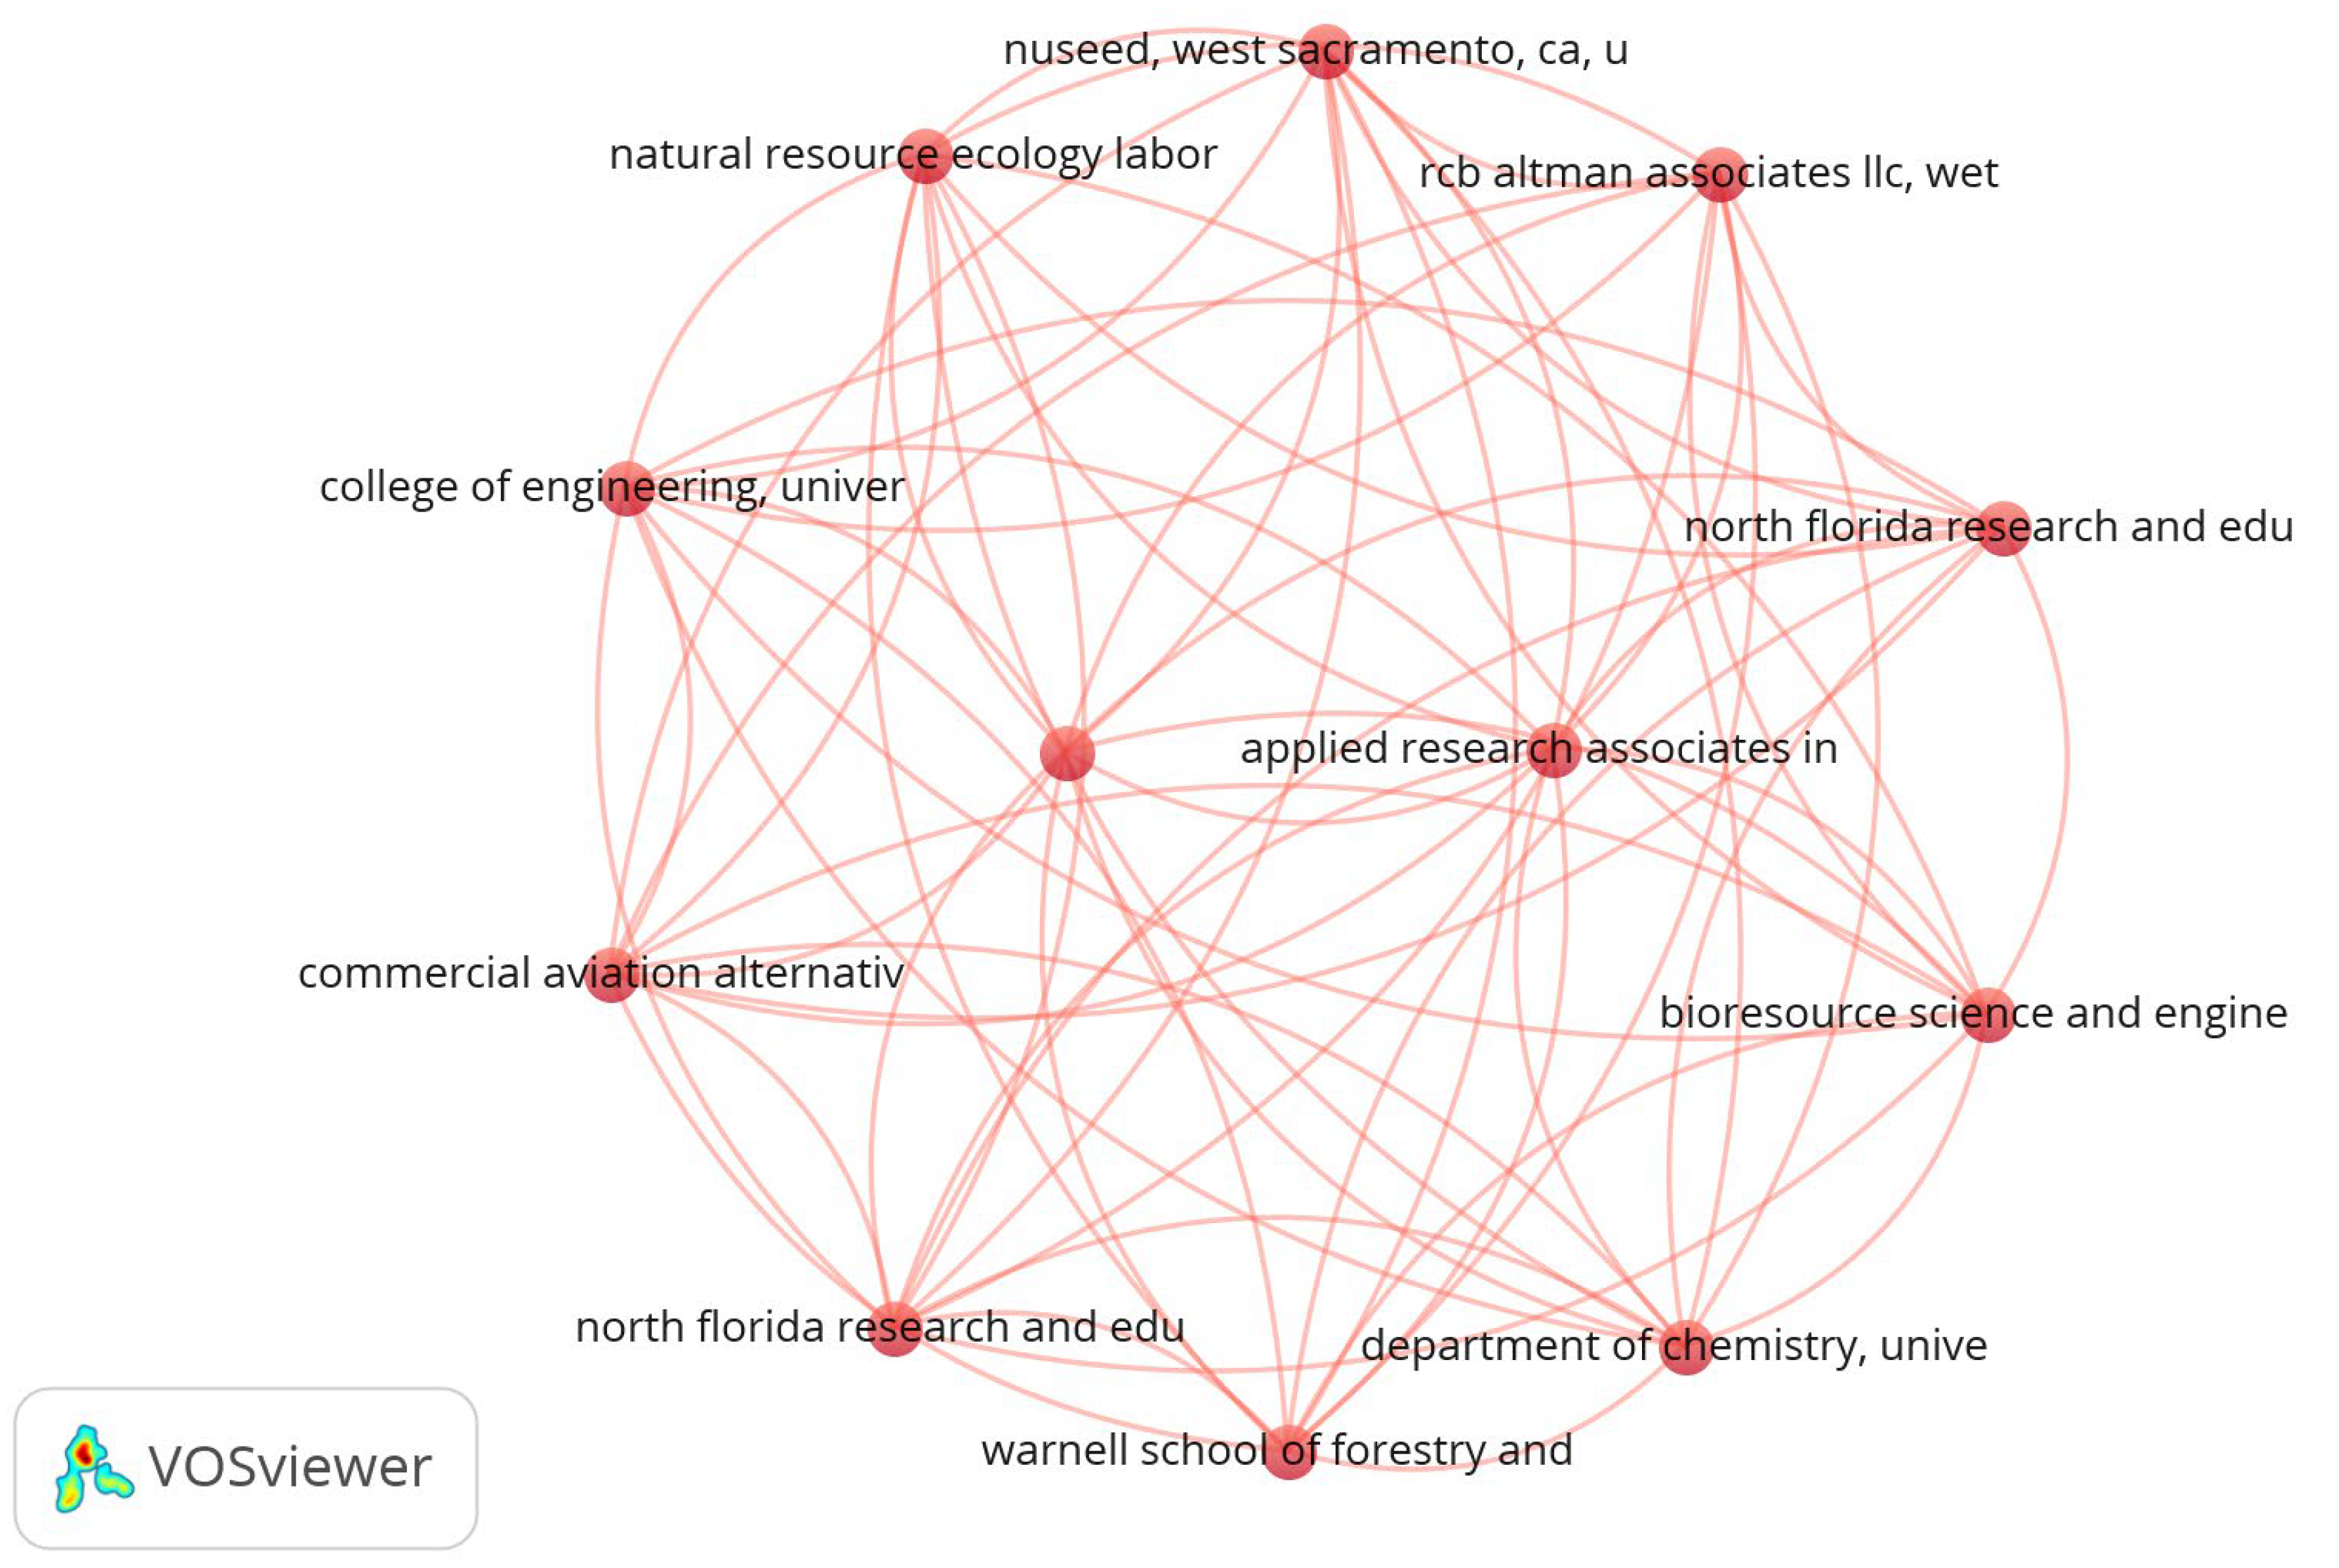
Some have no links, indicating single, individual studies; the largest number of items in the links are 12 items. Analysing the data, it is possible to identify a great variety of research institutes and universities dealing with the indicated topics.
A map indicating the links between organizations and co-authors is presented in Figure 19.
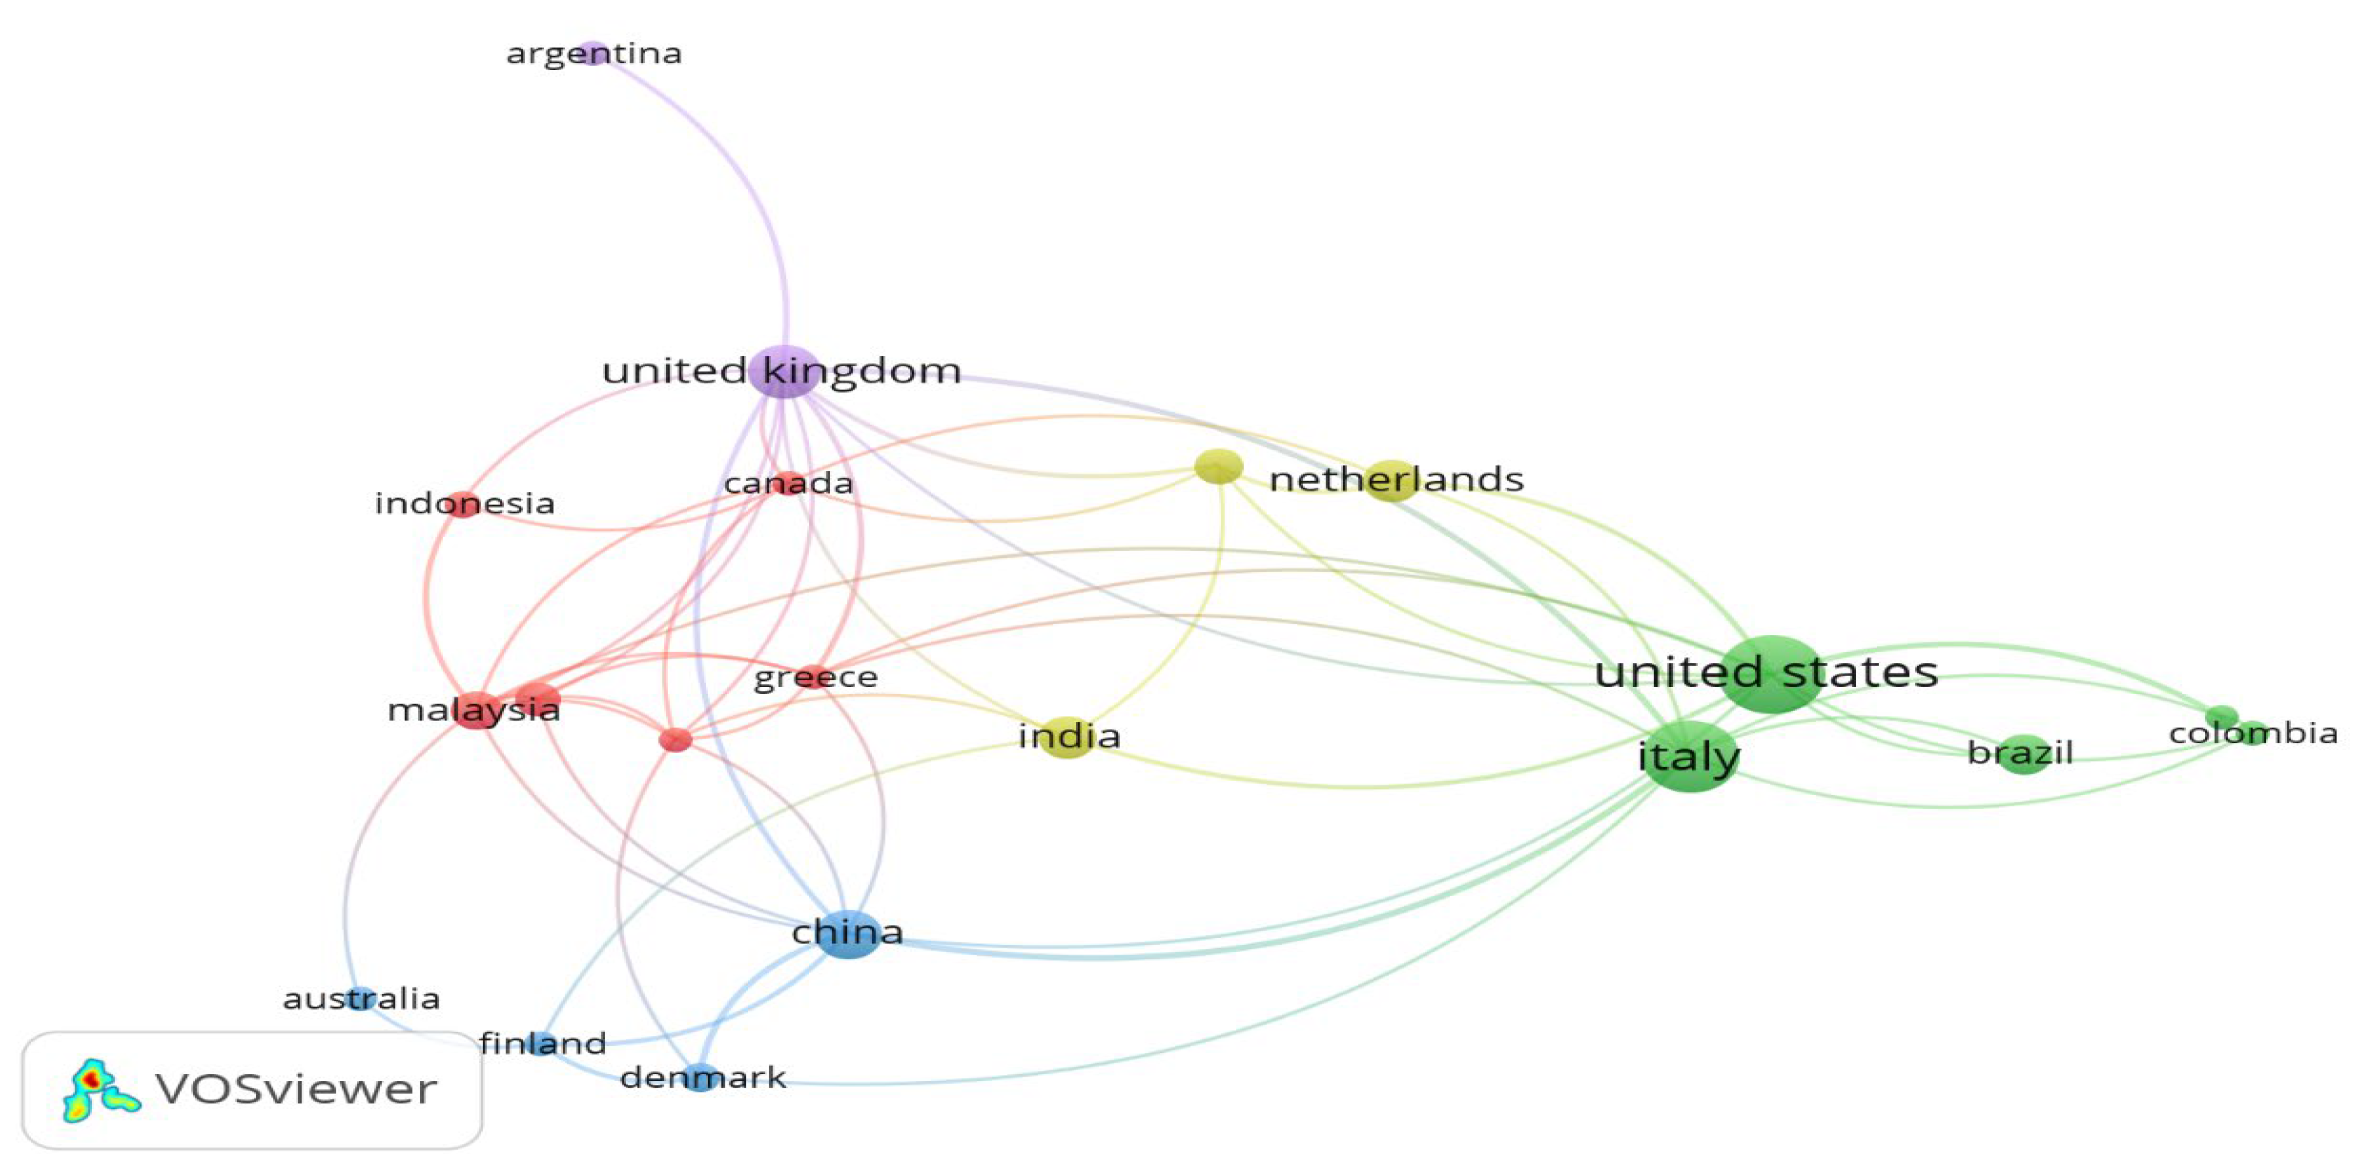
An interesting result of the study is the one presenting links between authors from different countries. Restrictions have been made in this respect: the number of documents of countries is represented by five to twenty links, representing fifty-five countries. There is a clear dominance of researchers and centers from the USA, UK, Italy, China, India, Malaysia, and The Netherlands (Figure 20). There is also a clear link between the USA, Italy, Brazil, and Colombia, and, in the next cluster are the UK, Argentina, the Netherlands, and India. Very interesting connections are Malaysia, Greece, Canada, and Indonesia, and the last cluster comprises China, Denmark, Finland, and Australia.
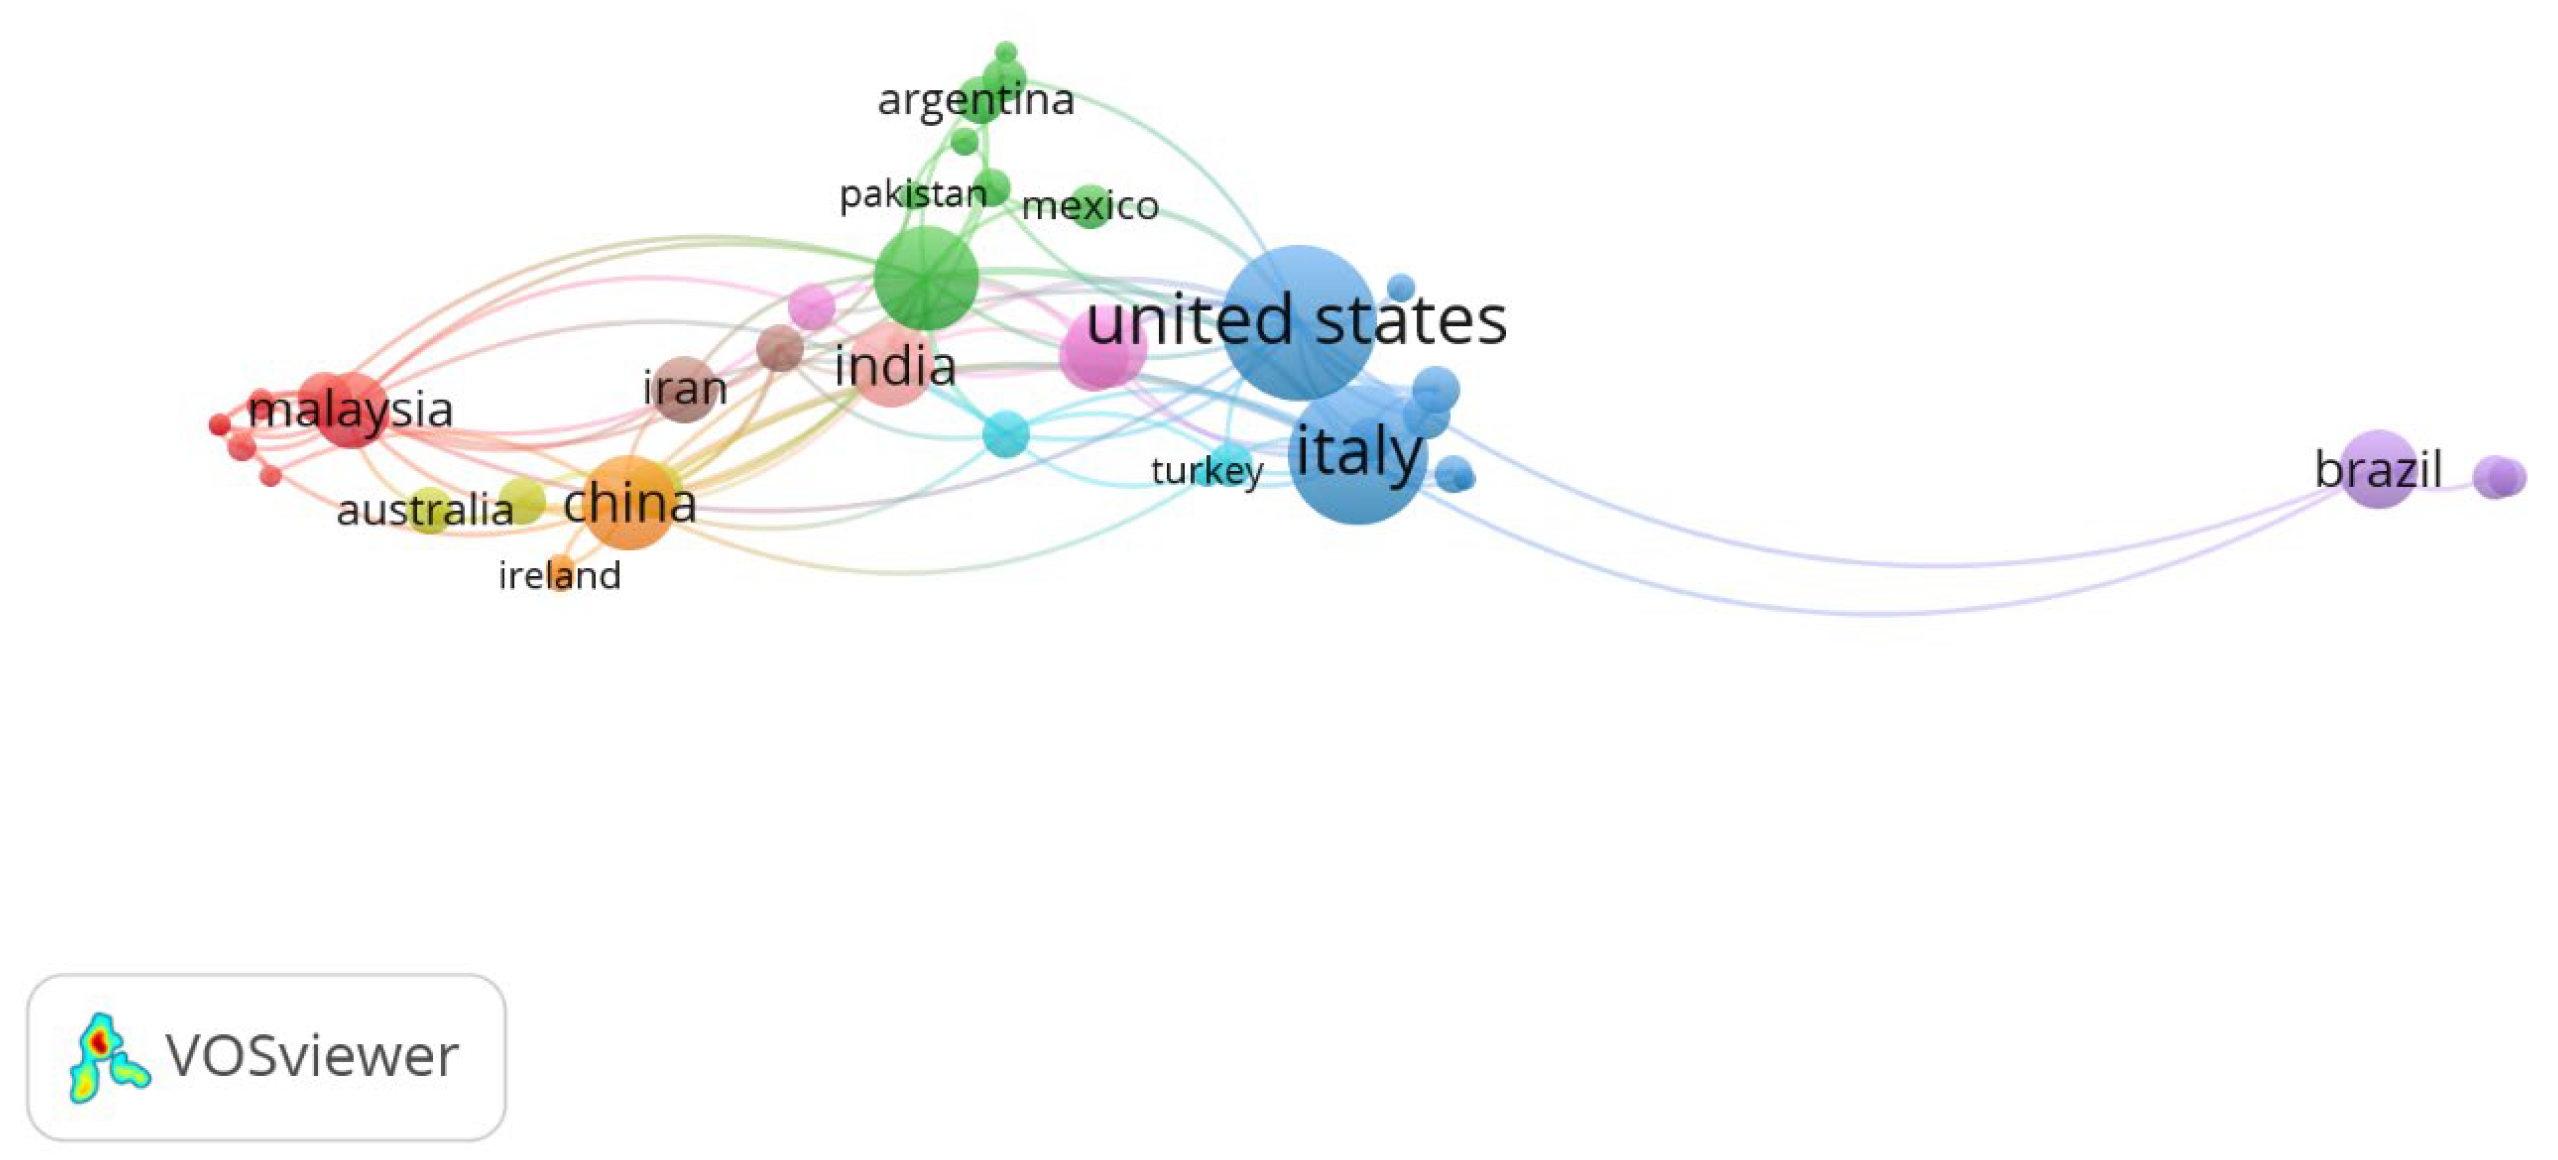
The results of the analysis show that the 55 countries do not have po-relationships with others, in that similar clusters are formed, but with a different number of publications (taking into account the lack of co-authorship, or co-occurring keywords, for all publications) (Figure 21).

4. Discussion, Limitations, and Conclusions

Bibliometric analysis is a very good research method for identifying interest in research topics worldwide, as well as indicating detailed research fields, methods, and issues within the area under study. This type of analysis involves the combination of performance analysis and visual knowledge maps, which are excellent ways of identifying topics and undertaking further, more detailed research in them. This method is, of course, limited in scope (only to keyword analyses, indexes, and abstracts, despite a systematic study review), but it nevertheless contains many interesting analyses, from which conclusions can be drawn concerning the scope of the study, area, research methods, authors, countries, and the most frequently used keywords. Unfortunately, limitations are also due to the fact that there is a very high degree of fragmentation in terms of descriptions and the use of individual words. Additionally, authors often treat abstracts without due attention to detail and indicate the most relevant elements from the content of the articles. This element is most important when automating the search of data for bibliometric analyses. Therefore, in order to accurately assess the scope of the study area, it is necessary to consult the entirety of the texts in order to accurately analyze the studied phenomena, draw conclusions, or cite individual papers. The multiplicity of keywords and their fragmentation results in a lack of precision in defining the subject of the analysis, as well as a lack of clarity facilitating the identification of the area or scope of research concerning the specificity of the study indicated. The citation analysis was performed, taking into account the oldest publications, which, among other reasons, allows them to be cited more. This is one of the limitations of this study. Answering the research questions as a whole, it should be pointed out that there is interest in this topic among researchers. However, it is not very great, and it is basically conceptualized in several areas (including a large range of different types of fuels and their use in the area of supply chains), and research is conducted in several research centers. The semantic analysis also shows large clusters of similar words and those that represent the main research area and most relevant elements, including supply chain, sustainability, sustainability, or renewable sources, as well as the different sources of fuels used in supply chains.
Bibliometric analyses are an easy way to investigate an area of interest, allow for exploration and search for research gaps, or to pose new hypotheses in research. They are easy to use, due to the ever-increasing possibilities offered by the increasingly sophisticated platforms of scientific publication databases. The scope of searches is very large, and it is actually possible to perform interesting analyses from various angles and criteria, as well as to draw meaningful conclusions for the development of science, and they are a source of knowledge in the field under study.
In the considerations, the SCOPUS database was used to explore issues related to energy supply chains, sustainability, and the links between the indicated terms. The main conclusions that emerge from the analysis are:
  • a significant increase in interest in the subject area from 2019—defined as the number of publications produced in a given year
  • The two most popular areas, accounting for just over half of the publications, are energy and environmental science.
  • The most productive journals are: Applied Energy and the Journal of Cleaner Production
  • The United States and Italy are definitely leading the way in describing the subject of RESCs, and, also, the top three research centers from which the first author of the publication came are: Università degli Studi di Padova, Imperial College London, and Consiglio per la Ricerca in Agricoltura e l’Analisi Dell’Economia Agraria CREA Rome. The placement of the institutes with the highest number of publications coincides with the data about countries of origin (the top five include institutions from Italy, the Unified Kingdom, and the United States). Here, one can see the cooperation of centers, especially from the United States and Italy.
  • The most cited article has 357 citations and was published in 2014, and the most cited publications mainly focus on the area of optimizing supply chains, as well as topics addressing the use of alternative fuels, such as bioethanol, biorefineries, and biomass.
  • Constraints had to be used to visualize the studies, as there were too many keywords, one at a time, that were not related to the others, which would result in a lack of readability of the maps. The logical constraints used contributed to the creation of five thematic clusters, on the basis of which conclusions can be drawn about the links and coexistence of keywords, authors, organizations, and keywords in the indexes in the topics studied.
  • There are many closely related words and a lack of clarity and uniformity in defining certain phenomena or areas of research.
An analysis of the publications allows us to draw the basic conclusion that the topic is interesting, but not very popular, among researchers. Furthermore, the increase in the number of publications has not been significant in recent years, which means that there is a very good field for advanced research in this area. It is, therefore, apparent that there is a research gap that can be filled, both from a theoretical and practical aspect, translating the results into managerial implications.

Author Contributions

Conceptualization, B.T. and T.W.; methodology, B.T. and T.W.; validation, B.T. and T.W.; formal analysis, B.T. and T.W., investigation, B.T. and T.W., resources, B.T. and T.W.; data curation, B.T. and T.W.; writing—original draft preparation, B.T. and T.W.; writing—review and editing, B.T. and T.W.; visualization, B.T. and T.W. All authors have read and agreed to the published version of the manuscript.

Funding

This research received no external funding.

Data Availability Statement

Not applicable.

Conflicts of Interest

The authors declare no conflict of interest.

References

  1. Sahebi, I.G.; Mosayebi, A.; Masoomi, B.; Marandi, F. Modeling the enablers for blockchain technology adoption in renewable energy supply chain. Technol. Soc. 2022, 68, 101871. [Google Scholar] [CrossRef]
  2. Fontes, C.H.D.O.; Freires, F.G.M. Sustainable and renewable energy supply chain: A system dynamics overview. Renew. Sustain. Energy Rev. 2018, 82, 247–259. [Google Scholar]
  3. Kumar, A.; Dixit, G. An analysis of barriers affecting the implementation of e-waste management practices in India: A novel ISM-DEMATEL approach. Sustain. Prod. Consum. 2018, 14, 36–52. [Google Scholar] [CrossRef]
  4. Elia, J.A.; Floudas, C.A. Energy supply chain optimization of hybrid feedstock processes: A review. Annu. Rev. Chem. Biomol. Eng. 2014, 5, 147–179. [Google Scholar] [CrossRef]
  5. Salunkhe, P.B.; Shembekar, P.S. A review on effect of phase change material encapsulation on the thermal performance of a system. Renew. Sustain. Energy Rev. 2012, 16, 5603–5616. [Google Scholar] [CrossRef]
  6. Maia, S.C.; de Benedicto, G.C.; do Prado, J.W.; Robb, D.A.; de Almeida Bispo, O.N.; de Brito, M.J. Mapping the literature on credit unions: A bibliometric investigation grounded in Scopus and Web of Science. Scientometrics 2019, 120, 929–960. [Google Scholar] [CrossRef]
  7. Noyons, E.C.; Moed, H.F.; Luwel, M. Combining mapping and citation analysis for evaluative bibliometric purposes: A bibliometric study. J. Am. Soc. Inf. Sci. 1999, 50, 115–131. [Google Scholar] [CrossRef]
  8. Van Eck, N.J.; Waltman, L. Software survey: VOSviewer, a computer program for bibliometric mapping. Scientometrics 2010, 84, 523–538. [Google Scholar] [CrossRef] [Green Version]
  9. Tranfield, D.; Denyer, D.; Smart, P. Towards a methodology for developing evidence-informed management knowledge by means of systematic review. Br. J. Manag. 2003, 14, 207–222. [Google Scholar] [CrossRef]
  10. Zhao, D.; Strotmann, A. Analysis and Visualization of Citation Networks; Morgan & Claypool: San Rafael, CA, USA, 2015. [Google Scholar]
  11. Falagas, M.E.; Pitsouni, E.I.; Malietzis, G.A.; Pappas, G. Comparison of PubMed, Scopus, web of science, and Google scholar: Strengths and weaknesses. FASEB J. 2008, 22, 338–342. [Google Scholar] [CrossRef]
  12. Azevedo, S.G.; Santos, M.; Antón, J.R. Supply chain of renewable energy: A bibliometric review approach. Biomass Bioenergy 2019, 126, 70–83. [Google Scholar] [CrossRef]
  13. Brzozowska-Rup, K.; Nowakowska, M. Bibliometric Studies on Renewable Energy—Poland Compared to Other EU Countries. Energies 2022, 15, 4577. [Google Scholar] [CrossRef]
  14. Cobo, M.J.; Martinez, M.A.; Gutierrez-Salcedo, M.; Fujita, H.; Herrera-Viedma, E. 25 Years at knowledge-based systems: A bibliometric analysis. Knowl.-Based Syst. 2015, 80, 3–13. [Google Scholar] [CrossRef]
  15. Mingers, J.; Leydesdorff, L. A review of theory and practice in scientometrics. European J. Oper. Res. 2015, 246. [Google Scholar] [CrossRef] [Green Version]
  16. Zhang, L.; Ling, J.; Lin, M. Artificial intelligence in renewable energy: A comprehensive bibliometric analysis. Energy Rep. 2022, 8, 14072–14088. [Google Scholar] [CrossRef]
  17. Ahmad, S.; Tahar, R.M. Selection of renewable energy sources for sustainable development of electricity generation system using analytic hierarchy process: A case of Malaysia. Renew. Energy 2014, 63, 458–466. [Google Scholar] [CrossRef]
  18. Shih, C.; Zhang, T.; Li, J.H.; Bai, C. Powering the Future with Liquid Sunshine. Joule 2018, 2, 1925–1949. [Google Scholar] [CrossRef] [Green Version]
  19. Santibañez-Aguilar, J.E.; González-Campos, J.B.; Ponce-Ortega, J.M.; Serna-González, M.; El-Halwagi, M.M. Optimal planning and site selection for distributed multiproduct biorefineries involving economic, environmental and social objectives. J. Clean. Prod. 2014, 65, 270–294. [Google Scholar] [CrossRef]
  20. Parajuli, R.; Dalgaard, T.; Jørgensen, U.; Adamsen, A.; Knudsen, M.; Birkved, M.; Gylling, M.; Schjørring, J. Biorefining in the prevailing energy and materials crisis: A review of sustainable pathways for biorefinery value chains and sustainability assessment methodologies. Renew. Sustain. Energy Rev. 2015, 43, 244–263. [Google Scholar] [CrossRef] [Green Version]
  21. Zhang, J.; Osmani, A.; Awudu, I.; Gonela, V. An integrated optimization model for switchgrass-based bioethanol supply chain. Appl. Energy 2013, 102, 1205–1217. [Google Scholar] [CrossRef]
  22. Schaubroeck, T.; De Clippeleir, H.; Weissenbacher, N.; Dewulf, J.; Boeckx, P.; Vlaeminck, S.; Wett, B. Environmental sustainability of an energy self-sufficient sewage treatment plant: Improvements through DEMON and co-digestion. Water Res. 2015, 74, 166–179. [Google Scholar] [CrossRef] [PubMed]
  23. Miret, C.; Chazara, P.; Montastruc, L.; Negny, S.; Domenech, S. Design of bioethanol green supply chain: Comparison between first and second generation biomass concerning economic, environmental and social criteria. Comput. Chem. Eng. 2016, 85, 16–35. [Google Scholar] [CrossRef] [Green Version]
  24. Akgul, O.; Shah, N.; Papageorgiou, L. Economic optimisation of a UK advanced biofuel supply chain. Biomass Bioenergy 2012, 41, 57–72. [Google Scholar] [CrossRef]
  25. Osmani, A.; Zhang, J. Stochastic optimization of a multi-feedstock lignocellulosic-based bioethanol supply chain under multiple uncertainties. Energy 2013, 59, 157–172. [Google Scholar] [CrossRef]
  26. Kajaste, R. Chemicals from biomass—Managing greenhouse gas emissions in biorefinery production chains—A review. J. Clean. Prod. 2014, 75, 1–10. [Google Scholar] [CrossRef]
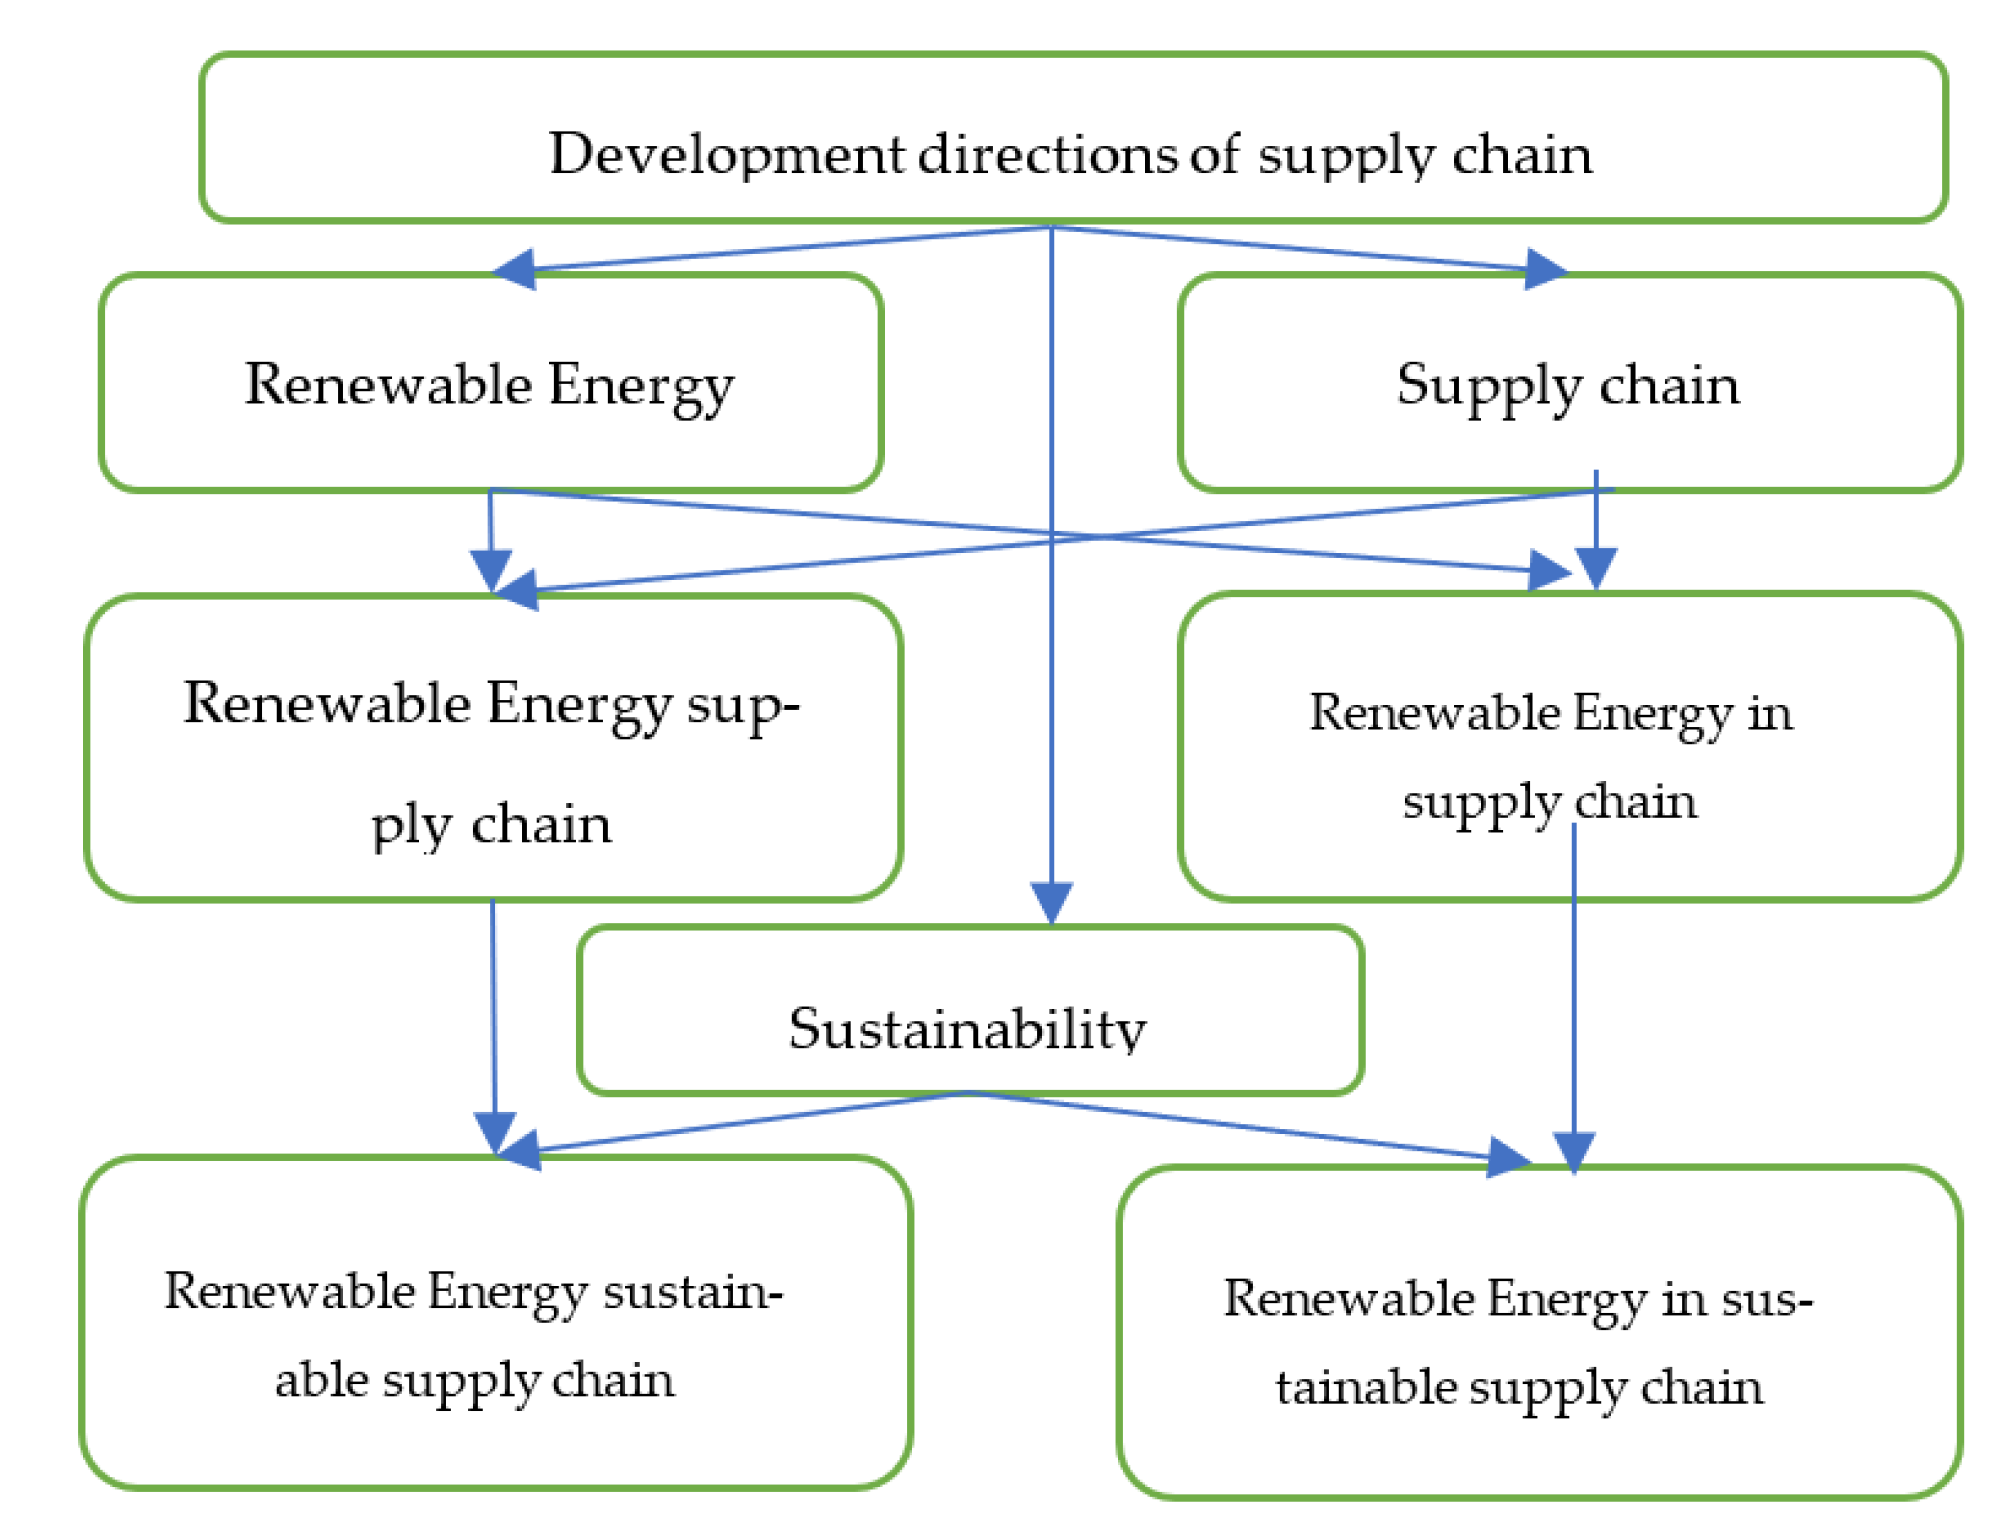
Figure 1. Renewable energy—sustainable supply chain context.
Energies 16 04761 g001
Figure 2. Research methodology framework. * data include articles published and in the database until 31 March 2023. Source: own elaboration.
Energies 16 04761 g002
Figure 3. The tendency number of publications.
Energies 16 04761 g003
Figure 4. Top 10 countries by number of publications.
Energies 16 04761 g004
Figure 5. Top institutions by number of publications.
Energies 16 04761 g005
Figure 6. The tendency number of citations.
Energies 16 04761 g006
Figure 7. Top research areas.
Energies 16 04761 g007
Figure 8. Authors with the most published studies in the sample.
Energies 16 04761 g008
Figure 9. Co-occurrence and all keywords map.
Energies 16 04761 g009
Figure 10. Research dynamics (keywords) over time (2011–2023).
Energies 16 04761 g010
Figure 11. Dynamics of publications with indicated keywords between 2016 and 2019.
Energies 16 04761 g011
Figure 12. Analysis of co-occurrence in connection with author keywords.
Energies 16 04761 g012
Figure 13. Analysis of keyword co-occurrence dynamics from 2015 to 2020.
Energies 16 04761 g013
Figure 14. Analysis of co-occurrence of keywords in the indexes.
Energies 16 04761 g014
Figure 15. Temporal dynamics of co-occurrence of keywords in the index.
Energies 16 04761 g015
Figure 16. Number of authors publishing in the area.
Energies 16 04761 g016
Figure 17. Links between authors in the research area indicated. Source: own elaboration.
Energies 16 04761 g017
Figure 18. Map indicating the organizations affiliated by the authors.
Energies 16 04761 g018
Figure 19. Link of co-authorship in countries map. Source: own elaboration.
Energies 16 04761 g019
Figure 20. Map of the relationship between countries.
Energies 16 04761 g020
Figure 21. Results of the all-country analysis, also without cross-referencing.
Energies 16 04761 g021
Table 1. Distribution of document types.
Document TypeNumber of PublicationsPercentage
Article16270.4%
Book Chapter2410.4%
Conference Paper229.6%
Review208.7%
Book20.9%
Table 2. Top 14 most productive journals.
Journal NameNumber of Publications
Applied Energy19
Journal of Cleaner Production16
Sustainability (Switzerland)12
Biomass And Bioenergy9
Energy9
Computer Aided Chemical Engineering7
Energy Policy7
Renewable and Sustainable Energy Reviews7
Bioresource Technology6
Chemical Engineering Transactions5
Clean Technologies and Environmental Policy5
Computers and Chemical Engineering5
Renewable Energy5
Energy Conversion and Management4
Table 3. The most highly cited publications.
Authors NameTitleYearAffiliation of First AuthorCountryNumber of CitationCitation Normalization
Ahmad, S., Tahar, R.M. [17]“Selection of renewable energy sources for sustainable development of electricity generation system using analytic hierarchy process: A case of Malaysia”2014Universiti Malaysia PahangMalaysia3575.69
Shih, C.F., Zhang, T., Li, J., Bai, C. [18]“Powering the Future with Liquid Sunshine”2018University of Chinese Academy of SciencesChina35110.22
Santibañez-Aguilar, J.E., González-Campos, J.B., Ponce-Ortega, J.M., Serna-González, M., El-Halwagi, M.M. [19]“Optimal planning and site selection for distributed multiproduct biorefineries involving economic, environmental and social objectives”2014Universidad Michoacana de San Nicolás de HidalgoMexico2213.46
Parajuli, R., Dalgaard, T., Jørgensen, U., Adamsen, A.P.S., Knudsen, M.T., Birkved, M., Gylling, M., Schjørring, J.K. [20]“Biorefining in the prevailing energy and materials crisis: A review of sustainable pathways for biorefinery value chains and sustainability assessment methodologies”2015Aarhus UniversityDenmark1833.84
Zhang, J., Osmani, A., Awudu, I., Gonela, V. [21]“An integrated optimization model for switchgrass-based bioethanol supply chain”2013North Dakota State UniversityUnited States1433.43
Schaubroeck, T., De Clippeleir, H., Weissenbacher, N., Dewulf, J., Boeckx, P., Vlaeminck, S.E., Wett, B. [22]“Environmental sustainability of an energy self-sufficient sewage treatment plant: Improvements through DEMON and co-digestion”2015Ghent UniversityBelgium1152.41
Miret, C., Chazara, P., Montastruc, L., Negny, S., Domenech, S. [23]“Design of bioethanol green supply chain: Comparison between first and second generation biomass concerning economic, environmental and social criteria”2016Université de ToulouseFrance1054.39
Akgul, O., Shah, N., Papageorgiou, L.G. [24]“Economic optimisation of a UK advanced biofuel supply chain”2012University College LondonUnited Kingdom1024.27
Osmani, A., Zhang, J. [25]“Stochastic optimization of a multi-feedstock lignocellulosic-based bioethanol supply chain under multiple uncertainties”2013North Dakota State UniversityUnited States942.26
Kajaste, R. [26]“Chemicals from biomass—Managing greenhouse gas emissions in biorefinery production chains—A review”2014Aalto UniversityFinland891.39
Table 4. Cluster characteristics—the most common keywords from supply chain energy and sustainable development in Scopus publications.
ClusterItem (Keywords)LinkTotal Link StreightOccurrence
1—red (21 items) sustainable supply chain development supply chain801479149
sustainable development801237120
optimization7743938
bioenergy7033733
biodisel7028635
2—green (19 items) environmental impact and pollutiongreenhous gasses7746136
life cycle7444035
environmental impact7736530
life cycle assesment6627724
gas emission6927622
3—blue (15 items) energy sources and agricultureethanol7864756
bioethanol7952846
Fossil fuels7629627
agriculture7327423
global warming7026616
4—yellow (14 items)—biofuelsbiomas7031629
biofuel7957852
biofuels7948243
feedstocks7031629
rafining6520319
supply chain6516024
5—Purple (12 items) renewable resources in SCMsustainability801080150
supply chain management8049650
renewable resources6827230
climate change7426825
greenhouse gas6826825
Disclaimer/Publisher’s Note: The statements, opinions and data contained in all publications are solely those of the individual author(s) and contributor(s) and not of MDPI and/or the editor(s). MDPI and/or the editor(s) disclaim responsibility for any injury to people or property resulting from any ideas, methods, instructions or products referred to in the content.